Featured Application
This paper can be used as a guideline in the stability design of a power system network to study the mechanism of cascading failures in power systems.
Abstract
In this study, we propose a load-redistribution-based practical cascading failure model that analyses the dynamic behaviour of a power system upon the occurrence of node failures. The proposed model pays particular attention to the load model and its role in modelling the cascade. Both naturally-induced and deliberate man-made node failures are incorporated in the proposed model for three typical network topologies—scale-free, small-world and Erdös–Rényi random networks—to demonstrate the validity of the proposed model and the extent of cascading failure. The load-based cascading failure model is validated using the data obtained from a real-world power grid, and the robustness and vulnerability when subjected to node failures are analysed and presented.
1. Introduction
Modern power systems are expanding in size, complexity and new technologies, which has brought significant improvement to the way we generate, transmit and consume electricity [1,2]. Nonetheless, these ever-growing power systems, at the same time, have created new and more pressing challenges for society, such as instability caused by massive scale-up [3] and uncertainties and risks due to the wide range of features and functions that modern grids boast [4]. Cascading failure is one of severest power outages in power systems, which can cause an astronomical amount of financial loss and affect countless people [5]. Cascading failures are normally caused by initial incidents, such as an electric fault at a particular transmission line, and through fast propagation, they can lead to large-scale blackouts in modern complex power systems [6,7,8].
On 14 August 2003, for instance, an initial disturbance caused by the summer heat in Ohio triggered the largest blackout in the history of the USA [9], which finally affected an estimated 10 million people in Ontario and 45 million people in eight states in the USA. Moreover, it was reported that there were about 30 billion dollars of economic loss in this incident. The largest blackout in history, branded “the biggest power failure”, happened on 31 July 2012 in India, which left 620 million people, half the Indian population, living without power for two days. This blackout was also a result of cascading failure caused by upgrading a backup power line in Bina-Gwalior-Agra in India [10]. The blackouts that happened all over the world have drawn considerable attention to study the cascading failure mechanism and investigate the robustness and vulnerability of power grids [11]. Investigations into these major blackouts have shown that almost all of them were triggered by an initial disturbance [12], which caused a series of cascading failures with rapid propagation. In order to understand the mechanism of cascading failures in power systems, it is necessary to comprehend how large-scale grids behave when different kinds of failures occur.
Electric grids, in principle, can be abstracted and considered as a type of complex network, with unique assumptions that describe the power system features. Numerous researchers have carried out relevant studies on complex networks; for example, investigations of a communication network via complex networks to increase reliability [13], the study of an epidemic complex network to efficiently destruct epidemic system [14], complex networks for musical compositions [15] and complex network approaches to optimizing the smart grid structure [16], just to list a few.
There are three typical forms of complex networks, namely scale-free networks, smart-world networks and Erdös–Rényi (ER) random networks. A scale-free network is a network whose degree of distribution, at least, asymptotically follows a power law [15]; a small-world network is a type of mathematical graph in which most nodes are not neighbours of one another, but the neighbours of any given node are likely to be neighbours of each other [16]; and an ER random network is either of the two closely-related models for generating random graphs with asymptotic stochastic graphs [17]. Real-world networks are usually combinations of these three typical networks, and thus, investigating these typical networks can provide innovative and impactful solutions to optimization problems and reliability and risk assessments. For instance, it has been possible to study and enhance the stability of communication networks through such analysis [18], and the issue that causes such instability can be effectively eliminated through vigorous research of complex networks [19]. The knowledge and research experience of complex network have enabled us to investigate the mechanism of cascading failures in power systems.
However, most exiting models analysing cascading failures in power systems have not taken into account the electrical features of power grids [20], making them fail to practically represent the realistic cascade propagation of power system failures. Intending to fill the shortage of research in this area, in this study, we propose a model that can practically describe the mechanism of cascading failure in power systems. The fundamental consideration of the proposed model is the load redistribution when a node fails. This model can represent, to a large extent, the dynamics of the cascade propagation of failure in a power system. Leveraging this proposed model, the robustness and vulnerability of a power system can be quantitatively analysed, which is validated through the aforementioned three typical networks. A realistic power grid in India is then employed to verify the proposed analytical method, which will provide advice as to how to improve the reliability of the power grid. Therefore, the proposed cascading failure model is proven valid through both theoretical analysis and simulation experiments.
The remainder of the paper is organized as follows. In Section 2, the proposed cascading failure model is presented, which is followed by the robustness analysis of three typical networks in Section 3. In Section 4, a real-world power grid example is analysed with the proposed model, which proves its validity. Finally, this paper concludes in Section 5.
2. The Proposed Cascading Failure Model
In Section 2, we propose a novel load-redistribution-based cascading failure model, considering both active and reactive loads, which pays particular attention to the load model and its role in modelling the cascade. Its derivation and development are shown in the following equations and deductions.
At each bus-bar, the loading condition at two consecutive sampling times can be described as follows [10],
where t represents the number of time instances, i indicates the node and and are the active and reactive power at the node at time instance t. Terms and are the load increments, which result from the redistribution from node j to node i at t, and stands for the index set of node i’s neighbours at t. If we use to represent the configuration of the power system at t, then we can write , indicating the node or bus inside the connection at time instance t. If a node is overloaded at time instance t, then this node is removed from instantaneously. Power variations and are given by:
where describes the state of node j at t with implying that node j is in the normal working condition, and means that node j breaks down as:
where and are the active and reactive power load capacities, which are given by:
where and denote the tolerance parameters of the active and reactive power loads, respectively, and and are the initial active and reactive power values, which are given by:
where is the degree (the number of its connected neighbours) of node j at , (>0) is a tunable parameter, which determines the load strength of the node, and:
is the proportional function of the failed node’s load at t, with being the degree of node j at t. Equation (6) is substituted into Equation (2) for power change calculation. According to the industrial standard, the reactive power load is normally assumed as of its active power load. In real power systems, however, not all reactive loads have the same relation to their active loads, and therefore, a modification factor is employed in (5). In a power grid, it is reasonable to assume that a node’s loading capacity is proportional to its degree , i.e., a node with more connections needs to have a larger loading capacity [21].
It should be mentioned that power systems will perform islanding when line overloading happens. When small islanded grids are formed, the power flow will be recalculated in the islanded grids. It is noted that the proposed method is still valid, regardless of the size of the grid. A small grid simulation will be the same as the simulation in the study, but with a reduced number of buses.
3. Robustness and Vulnerability of Power Grids
Robustness is a characteristic describing a model’s or system’s ability to resist random changes that alter its initial stable configuration. In this paper, “vulnerability” is used to describe a system’s ability to cope with heavy shocks, which represent the consequences in a power system caused by a single power station. Additionally, we distinguish the two kinds of failures, namely natural failures caused by natural phenomena, technical defects, wear, ageing, etc., and deliberate failures caused by intentional human activities such as bombing, blasting, cyber-attacks, etc. The natural failures are used to assess the robustness of a power grid, whereas man-made or deliberate failures are used to indicate the vulnerability of a power system.
3.1. Natural Failures and Robustness
We use term to denote the number of nodes in at and incorporate a failure at a node i by removing it from the network. As a result, the load of node i is then distributed to its neighbouring nodes, which are shown in Equations (1)–(6). If the resultant load at any neighbouring node exceeds its capacity, this node fails. The load redistribution is repeated until the loads of all remaining nodes fall below their respective capacities, i.e., the system reaches another stable condition. The number of failed nodes during the process is denoted by . Simulating this cascading process n times yields , ,...,, i.e., starting from the set of nodes , randomly selecting one node as failed and distributing its load in the network until the system stabilizes. The expected value of the discrete distribution thus obtained is called the normalized avalanche index, which indicates the probability of the occurrence of cascading failure in a power system, and is computed as follows:
We studied the behaviour of the avalanche index after natural failures upon the tunable parameter and the tolerance parameters and . These parameters affect each other and together determine the avalanche factor . Simulations were carried out for each triple with ranging from 0.1–2.0 with a step size of 0.1 and both and ranging from 0–1.0 with a step size 0.01. The simulation will produce in each case a discrete distribution of the ratios between the number of failed nodes and the total number of nodes in . In order to quantify the extent of cascading failures in different types of networks, Figure 1a–c illustrates the ratios of falling into different subranges of the tolerance parameters’ ranges for the 20 values of mentioned above.
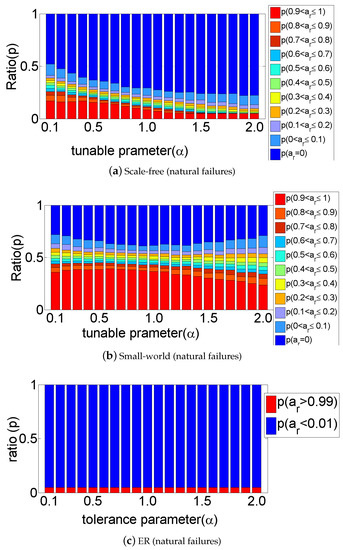
Figure 1.
Probabilities of cascading failures under natural failure conditions for three network types. ER, Erdös–Rényi.
Remarks:
- For scale-free power grids, Figure 1a shows the fractions of being zero or falling into one of the ten intervals , respectively. As increases, the probability of a large cascading failure (, marked in red) becomes lower, and the probability of no cascading failure (, marked in blue) becomes higher. In particular, it is found that for , the highest probability (77%) of not encountering a cascading failure is achieved. Scale-free power grid networks are considered robust under natural failure conditions, and they become more robust when increases, which means that, in natural failure mode, heavy-loading networks are more robust than light-loading ones.
- For small-world power grids, Figure 1b shows that the fractions of marked in red and blue do not depend predominantly on , which means that parameter has less influence on in the natural failure mode. Small-world power grid networks are still robust under natural failure conditions, but less robust than scale-free ones. The highest probability of not encountering a cascading failure is only 39%.
- For ER power grids, Figure 1c reveals that there are no obvious variations as increases, which indicates that parameter has no influence on under natural failure conditions. The probability of not encountering a cascading failure is constantly 95%. Hence, Erdös–Rényi power grids are the most robust ones among the three typical network types under natural failure conditions.
3.2. Deliberate Failures and Vulnerability
Deliberate failures caused by intentional obstruction of targeted nodes can demonstrate the fragility of a network. Normally, the nodes with the heaviest loads are treated as the most important ones, and some measures or special protections are employed to stabilize the network, whereas the nodes with the lightest loads are normally ignored in real networks. In this section, two different forms of malicious attacks to intentionally cause cascading failures are considered, i.e., highest loads attacks (HLA) and lowest loads attacks (LLA). In terms of the proposed model, with the number of nodes that fail during the cascading failure caused by an attack, an avalanche index is defined as:
Under HLA, the dependence of this avalanche index on the tunable parameter and the tolerance parameters and is shown in Figure 2. To quantify the extents of cascading failures, Figure 2a–c illustrates the ratios of that fall into the subranges (marked in blue) and (marked in red), for the 20 values of mentioned above.
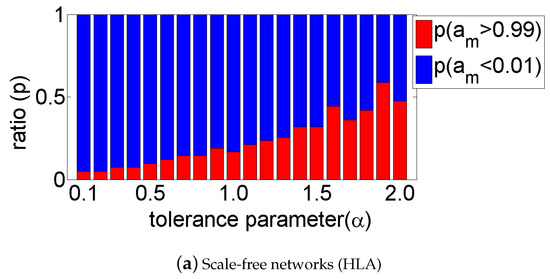
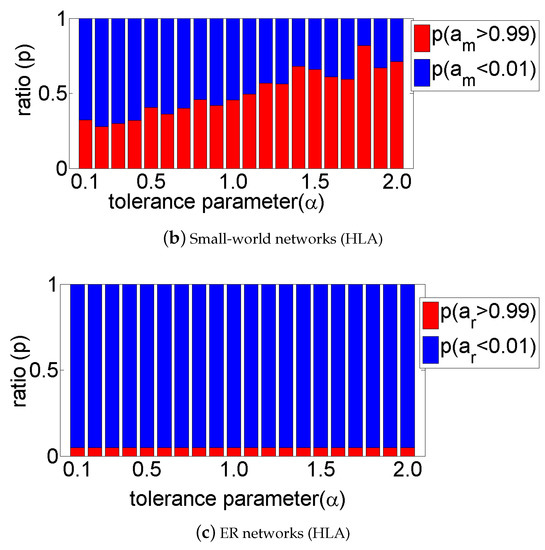
Figure 2.
Probabilities of the extents of cascading failures for three network types under highest loads attacks.
Similarly, Figure 3a–c illustrates the ratios of that fall into the subranges (marked in blue) and (marked in red), respectively, for the same values of under LLA. Interpreting Figure 2 and Figure 3, it can be seen that:
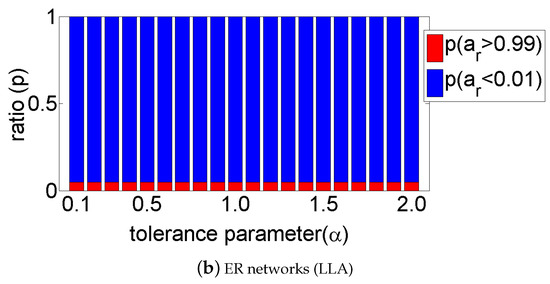
Figure 3.
Probabilities of the extents of cascading failures for three network types under lowest loads attacks.
- For scale-free power grids, Figure 2a and Figure 3a show that the probability of very large cascading failures (, marked in red) grows as increases under HLA, but decreases as increases under LLA. Scale-free power grids are vulnerable under malicious attacks. Further, scale-free power grids with heavy loads are more vulnerable than the ones with light loads under HLA, while the power networks with light loads are more vulnerable than the ones with heavy loads under LLA.
4. Case Study of a Real-World Power Grid
The characteristics of small-world complex networks can be expressed as:
where, , and are the average path lengths of random networks, regular networks and small-world networks, respectively, while , and are the clustering coefficients of random networks, regular networks and small-world networks, respectively. Terms K and n are the number of the network’s edges and nodes [22]. The Indian power grid falls into the category of a small-world network, and in this section, the proposed cascading failure model will be verified using real-world data of the Indian power grid through our simulation study.
4.1. Small-World Characteristics and Robustness of the Indian Power Grid
As in (9), the parameters of the Indian power grid were calculated and are listed in Table 1. It is revealed that and , which satisfies (9), implying the Indian power grid has the characteristics of small-world networks.

Table 1.
Comparison of different networks.
The avalanche index of the Indian power grid was simulated with real data. Figure 4 depicts the probabilities of cascading failures occurring. It can be seen that the larger the parameter (here, shown for the four values 0.5, 1.0, 1.5 and 2.0) is, the smaller is the avalanche index, thus the lower probability of a cascading failure. This leads to the following conclusions:
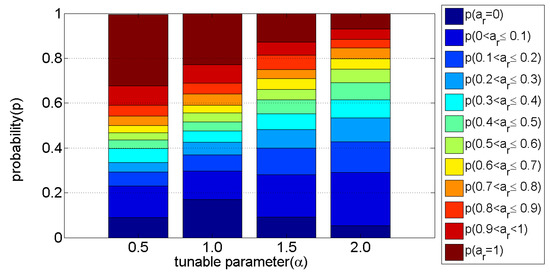
Figure 4.
Probabilities of cascading failures in the Indian power grid under natural failure conditions.
- The probability of medium and small cascading failures () grows as increases.
- With the increase of , the probability of a definite cascading failure () becomes smaller and is just 7% for . This implies that the probability of a definite cascading failure is very small under natural failure conditions, i.e., the grid is robust under these conditions.
- The probability of a large cascading failure (), which means nearly 515 out of the total 572 nodes fail, is also very small. The probability of a cascading failure is nearly zero under natural failure conditions when the tolerance parameters and are both larger than in real power systems. Hence, the Indian power grid is robust under natural failure condition, which is reasonable for its small-world features.
4.2. Scale-Free Characteristics and Vulnerability of the Indian Power Grid
Utilizing real data of the Indian power grid with its 572 nodes and 871 edges, its robustness and vulnerability are simulated and analysed as follows. Normally, it is assumed that the node with the largest load is the most important one, while the nodes with light loads are always ignored. However, nodes with light loads cannot be excluded from consideration and are taken into account in this case study. We notice that:
- Figure 5a,b shows that the probability of very large cascading failures (, marked in red) grows with as increases under HLA, but decreases under LLA.
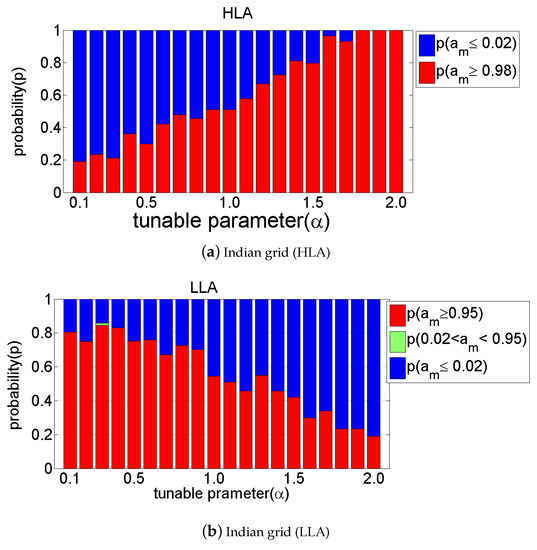 Figure 5. Probabilities of cascading failures in the Indian power grid under HLA and LLA.
 - It is obvious that HLA can lead to a definite cascading failure in the power grids of interest. In the case of the Indian cascading failure on 30 and 31 July 2012, it was caused by the failure of the Bina-Gwalior-Agra line, which took the heaviest load in the power grid. This fact shows great agreement with the simulation conducted in this study. Hence, in reality, special care needs to be taken for the nodes with the highest loads, e.g., more back-up capacities should be provided or more protective measures should be taken to ensure the stability of the power system.
- LLA is normally ignored, but can also cause a definite cascading failure, i.e., the light loads in power systems are vulnerable under LLA. Hence, it is necessary to pay more attention to light loads.
5. Conclusions
In this paper, we proposed a load-redistribution-based practical cascading failure model in power systems, with which three typical power grids (scale-free, small-world and ER networks) and a real-world power grid in India have been studied. The simulations, which incorporate both naturally-induced failures and deliberate man-made failures into the proposed model, demonstrate the robustness and vulnerability of the distinct types of networks. The simulation results of the India power grid displayed high congruity with what actually happened in the “30 July 2012” blackout, which have shown that the power grid is robust under natural failures but vulnerable under deliberate attacks. We can also conclude that heavy-loading and light-loading nodes are both important and can cause cascading failures, so that they should both be protected appropriately. The proposed model, which although was only applied to an Indian power grid, has wide applicability (including power grids in China) through extensive analyses in the three typical networks. At a regulatory level, this paper suggests that policy makers and power system operators need to give thorough consideration when designing and deploying protection systems, where both heavy-loading and light-loading facilities require appropriate protection mechanisms.
Author Contributions
Conceptualization, G.Z. Formal analysis, S.Z. Investigation, G.Z. Methodology, H.H.-C.I. Project administration, Y.Z. Supervision, T.F. and Y.Z. Writing, original draft, G.Z. Writing, review and editing, S.S.Y. All authors of this paper contributed equally to this work.
Funding
This research was funded in part by the National Natural Science Foundation of China Grant Number U1501251, in part by the Natural Science Foundation of Guangdong Province Grant Number 2017A030310243, in part by the Australian Research Council (ARC) Discovery Project (DP) Grant Number DP170104426, in part by the Foundation for Distinguished Young Talents in Higher Education of Guangdong Grant Number 2016KQNCX039 and in part by the Science and Technology Planning Project of Guangzhou under Grant Number 201804010310.
Conflicts of Interest
The authors declare no conflicts of interest.
References
- Omagari, Y.; Funaki, T. Experimental validation of an equivalent mechanical model for understanding power system stability. IEICE Electron. 2010, 7, 1578–1583. [Google Scholar] [CrossRef]
- Sabbah, A.I.; El-Mougy, A.; Ibnkahla, M. A survey of networking challenges and routing protocols in smart grids. IEEE Trans. Ind. Inf. 2013, 10, 210–221. [Google Scholar] [CrossRef]
- Wang, K.; Ouyang, Z.; Krishnan, R. A game theory based energy management system using price elasticity for smart grids. IEEE Trans. Ind. Inf. 2015, 11, 1607–1616. [Google Scholar] [CrossRef]
- Alahakoon, D.; Yu, X. Smart electricity meter data intelligence for future energy systems: A survey. IEEE Trans. Ind. Inf. 2016, 12, 425–436. [Google Scholar] [CrossRef]
- Liu, S.; Chen, B.; Zourntos, T.; Kundur, D.; Butler-Purry, K. A coordinated multi-switch attack for cascading failures in smart grid. IEEE Trans. Smart Grid 2014, 5, 1183–1195. [Google Scholar] [CrossRef]
- Zhou, D.; Elmokashfi, A. Network recovery based on system crash early warning in a cascading failure model. Sci. Rep. 2018, 8, 7443. [Google Scholar] [CrossRef] [PubMed]
- Fan, S.; He, G.; Jia, K.; Wang, Z. A Novel Distributed Large-Scale Demand Response Scheme in High Proportion Renewable Energy Sources Integration Power Systems. Appl. Sci. 2018, 8, 452. [Google Scholar] [CrossRef]
- Sun, Y.; Yu, X.; Tan, Z.; Xu, X.; Yan, Q. Efficiency evaluation of operation analysis systems based on dynamic data envelope analysis models from a big data perspective. Appl. Sci. 2017, 7, 624. [Google Scholar] [CrossRef]
- Glanz, J.; Perez-Pena, R. 90 Seconds That Left Tens of Millions of People in the Dark. New York Times, 2003; 1. [Google Scholar]
- Zhang, G.; Li, Z.; Zhang, B.; Halang, W.A. Understanding the cascading failures in Indian power grids with complex networks theory. Phys. A Stat. Mech. Its Appl. 2013, 392, 3273–3280. [Google Scholar] [CrossRef]
- Pournaras, E.; Vasirani, M.; Kooij, R.E.; Aberer, K. Decentralized planning of energy demand for the management of robustness and discomfort. IIEEE Trans. Ind. Inf. 2014, 10, 2280–2289. [Google Scholar] [CrossRef]
- Dwivedi, A.; Yu, X. A maximum-flow-based complex network approach for power system vulnerability analysis. IIEEE Trans. Ind. Inf. 2013, 9, 81–88. [Google Scholar] [CrossRef]
- Rossello, J.L.; Paul, I.D.; Canals, V. Stochasticnet: Self-configuring spiking neural networks. IEICE Electron. Express 2018, 10, 2280. [Google Scholar] [CrossRef]
- Del Real, A.J.; Arce, A.; Bordons, C. An integrated framework for distributed model predictive control of large-scale power networks. IEEE Trans. Ind. Inf. 2013, 10, 197–209. [Google Scholar] [CrossRef]
- Liu, X.F.; Chi, K.T.; Small, M. Complex network structure of musical compositions: Algorithmic generation of appealing music. Phys. A Stat. Mech. Its Appl. 2013, 389, 126–132. [Google Scholar] [CrossRef]
- Li, W.; Ferdowsi, M.; Stevic, M.; Monti, A.; Ponci, F. Cosimulation for smart grid communications. IEEE Trans. Ind. Inf. 2014, 10, 2374–2384. [Google Scholar] [CrossRef]
- Abe, R.; Taoka, H.; McQuilkin, D. Communicative electrical grids of the future. IEEE Trans. Smart Grid 2012, 2, 399. [Google Scholar] [CrossRef]
- El-Saleh, A.A.; Ismail, M.; Viknesh, R.; Mark, C.C.; Chan, M.L. Particle swarm optimization for mobile network design. IEICE Electron. Express 2012, 6, 1219–1225. [Google Scholar] [CrossRef]
- Kim, N.-T. Design of an ultra-broadband power amplifier using distributed network synthesis. IEICE Electron. Express 2013, 10, 20130614. [Google Scholar] [CrossRef]
- Wei, D.Q.; Luo, X.S.; Zhang, B. Analysis of cascading failure in complex power networks under the load local preferential redistribution rule. Phys. A Stat. Mech. Its Appl. 2012, 391, 2771–2777. [Google Scholar] [CrossRef]
- Nguyen, D.T.; Shen, Y.; Thai, M.T. Detecting critical nodes in interdependent power networks for vulnerability assessment. IEEE Trans. Smart Grid 2013, 4, 151–159. [Google Scholar] [CrossRef]
- Pastor-Satorras, R.; Castellano, C.; van Mieghem, P.; Vespignani, A. Epidemic processes in complex networks. Rev. Mod. Phys. 2015, 87, 925. [Google Scholar] [CrossRef]
© 2018 by the authors. Licensee MDPI, Basel, Switzerland. This article is an open access article distributed under the terms and conditions of the Creative Commons Attribution (CC BY) license (http://creativecommons.org/licenses/by/4.0/).