Swelling Capacity and Hydraulic Conductivity of Polymer-Modified Bentonite under Saline Water Conditions


Abstract
:1. Introduction
2. Materials
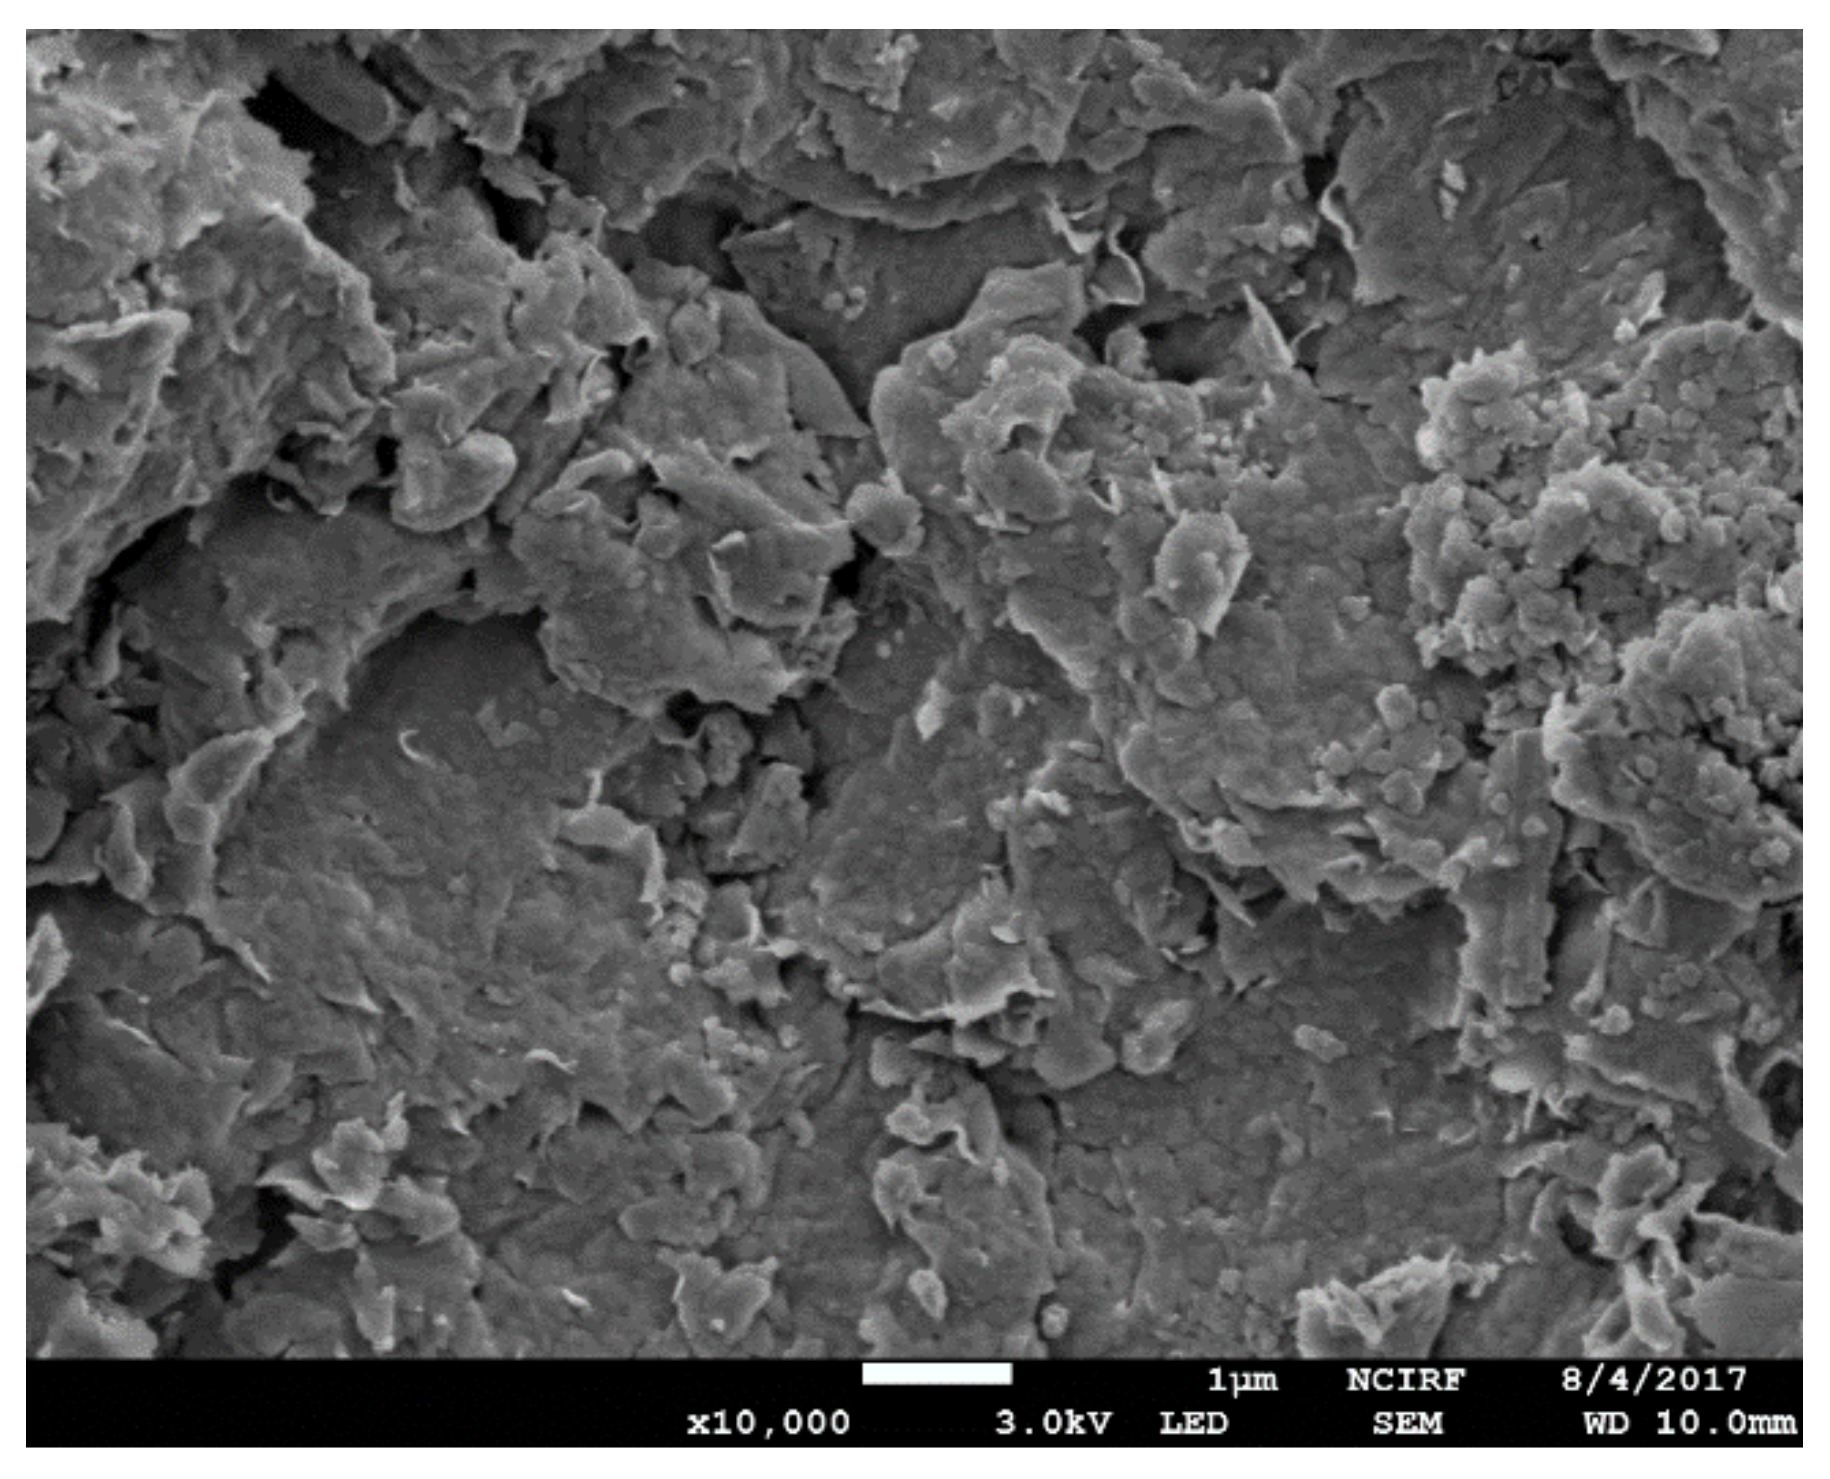
2.1. Bentonite
2.2. Guar Gum
2.3. Permeant Solutions
3. Methods
3.1. Specimen Preparation
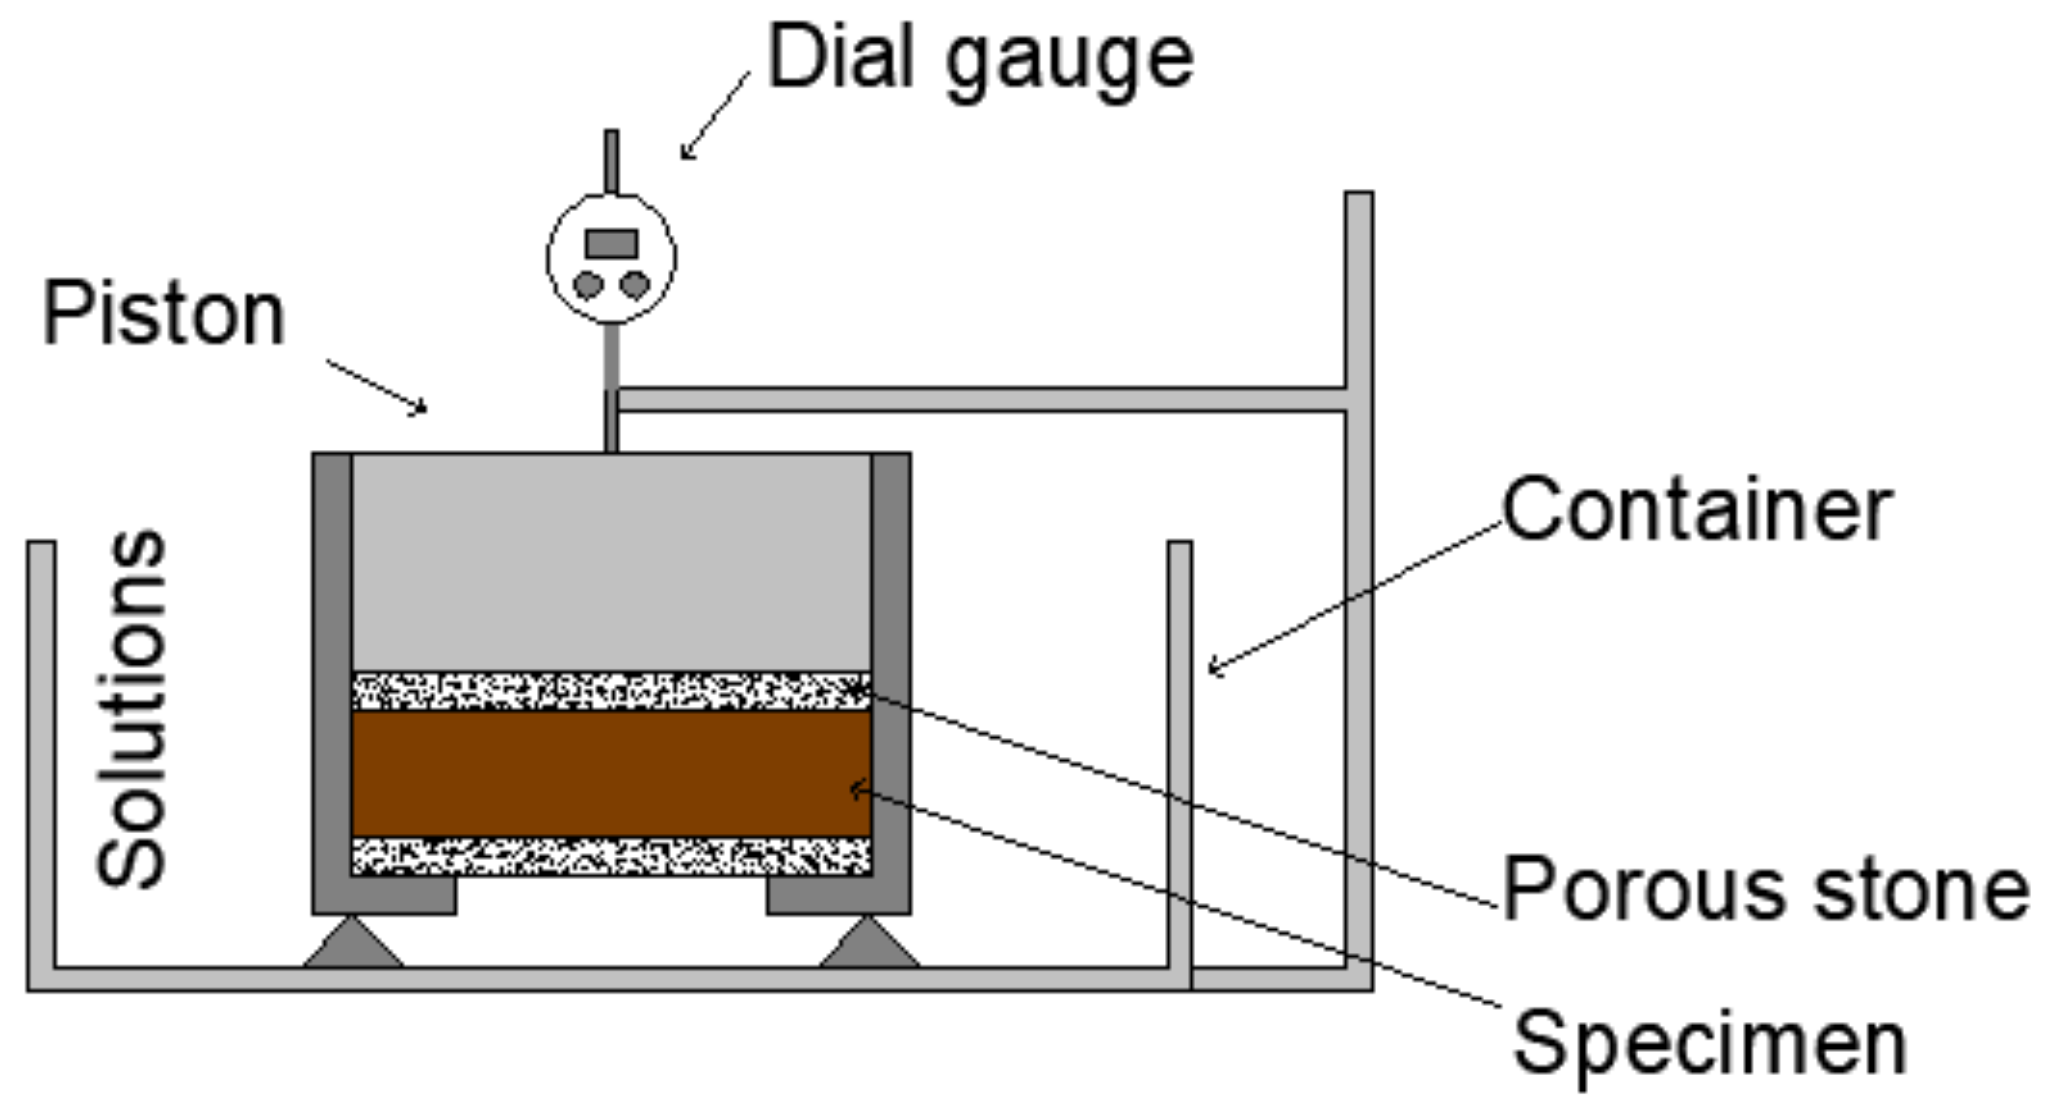
3.2. Unloaded Swelling Strain Test
3.3. Loaded Swelling Strain Test
3.4. Vertical Swelling Pressure Test
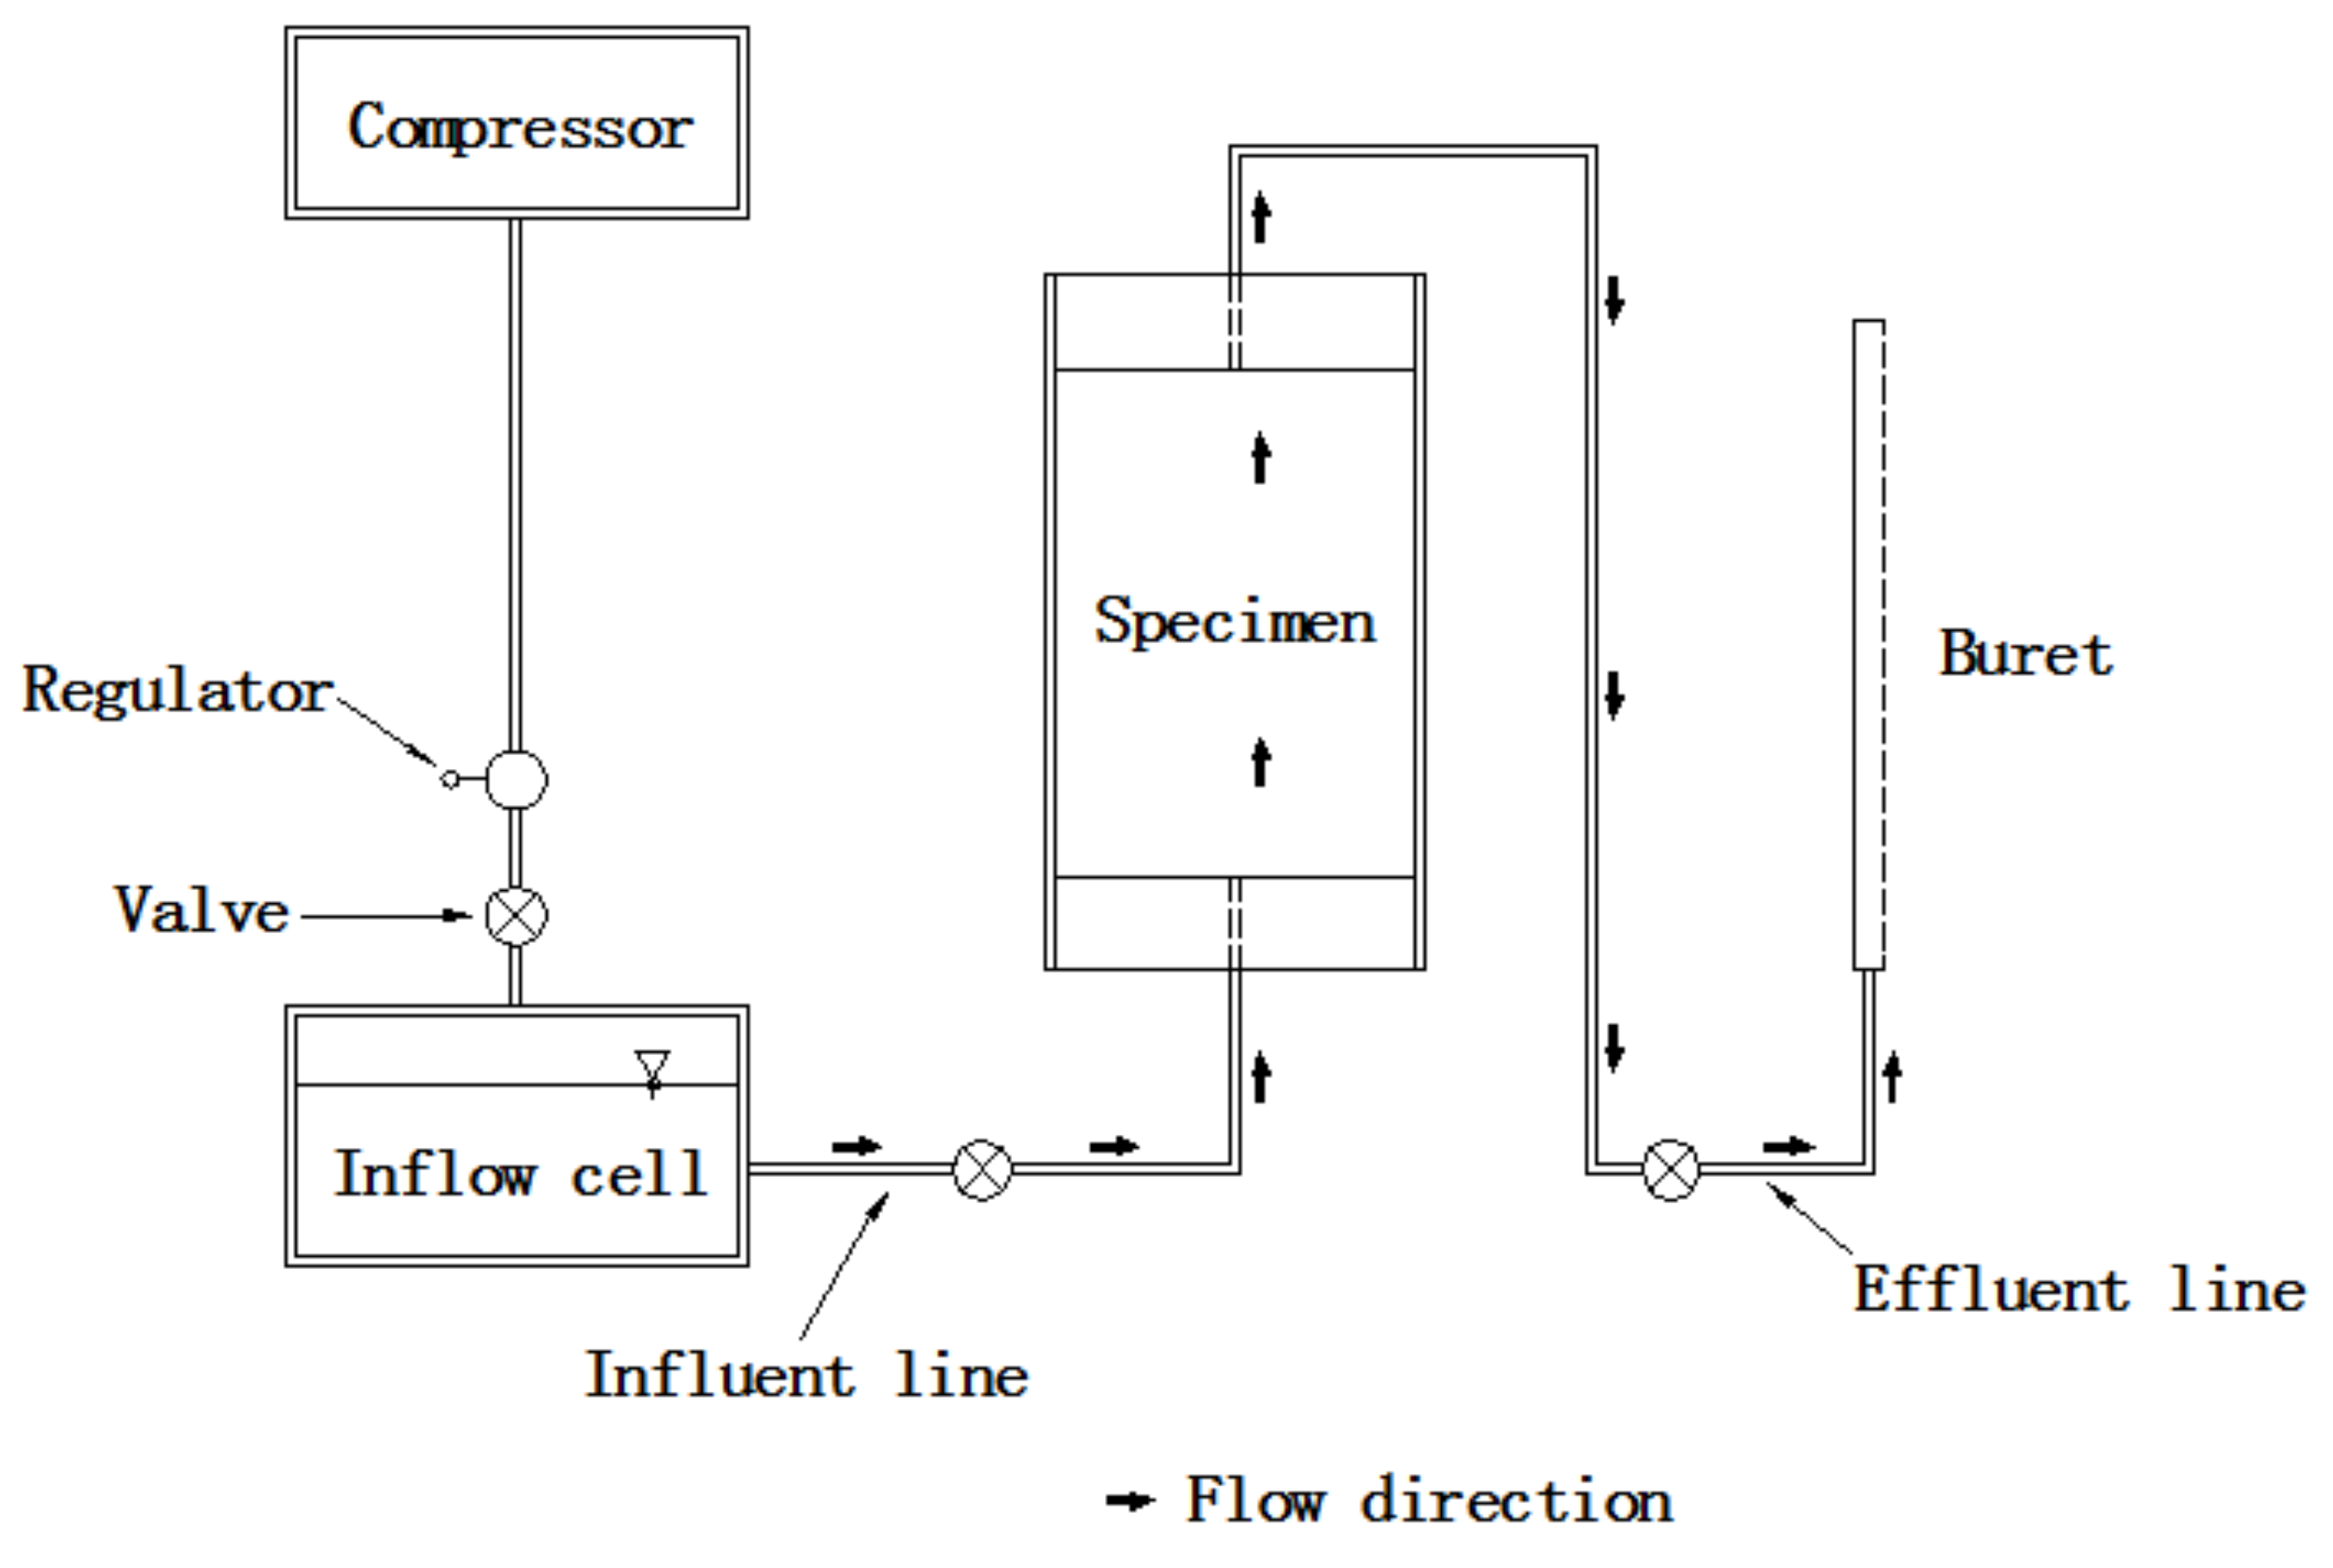
3.5. Hydraulic Conductivity Test
4. Results and Discussion
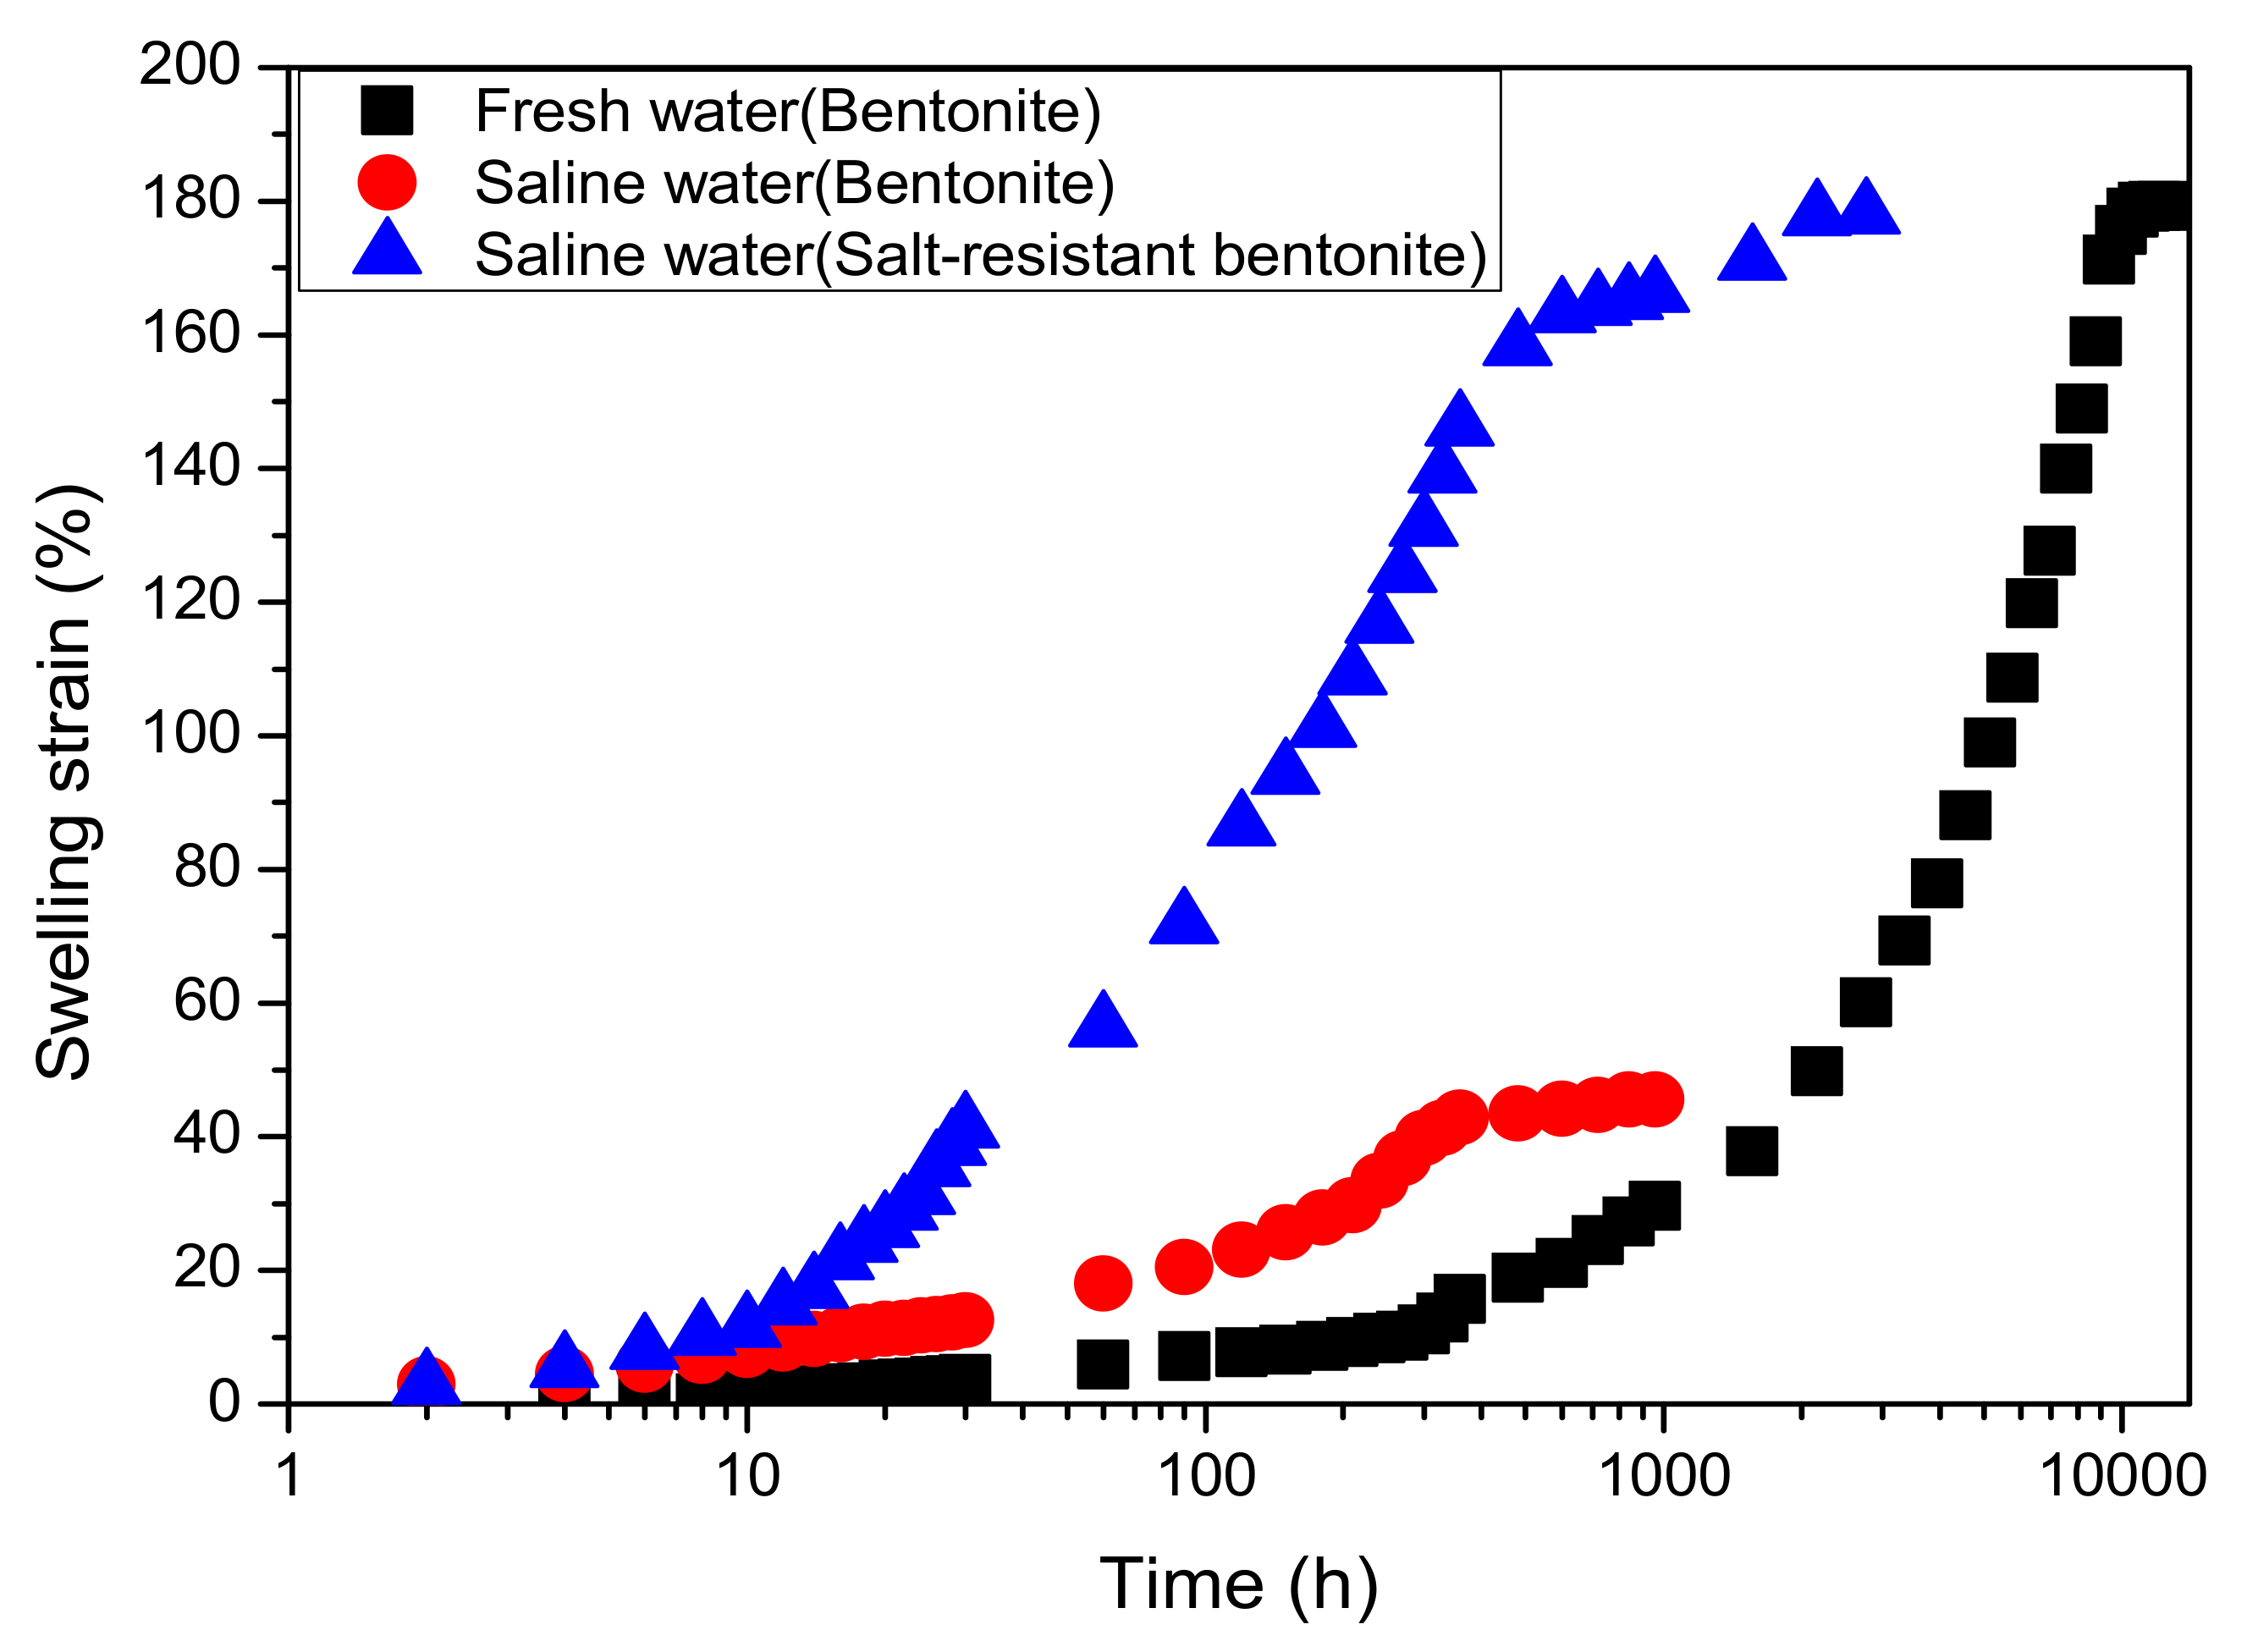
4.1. Unloaded Swelling Deformation
4.1.1. Improvement Effect of MB
4.1.2. Unloaded Swelling Deformation of MB
4.2. Loaded Swelling Deformation
4.2.1. Effect of Initial Dry Density
4.2.2. Effect of Vertical Pressure
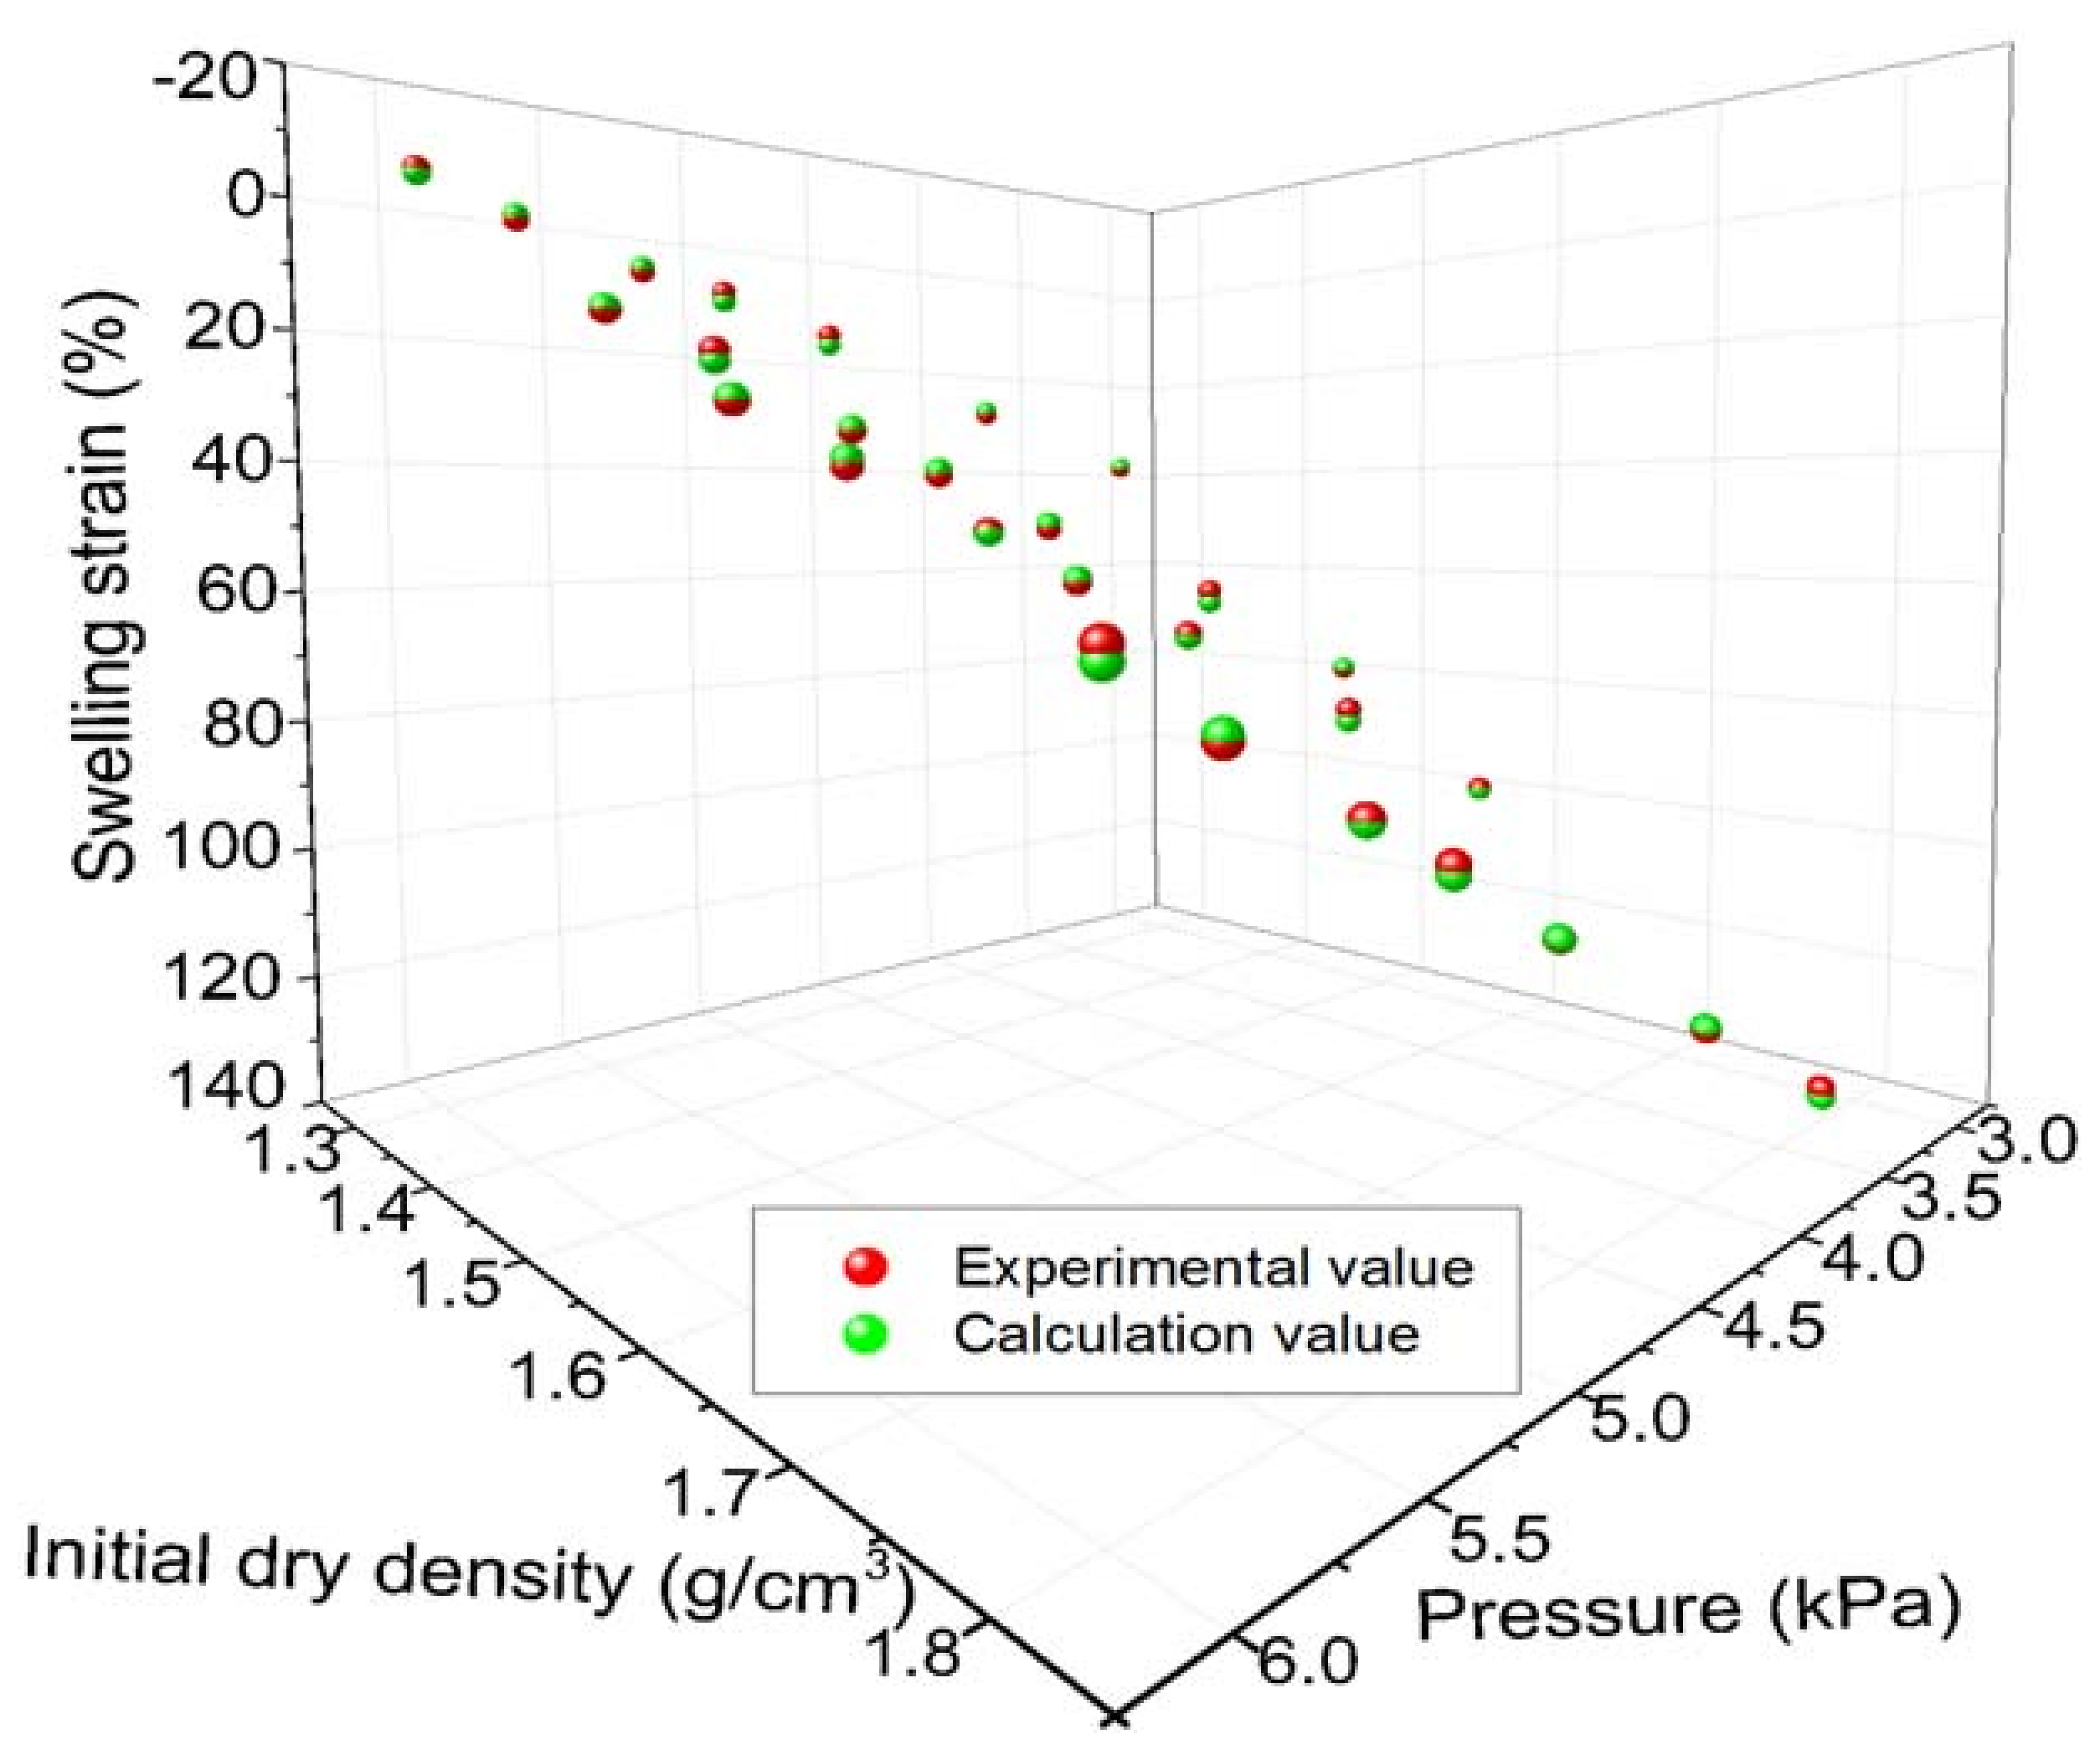
4.2.3. Calculation of Loaded Swelling Strain
4.3. Vertical Swelling Pressure
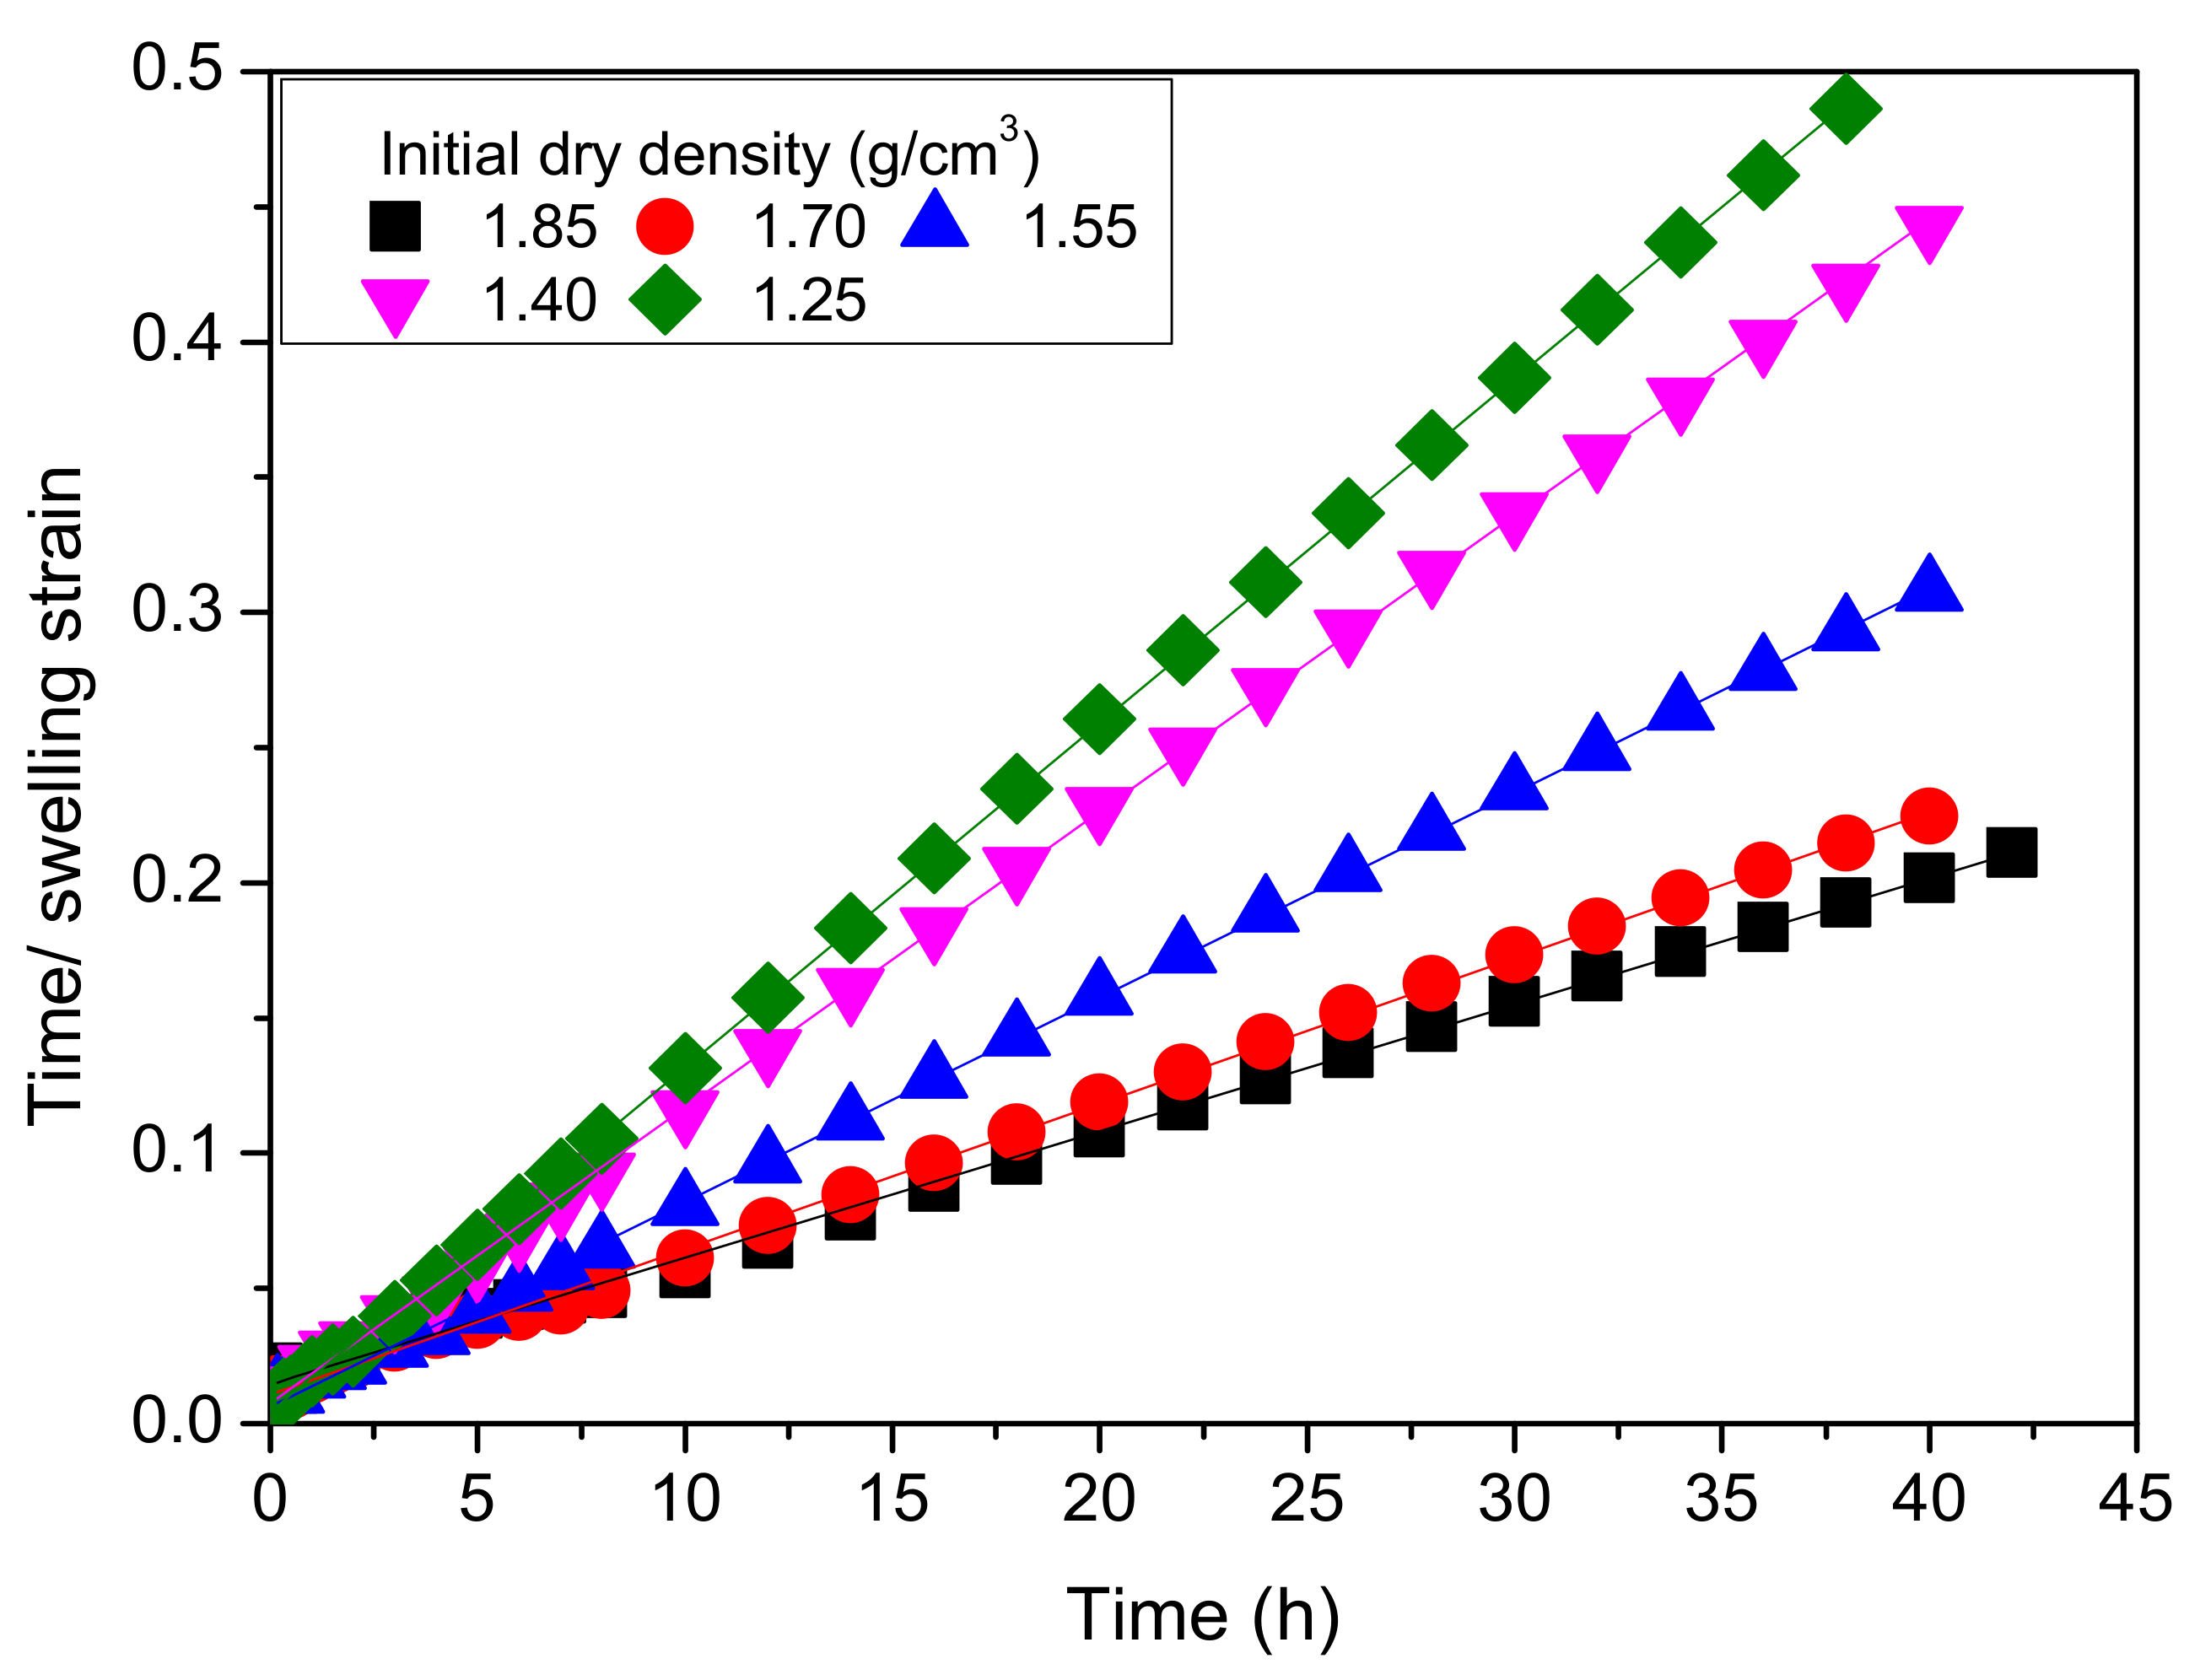
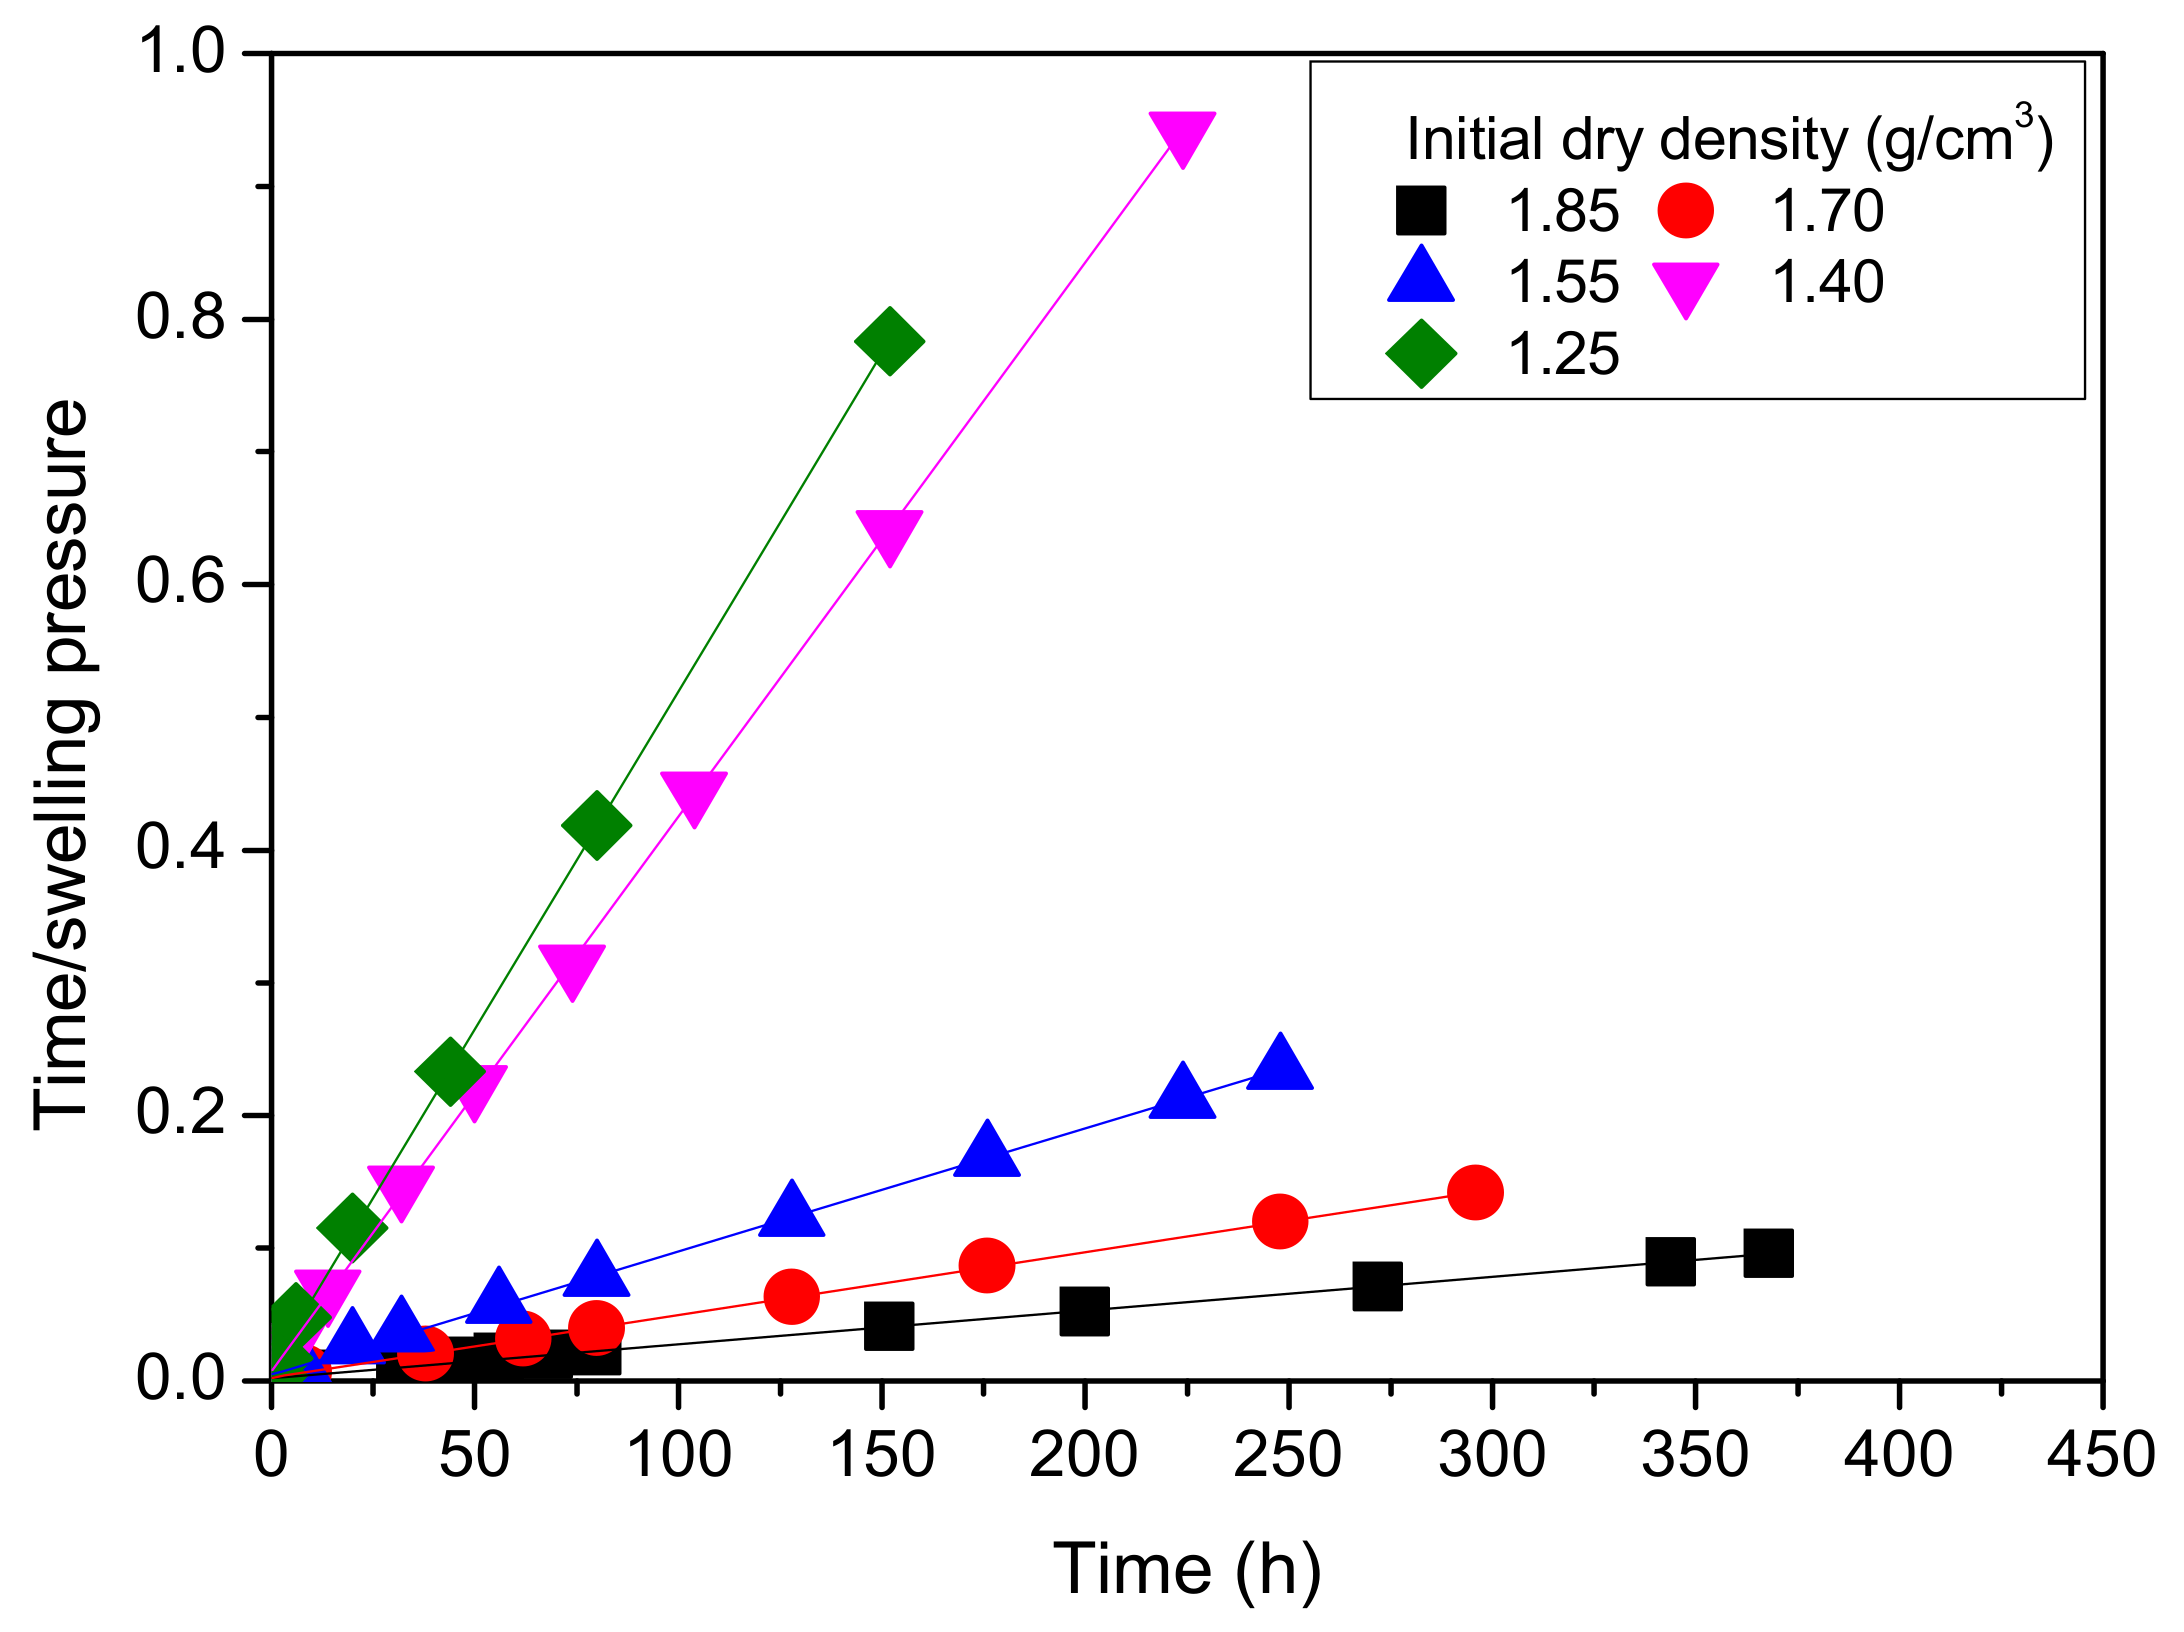
4.3.1. Effect of Swelling Time
4.3.2. Effect of Initial Dry Density
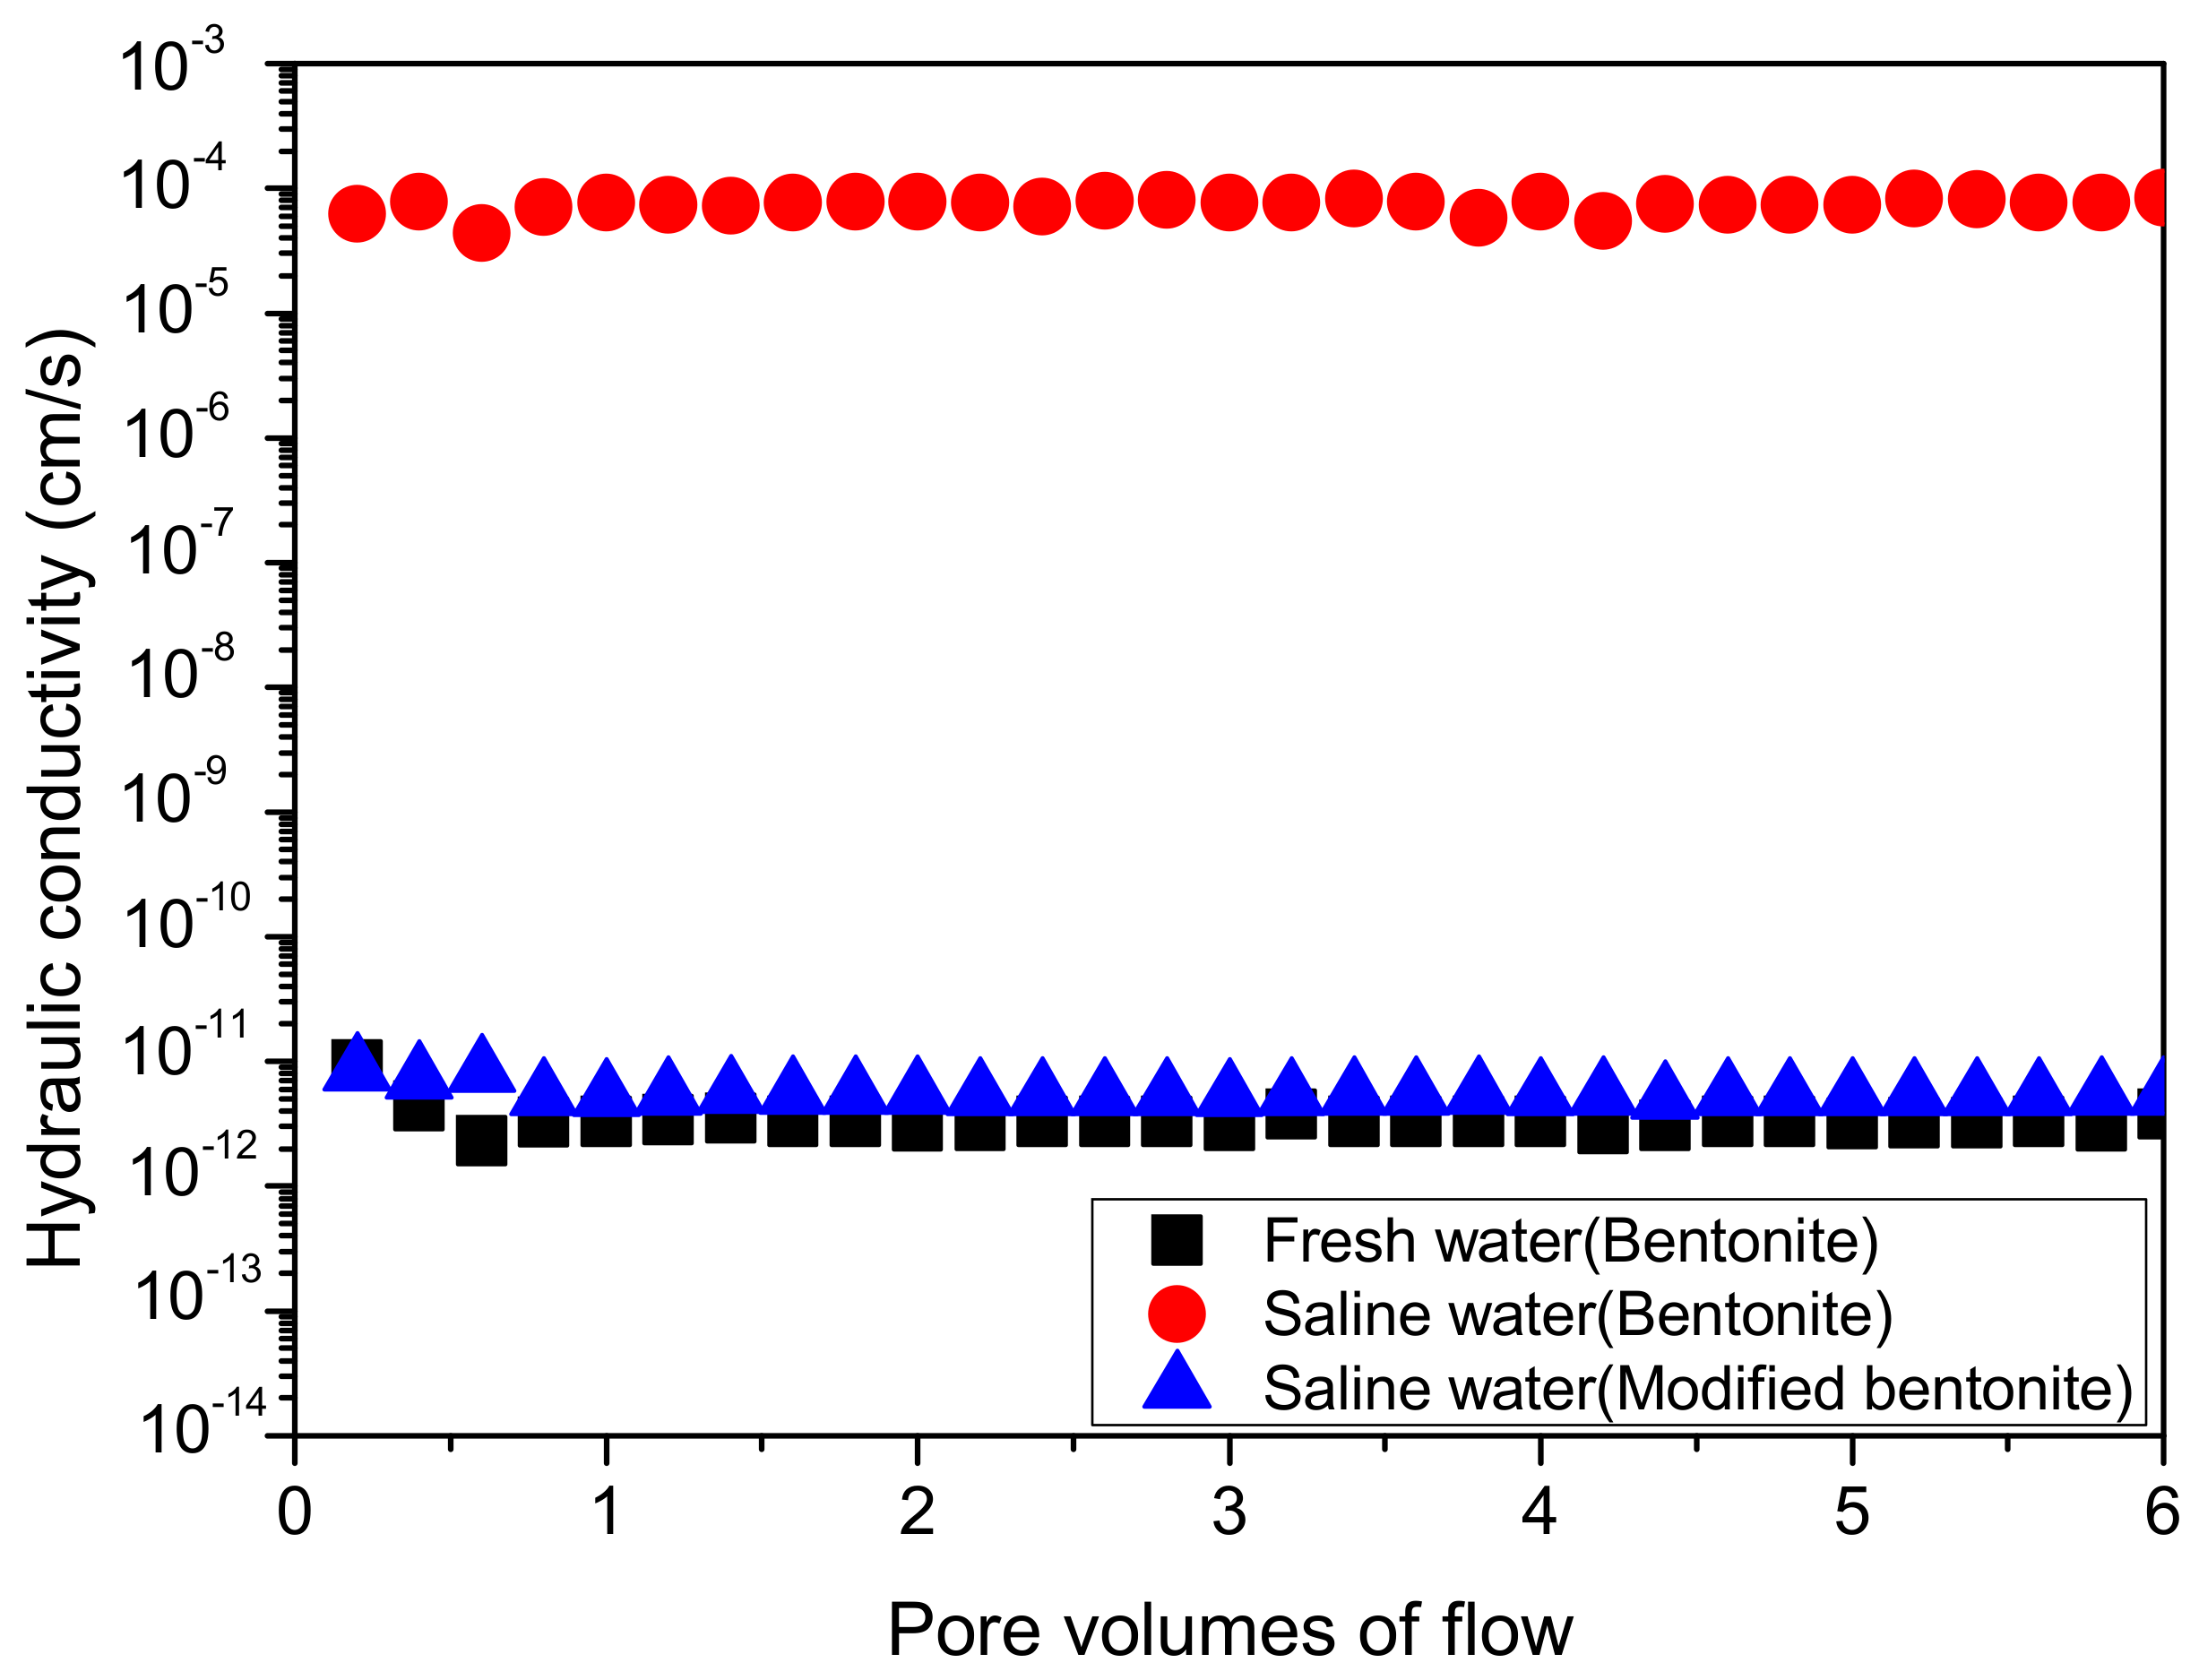
4.4. Hydraulic Conductivity
5. Conclusions
- (1)
- The improvement efficiency of MB is remarkable, the MB material exhibits good swelling characteristic and a low permeability in saline water, and the hydraulic conductivity of MB is less than 3 × 10⁻¹² cm/s.
- (2)
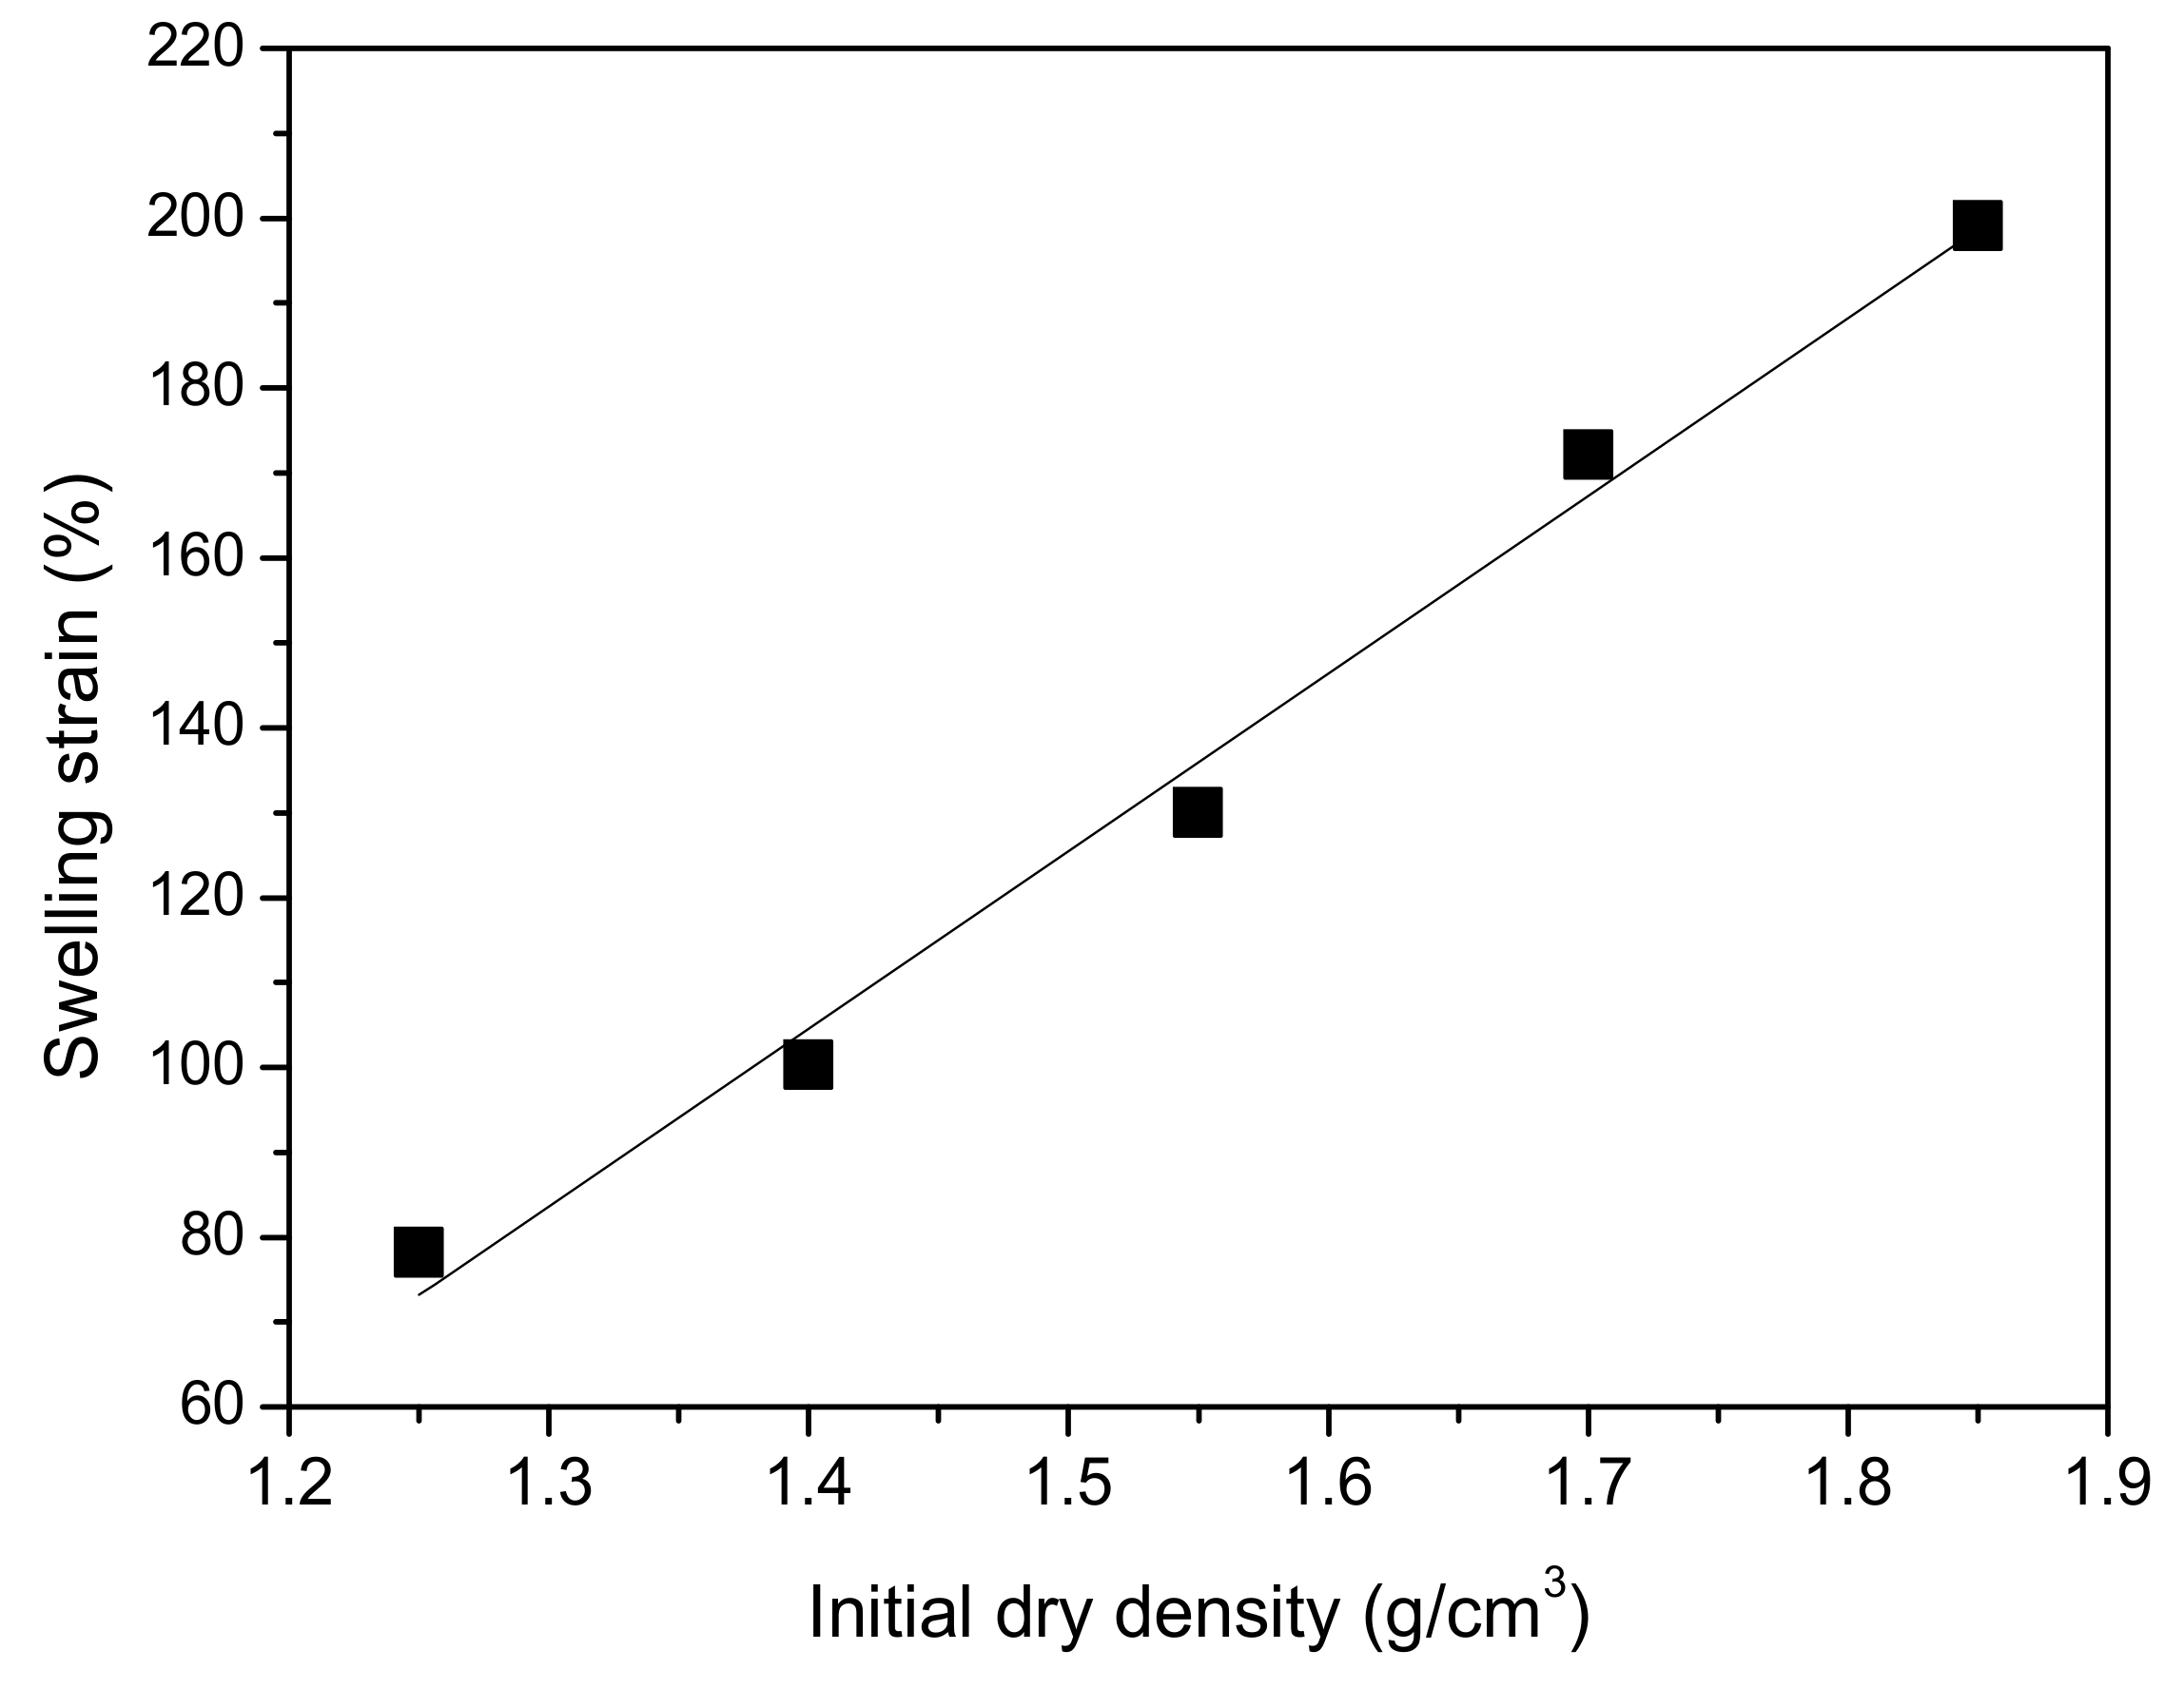
- The unloading swelling strain on MB in saline water increases over time and there is a linear relationship between the ratio of time to swelling strain and swelling time; the final unloading swelling strain of MB increases linearly with increasing initial dry density.
- (3)
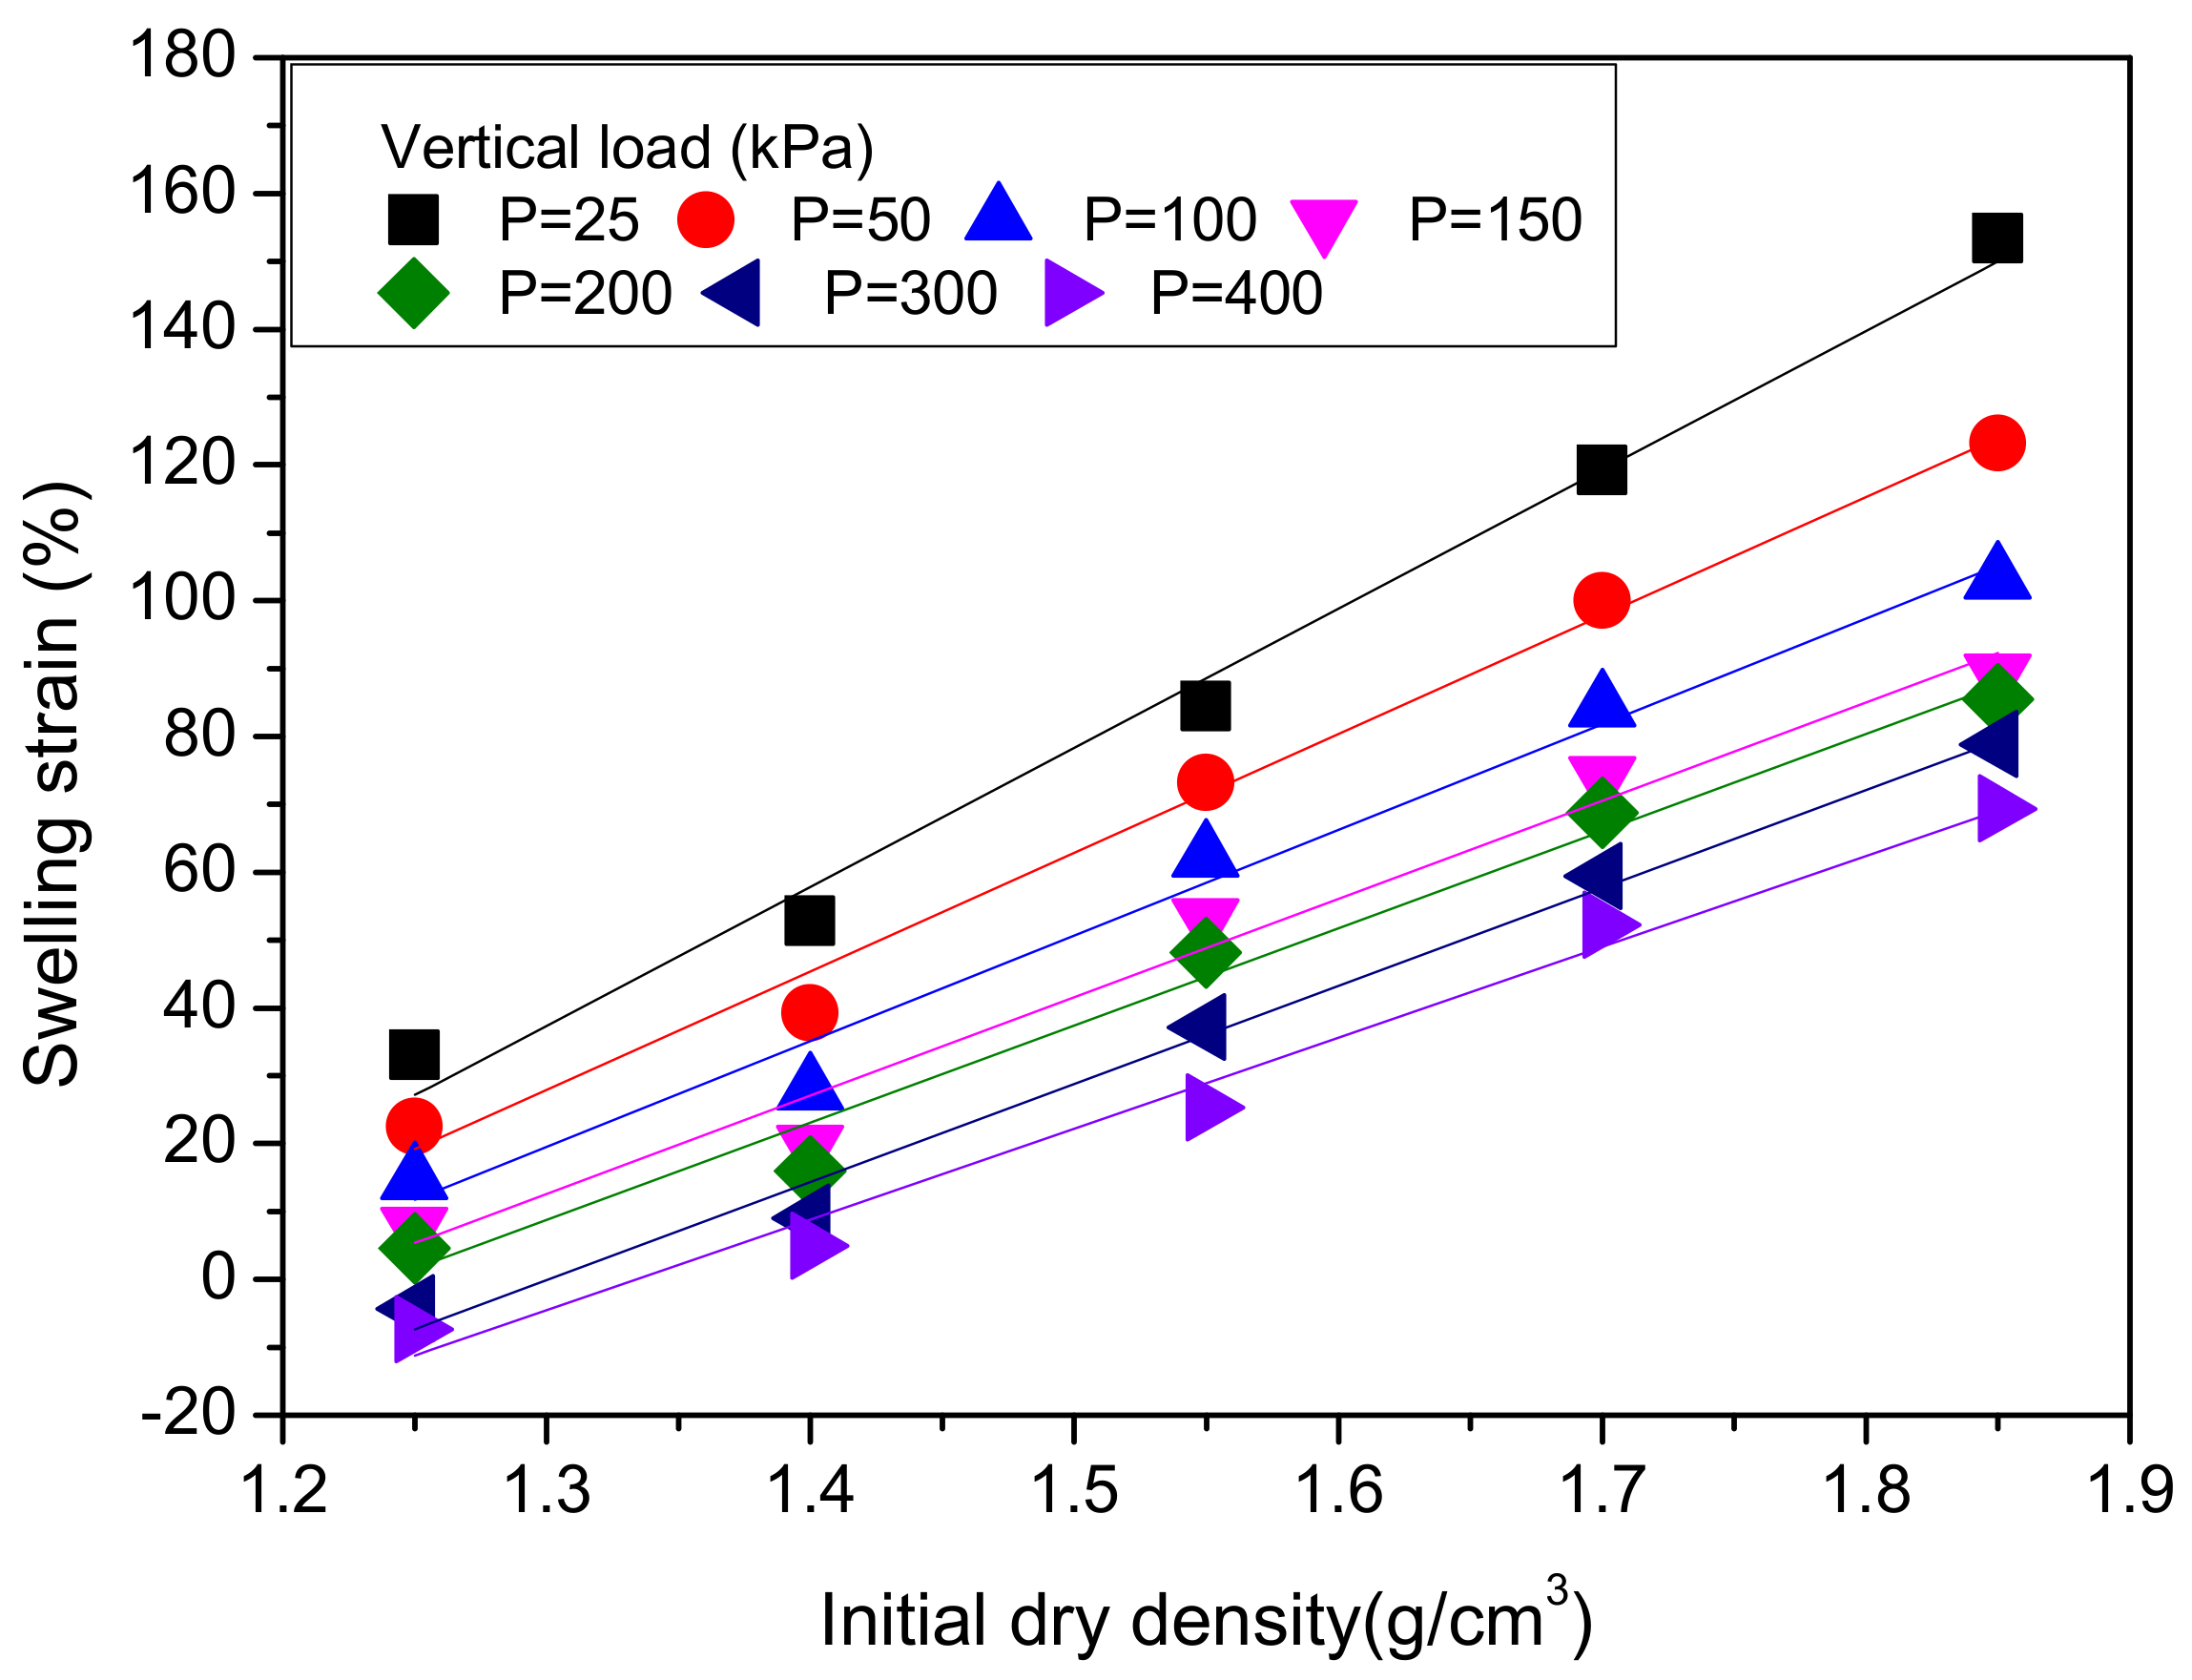
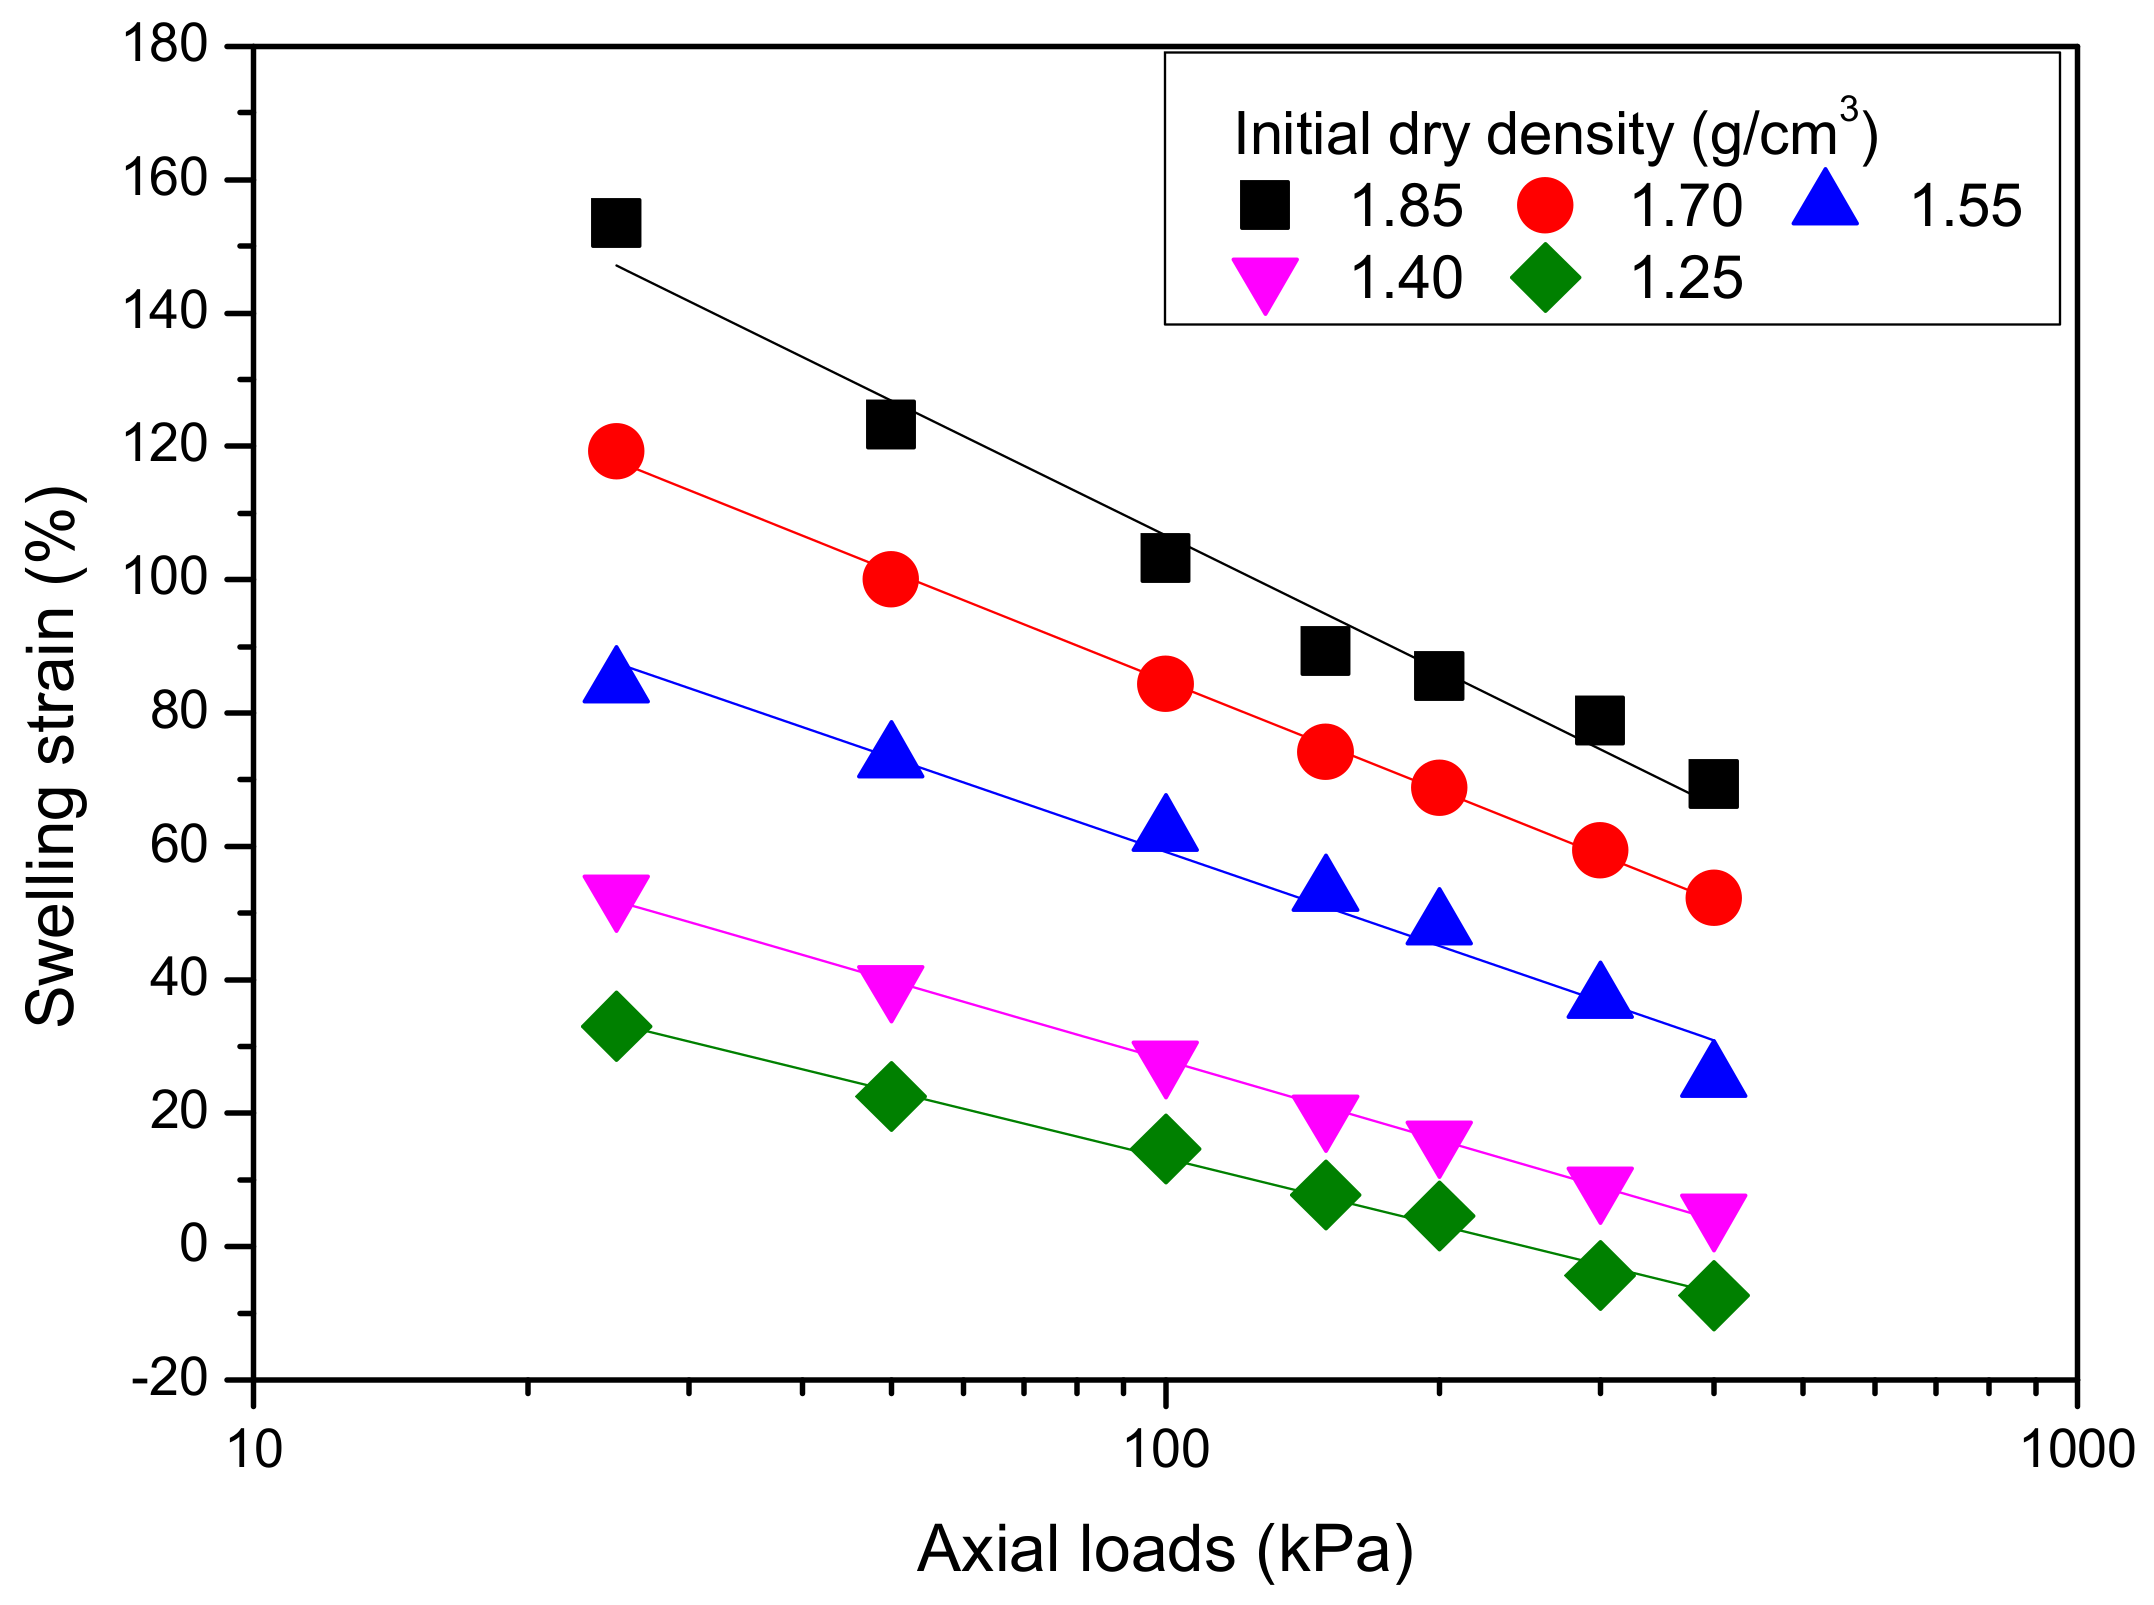
- The loading swelling strain of MB decreases with the increase of vertical pressure and increases with the initial dry density; a formula for the loading swelling strain that was related to initial dry density and vertical pressure was obtained.
- (4)
- With increasing swelling time, the swelling pressure increases rapidly at first and then decreases, the ratio of time to swelling pressure has a linear relationship with swelling time, and the relationship between swelling pressure and initial dry density of MB specimens is exponential and increasing.
- (5)
- Relationship affecting the swelling capacity of bentonite was deduced, and all such equations can provide a theoretical basis for the use of modified bentonite as an impermeable material in civil engineering practice.
- (6)
- The empirical relationships obtained above are only applicable to the specific conditions of this study. Swelling capacity can be influenced by other factors, for example, mixing of polymer and bentonite, and chemical compositions of the permeant. In future studies, these factors will be explored to facilitate the characterization of universal empirical relationships.
Author Contributions
Funding
Acknowledgments
Conflicts of Interest
References
- Koch, D. Bentonites as a basic material for technical base liners and site encapsulation cut-off walls. Appl. Clay Sci. 2002, 21, 1–11. [Google Scholar] [CrossRef]
- Kong, W.A.; Zheng, S.L.; Bai, C.H.; Dou, Z.L. Study on swelling performance of bentonite in aqueous solution. Non-Met. Mines 2010, 1, 42–44. [Google Scholar]
- Sun, L.; Hirvi, J.T.; Schatz, T.; Kasa, S.; Pakkanen, T.A. Estimation of montmorillonite swelling pressure: A molecular dynamics approach. J. Phys. Chem. C. 2015, 119, 19863–19868. [Google Scholar] [CrossRef]
- Laird, D.A. Influence of layer charge on swelling of smectites. Appl. Clay Sci. 2006, 34, 74–87. [Google Scholar] [CrossRef]
- Liu, L. Prediction of swelling pressures of different types of bentonite in dilute solutions. Coll. Surf. A Physicochem. Eng. Asp. 2013, 434, 303–318. [Google Scholar] [CrossRef]
- Sun, L.; Tanskanen, J.T.; Hirvi, J.T.; Kasa, S.; Schatz, T.; Pakkanen, T.A. Molecular dynamics study of montmorillonite crystalline swelling: Roles of interlayer cation species and water content. Chem. Phys. 2015, 455, 23–31. [Google Scholar] [CrossRef]
- Teich-McGoldrick, S.L.; Greathouse, J.A.; Jove-Colon, C.F.; Cygan, R.T. Swelling properties of montmorillonite and beidellite clay minerals from molecular simulation: Comparison of temperature, interlayer cation, and charge location effects. J. Phys. Chem. C. 2015, 119, 20880–20891. [Google Scholar] [CrossRef]
- Katti, D.R.; Srinivasamurthy, L.; Katti, K.S. Molecular modeling of initiation of interlayer swelling in Na–montmorillonite expansive clay. Can. Geotech. J. 2015, 52, 1385–1395. [Google Scholar] [CrossRef]
- Komine, H.; Ogata, N. Experimental study on swelling characteristics of sand-bentonite mixture for nuclear waste disposal. Soils Found. 1999, 39, 83–97. [Google Scholar] [CrossRef]
- Komine, H.; Ogata, N. Predicting swelling characteristics of bentonites. J. Geotech. Geoenviron. Eng. 2004, 130, 818–829. [Google Scholar] [CrossRef]
- Kaufhold, S.; Baille, W.; Schanz, T.; Dohrmann, R. About differences of swelling pressure—Dry density relations of compacted bentonites. Appl. Clay Sci. 2015, 107, 52–61. [Google Scholar] [CrossRef]
- Tsuchida, T.; Watabe, Y. Development of clayey water interception material in a coastal disposal site. In Soft Ground Engineering in Coastal Areas: Proceedings of the Nakase Memorial Symposium, Yokosuka, Japan, 28–29 November 2002; CRC Press: Boca Raton, FL, USA; p. 193.
- Dutta, J.; Mishra, A.K. Consolidation behaviour of bentonites in the presence of salt solutions. Appl. Clay Sci. 2016, 120, 61–69. [Google Scholar] [CrossRef]
- Elmashad, M.E.; Ata, A.A. Effect of seawater on consistency, infiltration rate and swelling characteristics of montmorillonite clay. HBRC J. 2016, 12, 175–180. [Google Scholar] [CrossRef]
- Tanaka, Y.; Nakamura, K. Effect of seawater and high-temperature history on swelling characteristics of bentonite. Doboku Gakkai Ronbunshu 2005, 73, 93–111. [Google Scholar] [CrossRef]
- Suzuki, S.; Prayongphan, S.; Ichikawa, Y.; Chae, B.G. In situ observations of the swelling of bentonite aggregates in NaCl solution. Appl. Clay Sci. 2005, 29, 89–98. [Google Scholar] [CrossRef]
- Jo, H.Y.; Benson, C.H.; Shackelford, C.D.; Lee, J.M.; Edil, T.B. Long-term hydraulic conductivity of a geosynthetic clay liner permeated with inorganic salt solutions. J. Geotech. Geoenviron. Eng. 2005, 131, 405–417. [Google Scholar] [CrossRef]
- Shariatmadari, N.; Salami, M.; Karimpour, F.M. Effect of inorganic salt solutions on some geotechnical properties of soil-bentonite mixtures as barriers. Int. J. Civ. Eng. 2011, 9, 103–110. [Google Scholar]
- Yu, H.; Sun, D.A.; Gao, Y. Effect of NaCl Solution on Swelling Characteristics of Bentonite with Different Diffuse Double Layers. In Applied Magnetic Resonance; Springer: Berlin, Germany, 2018; pp. 1–13. [Google Scholar]
- Karnland, O.; Muurinen, A.; Karlsson, F. Bentonite swelling pressure in NaCl solutions-Experimentally determined data and model calculations. Advances in Understanding Engineered Clay Barriers; CRC Press: Boca Raton, FL, USA, 2005; pp. 241–256. [Google Scholar]
- Rao, S.M.; Thyagaraj, T. Swell–compression behaviour of compacted clays under chemical gradients. Can. Geotech. J. 2007, 44, 520–532. [Google Scholar] [CrossRef]
- He, K.W.; Jin, X.L.; Gao, Y.G. Application of salt resistance bentonite waterproof blanket to underground railway project in Shenzhen. New Build. Mater. 2008, 35, 53–56. [Google Scholar]
- Hu, Z.; Zhu, J.; Hong, L.; Shi, H.; Ding, Y.; Cui, Y. Inflation Performance Study of Polymer Modified Bentonite in Salt Water. J. Mod. Agric. 2015, 4, 1–6. [Google Scholar]
- De Camillis, M.; Di Emidio, G.; Bezuijen, A.; Verástegui-Flores, R.D. Hydraulic conductivity and swelling ability of a polymer modified bentonite subjected to wet–dry cycles in seawater. Geotext. Geomembr. 2016, 44, 739–747. [Google Scholar] [CrossRef]
- Di Emidio, G. Hydraulic and Chemico-Osmotic Performance of Polymer Treated Clays. Ph.D. Thesis, Ghent University, Ghent, Belgium.
- Guler, E.; Ozhan, H.O.; Karaoglu, S. Hydraulic performance of anionic polymer-treated bentonite-granular soil mixtures. Appl. Clay Sci. 2018, 157, 139–147. [Google Scholar] [CrossRef]
- Liu, Y.; Gates, W.P.; Bouazza, A. Improvement on the Performance of Geosynthetic Clay Liners Using Polymer Modified Bentonite. Geotech. Eng. 2012, 43, 43–45. [Google Scholar]
- Casas, J.A.; Mohedano, A.F.; García-Ochoa, F. Viscosity of guar gum and xanthan/guar gum mixture solutions. J. Sci. Food Agric. 2000, 80, 1722–1727. [Google Scholar] [CrossRef]
- Parija, S.; Misra, M.; Mohanty, A.K. Studies of natural gum adhesive extracts: An overview. J. Macromol. Sci. Part C Polym. Rev. 2001, 41, 175–197. [Google Scholar] [CrossRef]
- American Society for Testing and Materials International. ASTM D2487-17: Standard Practice for Classification of Soils for Engineering Purposes (Unified Soil Classification System); American Society for Testing and Materials International: West Conshohocken, PA, USA, 2017. [Google Scholar]
- American Society for Testing and Materials International. ASTM D854-14: Standard Test Methods for Specific Gravity of Soil Solids by Water Pycnometer; American Society for Testing and Materials International: West Conshohocken, PA, USA, 2014. [Google Scholar]
- American Society for Testing and Materials International. ASTM D4318-17: Standard Test Methods for Liquid Limit, Plastic Limit, and Plasticity Index of Soils; American Society for Testing and Materials International: West Conshohocken, PA, USA, 2017. [Google Scholar]
- American Society for Testing and Materials International. ASTM D1141-98. Standard Practice for the Preparation of Substitute Ocean Water; American Society for Testing and Materials International: West Conshohocken, PA, USA, 2008. [Google Scholar]
- American Society for Testing and Materials International. ASTM D1557-12. Standard Test Methods for Laboratory Compaction Characteristics of Soil Using Modified Effort; American Society for Testing and Materials International: West Conshohocken, PA, USA, 2012. [Google Scholar]
- American Society for Testing and Materials International. ASTM D5856-15. Standard Test Method for Measurement of Hydraulic Conductivity of Porous Material Using a Rigid-Wall, Compaction-Mold Permeameter; American Society for Testing and Materials International: West Conshohocken, PA, USA, 2007. [Google Scholar]
- Zhu, C.M.; Ye, W.M.; Chen, Y.G.; Chen, B.; Cui, Y.J. Influence of salt solutions on the swelling pressure and hydraulic conductivity of compacted GMZ01 bentonite. Eng. Geol. 2013, 166, 74–80. [Google Scholar] [CrossRef]
- Ye, W.M.; Zhu, C.M.; Chen, Y.G.; Chen, B.; Cui, Y.J.; Wang, J. Influence of salt solutions on the swelling behavior of the compacted GMZ01 bentonite. Environ. Earth Sci. 2015, 74, 793–802. [Google Scholar] [CrossRef]
- Gao, Z.R.; Chen, T.; Xu, Y.F. Effect of salt solution on swelling characteristics of bentonite. Rock Soil Mech. 2018, 39, 249–253. [Google Scholar]
- Sun, Z.M.; Yu, J.; Zheng, S.L.; Bai, C.H. Effect of Salt in Aqueous Solution on the Swelling and Water-retention Capacity of Bentonite. Adv. Mater. Res. 2011, 194, 2039–2045. [Google Scholar] [CrossRef]
- Mishra, A.K.; Dutta, J.; Chingtham, R. A study on the behavior of the compacted bentonite in the presence of salt solutions. Int. J. Geotech. Eng. 2015, 9, 354–362. [Google Scholar] [CrossRef]
- Sivapullaiah, P.V.; Sridharan, A.; Stalin, V.K. Swelling behaviour of soil bentonite mixtures. Can. Geotech. J. 1996, 33, 808–814. [Google Scholar] [CrossRef]
- Komine, H.; Ogata, N. New equations for swelling characteristics of bentonite-based buffer materials. Can. Geotech. J. 2003, 40, 460–475. [Google Scholar] [CrossRef]
- Tripathy, S.; Bag, R.; Thomas, H.R. Effects of post-compaction residual lateral stress and electrolyte concentration on swelling pressures of a compacted bentonite. Geotech. Geol. Eng. 2014, 32, 749–763. [Google Scholar] [CrossRef]
- Baille, W.; Tripathy, S.; Schanz, T. Swelling pressures and one-dimensional compressibility behaviour of bentonite at large pressures. Appl. Clay Sci. 2010, 48, 324–333. [Google Scholar] [CrossRef]
- Herbert, H.J.; Kasbohm, J.; Sprenger, H.; Fernández, A.M.; Reichelt, C. Swelling pressures of MX-80 bentonite in solutions of different ionic strength. Phys. Chem. Earth Parts A/B/C 2008, 33, S327–S342. [Google Scholar] [CrossRef]
- Villar, M.V.; Lloret, A. Influence of dry density and water content on the swelling of a compacted bentonite. Appl. Clay Sci. 2008, 39, 38–49. [Google Scholar] [CrossRef]
- Komine, H.; Yasuhara, K.; Murakami, S. Swelling characteristics of bentonites in artificial seawater. Can. Geotech. J. 2009, 46, 177–189. [Google Scholar] [CrossRef]


| Physical Properties | NB | MB |
|---|---|---|
| Specific gravity | 2.7 | 2.65 |
| Liquid limit (%) | 397 | 344.2 |
| Plastic index (%) | 360 | 313 |
| Unified Soil Classification System | CH | CH |
| Percentage passing the sieve No. 200 | 100% | 100% |
| Specific surface area (m2/g) | 40–50 | 50–60 |
| Cation exchange capacity (meq/100 g) | 100–130 | 100–130 |
| Compounds | NB (%) | MB (%) |
|---|---|---|
| SiO2 | 61.30 | 56.39 |
| MgO | 1.64 | 3.55 |
| Al2O3 | 14.62 | 12.62 |
| Na2O | 2.54 | 2.43 |
| K2O | 0.28 | 0.27 |
| Fe2O3 | 3.8 | 3.47 |
| TiO2 | 0.52 | 0.52 |
| MnO | 0.07 | 0.07 |
| CaO | 4.13 | 7.34 |
| P2O5 | 0.01 | 0.01 |
| L.O.I | 11.09 | 13.33 |
| Total | 100 | 100 |
| Moisture (%) | Ash (%) | Protein (%) | Crude Fiber (%) | Galactomannan (%) |
|---|---|---|---|---|
| 10 | 0.66 | 3.10 | 1.9 | 84.34 |
| Compounds | Artificial Sea Water (g/L) | Natural Sea Water (g/L) |
|---|---|---|
| NaCl | 24.5 | 24.32 |
| MgCl2 | 5.2 | 5.12 |
| Na2SO4 | 4.1 | 4.09 |
| CaCl2 | 1.2 | 1.11 |
| KCl | 0 | 0.162 |
| NaHCO3 | 0 | 0.081 |
| KBr | 0 | 0.063 |
| H3BO3 | 0 | 0.026 |
| SrCl2 | 0 | 0.025 |
| NaF | 0 | 0.003 |
| Vertical Load (kPa) | a | b |
|---|---|---|
| 25 | 204.8 | 228.8 |
| 50 | 174.8 | 199.3 |
| 100 | 155.6 | 182.7 |
| 150 | 144.7 | 175.5 |
| 200 | 144.4 | 187.8 |
| 300 | 143.1 | 177.2 |
| 400 | 133.9 | 178.6 |
| Initial Dry Density (g/cm3) | a | b |
|---|---|---|
| 1.25 | 0.0023 | 0.00025 |
| 1.40 | 0.0024 | 0.00047 |
| 1.55 | 0.0048 | 0.00093 |
| 1.75 | 0.0077 | 0.00418 |
| 1.85 | 0.0106 | 0.00509 |
© 2018 by the authors. Licensee MDPI, Basel, Switzerland. This article is an open access article distributed under the terms and conditions of the Creative Commons Attribution (CC BY) license (http://creativecommons.org/licenses/by/4.0/).
Share and Cite
Xu, X.; Liu, X.; Oh, M.; Park, J. Swelling Capacity and Hydraulic Conductivity of Polymer-Modified Bentonite under Saline Water Conditions. Appl. Sci. 2018, 8, 1025. https://doi.org/10.3390/app8071025
Xu X, Liu X, Oh M, Park J. Swelling Capacity and Hydraulic Conductivity of Polymer-Modified Bentonite under Saline Water Conditions. Applied Sciences. 2018; 8(7):1025. https://doi.org/10.3390/app8071025
Chicago/Turabian StyleXu, Xin, Xiaofeng Liu, Myounghak Oh, and Junboum Park. 2018. "Swelling Capacity and Hydraulic Conductivity of Polymer-Modified Bentonite under Saline Water Conditions" Applied Sciences 8, no. 7: 1025. https://doi.org/10.3390/app8071025
APA StyleXu, X., Liu, X., Oh, M., & Park, J. (2018). Swelling Capacity and Hydraulic Conductivity of Polymer-Modified Bentonite under Saline Water Conditions. Applied Sciences, 8(7), 1025. https://doi.org/10.3390/app8071025