Article

A Mercury Intrusion Porosimetry Method for Methane Diffusivity and Permeability Evaluation in Coals: A Comparative Analysis

1
School of Energy Resources, China University of Geosciences, Beijing 100083, China
2
Coal Reservoir Laboratory of National Engineering Research Center of CBM Development & Utilization, China University of Geosciences, Beijing 100083, China
3
School of Engineering, Fraser Noble Building, King’s College, University of Aberdeen, Aberdeen AB24 3UE, UK
*
Author to whom correspondence should be addressed.
Appl. Sci. 2018, 8(6), 860; https://doi.org/10.3390/app8060860
Submission received: 28 April 2018 / Revised: 22 May 2018 / Accepted: 23 May 2018 / Published: 24 May 2018
(This article belongs to the Special Issue Nanotech for Oil and Gas)

Abstract

:
Mercury intrusion porosimetry (MIP) has been utilized for decades to obtain the pore size, pore volume and pore structure of variable porous media including inorganic rocks and organic rock (e.g., shales and coals). Diffusivity and permeability are the two crucial parameters that control gas transport in coals. The main purpose of this work is to derive the CH4 effective gas diffusivity and permeability in different rank coals with vitrinite reflectance of 0.46–2.79% Ro,m by MIP. Furthermore, regular CH4 diffusivity and permeability measurements are conducted to compare with the results of the derived CH4 diffusivity and permeability with MIP data. In this work, CH4 diffusivity and permeability of different rank coals are acquired with established equations, which are basically in accordance with the experimental values. However, the coal rank (maximum vitrinitere flectance, Ro,m) exhibits no significant relation to the effective diffusion coefficient (De) and gas diffusivity (D′). The cementation factor (m values) varies from 2.03 to 2.46, which tends to exhibit a semi-consolidated structure for coals compared with other rocks (e.g., dolomite, limestone, sandstone and red brick). The results show that the cementation factor could be an important factor for gas flow in coals. The correlation of CH4 diffusivity to porosity and permeability of 12 coal samples were explored, and it appears that CH4 diffusivity exhibits an increasing trend with an increase of permeability, and two different exponential relationships respectively exist in diffusivity versus porosity and permeability versus porosity. Therefore, this study could be conducive to gas sequestration or gas production during enhanced coalbed methane (CBM) recovery.

1. Introduction

Darcy flow is the dominant flow in conventional gas reservoirs. However, in some unconventional gas reservoirs (e.g., tight sands and particularly in coals) where pore-throat radii as small as a few micro-nanometers are common, diffusion plays an important role and should be taken into account [1]. The common Darcy equation cannot fully capture the physics of flow in the micro-nanopore structure of coalbed methane (CBM) reservoirs. For CBM reservoirs, the viscous effects and other flow phenomenon such as diffusion and slippage effects should be considered. Therefore, a more rigorous approach is needed to accommodate submicron effects in micro-nanopores of some low-permeability CBM reservoirs.
Gas near solid surface has a tendency to slip. Diffusion is one of the key processes controlling gas transport in porous media [2]. Diffusion may dominate gas transport when seepage velocity is ~0.005 m per year [3]. Knudsen diffusion of gas molecules and their collision with solid walls is one of the most fundamental studies in unconventional gas reservoirs [4] For coals, previous studies indicate that gas diffusion correlated well with coal type and coal rank due to the meso and macropore quantity [5,6,7,8]. However, in two coals with the same particle size and coal rank but different maceral composition, the previous research indicates that the coal with high inertinites shows a fast diffusivity [9,10,11,12,13]. For gas diffusivity, the determination methods may include the particle method, the steady state method and the inverse diffusion method [14,15,16]. The effective diffusivity strongly depends on pore size when the average pore size is less than 1 μm [17,18,19]. The effect of gas slippage in porous media can improve permeability [20,21]. In general, Klinkenberg’s effect becomes important when the mean free path of gas molecules is comparable to the pore-throat radius. Normally, Klinkenberg’s effect increases in fine-grained, low-permeability porous media [22]. The effect of gas slippage is even more pronounced for rarefied gas flow where the Knudsen number is much higher (Kn > 10). When the molecular mean free path is within two orders of magnitude of pore-throat diameter (0.1 < Kn < 1), gas molecules tend to slip on the pore surface. Consequently, permeability to gas results in higher values compared with permeability to liquid for a given porous medium including coals and shales. Many techniques can be used to measure the diffusivity and permeability in coals [14,15,16,20,21,22]. However, some scholars proposed some theoretical models to evaluate the diffusivity and permeability in porous media from the perspective of pore structure in coals. The scanning electron microscope (SEM), low-temperature N2 adsorption/desorption, mercury intrusion porosimetry (MIP), and nuclear magnetic resonance (NMR) techniques can be adopted to acquire the info of pore structure. In addition, then the effective diffusion coefficient and absolute permeability can be evaluated with the info of pore structure from these methods [23,24,25].
Mercury intrusion porosimetry (MIP) is a widely used technique for determining pore structure in porous materials including conventional and unconventional reservoirs (e.g., tight sand, shales and coals) [26,27,28,29]. Application of the MIP method to coals has been established for a long time as a routine way to assess the pore information including pore volume, porosity and pore size distribution. In this work, the info of pore structures for different rank coals was acquired by MIP data first. The theoretical models for effective gas diffusion coefficients and permeability in coals were derived. In addition, then the regular CH4 diffusivity and permeability measurements are conducted to compare with the results of the derived CH4 diffusivity and permeability with MIP data. Finally, the relationships among gas diffusivity and permeability were evaluated with the info of pore structures.

2. Coal Samples and Experiments

2.1. Samples Selection and Basic Coal Analyses

The twelve block coal samples with different coal ranks (0.46% to 2.79% Ro,m) were obtained from the active mining areas of the eastern Junggar Basin, eastern Ordos basin and southern Qinshui basin (Table 1). There were four low-rank coals (HDG 6#, BLG 6#, HYC 4#, LHJ 4#), four medium-rank coals (LL-HJG 5#, LL-DP 10#, LL-SL 5#, LL-XM 5#) and four high-rank coals (TY-DY 6#, GJ-DQ 4#, YQ-WK 15#, YQ-YK 15#). The basic coal analysis includes petrographic, proximate analyses and the maximum vitrinite reflectance (Ro,m) of the coal samples were conducted. The maceral compositions (500 testing points) were acquired by using a Laborlxe 12 POL microscope with the MPS 60 photo system on polished surfaces. In addition, the proximate analysis was operated using a GF-6000 full-automatic proximate analyzer manufactured by Preiser Scientific, USA, with a particle size of <0.2 mm based on the ISO 17246-2010 test standard as previous research.

2.2. MIP Experiment

MIP is one of the effective tools that can obtain pore info over such a broad range from 0.003 μm to 360 μm based on cylindrical capillary model. Compared with traditional methods (the particle method, the steady state method and the inverse diffusion method), determination of gas diffusivity with the pore info obtained through MIP is time saving (<2 h) and cost-effective. Mercury will invade pores with applied external pressure. Assuming the pores are composed of a variety of cylindrical pores, the Washburn equation [30] can be used to obtain the pore radius as shown in Equation (1):
Δ P = 2 γ c o s θ R
where ΔP denotes is the pressure (dynes/cm2); γ is the surface tension, set to be 485 (dynes/cm); θ is the wetting contact angle (°), set to be 130° [31]; and R is the capillary radius (cm) at the corresponding pressure.
Before the MIP test, the samples were oven-dried for at least 48 h at 105 °C; after that we cooled them to room temperature (22.5 °C) in a desiccator. Then, MIP tests were operated following the standard process of SY/T 5346-2005 and conducted by using PoreMaster GT60 (Quantachrome, Boynton Beach, FL, USA). The measurements can run up to a pressure of 206 MPa. After MIP tests, mercury intrusion-extrusion curves can be obtained, and then pore info including porosity, cumulative mercury injection volume, average pore size (da) and median pore size (d50) could be inferred.

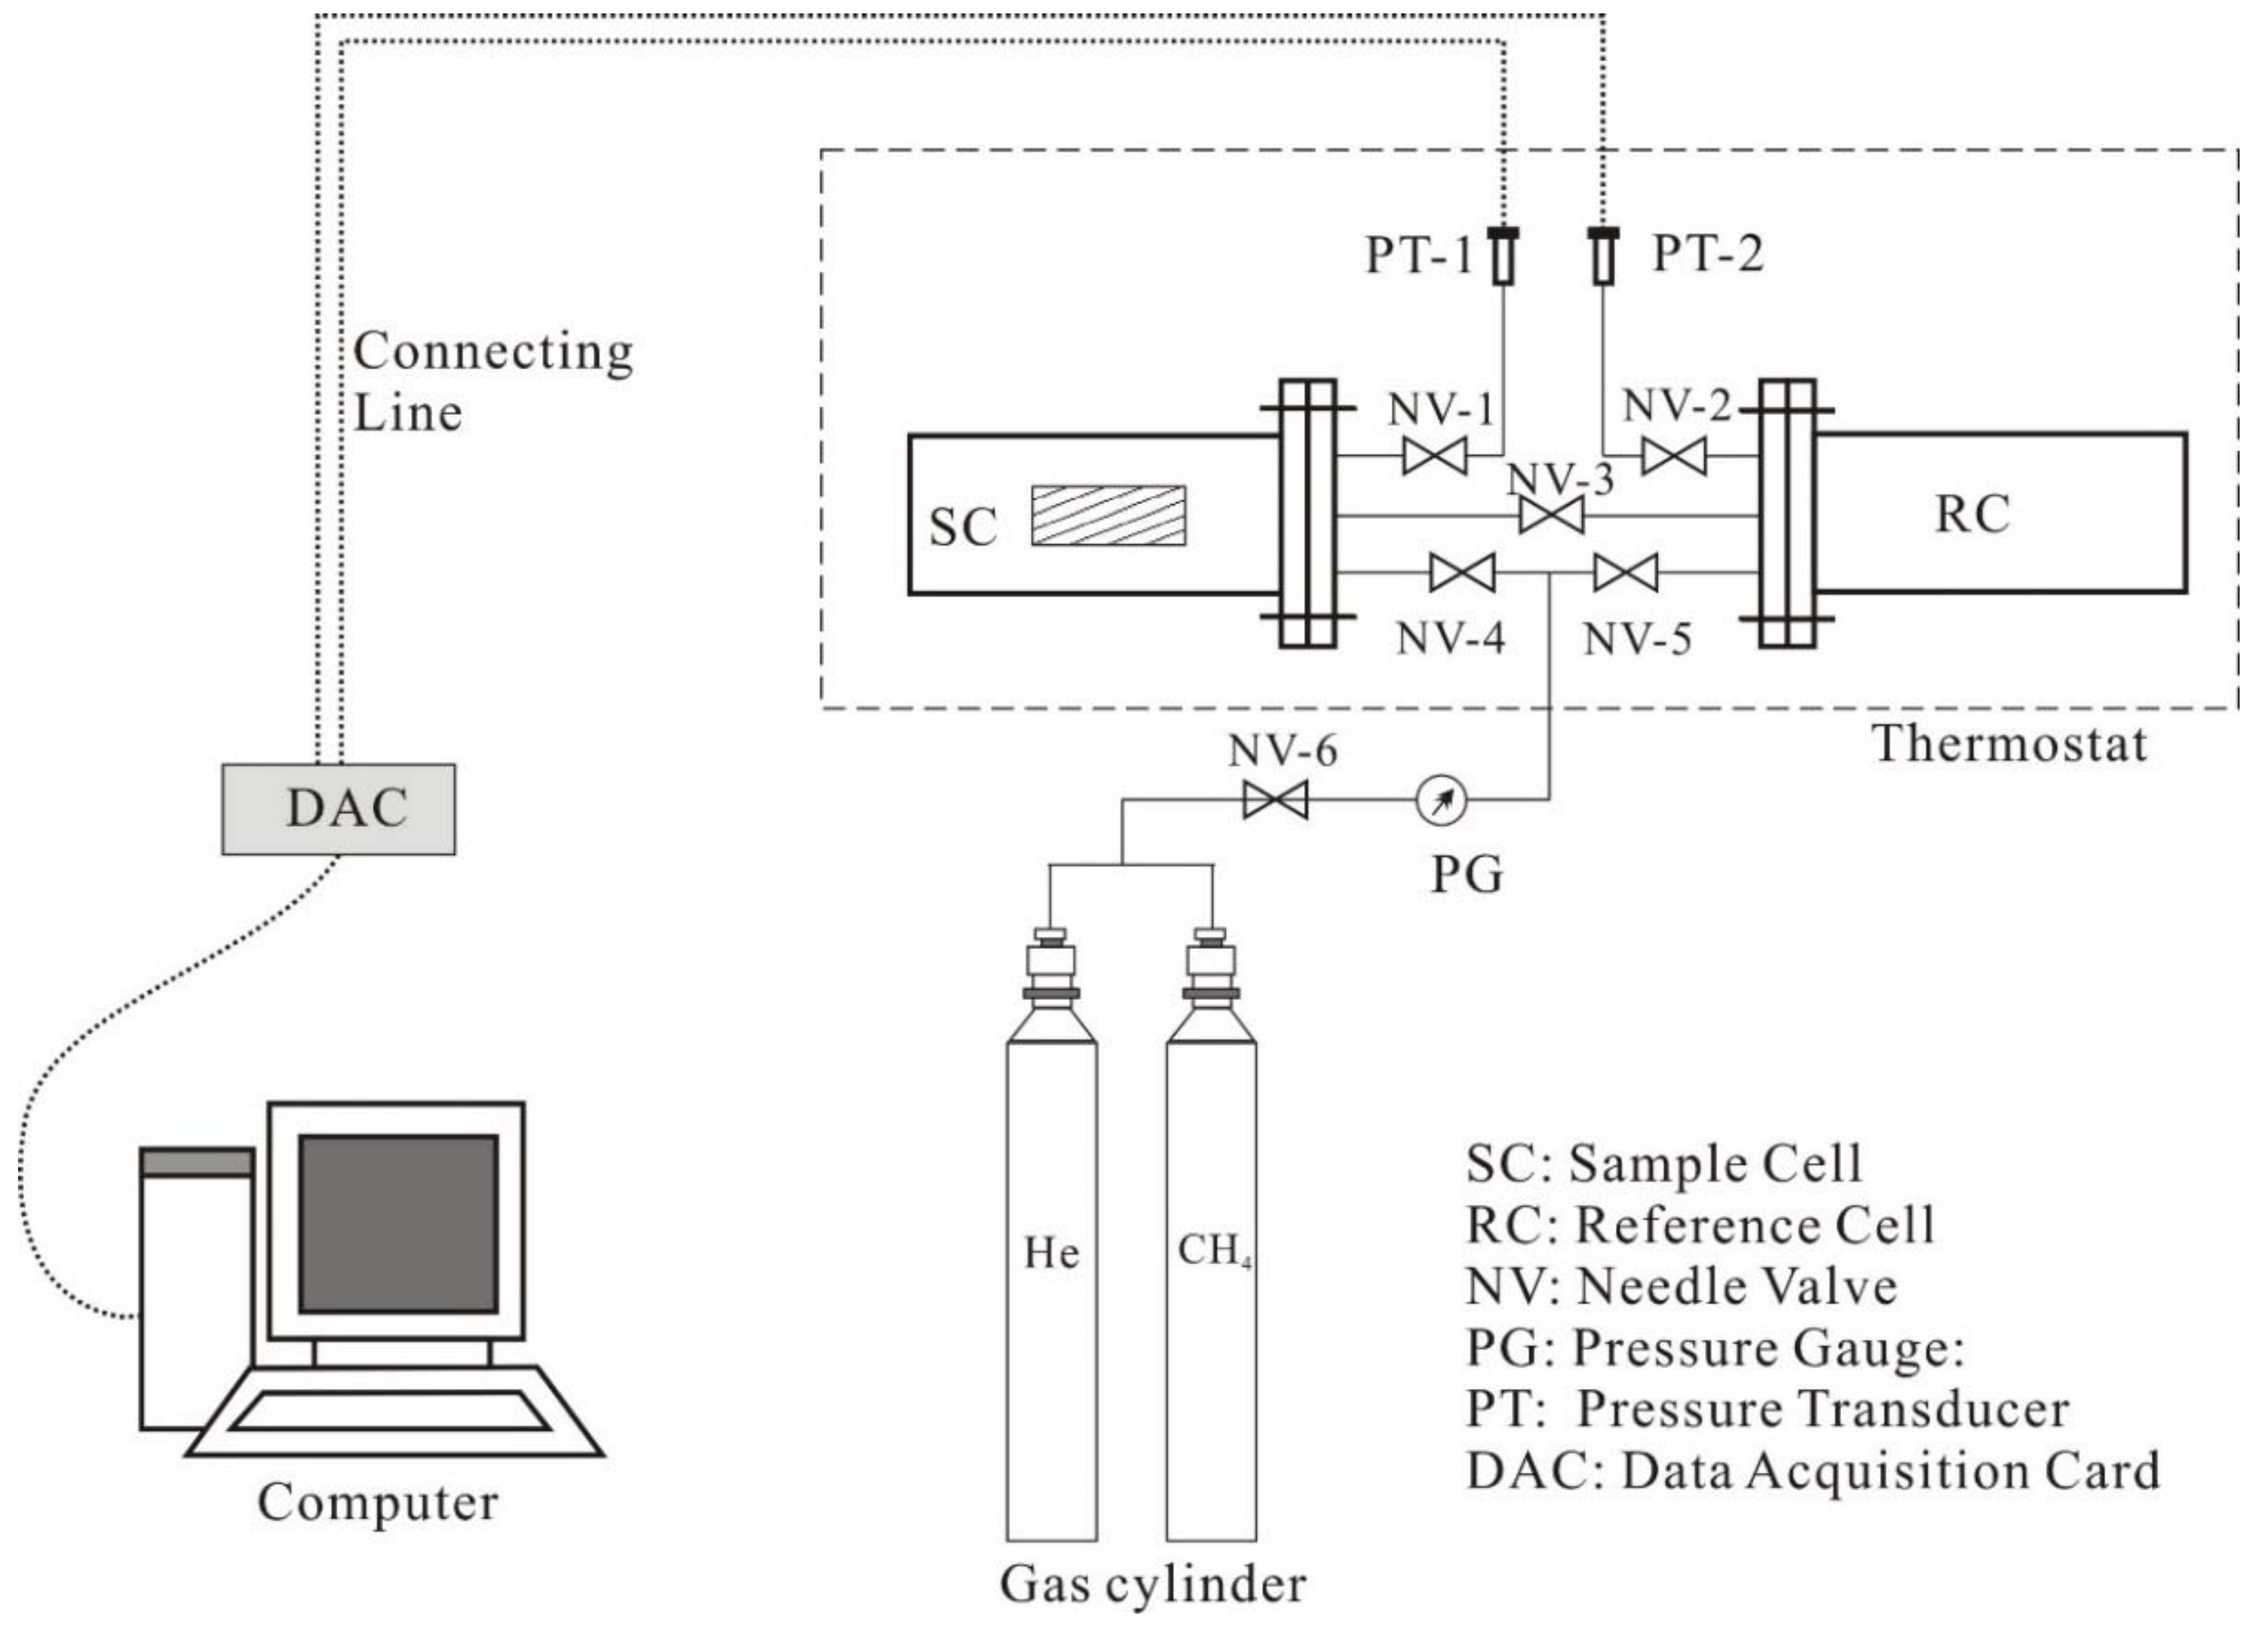
2.3. CH4 Diffusivity Measurement

The CH4 diffusivity measurement is based on the volumetric method [32], which was carried out as shown in Figure 1. The experimental device consists of the seal diffusion chamber, the thermostat, the gas source (CH4 and He) and the data collecting system. The seal diffusion chamber includes sample cell (SC) and reference cell (RC) with high-precision pressure transducer. The thermostat, with an accuracy of ±0.1 °C, is used to keep the seal diffusion chamber at the stated temperature of 30 °C.
Before the adsorption and diffusion experiments, all coal samples were ground to 60–80 mesh (0.18–0.25 mm) and were dried at 105 °C for 24 h. Then 40 g coal samples are weighed and put into sample cells immediately. The adsorption and diffusion measurements were kept at a temperature of 30 °C. The procedures are as follows: first, the empty volume of the sample cell and reference cell were measured by a volume expansion method using helium (He) gas. Second, the volume of the coal matrix should be determined by the volume expansion method using helium. Both above steps should be repeated three times. Third, measurements were performed by injecting CH4 with increasing pressures, and the pressure of the seal diffusion chamber at each time interval was recorded. Finally, the CH4 effective diffusion coefficient can be evaluated with the unipore diffusion model [33]:
M t M = 1 6 π 2 n = 1 1 n 2 e x p ( D n 2 π 2 t r p 2 )
where Mt corresponds to the total mass of gas adsorbed (kg/m3) at time t (s), M is the total amount of gas adsorbed (kg/m3) at indefinite time, D is the effective diffusivity (m2/s), rp is the diffusion path length (m). After a step change in surface concentration, this relationship may be written for the case of gas desorbing from coal particles as:
V t V = 1 6 π 2 n = 1 1 n 2 e x p ( D n 2 π 2 t r p 2 )
where Vt corresponds to the total volume of gas desorbed (cm3) at time t (s); and V is the total adsorbed or desorbed volume (cm3).
For the very small values of time (t < 600 s), we can obtain the relationship among adsorption rate data, the effective diffusivity De (m2/s) and time t (s) [16].
V t V = 6 ( D e t π )
The effective gas diffusion coefficient (De) is defined as the ratio of the gas diffusion coefficient (D) to the square of the diffusion path length rp: D e = D / r p 2 .

2.4. Permeability Measurement

Air permeability, a routine core analysis method, was measured using helium (He) gas according to the Chinese Oil and Gas Industry Standard SY/T 5336-1996. All samples were cut to a cylindrical core (2.5 cm in diameter, length >2.5 cm) parallel to the bedding plane [34]. The air permeability can be calculated as follows:
k = 2 Q 0 μ L P 0 A ( P 1 2 P 2 2 )
where k corresponds to air permeability (m2); Q0 is volumetric rate of flow at reference pressure (m3/s); μ is air viscosity (Pa·s); L is length of coal sample (m); P0 is reference pressure (Pa); A is cross-section area of core sample (m2); P1 is upstream air pressure (Pa); P2 is downstream air pressure (Pa).

3. The Derivation of CH4 Diffusivity and Permeability by MIP

3.1. CH4 Diffusivity

Gas diffusion in coal can be described as Fick’s diffusion [35], which can be expressed as:
F g = D e C x
where Fg denotes the diffusive gas flux in the porous medium [M·L−2·T−1]; De denotes the effective gas diffusion coefficient [L2·T−1]; C is gas concentration in the pore [M·L−3]; and x is distance [L].
Gas diffusivity (D′) is defined as the ratio of the effective gas diffusion coefficient (De) to the gas diffusion coefficient in air (Da), which can be expressed as an exponential function of porosity (analogous to Archie’s law) [36]:
D e D a = D = φ a m
where φa is gas measured porosity and m is cementation factor. In this work, the cylindrical shape for coal pores is assumed that the cylindrical diffusion paths prevail in the coals. The effective diffusion coefficient is expressed as [24,37,38,39]:
D e = φ a τ D
where De is effective diffusion coefficient (m2/s), D is the gas diffusion coefficient (m2/s); τ denotes the tortuosity factor [38]:
τ = 0.223 1.13 φ a
(applicable for 0.05 ≤ φa ≤ 0.95).
Then, the Bosanquet relation was introduced to get gas diffusion coefficient [40]:
1 D = 1 D a + 1 D K A
Here D is gas diffusion coefficient [L2·T−1], Da is gas diffusion coefficient in air [L2·T−1] and DKA is Knudsen diffusion coefficient [L2·T−1]. For Da, combined/effective diffusion coefficient of CH4 in binary gases (CH4 and Air) can be estimated from the Fuller theory [41],
D a = 0.0101 T 1.75 1 M C H 4 + 1 M A i r P [ ( v C H 4 ) 1 / 3 + ( v A i r ) 1 / 3 ] 2
where T is absolute temperature (K); M C H 4 is molecular weight of CH4 (g/mol); M A i r is molecular weight of Air (g/mol); P denotes the pressure of CH4 (Pa); v C H 4 and v A i r respectively represent molecular diffusion volume of CH4 and Air (cm3/mol).
And we can obtain the Knudsen diffusion coefficient (DKA) with the parameter of the temperature (T), molecular weight of gas (MCH4) and average pore size (da) of the porous medium, according to the following equation [23,42,43]:
D K A = 48.5 d a T M
T is temperature (K); M is gas weight (g/mol); and da is average pore diameter (m) from MIP:
d a = 4 V A × 10 6
V is total intrusion volume (mL/g); A is total pore area (m2/g).

3.2. Permeability

The relationships between absolute permeability and porosity, pore size were acquired based on MIP data with percolation theory [23,24]:
k = 1 89 ( L m a x ) 2 ( L m a x L c ) φ S ( L m a x )
Here k is absolute permeability (Darcy); Lc is pore size; Lmax is the value of the pore size with the maximum hydraulic conductance; φ is porosity and S(Lmax) is the fraction of total porosity φ filled at Lmax. To acquire this characteristic length (pore size) Lc from the mercury porosimetry, pressure is determined at the inflection point in the rapidly rising range of the cumulative mercury intrusion as previous research [2,23,24].
Before the MIP measurements, permeability with He and effective diffusion coefficients have been measured. The experimental CH4 diffusion by using unipore diffusion model and the theoretical calculated effective diffusion coefficients (De) of the same coal samples will be compared. The important parameters including effective diffusion coefficient (De), diffusivity (D′) and cementation factor (m values) by Equation (3) are presented in Table 2.

4. Results and Discussion

4.1. Repeatability of MIP Tests

Normally, a repeatability test on the same sample should be carried out as previously tested. Because the samples remain contaminated with mercury after the MIP test, a regular repeatability should not be available for MIP tests. However, three representative samples from the same coal were chosen to evaluate the repeatability of MIP. HDG 6#, LL-DP 10#, YQ-WK 15# were selected for triplicate MIP tests and the remaining 8 samples were tested only once. Table 3 shows the results of the repeatability tests.

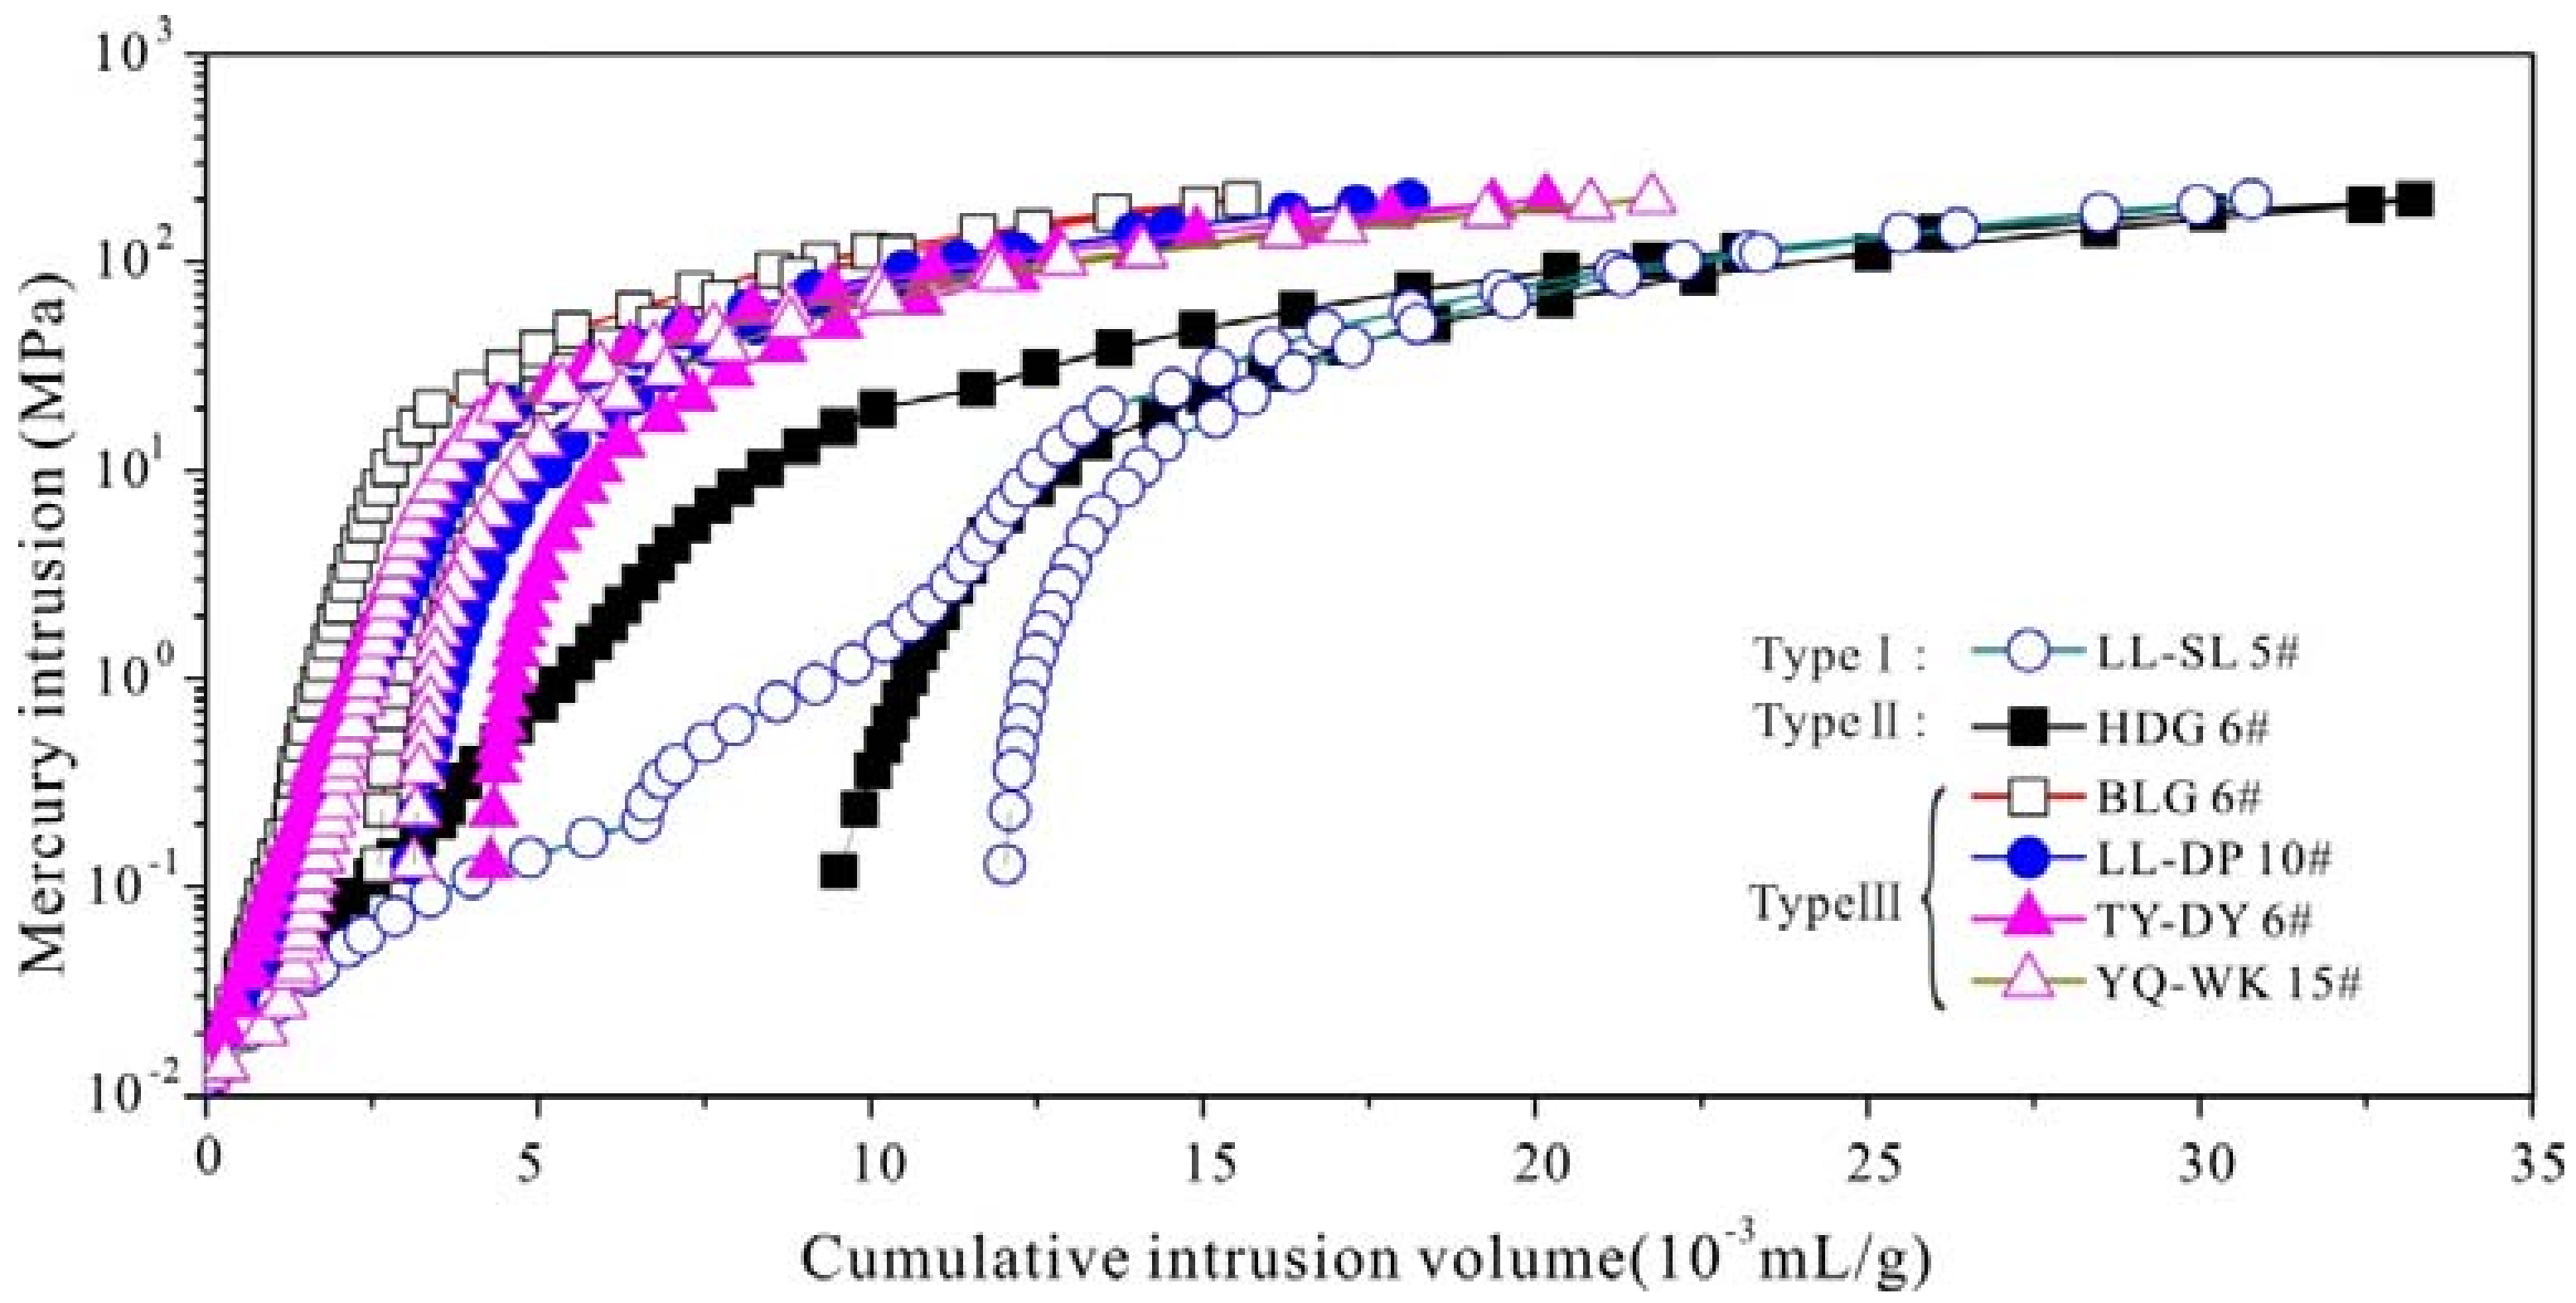
4.2. Coal Basic Information and MIP Results

The twelve coal samples with different coal ranks varied from lignites to anthracites with Ro,m 0.46% to 2.79%. The maceral composition of the coals was dominated by vitrinite and variable exinite content. In addition, the coals have moistures of 0.57–8.63%, ash yields of 5.38–38.08%, volatiles of 3.5–48.97% and fixed carbon of 25.36–75.05% respectively, as shown in Table 1. Six coal samples with different coal ranks were selected for mercury porosimetry, the mercury intrusion curves are showed in Figure 2. The average pore diameter of the selected coals has LL-SL5# (26.12) > YQ-WK15# (15.22) > HDG6# (13.80) > TY-DY6# (11.32) > LL-DP 10# (10.25) > BLG6# (8.70) as listed in Table 2. The cumulative intrusion curves can be divided into three types: Type I, for instance LL-SL5#, has small threshold pressure, high cumulative intrusion volume and low mercury withdrawal rate. The mercury intrusion curve can be divided into three sections: the curve increases steadily until the cumulative intrusion volume reaches 35% when the pressure is under 1 MPa; Curve slope increases suddenly and the rate of mercury intrusion slows down significantly when the pressure is higher than 1 MPa; Then, the curve verge to horizontality little by little when the pressure is higher than 10 MPa. The mercury withdrawal curve can be divided into two sections: the curve is similar to horizontality when the pressure is higher than 10 MPa; The slope become larger and the curve is similar to vertical when the pressure is under 10 MPa. Type I reflects that macropore and micropore predominate the pores, which means that strong heterogeneity existed. Type II, for instance HDG6#, has high threshold pressure, high cumulative intrusion volume and low mercury withdrawal rate. The mercury intrusion and withdrawal curves are stable and no inflection exists. Type II reflects that the even-distributed pore structure. Type III, that includes BLG6#, LL-DP 10#, TY-DY6# and YQ-WK15#, has high threshold pressure, low cumulative intrusion volume and high mercury withdrawal rate. Type III reflects that micropore dominates the pores.

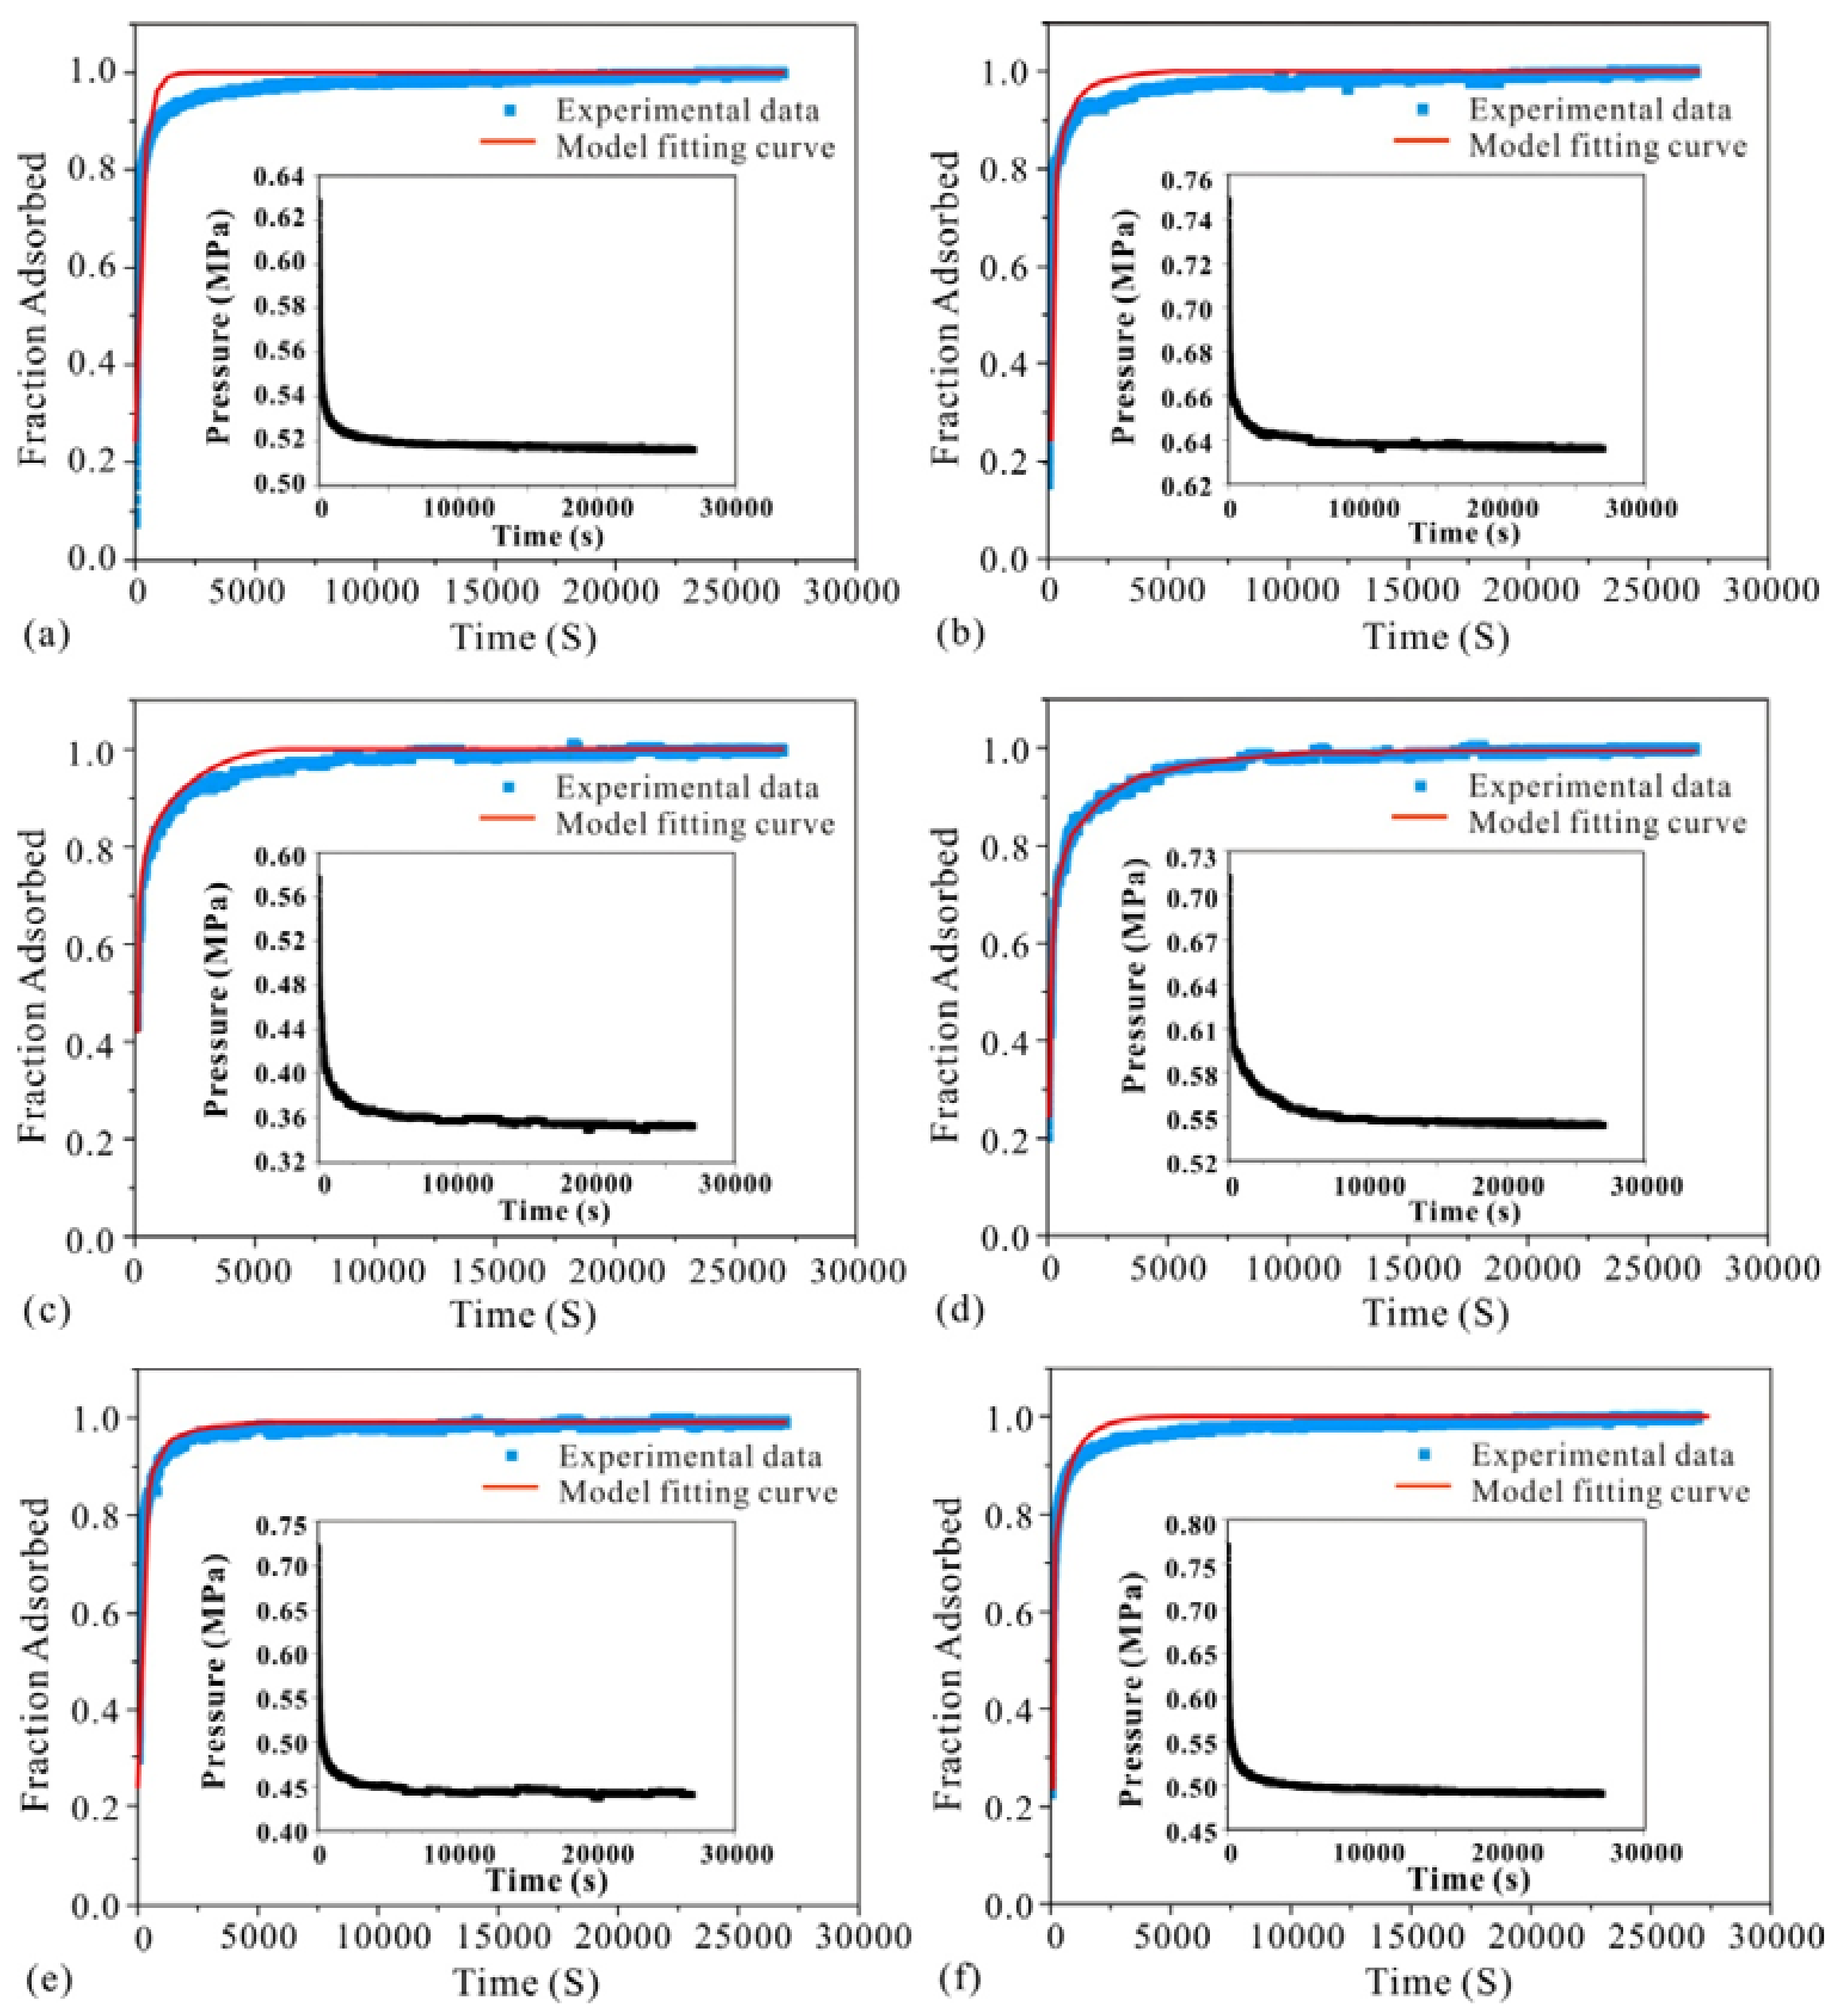
4.3. CH4 Diffusivity and Permeability by Measurements and MIP Data

The air permeability data using helium gas of 12 samples is listed in Table 4. The permeability most samples are in the range of 0.1–1.6 mD except HDG 6# (3.68 mD), YQ-YK 15# (4.02 mD) and GJ-DQ 4# (0.012 mD). High-pressure CH4 diffuse rate data on all 12 coal samples has been modeled using the unipore diffusion model (Equation (3)). As shown in Table 4. The magnitude of CH4 effective diffusion coefficient (De) is 10−8–10−7, and the correlation coefficients are in the range of 0.79–0.98. The raw pressure vs. time of methane diffuse on coals (a: HDG 6#; b: HYC 4#; c: LL-HJG 5#; d: LL-DP 10#; e: GJ-DQ 4#; f: YQ-WK) are shown in Figure 3. The diagrams show that the pressure decreases rapidly within the initial 1000 s and then the diffusion process approaches the equilibrium state gradually. According to Figure 3, the unipore model correlates well with the experimental curve for CH4 adsorption of various rank coals. Samples c (LL-HJG 5#) and d (LL-DP 10#) have smaller slopes than that of the others, which means more time is needed to reach the equilibrium state.
Figure 4 demonstrates the comparison of results from the theoretical calculation and experimental approach by CH4 diffusion, which shows that effective diffusion coefficient acquired by these two approaches is consistent except for sample LL-SL 5# (da = 26.12). The results of these two approaches for most samples are distributed equally near the straight line, which may support the validity of the theoretical method to determine the effective diffusion coefficient by MIP data. However, the effective diffusion coefficient calculated in this work is slightly higher than the experimental result by CH4 diffusion. This phenomenon may be due to the CH4 adsorption occurring in coal when a diffusion experiment wascarried out. The surface adsorption layer makes CH4 diffusion lag, while De calculated in this work without considering the gas adsorption phenomenon [32,44]. Therefore, a higher effective diffusion coefficient was acquired. For permeability, the theoretical calculation and experimental permeability by CH4 are distributed equally near the straight line with the slope equal to 1. This result means that the validity of the theoretical derivation method of determining coal permeability by mercury porosimetry data is reliable.

4.4. Insights into the Relationships among Coal Porosity, Gas Diffusivity and Permeability

In this section, the gas diffusivity and permeability data are obtained from experimental measurement. Figure 5 shows that the Ro,m exhibits no significant relationship with effective diffusion coefficient (De) and permeability [45]. However, there is a subtle exponential relationship with coefficient of determination (R2) of 0.41 between permeability and diffusivity as shown in Figure 6. Although no exact function of permeability and diffusivity exists, it indeed demonstrates an increasing gas diffusivity trend with the increase of permeability. Coefficient of determination (R2) can be calculated as follows:
R 2 = S S R S S T = S S T S S E S S T = 1 S S E S S T = 1 i = 1 n ( y i y ^ i ) 2 i = 1 n ( y i y ¯ ) 2
where y ^ i is the predicted value of y i ; y ¯ is the mean value of y; SSE is the sum of squares due to error:
SSE = i = 1 n ( y i y ^ i ) 2
SSR is the sum of squares of the regression:
SSR = i = 1 n ( y ^ i y ¯ ) 2
SST is the total sum of squares:
SST = i = 1 n ( y i y ¯ ) 2
From the above equation, if using a good fitting model, R2 should vary between 0 and 1. A value closes to 1 indicates that the fit is good.
Figure 7 shows the relationship of D′ and porosity constructed for the different rank coals and five other rocks. A distinct power function relationship exists between D′ and porosity for coals and other rocks. The cementation factor (m values) can be deduced by Equation (3). All twelve coals show relatively high m values (from 2.03 to 2.46), which tends to exhibit a larger m value for coals compared with other rocks. The results can be divided into two groups according to the different m values. The other rocks group includes dolomite, limestone, Indiana sandstone, Berea sandstone and red brick have the m value of 1.5, while for the different rank coals, the cementation factor is 2.3 due to the nature of organic rocks [2].
The coals exhibit an organized behavior and display an exponential relationship between D′ and average pore diameter (da) as shown in Figure 8. For the group of coals with m = 2.3, the relationship is expressed as follows with the coefficient of determination (R2) of 0.78:
D = 0.00028 d a 1.217
where D′ denotes diffusivity (dimensionless) and da is the average pore diameter in μm. For the group of other rocks with m = 1.5, the relationship can be summarized as follows with the coefficient of determination (R2) of 0.87:
D = 0.00453 d a 0.422
The complicated pore structure of coals makes it difficult to make further conclusions. The relationship for permeability versus porosity of twelve coals with different ranks and five other rocks were plotted in Figure 9. The relationship between permeability and porosity has been well established by previous research [46,47,48]. In this study, the results show two different exponential relationships for these two group rocks with different m values. For the group of coals with m = 2.3, the relationship between permeability and porosity can be summarized as follows with the coefficient of determination (R2) of 0.77:
k = 583.8 φ a 2.95
where k is permeability in μm2 and φa is air-filled porosity. This study may provide a new perspective on the fluid flow evaluation of unconventional reservoirs with the classic mercury porosimetry technique.

5. Conclusions

The effective diffusion coefficients and permeability of different rank coals were theoretically deduced with the data from mercury porosimetry. Besides, we have explored the correlation of CH4 diffusivity to porosity and permeability of different rank coals. The conclusions are made as follows:
(1)
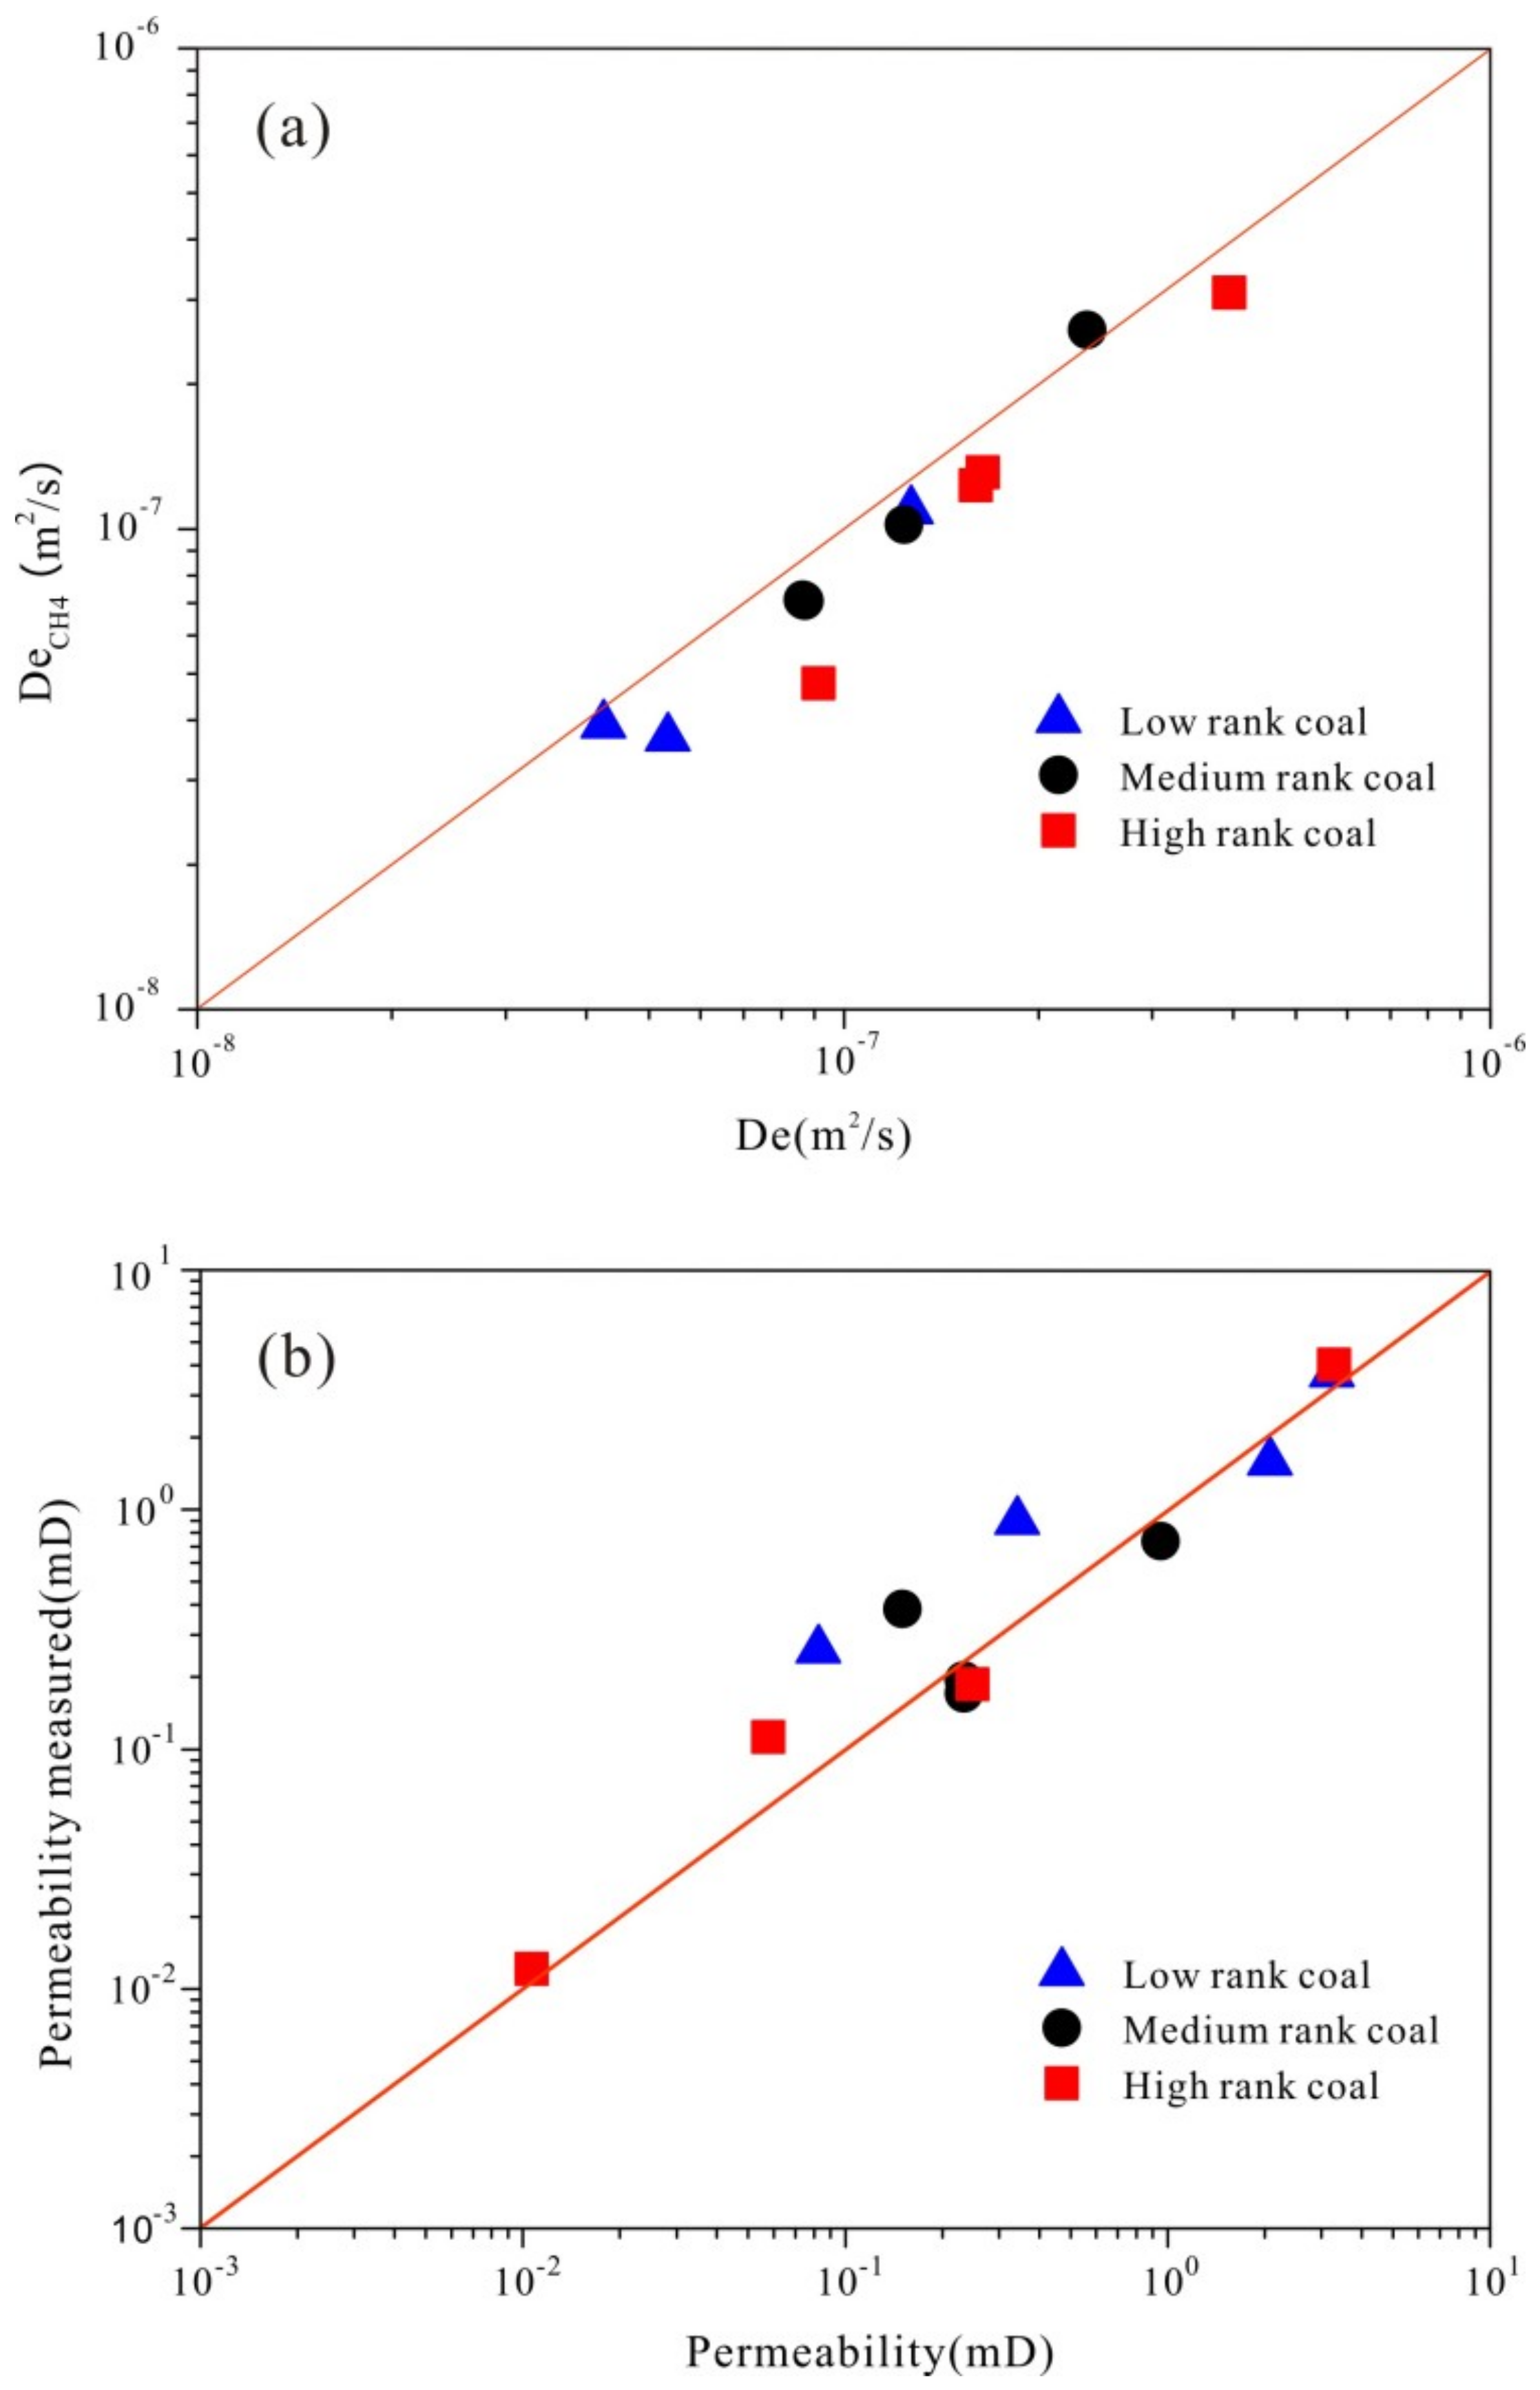
The calculated effective diffusion coefficient (De) is slightly higher than measured results due to the existence of CH4 adsorption in pore surface. The theoretically deduced permeability (k) is similar to the experimental result. This supports the validity of the derivation method of determining effective diffusion coefficient and permeability by mercury porosimetry.
(2)
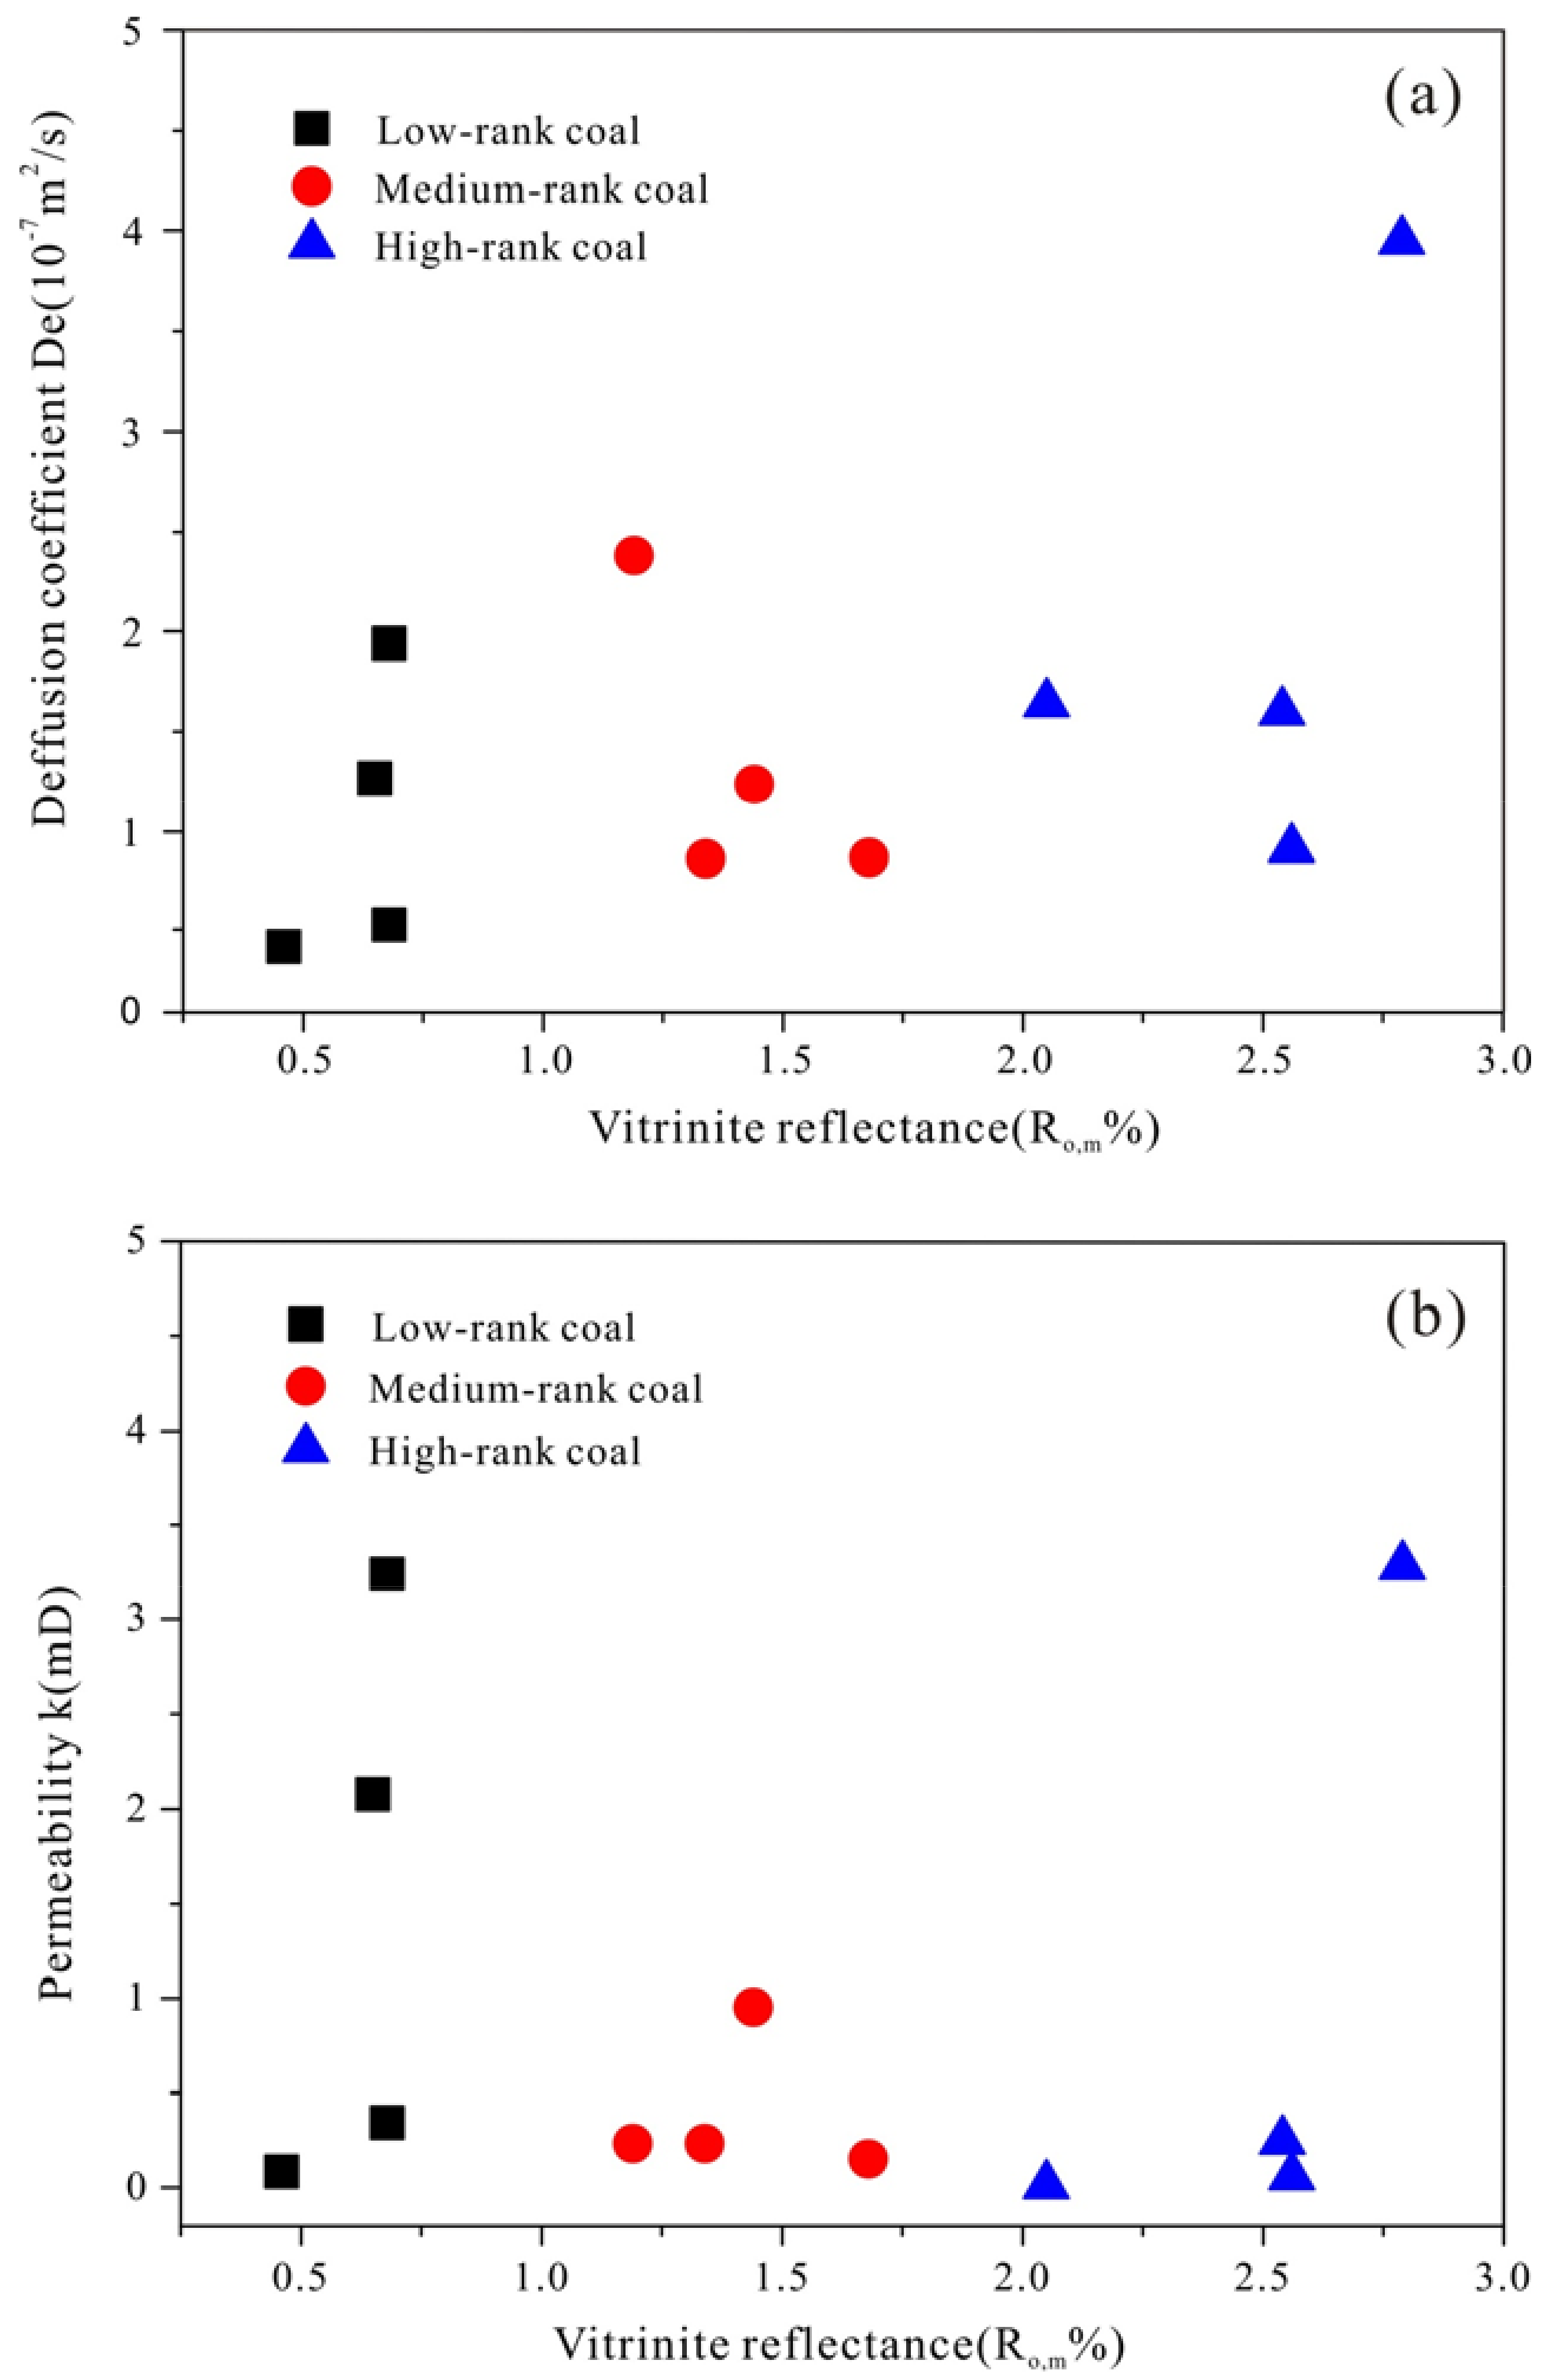
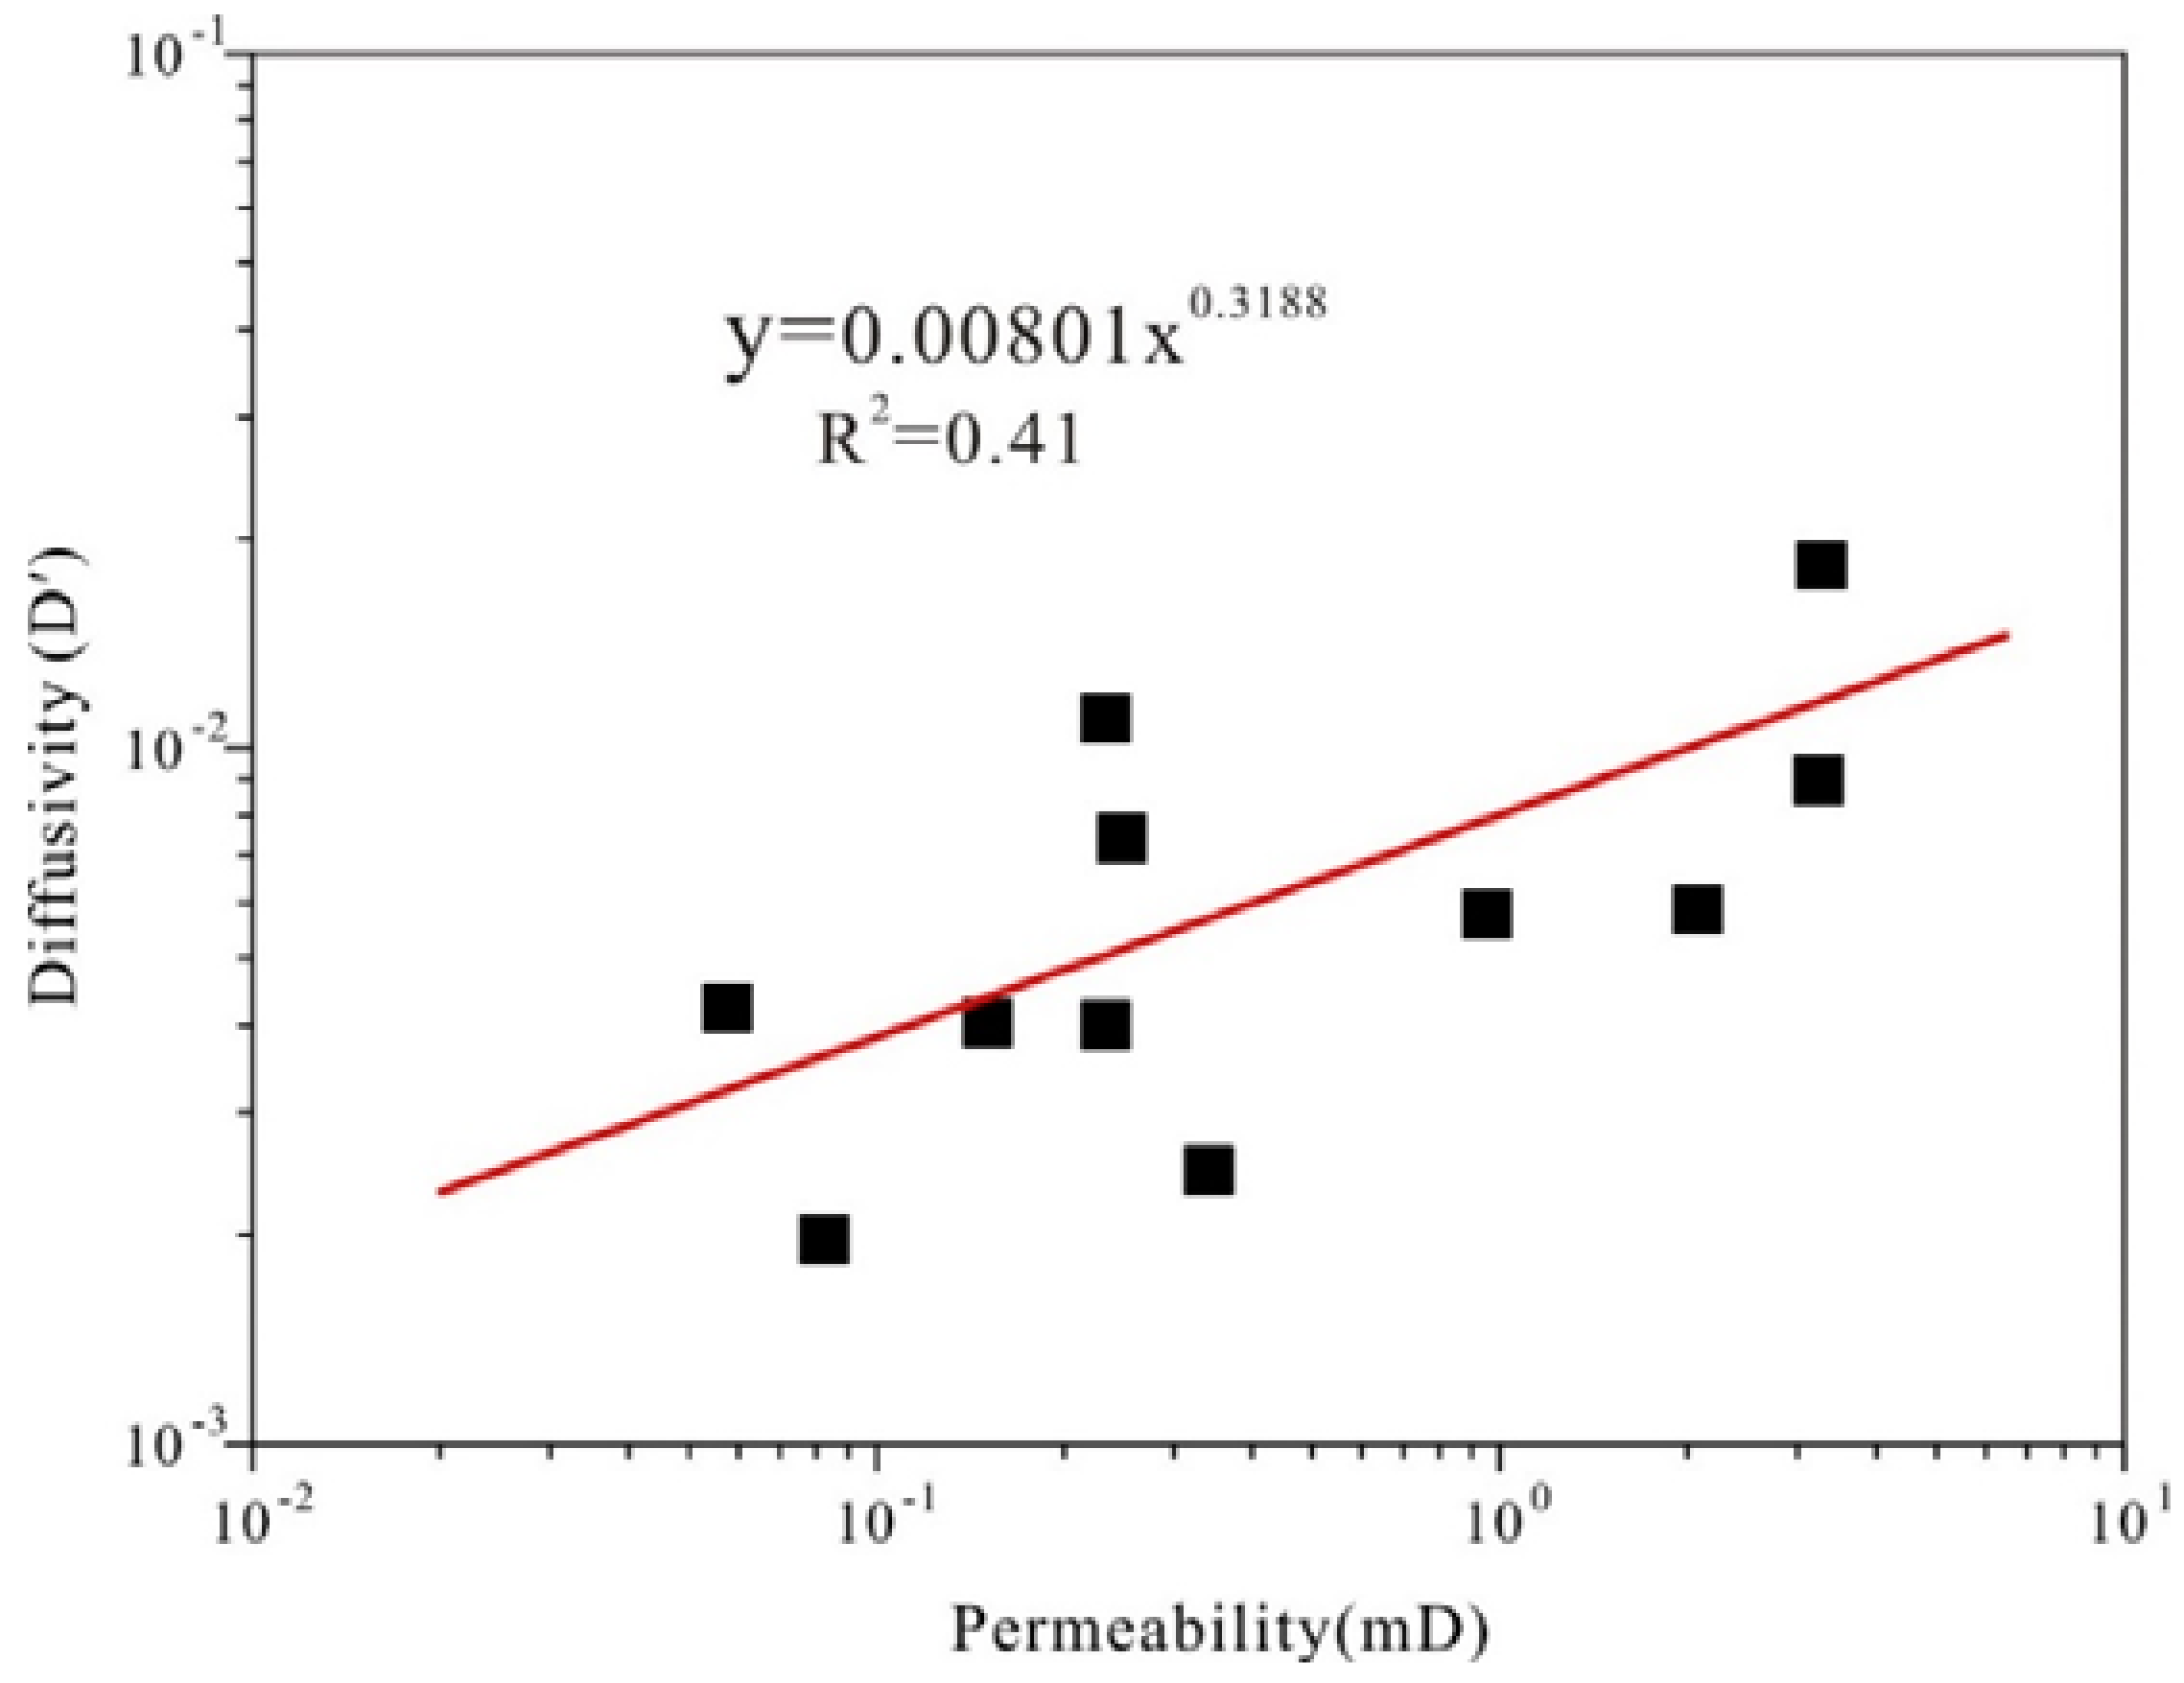
The coal composition and the maximum vitrinitere flectance (Ro,m) exhibits no significant correlation with effective diffusion coefficient (De) and gas diffusivity (D′) due to the limited coal samples. However, diffusivity, permeability and porosity present an obviously positive correlation.
(3)
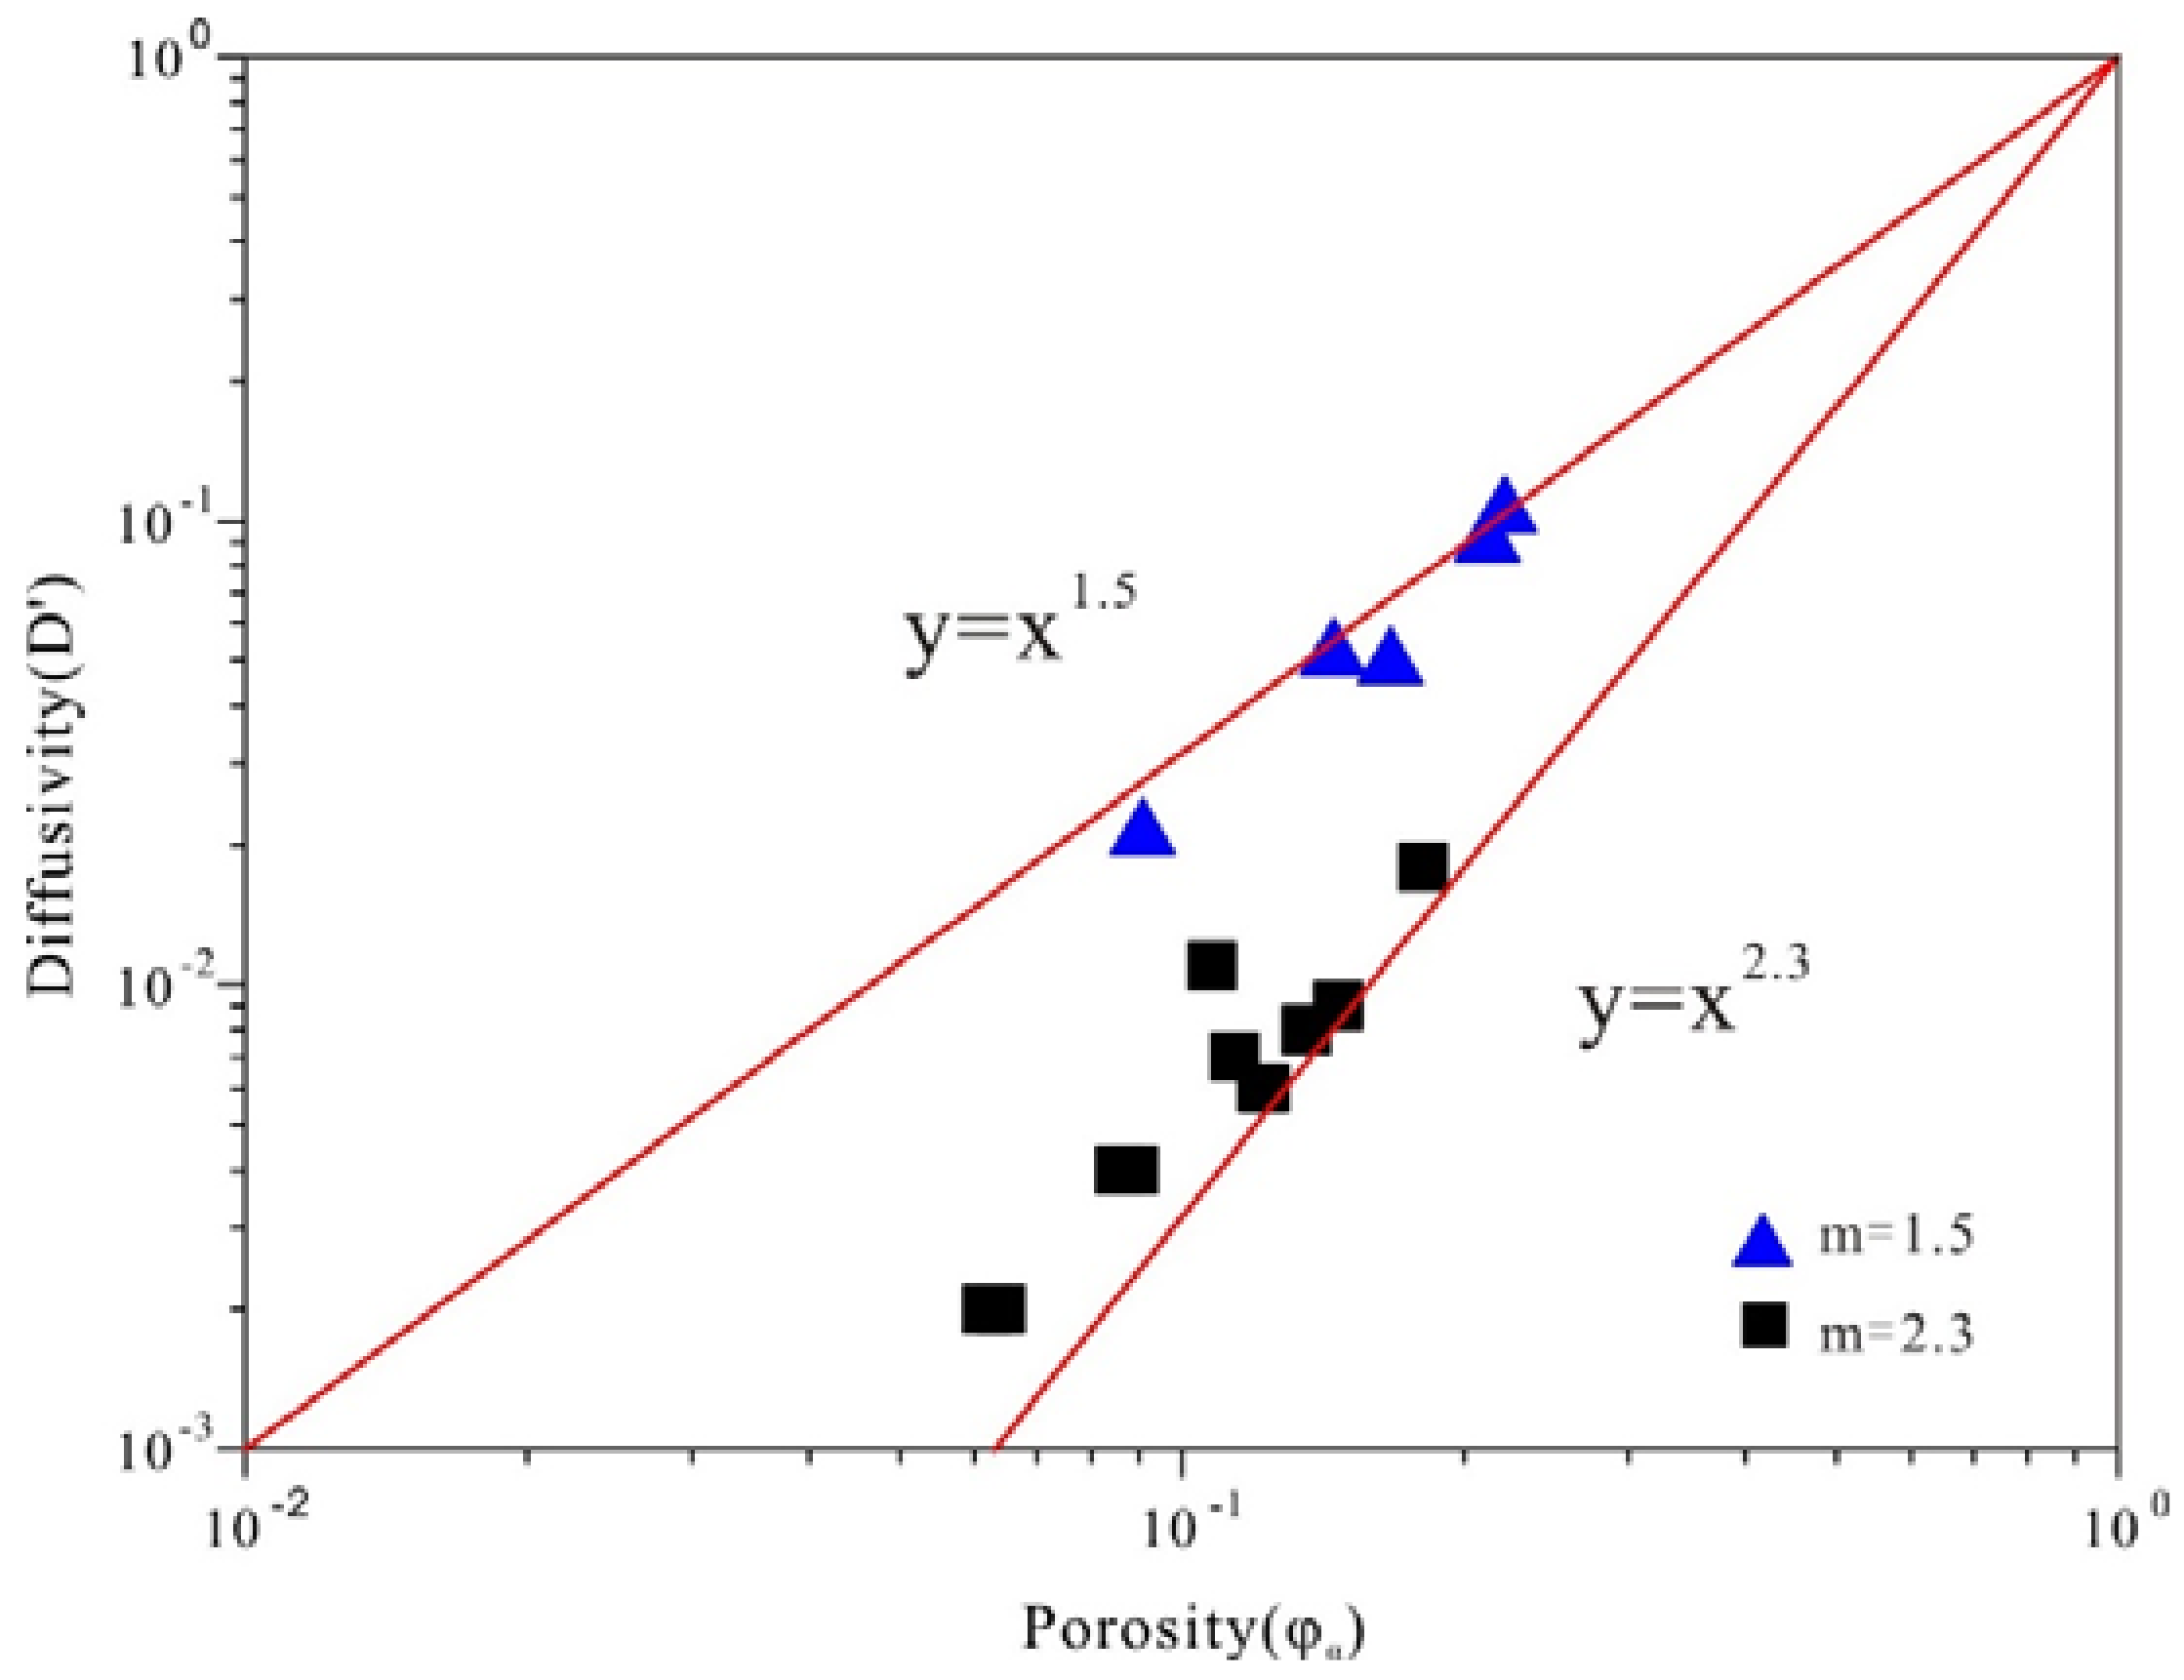
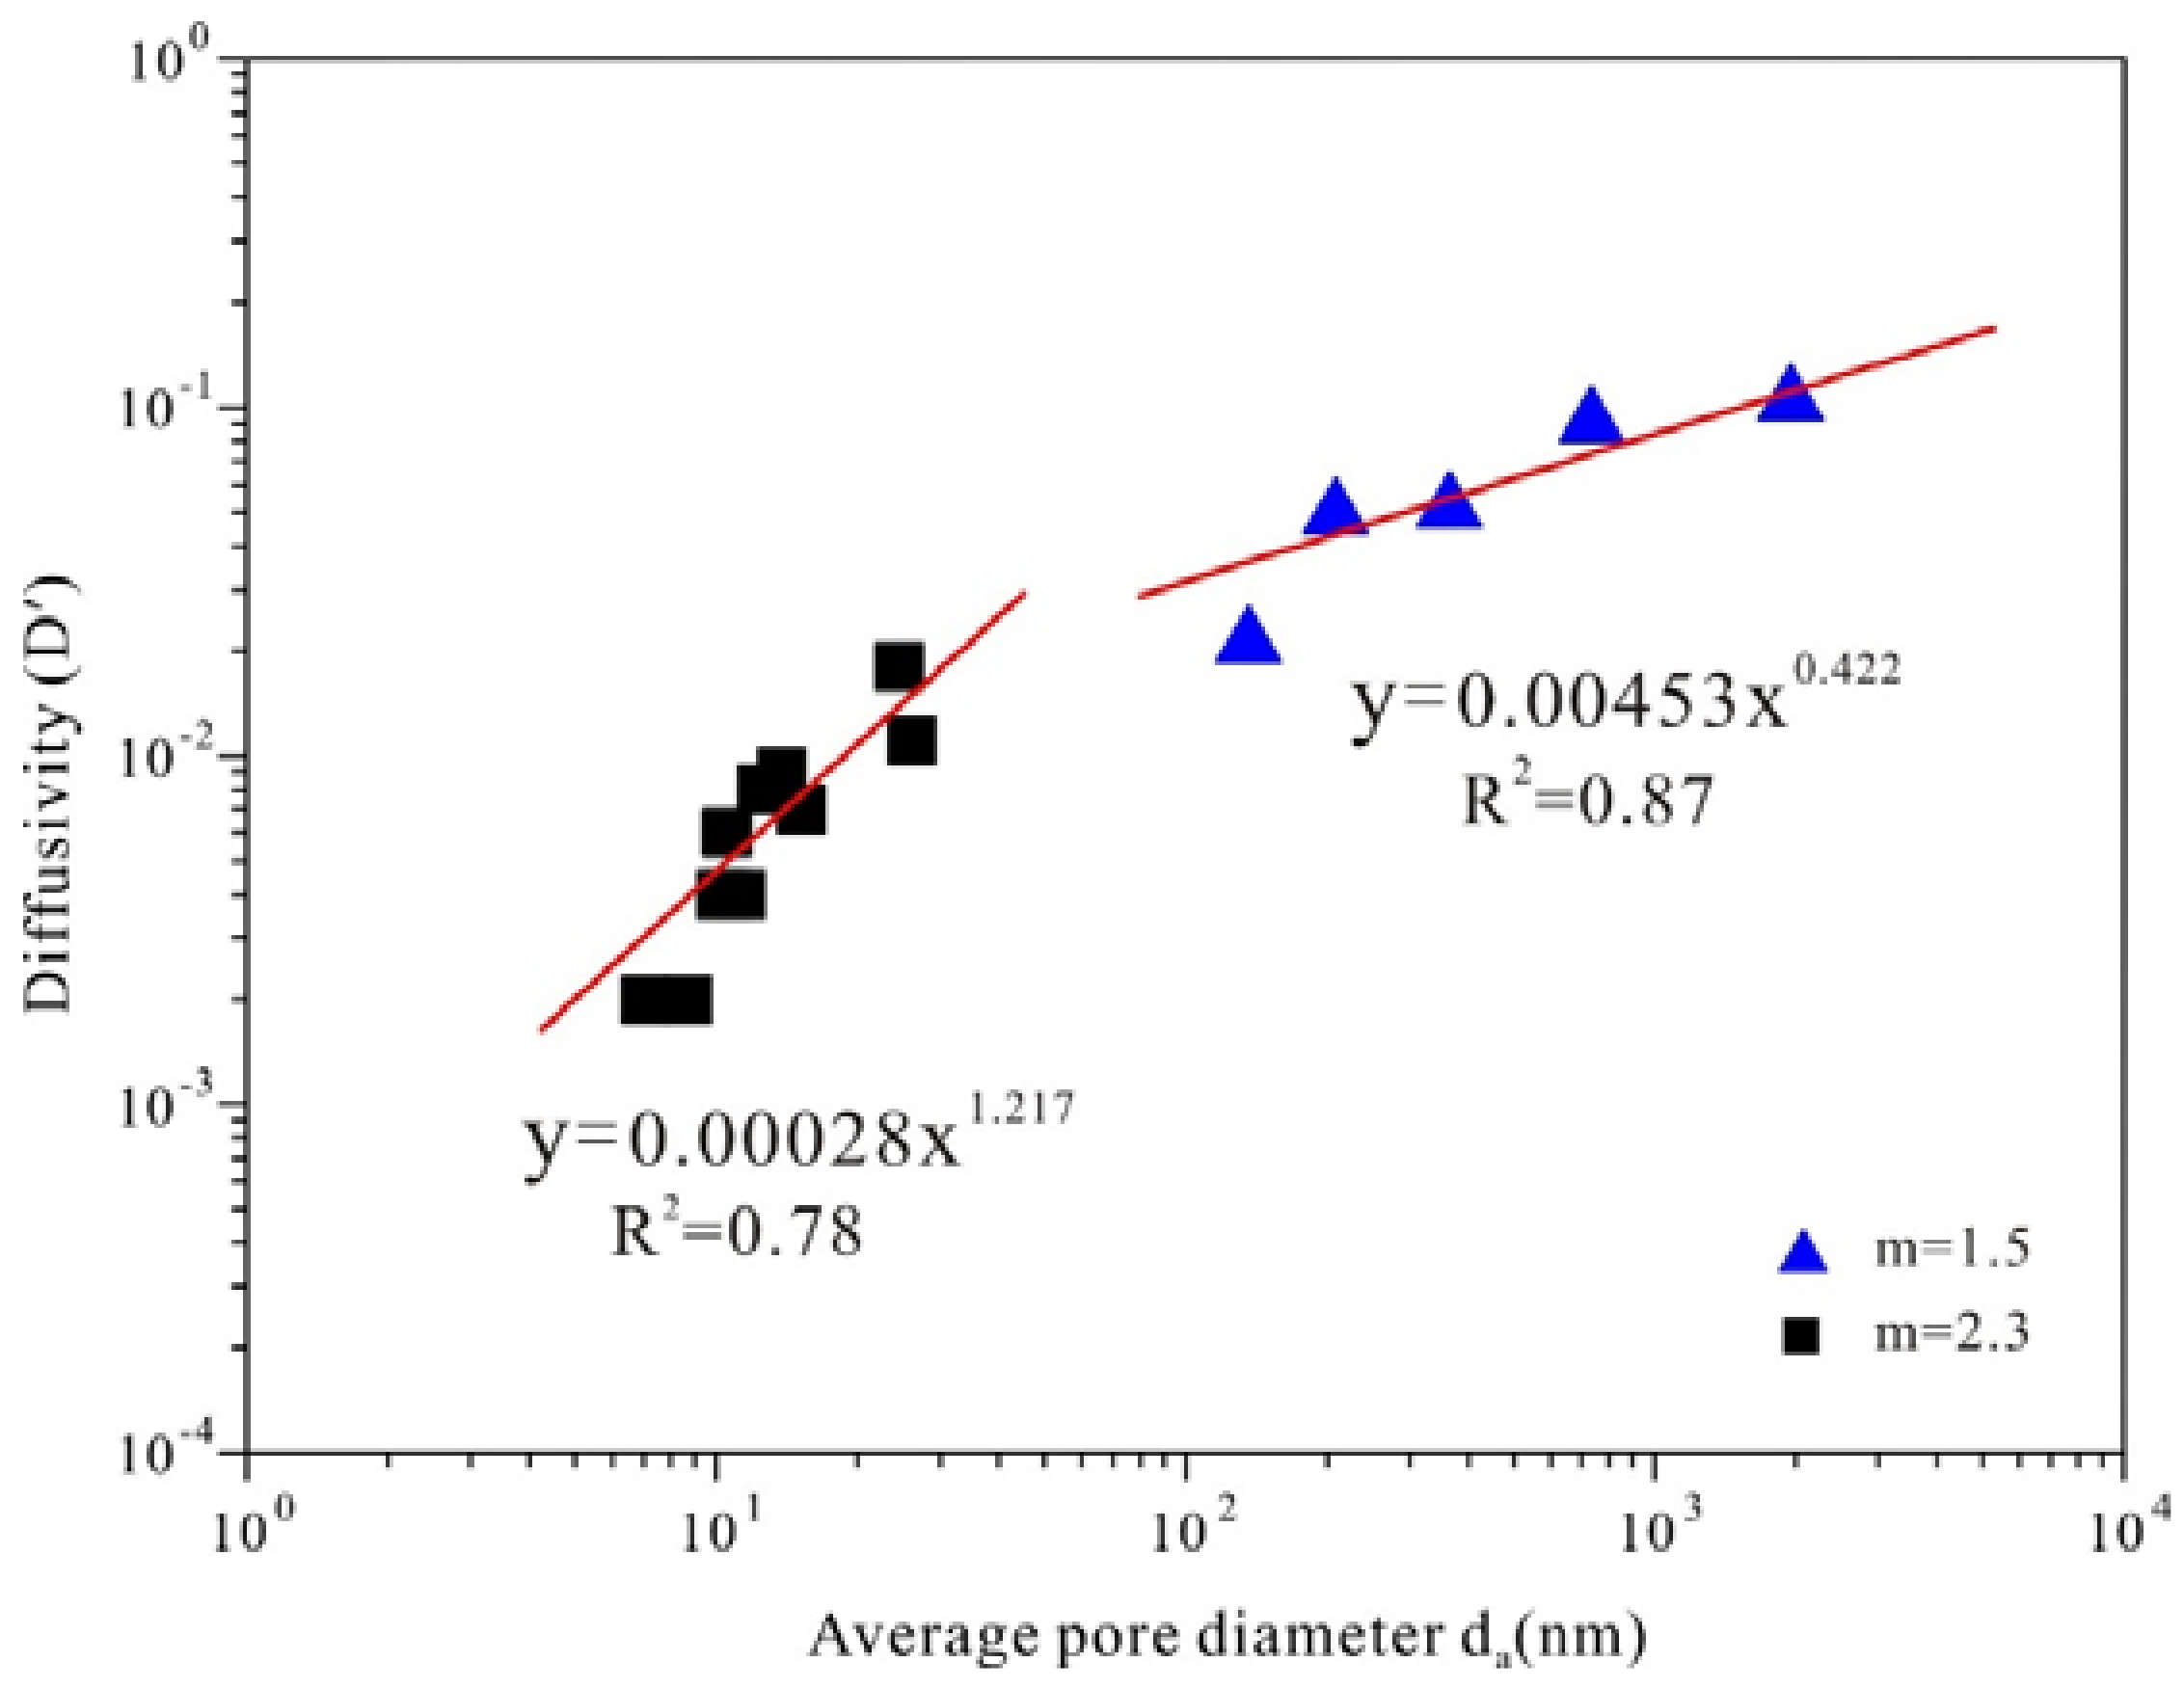
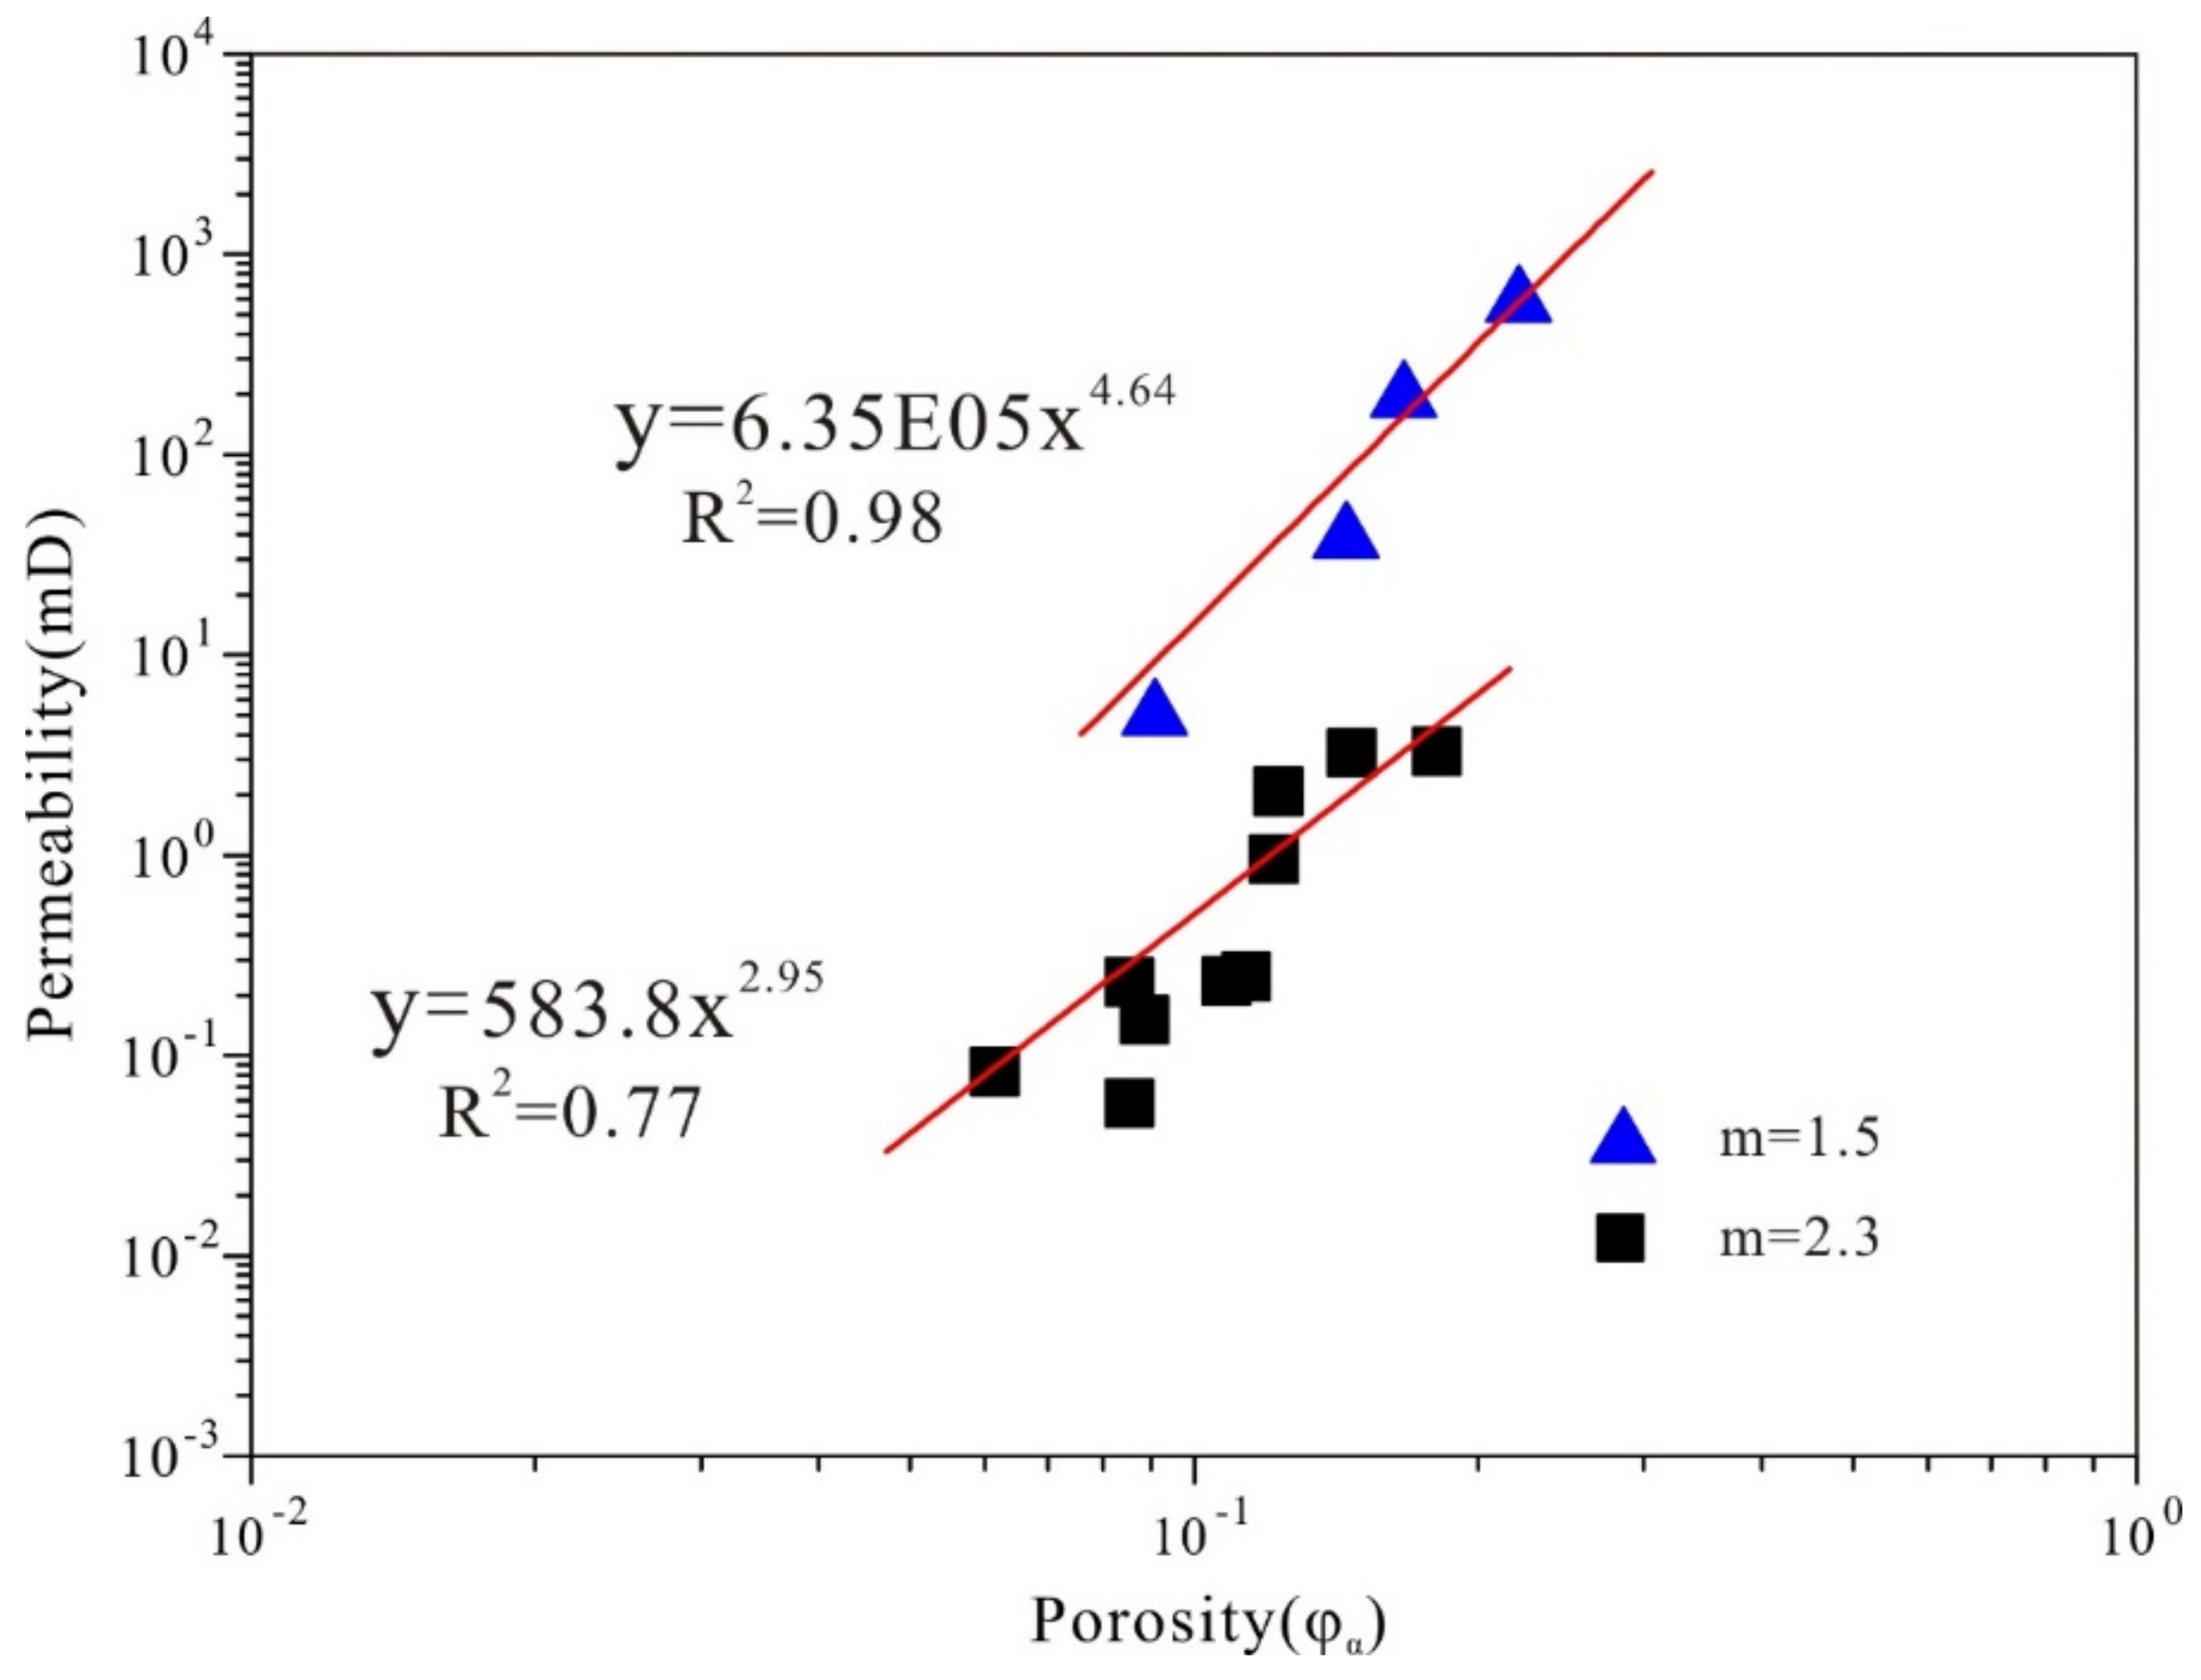
A distinct power function relationship exists between gas diffusivity and porosity for coals and other rocks. The deduced cementation factors (m values) for coals show relatively high m values (from 2.03 to 2.46), which tends to exhibit a larger m value for coals compared with other rocks due to the unconsolidated nature of coals.

Author Contributions

Conceptualization, Y.C.; Funding acquisition, D.L.; Investigation, X.F.; Methodology, X.F.; Validation, Y.Z.

Acknowledgments

This research was funded by the National Natural Science Fund of China (grant nos. 41602170 and 41772160), and the National Major Research Program for Science and Technology of China (2016ZX05043-001).

Conflicts of Interest

The authors declare no conflict of interest.

References

  1. Pillalamarry, M.; Harpalani, S.; Liu, S. Gas diffusion behavior of coal and its impact on production from coalbed methane reservoirs. Int. J. Coal Geol. 2011, 86, 342–348. [Google Scholar] [CrossRef]
  2. Gao, Z.Y.; Hu, Q.; Liang, H. Gas diffusivity in porous media: Determination by mercury intrusion porosimetry and correlation to porosity and permeability. J. Porous Media 2013, 16, 607–617. [Google Scholar] [CrossRef]
  3. Gillham, R.W.; Robin, M.L.J.; Dytynyshyn, D.J.; Johnson, H.M. Diffusion of nonreactive and reactive solutes through fine-grained barrier materials. Can. Geotech. J. 1984, 21, 541. [Google Scholar] [CrossRef]
  4. Firouzi, M.; Rupp, E.C.; Liu, C.W.; Wilcox, J. Molecular simulation and experimental characterization of the nanoporous structures of coal and gas shale. Int. J. Coal Geol. 2014, 121, 123–128. [Google Scholar] [CrossRef]
  5. Naveen, P.; Asif, M.; Ojha, K.; Panigrahi, D.C.; Vuthaluru, H. Sorption kinetics of CH4 and CO2 diffusion in coal: Theoretical and experimental study. Energy Fuels 2017, 31, 6825–6837. [Google Scholar] [CrossRef]
  6. Rahimi, M.; Singh, J.K.; Müllerplathe, F. CO2 adsorption on charged carbon nanotube arrays: A possible functional material for electric swing adsorption. J. Phys. Chem. C 2015, 119, 15232–15239. [Google Scholar] [CrossRef]
  7. Laxminarayana, C.; Crosdale, P.J. Controls on methane sorption capacity of Indian coals. AAPG Bull. 2002, 86, 201–212. [Google Scholar]
  8. Prinz, D.; Pyckhout-Hintzen, W.; Littke, R. Development of the meso- and macroporous structure of coals with rank as analysed with small angle neutron scattering and adsorption experiments. Fuel 2004, 83, 547–556. [Google Scholar] [CrossRef]
  9. Staib, G.; Sakurovs, R.; Gray, E.M.A. A pressure and concentration dependence of CO2 diffusion in two Australian bituminous coals. Int. J. Coal Geol. 2013, 116, 106–116. [Google Scholar] [CrossRef]
  10. Pone, J.D.N.; Halleck, P.M.; Mathews, J.P. Sorption capacity and sorption kinetic measurements of CO2 and CH4 in confined and unconfined bituminous coal. Energy Fuels 2009, 23, 4688–4695. [Google Scholar] [CrossRef]
  11. Mastalerz, M.; Goodman, A.; Chirdon, D. Coal lithotypes before, during, and after exposure to CO2: Insights from direct Fourier transform infrared investigation. Energy Fuels 2012, 26, 3586–3591. [Google Scholar] [CrossRef]
  12. Crosdale, P.J.; Beamish, B.B. Methane sorption studies at South Bulli(NSW) and Central(QLD) collieries using a high pressure microbalance. In Proceeding 28th Newcastle Symposium on Advances in the Study of the Sydney Basin Department Geology; The University of Newcastle: Newcastle, Australia, 1994; pp. 118–125. [Google Scholar]
  13. Crosdale, P.J.; Beamish, B.B. Methane diffusivity at South Bulli(NSW) and Central(QLD) Collieries in relation to coal maceral composition. In International Symposium-Cum-Workshop on Management and Control of High Gas Emission and Outbursts in Underground Coal Mines; Lama, R.D., Ed.; National Organising Committee of the Symposium: Wollongong, Australia, 1995; pp. 363–367. [Google Scholar]
  14. Pan, Z.J.; Connell, L.D.; Camilleri, M.; Connelly, L. Effects of matrix moisture on gas diffusion and flow in coal. Fuel 2010, 89, 3207–3217. [Google Scholar] [CrossRef]
  15. Li, Y.B.; Xue, S.; Wang, J.F.; Wang, Y.C.; Xie, J. Gas diffusion in a cylindrical coal sample – a general solution, approximation and error analyses. Int. J. Min. Sci. Technol. 2014, 24, 69–73. [Google Scholar] [CrossRef]
  16. Smith, D.M.; Williams, F.L. Diffusion models for gas production from coals: Application to methane content determination. Fuel 1984, 63, 251–255. [Google Scholar] [CrossRef]
  17. Mu, D.Q.; Liu, Z.S.; Huang, C. Determination of the effective diffusion coefficient in porous media including Knudsen effects. Microfluid. Nanofluid. 2008, 4, 257–260. [Google Scholar] [CrossRef]
  18. Cai, Y.D.; Liu, D.M.; Pan, Z.J.; Yao, Y.B.; Li, J.Q.; Qiu, Y.K. Pore structure and its impact on CH4 adsorption capacity and flow capability of bituminous and subbituminous coals from Northeast China. Fuel 2013, 103, 258–268. [Google Scholar] [CrossRef]
  19. Li, W.; Liu, H.F.; Song, X.X. Influence of fluid exposure on surface chemistry and pore-fracture morphology of various rank coals: Implications for methane recovery and CO2 storage. Energy Fuels 2017, 31, 12552–12569. [Google Scholar] [CrossRef]
  20. Chen, Y.; Liu, D.; Yao, Y.; Cai, Y.; Chen, L. Dynamic permeability change during coalbed methane production and its controlling factors. J. Nat. Gas Sci. Eng. 2015, 25, 335–346. [Google Scholar] [CrossRef]
  21. Zhang, L.H.; Liang, B.; Liu, Q.G.; Xiong, Y. A new deliverability equation considering slippage effect for gas reservoirs with low permeability and low pressure. Nat. Gas Ind. 2009, 29, 76–78. [Google Scholar]
  22. Anez, L.; Calas-Etienne, S.; Primera, J.; Woignier, T. Gas and liquid permeability in nano composites gels: Comparison of knudsen and klinkenberg correction factors. Microporous Mesoporous Mater. 2014, 200, 79–85. [Google Scholar] [CrossRef]
  23. Katz, A.J.; Thompson, A.H. Quantitative Prediction of Permeability in Porous rock. Phys. Rev. B 1986, 34, 8179–8181. [Google Scholar] [CrossRef]
  24. Katz, A.J.; Thompson, A.H. Prediction of rock electrical conductivity from mercury injection measurements. J. Geophys. Res. 1987, 92, 599–607. [Google Scholar] [CrossRef]
  25. Ataka, Y.; Kato, S.; Zhu, Q. Evaluation of effective diffusion coefficient in various building material and absorbents by mercury intrusion porosimetry. J. Environ. Eng. 2005, 7, 15–21. [Google Scholar] [CrossRef]
  26. Labani, M.M.; Rezaee, R.; Saeedi, A.; Al Hinai, A. Evaluation of pore size spectrum of gas shale reservoirs using low pressure nitrogen adsorption, gas expansion and mercury porosimetry: A case study from the Perth and Canning Basins, Western Australia. J. Pet. Sci. Eng. 2013, 112, 7–16. [Google Scholar] [CrossRef]
  27. Liu, P.; Yuan, Z.; Li, K. An improved capillary pressure model using fractal geometry for coal rock. J. Pet. Sci. Eng. 2016, 145, 473–481. [Google Scholar] [CrossRef]
  28. Lan, Y.; Davudov, D.; Moghanloo, R.G. Interplay between permeability and compressibility in shale samples. J. Pet. Sci. Eng. 2017, 159, 644–653. [Google Scholar] [CrossRef]
  29. Yu, S.; Bo, J.; Pei, S.; Wu, J.H. Matrix compression and multifractal characterization for tectonically deformed coals by Hg porosimetry. Fuel 2018, 211, 661–675. [Google Scholar] [CrossRef]
  30. Washburn, E.W. Note on a method of determining the distribution of pore sizes in a porous material. Proc. Natl. Acad. Sci. USA 1921, 7, 115–116. [Google Scholar] [CrossRef] [PubMed]
  31. Ellison, A.H.; Klemm, R.B.; Schwartz, A.M.; Grub, L.S.; Petrash, D.A. Contact angles of mercury on various surfaces and the effect of temperature. J. Chem. Eng. Data 1967, 12, 607–609. [Google Scholar] [CrossRef]
  32. Cai, Y.D.; Pan, Z.J.; Liu, D.M.; Zheng, G.Q.; Tang, S.H.; Connell, L.D.; Yao, Y.B.; Zhou, Y.F. Effects of pressure and temperature on gas diffusion and flow for primary and enhanced coalbed methane recovery. Energy Explor. Exploit. 2014, 32, 601–619. [Google Scholar] [CrossRef]
  33. Crank, J. The Mathematics of Diffusion, 2nd ed.; Oxford University Press: London, UK, 1975. [Google Scholar]
  34. Cai, Y.D.; Liu, D.M.; Yao, Y.B.; Li, J.Q.; Qiu, Y.K. Geological controls on prediction of coalbed methane of no. 3 coal seam in southern qinshui basin, north china. Int. J. Coal Geol. 2011, 88, 101–112. [Google Scholar] [CrossRef]
  35. Boving, T.B.; Grathwohl, P. Tracer diffusion coefficients in sedimentary rocks: Correlation to porosity and hydraulic conductivity. J. Contam. Hydrol. 2001, 53, 85–100. [Google Scholar] [CrossRef]
  36. Grathwohl, P. Diffusion in Natural Porous Media: Contaminant Transport, Sorption/Desorption and Dissolution Kinetics; Kluwer Academic Publishing: Boston, MA, USA, 1998. [Google Scholar]
  37. Moore, C.A.; Alzayadi, A. Theoretical Considerations of Movements of Gases around Sanitary Landfills; Report to U.S.; EPA: Washington, DC, USA, 1975.
  38. Carniglia, S.C. Construction of the tortuosity factor from porosimetry. J. Catal. 1986, 102, 401–418. [Google Scholar] [CrossRef]
  39. Evans, R.B.; Watson, G.M.; Mason, E.A. Gaseous diffusion in porous media at uniform pressure. J. Chem. Phys. 1961, 35, 2076–2083. [Google Scholar] [CrossRef]
  40. Pollard, W.G.; Present, R.D. On gaseous self-diffusion in long capillary tubes. Phys. Rev. 1948, 73, 752–774. [Google Scholar] [CrossRef]
  41. Fuller, E.N.; Schettler, P.D.; Giddings, J.C. New method for prediction of binary gas-phase diffusion coefficients. J. Ind. Eng. Chem. 1966, 58, 18–27. [Google Scholar] [CrossRef]
  42. Cunningham, R.E.; Williams, R.J.J. Diffusion in Gases and Porous Media; Plenum: Boston, MA, USA, 1980. [Google Scholar]
  43. Kast, W.; Hohenthanner, C.R. Mass transfer within the gasphase of porous media. Int. J. Heat Mass Transf. 2000, 43, 807–823. [Google Scholar] [CrossRef]
  44. Wang, Q.Q.; Li, W.; Zhang, D.F.; Wang, H.H.; Jiang, W.P.; Zhu, L.; Tao, J.; Huo, P.L.; Zhang, J. Influence of high-pressure CO2, exposure on adsorption kinetics of methane and CO2, on coals. J. Nat. Gas Sci. Eng. 2016, 34, 811–822. [Google Scholar] [CrossRef]
  45. Cai, Y.D.; Liu, D.M.; Pan, Z.J.; Che, Y.; Liu, Z.H. Investigating the effects of seepage-pores and fractures on coal permeability by fractal analysis. Transp. Porous Media 2016, 111, 479–497. [Google Scholar] [CrossRef]
  46. Chilingar, G.V.; Main, R.; Sinnokrot, A. Relationship between porosity, permeability, and surface areas of sediments. J. Sediment. Petrol. 1963, 33, 759–765. [Google Scholar]
  47. Ma, S.; Morrow, N.R. Relationships between porosity and permeability for porous rocks. Int. Symp. SCA 1996, 2, 8–10. [Google Scholar]
  48. Tiab, D.; Donaldson, E.C. Petrophysics—Theory and Practice of Measuring Reservoir Rock and Fluid Transport Properties; Elsevier: Amsterdam, The Netherlands, 2004. [Google Scholar]
Figure 1. Experimental devices for CH4 adsorption and diffusion.
Applsci 08 00860 g001
Figure 2. Cumulative intrusion volume vs. intrusion pressure for six coal samples with different coal ranks.
Applsci 08 00860 g002
Figure 3. Experimental and unipore model fitting curves of adsorption kinetics of CH4 adsorption on various coals. ((a): HDG 6#; (b): HYC 4#; (c): LL-HJG 5#; (d): LL-DP 10#; (e): GJ-DQ 4#; (f): YQ-WK 15#).
Applsci 08 00860 g003
Figure 4. Comparison of effective diffusion coefficients, permeability obtained by theoretical calculation with experimental results. (a) demonstrates that the comparison of effective diffusion coefficient from the theoretical calculation and experimental approach by CH4 diffusion, which shows that the effective diffusion coefficient calculated in this work is slightly higher than the experimental result by CH4 diffusion; (b) shows that the theoretical calculation and experimental permeability by CH4 are distributed equally near the straight line with the slope equals to 1.
Applsci 08 00860 g004
Figure 5. Diffusion coefficient and permeability for the low, medium and high rank coals. (a) Diffusion coefficient for the low, medium and high rank coals; (b) Permeability for the low, medium and high rank coals.
Applsci 08 00860 g005
Figure 6. Diffusivity (D′) vs. permeability for the different rank coals.
Applsci 08 00860 g006
Figure 7. Diffusivity (D′) vs. porosity (φa) for coal samples (square point) and other rocks (triangle point data).
Applsci 08 00860 g007
Figure 8. Diffusivity (D′) vs. average pore diameter (da) for coal samples (square point) and other rocks (triangle point).
Applsci 08 00860 g008
Figure 9. Permeability vs. porosity for coal samples (square point) and other rocks (triangle point).
Applsci 08 00860 g009
Table 1. Results of the MIP, petrographic and proximate analysis of the coal samples.
Sample No.Ro,m (%)Coal RankPorosity (%)da (nm)Proximate Analysis (%)Petrographic Analysis (%)
MadAadVadFCadVIEM
HDG 6#0.68high volatile bituminous14.713.806.3811.303.5067.3072.3011.0016.200.50
BLG 6#0.68high volatile bituminous6.48.708.635.384.1068.0669.9018.3011.600.20
HYC 4#0.65high volatile bituminous12.310.605.7815.823.9462.2078.0012.207.002.80
LHJ 4#0.46Liginites6.157.106.466.0939.1148.3478.805.4012.103.80
LL-HJG 5#1.34Medium volatile bituminous8.5510.620.7410.2727.9461.0560.6825.02014.3
LL-DP 10#1.68low-volatile bituminous8.8710.250.6311.1021.3066.9759.6934.6105.70
LL-SL 5#1.19Medium volatile bituminous10.8326.120.7112.0426.7760.4857.8132.192.507.50
LL-XM 5#1.44Medium volatile bituminous12.1610.530.579.9026.8062.7340.0356.6703.30
TY-DY 6#2.56semi-anthracite coal8.5511.320.6238.0835.9425.3649.517.99042.50
GJ-DQ 4#2.05semi-anthracite coal13.5912.530.7111.5748.9738.7576.9716.3306.70
YQ-WK 15#2.54semi-anthracite coal11.3615.221.4311.0612.4675.0577.9815.5206.50
YQ-YK 15#2.79anthracite coal18.1224.601.2013.3012.4973.0183.5512.1504.30
Note: da = average pore size; Mad = Moisture content (wt %, air dry basis); Aad = Ash yield (wt %, air dry basis); Vad = Volatile matter (wt %, air dry basis). FCad = Fixed carbon (wt %, air dry basis). V = vitrinite; I = inertinite; E = exinite; M = minerals.
Table 2. Porosity, permeability, effective diffusion coefficient and m values by MIP.
Sample No.Ro,m (%)Porosity (%)da (nm)Permeability (mD)De (m2/s)Dm
HDG 6#0.6814.713.803.242201.94 × 10−70.0092.46
BLG 6#0.686.48.700.341665.34 × 10−80.0022.18
HYC 4#0.6512.310.602.076781.27 × 10−70.0062.45
LHJ 4#0.466.157.100.082504.25 × 10−80.0022.23
LL-HJG 5#1.348.5510.620.233238.64 × 10−80.0042.25
LL-DP 10#1.688.8710.250.150948.70 × 10−80.0042.28
LL-SL 5#1.1910.8326.120.233482.38 × 10−70.0112.03
LL-XM 5#1.4412.1610.530.953051.24 × 10−70.0062.45
TY-DY 6#2.568.5511.320.057759.15 × 10−80.0042.22
GJ-DQ 4#2.0513.5912.530.010651.64 × 10−70.0082.45
YQ-WK 15#2.5411.3615.220.248101.60 × 10−70.0072.25
YQ-YK 15#2.7918.1224.603.285393.95 × 10−70.0182.34
Note: da = average pore size; De = effective gas diffusion coefficient; D′ = CH4 diffusivity; m = cementation factor.
Table 3. Results of repeatability tests.
Sample No.MIP TestPorosity (%)da (nm)
Measured ValueAvg ± Standard DeviationMeasured ValueAvg ± Standard Deviation
HDG 6#115.6214.7 ± 0.9214.5713.8 ± 0.77
213.8813.12
314.613.71
LL-DP 10#18.568.87 ± 0.3110.1210.25 ± 0.15
29.0610.4
38.9910.23
YQ-WK 15#111.5911.36 ± 0.3215.4115.22 ± 0.27
211.4515.3
311.0414.95
Table 4. Permeability and effective diffusion coefficient by experimental measurement.
Sample No.Ro,m (%)Porosity (%)k(m) (mD)P (MPa)De(m) (m2/s)R2D(m)
HDG 6#0.6814.73.680000.52041.23 × 10−70.790.006
BLG 6#0.686.40.892000.58733.67 × 10−80.930.002
HYC 4#0.6512.31.580000.64191.09 × 10−70.910.005
LHJ 4#0.466.150.260000.72343.91 × 10−80.870.002
LL-HJG 5#1.348.550.170790.36097.12 × 10−80.930.003
LL-DP 10#1.688.870.385600.55237.08 × 10−80.980.003
LL-SL 5#1.1910.830.193540.46732.59 × 10−70.820.012
LL-XM 5#1.4412.160.739220.55871.02 × 10−70.930.005
TY-DY 6#2.568.550.112470.60734.77 × 10−80.890.002
GJ-DQ 4#2.0513.590.012100.45291.31 × 10−70.950.006
YQ-WK 15#2.5411.360.186860.50171.23 × 10−70.860.006
YQ-YK 15#2.7918.124.022220.56433.10 × 10−70.910.014
Note: k(m) = permeability measured by helium; P = An equilibrium pressure of CH4 diffusion; De(m) = effective gas diffusion coefficient measured by adsorption and desorption Experiments; R2 = correlation. Coefficients of De(m).

