Article

Assessment of Student Music Performances Using Deep Neural Networks

by
Kumar Ashis Pati
*,†,
Siddharth Gururani
and
Alexander Lerch
Center for Music Technology, Georgia Institute of Technology, Atlanta, GA 30318, USA
*
Author to whom correspondence should be addressed.
These authors contributed equally to this work.
Appl. Sci. 2018, 8(4), 507; https://doi.org/10.3390/app8040507
Submission received: 28 February 2018 / Revised: 19 March 2018 / Accepted: 22 March 2018 / Published: 27 March 2018
(This article belongs to the Special Issue Digital Audio and Image Processing with Focus on Music Research)

Abstract

:
Music performance assessment is a highly subjective task often relying on experts to gauge both the technical and aesthetic aspects of the performance from the audio signal. This article explores the task of building computational models for music performance assessment, i.e., analyzing an audio recording of a performance and rating it along several criteria such as musicality, note accuracy, etc. Much of the earlier work in this area has been centered around using hand-crafted features intended to capture relevant aspects of a performance. However, such features are based on our limited understanding of music perception and may not be optimal. In this article, we propose using Deep Neural Networks (DNNs) for the task and compare their performance against a baseline model using standard and hand-crafted features. We show that, using input representations at different levels of abstraction, DNNs can outperform the baseline models across all assessment criteria. In addition, we use model analysis techniques to further explain the model predictions in an attempt to gain useful insights into the assessment process. The results demonstrate the potential of using supervised feature learning techniques to better characterize music performances.

1. Introduction

Music is essentially a performing art. Western classical music in particular often requires musicians to perform an acoustic rendition of a written piece of music, referred to as a musical score. While the score provides essential information regarding the sequence of notes and the overall rhythm, several finer details of the performance such as dynamics and timing are often left for the performer to decide. During a musical performance, the performer has to understand the musical notation, incorporate these finer details into their thoughts, and convert these thoughts into complex and precise motor movements. This makes music performance amongst the most skill-intensive actions performed by human beings [1] spanning all the three domains of learning [2], i.e., cognitive (e.g., the knowledge of music theory and understanding of musical symbols), psychomotor (e.g., ability to move specific body parts in a coordinated way) and affective (e.g., feel and express the emotions through performance).
Learning to perform music is, therefore, a complex and time-consuming task at the core of music education. The average music student requires regular attention and feedback from a trained teacher to improve their performance skills in a holistic manner. The teacher is expected to provide a consistent and reliable assessment of multiple facets of a performance. These facets include, for example, pitch and rhythmic accuracy or general expressiveness. The ill-defined and subjective nature of these criteria result in high variance of such assessments amongst music educators [3,4]. In spite of these potential issues, subjective performance assessment is ubiquitous in music education: selection in ensembles/bands is determined through competitive auditions and progress is monitored through recitals. Hence, improving the reliability and consistency of music performance assessments can play a critical role in the music learning process. The focus of this article lies in developing data-driven computational models capable of understanding music performances so as to assess them along several criteria (see Figure 1). The key motivation is to provide reliable and reproducible feedback to students by introducing an element of objectivity to the process. A better understanding of both the objective parameters characterizing music performances and the main factors contributing to their assessment can also give us new insights into the production and perception of musical performance.
The last two decades have seen significant progress and improvement in the field of music information retrieval (MIR) [5], which focuses on algorithms and methods for the analysis and extraction of information from music signals. Examples of typical MIR tasks are fundamental pitch detection [6,7], music transcription [8,9] and source separation [10]. Approaches to solve these tasks can be seen as critical building blocks for systems analyzing and assessing music performances [11,12,13,14,15,16,17,18,19,20]. There exist commercial systems for performance assessment such as Yousician [21] and SmartMusic [22], which provide students with visual feedback during their individual practice sessions. However, the assessments are either simplistic (note correct/incorrect), cover only a small aspect of the performance, or are opaque with respect to their computation and meaning.
Previous research on objective music performance assessment, utilizing traditional low-level audio features such as Mel frequency cepstral coefficients (MFCCs) or hand-crafted features characterizing pitch and rhythm could only show limited success [11,14,18,19]: while the models did capture some aspects of the performance, they were unable to achieve high accuracy results. Recently, it has been hypothesized that this “sub-optimal” performance could stem from the limitation of hand-designed features and that feature learning might allow for capturing relevant information not represented in the hand-crafted feature sets [23].
The goal of this article is to investigate whether we can learn more about music performance and its assessment by utilizing deep neural networks (DNNs) to learn better feature representations. DNNs are a class of feature learning methods that can serve as powerful function approximators capable of modeling complex nonlinear relationships [24]. DNN-based methods are currently representing the state-of-the-art in multiple MIR tasks including music classification [25], source separation [26,27], and multi-pitch tracking [28]. In this article, we propose DNN based regression models to assess music performances of pitched wind instruments along different subjective criteria. To the best of the authors’ knowledge, this has not been explored before. We experiment with data representations at different levels of abstraction and study their ability to encode information to characterize specific aspects of a music performance. The proposed models outperform previously used methods across all assessment criteria. We further demonstrate the effectiveness of the features learned and explain the model predictions using model analysis tools such as filter distance measures and saliency maps.
The rest of this article is structured as follows: Section 2 presents a survey of the relevant work in music performance analysis and assessment. The following Section 3 outlines the problem, proposed method and model architectures in detail, followed by our experimental design and methods. Results are presented in Section 4 followed by a discussion based on model analysis in Section 5. Lastly, Section 6 summarizes our findings, explores possible avenues for future work, and concludes the article.

2. Related Work

Music is more than the written score. While the score may capture the composer’s intent and provides a “blueprint for a performance” [29], only an acoustic rendition by a performer interpreting the score can allow for a complete perception of music. Different performances of the same score can be drastically different. This is primarily because the performer has to interpret, modify, or enhance the available score information and devise a strategy to convey the score to the listener by means of choosing and varying, for example, tempo and timing, dynamics, intonation and ornamentation, and tone quality. This leads to a unique and “expressive” music performance [29]. Music performance analysis (MPA) is a research area aimed at measuring, understanding, and modeling the impact of such expressive alterations on the human listener [30]. While most of the early research in MPA centered around analyzing symbolic data extracted from piano rolls or musical instrument digital interface (MIDI) devices (compare, e.g., [31,32]), attention has recently shifted to the analysis of audio signals (compare, e.g., [30,33]).
The idea of utilizing technology to assist music (performance) education is not new. Seashore pointed out the value of scientific observation of music performances for improving learning as early as the 1930s [34]. One of the earliest works exploring the potential of computer-assisted techniques in the music classroom was carried out by Allvin [35]. Although Allvin’s work was focused on using technology for providing individualized instruction and developing aural and visual aids to facilitate learning, it also highlighted the potential of using MIR techniques such as pitch detection to perform error analysis in a musical performance and provide constructive feedback to the learners.
The majority of the attempts at creating automatic music assessment systems so far have relied on extracting standard and hand-crafted features from the audio signal and then feeding them to a classifier to characterize the quality of the performance. Knight et al., for example, used a set of standard audio features and a support vector machine (SVM) classifier to categorize tonal quality of trumpet performances into “good” or “bad” labels [12]. Nakano et al., on the other hand, identified pitch interval accuracy and vibrato as important criteria for the evaluation of singing voice and designed hand-crafted features to quantify them [11]. Romani et al. used expert interviews to identify metrics for a “good” sound; based on these interviews, they designed custom features to measure pitch and timbre stability to evaluate the quality of an instrumental performance [15]. Abeßer et al. characterized the quality of student vocal and instrumental performances using features measuring the pitch, intonation, and rhythmic accuracy [14]. Luo et al. used a combination of spectral, timbral and pitch based features to identify common mistakes made by beginner violin players [16]. Li et al. tried modeling expressiveness in violin performance using their own set of features intended to capture dynamics, duration, and vibrato [17]. Vidwans et al. proposed using features based on audio-to-score alignment to compute a distance metric between the performance and the score being performed [19]. These were then combined with other features extracted from pitch, amplitude, and inter-onset intervals, and were used to build regression models to predict ratings given by expert judges along several performance criteria such as musicality, note accuracy, rhythmic accuracy and tone quality. Features based on aligned pitch contours—although in this case to a reference performance—were also used by Bozkurt et al. to analyze vocal conservatory exam recordings and classify them as “pass” or “fail” [20].
In spite of the different feature sets used by the above works, the central idea that ties them together is that they all attempt to leverage the knowledge of experts to design features tuned for a specific task. While this approach generally works well for simpler tasks, there is a risk of sub-optimal performance in problems involving complex relationships between the variables. DNNs, on the other hand, are capable of learning features from data and show promise in modeling these complex relationships. Therefore, neural networks and other feature learning methods have rapidly gained traction within the MIR community [36]. Amongst the different classes of deep neural architectures, convolutional neural networks (CNNs) are probably the most widely used. CNNs are inspired by biological vision systems and are efficient at learning local feature representations while possessing useful properties like local invariance and robustness to translation and distortions [37]. Following their success in image classification tasks (compare, e.g., [38]), CNNs have now been used used in numerous audio and music based tasks [28,39,40,41,42]. Although CNNs are capable of capturing local features, they lack the ability to learn temporal dependencies, which is critical to modeling sequential data such as speech, audio or music. Recurrent neural networks (RNNs) are another class of neural networks designed for sequential data [43] and have been used successfully for MIR tasks such as source separation [10], music transcription [44] and music classification [25].
Although DNNs and other feature learning methods are popular in the field of MIR in general, their usage in the analysis of music performance has been rather limited [23,45]. A few recent works have shown the potential of unsupervised feature learning using techniques such as sparse coding [46,47] and sparse filtering [48] in MPA tasks. Han and Lee used MFCCs and features learned from sparse filtering to detect common mistakes made by beginner flute players [45]. Wu and Lerch used sparse coding to learn features for building regression models capable of assessing percussive music performances [23]. The models showed significant improvement in performance compared to those using hand-crafted features. Inspired by the success of these unsupervised feature learning techniques, the motivation of this study is to explore the viability of using supervised feature learning in the form of DNNs for the assessment of music performance.

3. Material and Methods

In this study, we focus on building DNN based regression models that are capable of predicting ratings given by expert human judges for performances of pitched wind instruments. We experiment with two different input representations, which respectively encode a music signal at high and low levels of abstraction. We also present different DNN architectures targeted at this task. The models are trained to assess a musical performance along several distinct criteria such as note accuracy, rhythmic accuracy, etc. The performance of the DNN models are compared against a Support Vector Regression (SVR) based model trained using standard and hand-crafted features tuned for this task.

3.1. Dataset

The dataset that we use is provided by the Florida Bandmasters’ Association (FBA). This dataset contains the audio recordings from the Florida all-state auditions for three student categories: (i) Middle School (7th and 8th grade), (ii) Concert Band (9th and 10th grade), and (iii) Symphonic Band (11th and 12th grade) for three consecutive years (2013–2015). The auditions cover various wind and percussive instruments. Each student is required to perform several exercises, which are rated by expert judges along several assessment criteria. The scores performed vary between instruments, years and also between different student categories. All ratings are normalized to a range between 0 to 1. However, the number of judges and the grading rubrics are not available.
For this study, performances of three pitched wind instruments, i.e., Alto Saxophone, Bb Clarinet, and Flute from the Middle School and Symphonic Band categories are considered. The choice of instruments is considering that these instruments have the highest number of performance recordings over the three years. The two student categories are expected to have a greater difference in overall proficiency levels. The year-wise distribution of the number of students, the average duration of the performances and the percentage split amongst the instruments is shown in Table 1. The four assessment criteria used to grade the performances are Musicality (M), Note Accuracy (N), Rhythmic Accuracy (R), and Tone Quality (T).

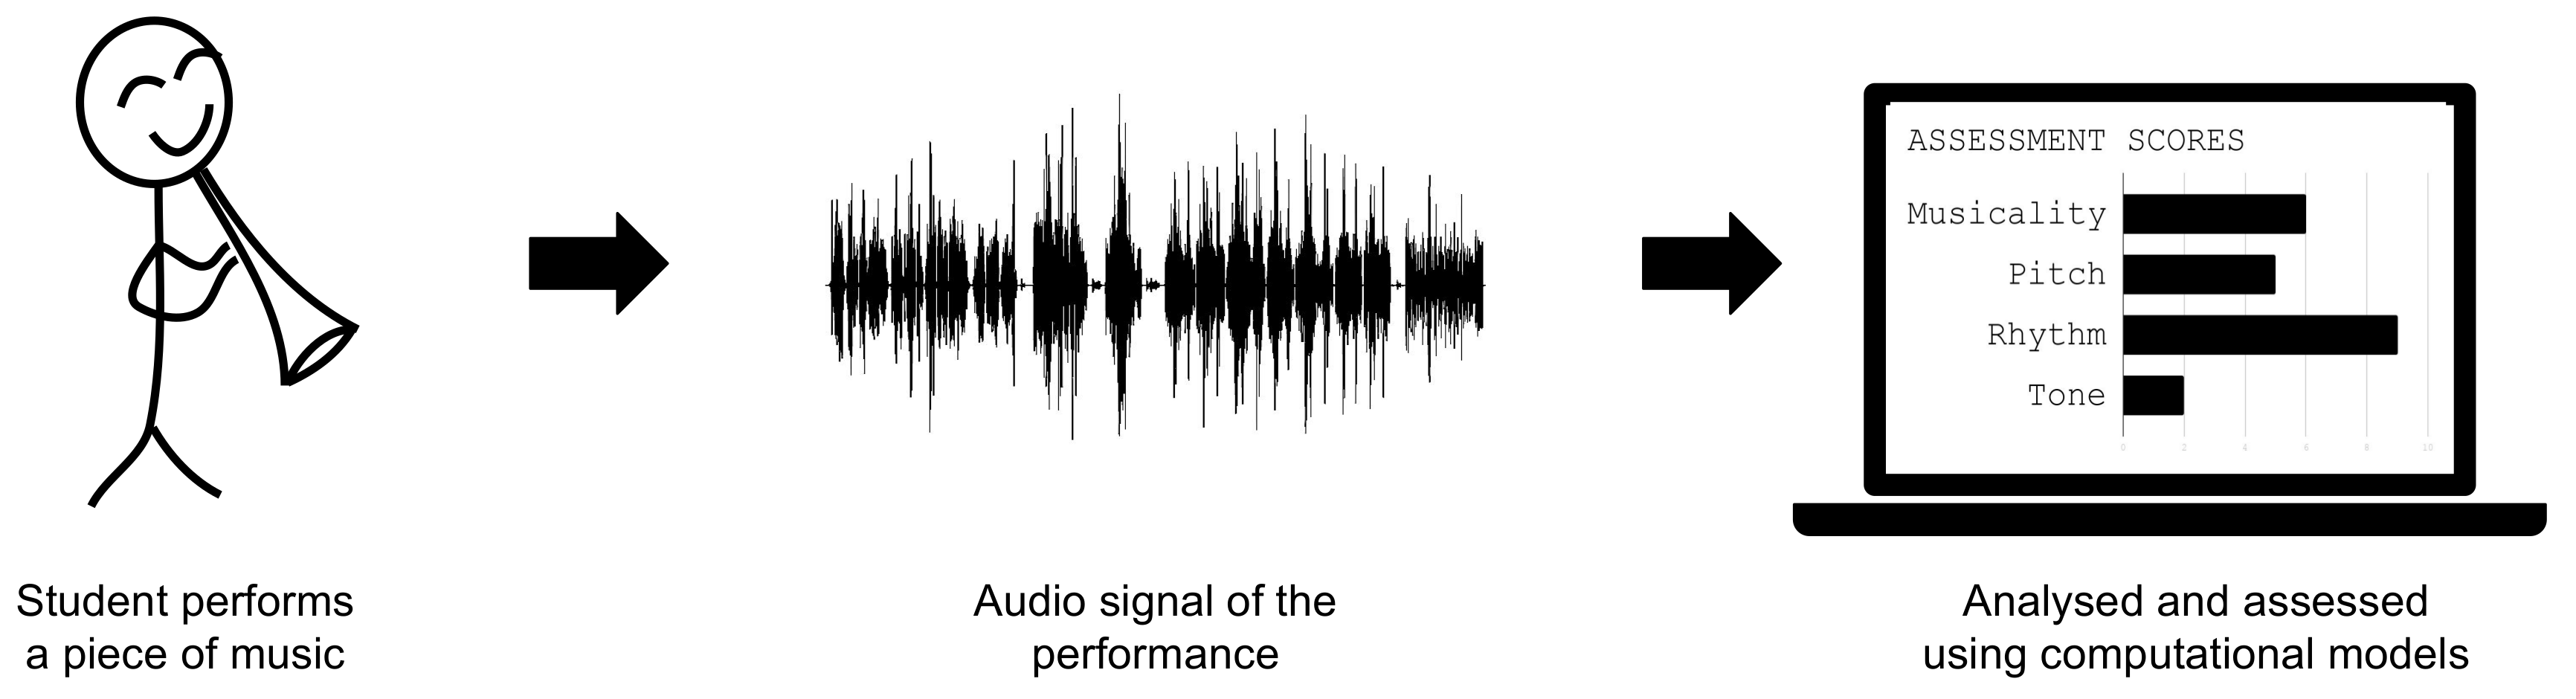
3.2. System Overview
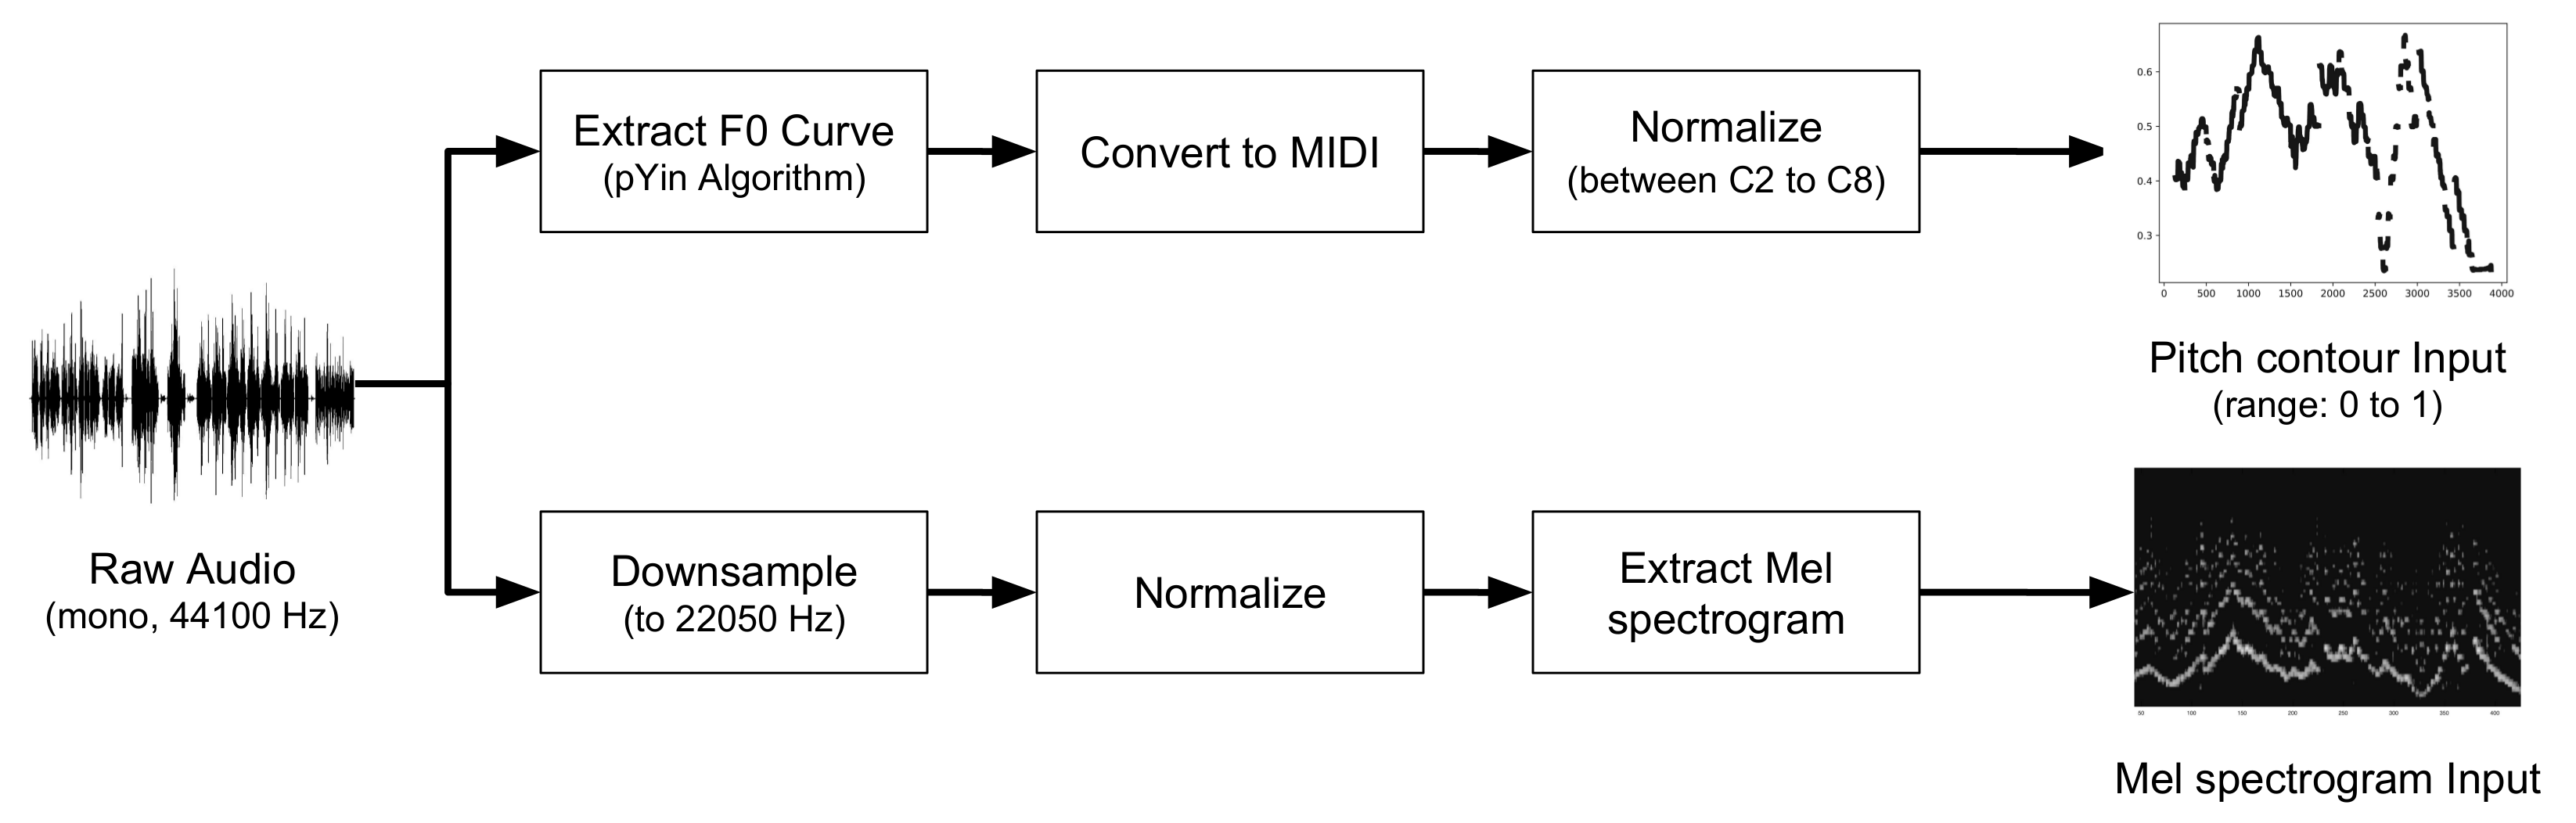
The proposed system uses a typical machine learning protocol comprised of two phases as shown in Figure 2: (i) a training and validation phase used to train the model and tune the hyperparameters; and (ii) a testing phase in which the model is evaluated. The available performance data consist of the audio recordings and the accompanying assessment ratings, which are used as ground truth. The data is first divided into three disjoint sets for training, validation, and testing. In the training and validation phase, the audio recordings of the performances are first passed through a pre-processing stage converting the raw audio signals into their corresponding input representations. These input representations are then fed into a DNN model that tries to predict the assessment ratings. The data in the training set is used to learn the model parameters. The model performance on the validation set is used to tune the hyperparameters. The testing set data is used to evaluate the model performance on unseen data following the same steps as above. The individual processing steps are explained in detail below.

3.3. Pre-Processing

In this step, the time-domain audio signals are converted to input data representations, which are meaningful to a DNN. First, the audio recordings are down-mixed to a single channel, re-sampled to a sampling rate of 44,100 Hz and normalized to a range of 1 to 1. Next, two different input representations are computed: (i) Pitch contour (PC) and (ii) Mel spectrogram (MEL).

3.3.1. Pitch Contour

Pitch contours are “time continuous sequences of fundamental frequency (F0) values” [49]. They are compact representations of the high level melodic content present in pitched musical audio and are motivated by the human perception of pitch in auditory streams [50]. While pitch and F0 are distinct physical entities, for the purpose of simplicity, we use them synonymously. Pitch estimation is considered as an essential pre-processing step in many MIR tasks such as melody extraction [49] and music transcription [8,9]. Since pitch contours capture frequency deviations, they are capable of characterizing important expressive aspects of musical performances such as bends, vibrato, etc., which make them suitable for use as an input representation for feature learning [51].
To compute the pitch contours from the input audio, the following steps were used (see Figure 3). First, the F0 estimate in Hz is computed from the audio recordings per block using the pYin F0 tracking algorithm [52]. pYin is a widely used F0 estimation technique for monophonic audio (all wind instruments considered in this work are monophonic). A block size of 23.2 ms and a hop size of 5.8 ms is used. The obtained frequency values are then converted to the MIDI domain using the following equation:
m = 69 + 12 log 2 f 440 Hz ,
where f is the F0 value in Hz and the m is the resulting MIDI pitch. This is followed by a normalization step. Since all the instruments under consideration have a pitch range from note C2 ( m = 32 ) to C8 ( m = 104 ), all MIDI pitches are first subtracted by 32 and then divided by 72. This results in a pitch contour range from 0 to 1 while minimizing sparsity in the input space to some degree. This is defined as the PC input representation.

3.3.2. Mel Spectrogram

The Mel spectrogram, on the other hand, is a time-frequency representation of an audio signal with a Mel-scaled frequency resolution intended to capture low level details along several dimensions such as pitch, amplitude and timbre. The use of Mel spectrograms is motivated by the nonlinear frequency resolution of the human auditory system [53], and they have been proven as useful input representations for various MIR tasks such as automatic tagging [25], onset detection [54], and feature learning [55].
The Mel spectrograms are calculated using Librosa [56] with 96 Mel bands from 0 to 11.025 kHz. Although this range does not cover the entire range of human hearing, it sufficiently covers the instruments’ fundamental and harmonic frequencies. The block size and hop size used are 92.8 ms and 46.4 ms, respectively. Decibel scaling is applied to the Mel spectrogram energies. This is defined as the MEL input representation.

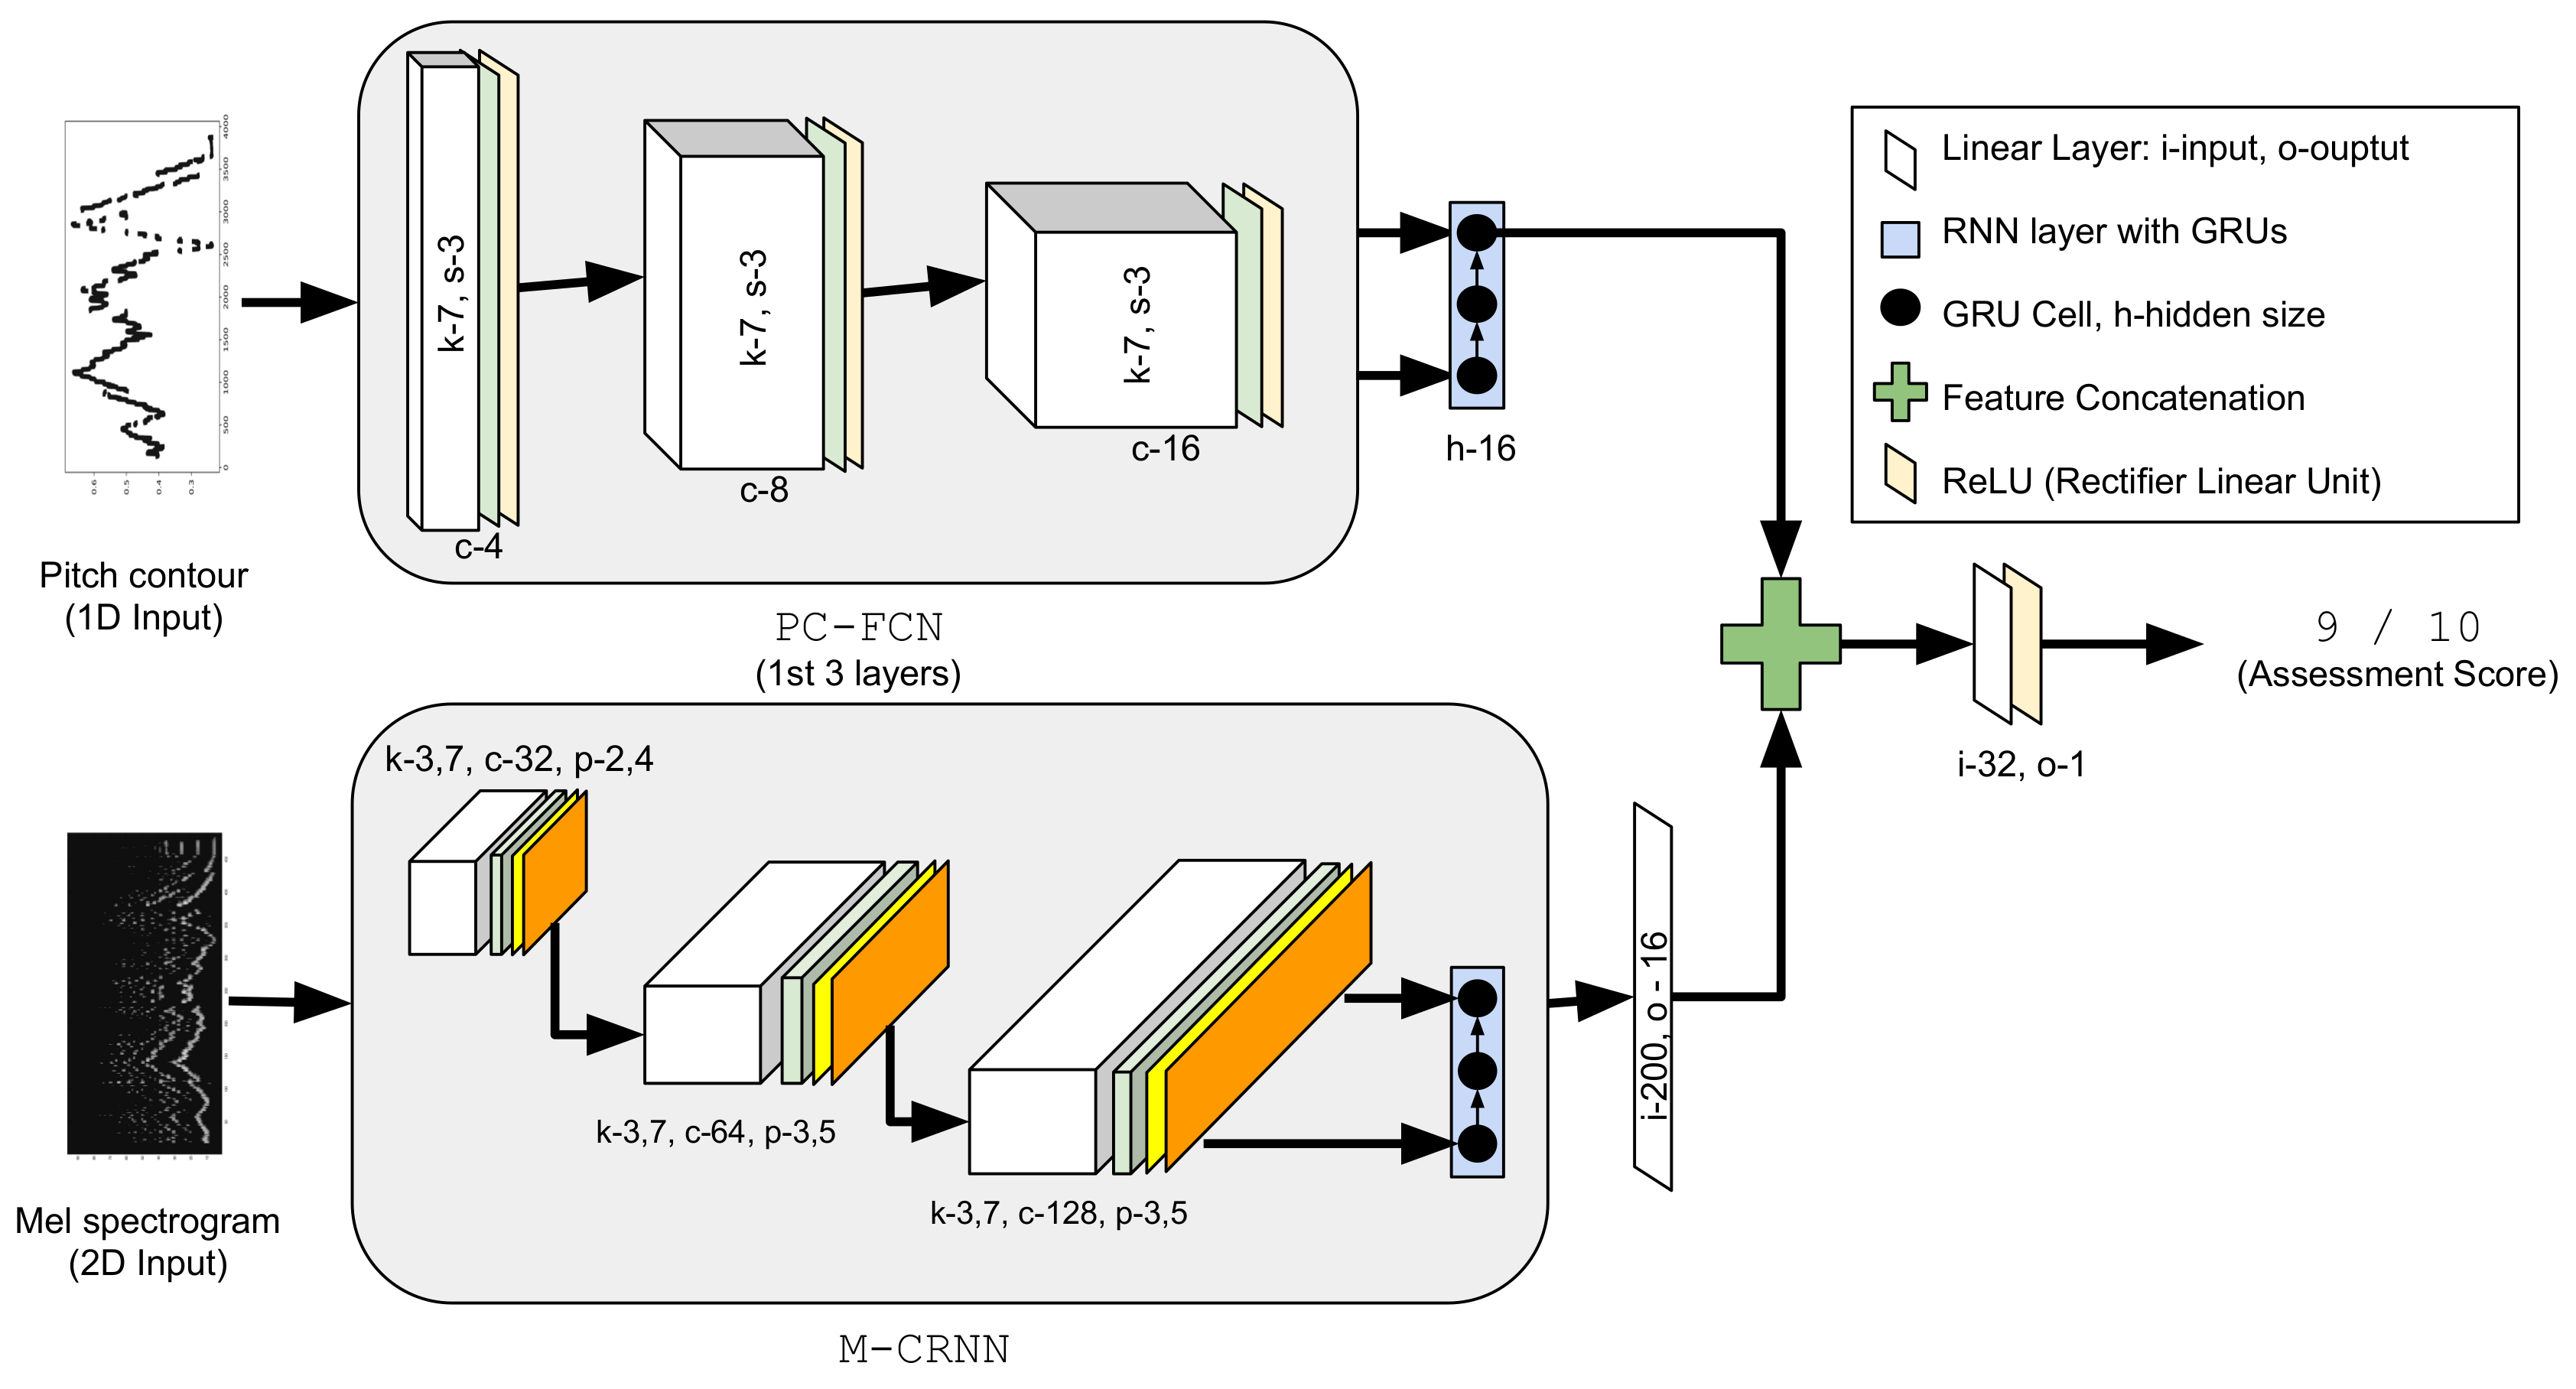
3.4. Deep Neural Network Architectures

Two different classes of DNN architectures are used. The first architecture, which is a fully convolutional model (PC-FCN), is used with the PC input representation. The second architecture uses a combination of convolutional and recurrent layers and is used with the MEL input representation (M-CRNN). We then propose a third hybrid model (PCM-CRNN) that combines the above in order to leverage information from both input representations.

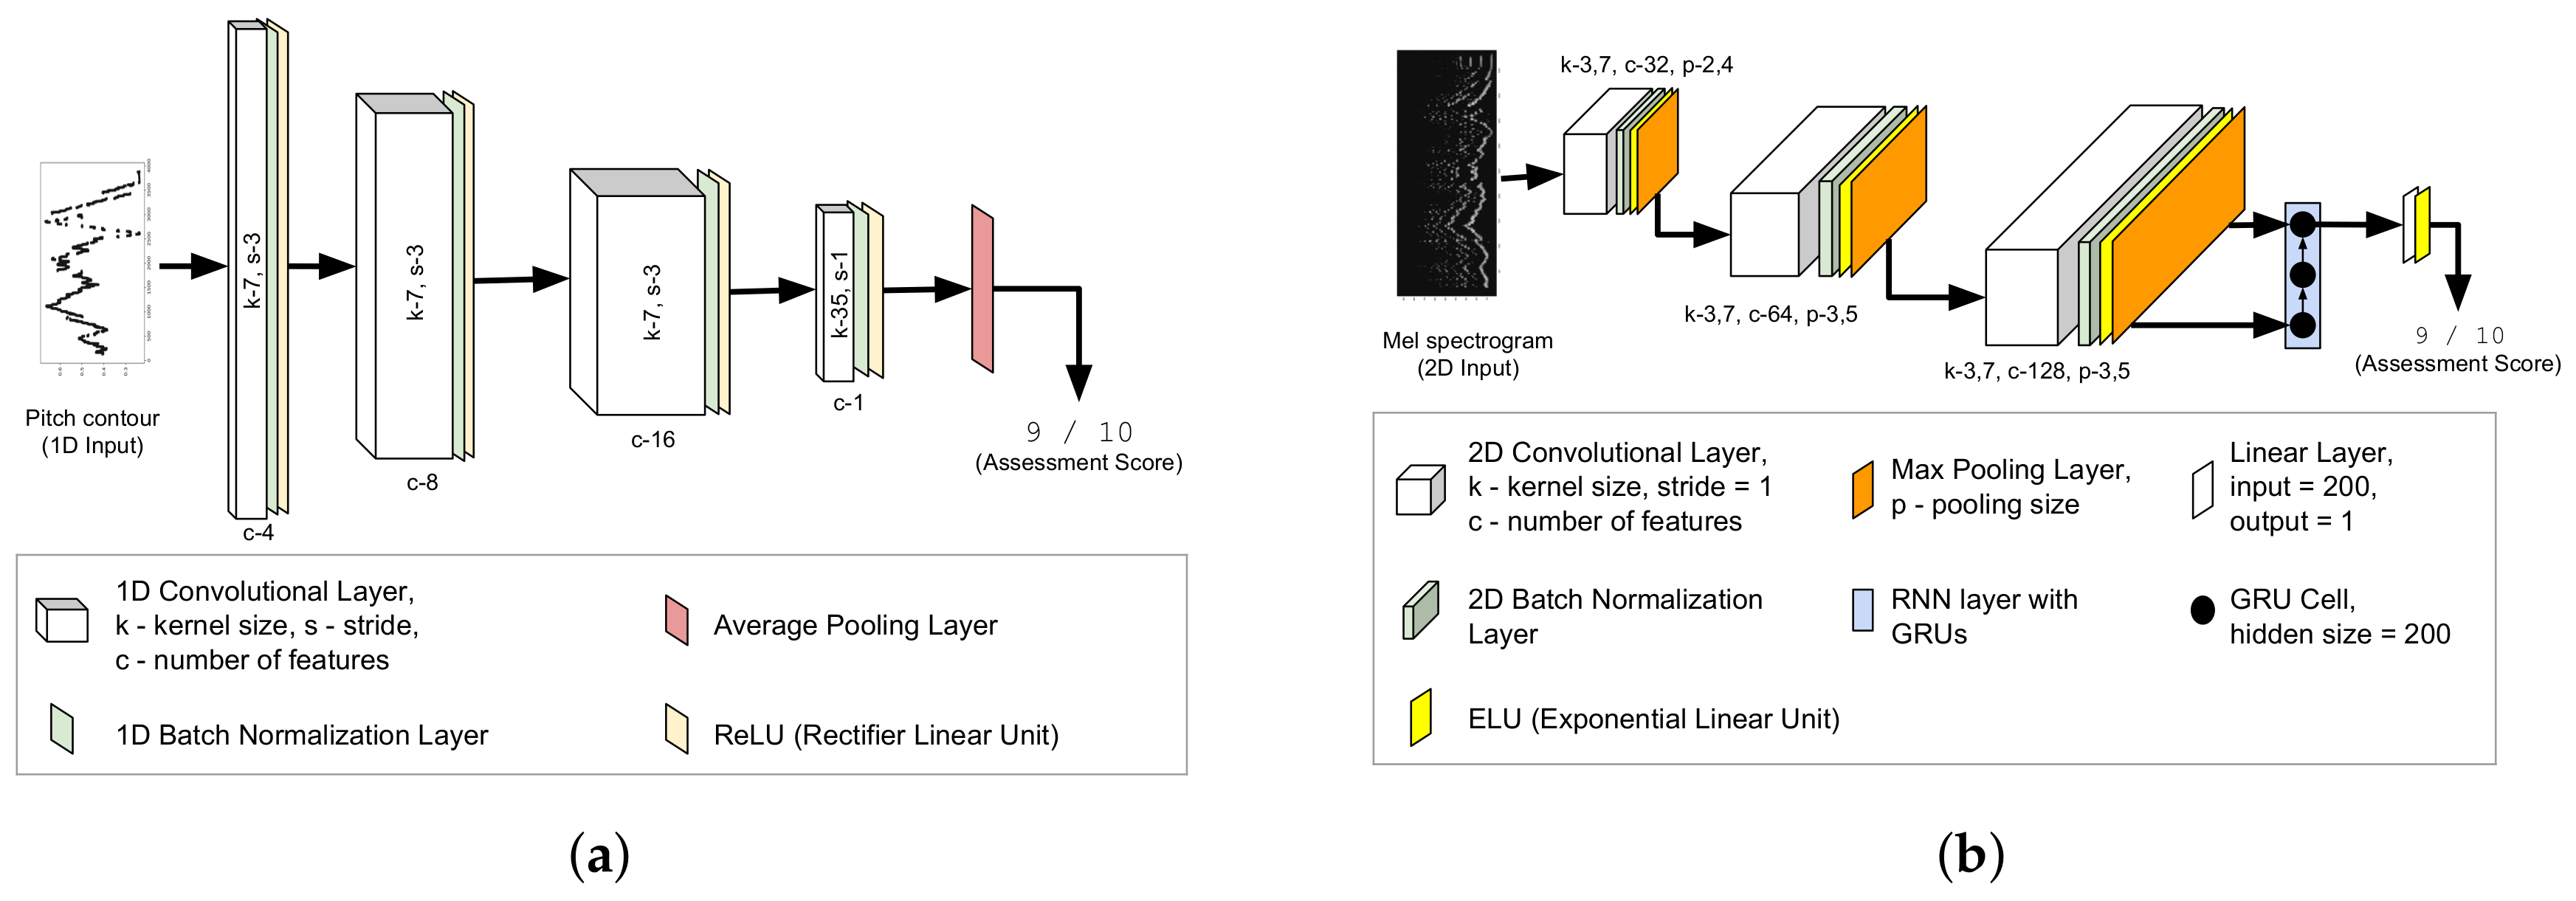
3.4.1. Fully Convolutional Pitch Contour Model

General CNNs usually have a fully connected layer at the end that restricts their usage to fixed sized inputs and makes them unsuitable for direct use with music performance data. Simply replacing the fully connected layers of a CNN with convolutional layers removes this limitation. The resulting architecture is referred to as a fully convolutional neural network (FCN). FCNs have been used by the computer vision community for quite some time [57,58]. However, their recent popularity is the result of the work done by Long et al., who used FCNs for performing dense pixel-level prediction for image segmentation tasks [59]. The ability to handle arbitrary length inputs makes FCNs a logical choice for use with music recordings [41,42].
The architecture details of the model are shown in Figure 4a. There are four convolutional layers, each of which has three components: (i) a 1D convolution layer, (ii) a 1D batch normalization layer, and (iii) a rectifier linear unit (ReLU) activation layer. Based on pilot experiments, for the first three layers, kernel size and stride are set to 7 (approx. 40 ms resolution in time) and 3 respectively. For the last layer, the kernel size is set to 35 and the stride is taken as 1. The number of features progressively increases to 16 in the 3rd layer. Batch normalization is used to reduce over-fitting during training [60]. An average pooling layer is connected at the end to output a single assessment score irrespective of the length of the input PC. The only limitation of this kind of FCN architecture is that it assumes that there is a minimum length of PC, which, for our case, corresponds to roughly 6 seconds.

3.4.2. Convolutional Recurrent Model with Mel Spectrogram

A music performance evolves with time and, hence, it is essential to use architectures that are capable of learning the temporal dependencies in data. Deep networks combining convolutional layers with RNNs (referred to as CRNNs) are designed to learn both the temporal and local feature representations. CRNNs were first successfully proposed for sentiment analysis in documents [61] and, since then, have been adopted for other tasks like image classification [62], music transcription [44] and music classification [25].
The M-CRNN uses the MEL input representation and is essentially a CNN with its last layer replaced with an RNN. Using a simple time-frequency representation as an input as compared to the high level PC allows the network to learn features that span across multiple dimensions instead of just pitch. The architecture details are shown in Figure 4b. The three convolutional layers consist of four components each: (i) a 2D convolution layer, (ii) a 2D batch normalization layer, (iii) an exponential linear unit (ELU) activation, and (iv) a 2D max pooling layer. The hyperparameters for each of the layers are shown in Figure 4b. The RNN layer is comprised of a single gated recurrent unit (GRU) layer with a hidden state of dimension 200. GRUs are used as they are simpler in implementation but are equally well-suited to capture long-term dependencies compared to other RNN units such as long short-term memory (LSTMs) (see [63,64] for empirical studies). The hidden state of the last GRU is passed to a fully connected linear layer (with an output dimension of 1) followed by a ReLU activation to obtain the model output.

3.4.3. Hybrid Model Combining Mel-Spectrogram and Pitch Contour Inputs

This model utilizes both the MEL and the PC representations as input. The motivation behind using this model is to leverage multiple input representations with different levels of abstraction. The MEL input representation allows the model to observe a lower level representation of a performance, enabling timbral, harmonic, and temporal features, while the PC input representation is a reduced high-level representation of the performed melody.
The architecture details are shown in Figure 5. In this hybrid model, the last convolutional layer of the PC-FCN model is replaced with a single layer RNN with hidden state size of 16. The hidden states of the last GRU of M-CRNN and the new RNN layer (connected to the modified PC-FCN) are then combined. Since the hidden size of the RNN layer for the two models is different (200 for the M-CRNN compared to 16 for the PC-FCN) and we want the model to equally weight both input representations during the final regression, we apply a fully connected layer after the M-CRNN with an output dimension of 16. Finally, the two outputs are concatenated to produce a 32-dimensional vector. This is passed to a fully connected layer (with an output dimension of 1) followed by a ReLU activation to obtain the hybrid model output.

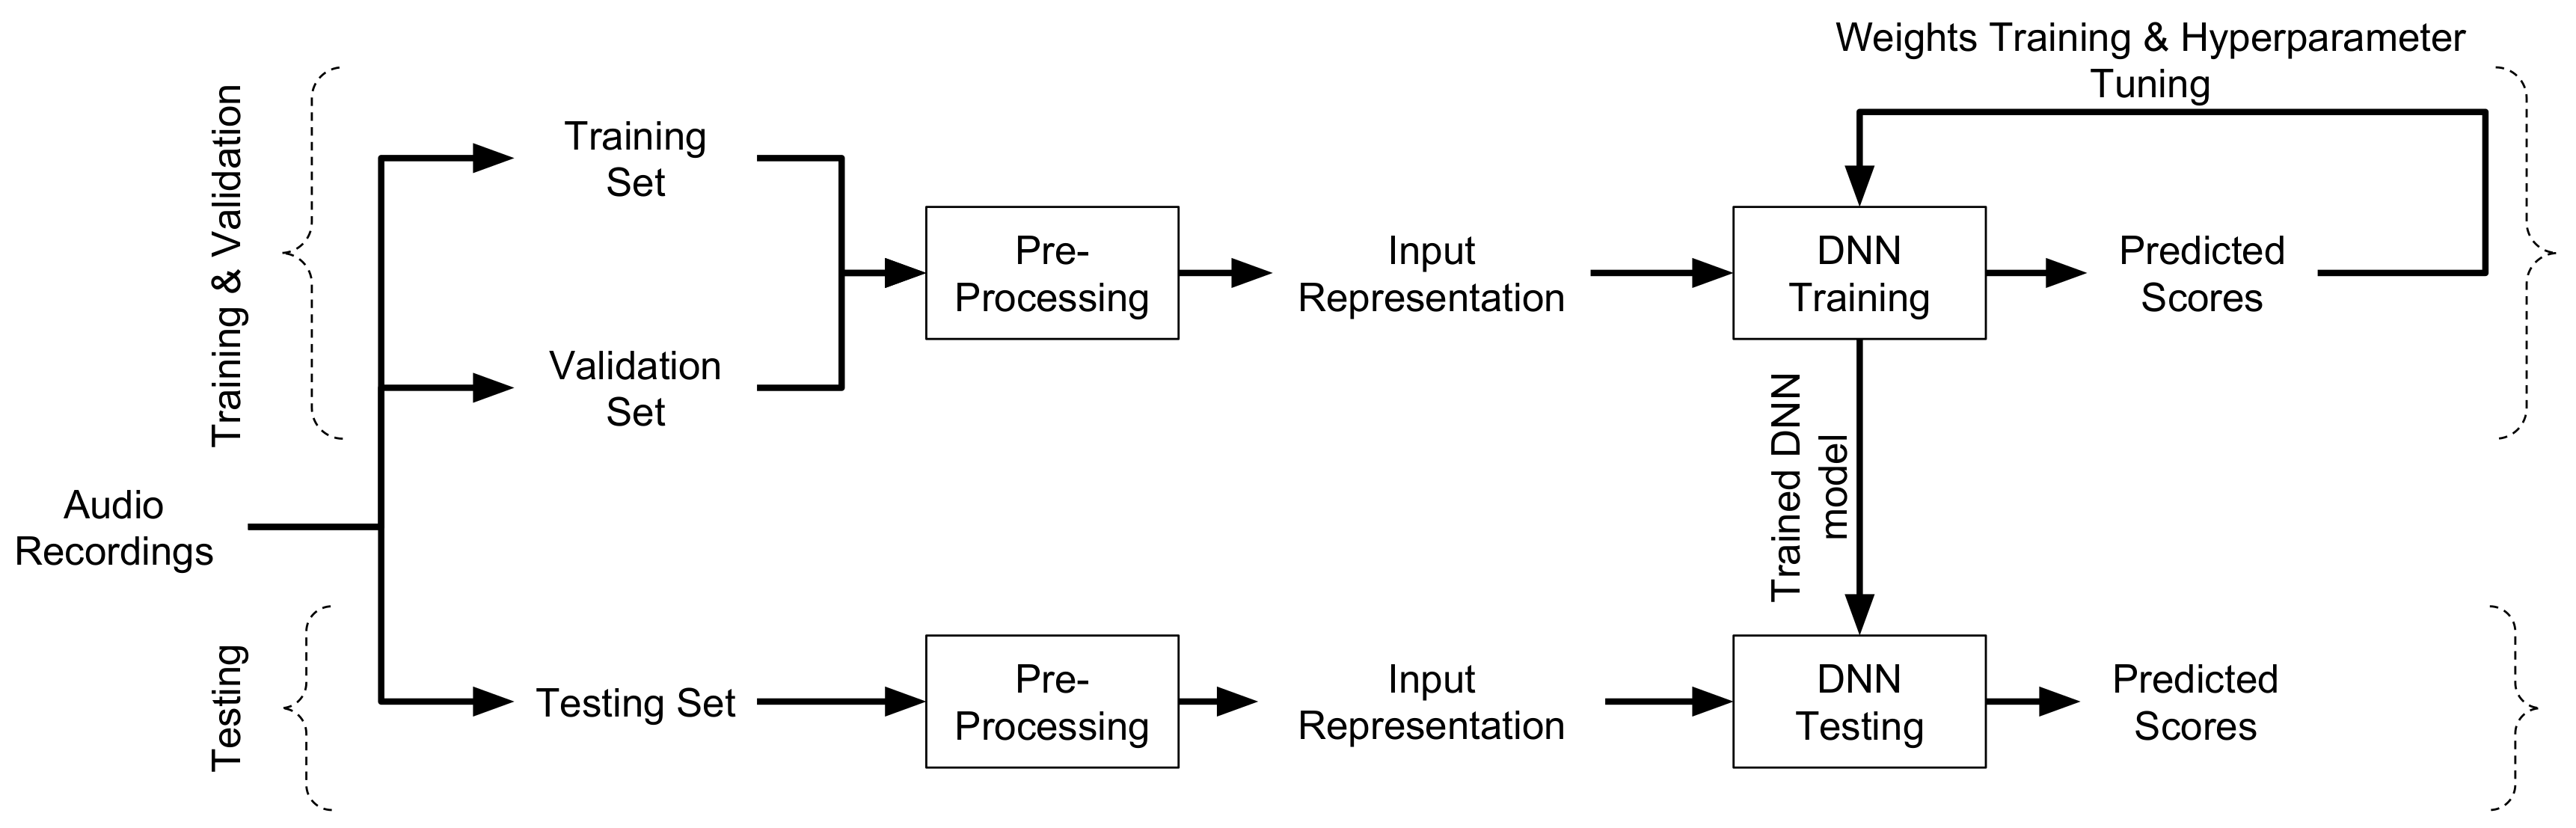
3.5. Deep Neural Network Training Procedure

The DNN models used are implemented using PyTorch [65]. The code for the model classes, scripts for training and testing, and the saved models are available online [66]. A batch-wise training procedure is adopted for DNN training. The training data is divided into mini-batches and model parameters are updated based on the overall loss (mean squared error) calculated per batch. All data-points within a mini-batch are sorted based on their sequence lengths and are appropriately zero-padded to match the length of the data point with the longest sequence length in that mini-batch. The Adam optimization algorithm [67] with a learning rate of 10 4 ( β 1 = 0.9 , β 2 = 0.999 and ϵ = 10 8 ) is used for updating the parameters. Early stopping based on the validation set performance is used to prevent over-fitting.
For the PC based models, additional data augmentation in the training set is carried out by splitting the pitch contours into smaller chunks (of length 1000 , 1500 , 2000 , etc.) while retaining the assessment ratings of the original pitch contour. While it is true that smaller chunks of a musical performance may not have the same assessment rating as the overall performance, we argue that the overall rating is an average of the individual ratings of the respective chunks and, hence, retaining the ratings act as weak labels for the augmented data. Pilot experiments in which the use of this augmented data improved the model performance on the validation set and reduced over-fitting further strengthens this argument.

3.6. Experiments

The experiments are designed to gauge the performance of the DNN models at predicting the ratings given by human judges across the different assessment criteria. Considering the overall difference in musical proficiency across the two categories of students (Symphonic Band versus Middle School), which might influence the way the judges assess them, two separate experiments are designed. The first experiment investigates the performance data of Symphonic Band students from all three of the years and the three instruments combined. The data are randomly shuffled and split into training, validation, and testing sets (using a 80 % , 10 % , and 10 % split). The three DNN models are separately trained for each of the four assessment criteria. The same steps are followed for the second experiment but with data taken from the Middle School recordings.
The performance of the proposed models is compared against an SVR model trained using traditional low-level as well as hand-crafted features as proposed by Wu et al. [18]. It is worth noting that, since the results for their model were obtained using only Middle School Alto Saxophone performances (a subset of the data considered in our experiments), the results reported here differ.
To summarize, the following models are compared and contrasted in the two experiments:
(i)
SVR-BD: SVR model using a feature set that combines both low-level and hand-crafted features. The low-level features are comprised of standard spectral and temporal features such as MFCCs, spectral flux, spectral centroid, spectral roll-off, zero-crossing rate, etc. The hand-crafted features, on the other hand, model note-level features such as note steadiness and amplitude deviations, as well as performance level features such as average accuracy, percentage of correct notes, and timing accuracy. The dimensionality of the combined feature set is 92 (68 for low-level, 24 for hand-crafted).
(ii)
PC-FCN: Fully convolutional model with the PC representation as the input.
(iii)
M-CRNN: Convolutional recurrent model with the MEL representation as the input.
(iv)
PCM-CRNN: Hybrid model that leverages both the PC and MEL input representations.

3.7. Evaluation Metrics
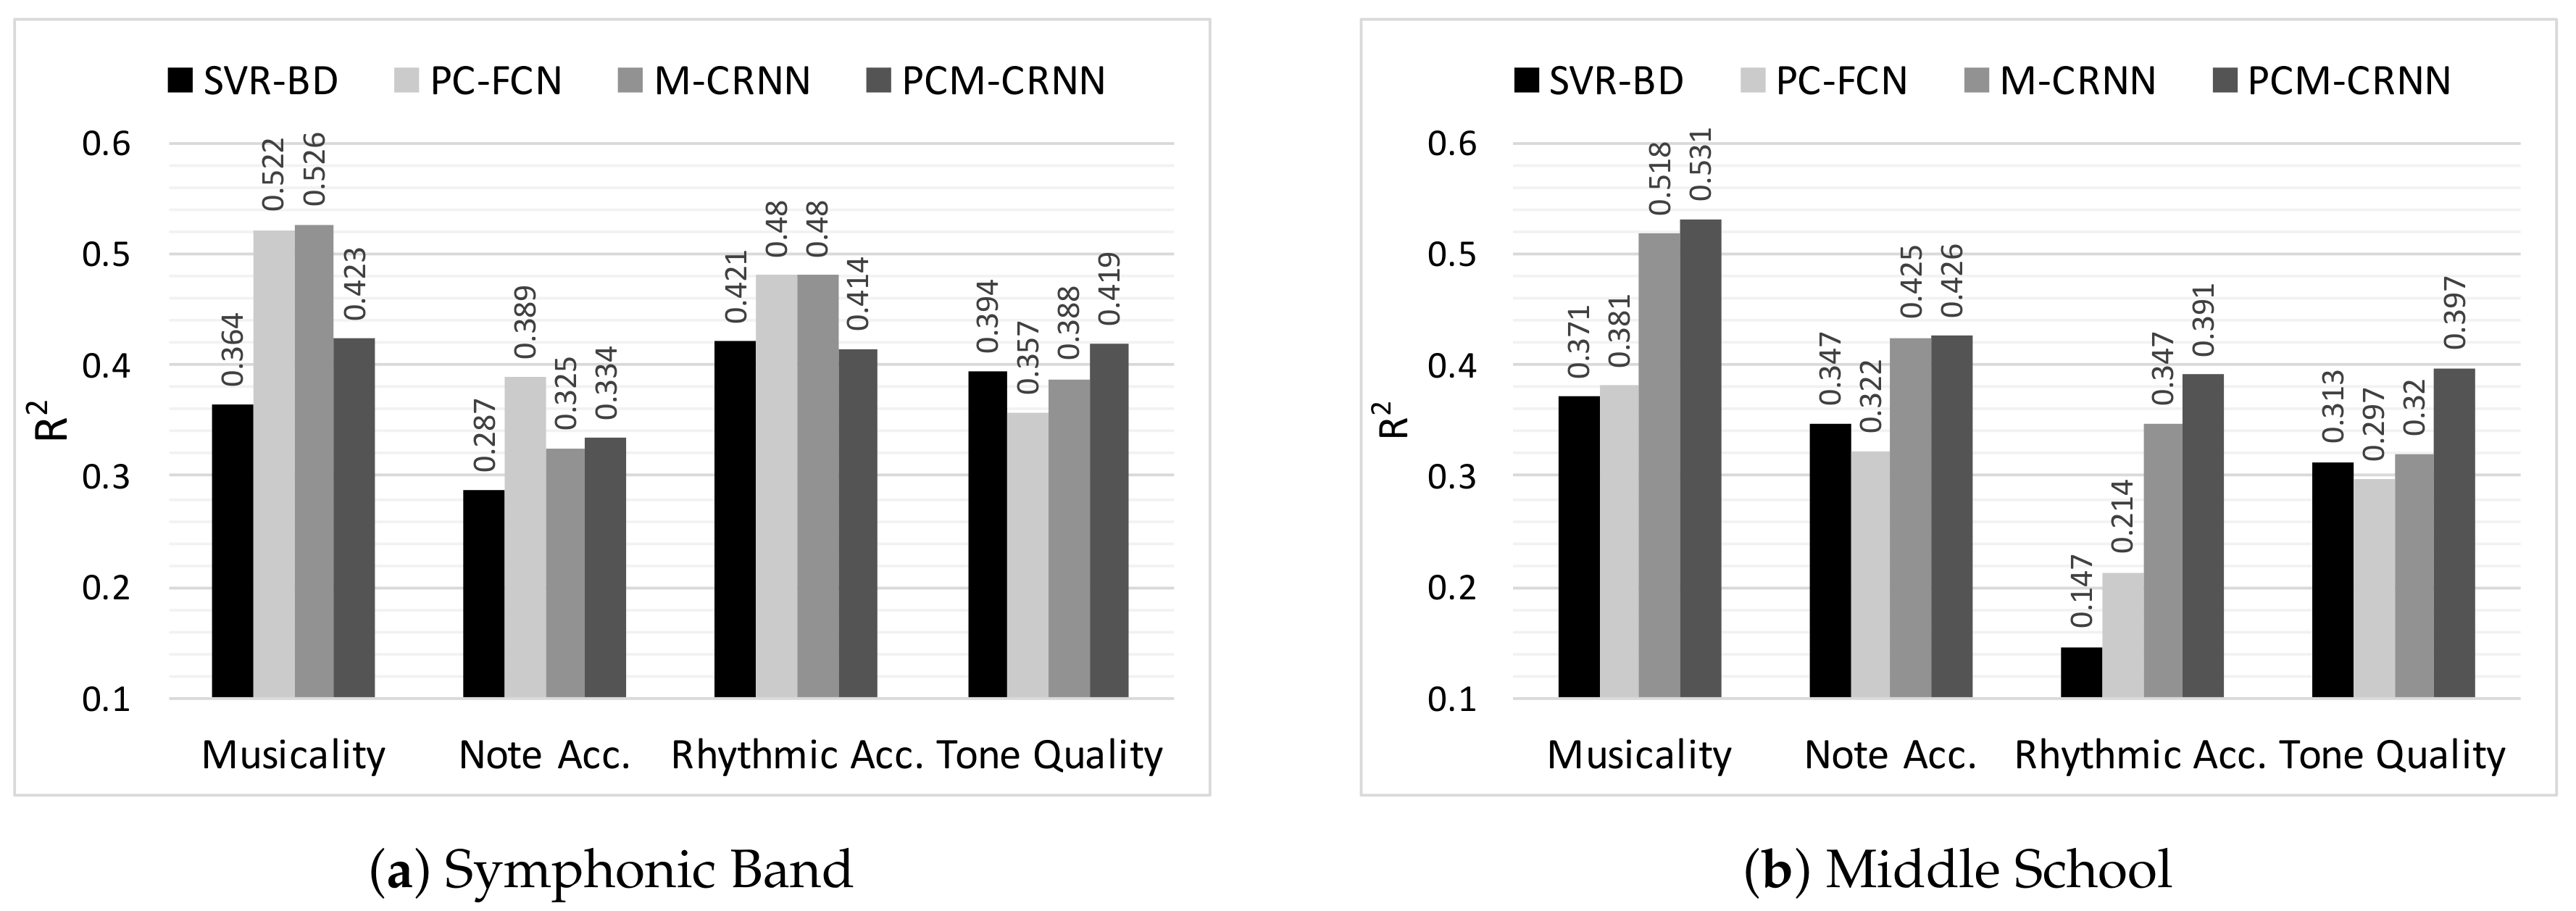
The models are evaluated on the test set using the following standard statistical metrics: the coefficient of determination ( R 2 ) and the Pearson correlation coefficient ( ρ ). While R 2 is an estimate of the goodness of fit of a model and explains how closely predicted values are aligned with the observed values, ρ is a measure of the linear correlation between two sets of variables (which in this case are the model predictions and the ground truth). Detailed mathematical formulations of both metrics can be found in [68].

4. Results

The performance of the investigated models are shown in Figure 6 ( R 2 metric) and Table 2 ( ρ metric). All of the correlation results are significant with p-values 0.05 .
The following observations and inferences can be made from the results:
(i)
For both student categories and for all assessment criteria, the SVR model is always outperformed by at least one of the DNN models. This holds true for both evaluation metrics. This suggests that deep architectures are able to extract more (musically) meaningful information from the data than standard and hand-crafted features.
(ii)
The best performance is observed for the assessment of Musicality. For both student categories, the best DNN models show clear superior performance compared to the SVR-BD model. It is worth noting that, among all the assessment criteria, Musicality is probably the most abstract and difficult to define. This makes feature engineering for Musicality rather difficult. The better performance of DNNs at this assessment criterion further indicates the capability of feature learning methods to model abstract concepts by learning patterns in data. Within the DNN models, those using RNNs consistently perform better for both student categories (except for PCM-CRNN for Symphonic Band). This shows the benefits of capturing temporal information for modeling this assessment criterion.
(iii)
The PC-FCN model outperforms the other DNN models in the case of Note Accuracy for the Symphonic Band. As Symphonic Band students show a generally higher musical proficiency than Middle School students, one possible reason for this could be that as the proficiency level of the students increases, the high level melodic information encoded in the pitch contour becomes more important in the assessment process. It is also worth noting that the musical scores performed by the Symphonic Band students are considerably more complex than the Middle School students in terms of note density and distribution across the scales. We discuss this further in Section 5.
(iv)
For the Tone Quality criterion, the DNN models show only minor improvement over the baseline SVR-BD model. This could possibly be explained by the spectral features (MFCCs, etc.), which are already very efficient at capturing timbral information and, thus, cannot be easily outperformed by learned features. The relatively poor performance of PC-FCN at this criterion is expected, given that the pitch contour computation process discards all timbre information; hence, the model has no relevant information to begin with. However, the performance of the MEL input based models (M-CRNN and PCM-CRNN) suggests that DNNs are able to learn useful features for this criteria from the MEL input representation.
(v)
For Middle School, the PCM-CRNN hybrid model performs at par or better than all other models and across all assessment criteria. This is expected since it observes both high level and low level representations as input and therefore draws from more data to learn better features. However, the performance of this model falls below expectation in the first three assessment criteria for Symphonic Band. This requires further investigation as there is no obvious explanation.
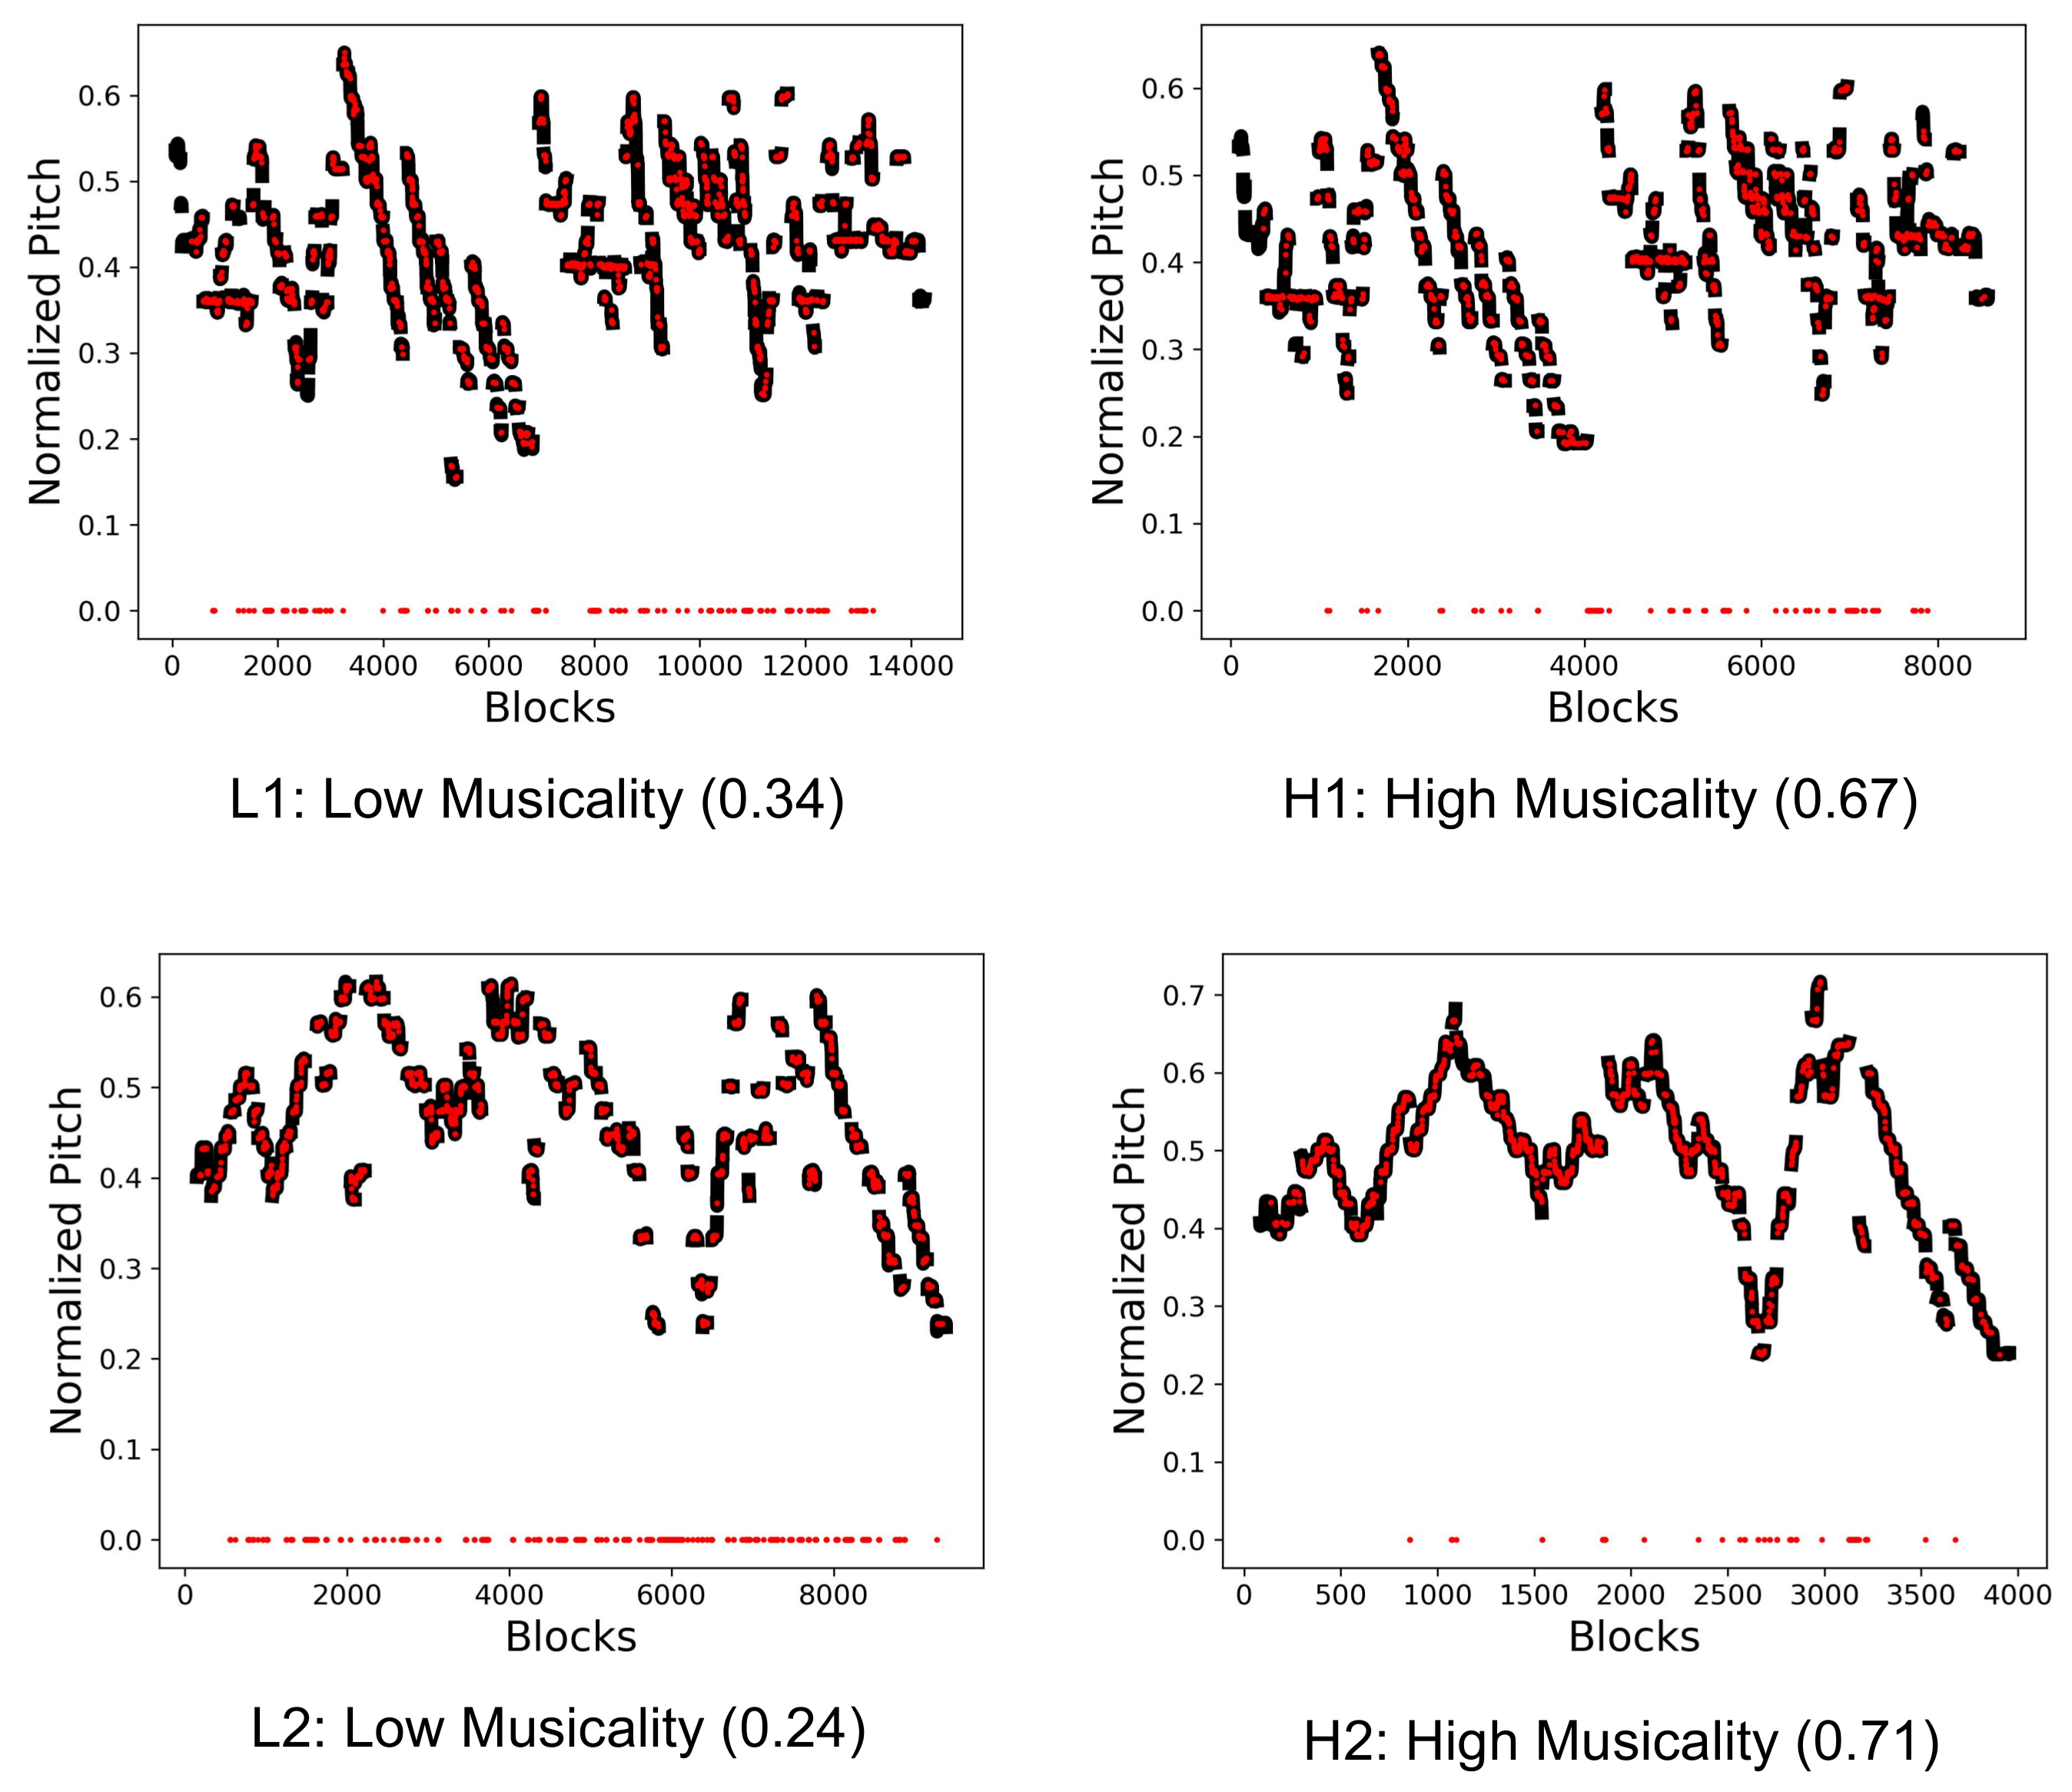
While the performance of the proposed models is significantly better than previously used methods, it is not robust enough for use in practical applications. Peak R 2 0.5 shows that the models are currently able to only explain around 50 % of the variance in the data and more work is needed to improve the performance before they can be deployed in applications, which can be directly used by students.

5. Model Analysis

In order to better explain the model predictions and explore the feature learning process further, we take a closer look at the PC-FCN model. We do not use the other larger models because they have high dimensionality in the feature space, which makes analysis using the tools mentioned below difficult. The PC-FCN model is suitable for our analysis because of its simpler architecture and smaller size, which enables easier and interpretable analysis.
The 1st convolutional layer (referred to as conv1) has a 1-dimensional kernel of size 7 and a channel width of 4. This weight matrix is flattened into a 28 × 1 dimensional vector and is extracted individually for the trained models for all four assessment criteria and for both student categories. Subsequently, pair-wise Cosine distance is computed between the eight vectors. The resulting distance matrix is shown as a plot in Figure 7. An interesting observation from the plot is that, for the Symphonic Band, conv1 weight vectors for the Musicality, Note Accuracy and Rhythmic Accuracy models (s-M, s-N, s-R) are very closely aligned (see the top 3 × 3 square in Figure 7), which indicates that even though these models are trained for different criteria, the features learned by conv1 are similar. In addition, the effectiveness of these weights is clear: PC-FCN is the best (or close to the best) performing model (based on the R 2 metric) for the three criteria under consideration. However, the same cannot be said for the Middle School conv1 layers. This hints in favor of our earlier conjecture that the high level melodic encoding inherent in the PC representation might be more important for assessing students with higher musical proficiency and while performing more complex scores. Within a particular student category, the correlation amongst the ground truth ratings for different assessment criteria tend to indicate the same. For example, for Symphonic Band, the correlation between Musicality and Note Accuracy is 0.75 , whereas, for Middle School, it is 0.60 .
A second observation from Figure 7 is that, for Musicality, conv1 layers of both student categories are closely aligned, which is not the case for the other assessment criteria. This suggests that there is potential for transfer learning for the Musicality criteria, i.e., a model trained on one set of students can be used to test another with suitable modifications. To test out this hypothesis, a short cross-category experiment is conducted where the PC-FCN models trained on Middle School are tested on Symphonic Band and vice versa. We obtain an R 2 = 0.193 for testing the Middle school model on Symphonic Band and an R 2 = 0.106 the other way around. While these results are not impressive, it is worth noting that results of this cross category testing for Note Accuracy and Rhythmic Accuracy were far worse with an average R 2 = 0.765 . This shows that Musicality as an abstract general concept can be potentially modeled using data from different student categories.
The saliency maps for a few specific input examples are investigated next. Saliency maps provide a way to visualize which input features affect the prediction of the DNN models to a greater degree [69,70]. The computation process for saliency maps is fairly straightforward. The model prediction is first computed via a forward pass through the trained DNN and then the gradient of the prediction is computed with respect to the input. The input features with high values of gradients are the ones to which the model prediction is most sensitive. A detailed mathematical formulation can be found in [70].
In the context of this work, we can use saliency maps to visualize which parts of an input pitch contour the model prediction is most sensitive to. The following analysis is again based on the PC-FCN model for the Musicality criterion. The saliency maps are shown in Figure 8. The input pitch contour is shown in black while the salient parts of the input are shown in red. On the left, there are two specific examples of Bb Clarinet performances from the 2014 Symphonic Band test set: student H1 who gets a relatively high Musicality rating (0.6) and student L1 who gets a low rating (0.35). These recordings are chosen due to their low prediction errors and a considerable difference between the assessment ratings. The contours themselves do not seem to reveal any obvious patterns; however, one interesting observation can be made: when compared to the pitch contour of student H1 (with the higher rating), there is a higher saliency of rests (0 value along the y-axis) in student L1’s pitch contour (with the low rating). A similar observation is also made for two other students from Middle school (Bb Clarinet, 2013) who have an even higher difference in Musicality ratings. The saliency maps are shown on the right of Figure 8. This can be explained through the impact of unwarranted repeated breaks during a performance that would tend to reduce an assessor’s perceptual rating of Musicality. Moreover, there might be a correlation between students who make mistakes during the performance and students with a high number of breaks.

6. Conclusions

Music performance assessment is a broad research area that deals with understanding, modeling, and characterizing several aspects of a music performance. This article explores the use of DNNs for assessing performances of pitched wind instruments for two student categories at different proficiency levels. Specifically, we train DNN based regression models for the prediction of assessments given by expert human judges across several subjective assessment criteria. Two different DNN architectures are proposed for the task: (i) a fully convolutional model using pitch contours as input, and (ii) a convolutional recurrent model using Mel spectrogram as input. The two proposed input representations are chosen with the intent to respectively encode high level melodic content and low level information spanning multiple dimensions. While the melodic information encoded in pitch contours enables better characterization of Musicality and Note Accuracy, timbral information in Mel spectrograms aids assessment of Tone Quality. A third hybrid model combining the above architectures is also proposed, which tries to leverage features learned from both input representations. The proposed DNN models outperform a baseline model using low-level and hand-designed features across all four assessment criteria (Musicality, Note Accuracy, Rhythmic Accuracy and Tonality) for both evaluation metrics ( R 2 and ρ ). This is observed for both student categories. Finally, in order to explain the model predictions and understand the feature learning process in a better way, model analysis techniques are used. These techniques help explain the effectiveness of pitch contours as input representation for assessing students at a higher proficiency level and show that abstract concepts like Musicality share features across student categories. To summarize, our key contributions include:
(i)
We introduce DNN based architectures for the music performance assessment task. The experimental results show the overall promise of using supervised feature learning methods for this task and the shortcomings of traditional approaches in describing music performances.
(ii)
We compare and contrast input data representations at different levels of abstraction and show that information encoded by each is critical for different assessment criteria.
(iii)
Compared to the baseline, we are able to show considerable improvement in model performance. For Musicality, which is arguably the most abstract assessment criterion, we demonstrate clear superior performance of the DNN models.
(iv)
We use model analysis techniques such as filter distance measures and saliency maps to explain the model predictions and further our understanding of the performance assessment process in general.
While the results are encouraging, they are not reliable enough for use in practical applications to provide feedback to students. The following avenues for future work might help improve the system:
(i)
Developing better input representations: Constant Q-Transforms have shown good results with other MIR tasks [28] and are thus a potential candidate for a low level representation. In addition, augmenting the pitch contours with the amplitude variations or pitch saliency could be a simple and yet effective way to encode dynamics. Another potential direction could be to switch to a raw time-domain input representation. While input representations help condense information, which facilitates feature learning, information that might be otherwise useful is discarded during their computation process. Examples include the loss of timbral and dynamic information during the pitch extraction process or the loss of the phase in a magnitude spectrum. Therefore, learning from raw audio—though challenging—presents opportunities to not only improve the performance of the models at this task, but also further our understanding of music perception in general.
(ii)
Adding the musical score: Although the human judges have access to the score that the students are performing, the DNN models do not. It would be of interest to design a model that allows encoding the score information in the input representation.
(iii)
Improving the training data: While we use the concept of weak labels to improve model training by increasing the amount of data available, other more popular data augmentation methods such as pitch shifting can be used to potentially increase the models’ robustness. Adding performances from other instruments to increase the available data is also an option, but requires adequate care to avoid bias towards a particular class of instruments. Given enough data, an alternative option would be to train instrument specific models, which can then capture the nuances and assessment criteria of the individual instruments better.
(iv)
Modifying the training methodology: Since the models are trained on one dataset with a limited number of instruments, they cannot be directly used on other music performance datasets. However, based on our preliminary cross-category analysis results, transfer learning [71] could be an option for certain assessment criteria and warrants further investigation.
(v)
Investigating alternative model analysis techniques: Along with the techniques used in this article, other model analysis techniques such as layer-wise relevance propagation [70] can be explored to further improve our understanding of the feature learning process. Improving the interpretability of DNNs is an active area of research in the Artificial Intelligence community and more efforts are needed to build better tools targeting music and general audio-based tasks.
(vi)
Combining multiple modalities: A music performance mostly caters to the auditory sense. However, visual cues such as gestures form a significant component of a music performance, which might influence the perception of expressiveness [72,73]. Using multi-modal input representations, which encode both auditory and visual information can provide several interesting possibilities for future research.
In this study, we show that DNNs are a promising tool for building computational models that can enable researchers to explore the area of music performance analysis in new and interesting ways. While considerable research still needs to be done before we can develop a comprehensive understanding of various aspects of a musical performance, our ability to interpret the models and to learn from feature representations will continue to be a critical factor in this endeavor.

Acknowledgments

The authors would like to thank the Florida Bandmasters Association for providing the dataset used in this study. We also gratefully acknowledge NVIDIA Corporation (Santa Clara, CA, United States) who supported this research by providing a Titan X GPU via the NVIDIA GPU Grant program.

Author Contributions

A.P., S.G. and A.L. conceived and designed the experiments; A.P. and S.G. implemented the models, performed the experiments, and analyzed the data; A.P., S.G. and A.L. wrote the paper.

Conflicts of Interest

The authors declare no conflict of interest.

References

  1. Palmer, C. Music performance. Ann. Rev. Psychol. 1997, 48, 115–138. [Google Scholar] [CrossRef] [PubMed]
  2. Bloom, B.S. Taxonomy of Educational Objectives; McKay: New York, NY, USA, 1956; pp. 20–24. [Google Scholar]
  3. Wesolowski, B.C.; Wind, S.A.; Engelhard, G. Examining rater precision in music performance assessment: An analysis of rating scale structure using the Multifaceted Rasch Partial Credit Model. Music Percept. 2016, 33, 662–678. [Google Scholar] [CrossRef]
  4. Thompson, S.; Williamon, A. Evaluating evaluation: Musical performance assessment as a research tool. Music Percept. 2003, 21, 21–41. [Google Scholar] [CrossRef]
  5. Schedl, M.; Gómez, E.; Urbano, J. Music information retrieval: Recent developments and applications. Found. Trends Inf. Retr. 2014, 8, 127–261. [Google Scholar] [CrossRef]
  6. De Cheveigné, A.; Kawahara, H. YIN, a fundamental frequency estimator for speech and music. J. Acoust. Soc. Am. 2002, 111, 1917–1930. [Google Scholar] [CrossRef] [PubMed]
  7. Gerhard, D. Pitch Extraction and Fundamental Frequency: History and Current Techniques; TR-CS 2003-06; Department of Computer Science, University of Regina: Regina, SK, Canada, 2003. [Google Scholar]
  8. Benetos, E.; Dixon, S.; Giannoulis, D.; Kirchhoff, H.; Klapuri, A. Automatic music transcription: Challenges and future directions. J. Intell. Inf. Syst. 2013, 41, 407–434. [Google Scholar] [CrossRef]
  9. Ryynänen, M.P.; Klapuri, A.P. Automatic transcription of melody, bass line, and chords in polyphonic music. Comput. Music J. 2008, 32, 72–86. [Google Scholar] [CrossRef]
  10. Huang, P.S.; Kim, M.; Hasegawa-Johnson, M.; Smaragdis, P. Singing-Voice Separation from Monaural Recordings using Deep Recurrent Neural Networks. In Proceedings of the International Society of Music Information Retrieval Conference (ISMIR), Taipei, Taiwan, 27–31 October 2014; pp. 477–482. [Google Scholar]
  11. Nakano, T.; Goto, M.; Hiraga, Y. An automatic singing skill evaluation method for unknown melodies using pitch interval accuracy and vibrato features. In Proceedings of the International Conference on Spoken Language Processing (ICSLP), Pittsburgh, PA, USA, 17–21 September 2006; pp. 1706–1709. [Google Scholar]
  12. Knight, T.; Upham, F.; Fujinaga, I. The potential for automatic assessment of trumpet tone quality. In Proceedings of the International Society of Music Information Retrieval Conference (ISMIR), Miami, FL, USA, 24–18 October 2011; pp. 573–578. [Google Scholar]
  13. Dittmar, C.; Cano, E.; Abeßer, J.; Grollmisch, S. Music Information Retrieval Meets Music Education. In Multimodal Music Processing; Müller, M., Goto, M., Schedl, M., Eds.; Dagstuhl Follow-Ups Series; Schloss Dagstuhl-Leibniz-Zentrum fuer Informatik: Wadern, Germany, 2012; Volume 3. [Google Scholar]
  14. Abeßer, J.; Hasselhorn, J.; Dittmar, C.; Lehmann, A.; Grollmisch, S. Automatic quality assessment of vocal and instrumental performances of ninth-grade and tenth-grade pupils. In Proceedings of the International Symposium on Computer Music Multidisciplinary Research (CMMR), Marseille, France, 15–18 October 2013. [Google Scholar]
  15. Romani Picas, O.; Parra Rodriguez, H.; Dabiri, D.; Tokuda, H.; Hariya, W.; Oishi, K.; Serra, X. A Real-Time System for Measuring Sound Goodness in Instrumental Sounds. In Proceedings of the 138th Audio Engineering Society Convention, Warsaw, Poland, 7–10 May 2015. [Google Scholar]
  16. Luo, Y.J.; Su, L.; Yang, Y.H.; Chi, T.S. Detection of Common Mistakes in Novice Violin Playing. In Proceedings of the International Society of Music Information Retrieval Conference (ISMIR), Taipei, Taiwan, 27–31 October 2015; pp. 316–322. [Google Scholar]
  17. Li, P.C.; Su, L.; Yang, Y.H.; Su, A.W. Analysis of Expressive Musical Terms in Violin Using Score-Informed and Expression-Based Audio Features. In Proceedings of the International Society of Music Information Retrieval Conference (ISMIR), Taipei, Taiwan, 27–31 October 2015; pp. 809–815. [Google Scholar]
  18. Wu, C.W.; Gururani, S.; Laguna, C.; Pati, A.; Vidwans, A.; Lerch, A. Towards the Objective Assessment of Music Performances. In Proceedings of the International Conference on Music Perception and Cognition (ICMPC), San Francisco, CA, USA, 5–9 July 2016; pp. 99–103. [Google Scholar]
  19. Vidwans, A.; Gururani, S.; Wu, C.W.; Subramanian, V.; Swaminathan, R.V.; Lerch, A. Objective descriptors for the assessment of student music performances. In Proceedings of the AES International Conference on Semantic Audio, Audio Engineering Society, Erlangen, Germany, 22–24 June 2017. [Google Scholar]
  20. Bozkurt, B.; Baysal, O.; Yuret, D. A Dataset and Baseline System for Singing Voice Assessment. In Proceedings of the International Symposium on Computer Music Multidisciplinary Research (CMMR), Matosinhos, Portugal, 25–28 September 2017; pp. 430–438. [Google Scholar]
  21. Yousician. Available online: https://www.yousician.com (accessed on 28 February 2018).
  22. Smartmusic. Available online: https://www.smartmusic.com (accessed on 28 February 2018).
  23. Wu, C.W.; Lerch, A. Learned Features for the Assessment of Percussive Music Performances. In Proceedings of the International Conference on Semantic Computing (ICSC), Laguna Hills, CA, USA, 31 January–2 February 2018. [Google Scholar]
  24. Csáji, B.C. Approximation with Artificial Neural Networks. Master’s Thesis, Etvs Lornd University, Budapest, Hungary, 2001. [Google Scholar]
  25. Choi, K.; Fazekas, G.; Sandler, M.; Cho, K. Convolutional recurrent neural networks for music classification. In Proceedings of the International Conference on Acoustics, Speech and Signal Processing (ICASSP), New Orleans, LA, USA, 5–9 March 2017; pp. 2392–2396. [Google Scholar]
  26. Chandna, P.; Miron, M.; Janer, J.; Gómez, E. Monoaural audio source separation using deep convolutional neural networks. In Proceedings of the International Conference on Latent Variable Analysis and Signal Separation (LVA/ICA), Grenoble, France, 21–23 Feburary 2017; pp. 258–266. [Google Scholar]
  27. Luo, Y.; Chen, Z.; Hershey, J.R.; Le Roux, J.; Mesgarani, N. Deep clustering and conventional networks for music separation: Stronger together. In Proceedings of the International Conference on Acoustics, Speech and Signal Processing (ICASSP), New Orleans, LA, USA, 5–9 March 2017; pp. 61–65. [Google Scholar]
  28. Bittner, R.M.; McFee, B.; Salamon, J.; Li, P.; Bello, J.P. Deep salience representations for f0 estimation in polyphonic music. In Proceedings of the International Society for Music Information Retrieval Conference (ISMIR), Suzhou, China, 23–27 October 2017; pp. 23–27. [Google Scholar]
  29. Clarke, E. Understanding the Psychology of Performance. In Musical Performance: A Guide to Understanding; Cambridge University Press: Cambridge, UK, 2002; pp. 59–72. [Google Scholar]
  30. Lerch, A. Software-Based Extraction of Objective Parameters From Music Performances. Ph.D. Thesis, Technical University of Berlin, Berlin, Germany, 2008. [Google Scholar]
  31. Palmer, C. Mapping musical thought to musical performance. J. Exp. Psychol. 1989, 15, 331. [Google Scholar] [CrossRef]
  32. Repp, B.H. Patterns of note onset asynchronies in expressive piano performance. J. Acoust. Soc. Am. 1996, 100, 3917–3932. [Google Scholar] [CrossRef] [PubMed]
  33. Dixon, S.; Goebl, W. Pinpointing the beat: Tapping to expressive performances. In Proceedings of the 7th International Conference on Music Perception and Cognition (ICMPC), Sydney, Australia, 17–21 July 2002; pp. 617–620. [Google Scholar]
  34. Seashore, C.E. The psychology of music. Music Educ. J. 1936, 23, 20–22. [Google Scholar] [CrossRef]
  35. Allvin, R.L. Computer-assisted music instruction: A look at the potential. J. Res. Music Educ. 1971, 19, 131–143. [Google Scholar] [CrossRef]
  36. Humphrey, E.J.; Bello, J.P.; LeCun, Y. Moving Beyond Feature Design: Deep Architectures and Automatic Feature Learning in Music Informatics. In Proceedings of the International Soceity of Music Information Retrieval Conference (ISMIR), Porto, Portugal, 8–12 October 2012; pp. 403–408. [Google Scholar]
  37. LeCun, Y.; Bengio, Y. Convolutional networks for images, speech, and time series. In The Handbook of Brain Theory and Neural Networks; MIT Press: Cambridge, MA, USA, 1995. [Google Scholar]
  38. Krizhevsky, A.; Sutskever, I.; Hinton, G.E. Imagenet classification with deep convolutional neural networks. In Proceedings of the Advances in Neural Information Processing Systems (NIPS), Lake Tahoe, NV, USA, 3–8 December 2012; pp. 1097–1105. [Google Scholar]
  39. Sainath, T.N.; Mohamed, A.-R.; Kingsbury, B.; Ramabhadran, B. Deep convolutional neural networks for LVCSR. In Proceedings of the 2013 IEEE International Conference on Acoustics, Speech and Signal Processing (ICASSP), Vancouver, BC, Canada, 26–31 May 2013; pp. 8614–8618. [Google Scholar]
  40. Ullrich, K.; Schlüter, J.; Grill, T. Boundary Detection in Music Structure Analysis using Convolutional Neural Networks. In Proceedings of the International Society for Music Information Retrieval Conference (ISMIR), Utrecht, The Netherlands, 9–13 August 2014; pp. 417–422. [Google Scholar]
  41. Choi, K.; Fazekas, G.; Sandler, M. Automatic tagging using deep convolutional neural networks. In Proceedings of the International Society of Music Information Retrieval Conference (ISMIR), New York City, NY, USA, 8–11 August 2016; pp. 805–811. [Google Scholar]
  42. Korzeniowski, F.; Widmer, G. A fully convolutional deep auditory model for musical chord recognition. In Proceedings of the International Workshop on Machine Learning for Signal Processing (MLSP), Salerno, Italy, 13–16 September 2016; pp. 1–6. [Google Scholar]
  43. Medsker, L.; Jain, L. Recurrent neural networks. In Design and Applications; CRC Press: London, UK, 2001. [Google Scholar]
  44. Sigtia, S.; Benetos, E.; Dixon, S. An end-to-end neural network for polyphonic piano music transcription. IEEE/ACM Trans. Audio Speech Lang. Process. 2016, 24, 927–939. [Google Scholar] [CrossRef]
  45. Han, Y.; Lee, K. Hierarchical approach to detect common mistakes of beginner flute players. In Proceedings of the International Society of Music Information Retrieval Conference (ISMIR), Curitiba, Brazil, 4–8 November 2014; pp. 77–82. [Google Scholar]
  46. Olshausen, B.A.; Field, D.J. Sparse coding with an overcomplete basis set: A strategy employed by V1? Vis. Res. 1997, 37, 3311–3325. [Google Scholar] [CrossRef]
  47. Harpur, G.F.; Prager, R.W. Development of low entropy coding in a recurrent network. Comput. Neural Syst. 1996, 7, 277–284. [Google Scholar] [CrossRef] [PubMed]
  48. Ngiam, J.; Chen, Z.; Bhaskar, S.A.; Koh, P.W.; Ng, A.Y. Sparse filtering. In Proceedings of the Advances in Neural Information Processing Systems (NIPS), Granada, Spain, 12–17 December 2011; pp. 1125–1133. [Google Scholar]
  49. Salamon, J.; Gómez, E. Melody extraction from polyphonic music signals using pitch contour characteristics. IEEE/ACM Trans. Audio Speech Lang. Process. 2012, 20, 1759–1770. [Google Scholar] [CrossRef]
  50. Bregman, A.S. Auditory Scene Analysis: The Perceptual Organization of Sound; MIT Press: Cambridge, MA, USA, 1990. [Google Scholar]
  51. Bittner, R.M.; Salamon, J.; Bosch, J.J.; Bello, J.P. Pitch Contours as a Mid-Level Representation for Music Informatics. In Proceedings of the AES International Conference on Semantic Audio, Audio Engineering Society, Erlangen, Germany, 22–24 June 2017. [Google Scholar]
  52. Mauch, M.; Dixon, S. pYIN: A fundamental frequency estimator using probabilistic threshold distributions. In Proceedings of the IEEE International Conference on Acoustics, Speech and Signal Processing (ICASSP), Florence, Italy, 4–9 May 2014; pp. 659–663. [Google Scholar]
  53. Moore, B.C. An Introduction to the Psychology of Hearing; Brill: Leiden, The Netherlands, 2012. [Google Scholar]
  54. Schluter, J.; Bock, S. Improved musical onset detection with convolutional neural networks. In Proceedings of the IEEE International Conference on Acoustics, Speech and Signal Processing (ICASSP), Florence, Italy, 4–9 May 2014; pp. 6979–6983. [Google Scholar]
  55. Van den Oord, A.; Dieleman, S.; Schrauwen, B. Deep content-based music recommendation. In Proceedings of the Advances in Neural Information Processing Systems (NIPS), Lake Tahoe, NV, USA, 4–11 December 2013; pp. 2643–2651. [Google Scholar]
  56. McFee, B.; Raffel, C.; Liang, D.; Ellis, D.P.; McVicar, M.; Battenberg, E.; Nieto, O. Librosa: Audio and music signal analysis in python. In Proceedings of the 14th Python in Science Conference, Austin, TX, USA, 6–12 July 2015; pp. 18–25. [Google Scholar]
  57. Matan, O.; Burges, C.J.; LeCun, Y.; Denker, J.S. Multi-digit recognition using a space displacement neural network. In Proceedings of the Advances in Neural Information Processing Systems (NIPS), San Francisco, CA, USA, 30 November–3 December 1992; pp. 488–495. [Google Scholar]
  58. Wolf, R.; Platt, J.C. Postal address block location using a convolutional locator network. In Proceedings of the Advances in Neural Information Processing Systems, Denver, CO, USA, 28 November–1 December 1994; pp. 745–752. [Google Scholar]
  59. Long, J.; Shelhamer, E.; Darrell, T. Fully convolutional networks for semantic segmentation. In Proceedings of the Conference on Computer Vision and Pattern Recognition (CVPR), Boston, MA, USA, 7–12 June 2015; pp. 3431–3440. [Google Scholar]
  60. Ioffe, S.; Szegedy, C. Batch normalization: Accelerating deep network training by reducing internal covariate shift. In Proceedings of the International Conference on Machine Learning (ICML), New York City, NY, USA, 19–24 June 2015; pp. 448–456. [Google Scholar]
  61. Tang, D.; Qin, B.; Liu, T. Document modeling with gated recurrent neural network for sentiment classification. In Proceedings of the 2015 Conference on Empirical Methods in Natural Language Processing (EMNLP), Lisbon, Portugal, 17–21 September 2015; pp. 1422–1432. [Google Scholar]
  62. Zuo, Z.; Shuai, B.; Wang, G.; Liu, X.; Wang, X.; Wang, B.; Chen, Y. Convolutional recurrent neural networks: Learning spatial dependencies for image representation. In Proceedings of the Conference on Computer Vision and Pattern Recognition Workshop (CVPRW), Boston, MA, USA, 7–12 June 2015; pp. 18–26. [Google Scholar]
  63. Chung, J.; Gulcehre, C.; Cho, K.; Bengio, Y. Empirical evaluation of gated recurrent neural networks on sequence modeling. arXiv. 2014. Available online: https://arxiv.org/abs/1412.3555 (accessed on 28 February 2018).
  64. Jozefowicz, R.; Zaremba, W.; Sutskever, I. An empirical exploration of recurrent network architectures. In Proceedings of the International Conference on Machine Learning, Lille, France, 6–11 July 2015; pp. 2342–2350. [Google Scholar]
  65. Paszke, A.; Gross, S.; Chintala, S.; Chanan, G. PyTorch: Tensors and dynamic neural networks in Python with strong GPU Acceleration. Available online: http://pytorch.org (accessed on 28 February 2018).
  66. Pati, K.A.; Gururani, S. MusicPerfAssessment. Available online: https://github.com/ashispati/MusicPerfAssessment (accessed on 28 February 2018).
  67. Kingma, D.P.; Ba, J. Adam: A method for stochastic optimization. arXiv. 2014. Available online: https://arxiv.org/abs/1412.6980 (accessed on 28 February 2018).
  68. McClave, J.T.; Sincich, T. Statistics, 9th ed.; Prentice Hall: Upper Saddle River, NJ, USA, 2003. [Google Scholar]
  69. Simonyan, K.; Vedaldi, A.; Zisserman, A. Deep inside convolutional networks: Visualising image classification models and saliency maps. arXiv. 2013. Available online: https://arxiv.org/abs/1312.6034 (accessed on 28 February 2018).
  70. Montavon, G.; Samek, W.; Müller, K.R. Methods for interpreting and understanding deep neural networks. Digit. Signal Process. 2017, 73, 1–15. [Google Scholar] [CrossRef]
  71. Choi, K.; Fazekas, G.; Sandler, M.; Cho, K. Transfer learning for music classification and regression tasks. In Proceedings of the International Society of Music Information Retrieval Conference (ISMIR), Suzhou, China, 23–27 October 2017; pp. 141–149. [Google Scholar]
  72. Thompson, W.F.; Graham, P.; Russo, F.A. Seeing music performance: Visual influences on perception and experience. Semiotica 2005, 203–227. [Google Scholar] [CrossRef] [Green Version]
  73. Schutz, M.; Lipscomb, S. Hearing gestures, seeing music: Vision influences perceived tone duration. Perception 2007, 36, 888–897. [Google Scholar] [CrossRef] [PubMed]
Figure 1. Towards automatic music performance assessment systems.
Applsci 08 00507 g001
Figure 2. Proposed system overview. DNN Deep neural network
Applsci 08 00507 g002
Figure 3. Flow diagram for computation of input representations. F0: Fundamental frequency, MIDI: Musical instrument digital interface.
Applsci 08 00507 g003
Figure 4. Model architecture diagrams. (a) Fully Convolutional Pitch Contour Model (PC-FCN); (b) Convolutional Recurrent Model with Mel Spectrogram (M-CRNN).
Applsci 08 00507 g004
Figure 5. Architecture diagram of the Hybrid Model Combining Mel-Spectrogram and Pitch Contour Inputs (PCM-CRNN).
Applsci 08 00507 g005
Figure 6. Evaluation results showing R 2 metric for all assessment criteria. SVR-BD: Baseline Model, PC-FCN: Fully Convolutional Pitch Contour Model, M-CRNN: Convolutional Recurrent Model with Mel Spectrogram, PCM-CRNN: Hybrid Model Combining Mel-Spectrogram and Pitch Contour Inputs.
Applsci 08 00507 g006
Figure 7. Cosine distance matrix between the weight vectors of the 1st convolutional layer of the Fully Convolutional Pitch Contourmodel (PC-FCN) for different (s: Symphonic Band, m: Middle School, M: Musicality, N: Note Accuracy, R: Rhythmic Accuracy, T: Tone Quality). Darker shade indicates lower distance.
Applsci 08 00507 g007
Figure 8. Saliency maps using PC-FCN model for four performances of Bb Clarinet (the two on the top are from 2014 Symphonic Band performances, the two on the bottom are from 2013 Middle School performances). The original pitch contour is shown in black and the salient sections are shown in red. The y-axis represents the normalized pitch values while the x-axis represents time in terms of blocks.
Applsci 08 00507 g008
Table 1. Dataset statistics for technical exercise showing the number of performances across years, average duration of performances and the % split across instruments (a: Alto Saxophone, c: Bb Clarinet, f: Flute).
Middle SchoolSymphonic Band
# StudentsAvg. Duration (in s)# StudentsAvg. Duration (in s)
2013447
a: 27% , c: 33%, f: 40%
34.07462
a: 25% , c: 38%, f: 37%
51.93
2014498
a: 30% , c: 33%, f: 37%
35.70527
a: 20% , c: 39%, f: 41%
47.96
2015465
a: 26% , c: 36%, f: 38%
35.27561
a: 23% , c: 39%, f: 37%
55.33
Total1410
a: 28% , c: 34%, f: 38%
35.011550
a: 23% , c: 39%, f: 38%
51.74
Table 2. Evaluation results showing the Pearson Correlation Coefficient ρ for all models and both student categories (M: Musicality, N: Note Accuracy, R: Rhythm Accuracy, T: Tone Quality, SVR-BD: Baseline Model, PC-FCN: Fully Convolutional Pitch Contour Model, M-CRNN: Convolutional Recurrent Model with Mel Spectrogram, PCM-CRNN: Hybrid Model Combining Mel-Spectrogram and Pitch Contour Inputs).
Symphonic BandMiddle School
ModelsMNRTMNRT
SVR-BD0.6120.5470.6490.6280.6190.5950.4180.587
PC-FCN0.7440.6470.7430.6120.6190.5610.4650.560
M-CRNN0.7330.5820.7000.6240.7230.6660.6020.573
PCM-CRNN0.6890.6940.6550.6490.7240.6530.6300.634

