Article

Numerical Studies on the Action Mechanism of Combustion Intermediates and Free Radicals on Nitrogen Oxides under Oil-Water Blended Conditions

1
State Key Laboratory of Automotive Simulation and Control, Jilin University, Changchun 130022, China
2
College of Automotive Engineering, Jilin University, Changchun 130022, China
*
Author to whom correspondence should be addressed.
Appl. Sci. 2018, 8(4), 490; https://doi.org/10.3390/app8040490
Submission received: 5 March 2018 / Revised: 18 March 2018 / Accepted: 21 March 2018 / Published: 23 March 2018
(This article belongs to the Section Chemical and Molecular Sciences)

Abstract

:

Featured Application

Clean combustion technology of internal combustion engine and internal purification for combustion reactor.

Abstract

The action mechanism of combustion intermediates and free radicals on nitrogen oxides have been evaluated. Based on chemical reaction dynamics and modern statistical theory, the subject was investigated by means of numerical simulation. A wide water/oil ratio and a wide air/fuel ratio were also taken into account. Some main conclusions were drawn that the reaction response of H2O2 is lagged behind, with the increase of water mass fraction from 10% to 30%. The maximum generation rate is 2.77%, 5.67%, 8.38% and the maximum consumption rate is 3.55%, 6.80%, 13.01% lower than that without water. Water addition leads to decline of the maximum generation rate of NO, N2O, NO2 by 15.24%, 9.21%, 14.78% on average. Further, the saliency factor is explored in the main reaction process depending on the correlation analysis and the sensitivity analysis method. According to the degree of the significance, OH > O > H2 for NO, O > H2 > OH > HO2 for N2O, and OH > H2 > O > H2O2 > HO2 for NO2. In the case of oil-water blended, H + O2 <=> O + OH and H2O2(+M) <=> 2OH(+M) promote the generation of OH and O at the beginning of the second stage, but H + O2(+M) <=> HO2(+M), HO2 + OH <=> H2O + O2, H2O2 + OH <=> H2O + HO2 play an inhibitory role in the generation of OH and O.

1. Introduction

At present, the problem of environmental pollution has attracted more and more attention, especially the problem of nitrogen oxide pollution, which has perplexed us for a long time. The generation of NOx is divided into thermal NOx, fast NOx and fuel NOx. Thermal NOx refers to nitrogen oxides produced by oxidation of N2 in the air at high temperature. The generation mechanism of the fast NOx is that a large amount of NOx is produced rapidly in the surface of the flame when the excess air coefficient is less than 1. The generation of fuel NOx depends on the nitrogen compounds in the fuel. Previous studies have demonstrated that the components of nitrogen oxides emission produced during the combustion process are mainly NO, and a small amount of NO2, N2O and so on. But NO will be reoxidized to NO2 in the air. In the control technologies of reducing nitrogen oxides emission, combustion with moderate water addition is an effective way [1,2].
Oil water emulsion and water injection are two common measures to introduce water into the combustion reaction, which is also regarded as the fuel improvement techniques. Elsanusi et al. [3] performed a set of engine experiments at the condition of three engine speeds (1000, 2100 and 3000 rpm), three engine loads (20%, 50% and 80%), and three different levels of water concentration (5%, 10% and 15%). They concluded that the nitrogen oxides (NOx) were significantly reduced with the increase of water content in the emulsion compared to their bases. One advantage of water injection when compared with EGR is the possible reduction of NOx emissions either at low engine loads and high engine loads without a substantial increase in PM emissions [4].
Kokkulunk et al. [5] investigated the performance and efficiency of a diesel engine with a steam injection system by means of experiment and simulation. They come to conclusion that the steam injection had a positive effect on performance and NO emissions at all speed and didn’t affect CO, CO2, HC emissions considerably. Tesfa et al. [6] conducted an engine experiment operated with biodiesel directly injected in the cylinder and water injected in the manifold. Some conclusion was got that when the water injection rate was 3 kg/h, NOx was reduced by about 50% and this measure didn’t result in significant changes in fuel consumption. In addition, the water injection in the intake manifold had little effect on the cylinder pressure and the heat release rate [7]. Kyriakides et al. [8] performed an experimental study with gasoline-ethanol-water ternary mixtures. They pointed out that the Otto engine requires no modifications to burn E40 and E40h (10% hydrous) efficiently with advantage of NOx emissions reduction. Nag Jung Choi et al. [9,10] proposed that the combustion temperature of fuel is the most important factor that directly affecting the NOx emissions from the engine. For biodiesel, the NOx emission increases a little with increasing of biodiesel blend ratio in diesel engines fueled with biodiesel blend fuel. This could attribute to that the combustion chamber temperature of biodiesel is higher than that of diesel fuel. Because biodiesel is an oxygenated fuel.
All the references mentioned above are focused on the generation quantity of NOx, which remained at the macro and phenomenal levels. Researchers are more inclined to explain the phenomenon that water addition into the combustion chamber can inhibit the generation of nitrogen oxides based on the physical property of water. Apparently, the latent heat of vaporization of water is high (40.8 kJ/mole at 100 °C, 1 atm), after introducing water into the combustion chamber, the adiabatic flame temperature reduces due to water vaporization. And it is generally believed that the generation conditions of NOx are high temperature and oxygen enrichment. This explanation is reasonable, but not enough. Correspondingly, at the micro level, there are few studies focused on the chemical effects of water involved in the progress of NOx reduction. Namely, the related mechanism is not clear. Some experimental studies have shown that small molecules and free radicals in the period of combustion have some influence on the generation of NOx [11,12,13]. However, at present, most laboratories have no quantitative measurement of free radicals. Even in reference 13, planar-laser-induced fluorescence (PLIF) is used to measure the distribution of OH radical. By using planar-laser-induced fluorescence (PLIF) and laser-induced fluorescence (LIF) spectroscopy, the energy decay of incident light and fluorescence quenching will be the biggest barrier. It has a bad impact on the quantitative calibration and has a strict requirement for the output wavelength of the laser [14,15]. Experimental measurements have limitations, and therefore, numerical calculation is an alternative method.
In further microscopic research on emission problems, it is especially important for multi-level reaction analysis of reaction rate, concentration and reaction time of reaction products in chemical reaction kinetics. Hence, correlation analysis and sensitivity analysis are introduced. Correlation analysis is helpful for researchers to understand the generation and consumption process of combustion pollutants and free radicals in essence, so as to provide a theoretical basis and technical approach for effective control generation of nitrogen oxides. It is of innovative significance to study the process of NOx generation at the condition of oil-water blended with the two means above. And the coupling of correlation analysis and sensitivity analysis can greatly improve the researchers’ insight into the importance of each reaction way, thus realizing the purpose of controlling combustion [16]. Under different initial conditions and boundary circumstances, the efficiency of solving the governing equation is too low. The more parameters involved in the model, the more prominent the problem is. Therefore, the introduction of correlation analysis and sensitivity analysis into the kinetics of elemental reaction has enriched the research means to make it possible to analyze the process of combustion [17]. The application of the coupling analysis to the generation of combustion pollutants is of great significance for analyzing the characteristics of pollutant generation, simplifying the reaction model and determining the suppression method.
In the present study, based on such realistic conditions, numerical methods enter into consideration. The valid mechanism analysis of combustion reaction process with oil-water-blended is focused. Based on correlation analysis and sensitivity analysis, the key intermediate products to control the yield of NOx in oil-water-blended condition are obtained, and the main paths are analyzed as well.

2. Experimental Method and Experimental Setup

2.1. Experimental Method

For the numerical calculation of chemical reaction dynamics, CHEMKIN [18] is a common tool, which is suitable for analyzing the chemical reaction process. Its main function is to solve a series of chemical problems involved in combustion through the analysis and calculation of the chemical reaction mechanism. Because the software package has the characteristics of reasonable structure, good reliability and easy to transplant, it has become the mainstream calculation software in the field of combustion chemistry dynamics. Some thermodynamic data are provided in the form of the NASA chemical equilibrium code, which are showed as the following Equations (1)–(6) [19]. Seven coefficients ( a 1 k ~ a 7 k ) are given in a database file (e.g., therm.dat), which is provided by the mechanism file.
C p k 0 R = a 1 k + a 2 k T k + a 3 k T k 2 + a 4 k T k 3 + a 5 k T k 4
H k 0 R T k = a 1 k + a 2 k 2 T k + a 3 k 3 T k 2 + a 4 k 4 T k 3 + a 5 k 5 T k 4 + a 6 k T k
S k 0 R = a 1 k l n T k + a 2 k T k + a 3 k 2 T k 2 + a 4 k 3 T k 3 + a 5 k 4 T k 4 + a 7 k
C v k 0 = C p k 0 R
U k 0 = H k 0 R T k
G k 0 = H k 0 T k S k 0
The chemical reaction mechanism used in this paper comes from two parts. Chen et al. [20] developed a reduced mechanism, which contains 207 species and 1026 steps. The mechanism is based on five components (C6H5CH3, iC5H12, iC8H18, nC5H12, nC7H16) gasoline surrogate mechanism, which comes from Lawrence Livermore National Laboratory (LLNL) [21]. This 207-species skeletal mechanism is validated under a wide range of conditions compared to the rapid compression machine (RCM) experimental data, and it has also been mentioned or verified widely in other research [22,23,24]. The mixture oil in this mechanism has similar properties to local oil products in Changchun, China, so the mechanism is suitable for this study and for future research.
The NOx mechanism comes from GRI mech3.0 [25], which has been widely verified by experiments [26,27,28]. In order to study the effect of gasoline-water blended on NOx, this work combines the NOx mechanism in GRI mech3.0 and Chen mechanism to fulfill the research. And the composite mechanism is provided with Supplementary materials.

2.2. Experimental Setup

The research is carried out in a closed homogeneous batch reactor provided by CHEMKIN code [18]. This is a ‘Closed 0-D Reactor’, which is used to simulate constant volume combustion problems and solve the energy equation. Before running the project, some of the computing conditions need to be set up. For example, import the composite mechanism file in ‘Pre-Processing’ section and then set the solver properties. In this project, the absolute tolerance is set to 1.0 × 10⁻²⁰; the relative tolerance is set to 1.0 × 10⁻⁸; the sensitivity absolute tolerance is set to 1.0 × 10⁻⁴; and the sensitivity relative tolerance is set to 1.0 × 10⁻⁴. For quantitative analysis, the water-oil mass ratio (WOMR) is defined in Equation (7). The other properties of the oil and the experimental condition are presented in Table 1.
r = m water m oil   ×   100 %

3. Results and Discussion

3.1. Two Stages Reaction Processes

Figure 1a–c are at different coordinating scales. In Figure 1a, the reaction is divided into two stages. The first stage occurs after about 1.3 ms. For the phase of low temperature oxidation, the reaction of mixed gas is exothermic, and the temperature increases from 800 K to 1000 K. H2O2 and HO2 are mainly produced at this stage and are considered as indicator products for the two-stage reaction. Decomposition of H2O2, H2O2 + M <=> 2OH + M (#16 elementary reaction in Chen mechanism plus GRI mech3.0) happens at 6.9 ms. For the combustion reaction, the large amount of OH generation marks the start of the burning. The three-body reaction H + O2 + M <=> HO2 + M (#9 elementary reaction in Chen mechanism plus GRI mech3.0) is an important radical recombination step, plays an important role as a chain terminating process at the second explosion limit and leads to relatively long induction times at conditions near the second limit [33]. The paramount condition that the system can enter the high temperature stage after the low temperature stage is that the low temperature reaction must be able to release enough heat to increase the temperature of the system. When the temperature reaches to 1000 K, the temperature rises sharply, and the mixture enters the high temperature oxidation stage. The high temperature reaction process releases a lot of heat, which provides the conditions for NOx generation.

3.2. Intermediate Reaction Products (Small Molecules and Free Radicals) at Different WOMR

In Figure 2a, the variation of the reaction rate of H2O2 with different water/oil mass ratio is exhibited. Combined with Figure 1a and Figure 2b,c, the generation of H2O2 occurred between 0.001 s and 0.002 s and the consumption occurred between 0.007 s and 0.008 s. When the water mass fraction increases from 10% to 30%, the response of the reaction of H2O2 is lagged behind, and the maximum generation rate is 2.77%, 5.67%, 8.38% lower than that without water, and the maximum consumption rate is 3.55%, 6.80%, 13.01% lower than that without water. It shows that both reaction delay and peak value decrease cause the increase of heat needed for activation reaction at the same activation energy and reaction temperature when water is introduced to inhibit the chain reaction. The existence of water plays a role in controlling the rate of the main element reaction.
Figure 3 shows the reaction rate of H2 at different WOMR. Hydrogen has the advantages of low ignition energy, high flame propagation speed, high diffusion rate and wide ignition limit [34,35,36]. Therefore, hydrogen addition can effectively increase combustion stability. The primary hydrogen production reaction in this mechanism is: NH + H2O <=> HNO + H2 (#1032 elementary reaction in Chen mechanism plus GRI mech3.0), in which the positive reaction requires very high activation energy, Ea = 13.850 kJ/mol. With the increase of water, the temperature of the system decreases and the generation rate of H2 decreases significantly, and the reaction is pushed back. But another elementary reaction NH + NO <=> N2 + OH (#1033 elementary reaction in Chen mechanism plus GRI mech3.0) mainly occurs in the reductive environment. So under this circumstance, the above two steps will result in a scramble for the NH radical. Then the final result of the effect is that the NH is oxidized by excessive H2O, so the reduction process of NO is hindered, resulting in a slight increase of the yield of NO.
From Figure 4, it can be seen that with the increase of water content, the reaction rates of OH, HO2, H and O decrease in varying degrees and are accompanied by the back shift of the peak value. At the same time, there is also the transfer process of material and energy between the four intermediate products. These reactions occur at the high temperature stage at the end of the first stage. Because of the high temperature, the intense reaction, the short reaction time, and the competition for the same components, there is a relationship between these reactions, forming a closed loop, as shown in Table 2. In a moment, the concentration of OH and O increases sharply, which causes the generation of many active centers. Ultimately, the activation center concentration is the key factor affecting the combustion of the fuel. This is the starting point of the second stage combustion. The concentration of OH and O decreases after some chain carrier is destroyed. Then the system reaches the steady state gradually.

3.3. Coupling Analysis at Water Mixing and Variable Excess Air Coefficient Conditions

Figure 5 shows the mole fraction map of free radicals corresponding to maximum rate map of production of NO, Figure 6 shows the mole fraction map of free radicals corresponding to maximum rate map of production of N2O, and Figure 7 shows the mole fraction map of free radicals corresponding to maximum rate map of production of NO2. Because the corresponding time of the maximum production rate of NO, N2O, and NO2 is very close to each other, free radicals have little change in the maps of the three groups. In these three groups of figures, because the temperature reduces obviously, the starting point of the high temperature oxidation stage is delayed, the duration of the high temperature is shorter and the generation rate of NOx decreases, with the increase of the proportion of water in the fuel. When the water content increases by 10%, the maximum NO generation rate decreases by 15.24% on average, the maximum N2O generation rate decreases by 9.21% on average, and the maximum NO2 generation rate decreases by 14.78% on average. In the distribution of free radicals mole fraction, H, HO2 and H2O2 show obviously non monotonicity in lambda direction, which is inconsistent with the monotonicity of NOx generating rate map. It can be roughly estimated that the above three free radicals are not very closely related to NOx generation. For O and OH, the mole concentration map can be observed clearly, which is consistent with the NOx generation rate in the two-dimensional space of lambda and WOMR, in the three groups of figures. In order to further explore, the results of the above maps will be analyzed by correlation analysis and sensitivity analysis.

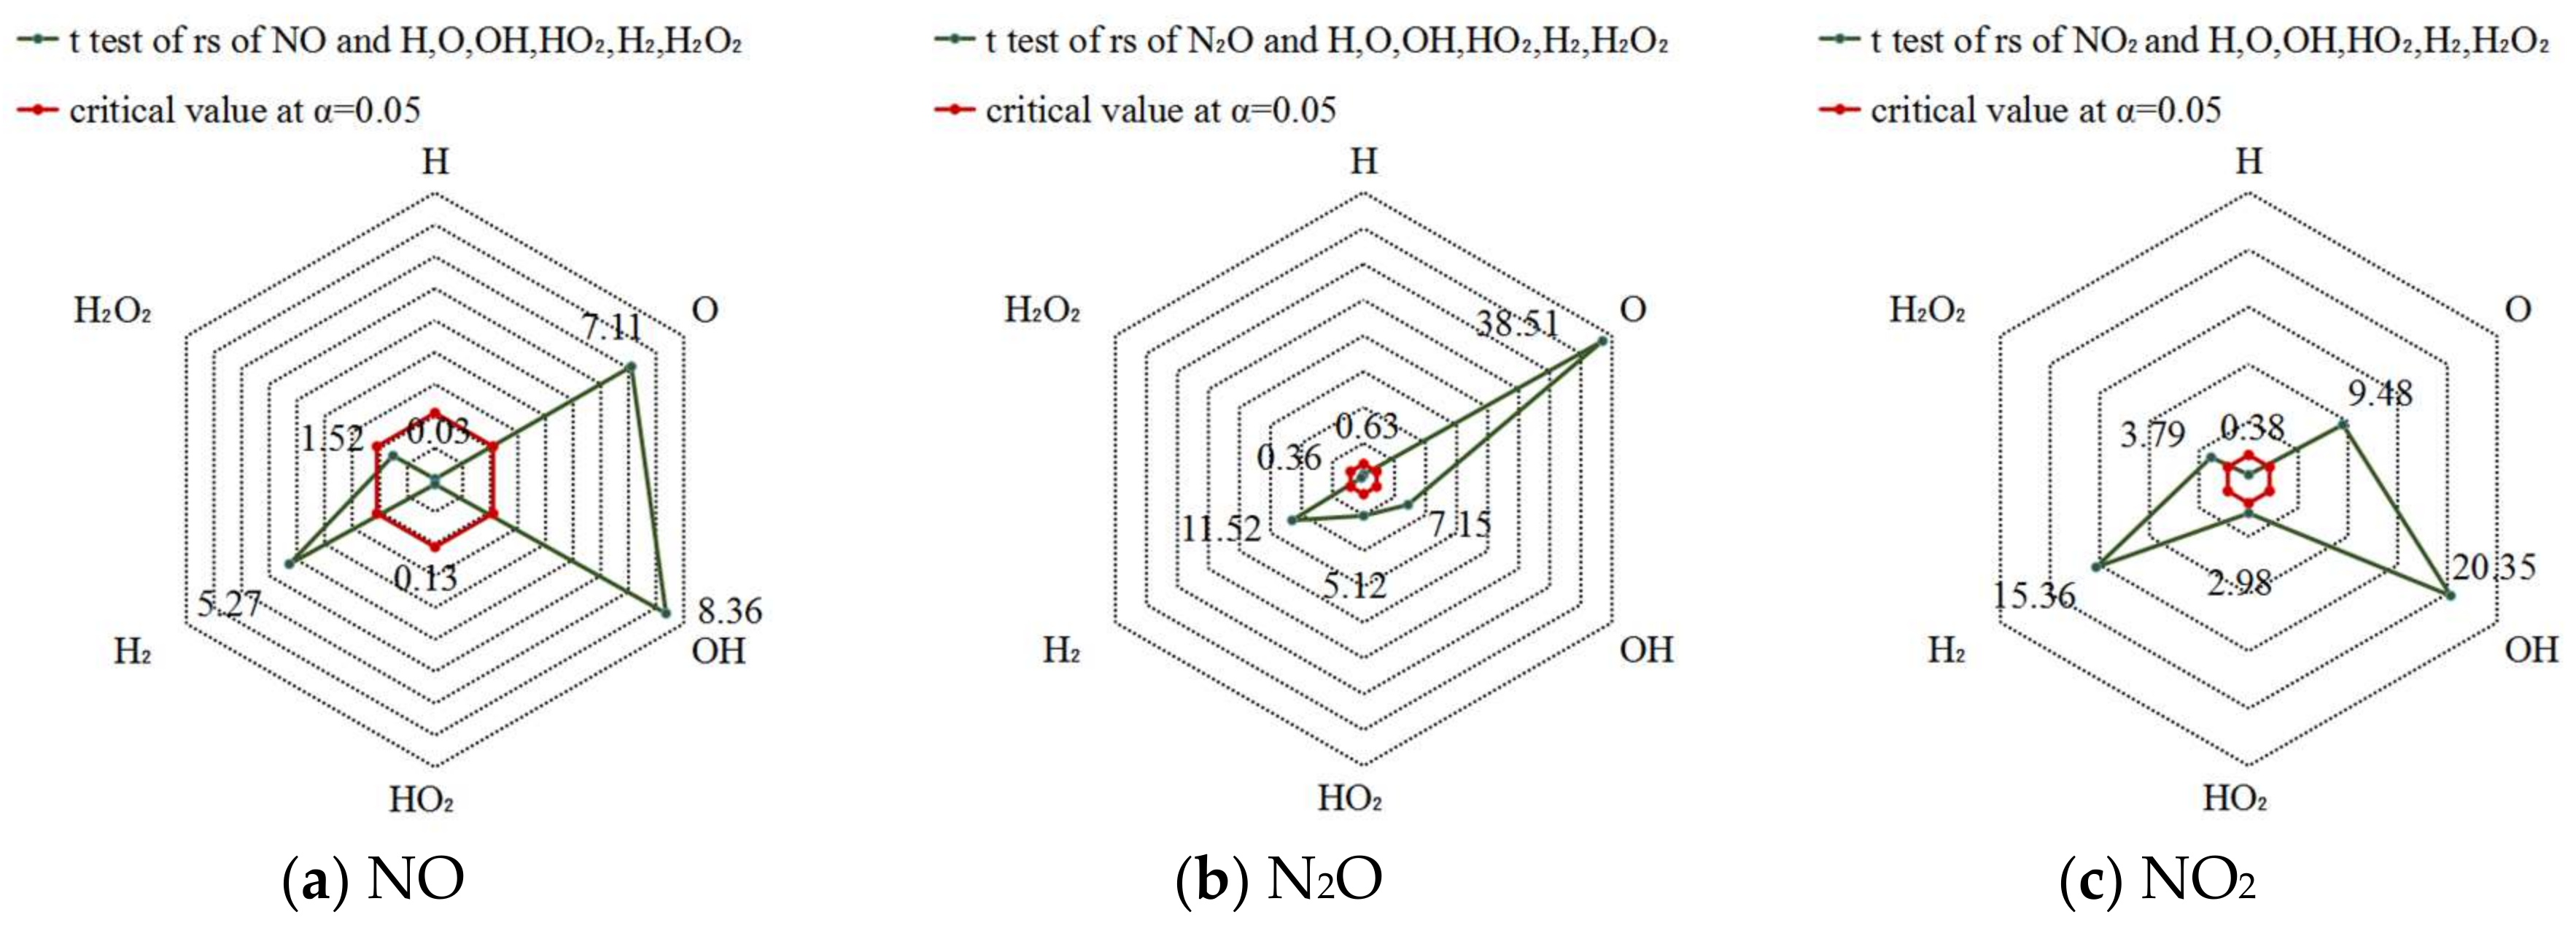
3.3.1. Correlation Analysis

In order to further explain the relative relationship between the small molecules of the free radicals and the NOx, the correlation coefficient algorithm is introduced to illustrate this problem.
Number of pairs, such as ( x 1 , y 1 ) , ( x 2 , y 2 ) , …, ( x n , y n ) are given. It is necessary to check whether the two variables, X and Y, are related. The traditional Pearson product-moment correlation coefficient (PPMCC) is a measure method of the linear relationship between X and Y. However, there are 2 limitations when using Pearson product-moment correlation coefficient. On one side, the data must be obtained from normal distribution in pairs. On the other side, the data are at least equidistant in logical range. Whereas the non-parameter Spearman rank correlation coefficient (SRCC) is used to measure the more generalized correlation relation (not necessarily linear).
Let ( x , y ) be a sample from two different entire populations: ( X , Y ) and its observation value is ( x 1 , y 1 ) , ( x 2 , y 2 ) , …, ( x n , y n ) . If x i and y i are sorted by value individually, the new rank of x i and y i in the two sequential samples is recorded as R x , i and R y , i ( 0 i n ) . So, n pairs of rank numbers, ( R x , 1 , R y , 1 ) , ( R x , 2 , R y , 2 ) , …, ( R x , n , R y , n ) is obtained from 1 to n. Generally, the Spearman rank correlation coefficient formula can be recorded as follows [37]:
r s = i = 1 n ( R x , i R x ¯ ) ( R y , i R y ¯ ) i = 1 n ( R x , i R x ¯ ) 2 i = 1 n ( R y , i R y ¯ ) 2
R x ¯ = 1 n i = 1 n R x , i
R y ¯ = 1 n i = 1 n R y , i
If there is no same data in the X, Y sequence, then the mean value can be recorded as:
R x ¯ = R y ¯ = n + 1 2
So the formula of r s can be further simplified to:
r s = 1 6 i n ( R x , i R y , i ) 2 n ( n 2 1 )
r s > 0 represents positive correlation and r s < 0 represents negative correlation. | r s | is more close to 1, the correlation between the samples is higher. Whereas | r s | is closer to 0, the correlation between the samples is lower. Sometimes the sample with very high correlation coefficient may also come from the uncorrelated population. In order to exclude such situation, a significance test of the correlation coefficient is needed. The Student’s t test provides the excellent ability to test the significance of r s . The test formula of student’s t is as follows [38]:
t = r s n 2 1 r s 2 ~ t ( n 2 ) .
The general step of the significance test for the correlation coefficient is to establish the null hypothesis that H0: X and Y are related, and the alternative hypothesis that H1: X and Y is not related. Then give the confidence level α . Based on α , find out the corresponding critical value. At the end make a comparison: if | t | t α , it is assumed that H0 is tenable and if | t | < t α , it is assumed that H1 is tenable.
Table 3 shows the SRCC matrix of free radicals mole fraction and maximum reaction rate of NOx. Figure 8a shows that there is a close relation between the maximum production rate of NO and the mole fraction of O, OH, H2 (coefficient of SRCC, OH > O > H2). Figure 8b shows that there is a close relation between the maximum production rate of N2O and the mole fraction of O, OH, HO2, H2 (coefficient of SRCC, O > H2 > OH > HO2). Figure 8c shows that there is a close relation between the maximum production rate of NO2 and the mole fraction of O, OH, HO2, H2, H2O2 (coefficient of SRCC, OH > H2 > O > H2O2 > HO2). All results above meet a confidence level of at least 95%. Therefore, it can be considered that the above conclusions are statistically significant and correct. At the same time, it also notes that the mole content of O, OH and H2 has a very obvious common effect on the generation of nitrogen oxides (NO, N2O and NO2).

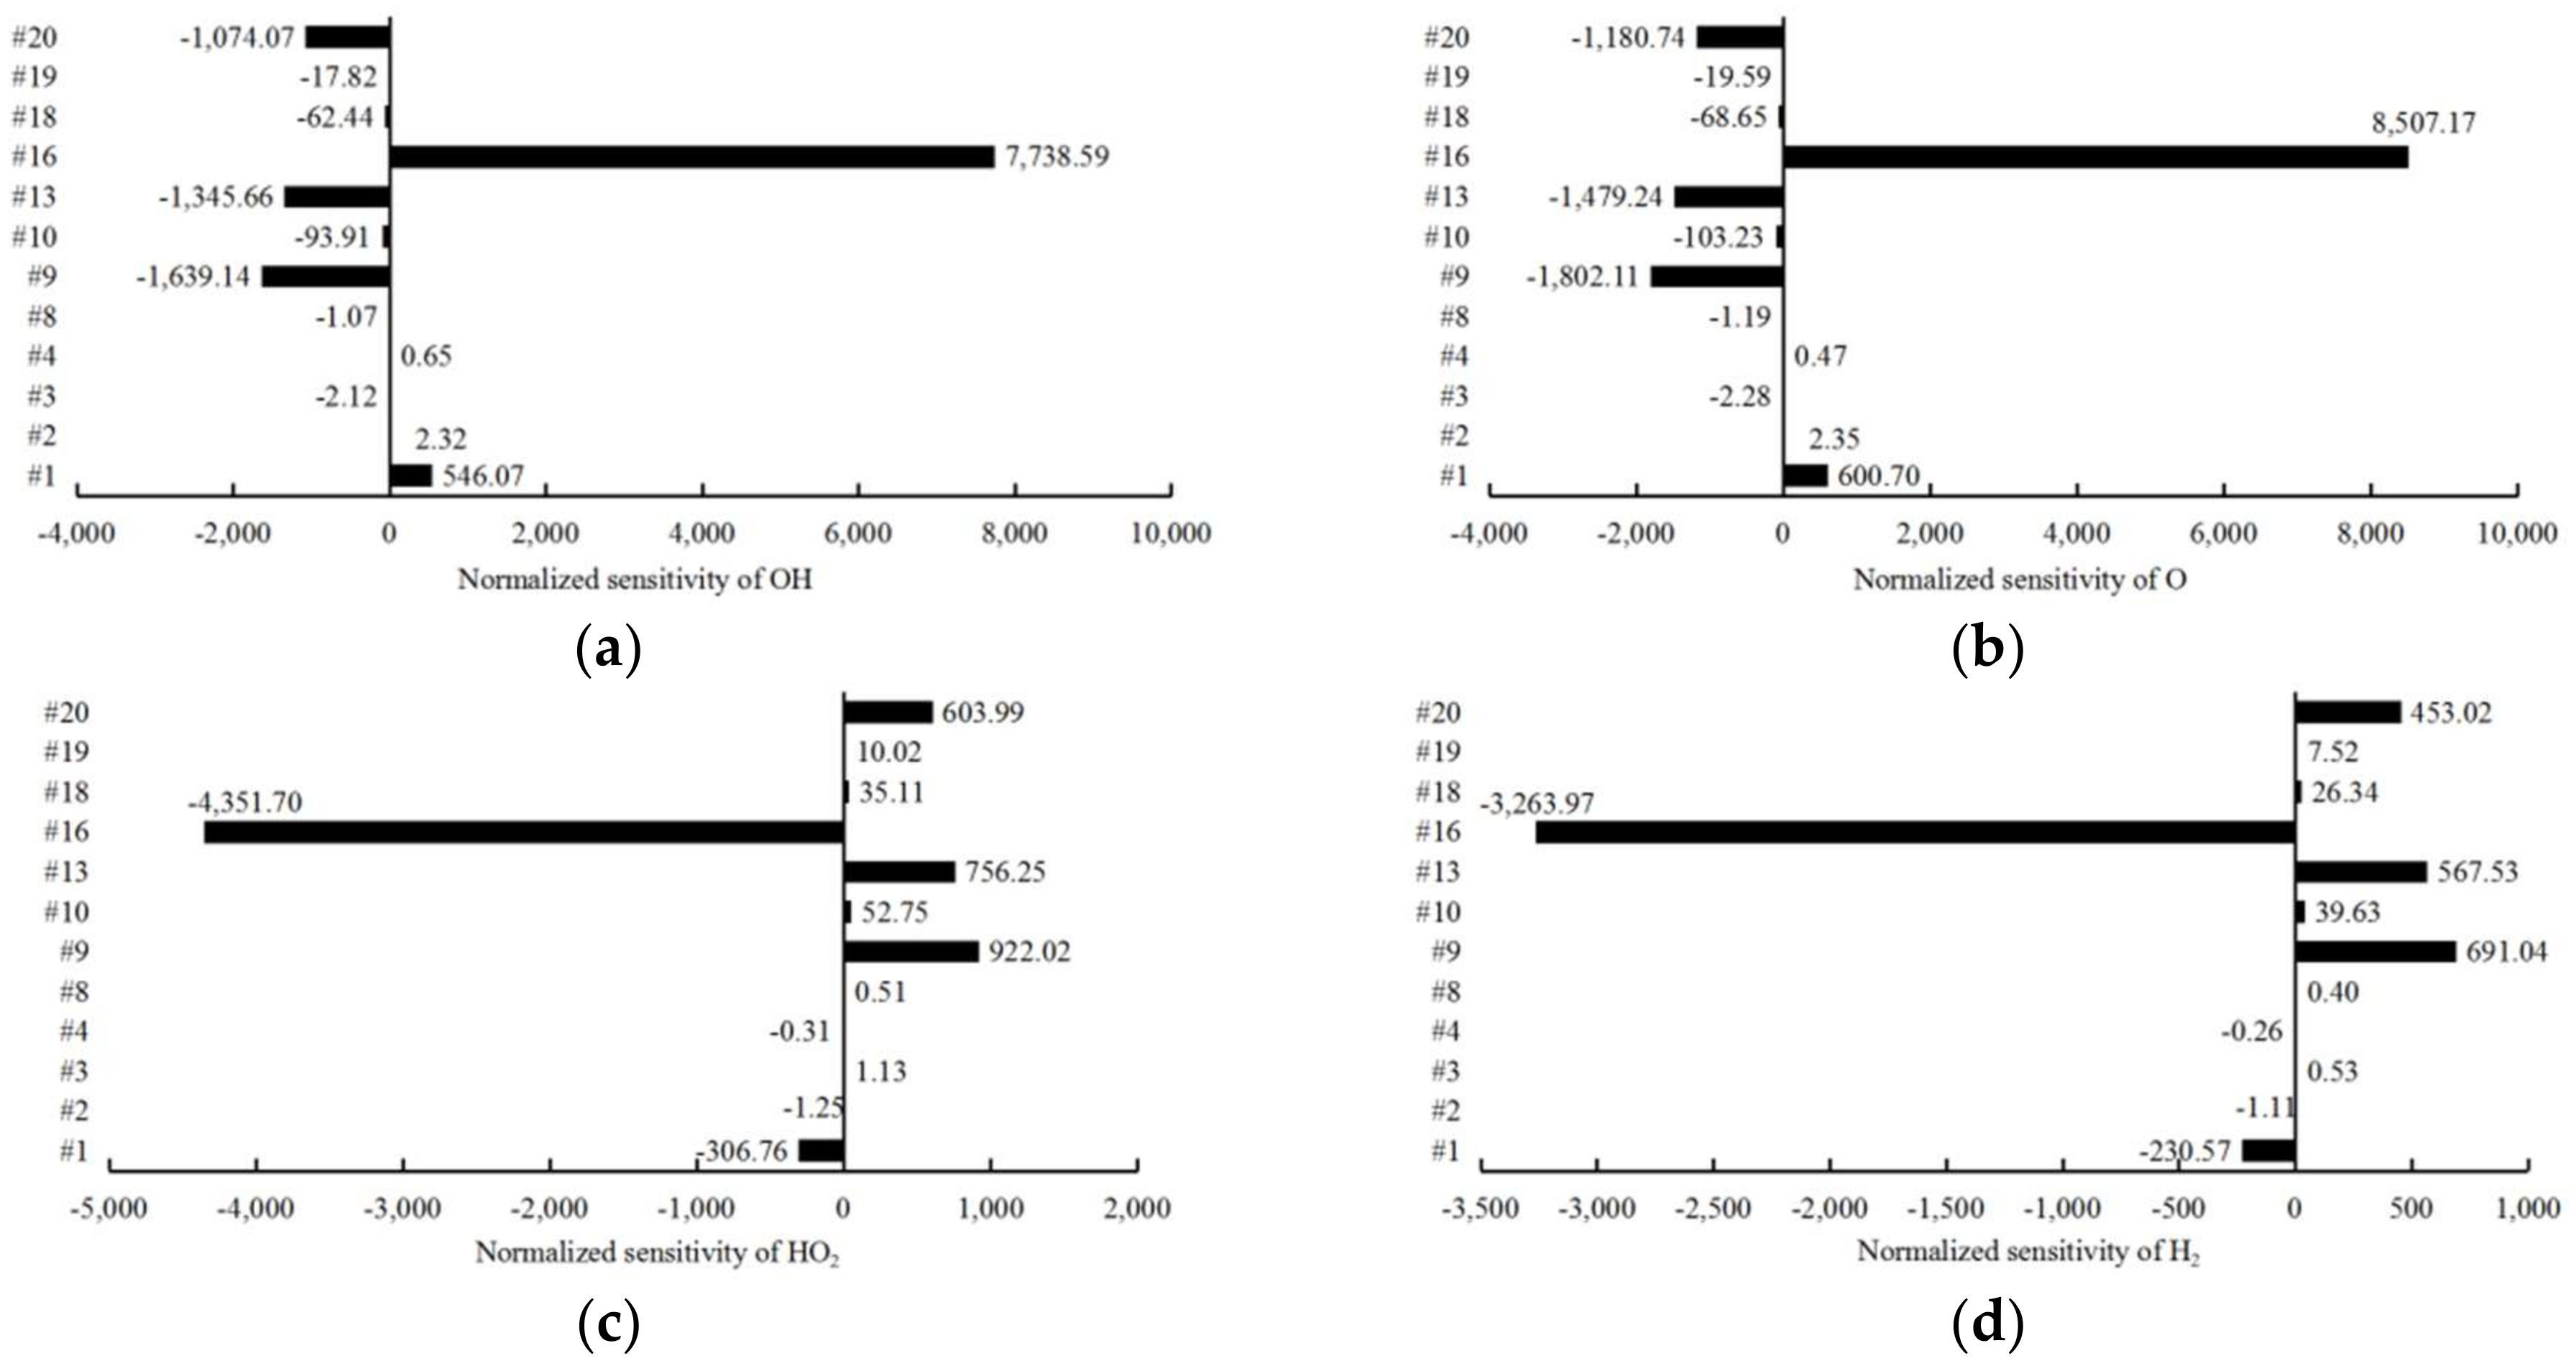
3.3.2. Sensitivity Analysis

In many research fields, sensitivity analysis is applied, and the reaction rate of components i is derived from mass action law:
d C d t = f ( C ; K )
C ( 0 ) = C 0
β i j ( t ) = C i ( t ) K j
The higher the sensitivity, the more important the elementary reaction j to the component i. The specific sensitivity results are shown in Figure 9, corresponding to the starting point of the second stage reaction.
The positive sensitivity coefficient indicates that the elementary reaction affects the generation of free radicals, and the negative sensitivity coefficient indicates that the elementary reaction affects the consumption of free radicals. The mutual influence increases with the absolute value of the sensitivity coefficient increases. From Figure 9, it is found that elementary reaction #1, #9, #13, #16 and #20 can promote or inhibit the generation of free radicals OH, O, HO2 and H2 than others, but the elementary reaction #16 is more important. At the same time, OH and O show a consistent sensitivity to different elementary reactions. HO2 and H2 show a consistent sensitivity to different elementary reactions. Whereas the sensitivity of OH, O and the sensitivity of HO2, H2 are antagonistic.

4. Conclusions

In this paper, a numerical investigation of the action mechanism of H, O, OH, HO2, H2 and H2O2 on the generation of nitrogen oxides with different air/fuel ratio and different WOMR was completed. The main conclusions are summarized as follows:
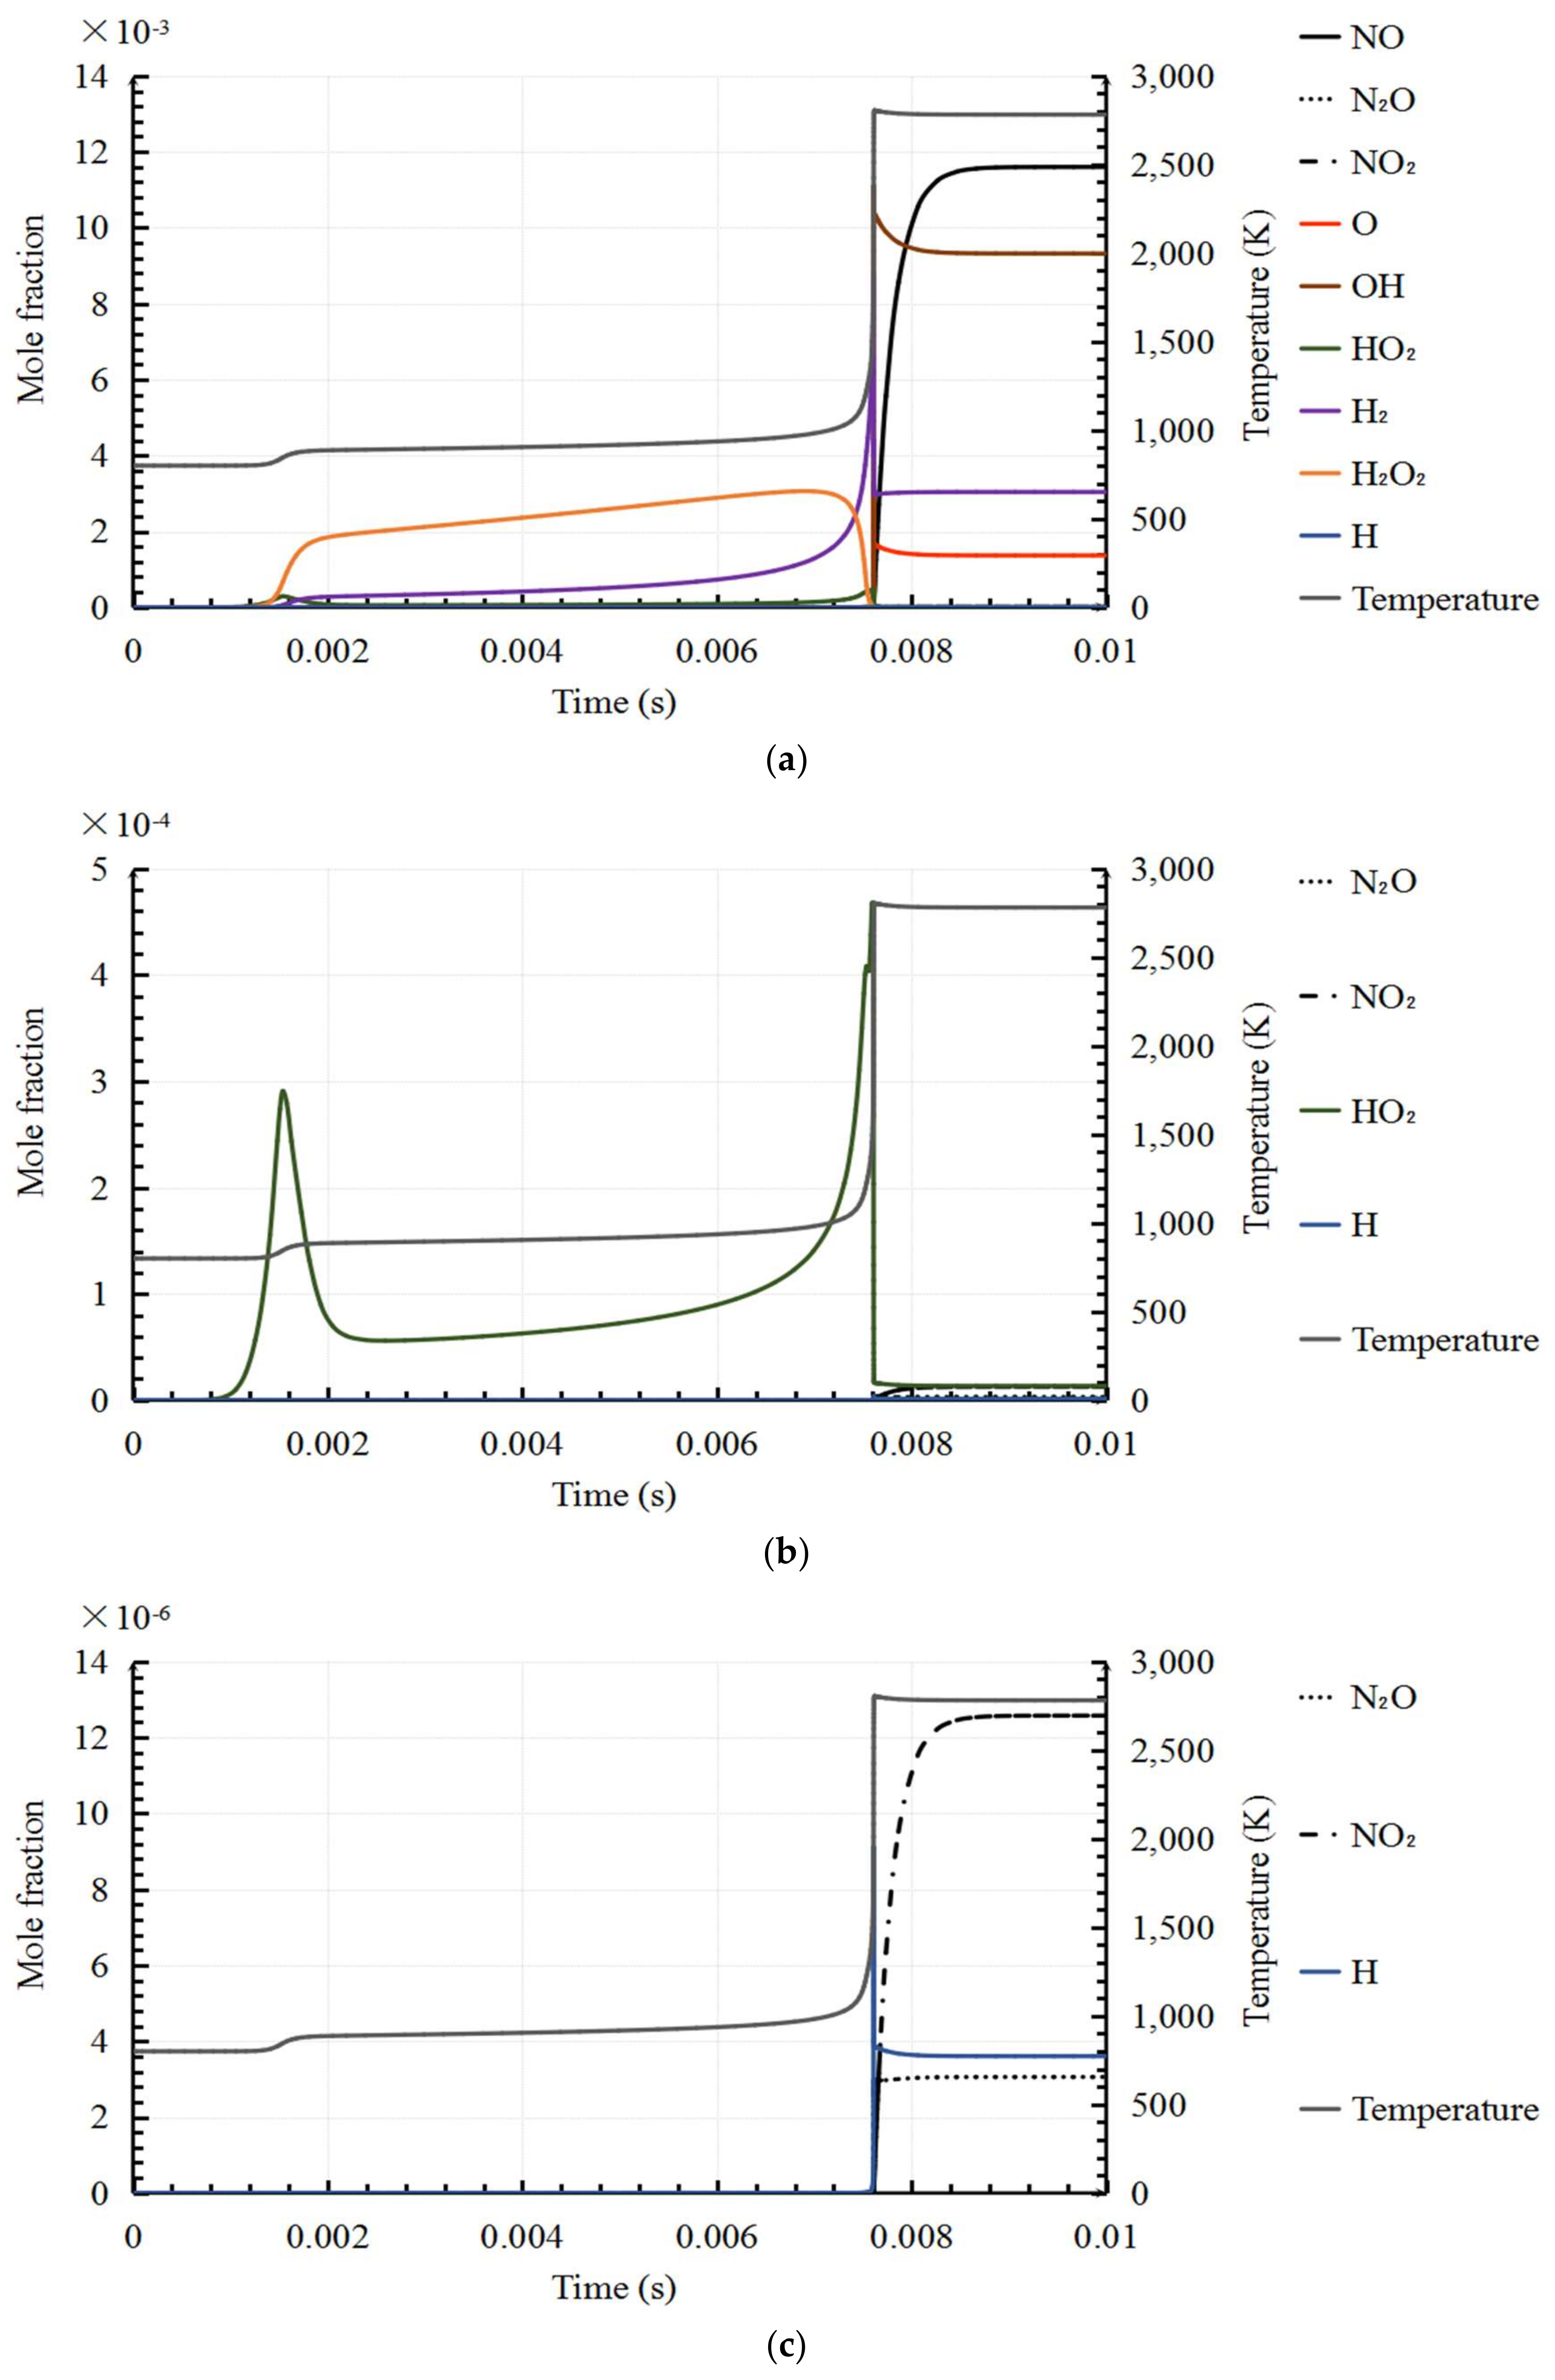
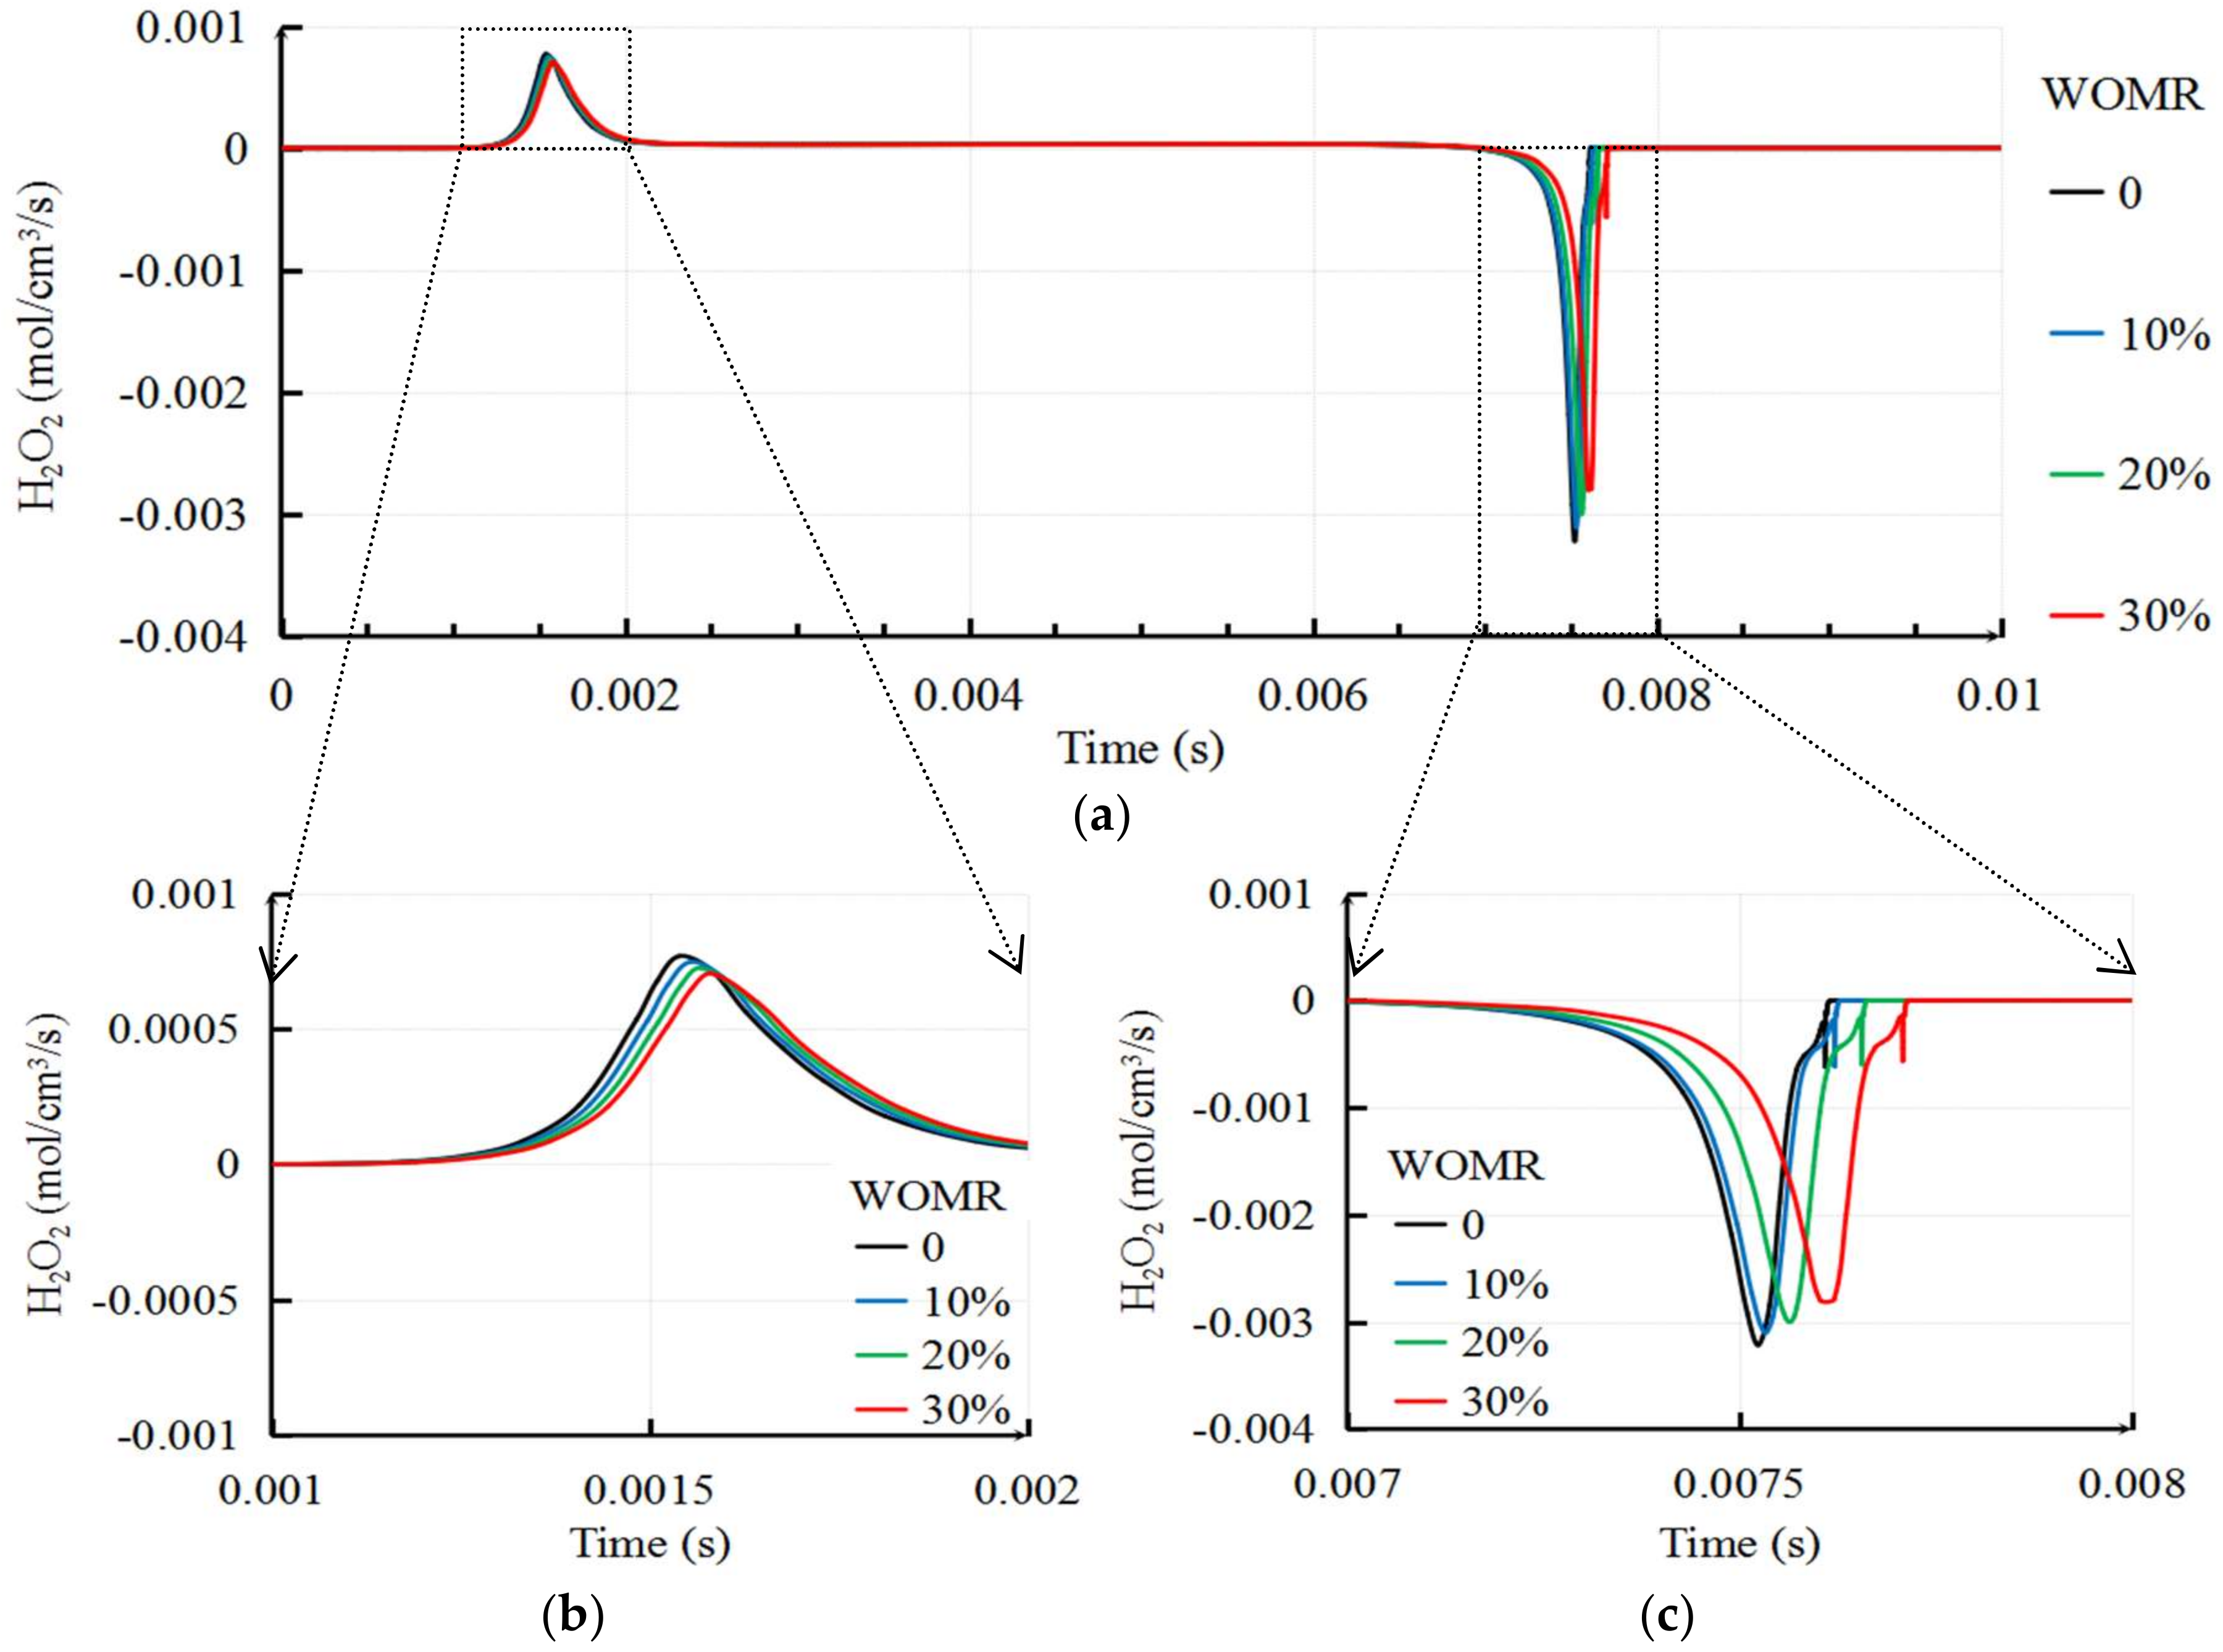
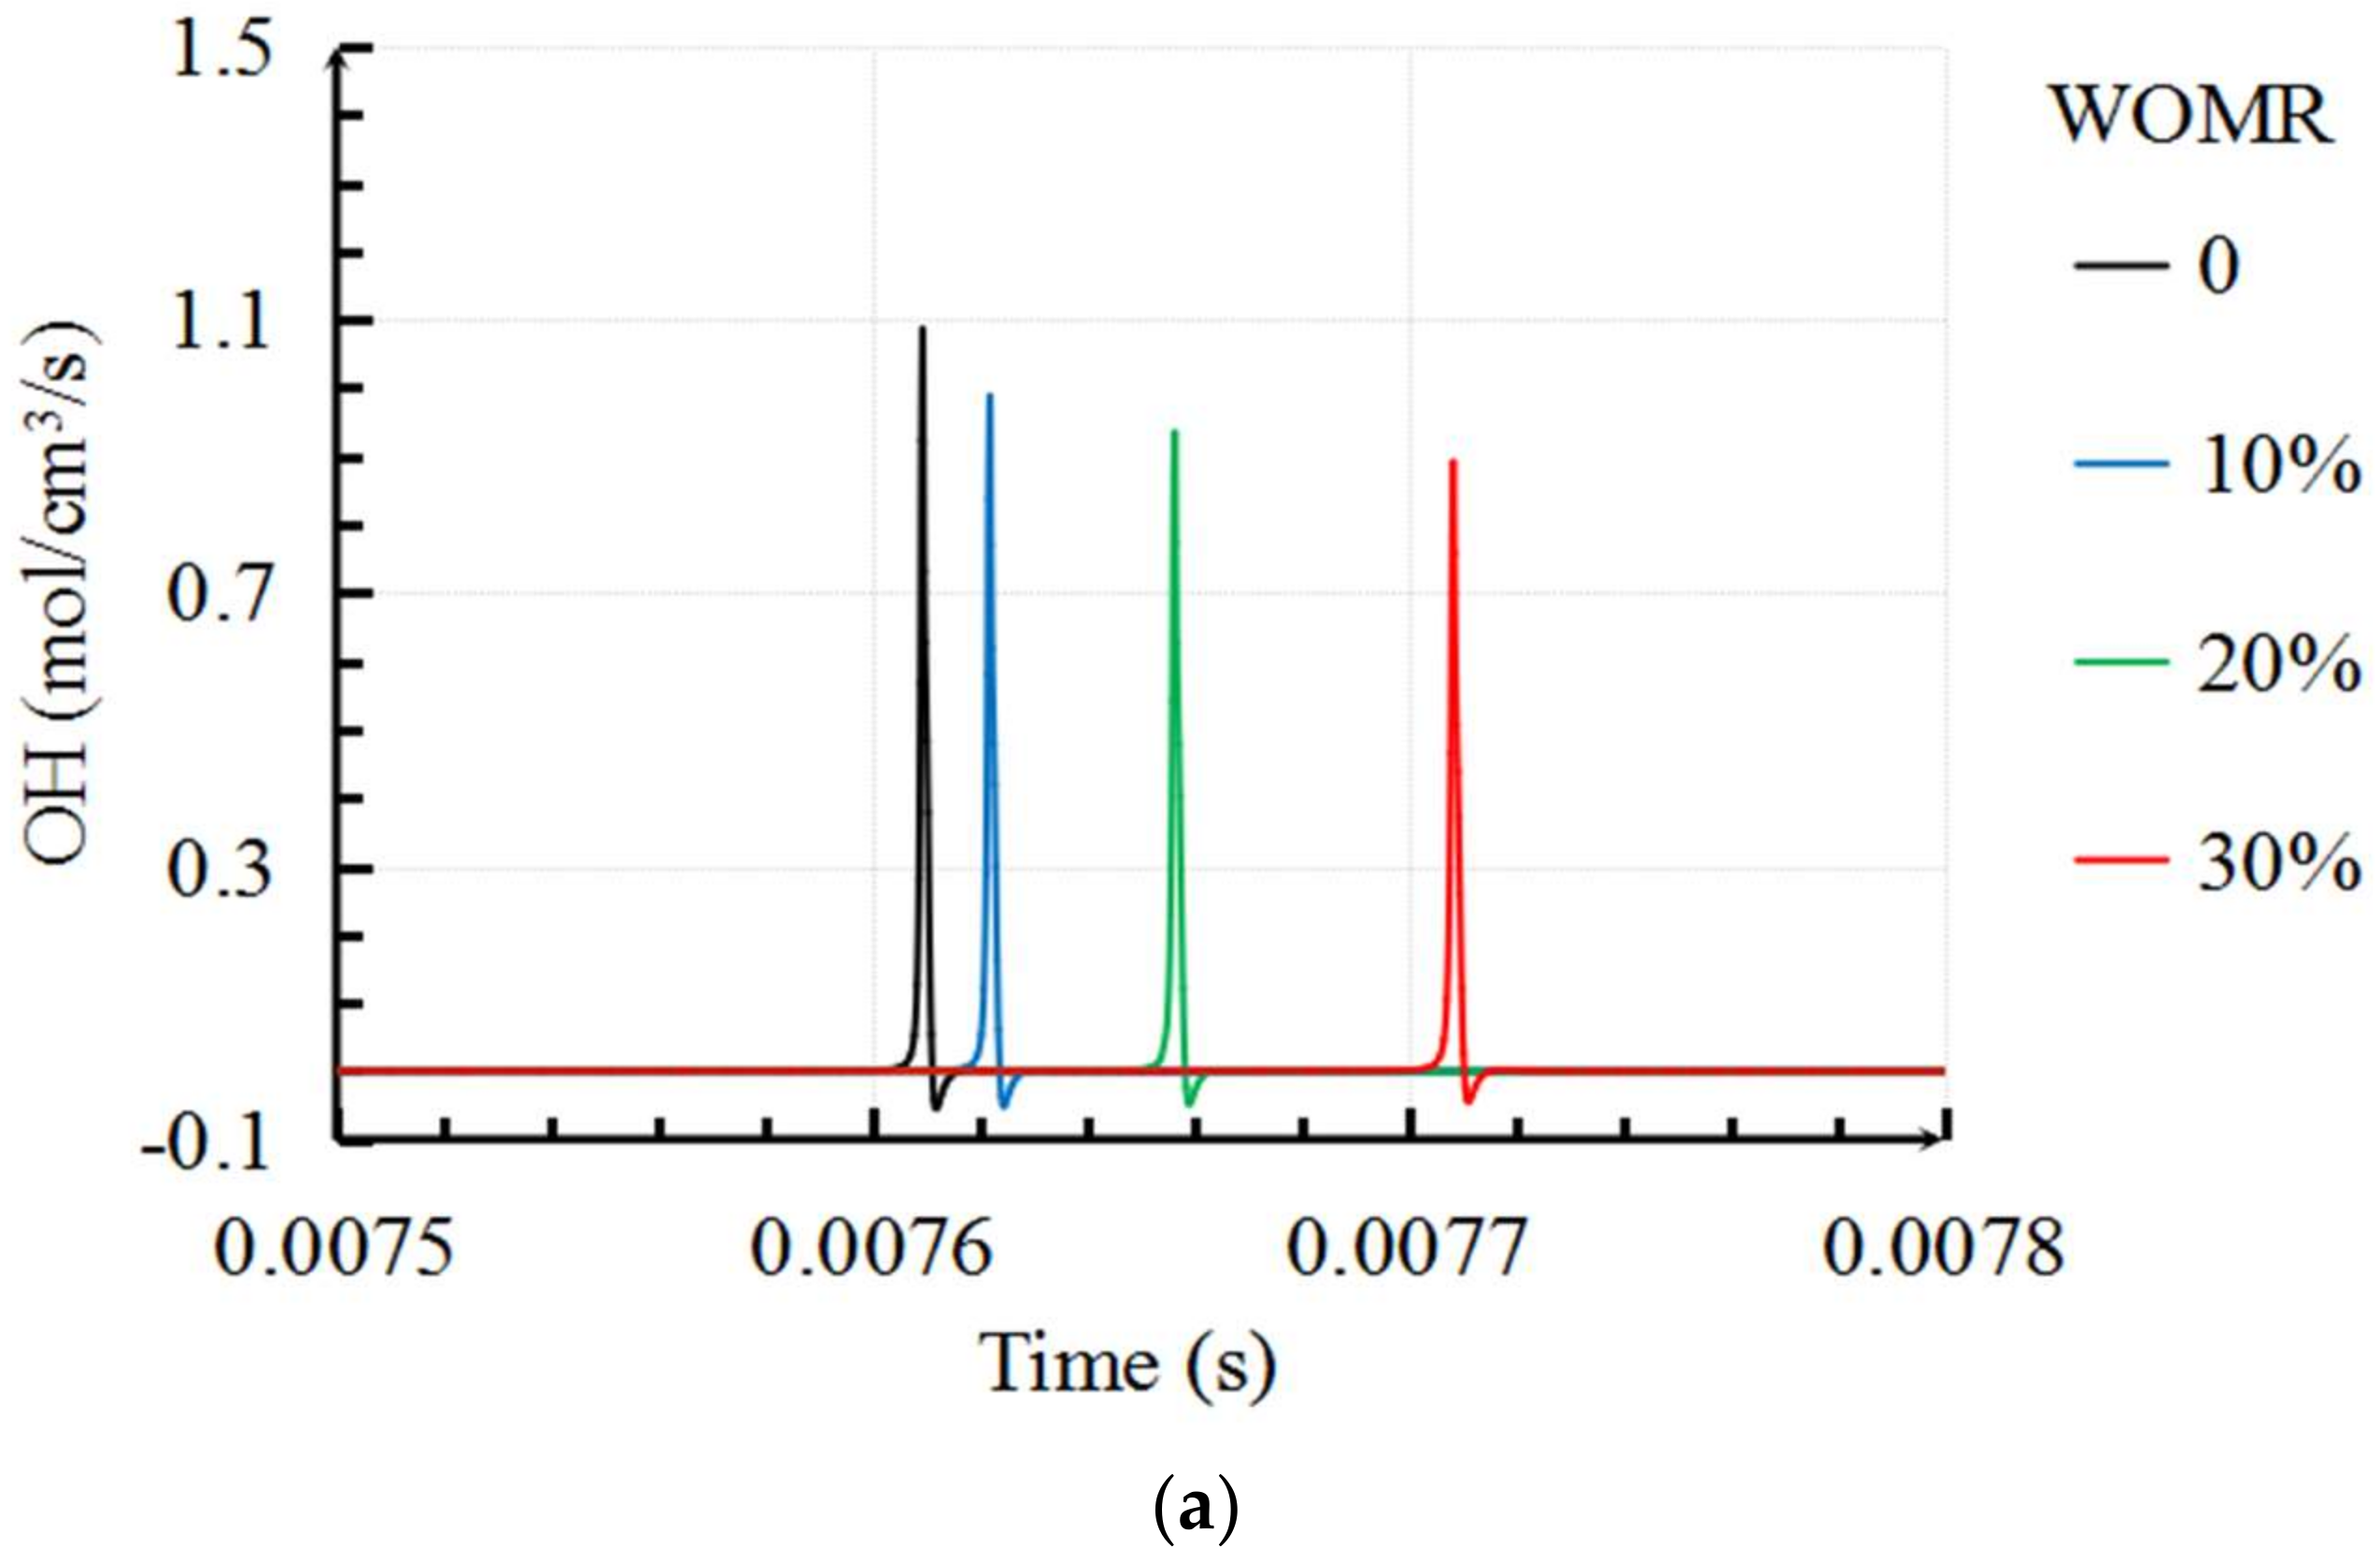
  • An obvious result of two stages reaction processes is obtained by the numerical method. When the temperature reaches to 1000 K, the temperature rises sharply, and the mixture enters the high temperature oxidation stage. The rapid consumption of H2O2 and the rapid generation of OH indicates the generation of the flame surface.
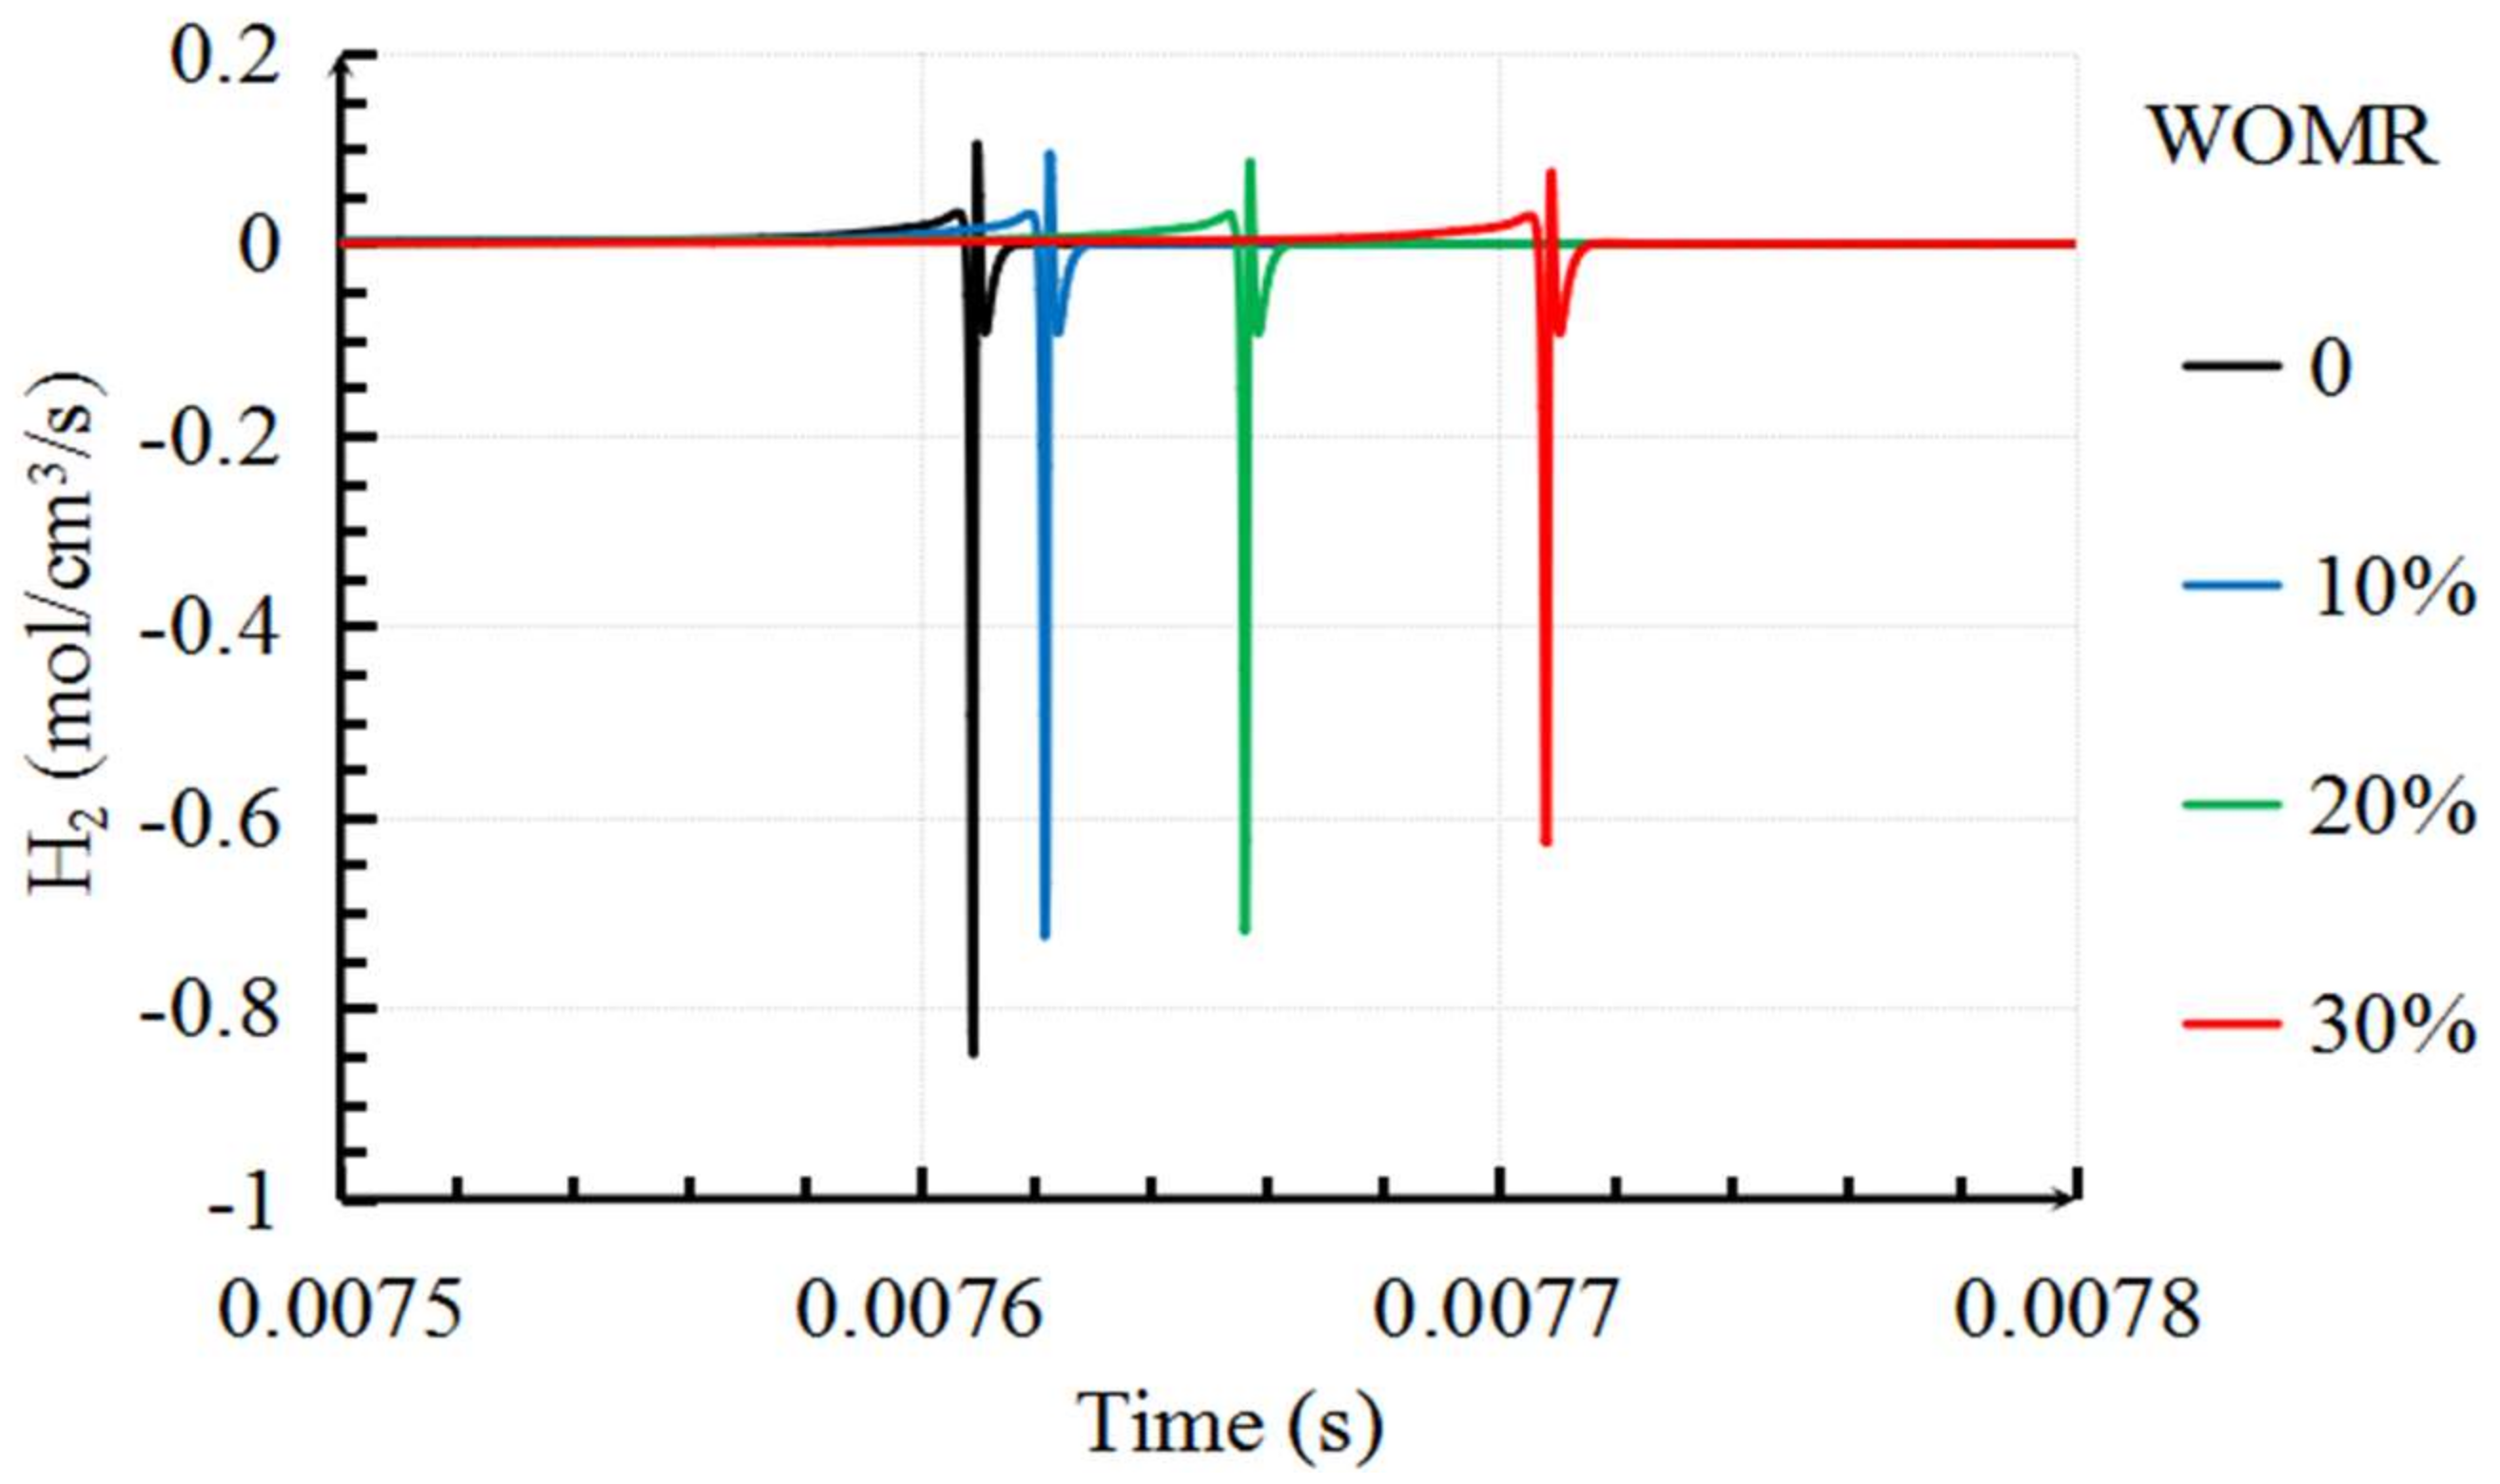
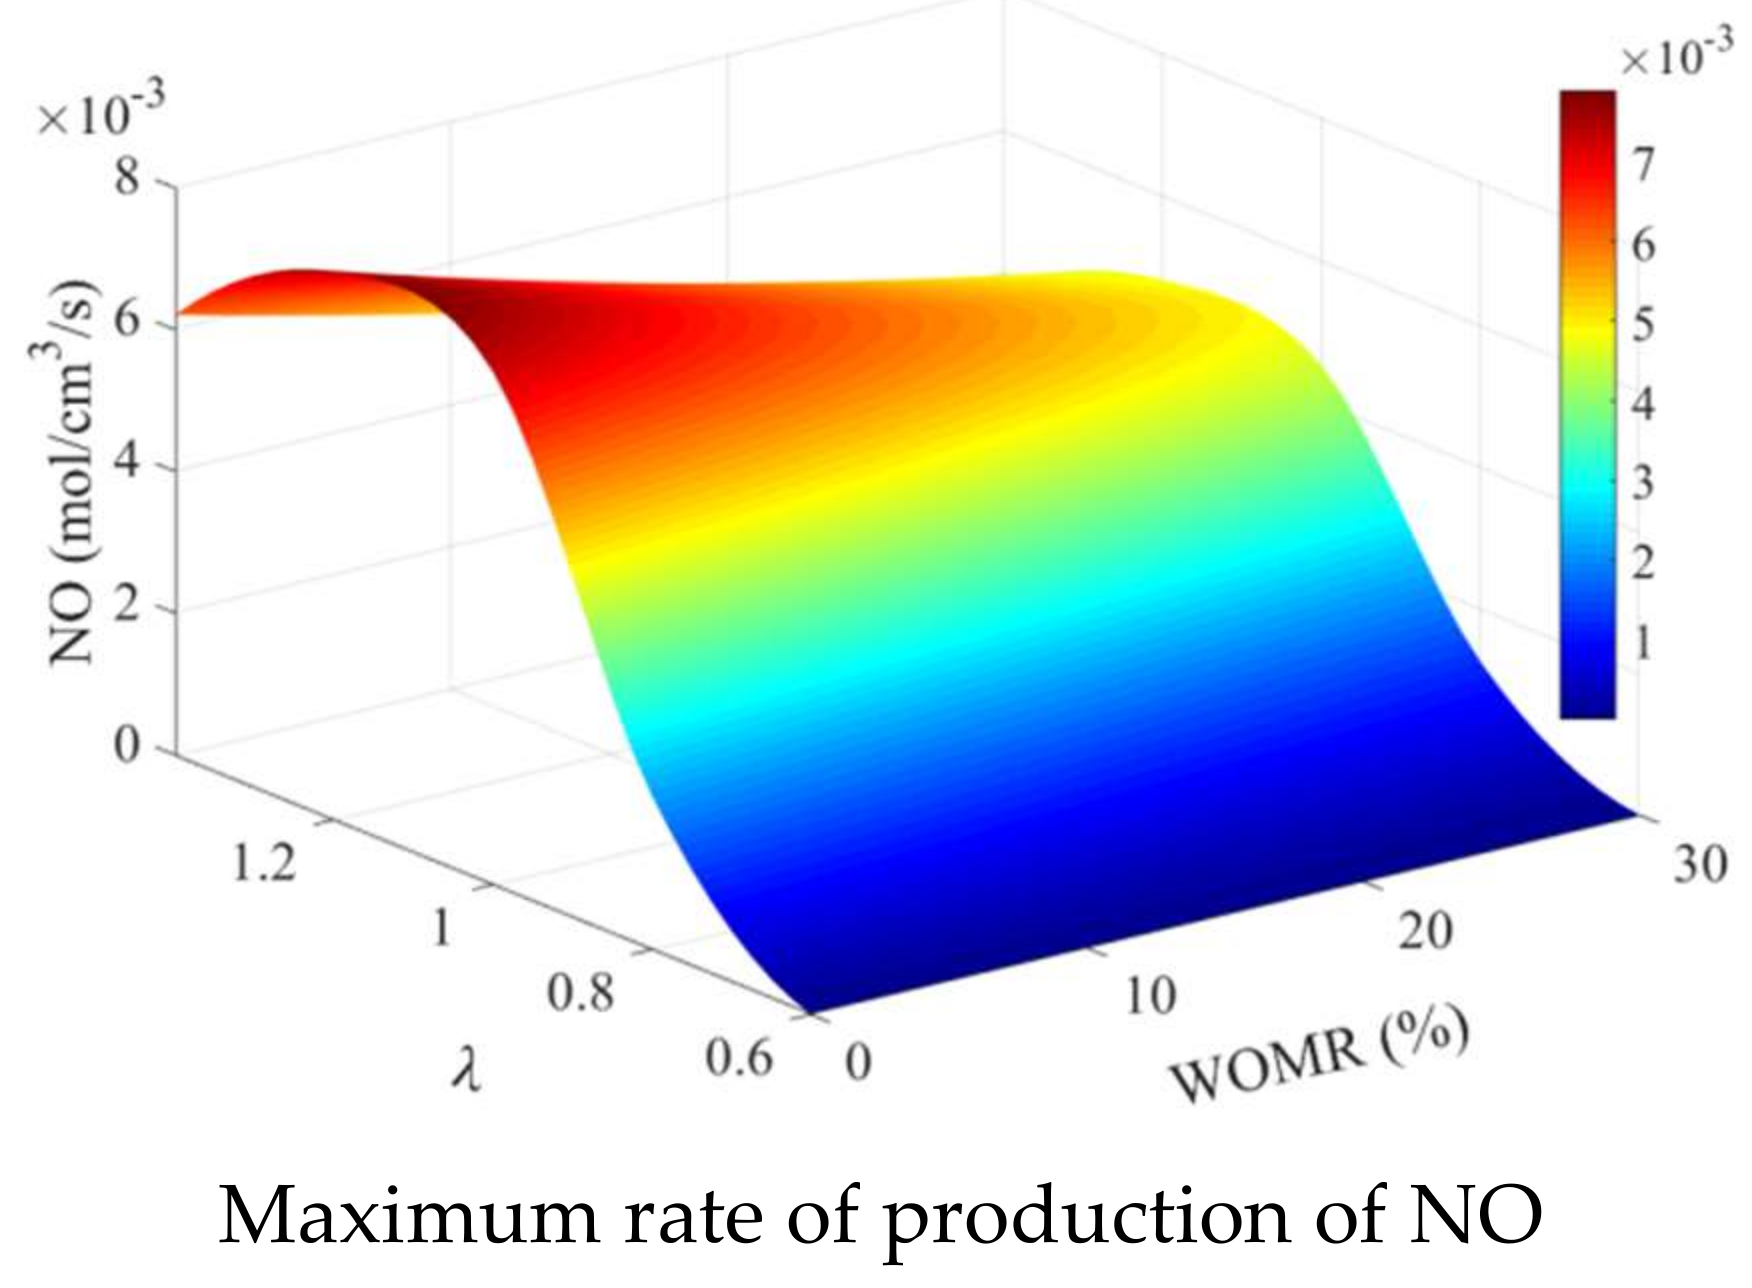
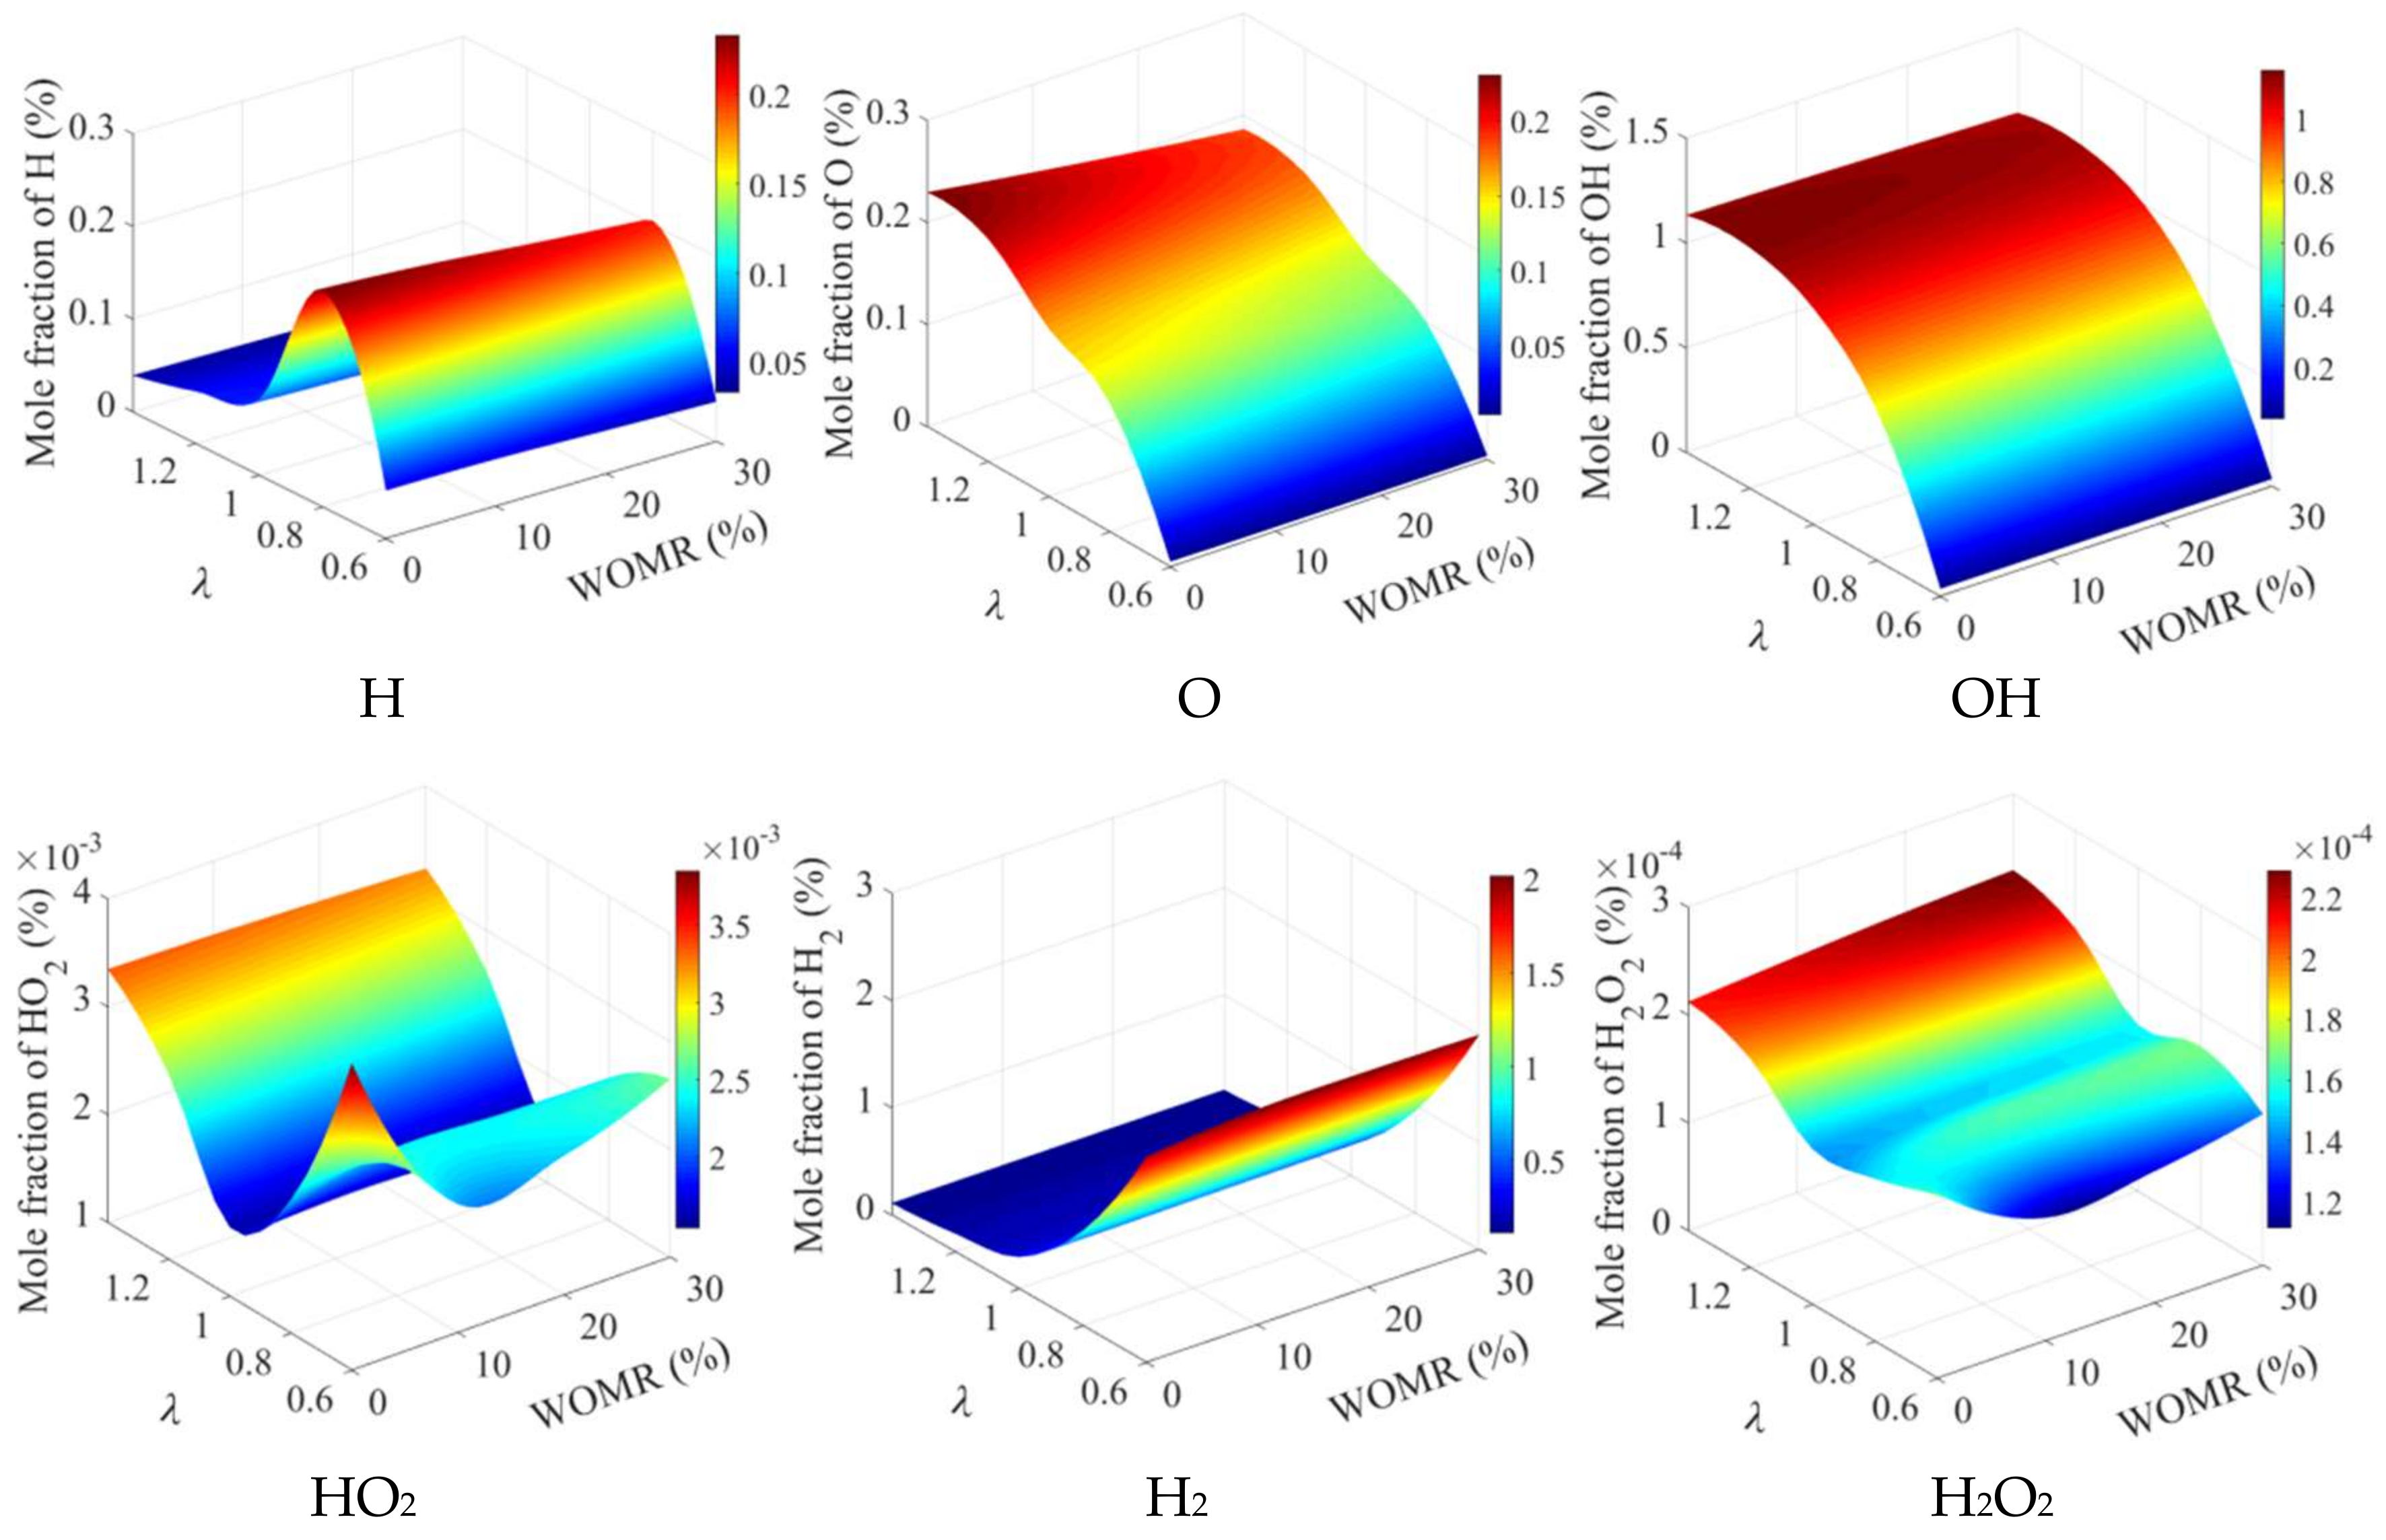
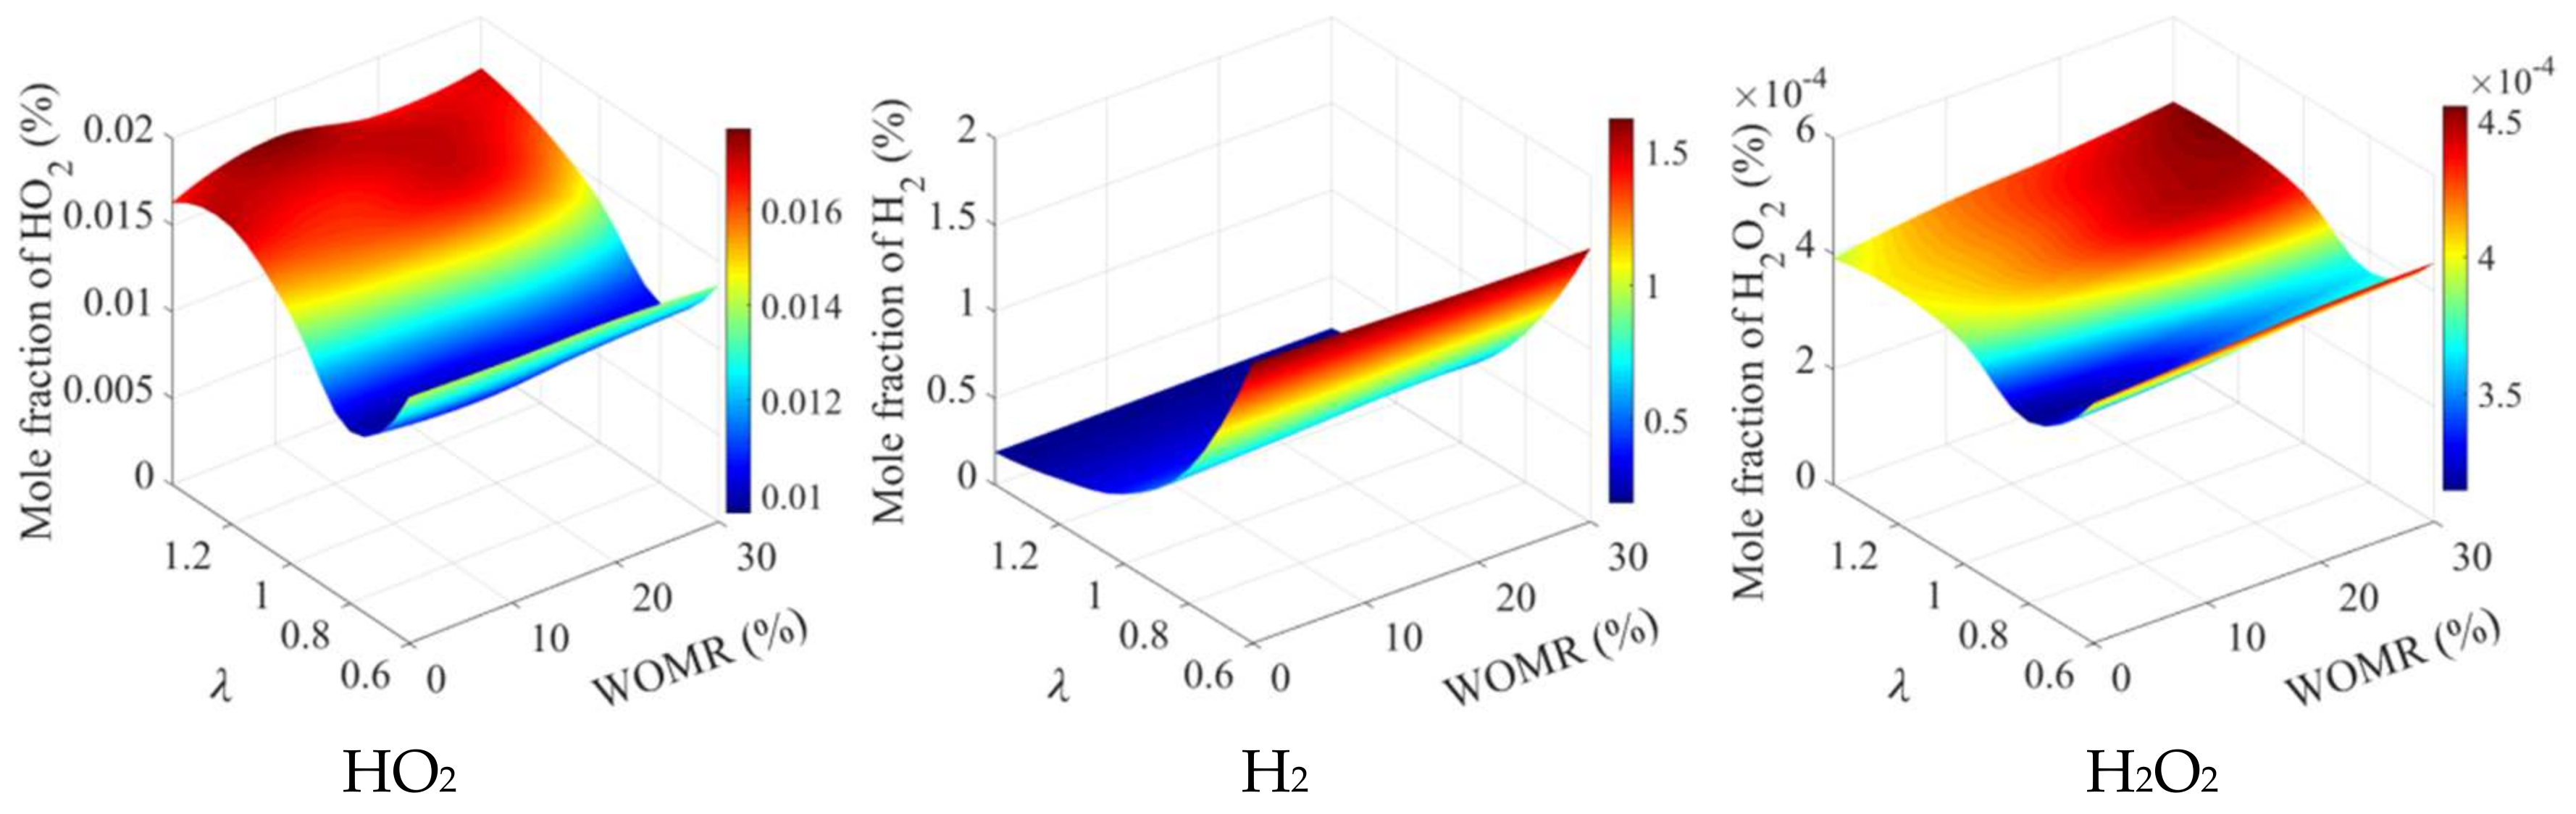
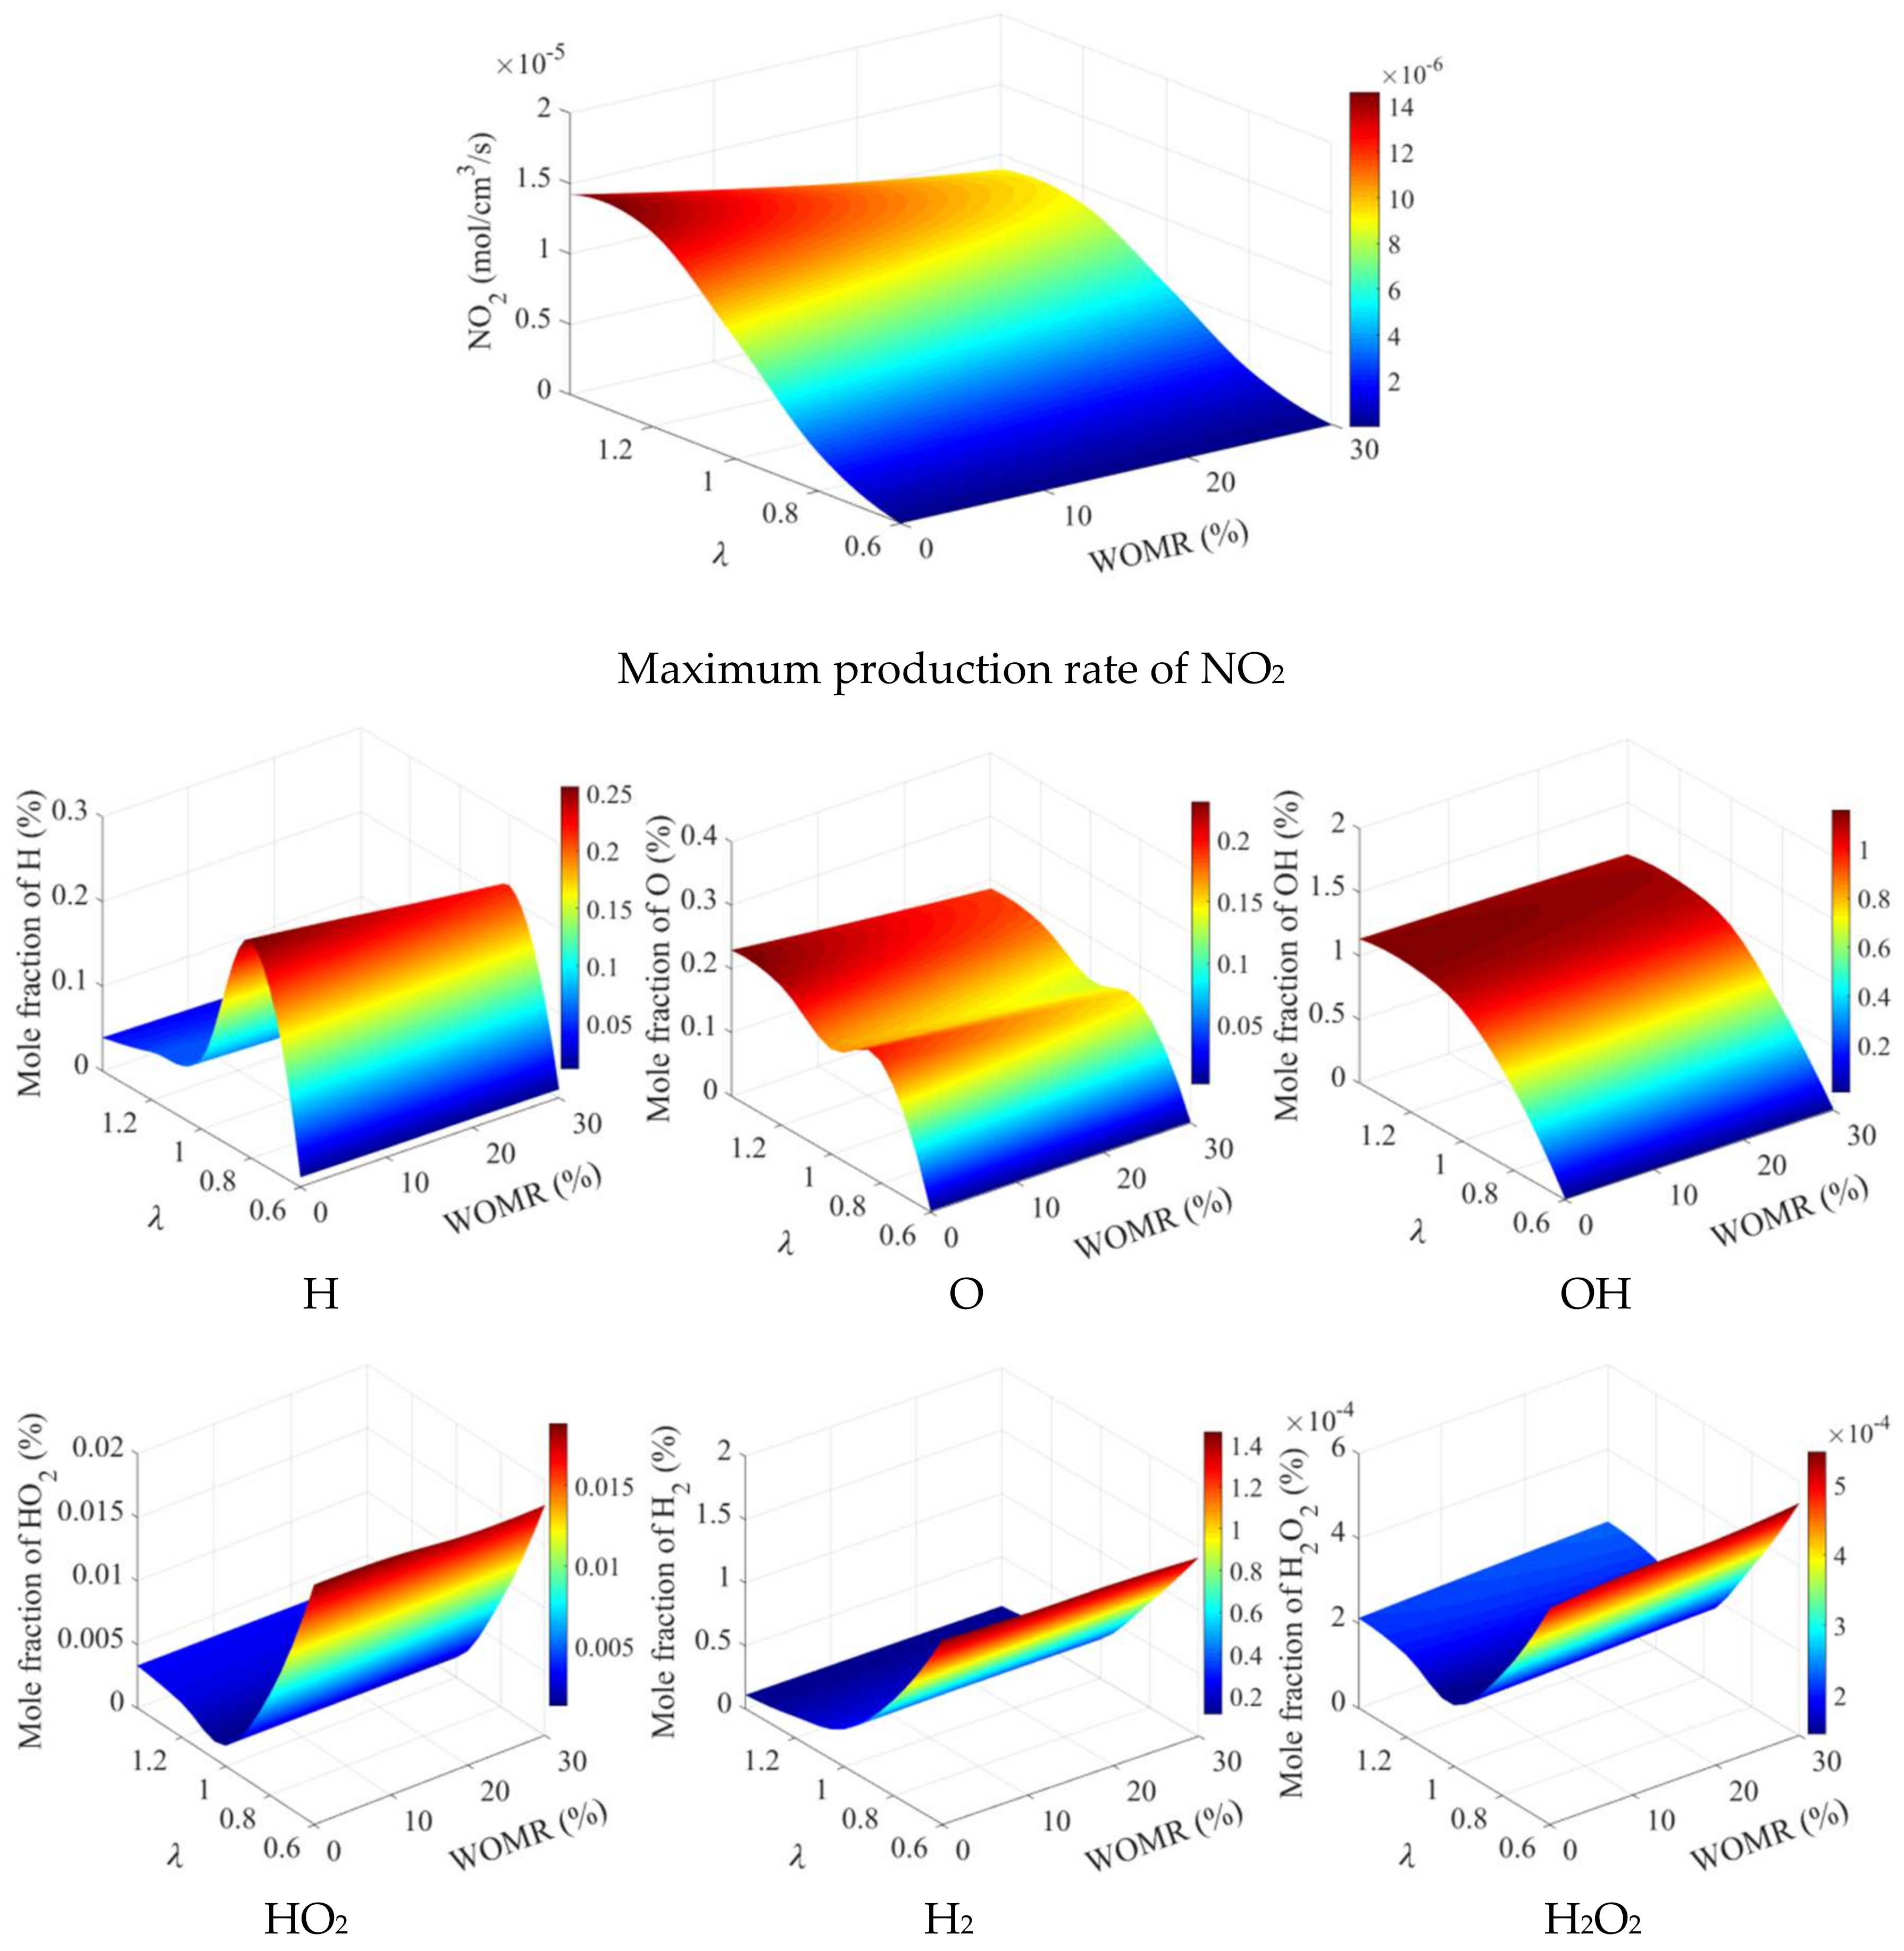
  • With the increase of water mass fraction, the response of the reaction of free radicals (H, O, OH, HO2, H2, H2O2) is lagged behind, meanwhile the peak value of the reaction rate decreases due to the increase of heat needed for activation reaction at the same activation energy and reaction temperature. When the water content increases 10%, the maximum generation rate of NO, N2O, NO2 decreases by 15.24%, 9.21%, 14.78% on average, respectively.
  • According to the correlation results, maximum production rate of NO and the mole fraction of O, OH, H2 have significant correlation relation; maximum production rate of N2O and the mole fraction of O, OH, HO2, H2 have significant correlation relation; maximum production rate of NO2 and the mole fraction of O, OH, HO2, H2, H2O2 have significant correlation relation. In contrast, OH, O and H2 play a more significant role in the common influence of the generation of nitrogen oxides.
  • According to the sensitivity results, elementary reactions #1 and #16 promote the generation of OH and O at the beginning of the second stage, but elementary reaction #9, #13 and #20 have a negative effect. Meanwhile the result is just opposite for effect of HO2 and H2.

Supplementary Materials

The supplementary material contains the mechanism document used in this article. The following are available online at https://www.mdpi.com/2076-3417/8/4/490/s1, mech.txt: it records the chemical reaction mechanism; thermo.txt: it records the thermodynamic parameters of the species; transport.txt: it records the transport parameters of the species.

Acknowledgments

This work is supported by the National Natural Science Foundation of China (NSFC, 51276079) and the Project 2017042 supported by the Graduate Innovation Fund of Jilin University. The authors appreciate the insightful comments and suggestions from the reviewers and the editor.

Author Contributions

Fengshuo He and Xiumin Yu conceived, designed and performed the experiments; Yaodong Du analyzed the data; Fengshuo He and Zezhou Guo wrote the paper.

Conflicts of Interest

The authors declare no conflict of interest.

Nomenclature

Hhydrogen atom
Ooxygen atom
OHhydroxyl radical
HO2hydroperoxyl radical
H2hydrogen
H2O2hydrogen peroxide
Mthird body
NOxnitrogen oxides
NOnitric oxide
NO2nitrogen dioxide
N2Onitrous oxide
EGRexhaust gas recirculation
PMparticle matter
COcarbon monoxide
CO2carbon dioxide
HChydrocarbon
CAcrank angle
PLIFplanar-laser-induced fluorescence
LIFlaser-induced fluorescence
LLNLLawrence Livermore National Laboratory
RCMrapid compression machine
GRIThe Gas Research Institute
C6H5CH3methylbenzene
iC5H12isopentane
iC8H18isooctane
nC5H12n-pentane
nC7H16n-heptane
O2oxygen
N2nitrogen
Arargon
λexcess air coefficient
WOMRwater-oil mass ratio
PPMCCPearson product-moment correlation coefficient
SRCCSpearman rank correlation coefficient
Symbols
C p k 0 specific heat capacity at constant pressure
H k 0 enthalpy
S k 0 entropy
C v k 0 the specific heat capacity at constant volume
U k 0 internal energy
G k 0 Gibbs free energy
a 1 k ~ a 7 k constant column
r water-oil mass ratio
m water mass of water
m oil mass of oil
(X, Y)two dimension random variables
(x, y)sample of (X, Y)
( R x , n , R y , n ) rank of ( x n , y n )
R x ¯ the mean value of R x
R y ¯ the mean value of R y
rsSpearman rank correlation coefficient
tindex of the significance test
α confidence level
C n-dimensional vector of the concentration
K the parameter of the system, which is related to the chemical reaction rate, the activation energy and so on
β i j the sensitivity of the component i to the reaction rate of the elementary reaction j

References

  1. Subramanian, K.A. A comparison of water–diesel emulsion and timed injection of water into the intake manifold of a diesel engine for simultaneous control of NO and smoke emissions. Energy Convers. Manag. 2011, 52, 849–857. [Google Scholar] [CrossRef]
  2. Awad, O.I.; Mamat, R.; Ibrahim, T.K.; Ali, O.M.; Kadirgama, K.; Leman, A.M. Performance and combustion characteristics of an SI engine fueled with fusel oil-gasoline at different water content. Appl. Thermal Eng. 2017, 123, 1374–1385. [Google Scholar] [CrossRef]
  3. Elsanusi, O.A.; Roy, M.M.; Sidhu, M.S. Experimental Investigation on a Diesel Engine Fueled by Diesel-Biodiesel Blends and their Emulsions at Various Engine Operating Conditions. Appl. Energy 2017, 203, 582–593. [Google Scholar] [CrossRef]
  4. Tauzia, X.; Maiboom, A.; Shah, S.R. Experimental study of inlet manifold water injection on combustion and emissions of an automotive direct injection Diesel engine. Energy 2010, 35, 3628–3639. [Google Scholar] [CrossRef]
  5. Kökkülünk, G.; Gonca, G.; Ayhan, V.; Cesur, İ.; Parlak, A. Theoretical and experimental investigation of diesel engine with steam injection system on performance and emission parameters. Appl. Thermal Eng. 2013, 54, 161–170. [Google Scholar] [CrossRef]
  6. Tesfa, B.; Mishra, R.; Gu, F.; Ball, A.D. Water injection effects on the performance and emission characteristics of a CI engine operating with biodiesel. Renew. Energy 2012, 37, 333–344. [Google Scholar] [CrossRef]
  7. Prasad, S.; Gonsalvis, J.; Vijay, V.S. Effect of Introduction of Water into Combustion Chamber of Diesel Engines—A Review. Energy Power 2015, 5, 28–33. [Google Scholar] [CrossRef]
  8. Kyriakides, A.; Dimas, V.; Lymperopoulou, E.; Karonis, D.; Lois, E. Evaluation of gasoline–ethanol–water ternary mixtures used as a fuel for an Otto engine. Fuel 2013, 108, 208–215. [Google Scholar] [CrossRef]
  9. Ge, J.; Yoon, S.; Choi, N. Using Canola Oil Biodiesel as an Alternative Fuel in Diesel Engines: A Review. Appl. Sci. 2017, 7, 881. [Google Scholar] [CrossRef]
  10. Ge, J.C.; Kim, H.Y.; Yoon, S.K.; Choi, N.J. Reducing volatile organic compound emissions from diesel engines using canola oil biodiesel fuel and blends. Fuel 2018, 218, 266–274. [Google Scholar] [CrossRef]
  11. Wang, J.-K.; Li, J.-L.; Wu, M.-H.; Chen, R.-H. Reduction of Nitric Oxide Emission from a SI Engine by Water Injection at the Intake Runner. In Proceedings of the ASME 2009 International Mechanical Engineering Congress and Exposition, Lake Buena Vista, FL, USA, 13–19 November 2009; pp. 335–340. [Google Scholar]
  12. Taghavifar, H.; Anvari, S.; Parvishi, A. Benchmarking of water injection in a hydrogen-fueled diesel engine to reduce emissions. Int. J. Hydrog. Energy 2017, 42, 11962–11975. [Google Scholar] [CrossRef]
  13. Lee, D.; Lee, J.S.; Kim, H.Y.; Chun, C.K.; James, S.C.; Yoon, S.S. Experimental Study on the Combustion and NOx Emission Characteristics of DME/LPG Blended Fuel Using Counterflow Burner. Combust. Sci. Technol. 2012, 184, 97–113. [Google Scholar] [CrossRef]
  14. Schulz, C.; Sick, V. Tracer-LIF diagnostics: Quantitative measurement of fuel concentration, temperature and fuel/air ratio in practical combustion systems. Prog. Energy Combust. Sci. 2005, 31, 75–121. [Google Scholar] [CrossRef]
  15. Bai, L.; Zhao, S.; Fu, Y.; Cheng, Y. Experimental study of mass transfer in water/ionic liquid microdroplet systems using micro-LIF technique. Chem. Eng. J. 2016, 298, 281–290. [Google Scholar] [CrossRef]
  16. Davis, S.G.; Joshi, A.V.; Wang, H.; Egolfopoulos, F. An optimized kinetic model of H2/CO combustion. Proc. Combust. Inst. 2005, 30, 1283–1292. [Google Scholar] [CrossRef]
  17. Donato, N.; Petersen, E. Simplified correlation models for CO/H2 chemical reaction times. Int. J. Hydrogen Energy 2008, 33, 7565–7579. [Google Scholar] [CrossRef]
  18. CHEMKIN Tutorials Manual; CHEMKIN-PRO 15131; CHEMKIN Software: San Diego, CA, USA, 2013.
  19. Gordon, S.; McBride, B.J. Computer Program for Calculation of Complex Chemical Equilibrium Compositions, Rocket Performance, Incident and Reflected Shocks and Chapman-Jouguet Detonations; NASA Report SP-273; NASA: Cleveland, OH, USA, 1971.
  20. Chen, Y.; Wolk, B.; Mehl, M.; Cheng, W.K.; Chen, J.-Y.; Dibble, R.W. Development of a reduced chemical mechanism targeted for a 5-component gasoline surrogate: A case study on the heat release nature in a GCI engine. Combust. Flame 2017, 178, 268–276. [Google Scholar] [CrossRef]
  21. Mehl, M.; Pitz, W.J.; Westbrook, C.K.; Curran, H.J. Kinetic modeling of gasoline surrogate components and mixtures under engine conditions. Proc. Combust. Inst. 2011, 33, 193–200. [Google Scholar] [CrossRef]
  22. Dong, S.; Yang, C.; Ou, B.; Lu, H.; Cheng, X. Experimental investigation on the effects of nozzle-hole number on combustion and emission characteristics of ethanol/diesel dual-fuel engine. Fuel 2018, 217, 1–10. [Google Scholar] [CrossRef]
  23. Fu, X.-Q.; He, B.-Q.; Li, H.-T.; Chen, T.; Xu, S.-P.; Zhao, H. Effect of direct injection dimethyl ether on the micro-flame ignited (MFI) hybrid combustion and emission characteristics of a 4-stroke gasoline engine. Fuel Process. Technol. 2017, 167, 555–562. [Google Scholar] [CrossRef]
  24. Zhen, X.; Wang, Y.; Liu, D. An overview of the chemical reaction mechanisms for gasoline surrogate fuels. Appl. Thermal Eng. 2017, 124, 1257–1268. [Google Scholar] [CrossRef]
  25. Smith, G.P.; Golden, D.M.; Frenklach, M.; Moriarty, N.W.; Eiteneer, B.; Goldenberg, M.; Bowman, C.T.; Hanson, R.K.; Song, S.; Gardiner, W.C., Jr.; et al. GRI-Mech 3.0. Available online: http://www.me.berkeley.edu/gri_mech/ (accessed on 22 March 2018).
  26. Biagioli, F.; Güthe, F. Effect of pressure and fuel–air unmixedness on NOx emissions from industrial gas turbine burners. Combust. Flame 2007, 151, 274–288. [Google Scholar] [CrossRef]
  27. Sangl, J.; Mayer, C.; Sattelmayer, T. Prediction of the NOx-Emissions of a Swirl Burner in Partially and Fully Premixed Mode on the Basis of Water Channel LIF and PIV Measurements. In Proceedings of the ASME Turbo Expo 2013: Turbine Technical Conference and Exposition, San Antonio, TX, USA, 3–7 June 2013; p. V01BT04A058. [Google Scholar]
  28. Sundaram, B.; Klimenko, A.Y.; Cleary, M.J.; Maas, U. Prediction of NOx in premixed high-pressure lean methane flames with a MMC-partially stirred reactor. Proc. Combust. Inst. 2015, 35, 1517–1525. [Google Scholar] [CrossRef]
  29. Standard Test Method for Dynamic Viscosity and Density of Liquids by Stabinger Viscometer (and the Calculation of Kinematic Viscosity); ASTM D7042-16e3; ASTM International: West Conshohocken, PA, USA, 2016.
  30. Standard Test Method for Determination of Individual Components in Spark Ignition Engine Fuels by 50-Metre Capillary High Resolution Gas Chromatography; ASTM D6733-01(2016); ASTM International: West Conshohocken, PA, USA, 2016.
  31. Standard Test Method for Research Octane Number of Spark-Ignition Engine Fuel; ASTM D2699-17; ASTM International: West Conshohocken, PA, USA, 2017.
  32. Standard Test Method for Motor Octane Number of Spark-Ignition Engine Fuel; ASTM D2700-17a; ASTM International: West Conshohocken, PA, USA, 2017.
  33. Slack, M.W. Rate coefficient for H + O2 + M = HO2 + M evaluated from shock tube measurements of induction times. Combust. Flame 1977, 28, 241–249. [Google Scholar] [CrossRef]
  34. Das, L. Hydrogen engine: Research and development (R&D) programmes in Indian Institute of Technology (IIT), Delhi. Int. J. Hydrogen Energy 2002, 27, 953–965. [Google Scholar] [CrossRef]
  35. Verhelst, S.; Sierens, R.; Verstraeten, S. A Critical Review of Experimental Research on Hydrogen Fueled SI Engines; SAE Technical Paper 2006-01-0430; SAE: Warrendale, PA, USA, 2006. [Google Scholar]
  36. Maghbouli, A.; Yang, W.; An, H.; Shafee, S.; Li, J.; Mohammadi, S. Modeling knocking combustion in hydrogen assisted compression ignition diesel engines. Energy 2014, 76, 768–779. [Google Scholar] [CrossRef]
  37. Myers, J.L.; Well, A. Research Design and Statistical Analysis, 2nd ed.; Lawrence Erlbaum Associates: Mahwah, NJ, USA, 2003; ISBN 978-0-8058-4037-7. [Google Scholar]
  38. Zar, J.H. Significance Testing of the Spearman Rank Correlation Coefficient. J. Am. Stat. Assoc. 1972, 67, 578. [Google Scholar] [CrossRef]
Figure 1. The iterative process of the intermediate products, NOx and temperature (λ = 1, WOMR = 0). (a) Global comparison; (b) Detail comparison 1; (c) Detail comparison 2.
Applsci 08 00490 g001
Figure 2. Reaction rate of H2O2 at different WOMR (λ = 1). (a) Global profile comparison; (b) Detail profile comparison 1; (c) Detail profile comparison 2.
Applsci 08 00490 g002
Figure 3. Reaction rate of H2 at different WOMR (λ = 1).
Applsci 08 00490 g003
Figure 4. Reaction rate of OH, HO2, H and O at different WOMR (λ = 1). (a) Reaction rate of OH; (b) Reaction rate of HO2; (c) Reaction rate of H; (d) Reaction rate of O.
Applsci 08 00490 g004aApplsci 08 00490 g004b
Figure 5. Mole fraction of free radicals corresponding to maximum rate of production of NO.
Applsci 08 00490 g005aApplsci 08 00490 g005b
Figure 6. Mole fraction of free radicals corresponding to maximum rate of production of N2O.
Applsci 08 00490 g006aApplsci 08 00490 g006b
Figure 7. Mole fraction of free radicals corresponding to maximum rate of production of NO2.
Applsci 08 00490 g007
Figure 8. Result of Student’s t significance test for SRCC (confidence level α = 0.05 ).
Applsci 08 00490 g008
Figure 9. Sensitivity diagram of OH, O, HO2, H2 (at the time of the second stage starting point). (a) Normalized sensitivity of OH (b) Normalized sensitivity of O; (c) Normalized sensitivity of HO2 (d) Normalized sensitivity of H2.
Applsci 08 00490 g009
Table 1. Properties of the oil and experimental settings.
CategoryValue
Fuel mixture (mol. %)C6H5CH3: 37%, iC5H12: 27%, iC8H18: 27%,
nC5H12: 5%, nC7H16: 4%
Dynamic viscosity (kg·m−1·s−1)3.1 × 10⁻⁴ (at 25 °C, 1 atm) [29,30]
Density (kg·m3)804 (at 25 °C, 1 atm) [29,30]
RON95.4 [30,31]
MON87.8 [30,32]
Oxidizer mixture (mol. %)O2: 21%, N2: 78%, Ar: 1%
Initial conditionT: 800 K, P: 8 atm, V: 65 cm3
λ0.6, 0.8, 1, 1.2, 1.4
Water-oil mass ratio0, 10%, 20%, 30%
Table 2. Elementary reactions sequence in recombination mechanism.
ReactionSerial Number
H + O2 <=> O + OH1
O + H2 <=> H + OH2
OH + H2 <=> H + H2O3
O + H2O <=> 2OH4
H2O + M <=> H + OH + M8
H + O2(+M) <=> HO2(+M)9
HO2 + H <=> H2 + O210
HO2 + OH <=> H2O + O213
H2O2(+M) <=> 2OH(+M)16
H2O2 + H <=> H2 + HO218
H2O2 + O <=> OH + HO219
H2O2 + OH <=> H2O + HO220
Table 3. SRCC matrix of free radicals mole fraction and maximum reaction rate of NOx.
XHOOHHO2H2H2O2
YNO0.00750.85860.89170.03160.77890.3368
N2O0.14740.99400.86020.76990.93830.0857
NO20.08870.91280.9789−0.5744−0.9639−0.6662

