Microstructure-Based Prediction of the Elastic Behaviour of Hydrating Cement Pastes

 ,
,  ,
,  ,
,  ,
, 
Abstract
:1. Introduction
2. Material and Mixtures
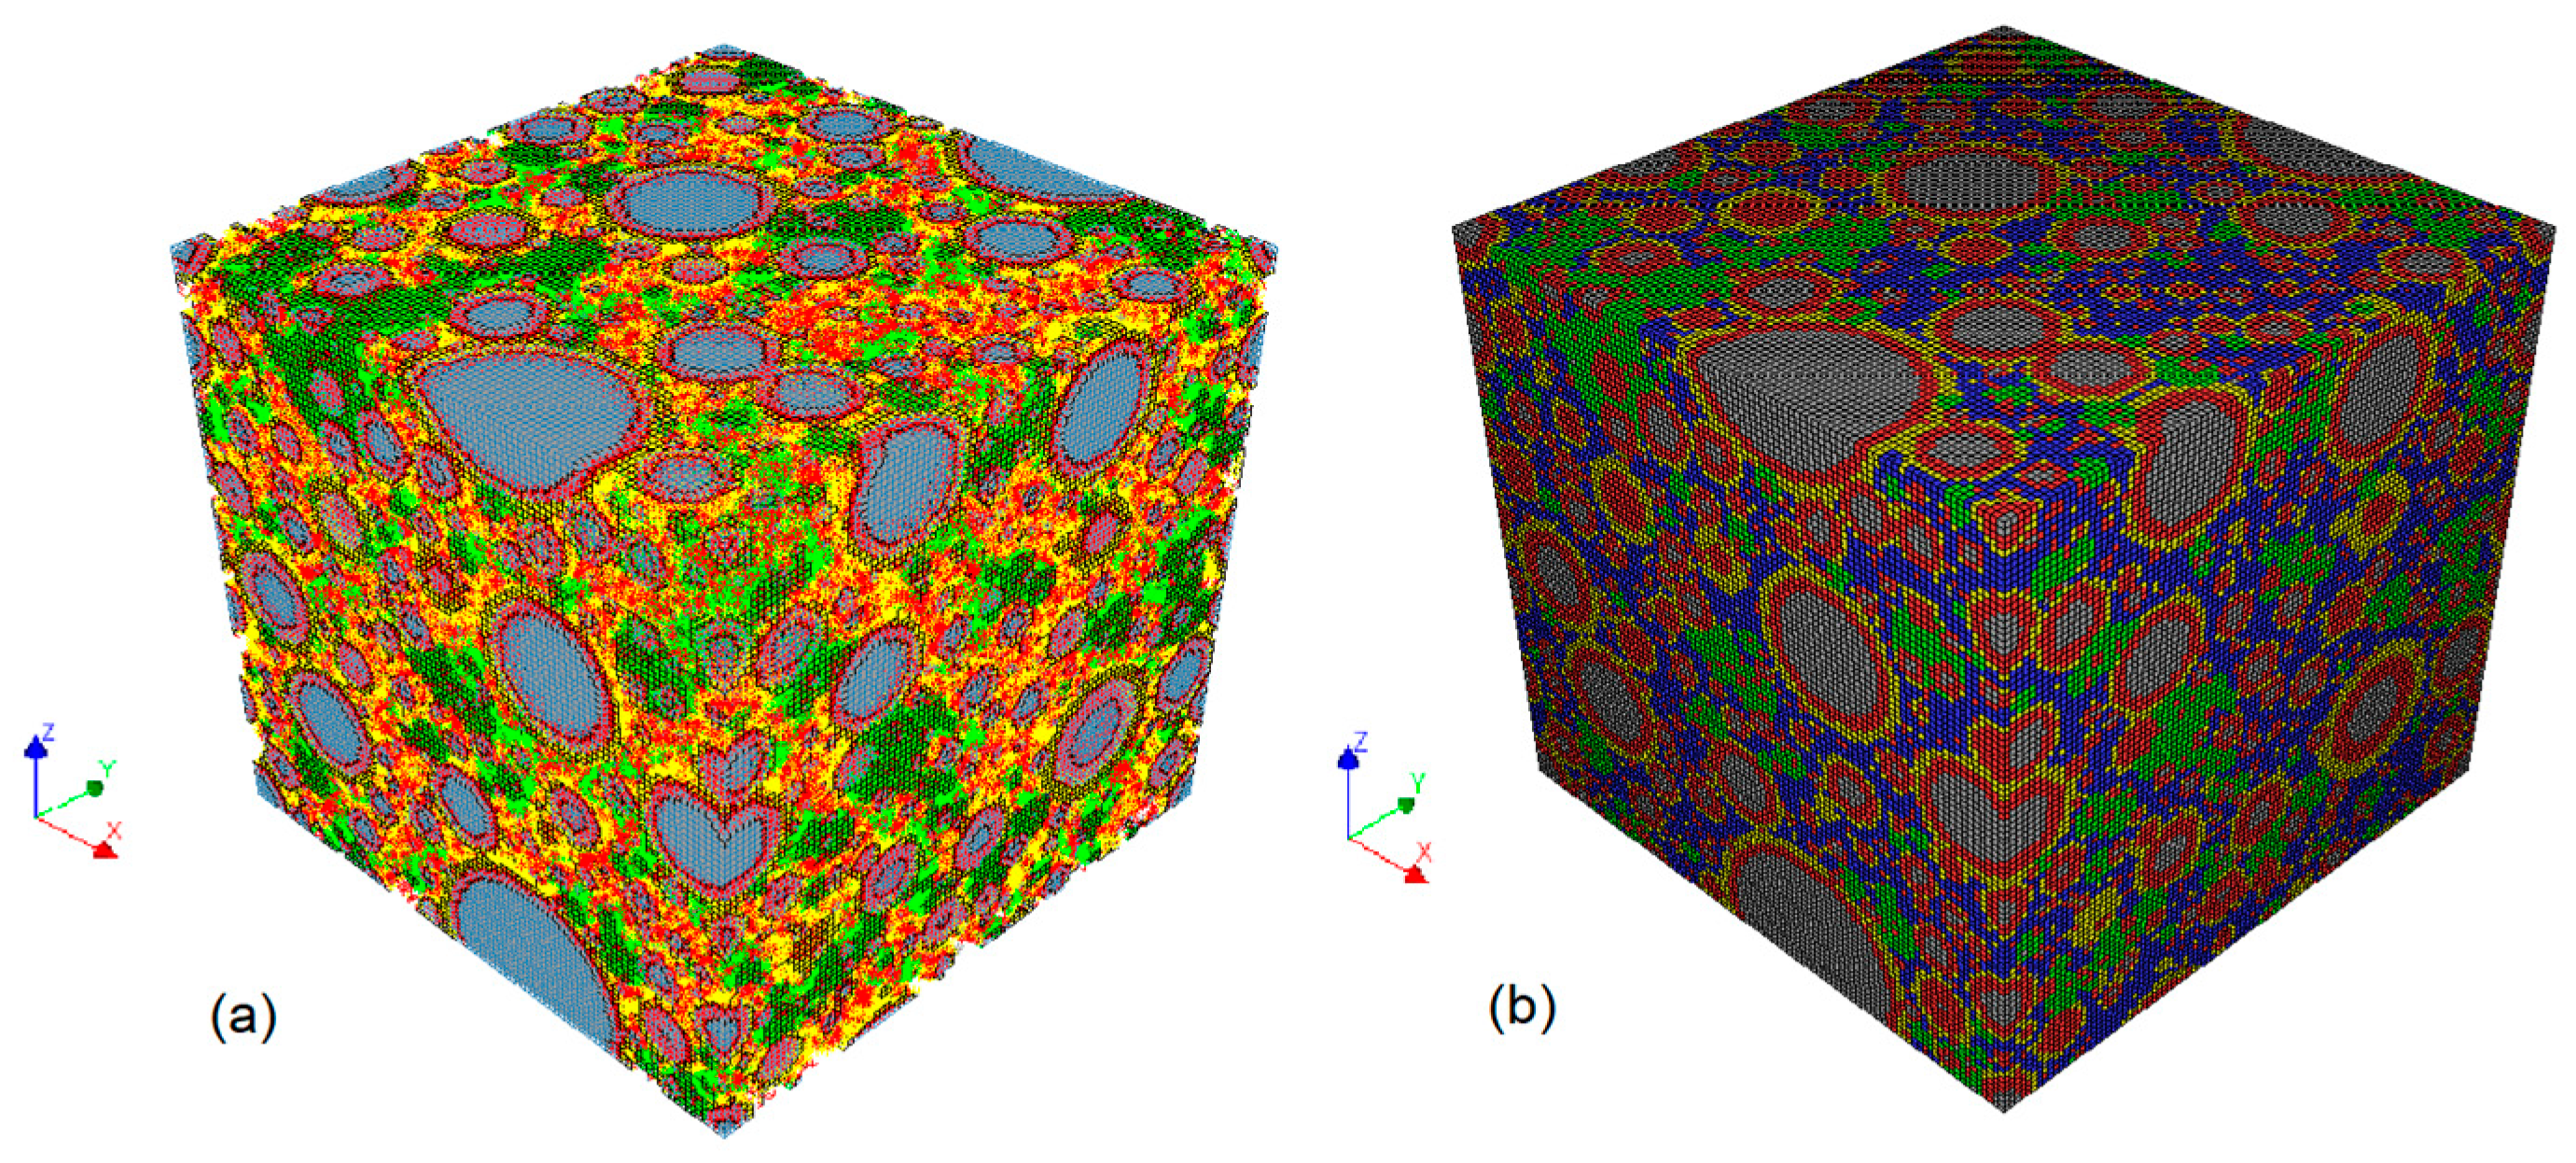
3. Microstructure of the Cement Paste
4. Mechanical Model
4.1. Lattice Model
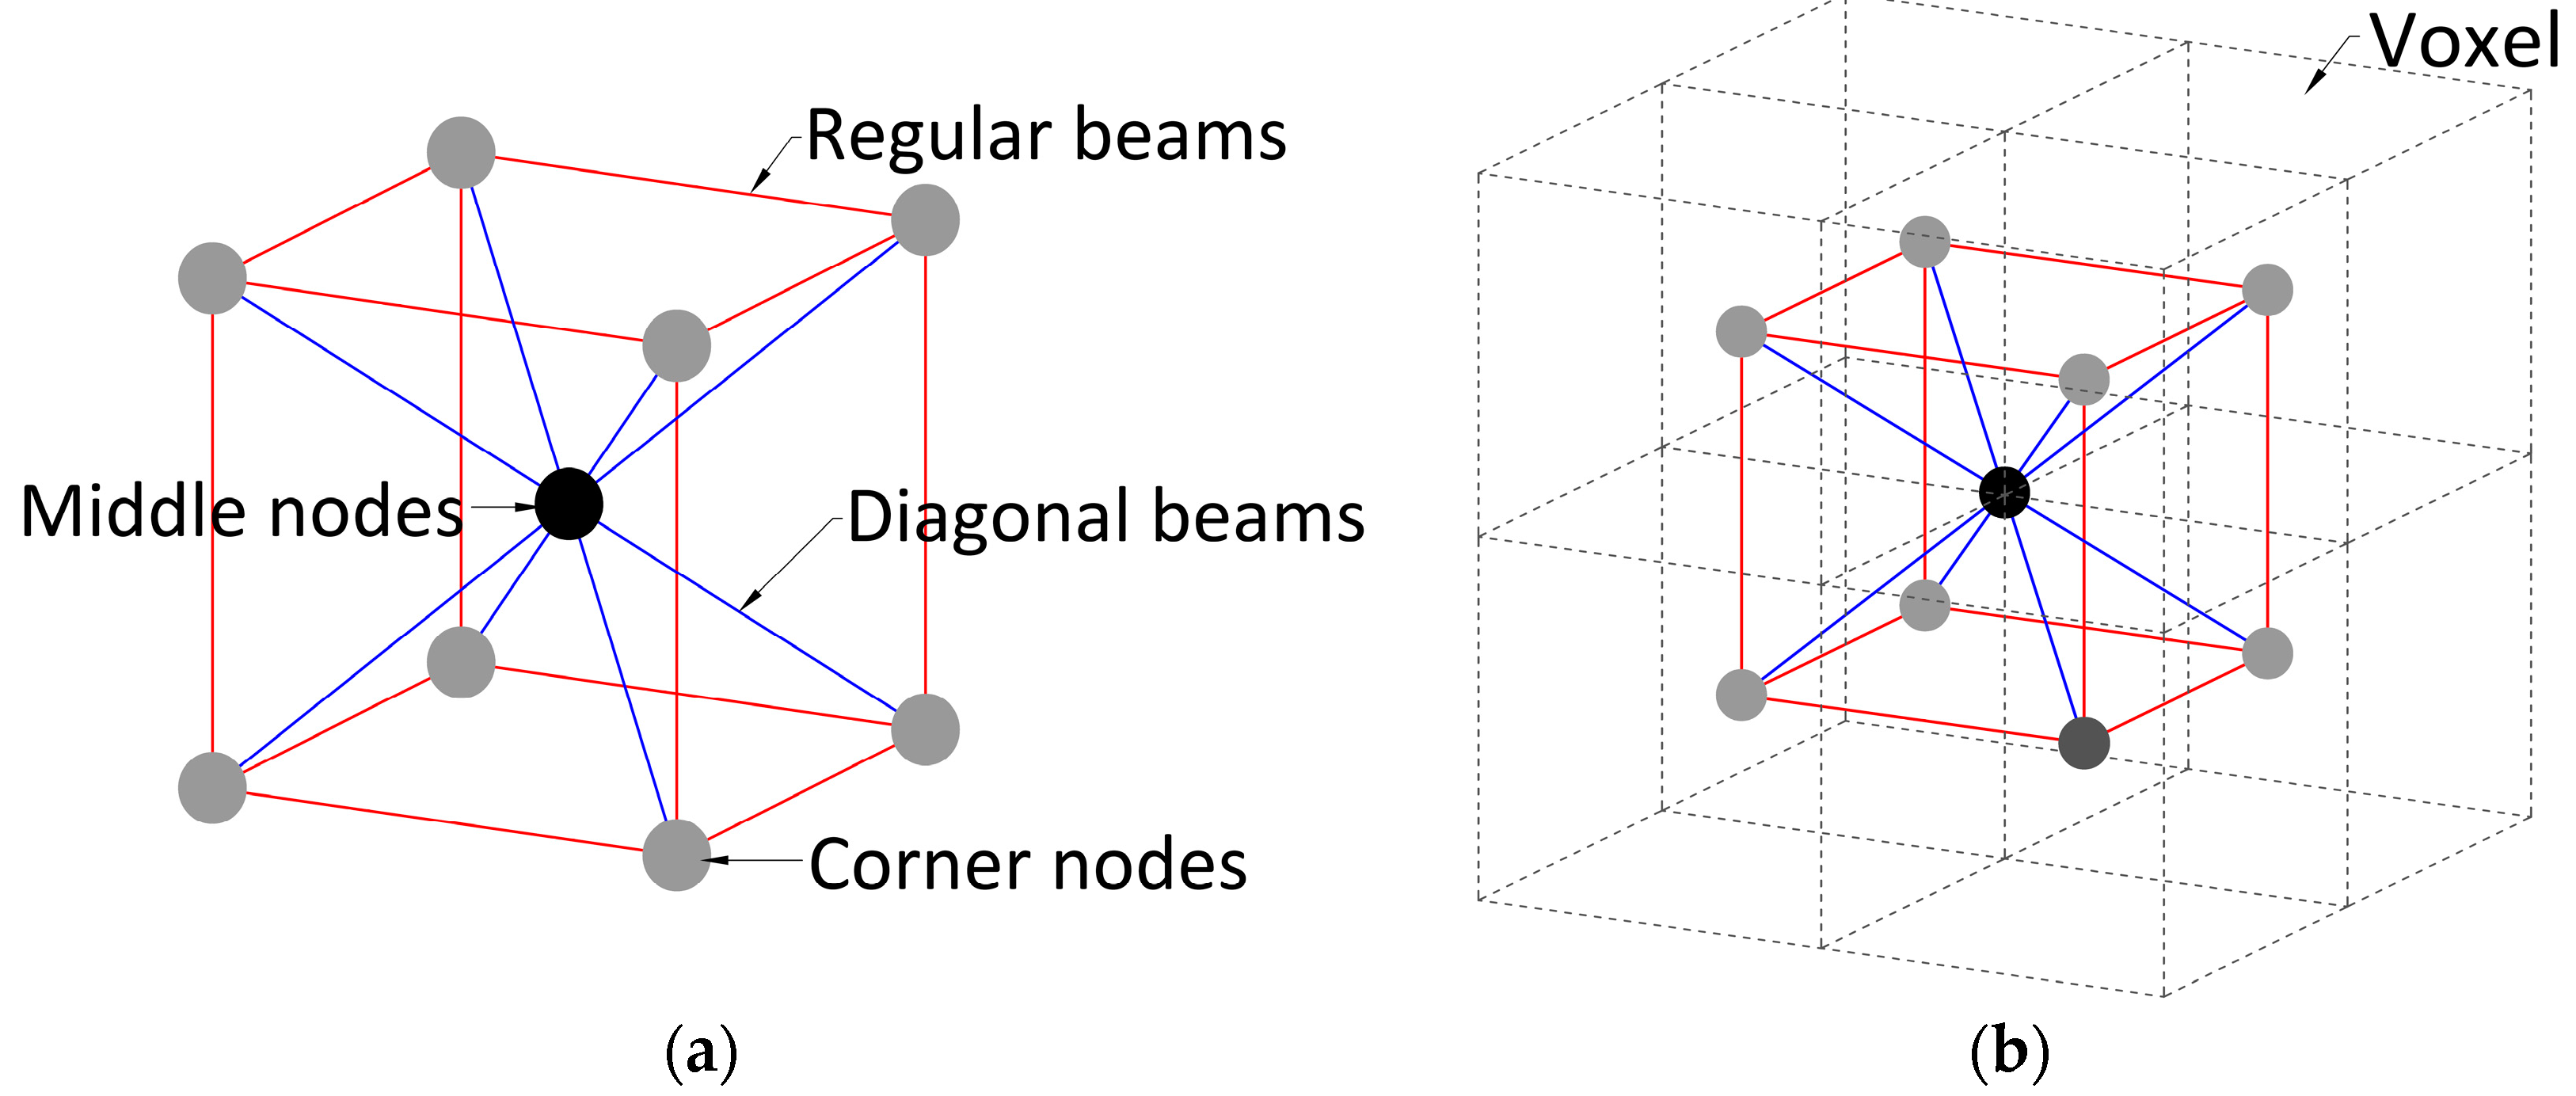
4.1.1. Lattice Construction
4.1.2. Boundary Conditions and Effective Elastic Modulus
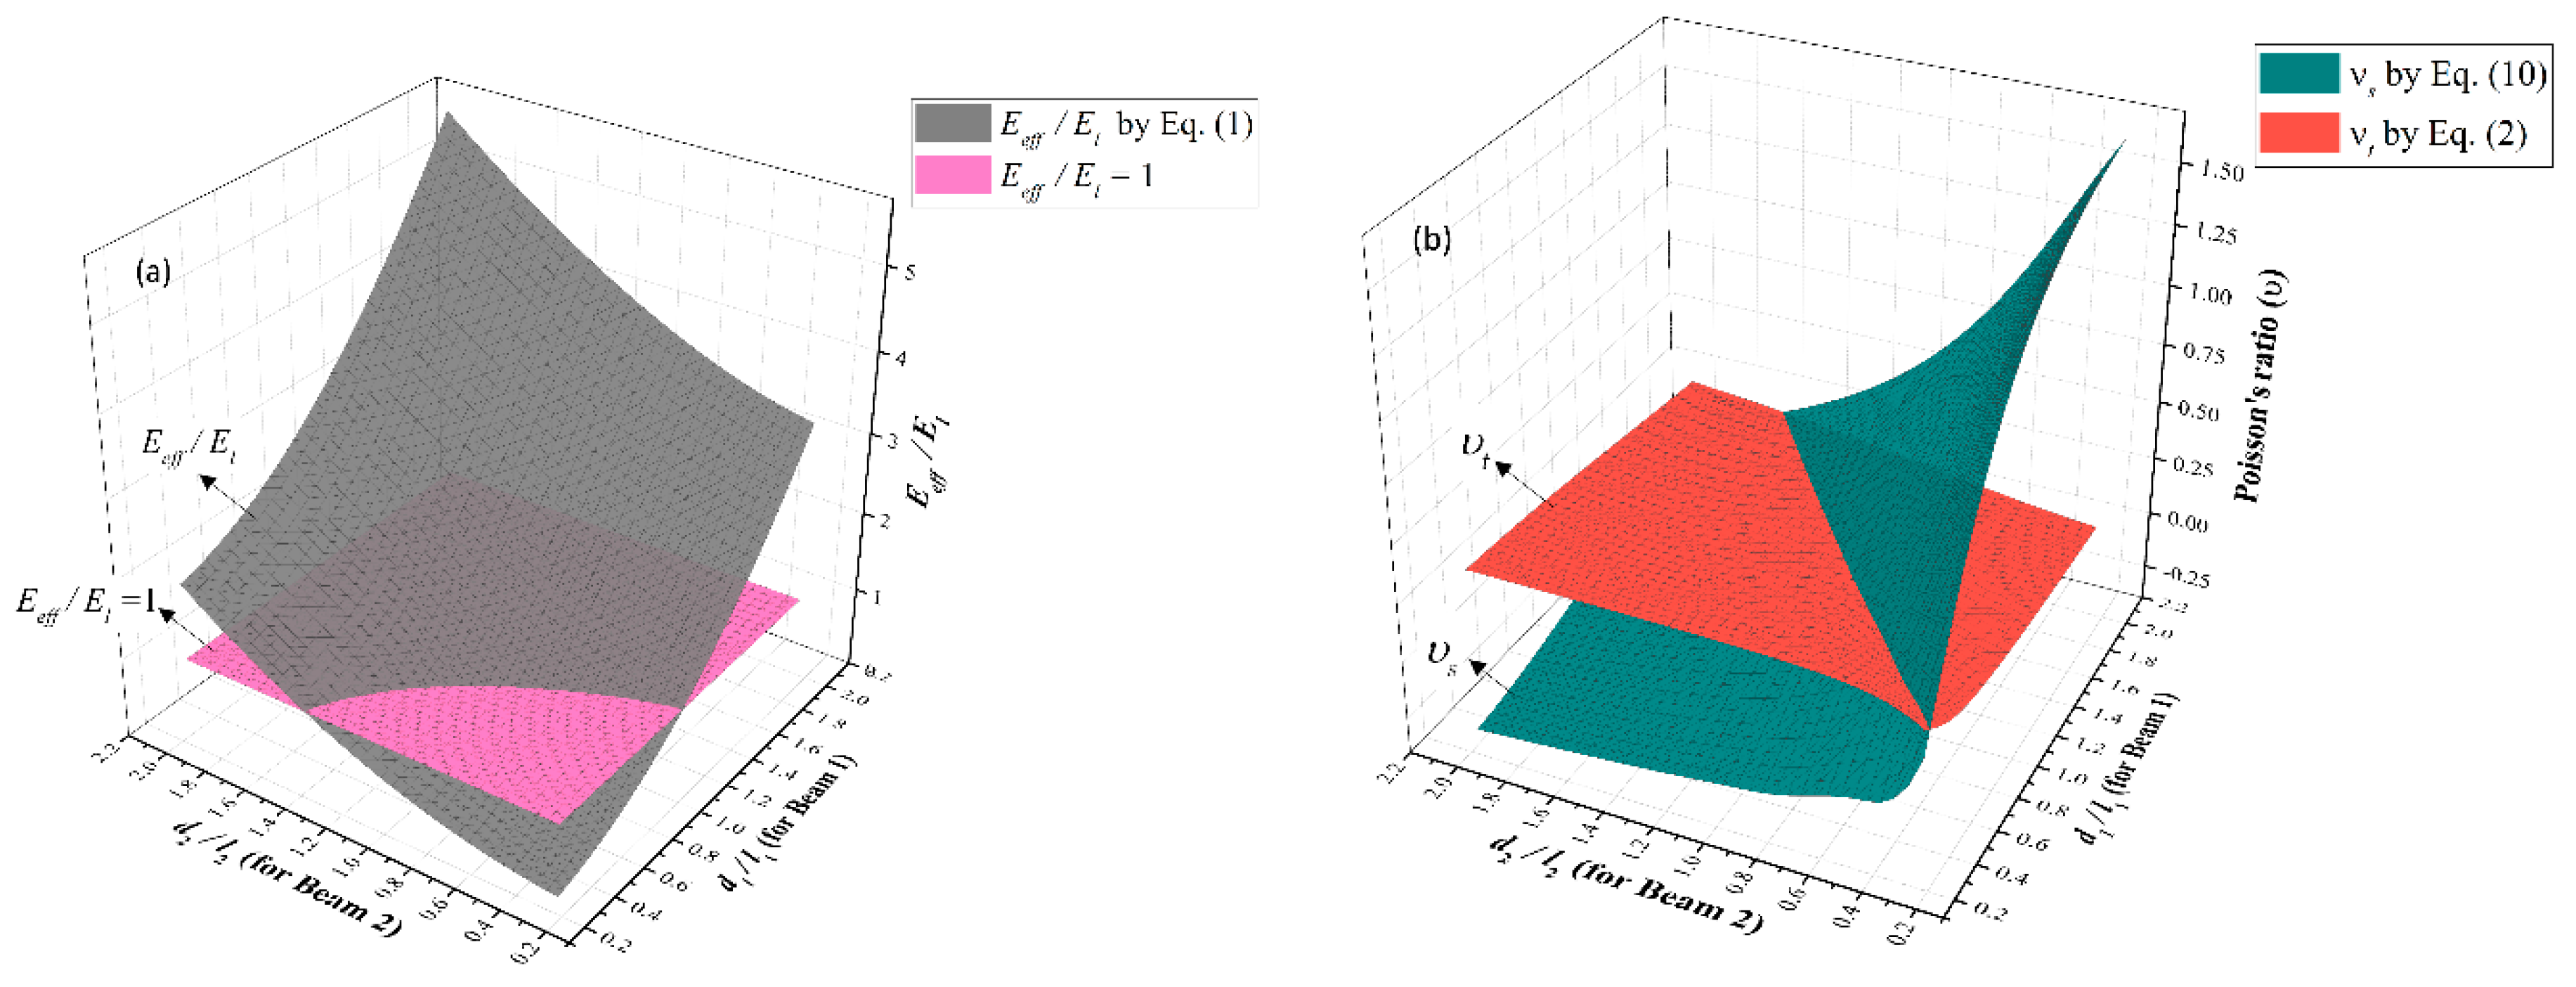
4.1.3. Beam Elements
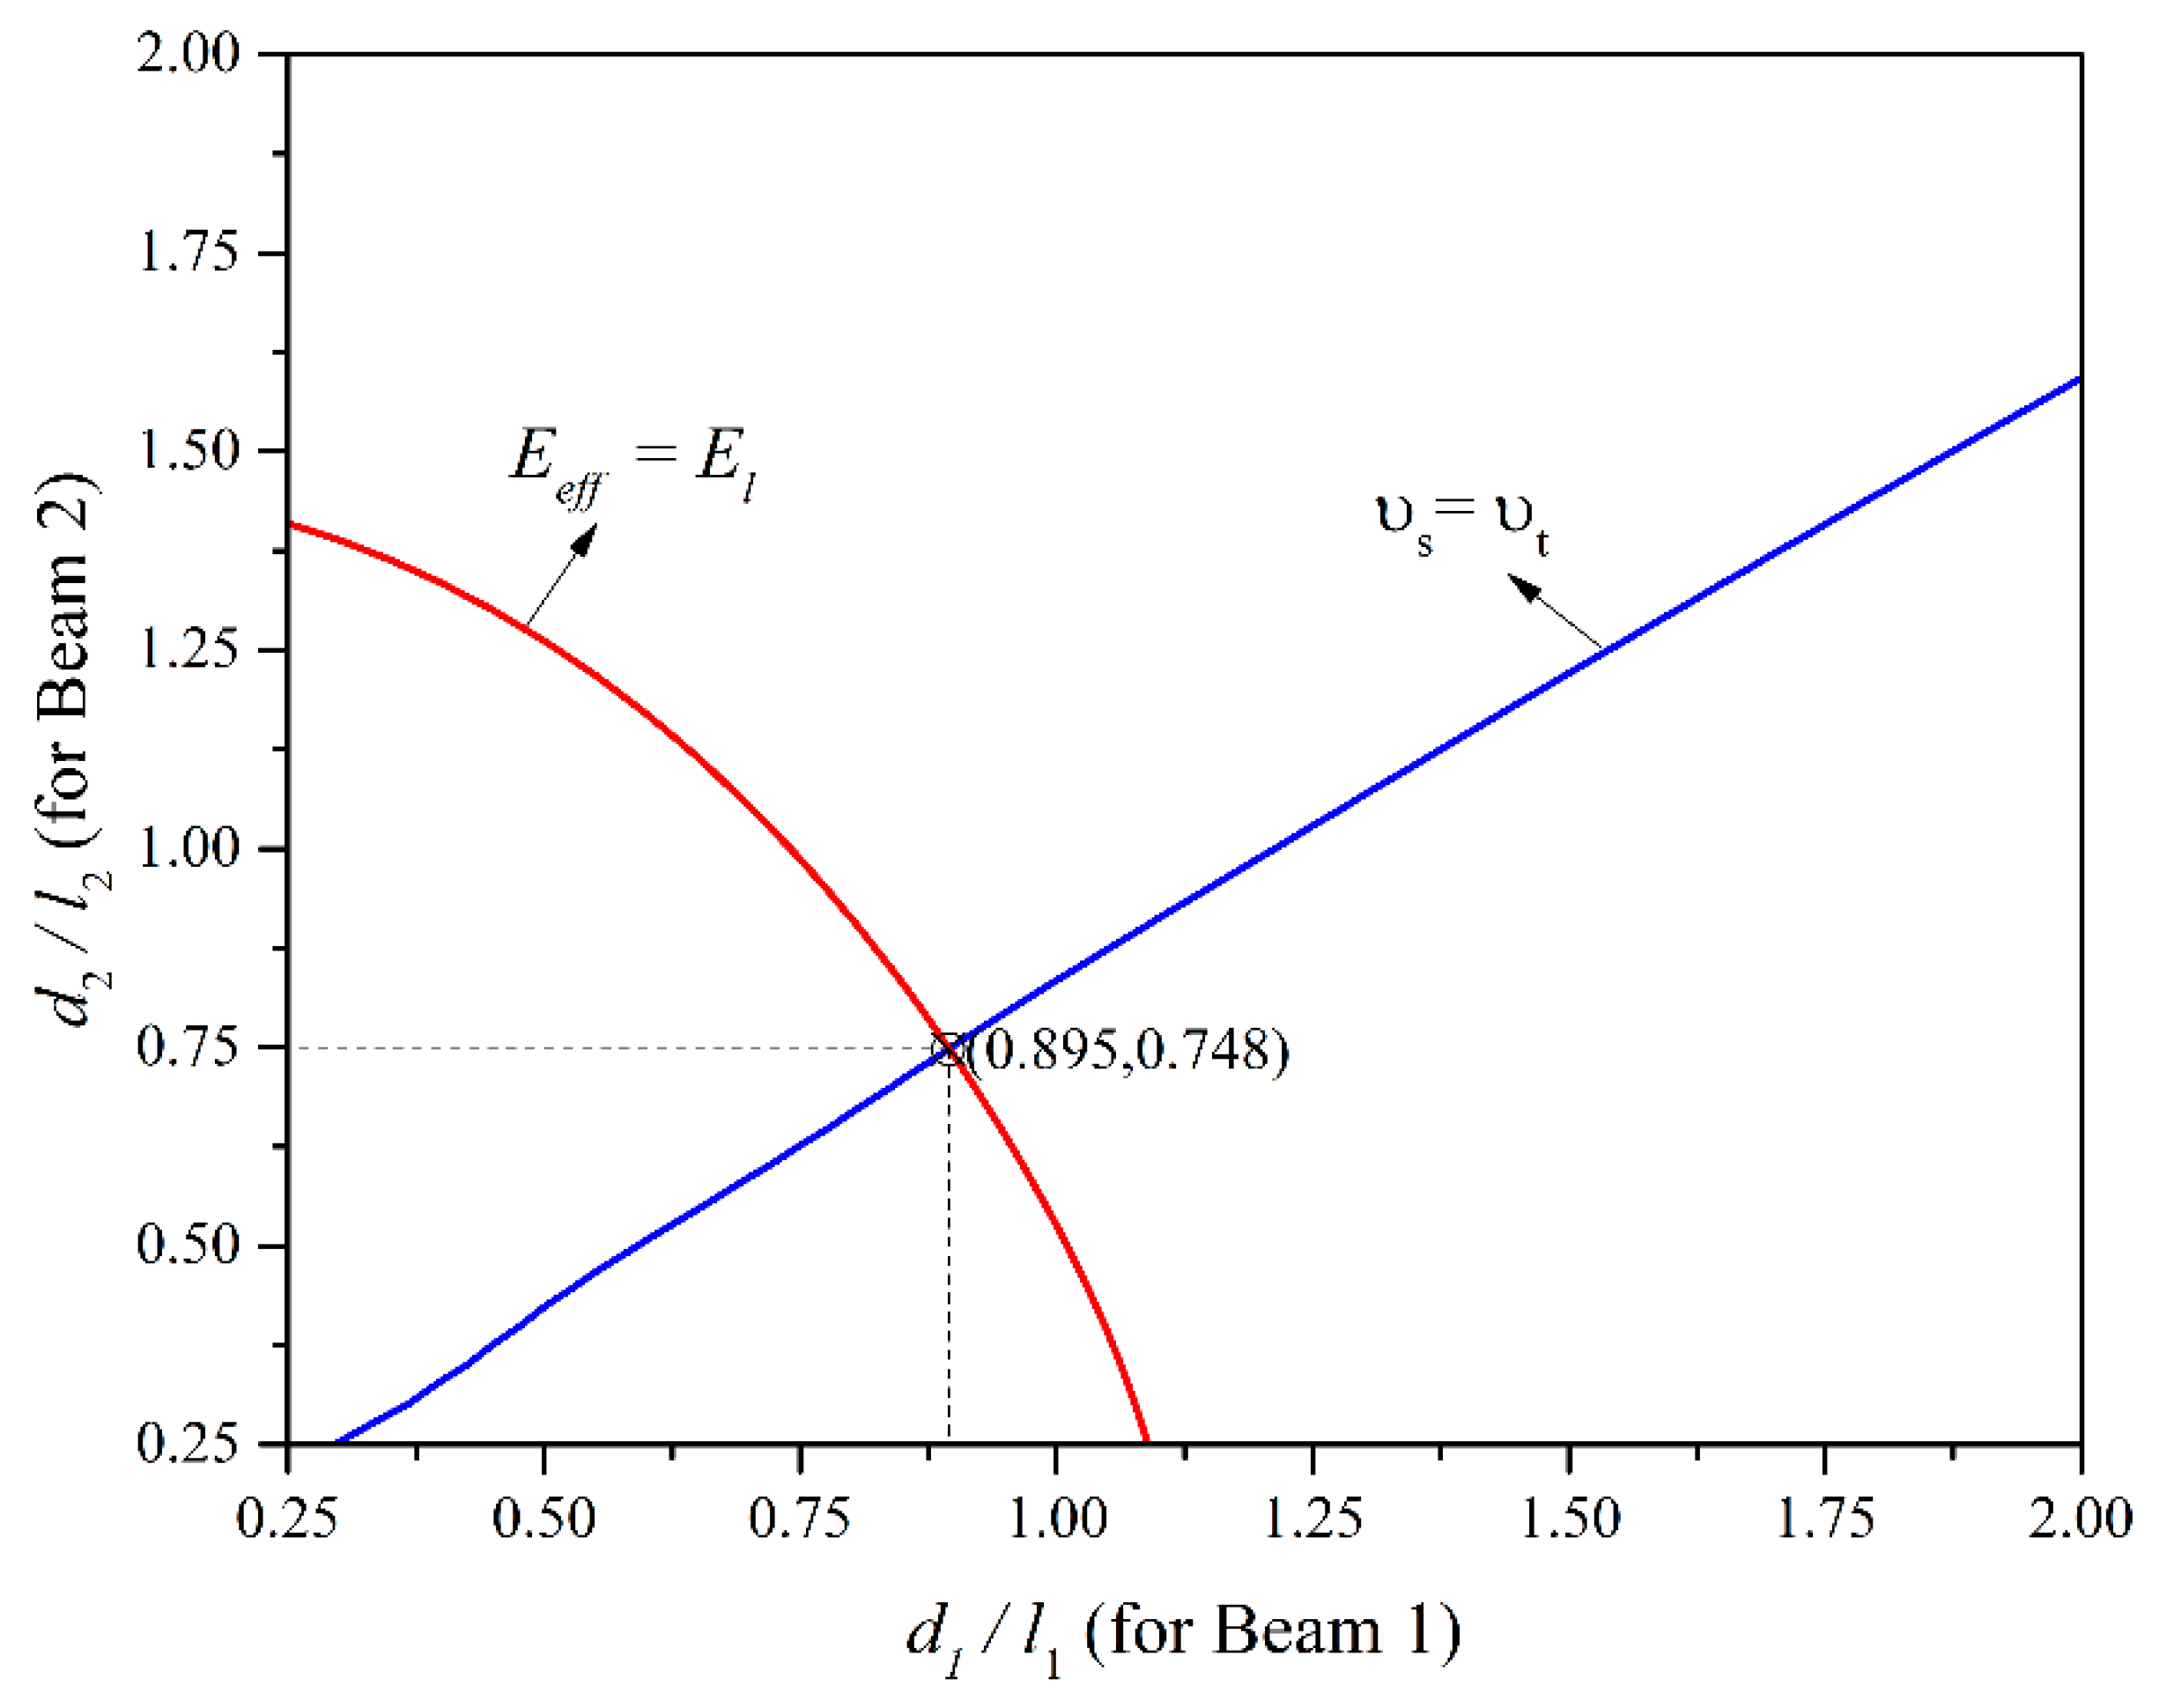
4.1.4. Definition of Beam Properties
4.1.5. Definition of Beam Geometry
4.2. FEM Model
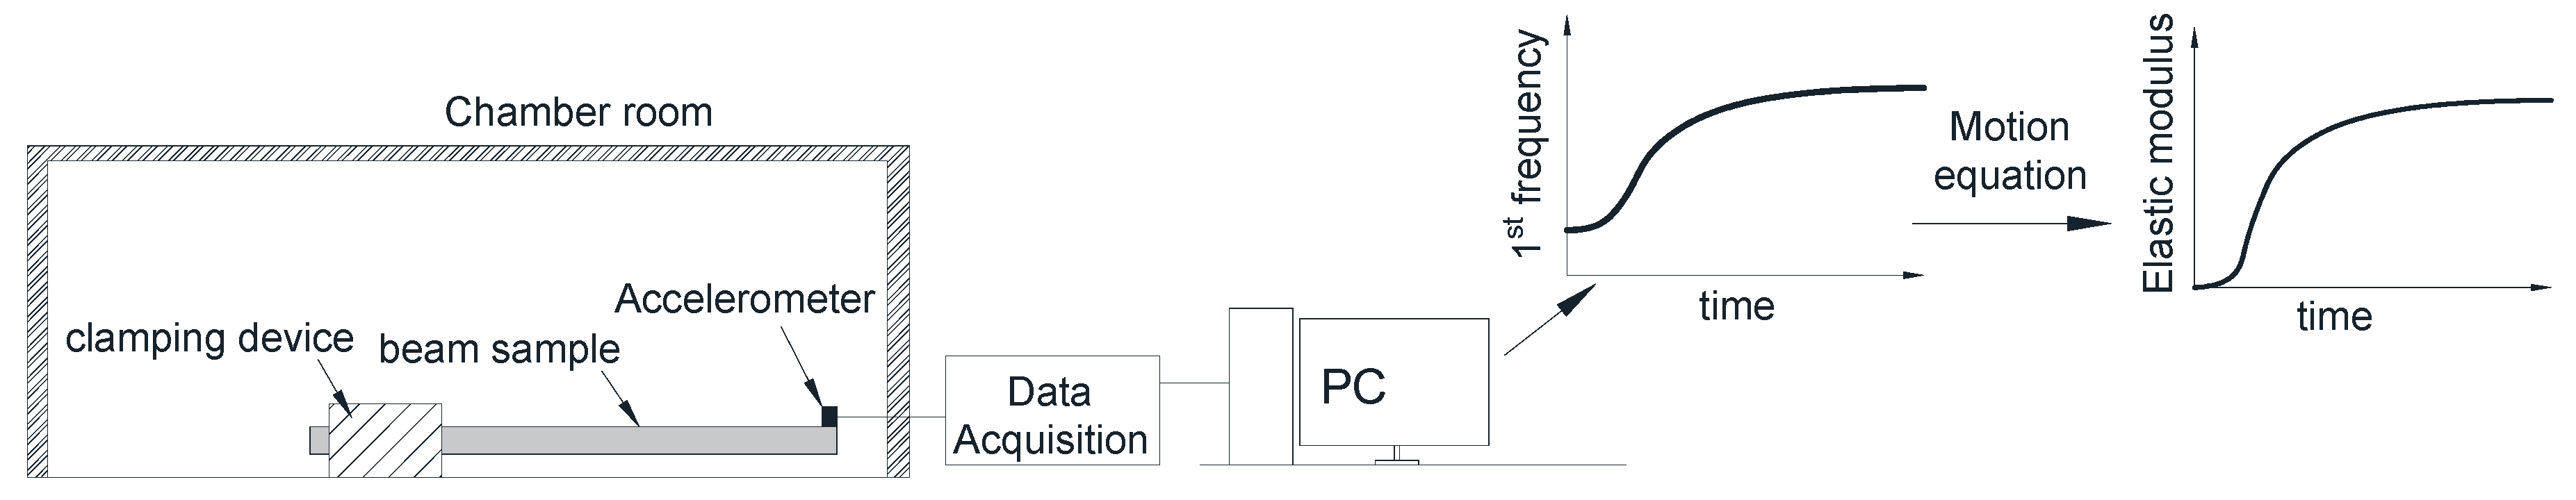
5. EMM-ARM Testing Method
6. Results and Discussion
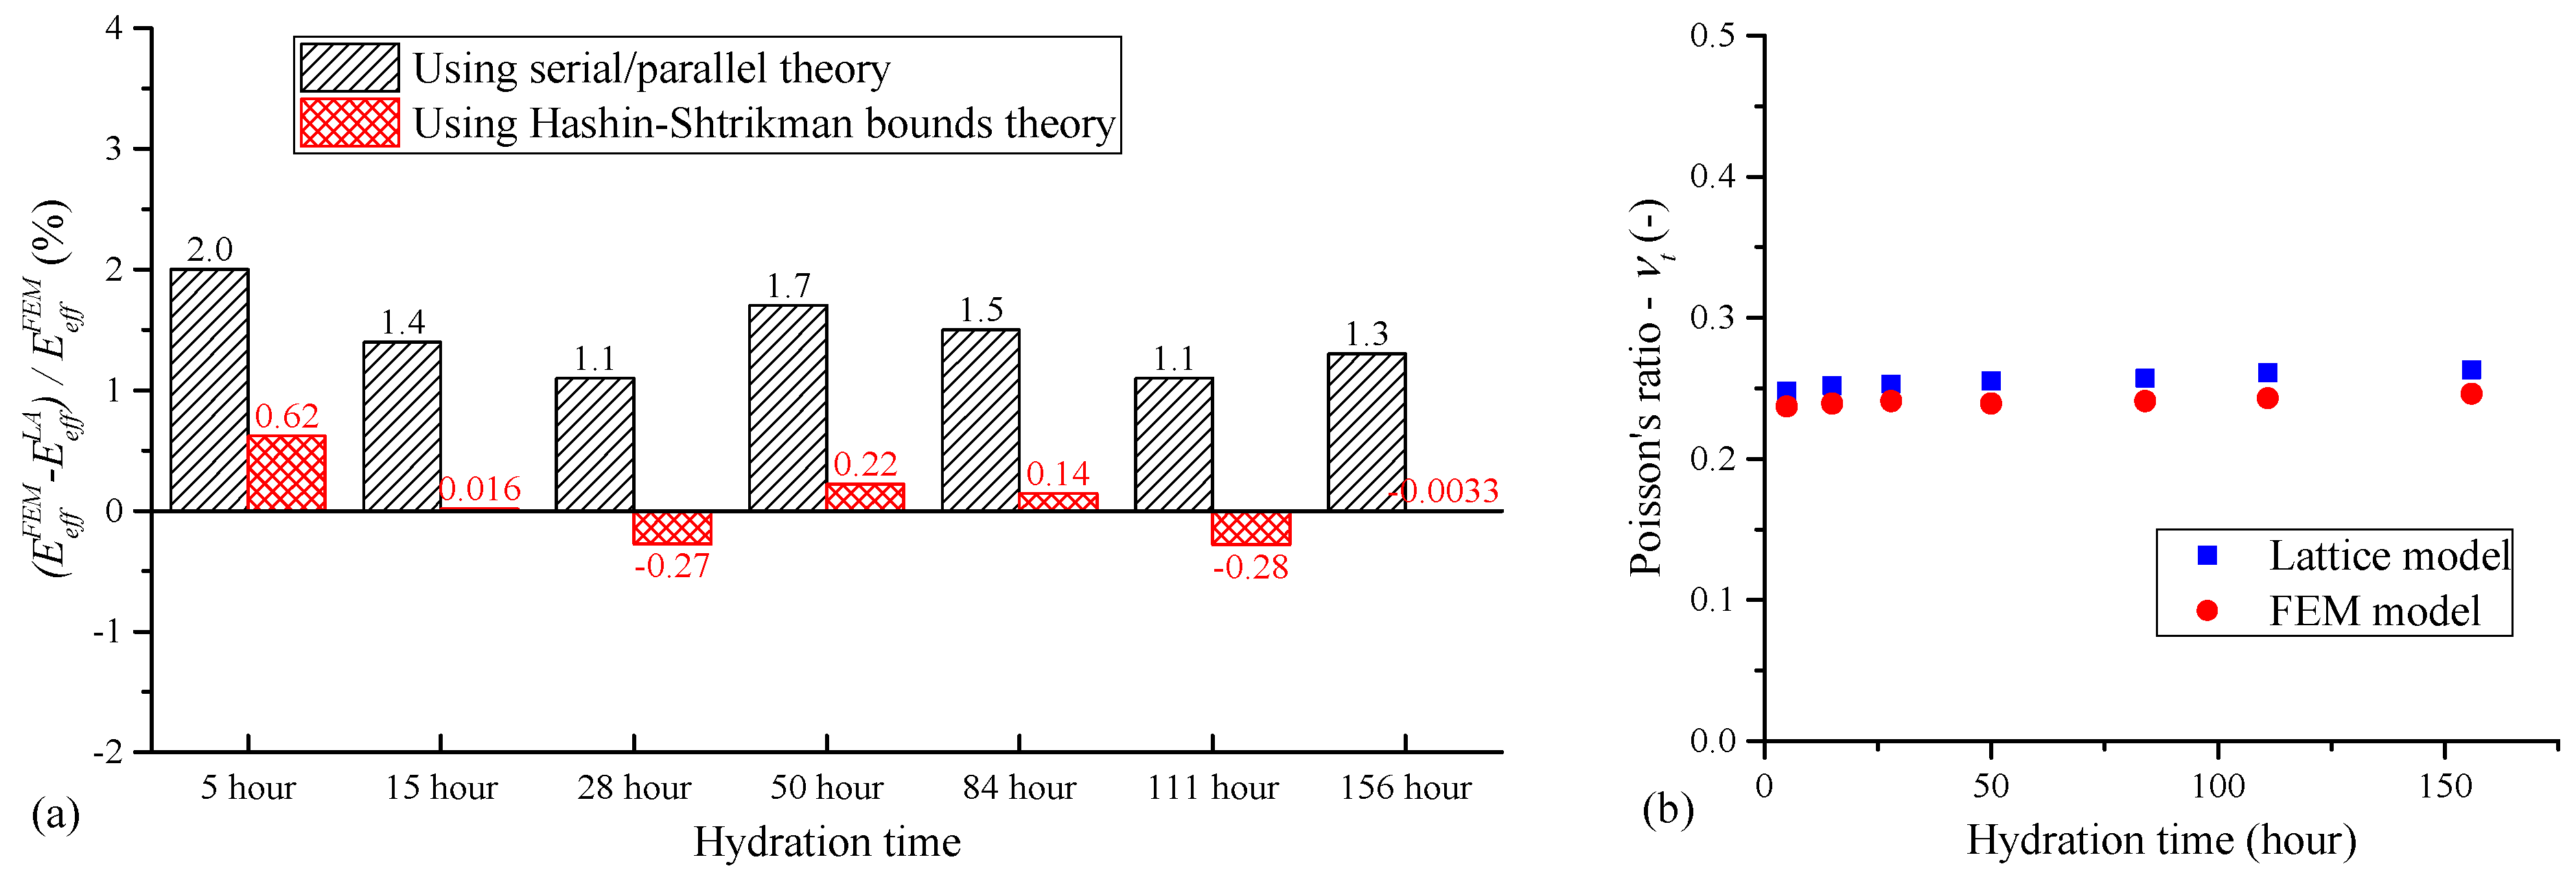
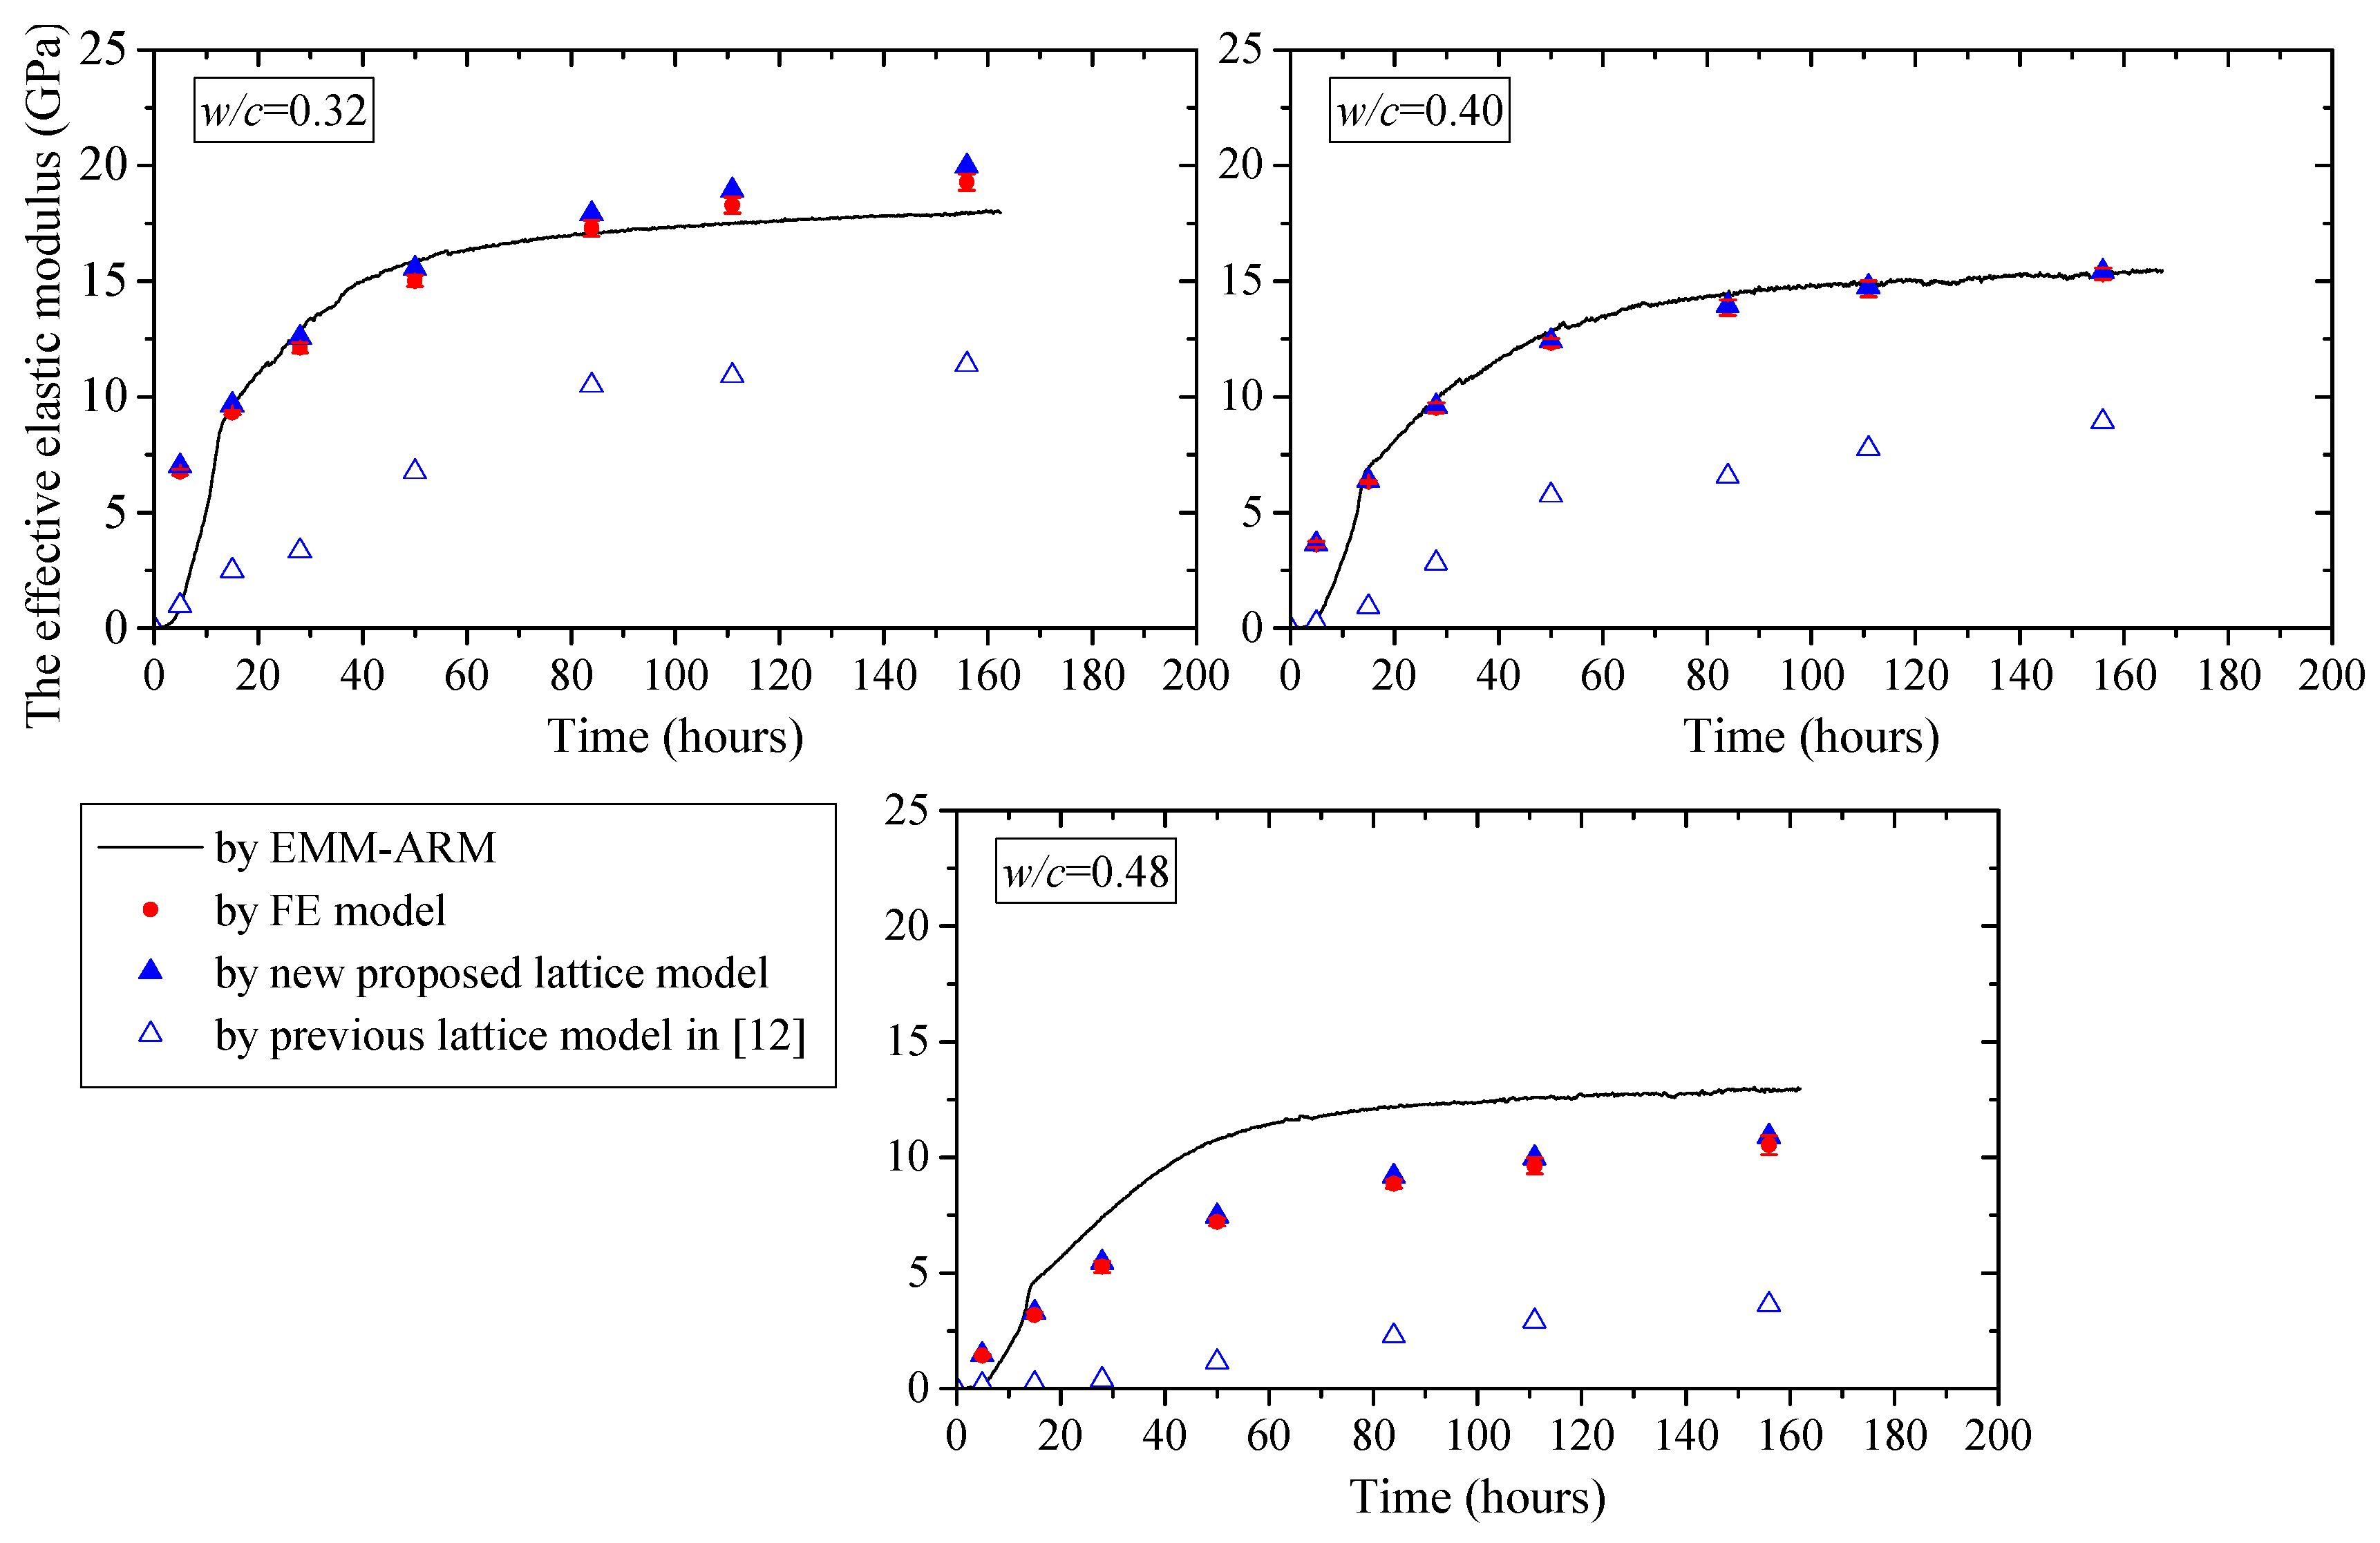
6.1. Lattice vs. FEM Results
6.2. Experimental vs. Numerical Results
6.3. Parametric Study
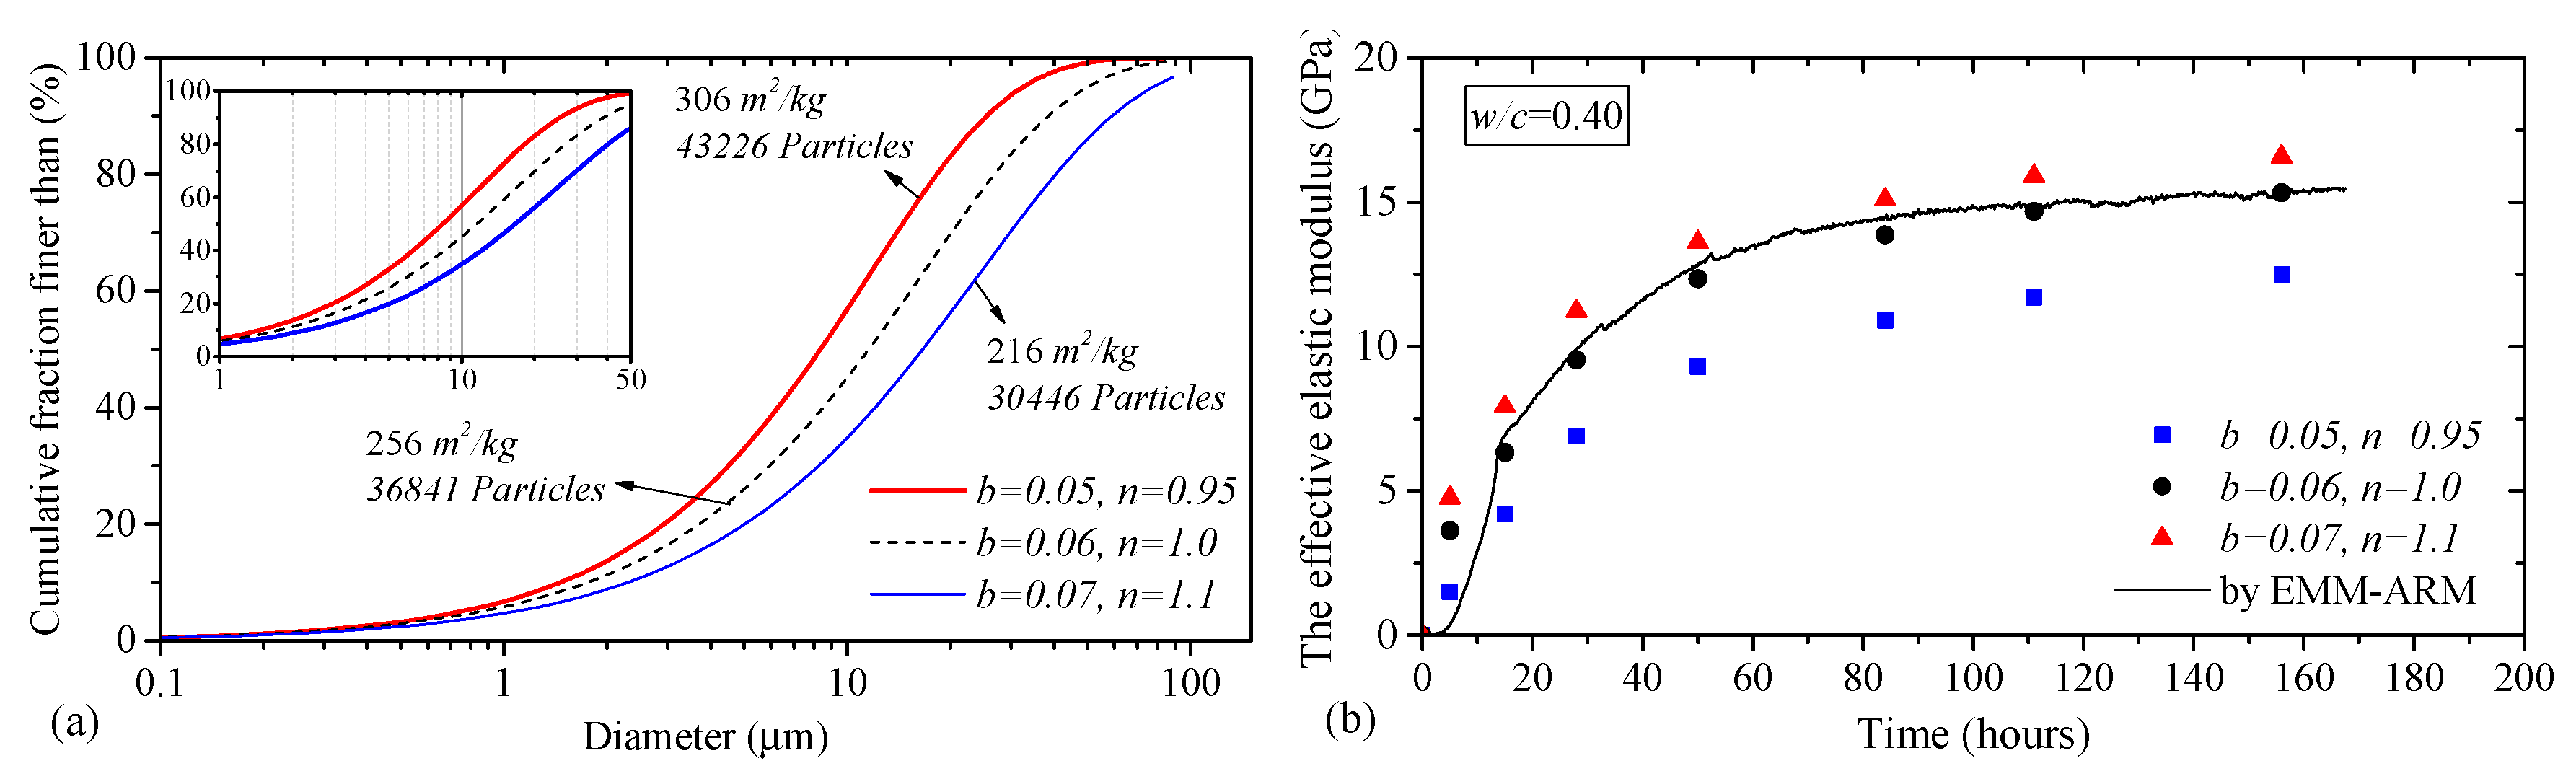
6.3.1. Influence of PSD
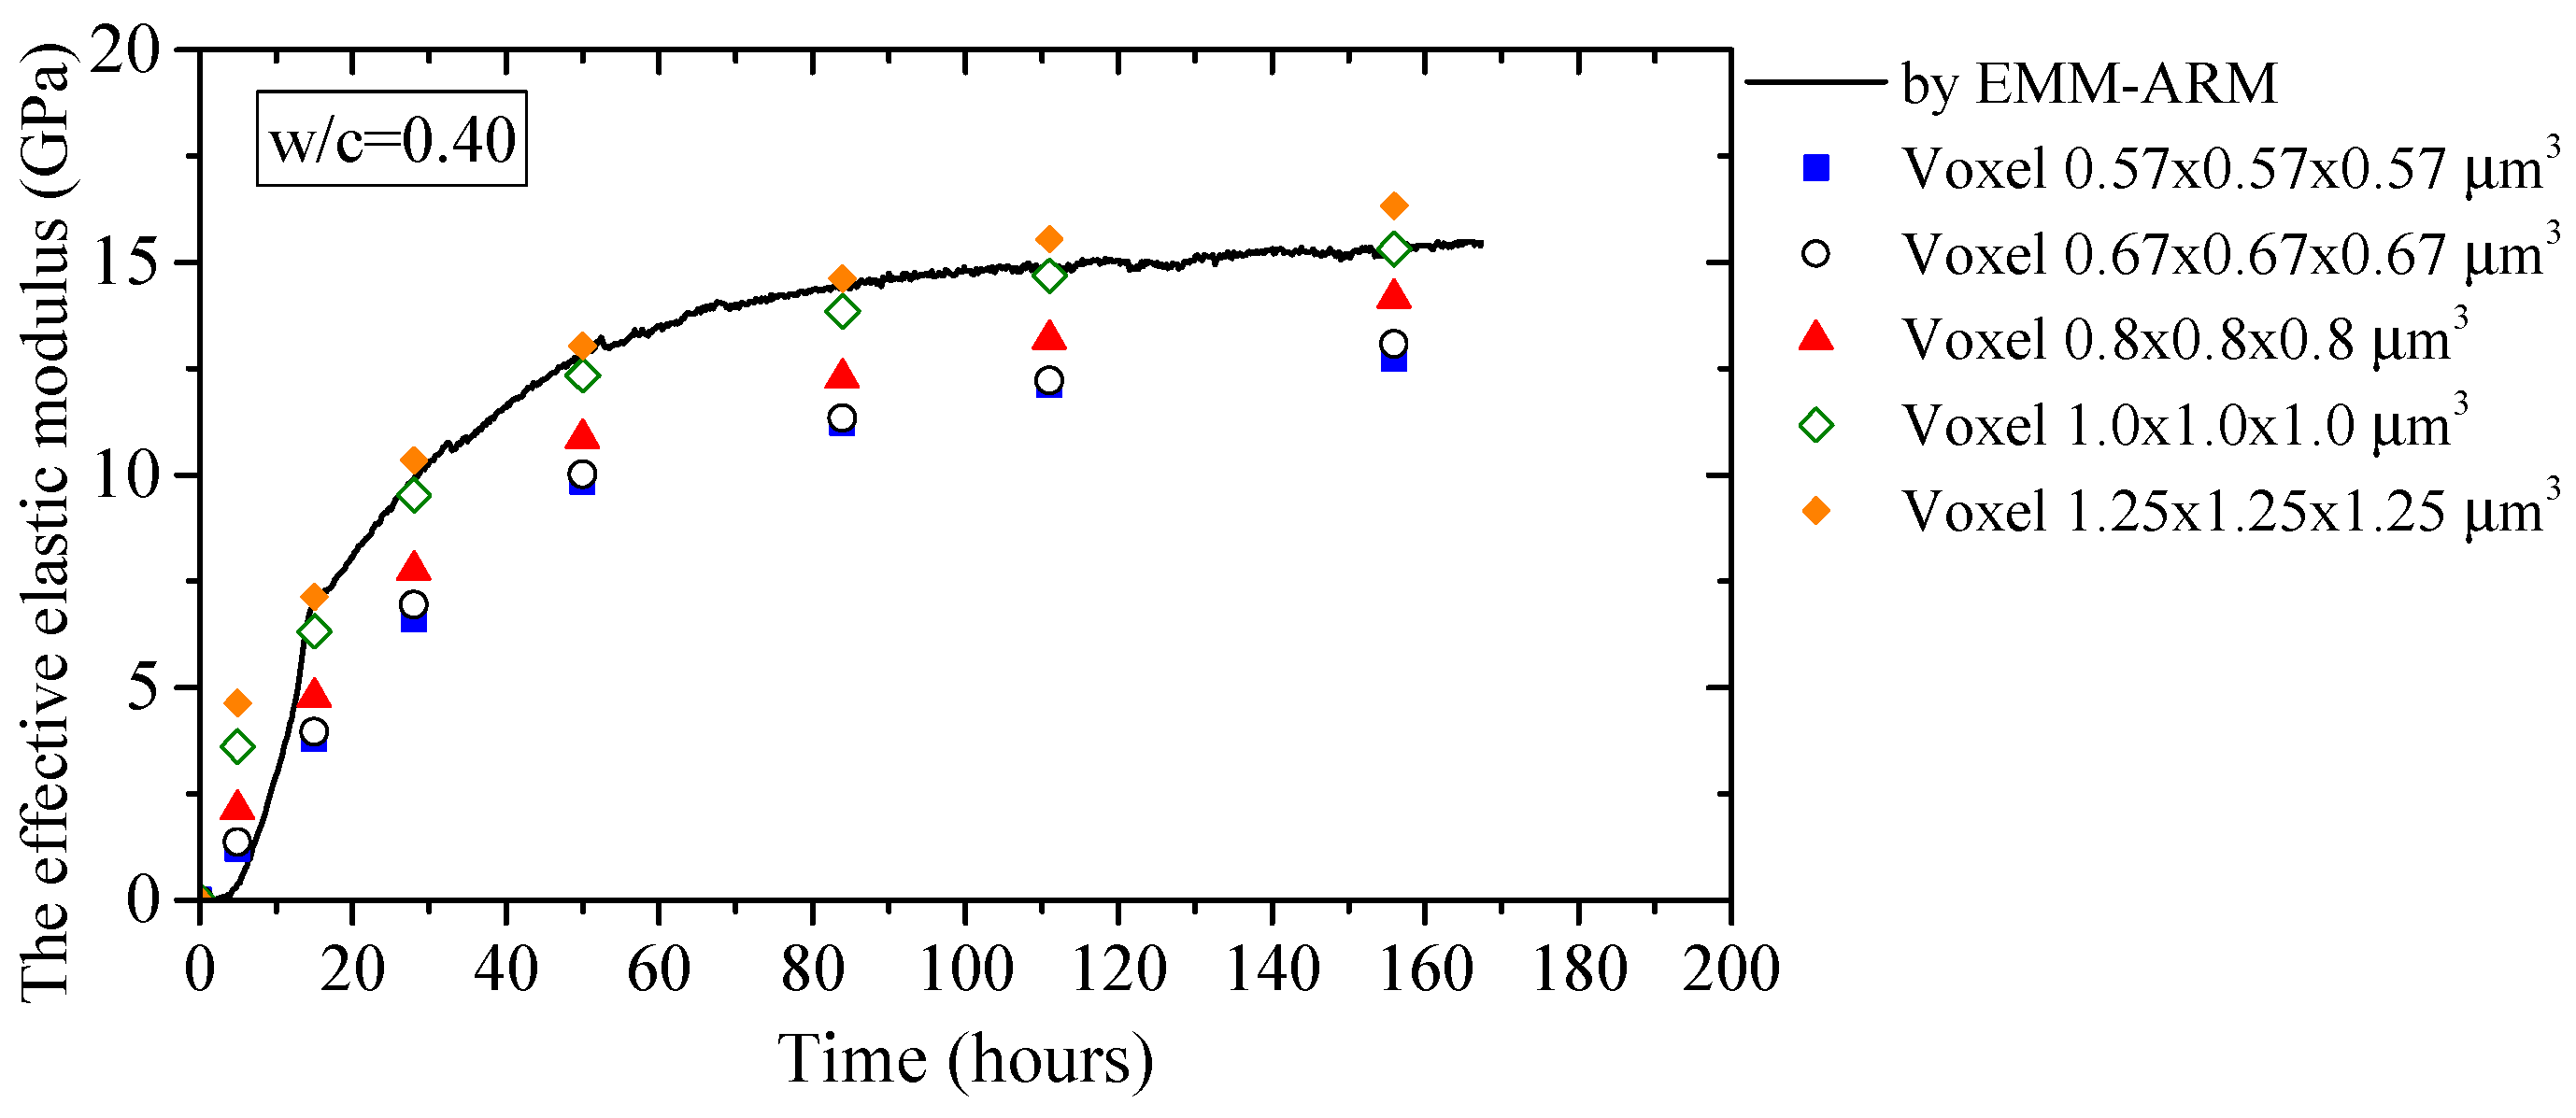
6.3.2. Influence of Voxel Size
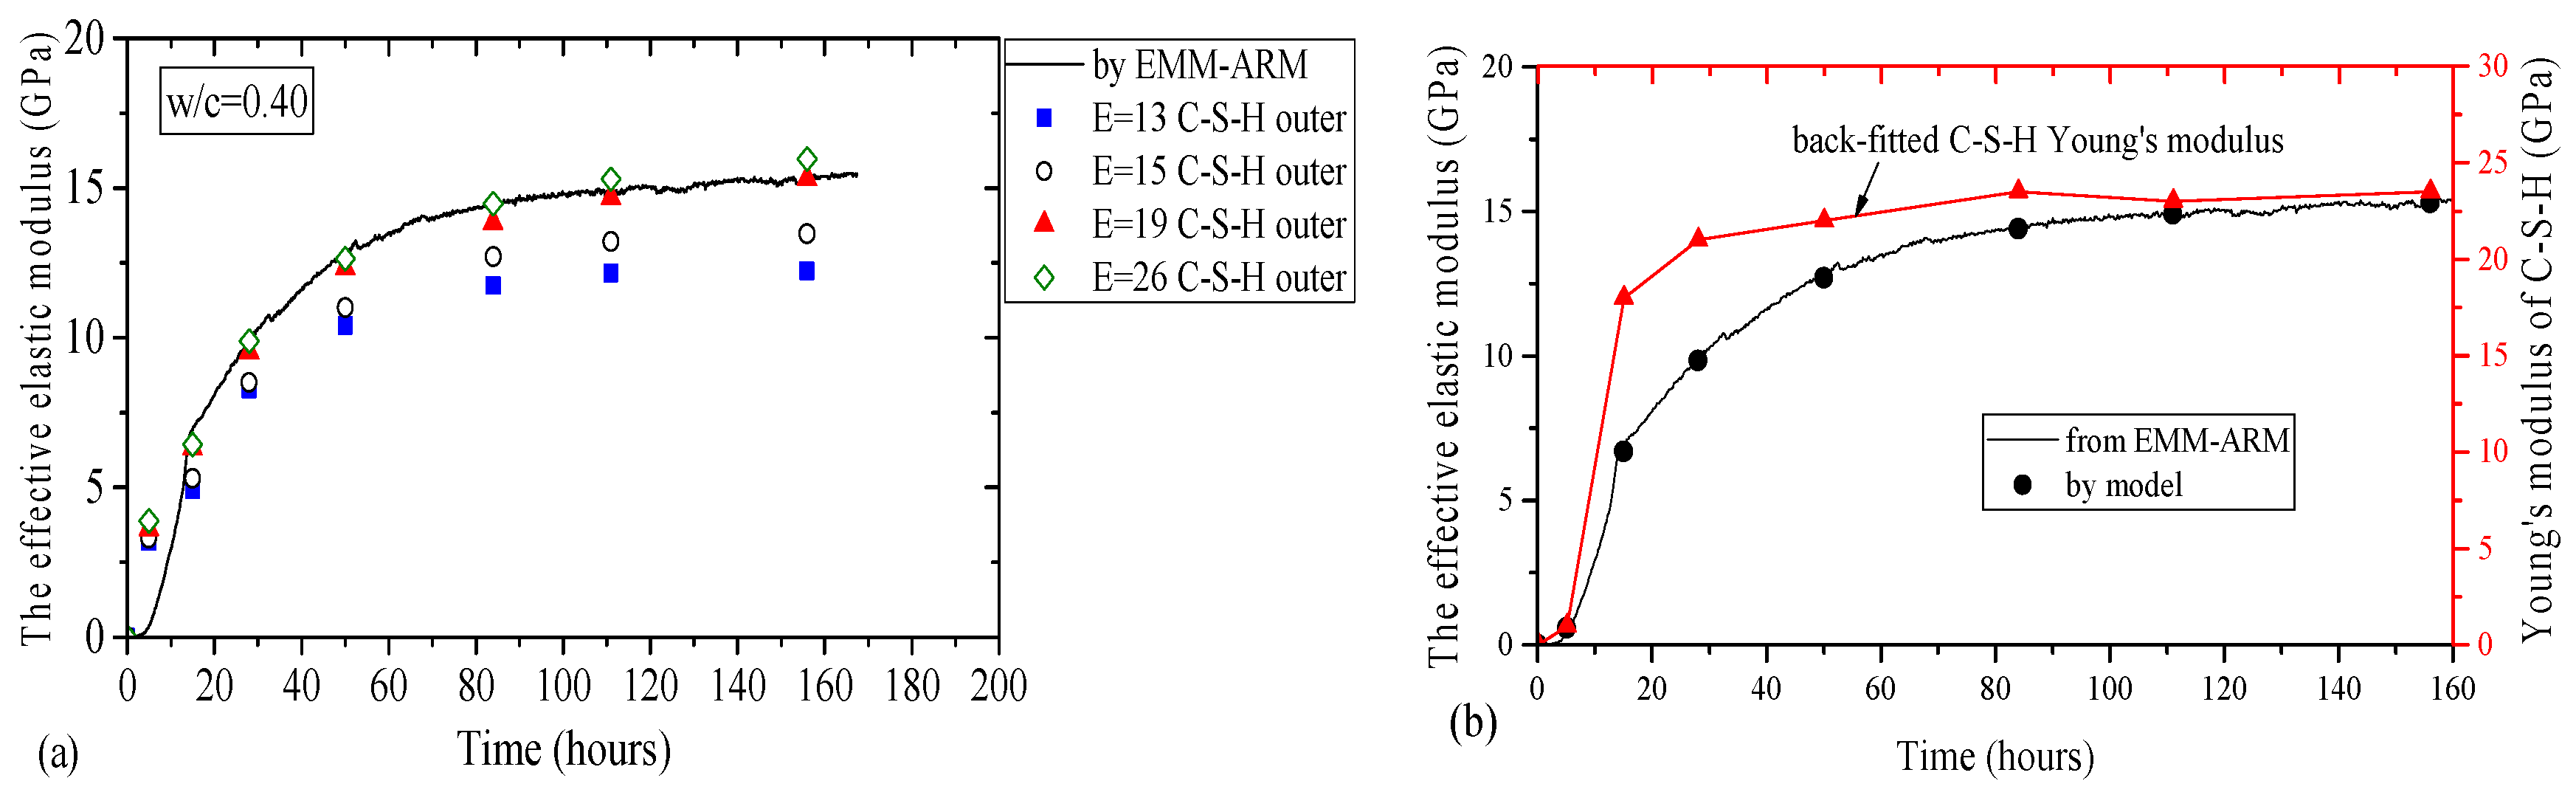
6.3.3. Influence of Elastic Properties of C-S-H
7. Summary and Conclusions
- (i).
- While the volume of cement was kept constant in the cement hydration modelling, a variation of the Particle Size Distribution (PSD) of cement grains resulted in different morphologies in the cement paste microstructure. When the number of particle increases (adopting a finer PSD curve), finer pore networks are formed, leading to a higher number of solid phase contacts in the microstructure. The higher number of solid connections increases the effective Young’s modulus of the cement paste. The phenomenon was opposite when a coarser PSD curve was adopted. Therefore, the pore network morphology has a strong influence on the numerical prediction of the effective elastic modulus of the cement paste.
- (ii).
- The voxel size, directly related to the microstructure discretisation, plays an important role when using numerical models for predicting the elastic modulus of cement pastes. To reduce the artificial solid connections in digitalised microstructures, the size of voxel shall be adequately small. Decreasing the voxel size to about 70% of the minimum size of cement grains seems to be a promising strategy to improve the accuracy of the numerical predictions.
- (iii).
- At very early ages, by decreasing Young’s modulus of C-S-H the numerical models capture the experimental value of the effective Young’s modulus of the cement paste. At these early ages, only low dense C-S-H starts to form in the microstructure, and consequently, a division of the C-S-H product into inner and outer phases leads to an overestimation of the effective Young’s modulus of the cement paste.
Acknowledgments
Author Contributions
Conflicts of Interest
References
- Zaoui, A. Continuum micromechanics: Survey. J. Eng. Mech. 2002, 128, 808–816. [Google Scholar] [CrossRef]
- Suquet, P. Continuum Micromechanics; Springer: Berlin/Heidelberg, Germany, 2014; Volume 377. [Google Scholar]
- Montero-Chacón, F.; Marín-Montín, J.; Medina, F. Mesomechanical characterization of porosity in cementitious composites by means of a voxel-based finite element model. Comput. Mater. Sci. 2014, 90, 157–170. [Google Scholar] [CrossRef]
- Jawed, I.; Skalny, J.; Young, J.F. Hydration of Portland cement. In Structure and Performance of Cements; CRC Press: Boca Raton, FL, USA, 1983; pp. 284–285. [Google Scholar]
- Xiao, L.; Li, Z. New understanding of cement hydration mechanism through electrical resistivity measurement and microstructure investigations. J. Mater. Civ. Eng. 2009, 21, 368–373. [Google Scholar] [CrossRef]
- Bullard, J.W.; Jennings, H.M.; Livingston, R.A.; Nonat, A.; Scherer, G.W.; Schweitzer, J.S.; Scrivener, K.L.; Thomas, J.J. Mechanisms of cement hydration. Cem. Concr. Res. 2011, 41, 1208–1223. [Google Scholar] [CrossRef]
- Jennings, H.M.; Johnson, S.K. Simulation of microstructure development during the hydration of a cement compound. J. Am. Ceram. Soc. 1986, 69, 790–795. [Google Scholar] [CrossRef]
- Bentz, D.P. A Three-Dimensional Cement Hydration and Microstructure Program: I. Hydration Rate, Heat of Hydration, and Chemical Shrinkage; Building and Fire Research Laboratory, National Institute of Technology: Gaithersburg, MD, USA, 1995.
- Van Breugel, K. Numerical Simulation of Hydration and Microstructural Development in Hardening Cement-Based Materials. (I) Theory. Cem. Concr. Res. 1995, 25, 319–331. [Google Scholar] [CrossRef]
- Ye, G. Experimental Study and Numerical Simulation of the Development of the Microstructure and Permeability of Cementitious Materials. Ph.D. Thesis, TU Delft, Delft University of Technology, Delft, The Netherlands, 2003. [Google Scholar]
- Bishnoi, S.; Scrivener, K.L. µic: A new platform for modelling the hydration of cements. Cem. Concr. Res. 2009, 39, 266–274. [Google Scholar] [CrossRef]
- Mazaheripour, H.; Faria, R.; Ye, G.; Schlangen, E.; Granja, J.; Azenha, M. Microstructure-based modelling prediction of elasticity in hydrating cement paste. In Proceedings of the 2nd International RILEM/COST Conference on Early Age Cracking and Serviceability in Cement-Based Materials and Structures—EAC2 2017, ULB-VUB, Brussels, Belgium, 12–14 Septermber 2017. [Google Scholar]
- Schlangen, E.; Qian, Z. 3D modeling of fracture in cement-based materials. J. Multiscale Model. 2009, 1, 245–261. [Google Scholar] [CrossRef]
- Qian, Z.; Ye, G.; Schlangen, E.; van Breugel, K. 3D lattice fracture model: Application to cement paste at microscale. Key Eng. Mater. 2011, 452–453, 65–68. [Google Scholar] [CrossRef]
- Azenha, M.; Magalhães, F.; Faria, R.; Cunha, Á. Measurement of concrete E-modulus evolution since casting: A novel method based on ambient vibration. Cem. Concr. Res. 2010, 40, 1096–1105. [Google Scholar] [CrossRef]
- Granja, J. Continuous Characterization of Stiffness of Cement-Based Materials: Experimental Analysis and Micro-Mechanics Modelling. Ph.D. Thesis, Civil Engineering Department, University of Minho, Braga, Portugal, 2016. [Google Scholar]
- Muller, A.C.A.; Scrivener, K.L.; Gajewicz, A.M.; McDonald, P.J. Densification of C-S-H Measured by 1H NMR Relaxometry. J. Phys. Chem. C 2013, 117, 403–412. [Google Scholar] [CrossRef]
- Velez, K.; Maximilien, S.; Damidot, D.; Fantozzi, G.; Sorrentino, F. Determination by nanoindentation of elastic modulus and hardness of pure constituents of Portland cement clinker. Cem. Concr. Res. 2001, 31, 555–561. [Google Scholar] [CrossRef]
- Manzano, H.; Dolado, J.S.; Ayuela, A. Elastic properties of the main species present in Portland cement pastes. Acta Mater. 2009, 57, 1666–1674. [Google Scholar] [CrossRef]
- Van Breugel, K. Numerical simulation of hydration and microstructural development in hardening cement-based materials:(II) applications. Cem. Concr. Res. 1995, 25, 522–530. [Google Scholar] [CrossRef]
- Chang, C.S.; Wang, T.K.; Sluys, L.J.; van Mier, J.G.M. Fracture modeling using a micro-structural mechanics approach––I. Theory and formulation. Eng. Fract. Mech. 2002, 69, 1941–1958. [Google Scholar] [CrossRef]
- Schlangen, E. Crack development in concrete, part 2: Modelling of fracture process. Key Eng. Mater. 2008, 385–387, 73–76. [Google Scholar] [CrossRef]
- Wang, L.; Ueda, T. Mesoscale modelling of the chloride diffusion in cracks and cracked concrete. J. Adv. Concr. Technol. 2011, 9, 241–249. [Google Scholar] [CrossRef]
- Šavija, B.; Pacheco, J.; Schlangen, E. Lattice modeling of chloride diffusion in sound and cracked concrete. Cem. Concr. Comp. 2013, 42, 30–40. [Google Scholar] [CrossRef]
- Luković, M.; Šavija, B.; Schlangen, E.; Ye, G.; van Breugel, K. A 3D lattice modelling study of drying shrinkage damage in concrete repair systems. Materials 2016, 9, 575. [Google Scholar] [CrossRef] [PubMed]
- Cusatis, G.; Bažant, Z.P.; Cedolin, L. Confinement-shear lattice CSL model for fracture propagation in concrete. Comput. Methods Appl. Mech. Eng. 2006, 195, 7154–7171. [Google Scholar] [CrossRef]
- Jivkov, A.P.; Yates, J.R. Elastic behaviour of a regular lattice for meso-scale modelling of solids. Int. J. Solids Struct. 2012, 49, 3089–3099. [Google Scholar] [CrossRef]
- Element Library, in DIANA-10.1 User’s Manual; Manie, J. (Ed.) DIANA FEA: Delft, The Netherlands, 2017. [Google Scholar]
- Timoshenko, S.; Goodier, J.N. Theory of Elasticity; NTNU: New York, NY, USA, 1951. [Google Scholar]
- Karihaloo, B.L.; Shao, P.F.; Xiao, Q.Z. Lattice modelling of the failure of particle composites. Eng. Fract. Mech. 2003, 70, 2385–2406. [Google Scholar] [CrossRef]
- Hashin, Z.; Shtrikman, S. A variational approach to the theory of the elastic behaviour of multiphase materials. J. Mech. Phys. Solids 1963, 11, 127–140. [Google Scholar] [CrossRef]
- Sekkal, W.; Zaoui, A.; Benzerzour, M.; Abriak, N. Role of porosity on the stiffness and stability of (001) surface of the nanogranular C-S-H gel. Cem. Concr. Res. 2016, 87, 45–52. [Google Scholar] [CrossRef]
- Boumiz, A.; Vernet, C.; Tenoudji, F.C. Mechanical properties of cement pastes and mortars at early ages: Evolution with time and degree of hydration. Adv. Cem. Based Mater. 1996, 3, 94–106. [Google Scholar] [CrossRef]
- Ye, G.; van Breugel, K.; Fraaij, A.L.A. Three-dimensional microstructure analysis of numerically simulated cementitious materials. Cem. Concr. Res. 2003, 33, 215–222. [Google Scholar] [CrossRef]
- Torrenti, J.-M.; Benboudjema, F. Mechanical threshold of cementitious materials at early age. Mater. Struct. 2005, 38, 299–304. [Google Scholar] [CrossRef]
- Sun, Z.; Ye, G.; Shah, S.P. Microstructure and early-age properties of Portland cement paste–effects of connectivity of solid phases. ACI Mater. J. 2005, 102, 122–129. [Google Scholar]
- Gao, P.; Ye, G.; Wei, J.; Yu, Q. Multi-scale simulation of capillary pores and gel pores in Portland cement paste. In Proceedings of the 14th International Congress on the Chemistry of Cement (ICCC 2015), Beijing, China, 13–16 October 2015. [Google Scholar]
- Muller, A.C.A.; Scrivener, K.L.; Gajewicz, A.M.; McDonald, P.J. Use of bench-top NMR to measure the density, composition and desorption isotherm of C-S-H in cement paste. Micropor. Mesopor. Mater. 2013, 178, 99–103. [Google Scholar] [CrossRef]
- Smilauer, V.; Bittnar, Z. Microstructure-based micromechanical prediction of elastic properties in hydrating cement paste. Cem. Concr. Res. 2006, 36, 1708–1718. [Google Scholar] [CrossRef]


| Cement clinker component | C3S | C2S | C3A | C4AF | Others | |
|---|---|---|---|---|---|---|
| Fraction (%) | 66.89 | 20.59 | 3.62 | 1.03 | 7.87 | |
| Density (g/cm3) | 3.21 | 3.28 | 3.03 | 2.32 | ~3.0 | Avg. 3.15 |
| Cement Clinker | Velez et al. (2001) [18] | Manzano et al. (2009) [19] | Present Study | Clinker | ||||||||
|---|---|---|---|---|---|---|---|---|---|---|---|---|
| E | G | υ | E | G | υ | E | G | υ | E | G | υ | |
| (GPa) | (GPa) | - | (GPa) | (GPa) | - | (GPa) | (GPa) | - | (GPa) | (GPa) | - | |
| Alite (C3S) | 135 | 51.9 | 0.3 | 138.9 | 54.5 | 0.28 | 137 | 53 | 0.30 | 137 | 53 | 0.3 |
| Belite (C2S) | 130 | 50.0 | 0.3 | 137.9 | 53.1 | 0.3 | 134 | 52 | 0.30 | |||
| C3A | 145 | 55.8 | 0.3 | - | - | - | 145 | 56 | 0.30 | |||
| C4AF | 125 | 48.1 | 0.3 | - | - | - | 125 | 48 | 0.30 | |||
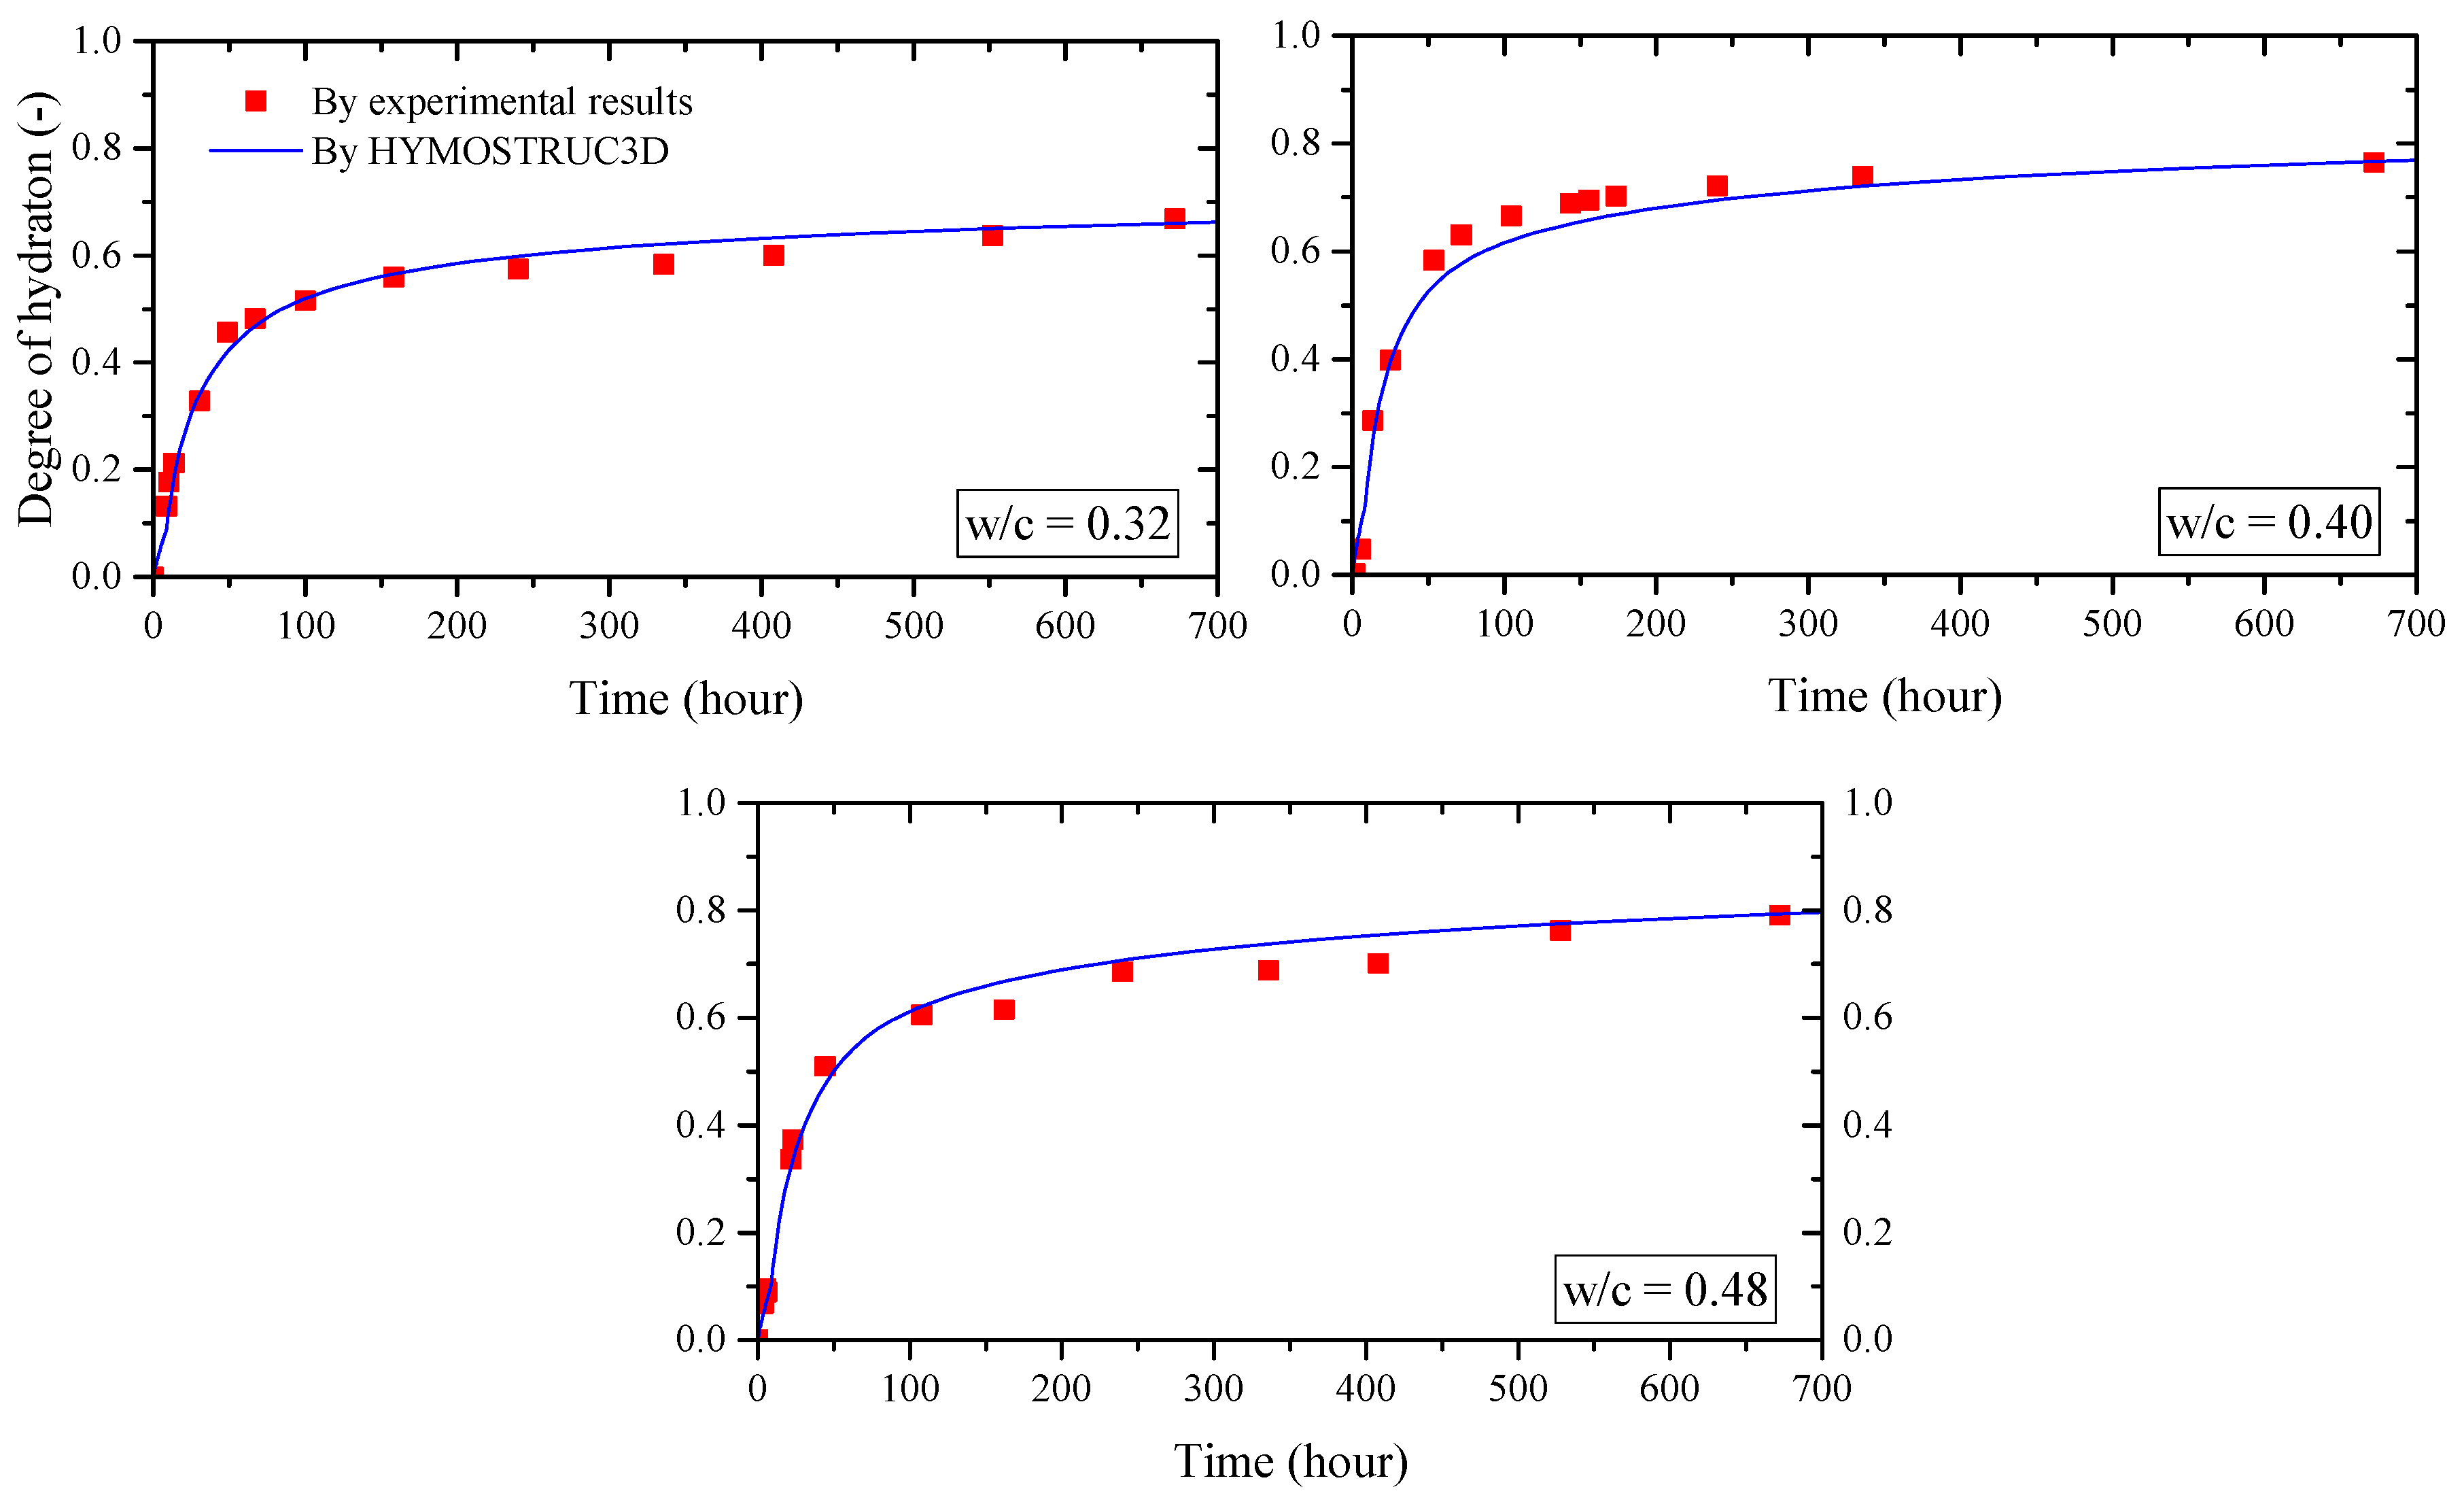
| Model Hydration Parameters | w/c = 0.32 | w/c = 0.40 | w/c = 0.48 |
|---|---|---|---|
| k0 (reaction rate of cement particle) | 0.035 | 0.055 | 0.04 |
| dtr (transition thickness of cement particles) | 2.0 | 2.0 | 2.0 |
| β1 (calibration parameters) | 1.0 | 1.0 | 1.0 |
| β2 (calibration parameters) | 1.0 | 1.0 | 1.0 |
| Dimensions the REV cube | 100 × 100 × 100 μm3 | ||
| Reactant | C3S, C2S, C3A, C4AF, and gypsum | ||
| Product phases | Inner layer C-S-H; Outer layer C-S-H; CH grain | ||
| Minimum and maximum particle size | 1 μm–70 μm | ||
| Temperature | 20 °C | ||
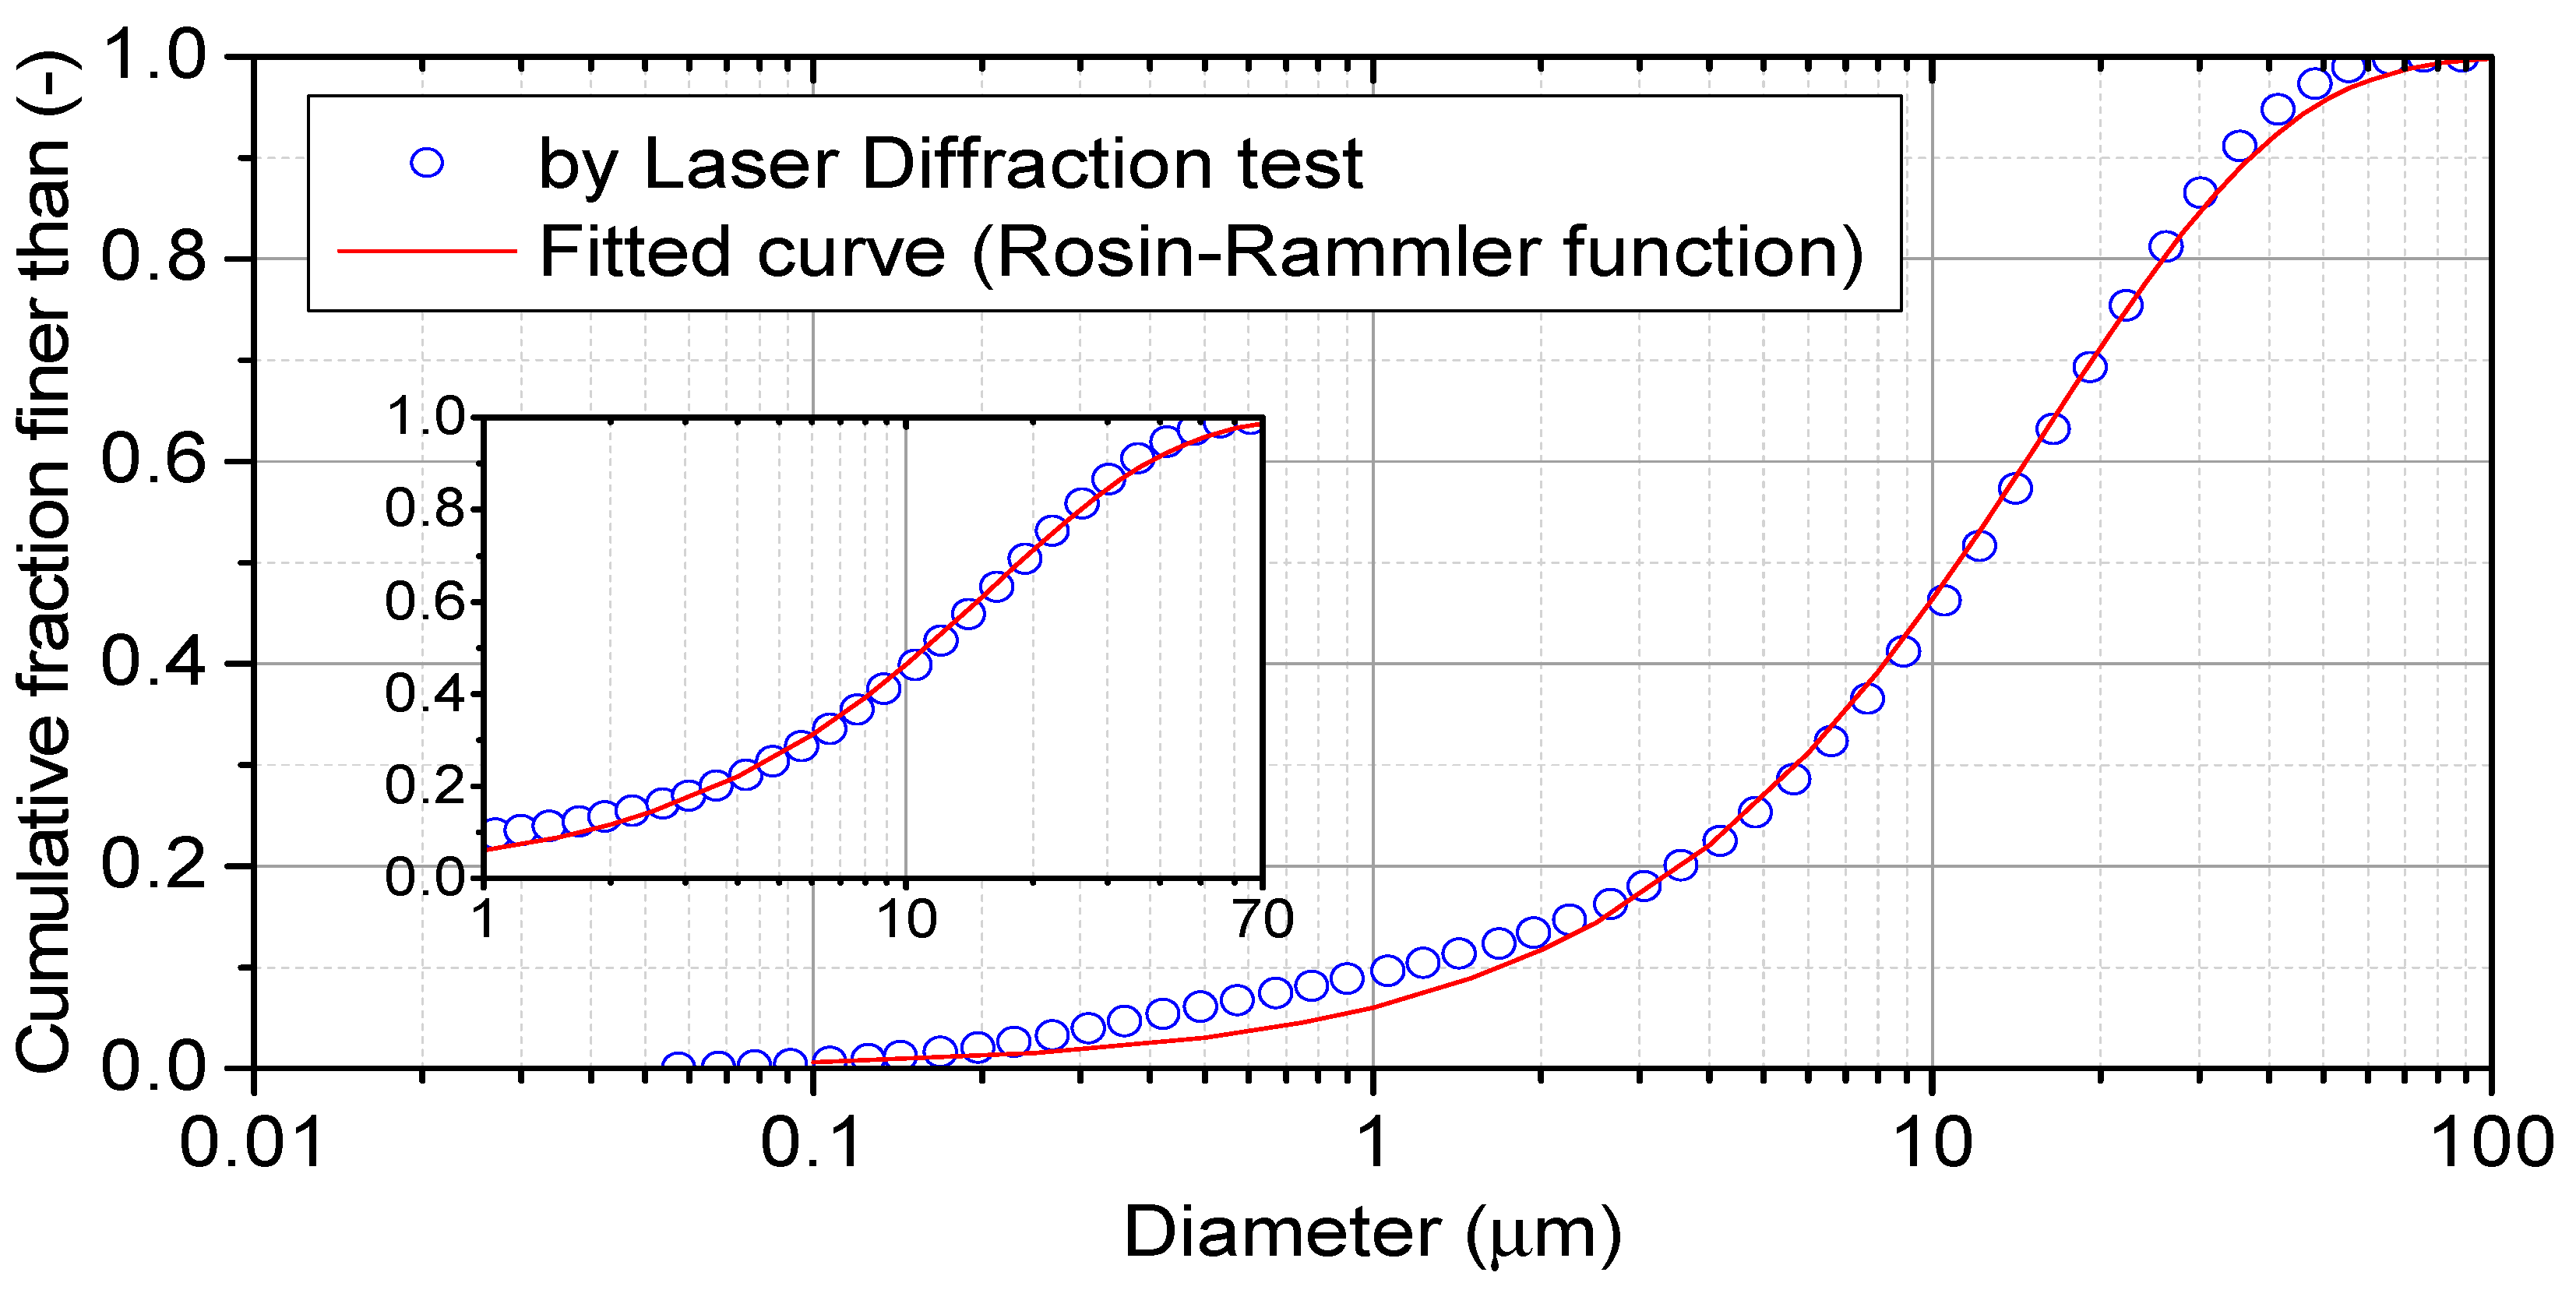
| PSD parameters: b, n | 0.06, 1.0 (see Figure 1) | ||
| Hydration Product | Elastic Modulus (Average Value) (GPa) | Poisson’s Ratio |
|---|---|---|
| C-S-H Inner (high-dense) | 26–32 (29) | 0.25 |
| C-S-H Outer (low-dense) | 13–26 (19.5) | 0.25 |
| CH | 35 | 0.30 |
| Hydration Time (Hours) | Model | Number of Element | Number of Nodes | Number of Interfaces | Interface Percentage (%) | Solving Time * (sec) | Young’s Modulus (GPa) | Poisson’s Ratio (-) |
|---|---|---|---|---|---|---|---|---|
| 5 | Lattice | 5,199,531 | 1,366,992 | 222,459 | 4.28 | 2641 | 3.60 | 0.248 |
| FE | 515,200 | 897,518 | - | 0.0 | 242 | 3.62 | 0.237 | |
| 15 | Lattice | 6,042,059 | 1,486,326 | 431,944 | 7.15 | 2932 | 6.32 | 0.252 |
| FE | 593,551 | 942,238 | - | 0.0 | 242 | 6.32 | 0.239 | |
| 28 | Lattice | 6,688,144 | 1,564,456 | 543,773 | 8.13 | 3145 | 9.56 | 0.253 |
| FE | 651,815 | 964,251 | - | 0.0 | 263 | 9.53 | 0.241 | |
| 50 | Lattice | 7,278,024 | 1,630,933 | 578,575 | 7.95 | 4086 | 12.31 | 0.255 |
| FE | 704,181 | 979,932 | - | 0.0 | 271 | 12.34 | 0.239 | |
| 84 | Lattice | 7,557,111 | 1,660,055 | 572,667 | 7.58 | 4592 | 13.84 | 0.257 |
| FE | 728,502 | 985,321 | - | 0.0 | 274 | 13.86 | 0.241 | |
| 111 | Lattice | 7,725,450 | 1,677,884 | 574,797 | 7.44 | 5123 | 14.72 | 0.261 |
| FE | 743,217 | 988,786 | - | 0.0 | 281 | 14.68 | 0.243 | |
| 156 | Lattice | 7,904,593 | 1,696,642 | 577,694 | 7.31 | 5637 | 15.32 | 0.263 |
| FE | 758,822 | 992,332 | - | 0.0 | 296 | 15.32 | 0.246 |
© 2018 by the authors. Licensee MDPI, Basel, Switzerland. This article is an open access article distributed under the terms and conditions of the Creative Commons Attribution (CC BY) license (http://creativecommons.org/licenses/by/4.0/).
Share and Cite
Mazaheripour, H.; Faria, R.; Ye, G.; Schlangen, E.; Granja, J.; Azenha, M. Microstructure-Based Prediction of the Elastic Behaviour of Hydrating Cement Pastes. Appl. Sci. 2018, 8, 442. https://doi.org/10.3390/app8030442
Mazaheripour H, Faria R, Ye G, Schlangen E, Granja J, Azenha M. Microstructure-Based Prediction of the Elastic Behaviour of Hydrating Cement Pastes. Applied Sciences. 2018; 8(3):442. https://doi.org/10.3390/app8030442
Chicago/Turabian StyleMazaheripour, Hadi, Rui Faria, Guang Ye, Erik Schlangen, José Granja, and Miguel Azenha. 2018. "Microstructure-Based Prediction of the Elastic Behaviour of Hydrating Cement Pastes" Applied Sciences 8, no. 3: 442. https://doi.org/10.3390/app8030442
APA StyleMazaheripour, H., Faria, R., Ye, G., Schlangen, E., Granja, J., & Azenha, M. (2018). Microstructure-Based Prediction of the Elastic Behaviour of Hydrating Cement Pastes. Applied Sciences, 8(3), 442. https://doi.org/10.3390/app8030442