We verify the practical performance of the proposed algorithm from two levels of the effectiveness of the index performance synchronization evaluation model and the effectiveness of the personalized planning.
3.2.2. Validation of the Effectiveness of Personalized Planning
Based on the basic evaluation model for the reliable evaluation of the results of the synchronization performance index, three drives (A, B and C) in two categories, who own their own log trajectory records, are randomly selected from the seven kinds of small classifications of driving users (
Table 3) to the performance of the path planning algorithm. Specifically, inter-class experiments based on different type users A and B are designed to verify the universality of the algorithm. Meanwhile, intra-class validation experiment based on different type users B and C, who are in same type but possess different driving feature vectors are added to further verify the personalization level of algorithm. The validation verification framework is design as in
Table 10. To facilitate the comparison of path planning results, this paper is based on the background of route guidance in Changsha City which is same as that of Reference [
25], as well as the user types.
The class design verification in
Table 10 shows that the economy + comfort user A ([0.05,0.32,0.63]) travels with only economy and comfort in mind and thus ignores the time factor. For this user, the economic attention level is 2, the influence coefficient is small at 0.32, the level of the concern for comfort is 1, and the influence coefficient is up to 0.63. The individual values of road performance depend only on the economy and comfort factors.
Based on the driving characteristics of user A, the case is weight coupled with the time, economy, and comfort performance values obtained by the evaluation model. Moreover, the individual road performance values in field A are obtained. Then, the best path is searched according to the road’s personalized cost. In view of the large complexity of road networks, this example only enumerates the personalized performance and effective length of the road related to the path search results, as shown in
Table 11, where the effective length of the road is the length of the path through the planning path. In
Table 11, the personalized performance of each road in the personalized path that integrates user A’s habits is higher than the personalized performance of the roads in the reference path, which lays the foundation for the integration of personalized path performance advantages of user A driving habits.
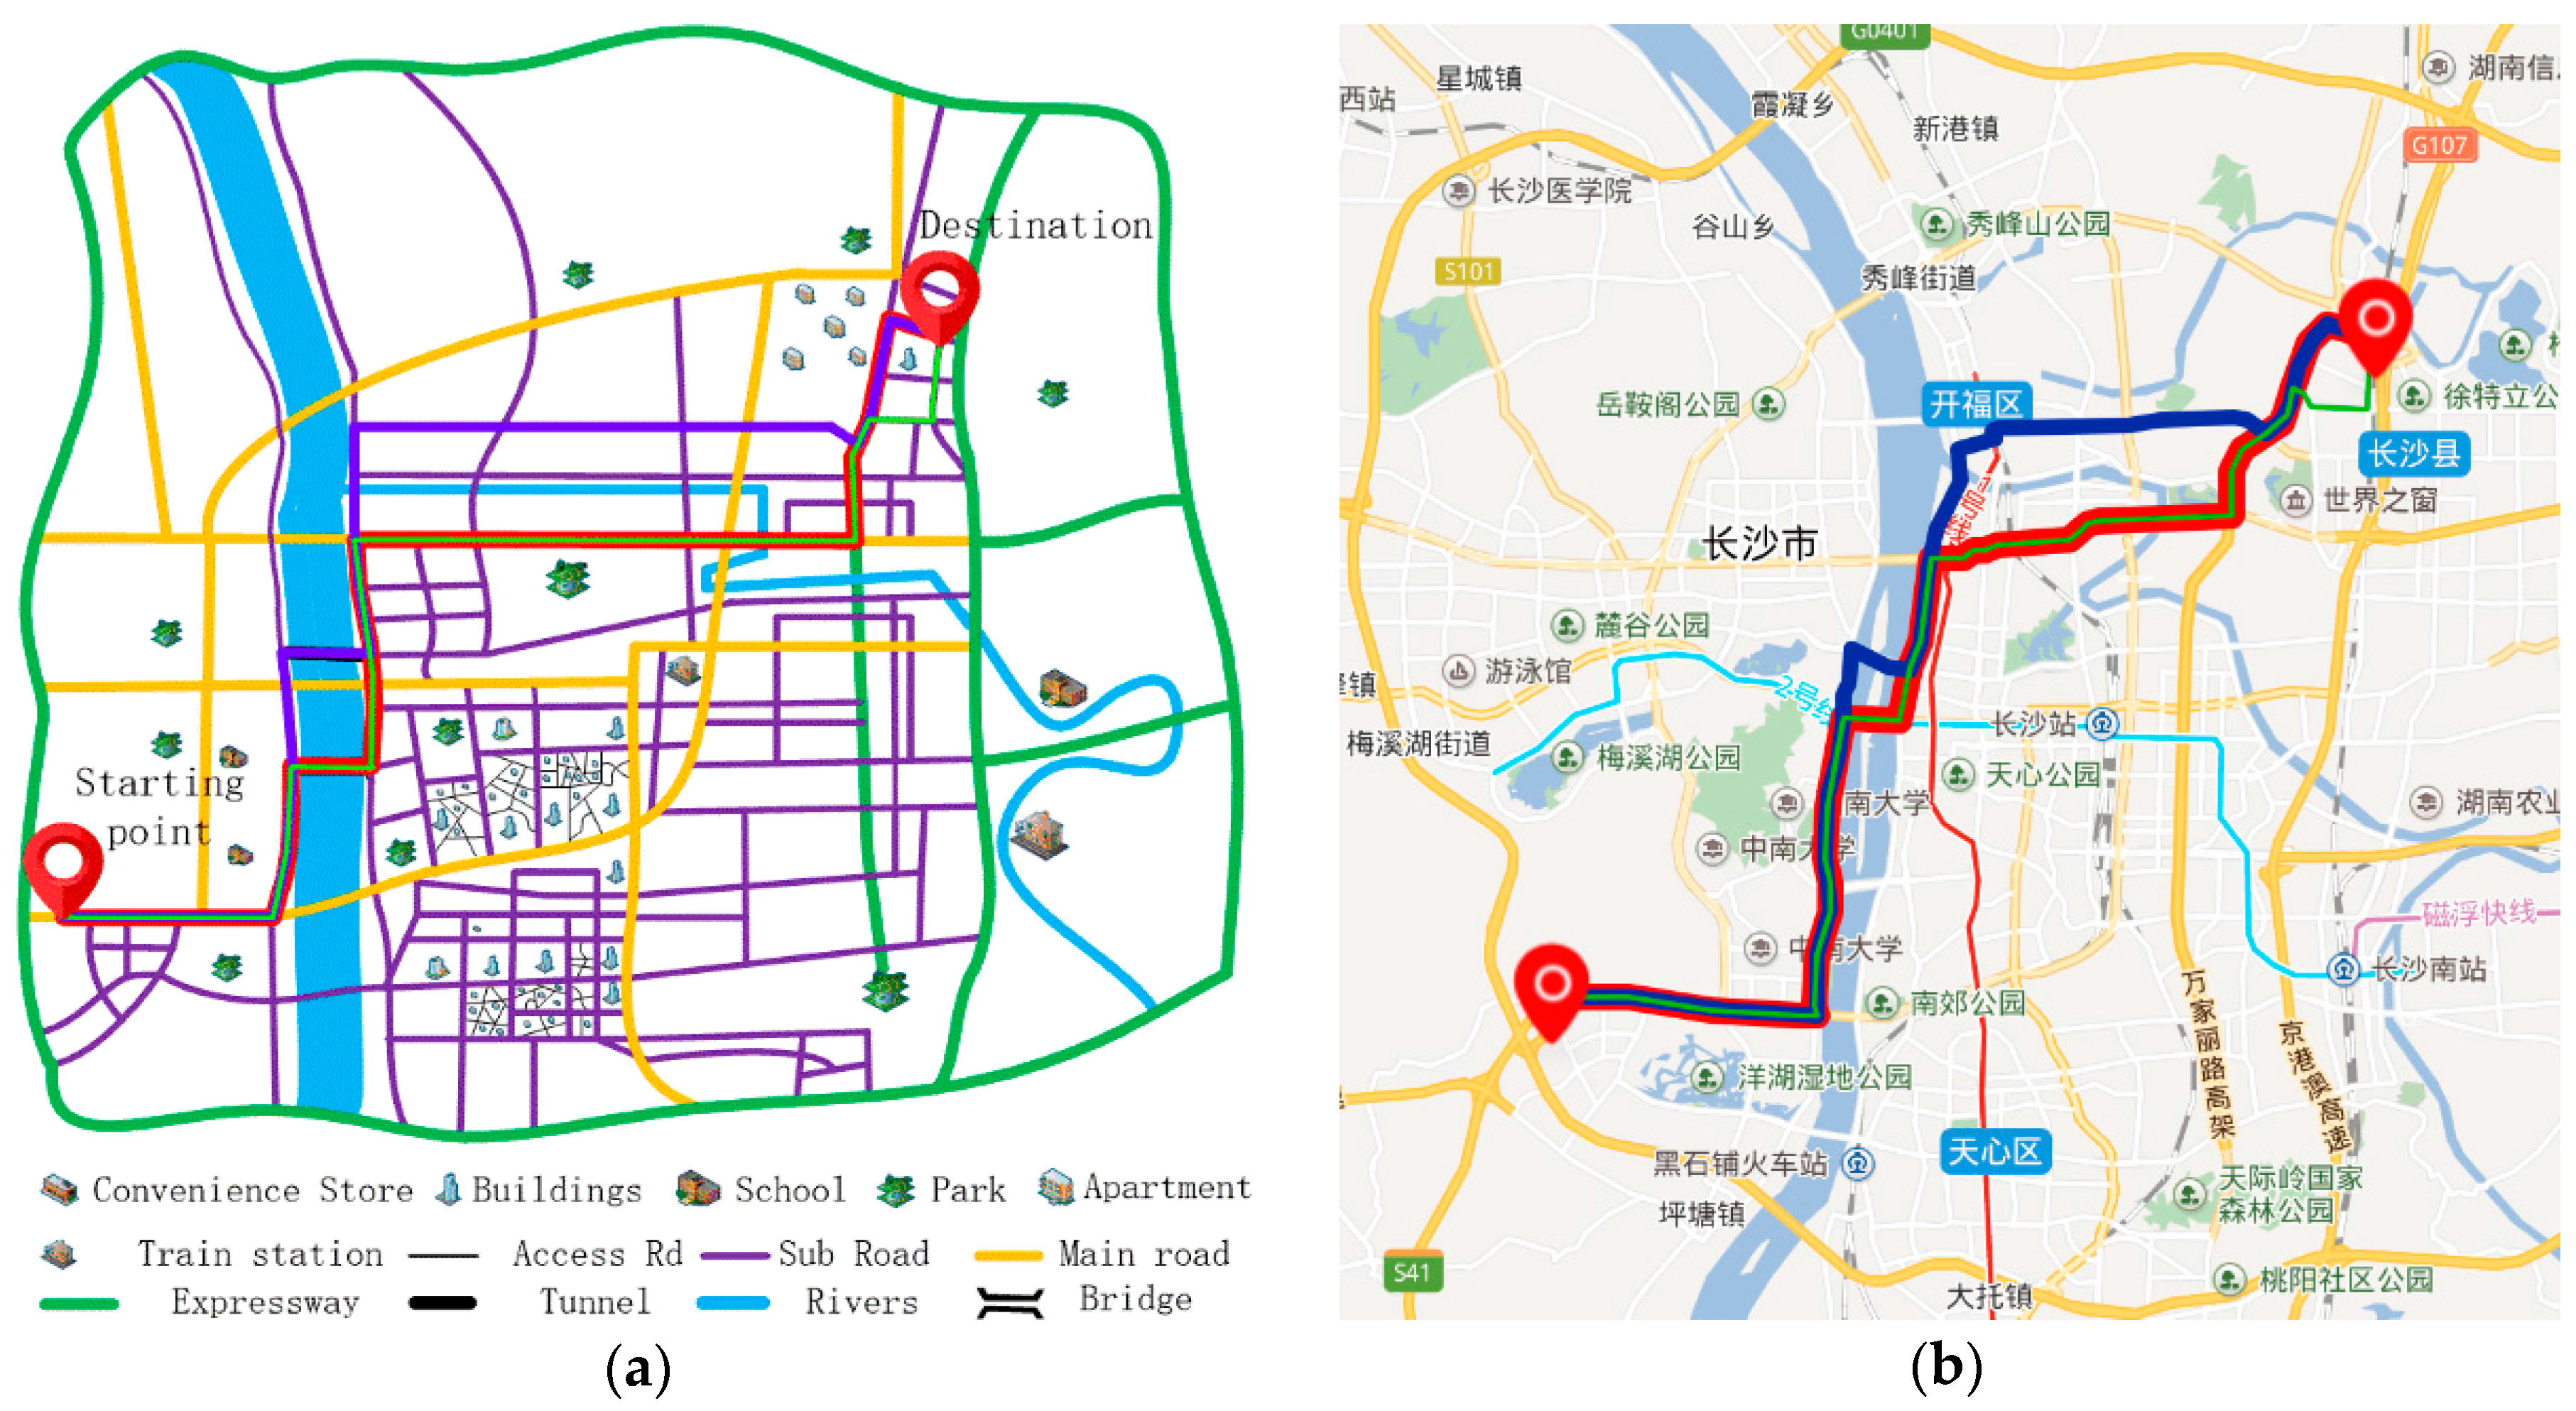
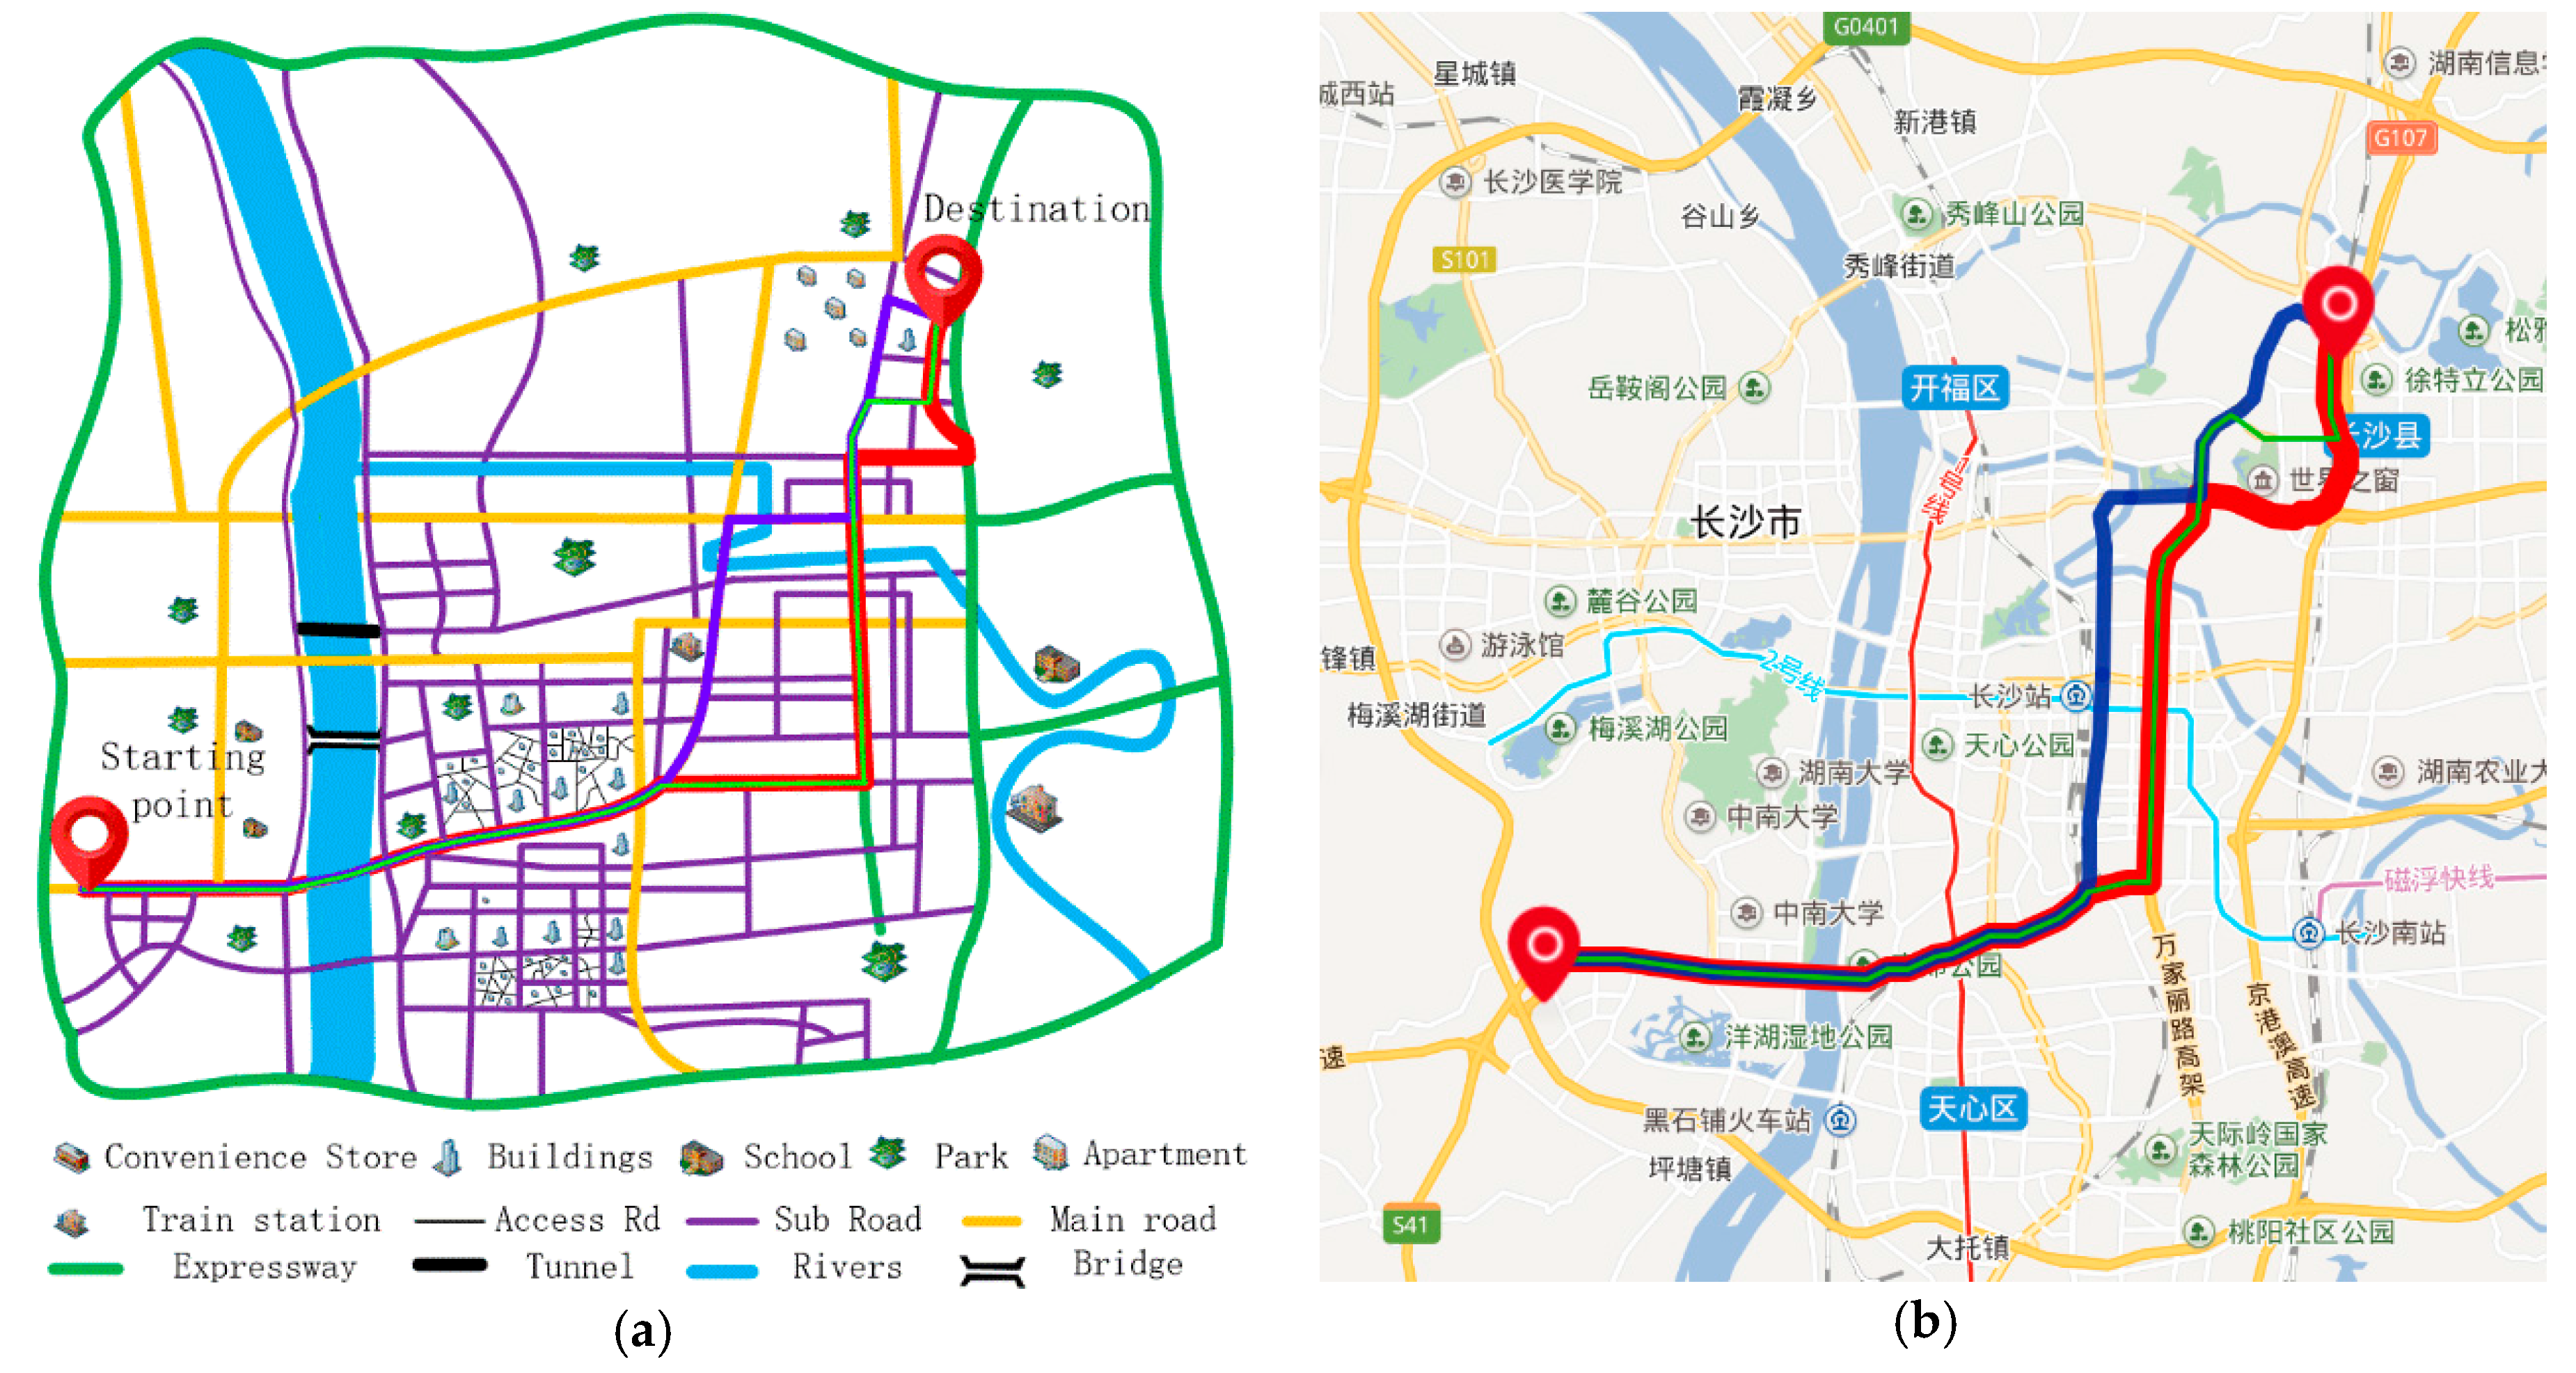
The optimal path model and actual planning path for user A are shown in
Figure 9a,b, respectively. In these figures, blue denotes the optimal planning path for users of the same type [
20], red denotes the optimal path to merge user A’s driving habits, and green denotes the log track of user A.
Figure 9 shows that in the landscape area, the blue and red paths are dominated by the surrounding landscape of Juzizhou Road, which showcases fresh air, beautiful scenery and low noise. The blue line represents the Yingpan road tunnel, and the red path shows the Orange Island Bridge across the area, overlooking the Orange Island scenery. The latter is in line with user A’s comfort requirements. In addition, the red route chooses the path from the perspective of user A, considering the comfort factors, and at the same time, it also focuses on the economic factors. In the non-sightseeing section, a small number of branches are allowed to reduce the detour distance to make up for the additional economic losses caused by the bypass of the two ends of the Orange Island Bridge. According to
Table 11, the economic and comfort performance of the road and the effective length calculation indicate that the cumulative comfort consumption rates of the red planning path and blue reference path are 56.62 and 59.06, respectively, and the total economic losses are 88.28 and 88.19, respectively. In comparison with the reference path, the user personalization path that integrates user A’s habits increases comfort performance while decreasing economic performance slightly. The comfort performance increment of user A is contrary to the economic performance increment, and comparing the performance of the red and blue paths is difficult.
Hence, in this work, the increase in comfort loss is
, economic loss increment is
and is dimensionless, as shown in Formula (20). Between
and
, t represents the time consumption of the red path and the total amount of economic consumption.
The calculation shows that
and
are satisfied in Formula (21).
Therefore, for user A, the increased comfort performance of the red path is greater than the economic performance reduction, the red path is more consistent with user A’s driving habits.
Time + economic user B ([0.35,0.57,0.08]) and user A ([0.05,0.32,0.63]) show significant differences in driving characteristics. Specifically, the former places high importance in time and economic factors while ignoring the influence of comfort; that is, for time level 2, the influence coefficient is 0.35, and for time level 1, the influence coefficient is 0.57.
Reference example A makes personalized path planning from user B’s perspective, and the path planning process is no longer duplicated. The individual performance and effective length of the related roads are shown in
Table 12.
Table 11 shows that the Yun Qi Road, South Second Ring, Wan Jiali viaduct, Wanjiali North Road, and Xianghu West Road appear in the path planning of users A and B; however, the road presents a considerable difference in terms of the personalized performance value and its effective length. Hence, verifying the performance of the proposed personalized path varies from person to person.
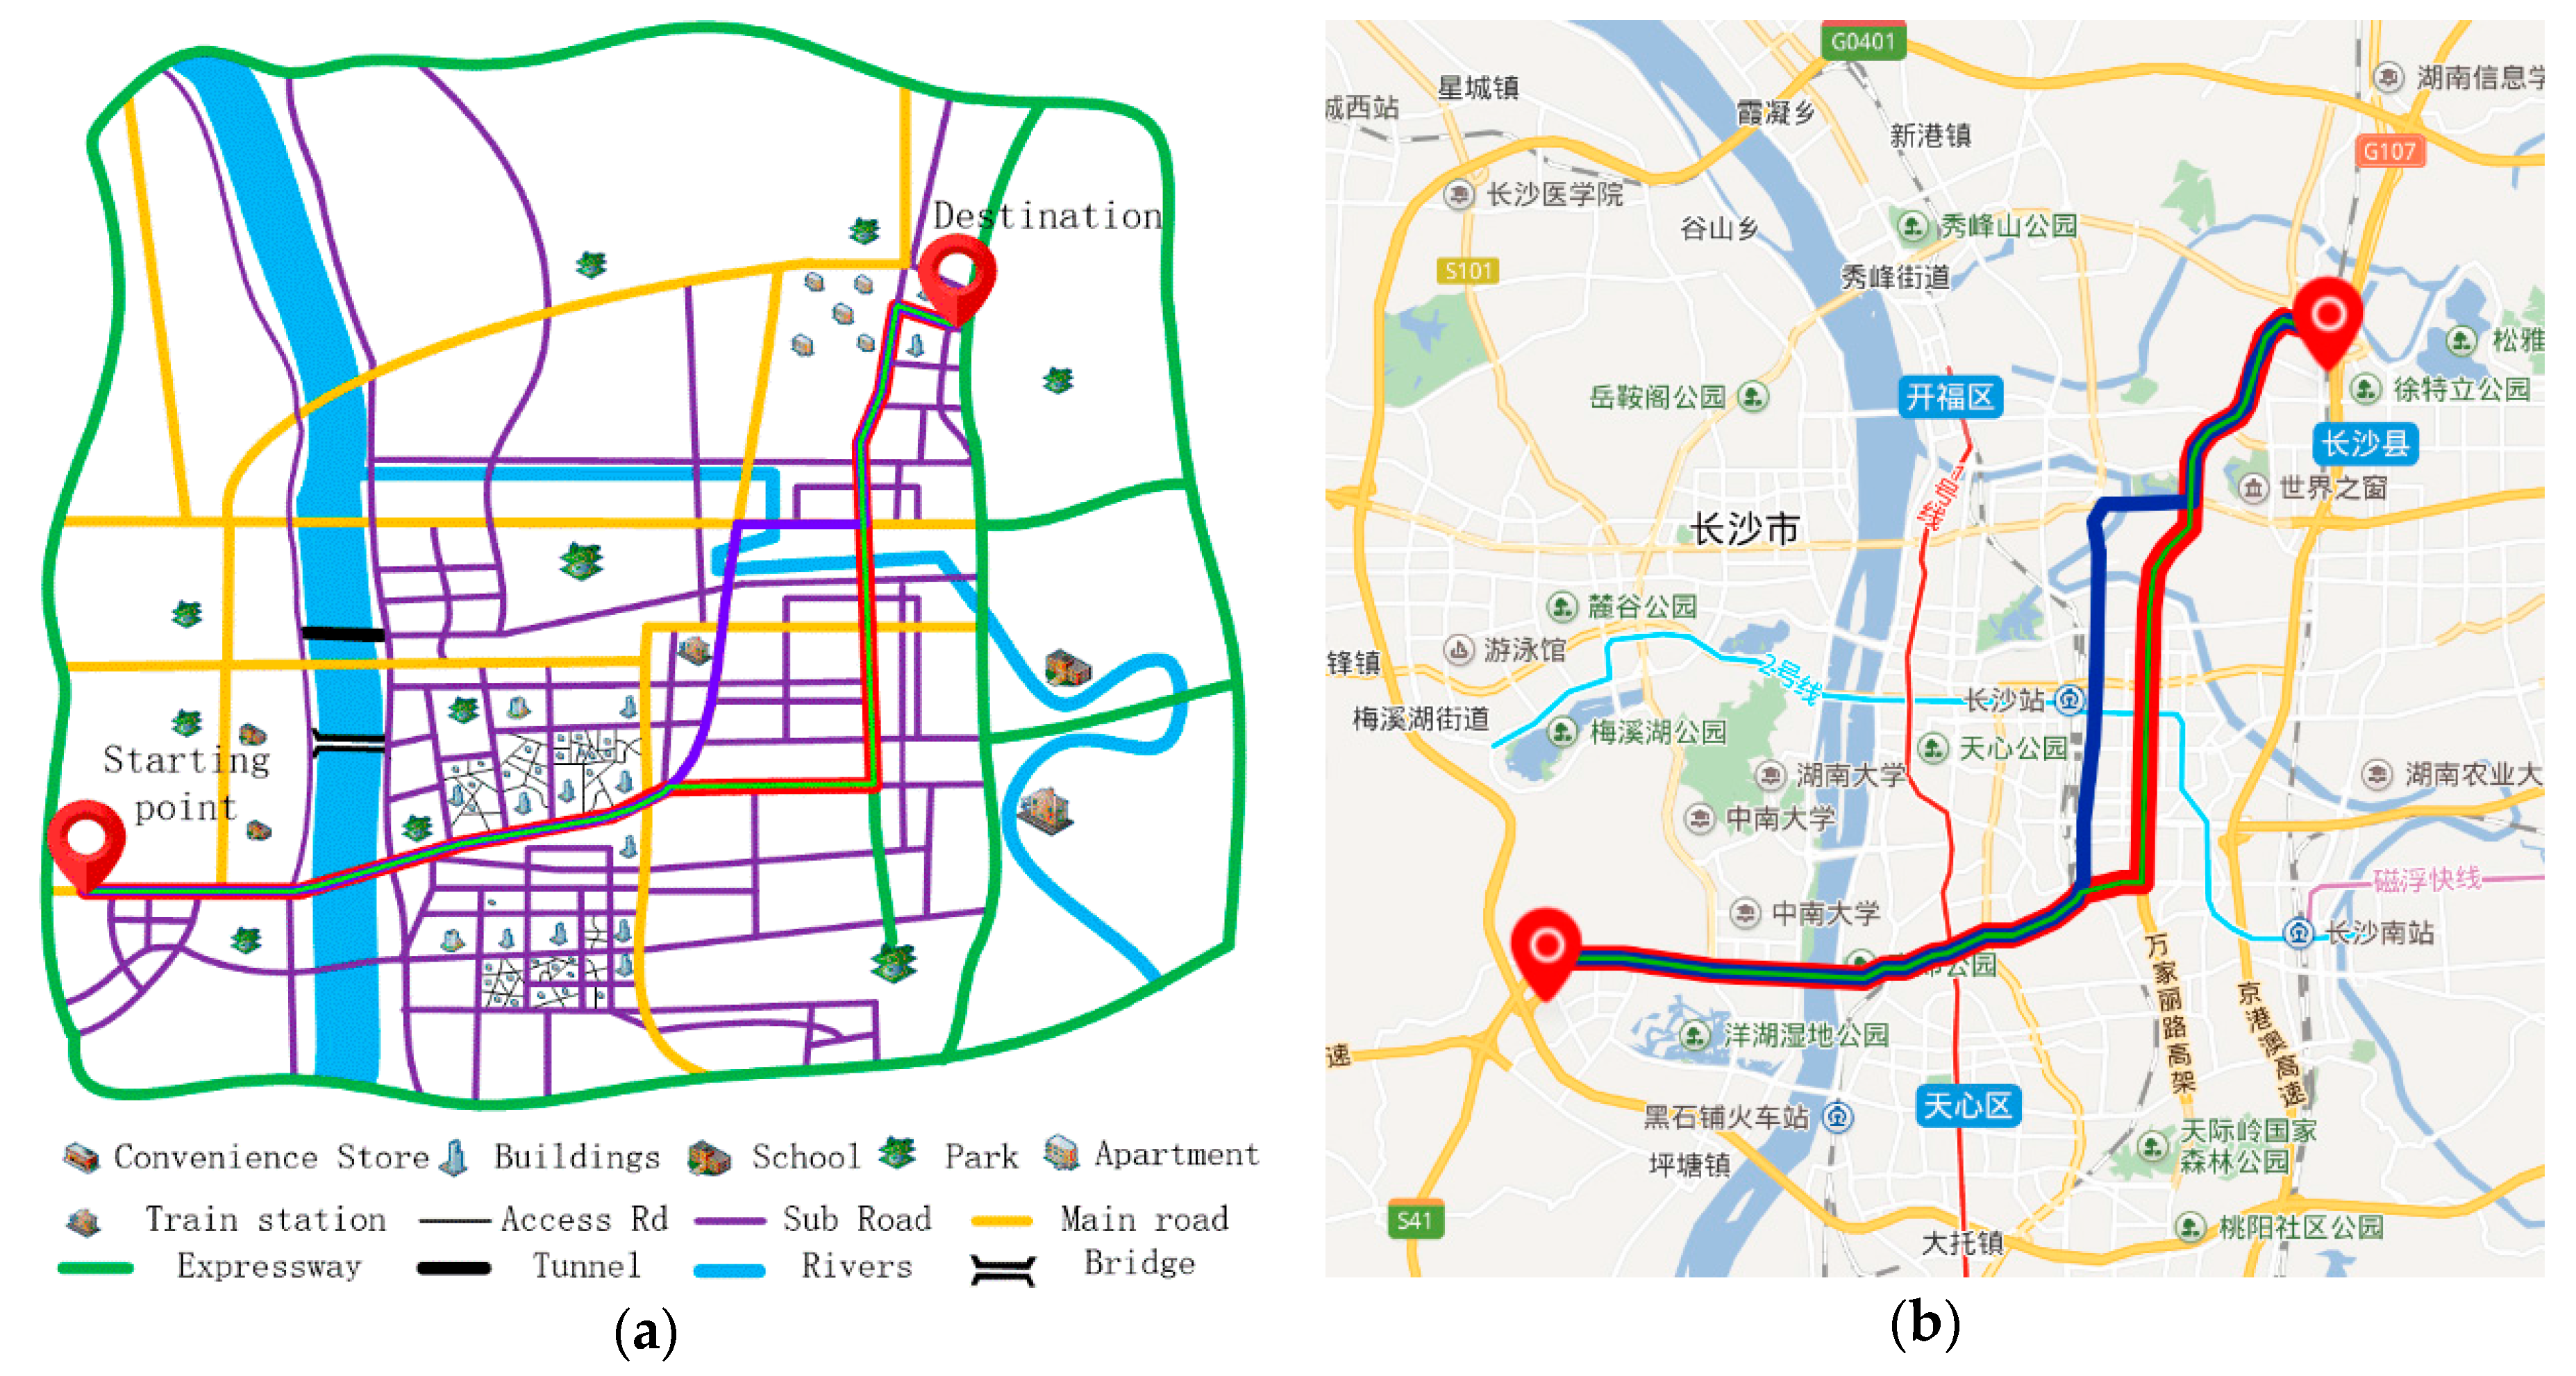
The optimal path model based on user B and the actual path, as shown in
Figure 10a,b, respectively, remain unchanged in terms of the descriptions of the colors corresponding to the planning paths.
Figure 10 shows that the blue and red paths are driven mainly by the main road or viaduct, and they shorten the detour distance as much as possible. In comparison with the blue reference path, the red path representing the personalized path of user A can effectively avoid the East Second Ring Road, Bayi Road, South Road, Furong Road, Wuyi Road, and the bottleneck of a congested road. The road is relatively unimpeded. Moreover, by replacing Wan Jiali viaduct with going around the city at high speed, guaranteeing the time performance, it avoids the extra cost of passing through the road and the distance from the bypass, and improves the economic performance of the path.
According to the calculation results related to the time and economic performance and the effective road length in
Table 12, the time consumption rates of the red planning path and blue reference path are 57.362 and 68.016, respectively, and the economic losses are 69.576 and 98.252, respectively. In comparison with the reference path, the personalized path that integrates user A’s habits shows improved comfort and economic performance. This result is consistent with the driving characteristics of user A, focusing on time and economic performance.
This example is the personalized path planning for time + economic user C ([0.56,0.37,0.07]), and user B’s planning path constitutes the intra-class verification of personalized path performance. Users C and B ([0.35,0.57,0.08]) share similar features, belong to the same time + economic type, pay attention to time and economic factors, while ignore the factors of comfort effect. However, there are two different levels of attention in time and economy. C users are more inclined to time, with a level of 1, a coefficient of 0.56, a second economic factor, a level of 2, and a coefficient of 0.37.
Reference example A makes personalized path planning from user C’s perspective. The personalized performance and effective length of the related roads are shown in
Table 13.
Table 12 shows that the Yun Qi Road, South Second Ring, Wan Jiali viaduct, Wanjiali North Road, and Xianghu West Road also appear in the same type of path planning of users B and C. Path planning is of different types for users A and B. The same type of road users has different personalized performance, particularly for users B and C. With large effective length differences, the amplitude becomes increasingly small. The similarity obviously improves path planning. Path planning at a similar degree increases with the increase of similarity between user feature vectors.
The optimal path model based on user C’s driving habits and the actual planning path, as shown in
Figure 11a,b, remain unchanged in terms of the descriptions of the colors corresponding to the planning paths.
By comparing
Figure 10 and
Figure 11, we can completely see that the blue reference path for user C in
Figure 11 is consistent with that of user B in
Figure 10, while the red planning path for user C in
Figure 11 is only consistent with that of user B in
Figure 10 at the beginning of the path planning, which avoids the East Second Ring Road and other regional centers and makes full use of time and economic advantages of Wanjiali viaduct; moreover, the inconsistent section steers clear of the Xianghu Road in densely populated areas, replacing it with Xi Xia Road that exhibits pedestrian sparsity, small confluence vehicles, and less traffic. According to the calculation results of time and economic performance and the effective road length shown in
Table 13, the cumulative time consumption rates of the red planning path and blue reference path are 57.25 and 68.02, respectively, and the total economic losses are 77.69 and 98.25, respectively. In comparison with the reference path, the personalized path of user A shows significantly improved time and economic performance, as shown in
Table 14.
To embody the private custom advantage of the personalized planning path proposed in this paper, the user C is used as the specific service object in this verification link, except for the example of the reference path (blue in
Figure 11b) experiments, adding the same type of personalized path (red in
Figure 10b) contrast link.
Obviously, the contrast experiment on the personalized planning path that integrates user B’s habits does not meet the increment in time and economic consumption. Therefore, for the performance qualitative comparison link of Example 1, the dimensionless and performance comparison results are shown in
Table 14.
Table 14 shows that in comparison with the reference path, the personalized planning path of user C shows greatly improved time and economic performance. This result is in line with the characteristics of the user related to time + economic performance. In comparison with the individual path planning of user B, the personalized path of user C shows improved time and economic performance; however, the benefits outweigh the lack of economic performance. This result is in line with user C’s greater attention time than economic performance levels.
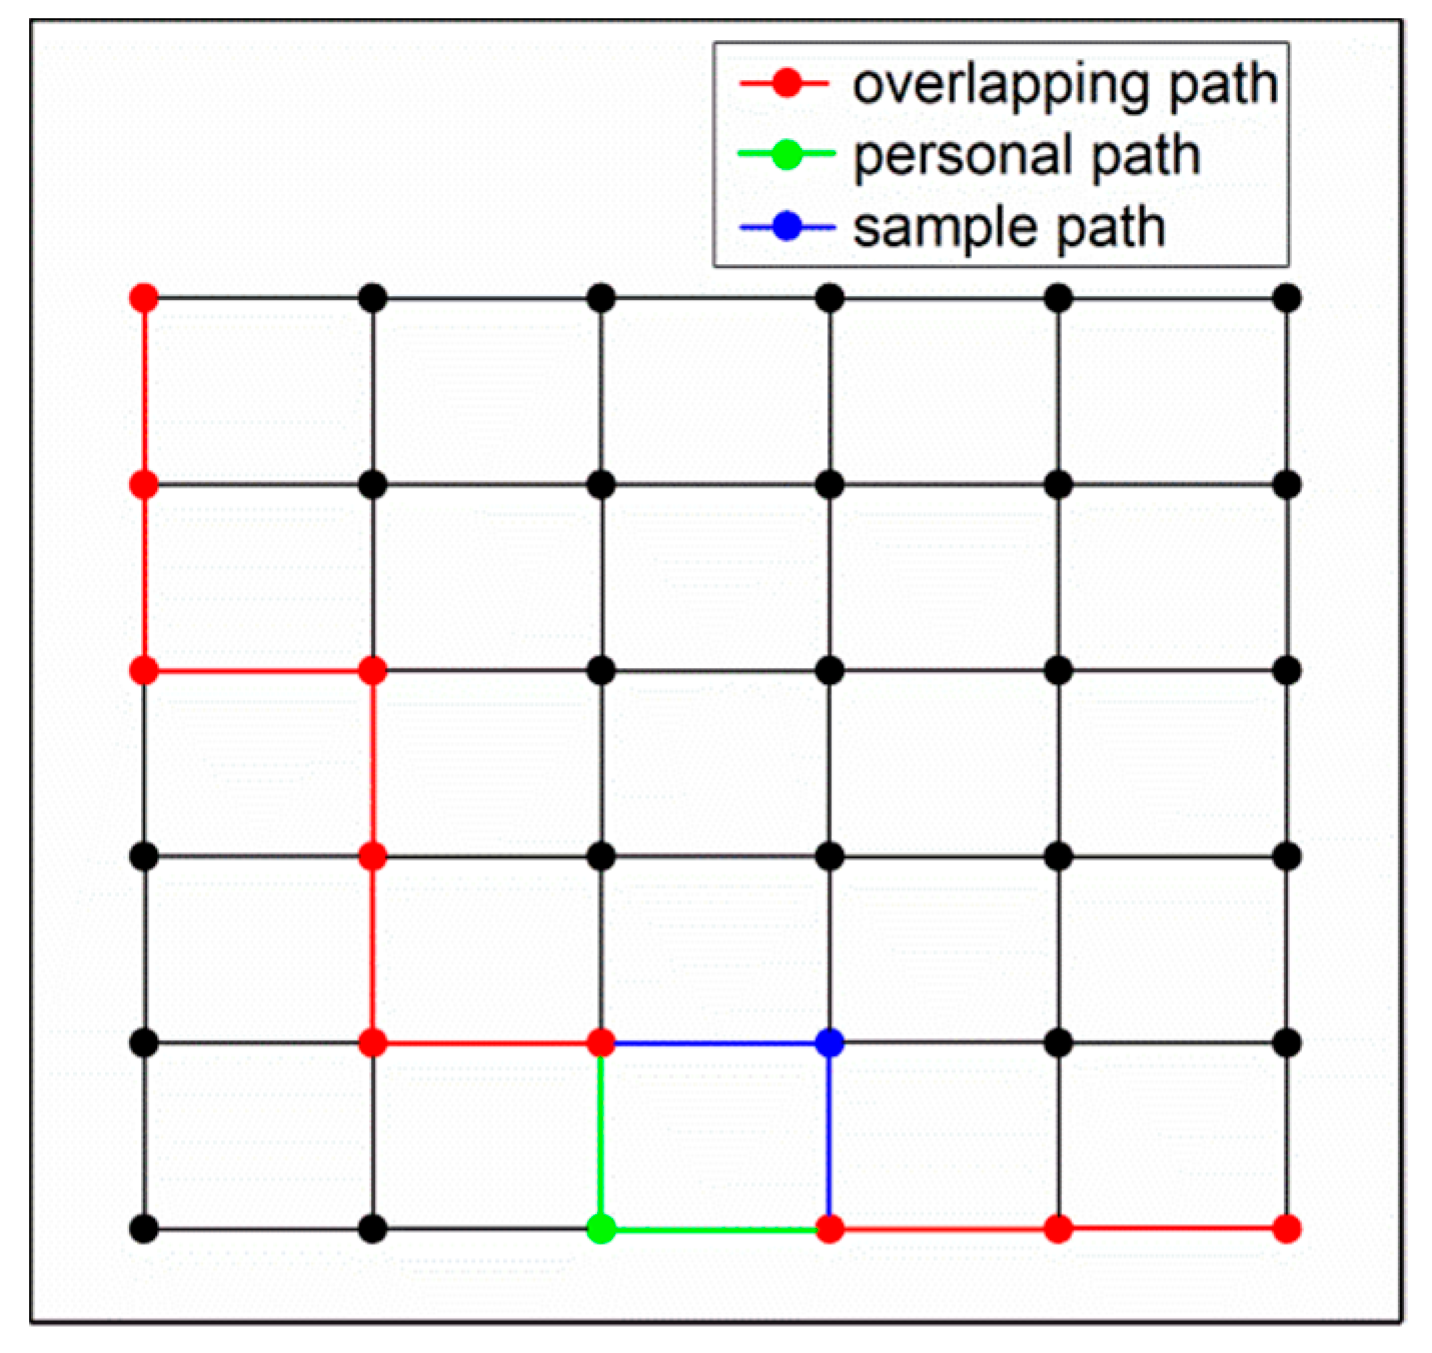
To establish the evaluation criteria for different planning paths and evaluate the performance of planning paths under different algorithms quantitatively, we introduce the path coincidence rate to characterize the matching degree between personalized paths. User driving habits Λ are satisfied in Formula (22).
Type
is the path length for the coincidence of planning path and log trajectory,
is the planning path length, and
≤
. The results of the above example are listed as follows: comfort + economic user A, time + economic user B, time + economic user C personalized path/literature reference path and user log trajectory matching the result shown in
Table 15.
From
Table 15, the coincidence degree levels of the personalized planning paths that integrates users A, B, and C are 89.2%, 100%, and 84.5%, respectively, which are different from the corresponding user log paths. The coincidence degrees of the planning paths are 52.3%, 64.7%, and 48.7%. In comparison with the reference path in the literature, the coincidence rate of the personalized path that integrates user habits and users’ log trajectory significantly increases by 36.9%, 35.3%, and 35.8%.


