4.1. Principal Components Analysis
The data dimensionality was reduced with the PCA method, which sought to find linear transformational functions that would bind the highest possible number of highly-correlated variables. The outlier results were eliminated first. Outlier values were those that were outside the 1.5 interquartile range [
34]. After the elimination step, a correlation table was prepared. Analysis of the correlation table data indicates that features such as V
m, N
w, ρ
ssd and ITS are correlated at the significance level of
R2 > 0.5. Parameters TSR and W
RW+M2 are correlated significantly at
R2 > 0.58. The highest collinearity occurs between the set of dynamic modulus E* results and the set of phase angle δ results, regardless of frequency level or test temperature used. The coefficient of determination is several times higher than 0.9. Both E* and δ are also strongly correlated with the recycled mixtures physical properties (V
m, N
w) and with ITS. The strong correlation in the group of rheological parameters, E and δ, makes constructing any classical model using multiple regression impractical. The inverse of the correlation matrix in the model would also be difficult. As a result, the PCA method turned out to be the best solution because it allowed the transformation of the measured parameter values into a new data set in such a way that new variables would be maximally uncorrelated with each other. Further analyzes were performed on new variables (new principal components).
With PCA the total number of original variables were reduced to 4 new variables. The Kaiser criterion [
36] was adopted, according to which the number of factors in the analysis could have factor loadings greater than 1, and the proportion of the variance explained was more than 85%. The results of the analysis are in
Table 2.
Finally, the phenomenon of collinearity between variables was eliminated when by the lost in representation quality approximately of 11%. Note that variable 5 did not make any significant contribution to explaining the 2.2% variability in the dataset. Thereby, the number of variables was limited to 4 using the Kaiser criterion. At this stage in the analysis, each new variable was functionally related with the real variables introduced into the dataset. The correlation and eigenvector table (
Table 3) shows the nature of the relationship between raw variables and the given new grouping variable.
Using results of eigenvectors together with the mean and the standard deviation statistics in
Table 3 every new result out of analysis can be transformed to new collection of uncorrelated variables (Z1–Z4). Note that all the results of the elastic stiffness modulus (E) and the phase angle (δ) showed the highest correlation with the first variable (Z1). This factor, based on
Table 2, explains almost 57% of the variation in the entire dataset. It should be noted that between moduli determined at different temperatures (in viscoelastic range) there were a relationship according to well know TTSP (time temperature superposition principle). The impact of the stiffness modulus and phase angle parameters on the observed data set were expressed by the parameter Z1 which defines the viscoelastic character of the recycled mixes. The presented analysis assumed the possibility of entering missing stiffness modulus data on the basis of the results coming from the leading curve.
Factor Z1 is in fact responsible for the rheological characteristics in the linear viscoelasticity range of the recycled mixtures. It gather a whole impact of stiffness modulus and phase angle at all. Regardless of how many stiffness modulus measurements were made its influence on analysis will be the greatest. The second variable (Z2) is strongly correlated with air void content (V
m) and absorption (N
w), and moderately correlated with indirect tensile strength (ITS) and viscous behavior of specimens at high temperature as shown by (δ) measurement. This variable explains about 21% of the variation in the population. The third variable (Z3) is correlated with the parameters responsible for moisture resistance. The portion of variation it explains is only about 6%, which can probably be attributed to the low sensitivity to the presence of water of the set of MCAS mixtures with waste materials. The last variable (Z4) explains only 4.6% (
Table 3) of data variation in the dataset, and is correlated mainly with the density of recycled mixtures in conjunction with moisture resistance. The low proportion of variation in (Z4) is probably caused by the presence of “heavy-weight” steel slag aggregate. The new variables providing a global view of the set of effects were used in the process of grouping objects in the dataset of the recycled mix specimens.
4.2. Cluster Analysis
The selection of suitable variables was extremely important in cluster analysis, as was the isolation of the principal components at the earlier stage. The key issue was to choose the variables that best represent the population of recycled MCAS mixes with waste materials. The previous stage of the analysis was aimed at eliminating outlying points and minimizing the collinearity of new variables. The subsequent grouping step was based on the new four factorial variables Z1 to Z4 and indirectly on the real variables which represented the specimens of the mixtures. Ward’s method was used as a hierarchical method of agglomeration [
37,
38] In practice, there is no arbitrary method that clearly states the number of clusters. The Grabiński [
39] and the frequently used Sneath criterion were used in this study [
40]. The limit value for the Sneath criterion is shown in
Figure 3.
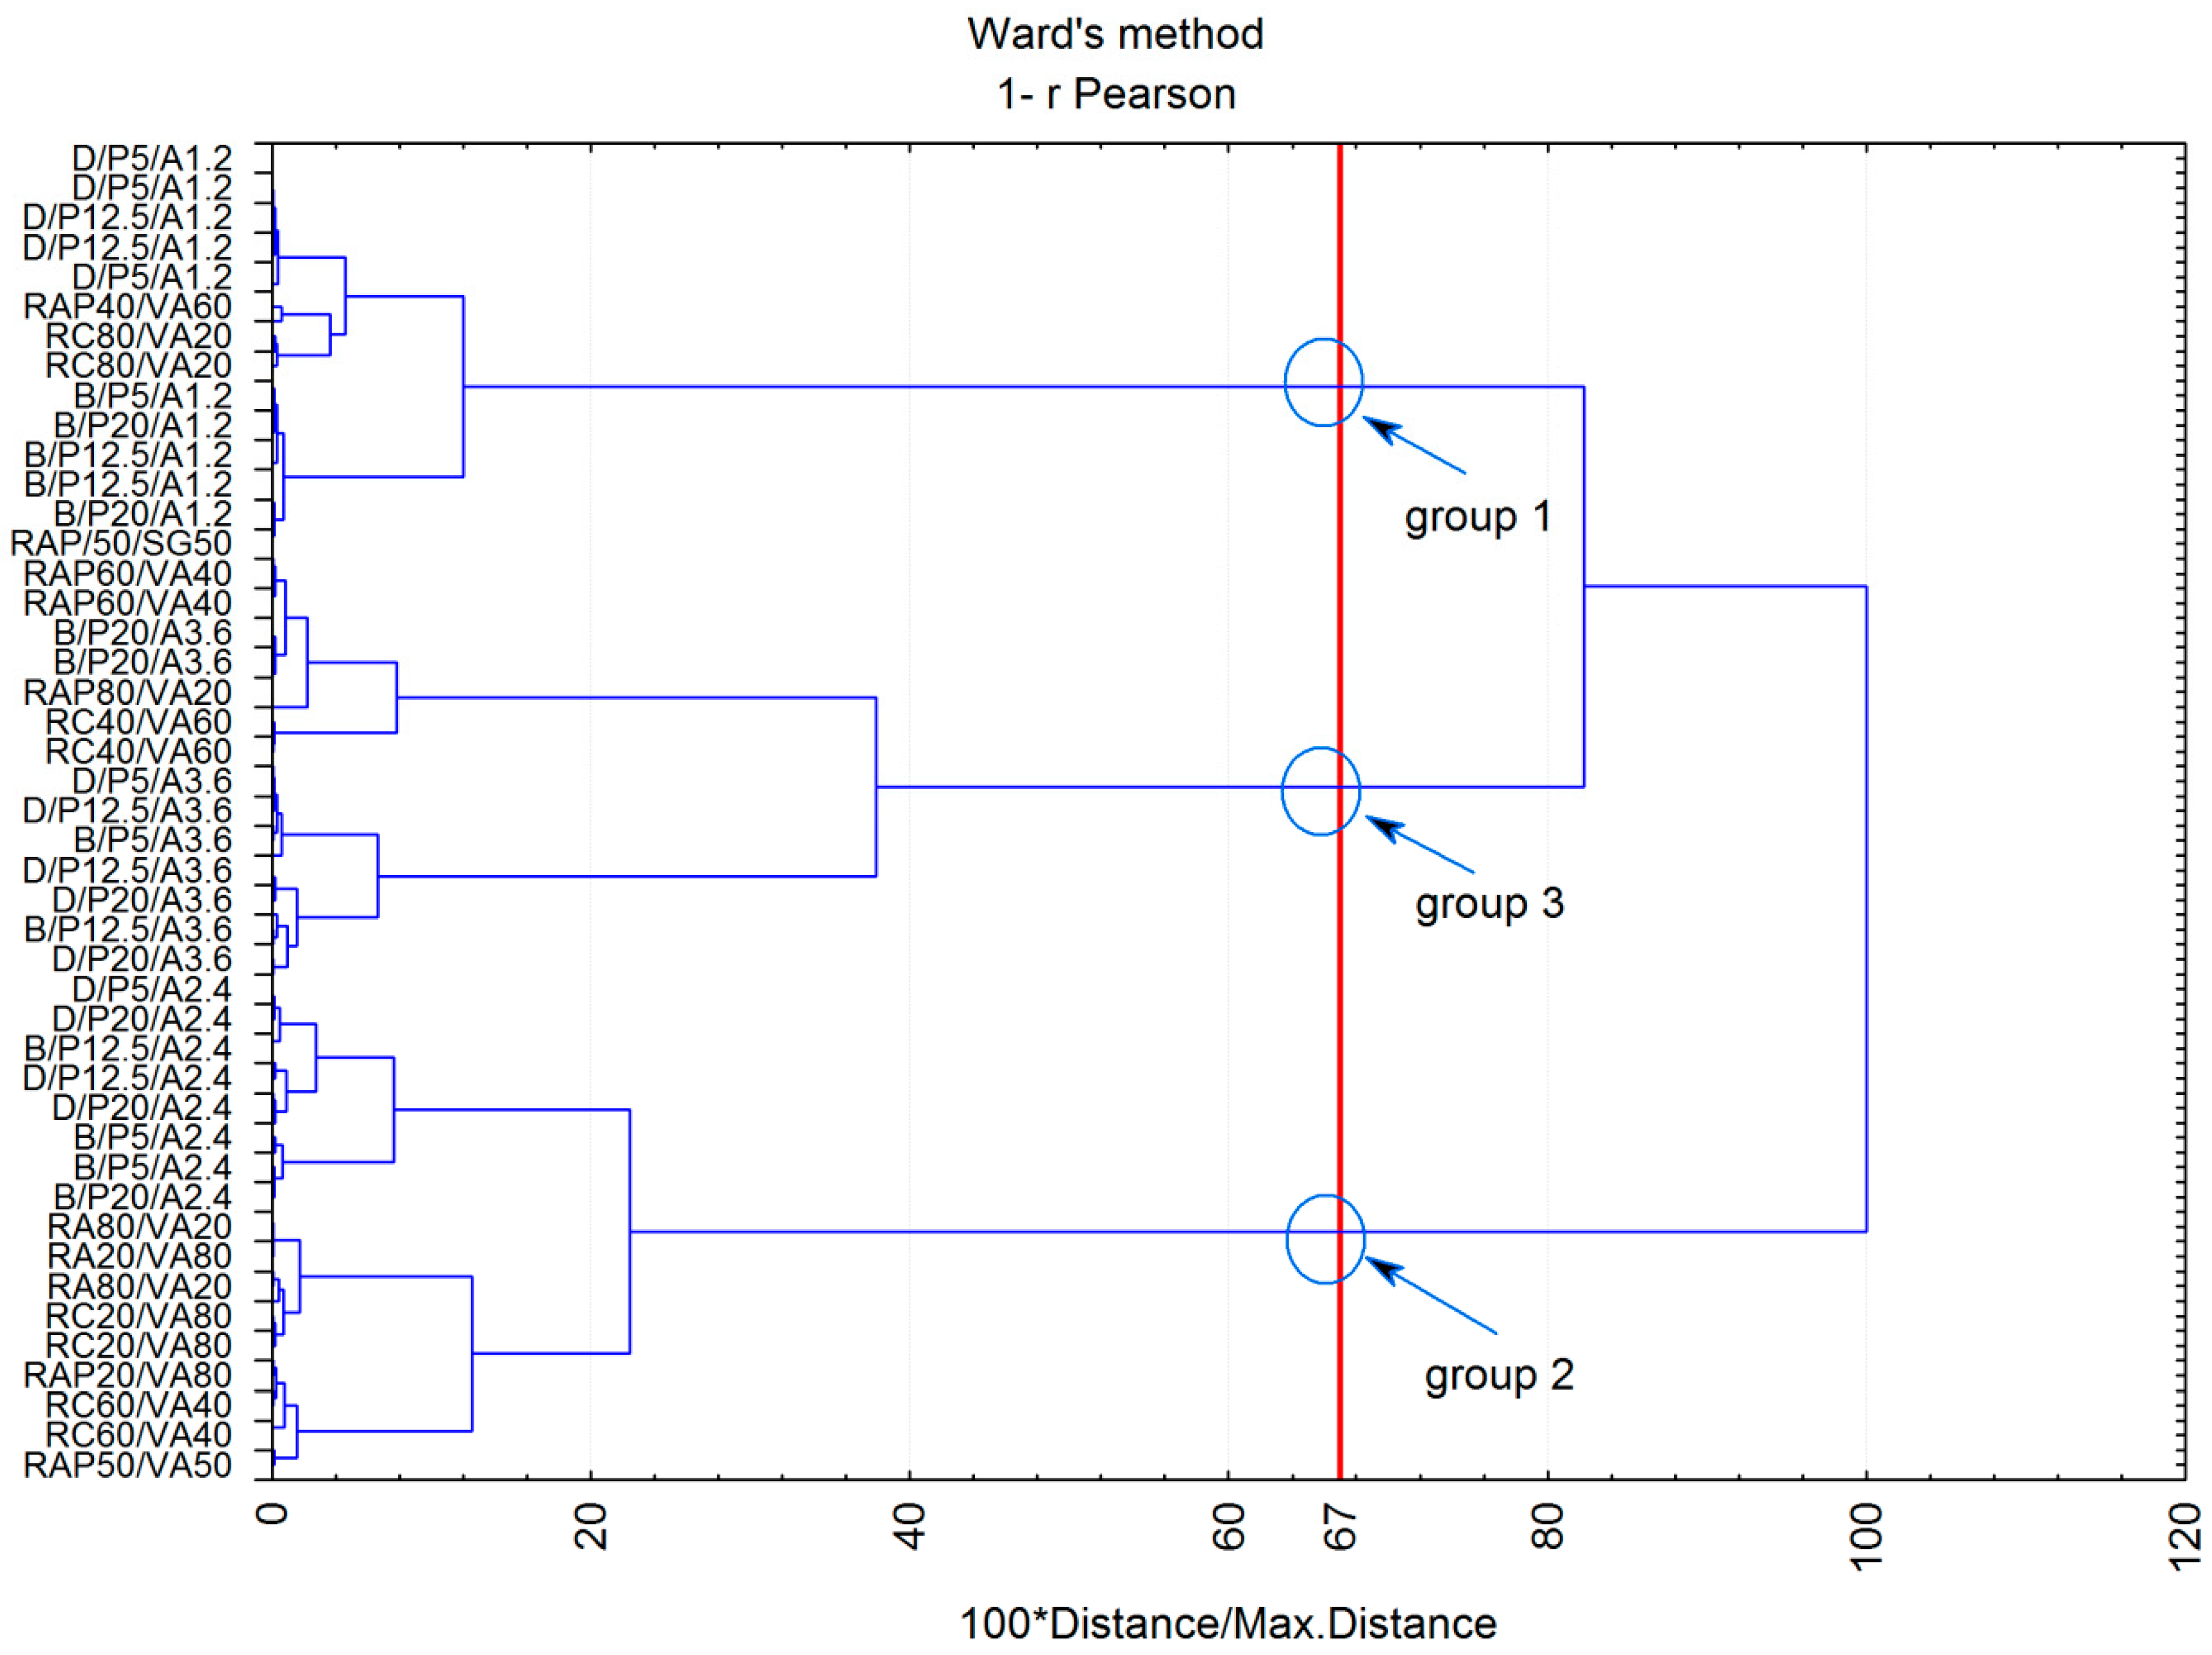
The vertical axis in
Figure 3 shows every second case. The main intention was to present as many cases from the specific group as possible. On the basis of the agglomeration results (
Figure 3) and using four variables (Z1 to Z4), three new groups were obtained, different in terms of physical and mechanical parameters. Their differentiation was very clear given the normalized distances between the clusters. The red line in
Figure 3 cuts off a set of high internal similarity objects (clusters) but characterized by a great dissimilarity between one another. This information is important because the agglomeration can be the basis for assigning particular MCAS specimens. Finally, three groups were chosen for further analysis.
Table 4 shows the types of MCAS recycled mixtures represented by the highest number of specimens in the given group.
The mix denotation as RAP20/VA80 indicates the use of 20% RAP and 80% VA in the mix. In the case of mixtures with mineral dust, D.P12.5/A1.2 denotes a blend of 12.5% dolomite mineral dust (D) and 1.2% foamed bitumen. The grouping as described above provides preliminary information on certain factors that separate the properties of the specimens being analyzed. In the present form, the amount of bitumen in the mixtures with mineral dust (D/P/A and B/P/A) was a major factor in assigning them to adequate groups. The amount and type of dust played a secondary role. Other important elements were the amount of recycled aggregate (RA) and the amount of RAP used in the recycling process. The increase in the amounts of RAP and foam bitumen caused the convergence between the grouping results for the recycled mixture specimens with the average results in Group 3. However, the presence of cement in the mix or its increased content due to the addition of recycled cement concrete materials could also influence the grouping effect because Group 1includes a case of mixtures with high amounts of reclaimed concrete (RC) and a case of a low bitumen mixture, which may suggest excessive stiffness of the mixtures.
The next step in multidimensional inference was the statistical estimation of the results within particular groups of MCAS specimens with waste materials. First, the average dynamic stiffness modulus (E) and the phase shift (δ) were evaluated. Due to the high collinearity of rheological results and in compliance with provisions [
30,
31], the results of the stiffness modulus determined at 5 °C and 10 Hz loading time were used for comparative purposes. As for the phase angle, the average value determined at 40 °C was used. This choice was based on the distinctness of this case observed in
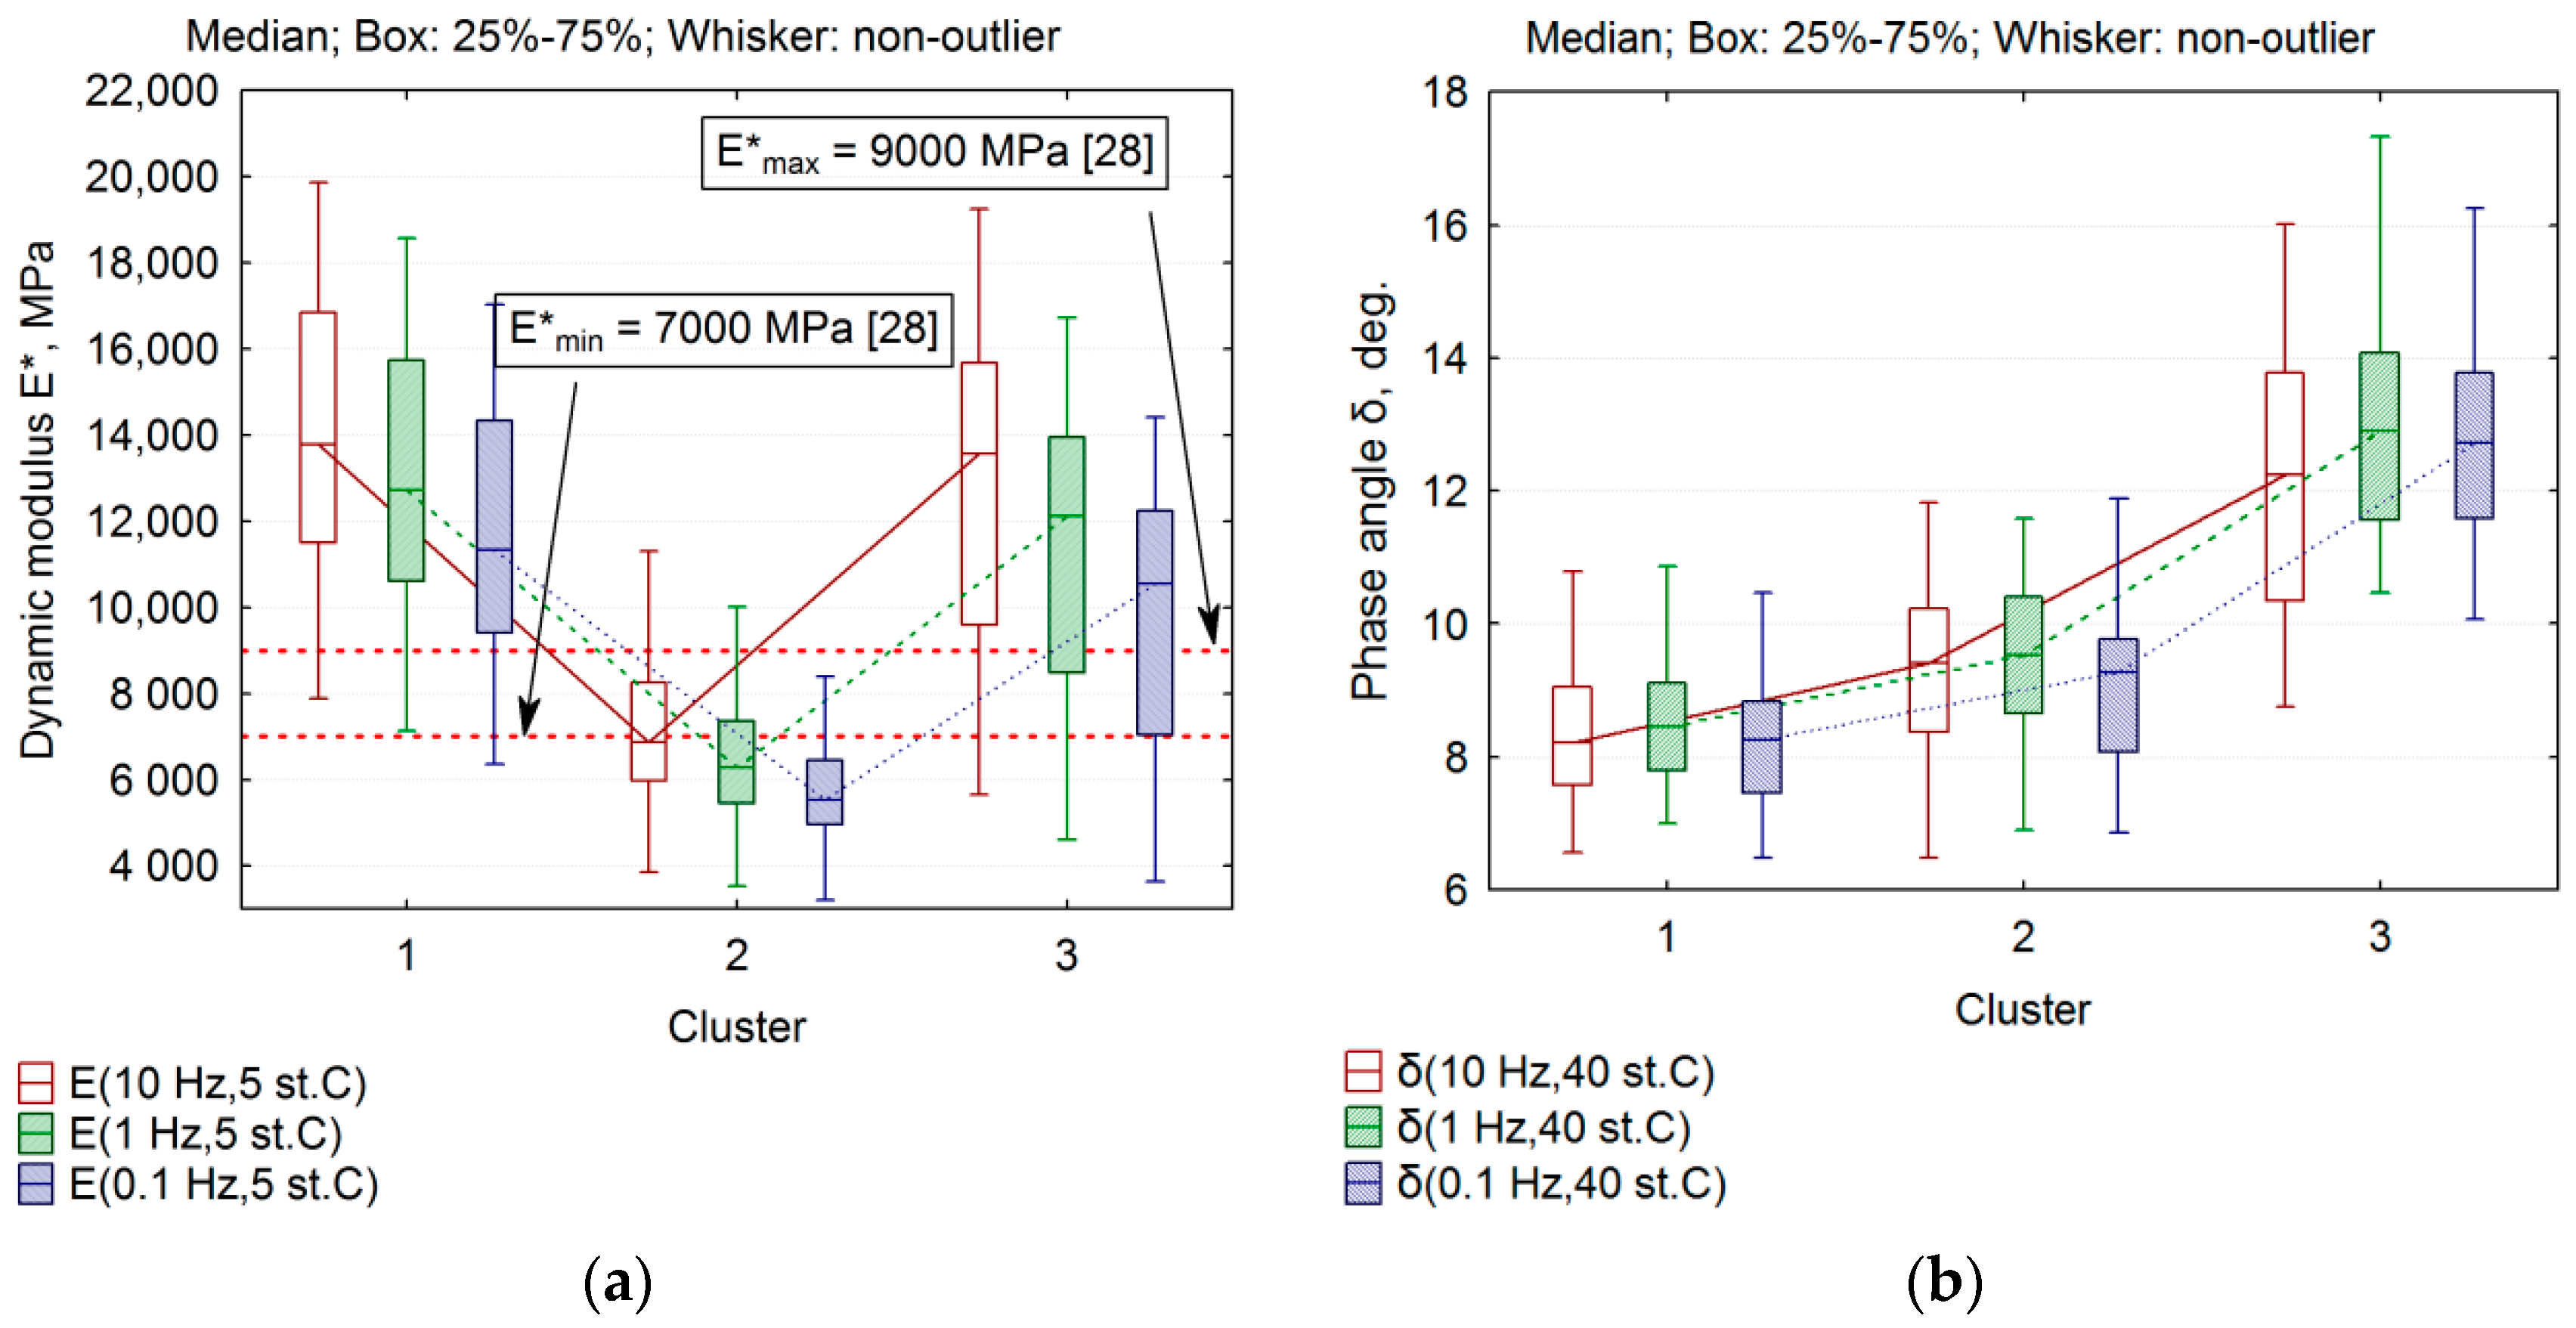
Table 3, as reflected in the behavior of the mixtures at high service temperatures. The viscoelasticity results of the recycled MCAS mixes are shown in
Figure 4.
The results in
Figure 4a show that the mix specimens in Group 1 had the highest average dynamic moduli (E). The average value of the stiffness modulus determined at 5 °C and 10 Hz was E = 13,787 MPa. This value is almost twice as high as the minimum criterion set forth in [
18]. Such a high stiffness modulus and low sensitivity to loading time have also been observed by other researchers [
8]. However, their observations do not confirm excessive cracking in pavements due to high stiffness of incorporated MCAS. Group 3 attained comparable dynamic modulus results to those in Group 1. Their equivalence indicates that this parameter (stiffness modulus) cannot be the only criterion when considering suitability of recyclable MCAS mixes with waste materials. The lowest results were obtained in Group 2 composed of mix specimens with dusts and large proportion of recycled aggregates, probably because of inadequate foamed bitumen-dust amount ratio. Group 2 included the specimens with dolomite and basalt dusts made independently in time, which excludes systematic errors in dosing. The average level of stiffness modulus in Group 2 was E* = 6866 MPa. Note that this group contained also the specimens with recycled dolomite aggregate (RA) whose quality could have influenced the grouping process [
7]. The phase angle (δ) results complemented the analysis (
Figure 4b). Note that although Group 1 and Group 3 were similar in terms of stiffness, their rheological character at 40 °C was different. In Group 3, the phase angle was almost twice that of Group 1. Probably the viscous effect of Group 3 was due to the presence of specimens containing high amounts of bitumen and RAP material used in the composition of recycled MCAS mixtures. As a result, mixtures in Group 3 were different from Group 1 mixes by having an increased reserve of flexibility also at low temperatures. The effect of hydraulic binders, including binder blends, on the rheological character of the recycled mixtures was observed in [
41] 4.0.
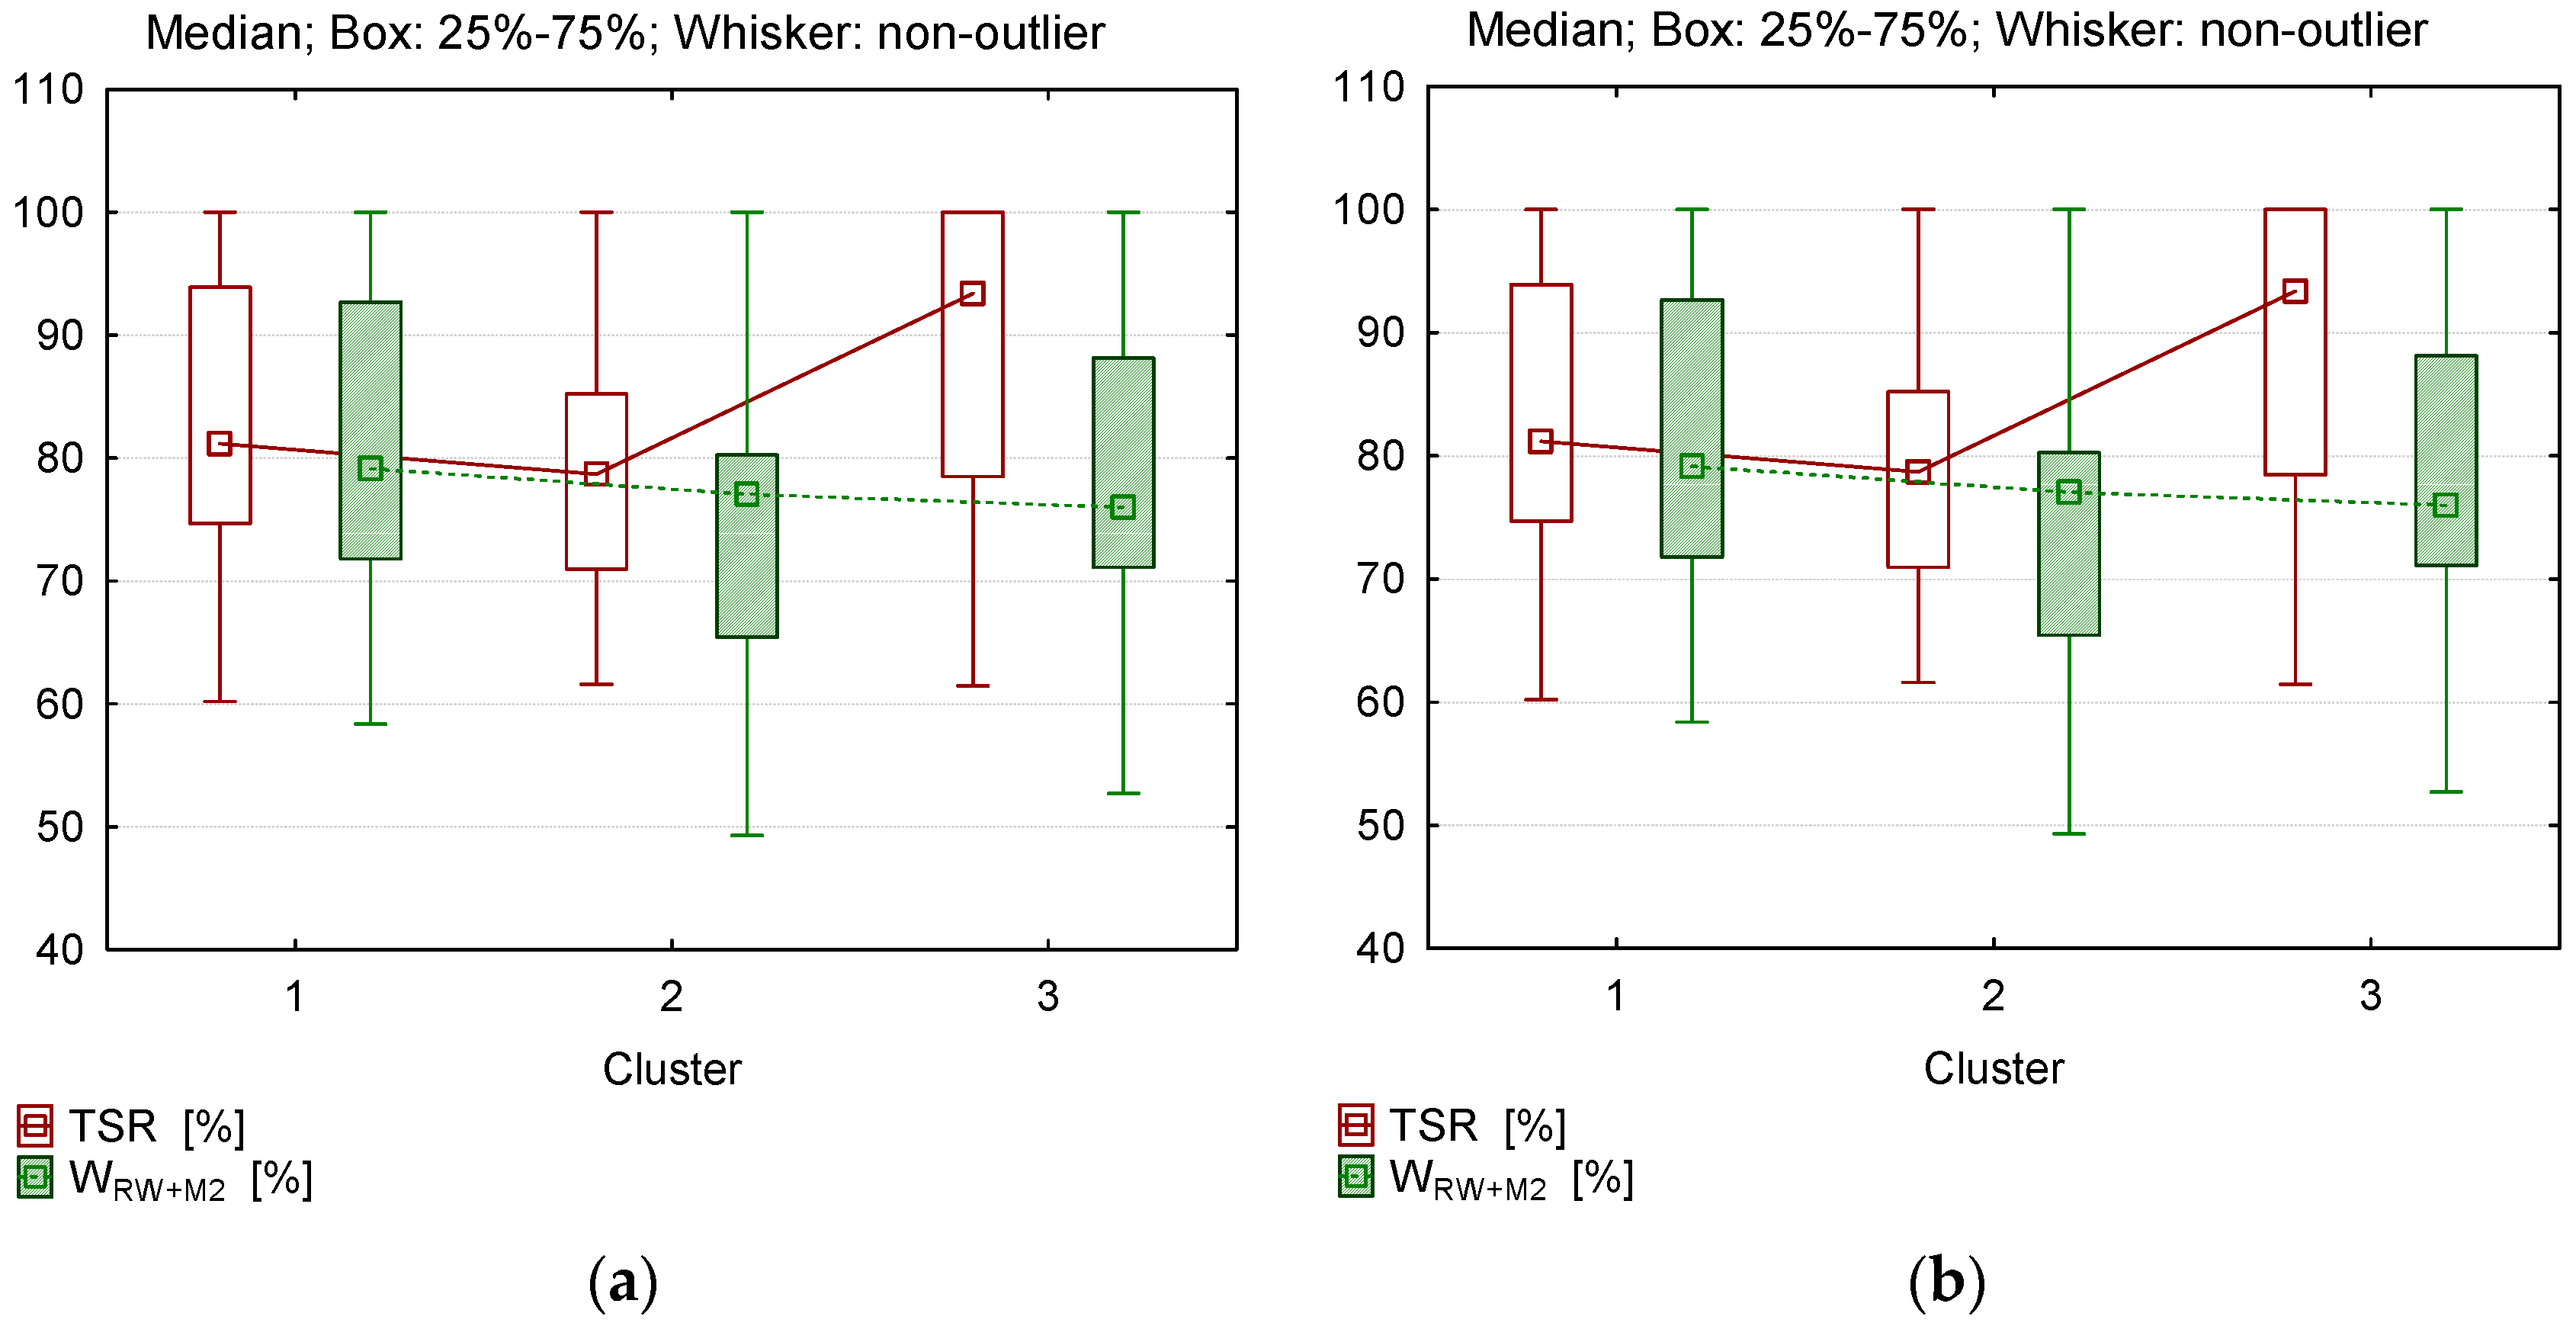
Another group of parameters whose levels were diversified with respect to clusters were the characteristics related to climatic factors (TSR and WRW + 2M) and indirect tensile strength (ITS) at 25 °C. The grouping results are illustrated in
Figure 5.
The results of moisture resistance for the MCAS recycled mixtures (TSR and W
RW+2M) (
Figure 5a) were convergent with each other and showed the similarity of the overall results in Group 1 and Group 2. In Group 3, the average TSR value was high, TSR > 90%. This demonstrates the increased resistance to moisture-induced damage of the specimens in Group 3. It should be noted that Group 3 comprised the specimens with a large amount of bitumen. As with the ITS (
Figure 5b) and TSR results, the highest levels were recorded in Group 3. The large group of MCAS results in Group 3 was within the MCE requirements range. Thus, the recycled mixtures in Group 3 had the highest cohesion and improved moisture resistance. In contrast, Group 2 represented mixtures with an acceptable moisture resistance level but with the lowest average level of the ITS parameter was relative to MCE. Evaluation of the results in Group 2 indicates a likelihood that ITS > 500 kPa and TSR < 50. This may be a sign of low cohesion of some of the mixes in Group 2, as mentioned in [
7,
29]. Therefore, the durability of mixes similar to this group is questionable.
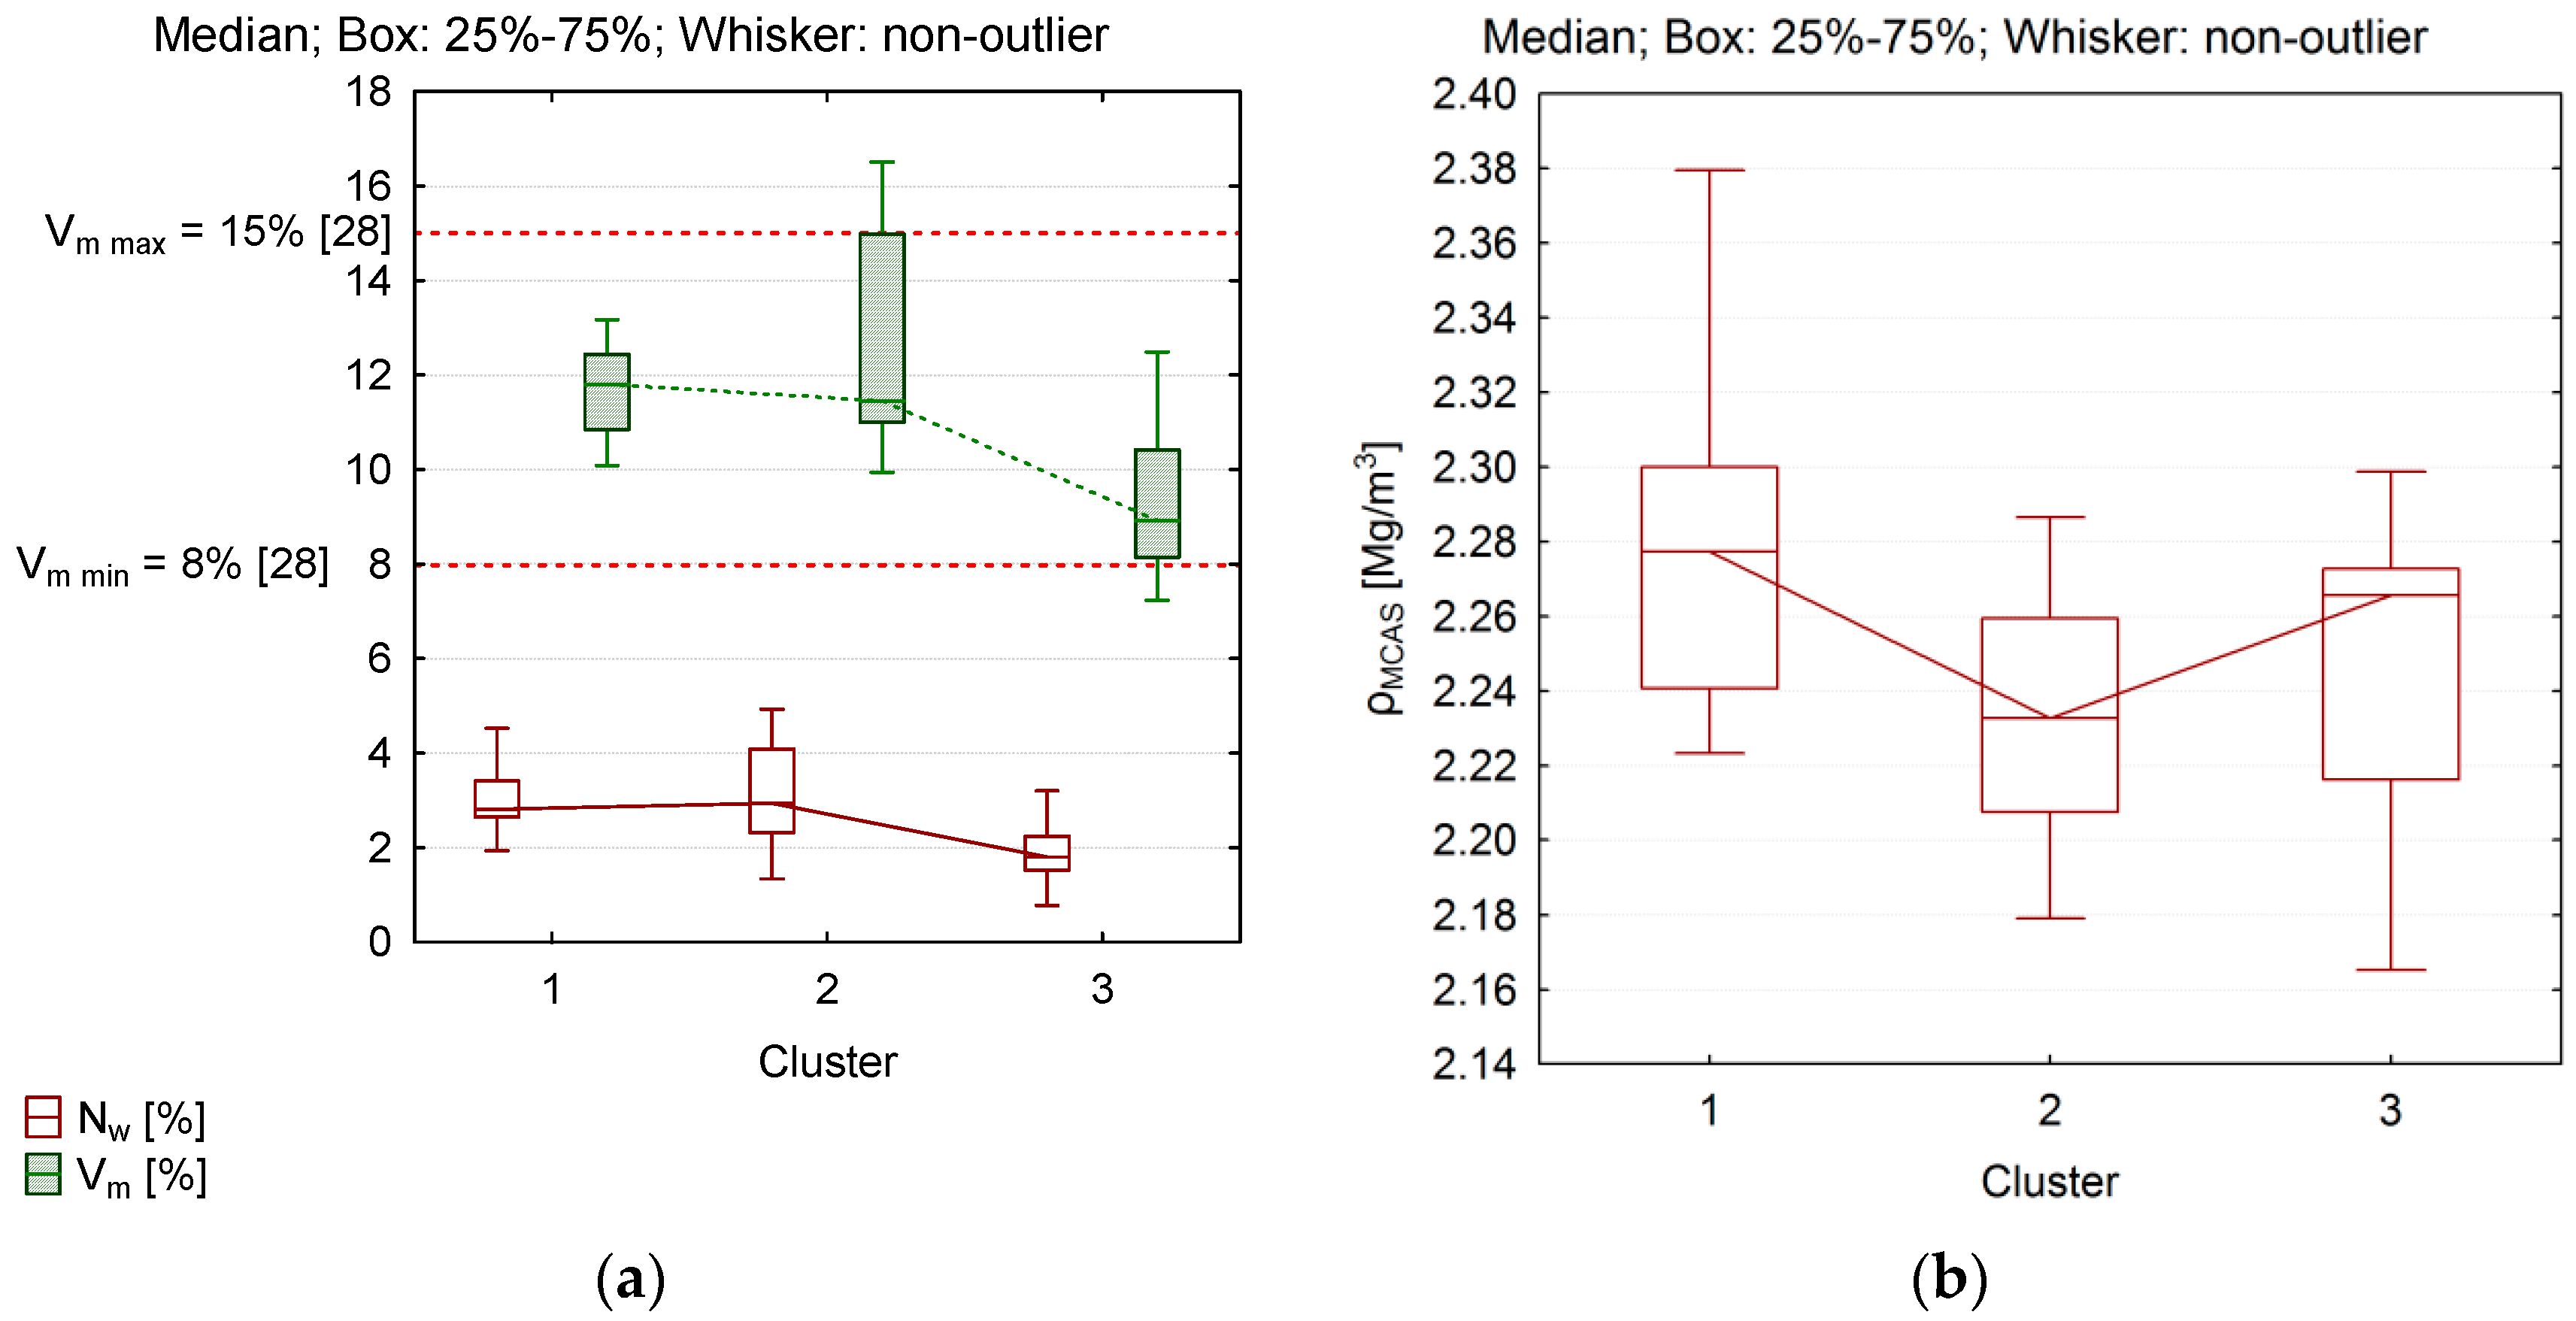
Finally, physical parameters, air void content (V
m), absorption (N
w) and density (ρ
MCAS), were considered in the analysis of the recycled mixtures population. The results are shown in
Figure 6.
Analysis of the results of grouping the specimens of MCAS recycled mixtures indicates that the average value of air void content was the lowest in Group 3, Vm = 8.9%. The low level of this parameter was probably due to the high content of free bitumen in the recycled mixtures. In the other groups (1 and 2), the average air void content was about 11%, with high asymmetry observed in Group 2 in the distribution of air void content population with at least 25% of the results being above 15%. This result correlated with the low ITS performance. The mixtures in Group 2 had the lowest density, which may be a sign of low cohesion in the mix specimens. A certain singularity in achieving high mix density was observed in Group 1. This cluster grouped the mixes with the highest density but with the air void content was comparable with Group 2. This observation can be explained by the presence of recycled mixtures with high density steel slag.
To summarize the discussion so far, we can state that the specimens of recycled mixtures in the first group were characterized by high air void content and low amount of bitumen. The viscoelastic rheological character of mixtures indicates excessively stiff response. Parameter ITS suggests moderate cohesion. The resistance to climatic conditions was at a satisfactory level. The second group, representing low cohesion mixtures containing recycled aggregates (RC) and up to 50% of RAP material in the virgin aggregate, was characterized by low ITS, minimal resistance to climatic factors and low stiffness, indicating potentially low durability. In contrast, the third group represented the mixtures with high moisture resistance, high indirect tensile strength, high stiffness modulus and noticeably more viscous behavior at 5 °C, attained owing to the adequate amount of bitumen and higher amounts of RAP in the mixtures. The mixtures similar to those in Group 3 in the current dataset may be most recommended for use.
4.3. Discriminative Function Analysis
The last stage of multidimensional statistical inference was the discriminatory analysis. Its main purpose was to identify the mathematical functions that allow for the best discrimination between the clusters as described in the preceding paragraph. Discriminant functions answer the question which variables are the best predictors of group membership. In addition, the discriminatory analysis was to verify the validity of the adopted groups. In the first place, discriminatory analysis required the canonical analysis to separate the present clusters by mathematical functions [
40] 39, starting from the review of variables in the model. The results of the discriminatory analysis are summarized in
Table 5.
The discriminant analysis was performed on transformed variables obtained during the search for principal components (PCA). The results shown in
Table 5 indicate that the parameters expressed by variable Z2 (the lowest value of partial Willks’ Lambda), responsible for the structural properties of the recycled mixture, provided the most overall discrimination (
p < 0.05). The second most discrimination was provided by variable Z1 (rheological properties), responsible for MCAS viscoelastic properties. As for variable Z3, its effect on the group discrimination was marginal. Variable Z3 bonds moisture resistance parameters and a portion of the ITS variation. Its statistically insignificant contribution to the discrimination was due to the low diversity of moisture resistance results across the dataset. With the initial knowledge of the contribution of the given variables on the discrimination, it was necessary to determine the canonical coefficients, on the basis of which the discriminant functions (classification functions) were computed. Arbitrarily, two significant functions were used. The predictive validity of the functions was assessed in the χ
2 test and summarized in
Table 6.
The results in
Table 6 indicate that both discriminant functions were statistically significant (
p < 0.05) and thus could be used for further statistical inference. The raw values of the canonical functions required for the final determination of discriminant functions, important for the classification of other cases of recyclable MCAS mixes with waste materials, are shown in
Table 7.
It follows from the results above that the first canonical function (V_1) explained about 74% of the variation whereas the second function (V_2) explained 26% of discrimination. The canonical discriminant function had the form (2):
The discriminant (classification) functions allowed direct classification of each mixture case and its projection to the results space used in the experiment. These functions are a valuable reference material, since other mix results can be projected to this “learned” database and used to evaluate their similarity to their already isolated clusters. The clusters may represent areas of the recycled mix properties proposed for recommendation. The ultimate forms of the discriminant functions are shown in
Table 8.
This final stage of analysis enabled the mathematical description of the boundaries required to classify the cases of recycled mixes with waste materials (specimens) in existing clusters. As mentioned above, they can be treated as a “learned” reference model for the behavior of MCAS mixtures with waste materials. Therefore, based on the value of the discriminant function and the coefficients in
Table 8, a new case of a recycled mixture of unknown membership can be classified in a given group. The group membership is established based on the maximum value obtained from the computation of all three classification functions. The grouping procedure adopted in the analysis was 98% effective. In Groups 1 and 3 only one case was probably misclassified—the one at the boundary between the arbitrary boundary determined by the classification function.
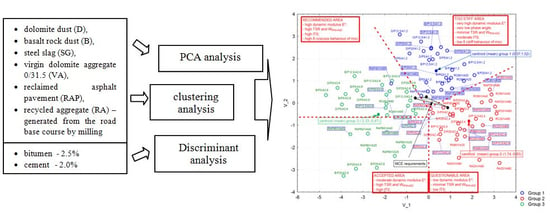
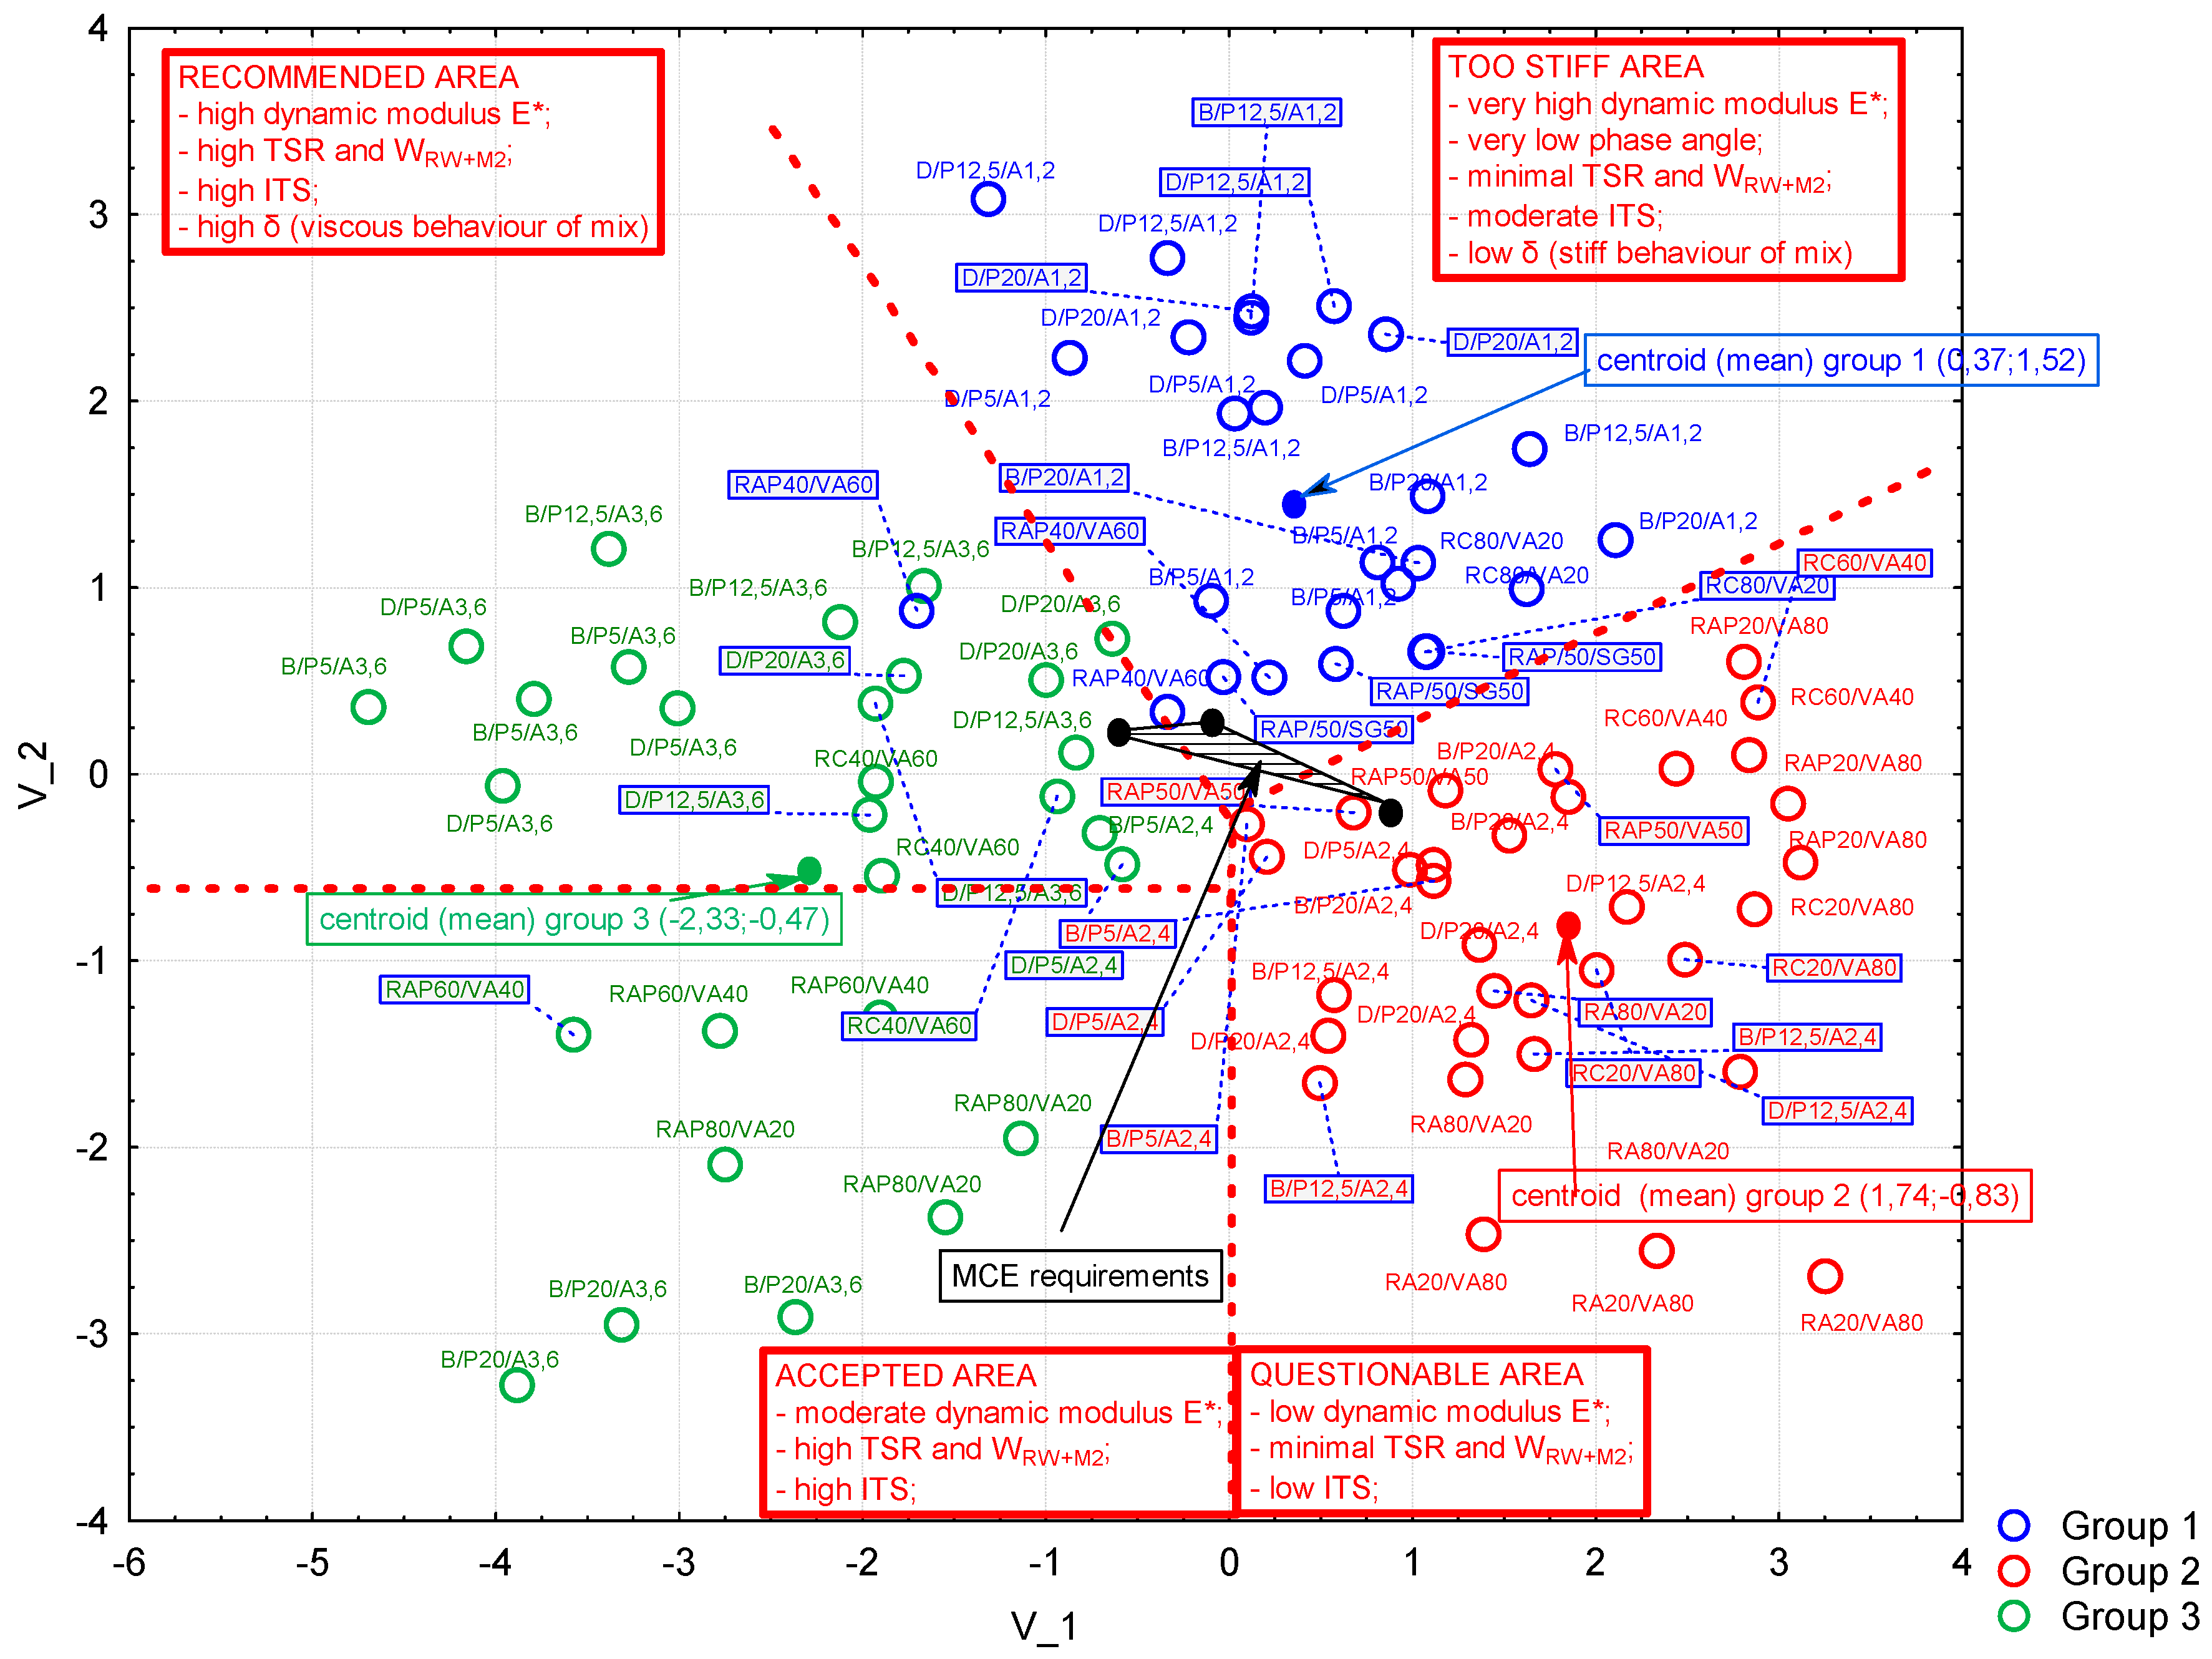
The multidimensional analysis summarizes the projection plot of the data with respect to the values of two canonical functions. It allows global assessment of the population partition and rules applicable in the given set of recycled mixtures with waste materials. The canonical data scatter plot with the cases of recycled MCAS is shown in
Figure 7.
The canonical value scatter plot provides an overview of a number of general rules and relationships in a given set of results for the samples of recycled mixtures made with different waste materials. The samples of recycled mixtures that best represent the data sets can be defined as those at the group centroid (mean). In the case of Group 1, these were the mix samples with the addition of basalt mineral dust, regardless of the mineral dust amount, with 1.2% bitumen foam content. The RC80/VA20 mix was also close to the canonical mean in Group 1. This proves that Group 1 was represented by the mixtures whose rheological state could result from the high content of hydraulic binders.
Group 2 could be represented by the samples with dolomite dust, mixes with 20% RC (20RC/80VA) and, which is most important, by the mixtures with 80% recycled aggregate (80RC/20VA), which suggests that the use of large amounts of recycled aggregate should be investigated further for its suitability. The latter case makes the use of a large recycled aggregate subject to its thorough examination in terms of suitability. Analysis of the parameters assigned to Group 2 shows that the use of recycled aggregates can be an acceptable compromise between the quality and durability of mixtures produced using deep recycling with foamed bitumen.
Group 3 was represented by mixtures with dolomite aggregate and a large amount of foamed bitumen (3.6%). The RC40/60VA and RAP60/VA40 cases could also be included. This demonstrates that mixtures in this group were predominantly viscous due to higher amount of bitumen binder, which is in contrast to the mixtures in Group 1. Considering the effect of a given variable’s influence on a given discriminatory function (
Table 6), the second canonical variable (V_2) is a major mixture discriminant factor due to its viscoelastic nature. The mixtures that had high V_2 value were characterized by high dynamic stiffness modulus (E) with dominant elastic portion (E’), while those with the lowest V_2 had the lowest dynamic modulus (E). The mixtures with high values of the first canonical variable (V_1) exhibited high density, low ITS, and low but acceptable TSR.
More information can be derived from the results in
Table 7. The key issue in each task is to determine the area in which cases of recycled mixtures with best properties are located. Analysis of data in
Table 3 and
Table 7 should include minimization of the first variable (V_1) and maximization of the second canonical variable (V_2).
Figure 7 has this area marked as recommended. All the areas were determined through canonical function plots. An inverse optimization provides examples of recycled mixtures with lower durability relative to the parameters used in the experiment. On the basis of the multidimensional analysis, accounting for the classification functions and factor variables, four areas were defined in the plane determined by the canonical variables. The first recommended area (
Figure 7) represents the samples of mixtures with 5–12% dust contents (basalt or dolomite) and 3.6% of foamed bitumen. High similarity to this group was demonstrated by samples designated as 40RC/60VA, which were classified in this group. The second area represents the samples of mixtures with high moisture resistance, moderate stiffness and viscous character at 40 °C due to increased free bitumen content. This area is designated as acceptable. The results of the third area, designated as questionable, should be considered with caution. This area represents the samples of mixtures with very high stiffness, minimum moisture resistance and moderate ITS. However, the most disturbing fact is that due to the elastic–brittle nature, the mixtures in this area may be sensitive to reflective cracking. The fourth group is the case of recycled mixtures with the lowest stiffness and low phase angle, causing reflected cracking at lower stress than in the “questionable” area (third area). In addition, the low ITS level and minimal frost resistance make them less useful. In this area, recycled mixtures with a high content of recycled dolomite aggregate, above 20%, with RAP content of less than 40% and a small amount of RC are predominant. This confirms the hypothesis that the use of recycled aggregate must be preceded by a careful analysis of the quality of such material prior to its application in deep recycling technology.
Figure 7 shows the initial projection of MCE requirements in Poland [
13,
14] with respect to the V_1 and V_2 coordinates included in
Figure 4,
Figure 5 and
Figure 6. It should be noted that after determining the results of classification functions, the obtained MCE solution space is in the center of diagram in
Figure 7. A portion of the MCE results is in the solution space marked as questionable. Nevertheless, on the basis of
Figure 7, the use of MCAS mixes with waste materials allows attaining far better results than those that are compared to the classical MCE mix. The results of the iterative process required to project the requirements for MCE are shown in
Table 9.
The limiting point of MCE results projection with respect to the space determined by the mixtures with waste materials were defined by maximizing each discriminant function. The value of each point within the polygon in
Figure 7 was decoded with respect to the real parameters for the recycled mixtures (
Table 9). Note that the mix with high air void content and low moisture resistance will be assigned, as a similar mixture, to Group 2, i.e., to questionable results from the perspective of the mix durability. For the mix to obtain the results similar to Group 3 (recommended), a larger amount of bitumen emulsion and cement will have to be used to improve its physical and mechanical parameters. The area of the results similar to Group 1 represents the mixtures with high cement content. The same results were observed in [
18].


