Article

Analysis of Xanthine Oxidase Inhibitors from Clerodendranthus spicatus with Xanthine Oxidase Immobilized Silica Coated Fe3O4 Nanoparticles

1
Institute of Bast Fiber Crops, Chinese Academy of Agricultural Sciences, Changsha 410205, China
2
College of Chemistry and Chemical Engineering, Central South University, Changsha 410083, China
*
Authors to whom correspondence should be addressed.
Appl. Sci. 2018, 8(2), 158; https://doi.org/10.3390/app8020158
Submission received: 30 December 2017 / Revised: 20 January 2018 / Accepted: 22 January 2018 / Published: 24 January 2018
(This article belongs to the Special Issue Biological Applications of Magnetic Nanoparticles)

Abstract

:
In this study, xanthine oxidase immobilized silica coated Fe3O4 nanoparticles (Fe3O4@SiO2-XO) were successfully prepared and characterized by transmission electron microscope, X-ray powder diffraction, Fourier transform infrared spectroscopy and vibrating sample magnetometer. The average diameter of the Fe3O4 nanoparticles was about 300 nm to 350 nm with a shell thickness of 60 nm. The maximum saturation magnetization of the Fe3O4@SiO2-XO nanoparticles was 44.9 emu/g, which ensured the separation from the medium within one minute by using an ordinary magnet. A xanthine oxidase (XO) inhibitor screening method using Fe3O4@SiO2-XO nanoparticles was established and utilized in the extract of Clerodendranthus spicatus. Under the optimized conditions, two compounds were screened out and identified as gardenin B and eupatorin. The half maximal inhibitory concentration (IC50) values of these two compounds were 1.488 μg/mL and 11.197 μg/mL, respectively. The interactions between these two compounds and XO were investigated by the fluorescence spectroscopic method. The results suggested that the quenching effects of gardenin B and eupatorin were due to a static quenching mechanism. Furthermore, gardenin B showed stronger binding capacity than that of eupatorin. In conclusion, this screening method exhibited efficiency and reusability in screening, identification and analysis of enzyme inhibitors from complex mixtures.

1. Introduction

Natural products were fruitful sources of bioactive compounds for drug discovery [1]. However, unclear function mechanisms, complex composition, and tiring separation and purification procedures often hinder the research of natural products [2]. Thus, the research on active compounds in natural products would benefit from more efficient and novel screening technologies. Up to now, many screening methods based on solid phase extraction, membrane filtration, and hyphenated instruments were developed [3,4,5]. In recent decades, magnetic nanoparticles gained great interests in biological and medicinal fields. Many kinds of magnetic nanoparticles were applied as the catalysts, the carriers, the supports and so on [6,7]. Unlike the other nanomaterials, well dispersed magnetic nanoparticles in solution could be immediately separated from medium by an external magnet [8]. High magnetic response, high stability and high surface area made magnetic nanoparticles become ideal solid supports for enzyme immobilization [9]. Enzyme modified magnetic nanoparticles could be used as agents in the screening of active and bioactive compounds from natural products. Because of the advantages in low sample consumption, easy operation and rapid screening, this kind of screening strategy was widely applied [10,11,12].
Xanthine oxidase (XO) is a critical cytosolic enzyme which is widely distributed in mammalian tissues. XO could catalyze the oxidation of hypoxanthine to xanthine and further catalyze the oxidation of xanthine to uric acid [13]. High concentrations of uric acid would result in the hyperuricemia and gout [14]. Accordingly, the inhibition of XO could reduce the production of uric acid and become a of therapeutic method for treating hyperuricemia and gout. Allopurinol is an XO inhibitor and is widely clinical applied in related treatments [15]. However, many adverse reactions to allopurinol, like allergic reactions, nephropathy, and hepatitis, have been observed and have limited the usage of allopurinol [16]. Hence, more potential XO inhibitors from natural products with fewer adverse effects and higher therapeutic activity are needed.
Clerodendranthus spicatus (Thunb.) is a plant species and a popular folk medicine in China. It was widely distributed in southern China, including in Fujian, Yunnan and Hainan provinces [17]. As a traditional Chinese medicine, Clerodendranthus spicatus has been used in the treatment of urinary lithiasis, rheumatism, acute nephritis, chronic nephritis, and cystitis [18]. So far, previous documented reports on the chemical composition of Clerodendranthus spicatus showed the existence of plenty of diterpenes, flavonoids, triterpenes and phenolic acids [19]. Water extract of Clerodendranthus spicatus was often investigated because water soluble phenolic acids were considered to be responsible for those activities [20,21]. However, more systematical research on Clerodendranthus spicatus was still necessary since many valuable active compounds in Clerodendranthus spicatus were not clear.
In this study, xanthine oxidase immobilized silica coated Fe3O4 nanoparticles (Fe3O4@SiO2-XO) were successfully prepared and characterized by Fourier transform infrared spectroscopy (FT–IR), X-ray powder diffraction (XRD), transmission electron microscope (TEM), and vibrating sample magnetometer (VSM). Previous research in our lab demonstrated that extract of Clerodendranthus spicatus typically inhibited the activity of XO. Consequently, a XO inhibitor screening method using Fe3O4@SiO2-XO nanoparticles was established and utilized in the extract of Clerodendranthus spicatus based on our previous research. According to our proposed screening method, two compounds were screened out and identified as gardenin B and eupatorin. The inhibitions on XO of gardenin B and eupatorin were further verified and the interactions between these two compounds and XO were investigated by fluorescence spectroscopic methods.

2. Results and Discussion

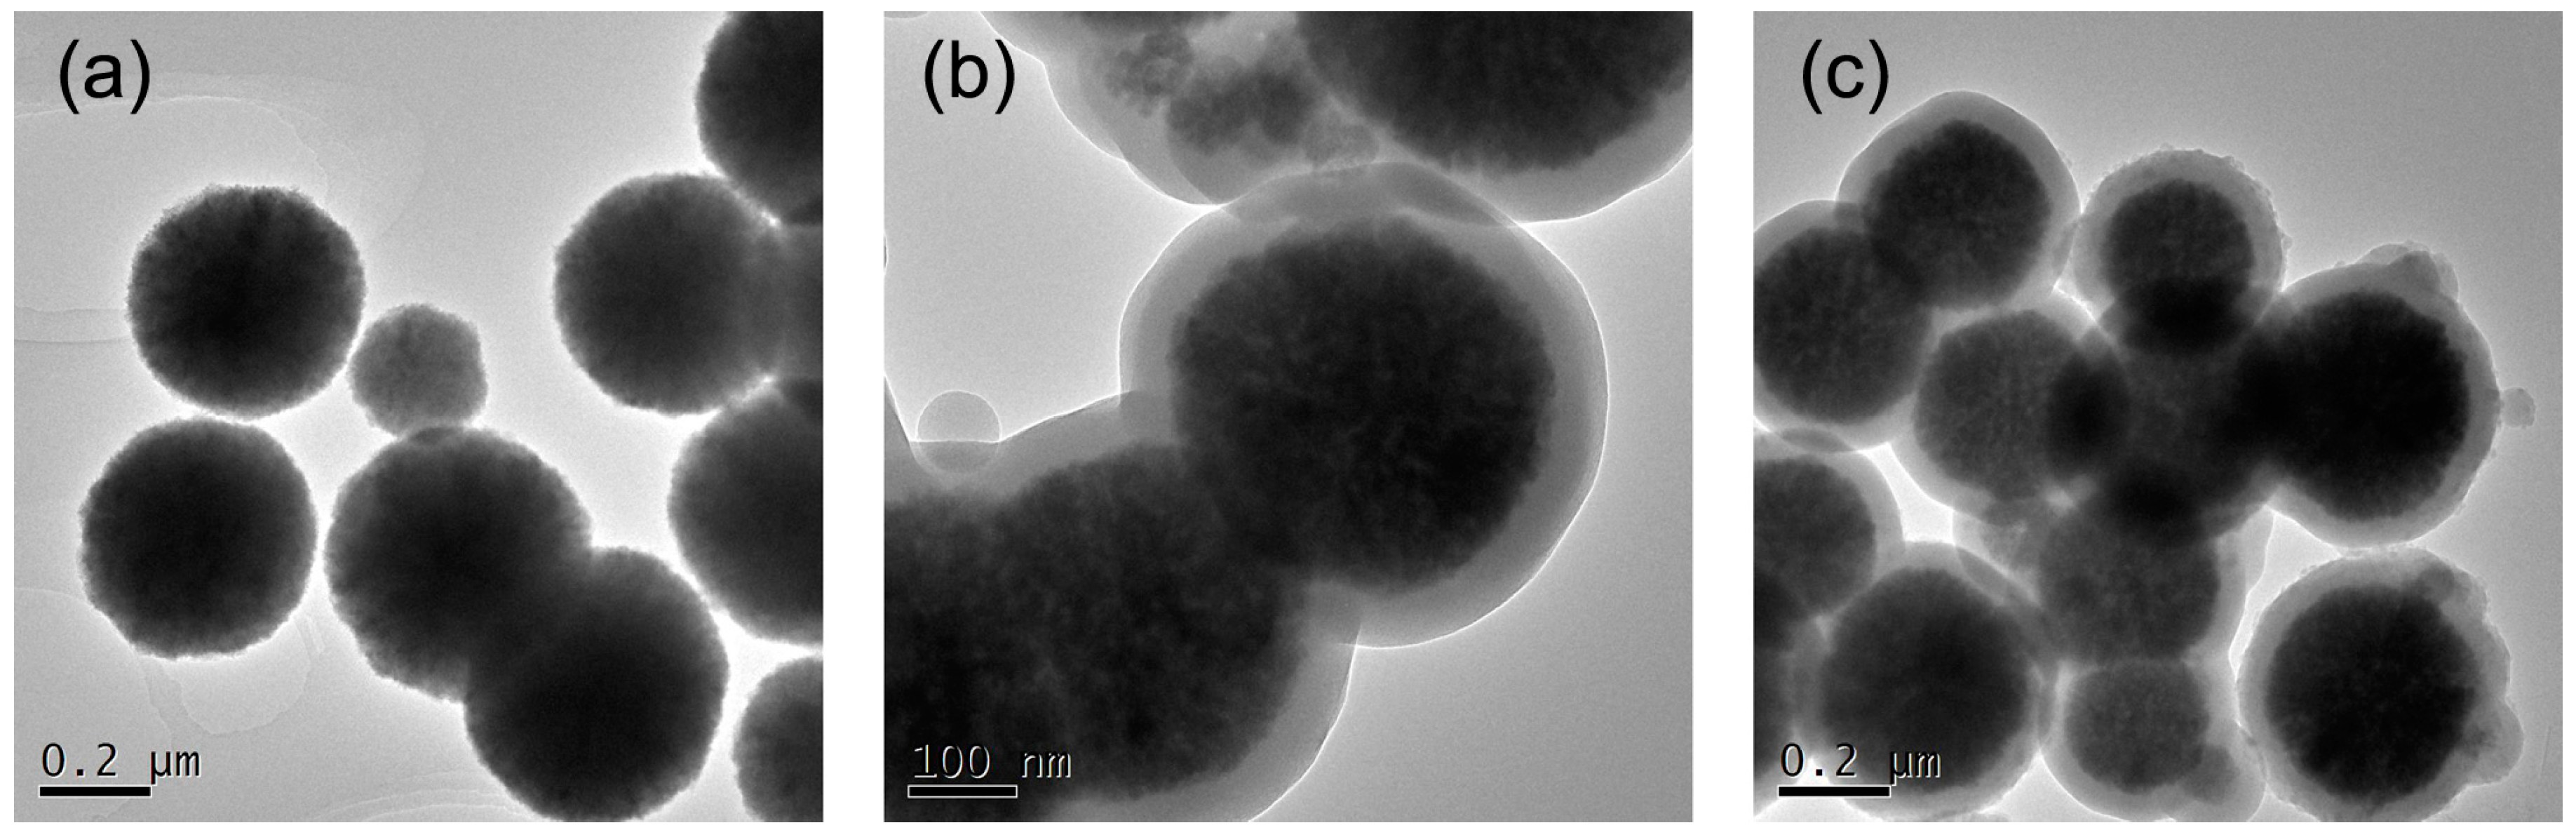
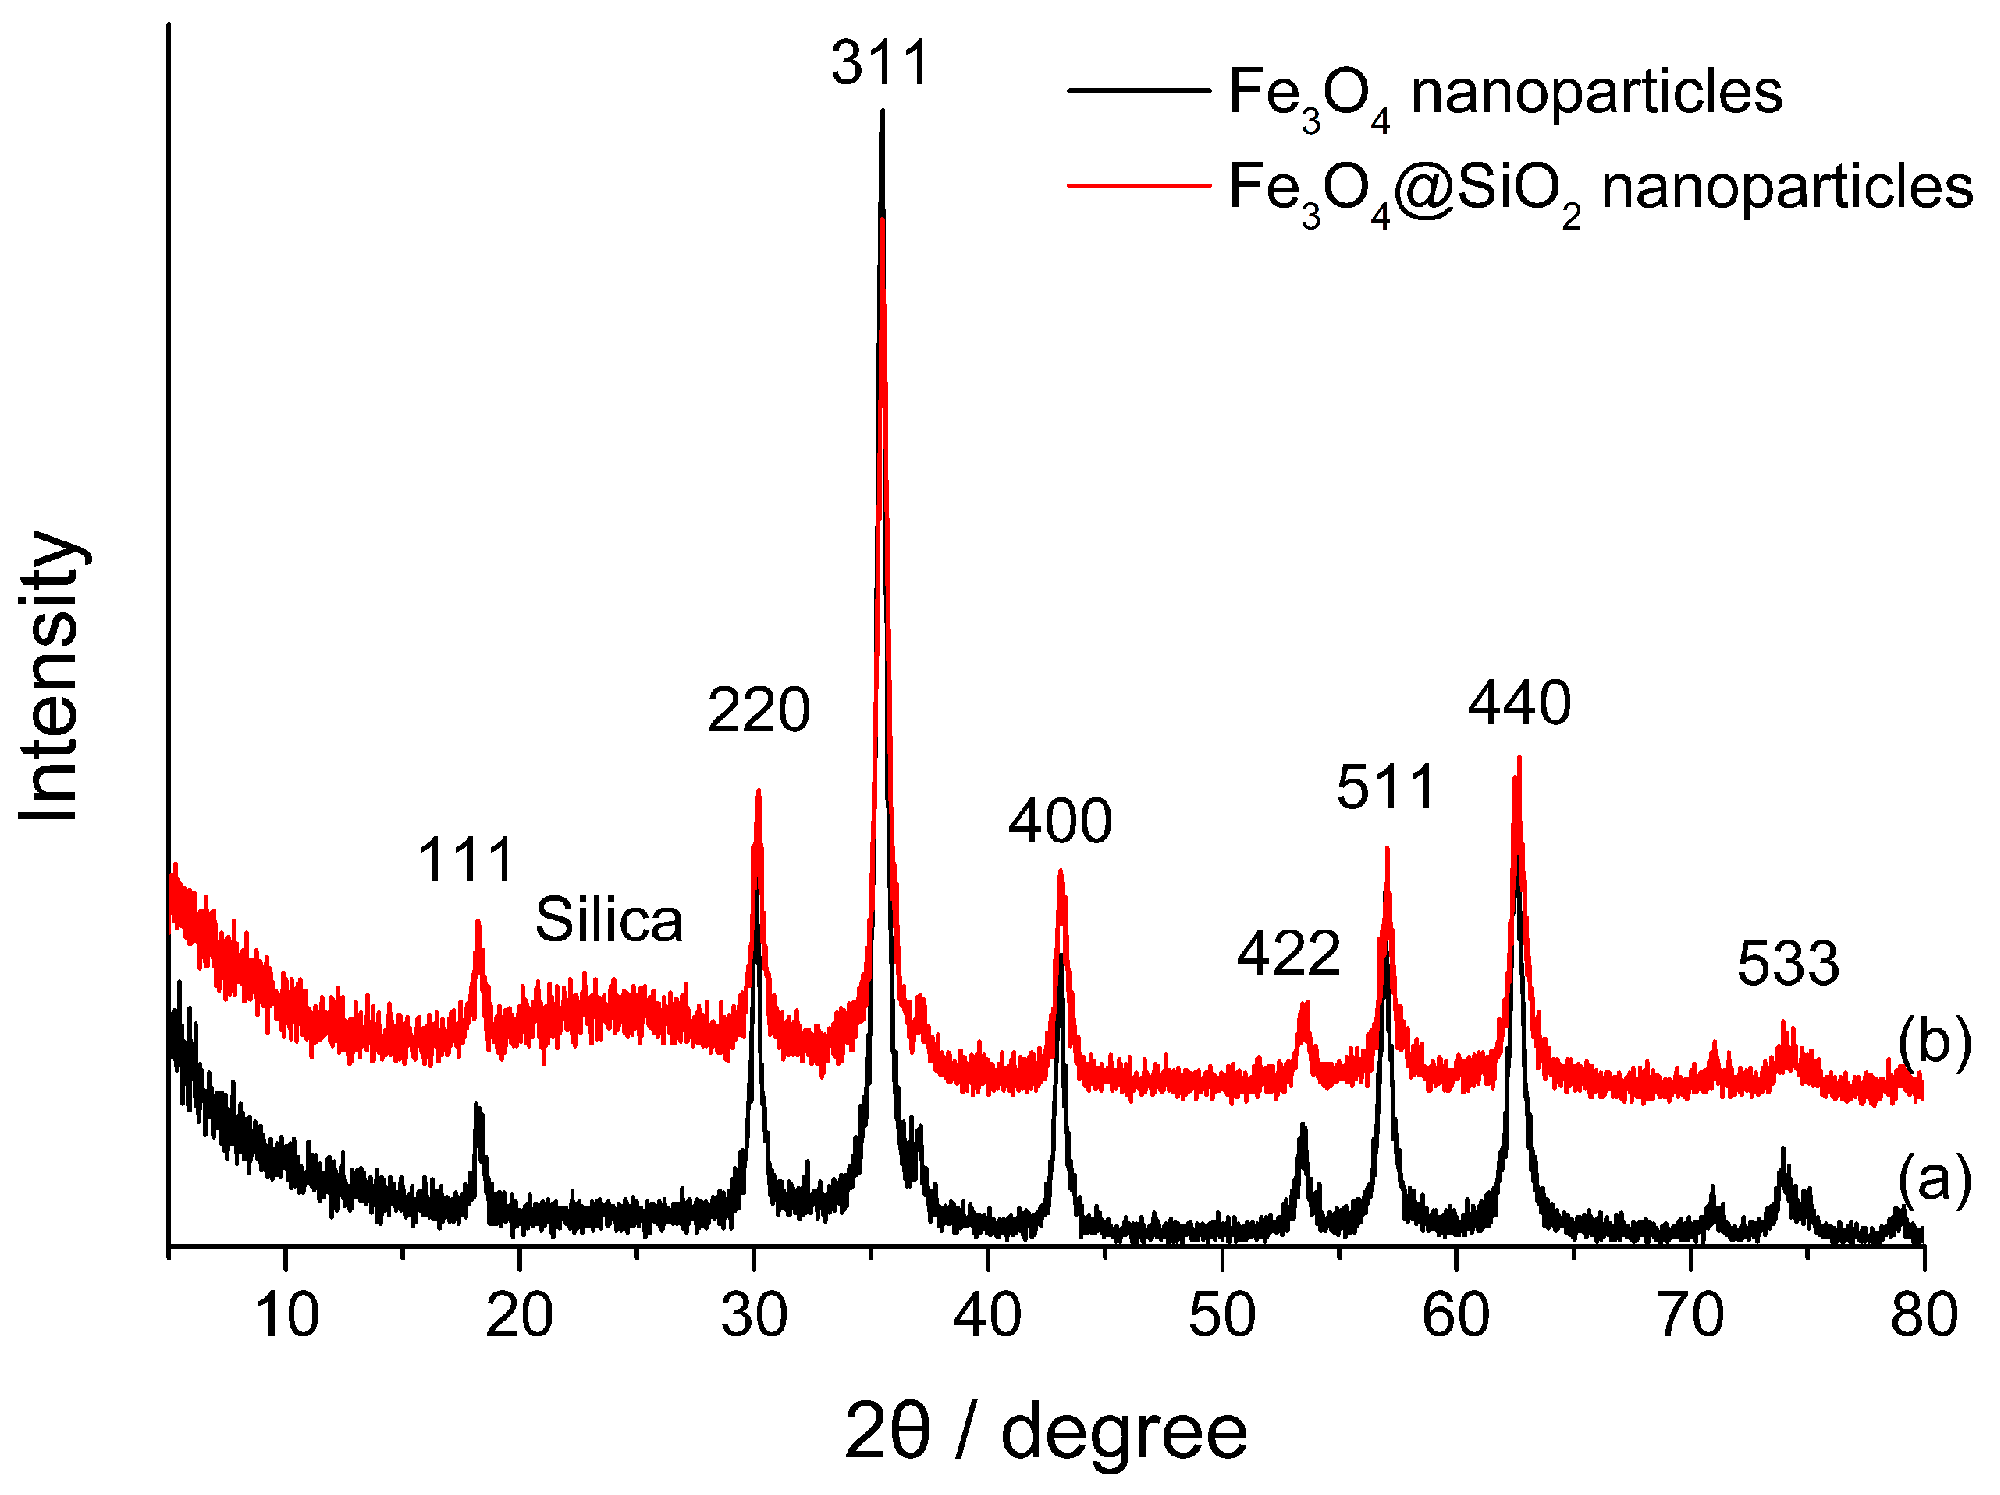
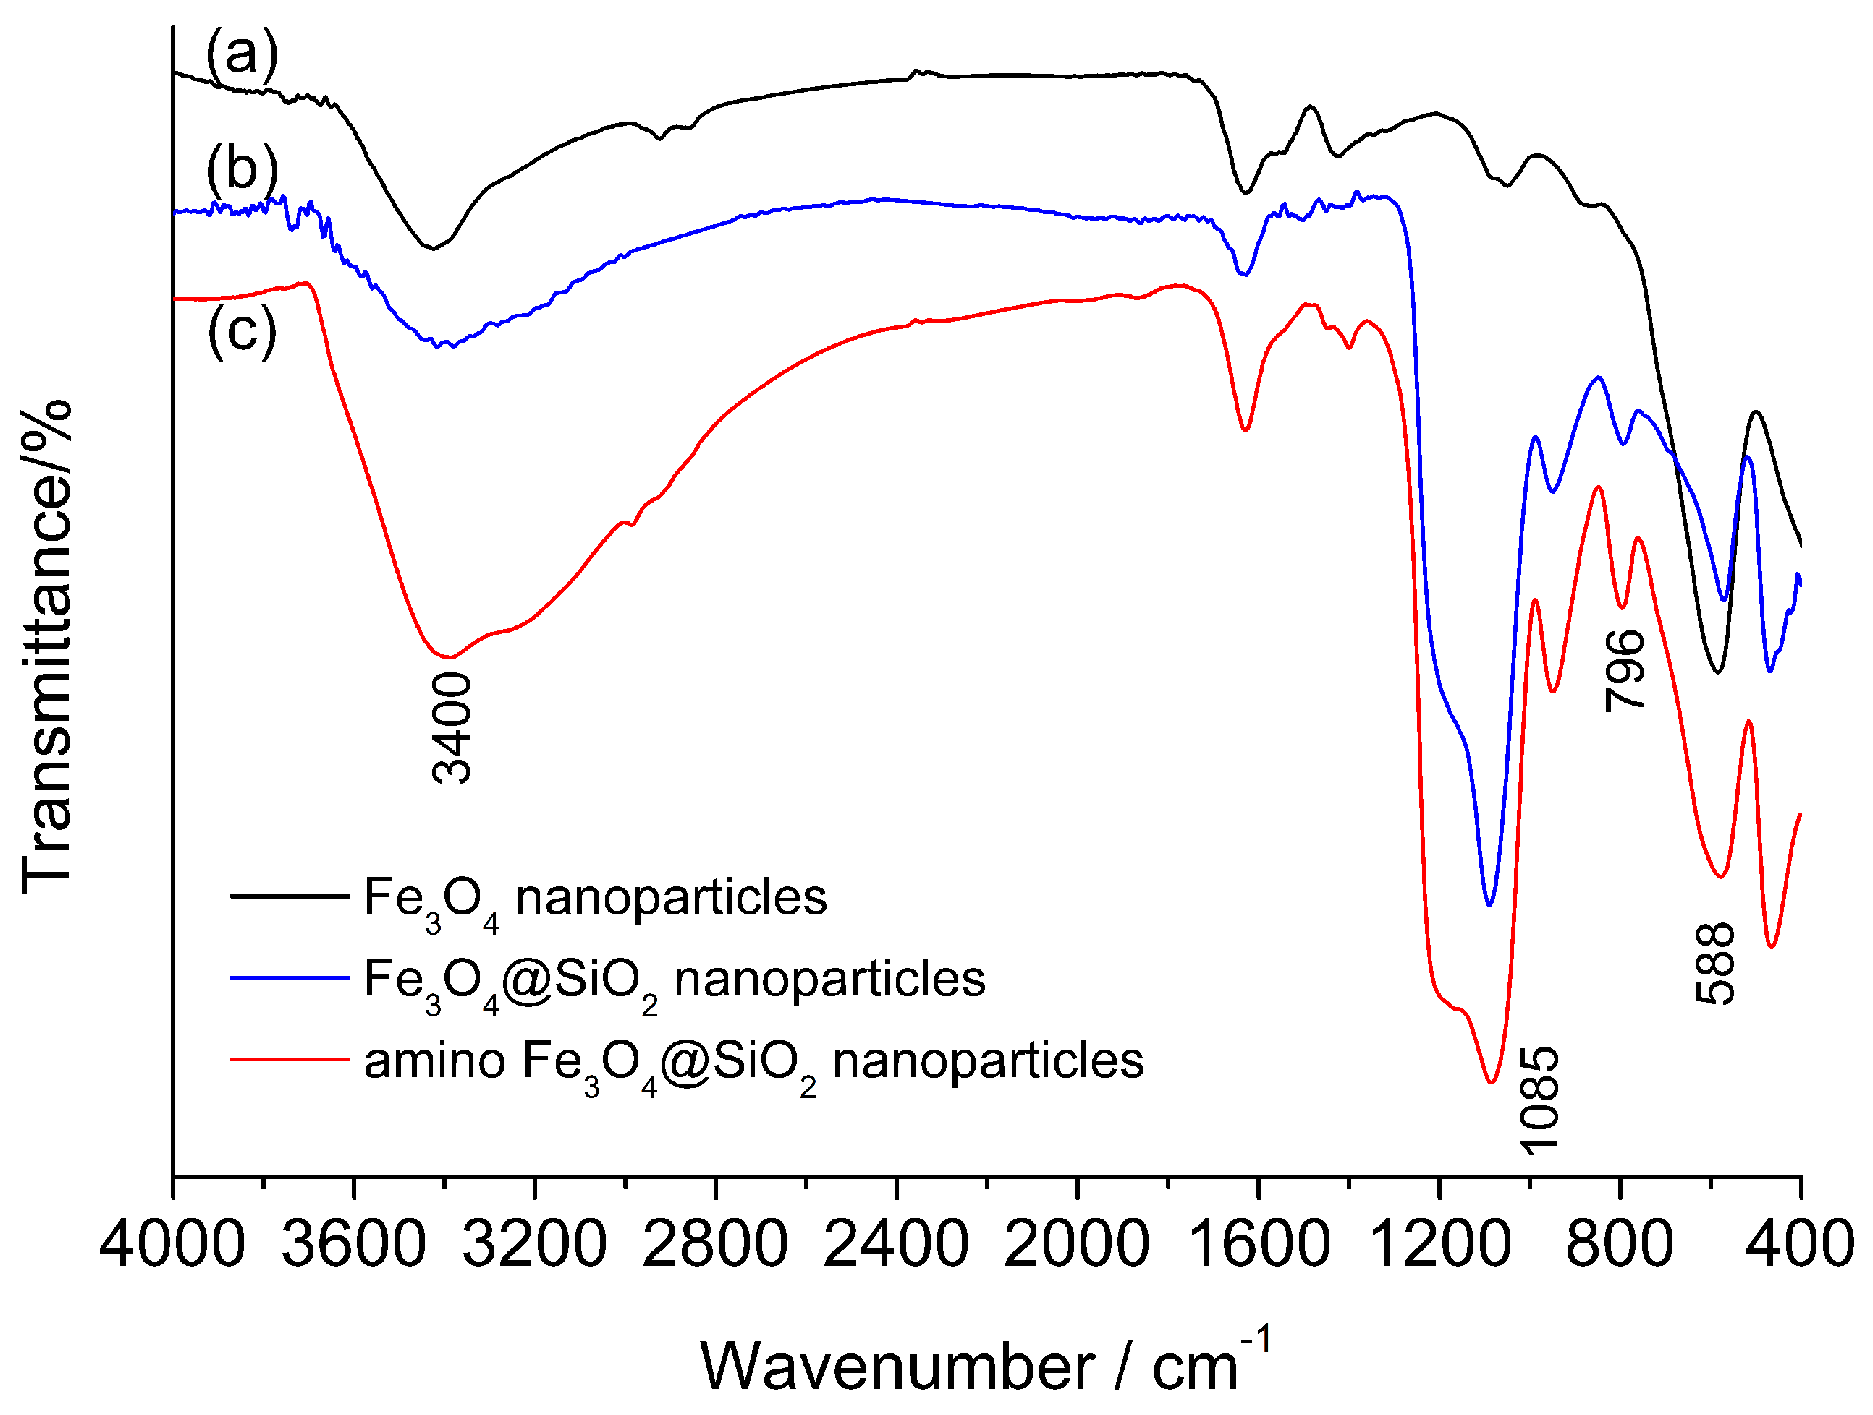
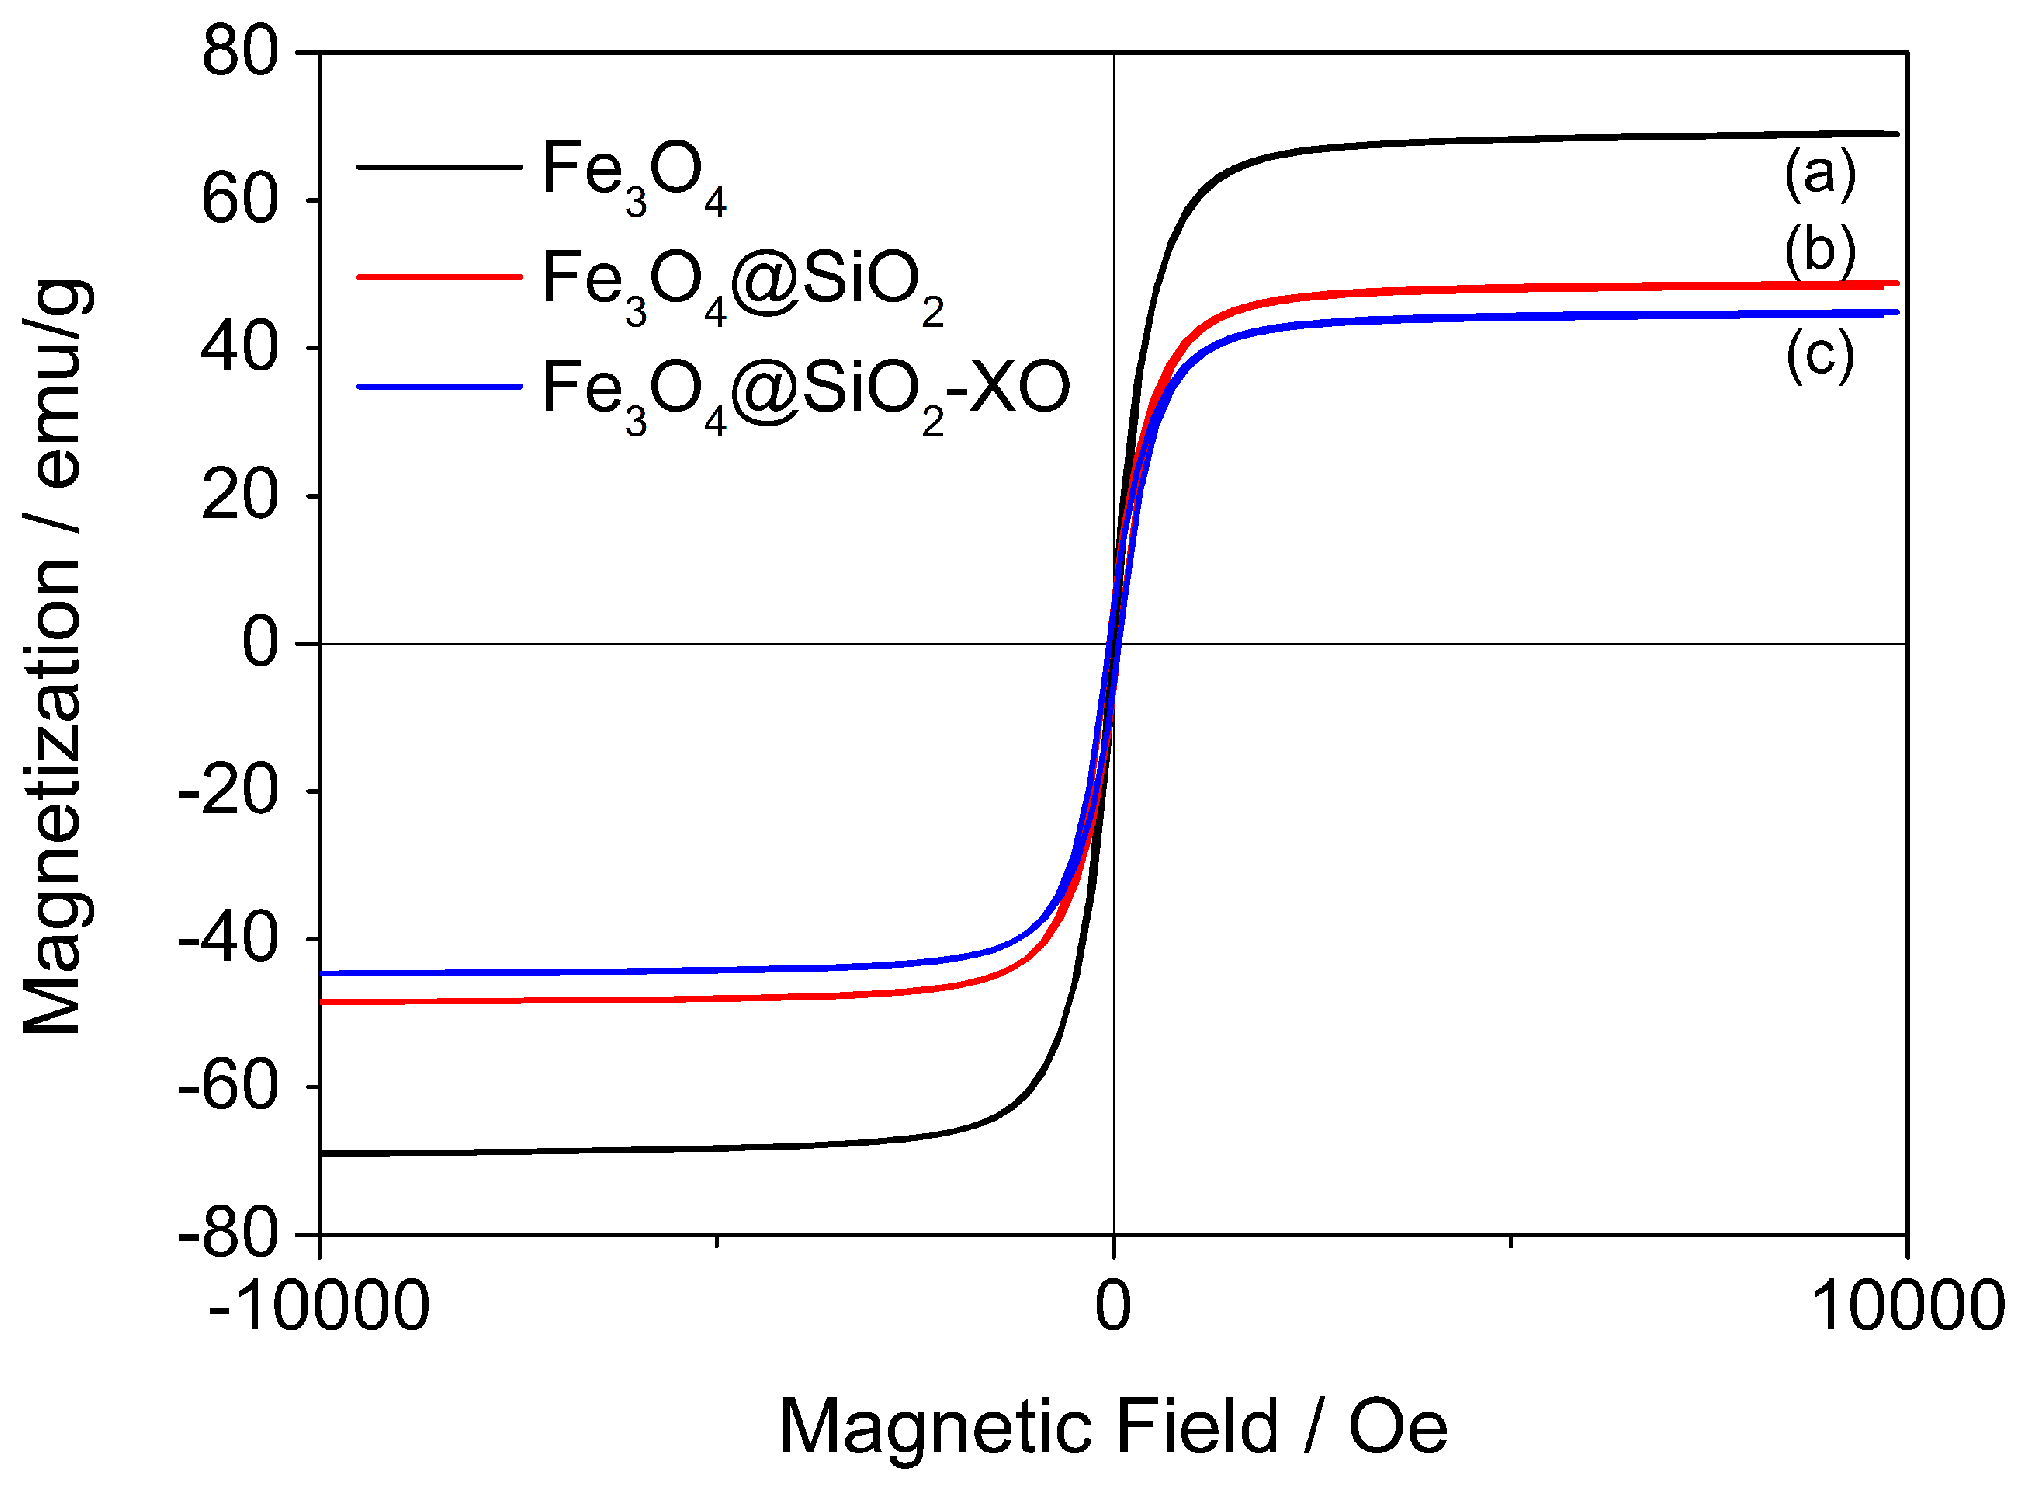
2.1. Characterization of Fe3O4@SiO2-XO Nanoparticles

The morphologies of Fe3O4, silica coated Fe3O4 nanoparticles (Fe3O4@SiO2) and Fe3O4@SiO2-XO nanoparticles were characterized by TEM to visually observe the morphologies and the changes of nanoparticles during the preparation. TEM images of these nanoparticles are shown in Figure 1. Figure 1a showes the morphology of Fe3O4 nanoparticles. It could be seen that the Fe3O4 nanoparticles had a round shape and were well dispersed. The average diameter of Fe3O4 nanoparticles was about 300 nm to 350 nm. Figure 1b shows the morphology of Fe3O4@SiO2 nanoparticles. It could be seen that a light grey coating layer existed on the surface of the Fe3O4 nanoparticles and that the shell thickness of the silica layer was about 60 nm. After the amino functionalization and enzyme immobilization, the change in shape of the final Fe3O4@SiO2-XO nanoparticles was small. The surface of the Fe3O4@SiO2-XO nanoparticles showed some roughness, which might have been caused by the amino groups and the enzyme molecules.
The structures of synthesized Fe3O4 and Fe3O4@SiO2 nanoparticles were analyzed by XRD and the results are shown in Figure 2. For Fe3O4 nanoparticles, the characteristic peaks were marked by corresponding indices (111), (220), (311), (400), (422), (511), (440) and (533) in accordance with the standard Fe3O4 crystal XRD card. For Fe3O4@SiO2 nanoparticles, the characteristic peaks were similar to that of Fe3O4 nanoparticles except for the peak around 24°. The peak around 24° could be attributed to the silica [22]. Based on these analyses, the coating of silica could be considered successful.
To confirm the silica coating and amino groups on the surface of Fe3O4 nanoparticles, FT–IR analysis was also performed. As shown in Figure 3a, the FT–IR spectrum of Fe3O4 nanoparticles showed a characteristic Fe–O vibration band at 588 cm−1 [23]. Figure 3b shows the FT–IR spectrum of Fe3O4@SiO2 nanoparticles. Compared with naked Fe3O4 nanoparticles, the feature peak in the spectrum of Fe3O4@SiO2 nanoparticles at 796 cm−1 and those around 1085 cm-1 belonged to the Si-O-Si stretching vibration, the Si–O–H stretching vibration and the Si–O vibration, respectively [24]. After the amino functionalization, the FT–IR spectrum of amino Fe3O4@SiO2 nanoparticles showed all of the peaks mentioned above. Moreover, the enhanced wide peak at 3400 cm−1 could be attributed to the N–H stretching vibration [23]. These results indicated that the silica coating and the following amino functionalization on the surface of Fe3O4 nanoparticles were successful.
In order to evaluate the magnetic properties of prepared nanoparticles, the Fe3O4, Fe3O4@SiO2 and Fe3O4@SiO2-XO nanoparticles were characterized by VSM. The magnetization curves of these nanoparticles are shown in Figure 4. It can be seen that the maximum saturation magnetization of Fe3O4 nanoparticles was 68.9 emu/g. After the coating of silica and the immobilization of XO, the maximum saturation magnetizations of Fe3O4@SiO2 and Fe3O4@SiO2-XO nanoparticles dropped to 48.8 emu/g and 44.9 emu/g, respectively [25]. Although the maximum saturation magnetization of Fe3O4@SiO2-XO nanoparticles decreased, the materials could be separated from the reaction medium within one minute. Hence, the magnetic response property of the prepared Fe3O4@SiO2-XO nanoparticles was acceptable for the isolation and related applications.

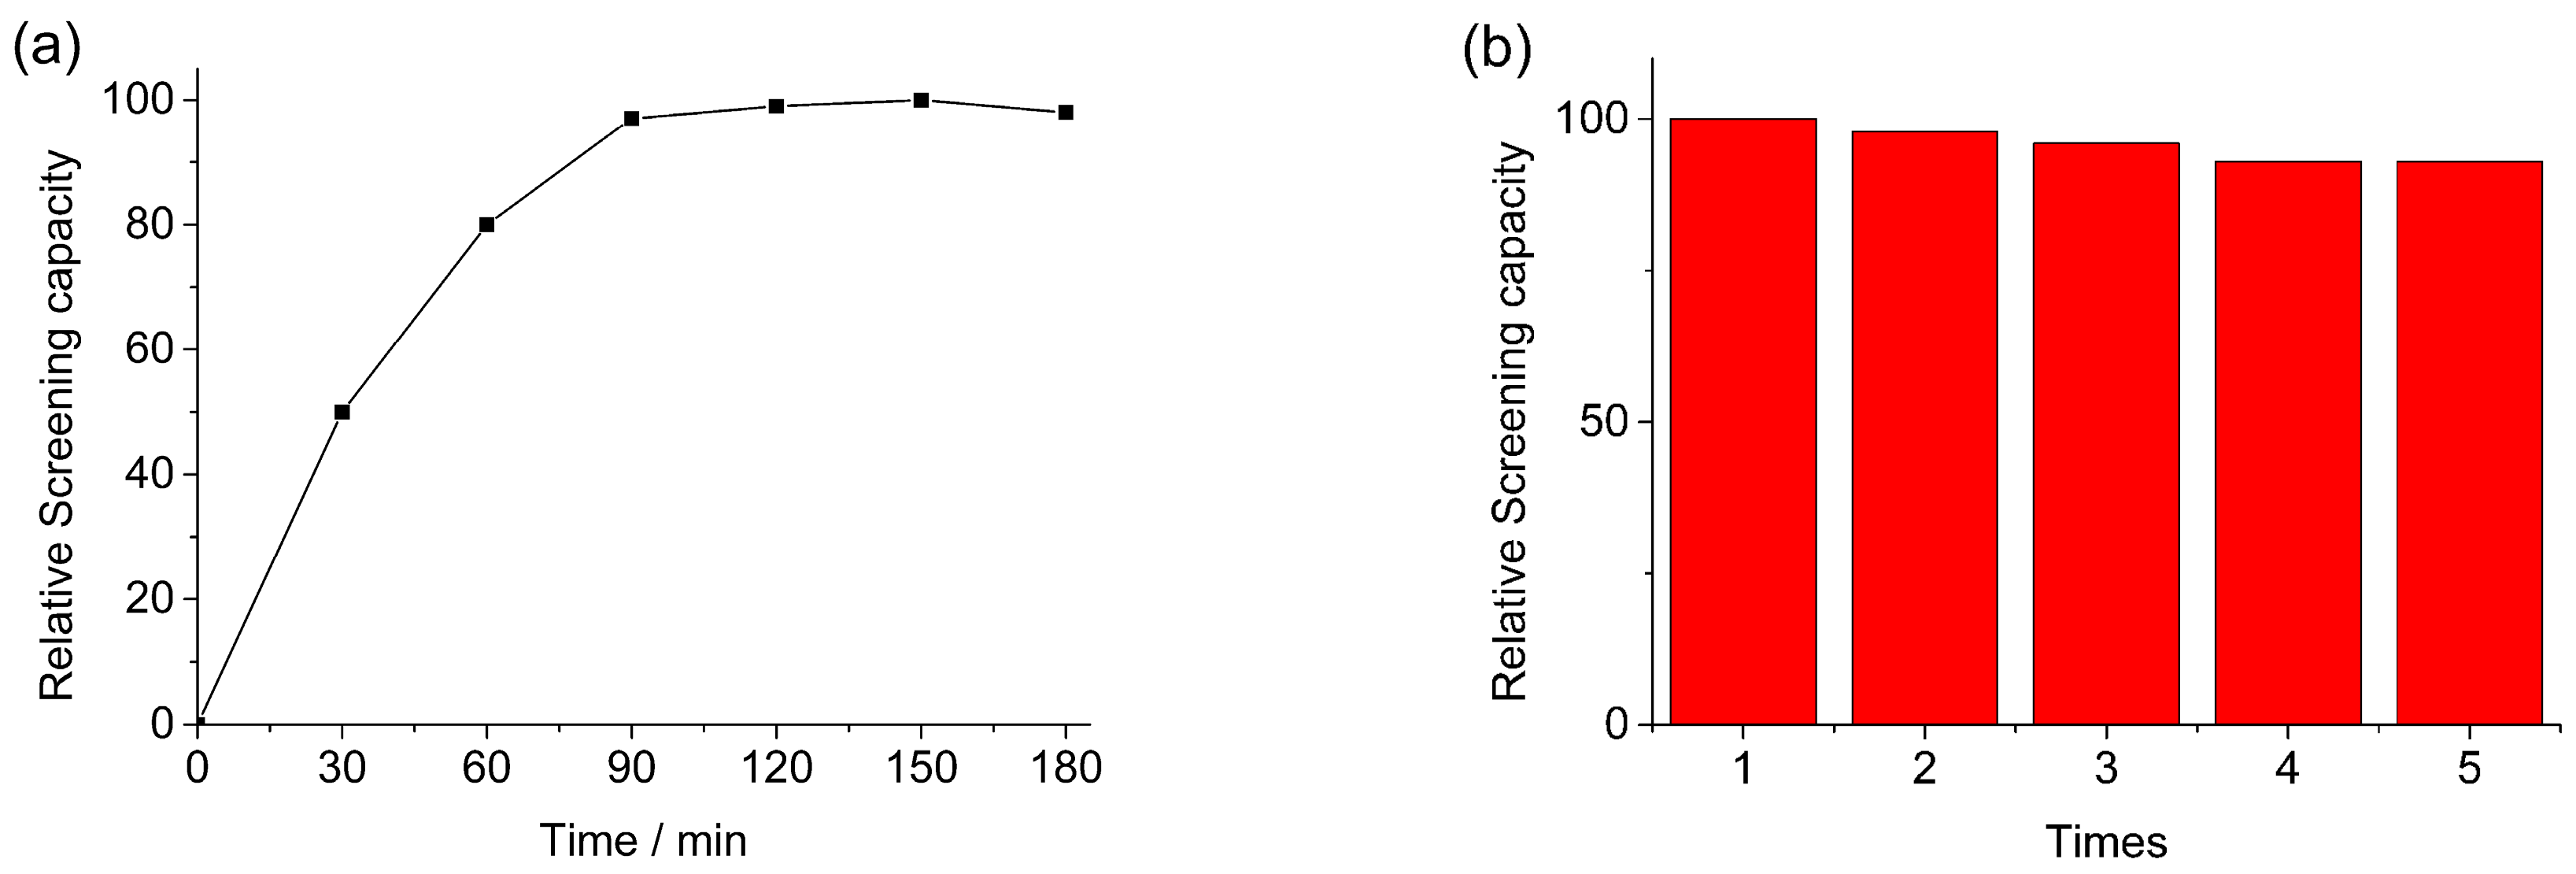
2.2. Optimization of Screening Conditions

In order to ensure the efficiency of screening and to give sufficient reaction time, the screening time from 0 min to 180 min of Fe3O4@SiO2-XO nanoparticles with extract was investigated. When Fe3O4@SiO2-XO nanoparticles were incubated with extract for a certain time, the Fe3O4@SiO2-XO nanoparticles were retained by a magnet and washed with buffer solution. Finally, the nanoparticles were eluted by a methanol solution and the absorbance of the elution was detected by Ultraviolet–visible spectroscopy (UV–VIS) Spectrophotometer at 254 nm. Because the elution contained screened compounds and those compounds showed absorbance at 254 nm, higher absorbance of the elution at 254 nm meant that a higher concentration of compounds were screened out and, thus that the screening was closer to complete. Therefore, the screening capacity was expressed as the absorbance at 254 nm in a relative form (%) with the maximal value as 100%. As shown in Figure 5a, after 90 min screening, the screening capacity reached maximum. Hence, 90 min was enough for the screening of Fe3O4@SiO2-XO nanoparticles with extract.
Reuse of magnetic nanoparticles could apparently reduce experimental cost and improve efficiency. The reusability of Fe3O4@SiO2-XO nanoparticles was investigated and shown in Figure 5b. After one round of screening, the Fe3O4@SiO2-XO nanoparticles were washed with buffer solution and then transferred into another extract solution to start a new round of screening. The elution of each round was monitored by UV–VIS Spectrophotometer at 254 nm and the screening capacity was expressed as the absorbance at 254 nm in a relative form (%) with the maximal value as 100%. As a result, the screening capacity of Fe3O4@SiO2-XO nanoparticles after five rounds screening retained 93% of its initial capacity. As a support for enzyme, Fe3O4@SiO2 nanoparticles could effectively protect the enzyme activity and increase the practicality of this method.

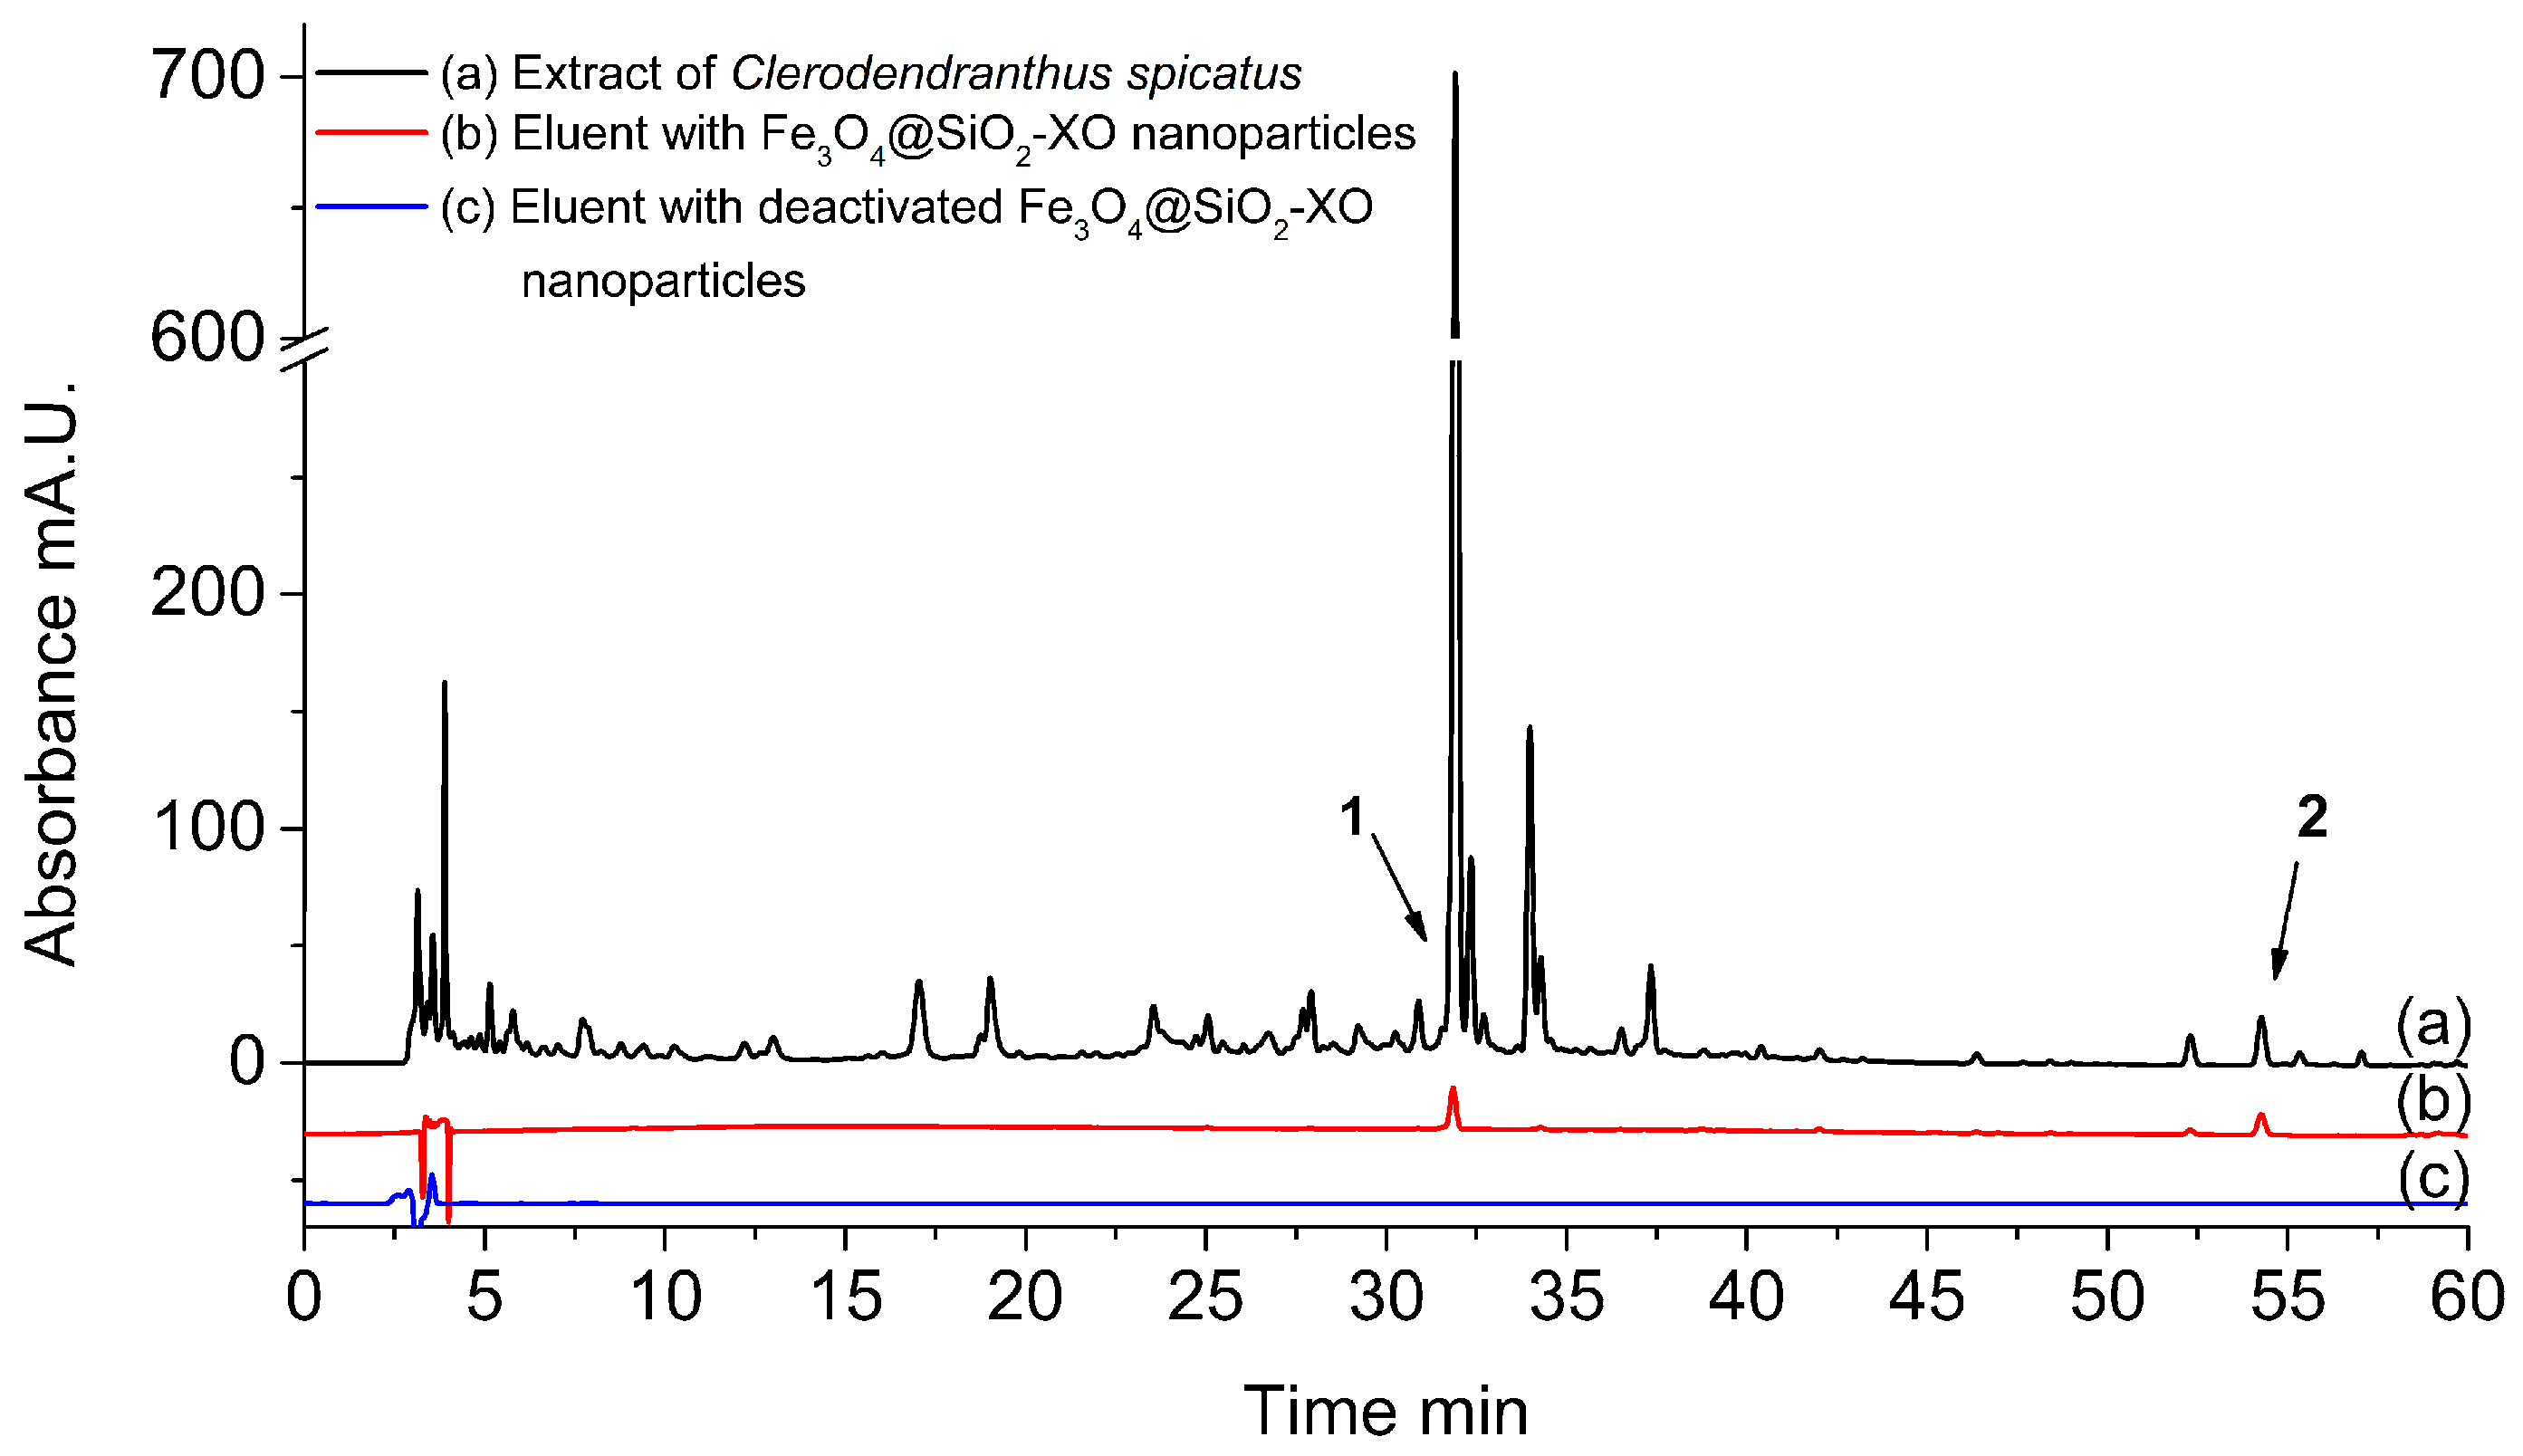
2.3. Screening of XO Inhibitors from Clerodendranthus spicatus

Our previous studies indicated that the extract of Clerodendranthus spicatus showed inhibition activities on XO. In this experiment, the inhibitory activity of the extract of Clerodendranthus spicatus was also tested to ensure the smooth implementation of this work. The results showed that the extract of Clerodendranthus spicatus exhibited inhibition on XO with the IC50 value at 147.0 μg/mL, which indicated there were plenty of potential XO inhibitors in the extract. Therefore, the analysis of XO inhibitors from extract of Clerodendranthus spicatus was meaningful.
The chromatograms of Clerodendranthus spicatus in aqueous and eluent solutions after screening using Fe3O4@SiO2-XO nanoparticles are shown in Figure 6. In order to obtain the optimum chromatograms for analysis, various gradient elution modes, several flow rates and column temperatures were evaluated. Finally, acceptable separation was achieved within of 60 min analysis. The chromatogram of Clerodendranthus spicatus extract can be found in Figure 6a. It can be seen that most of the peaks in the sample reached baseline separation and that the peak shape presented well.
When Fe3O4@SiO2-XO nanoparticles were incubated with extract of Clerodendranthus spicatus, the potential XO inhibitors would bind to Fe3O4@SiO2-XO nanoparticles based on affinity interaction. Meanwhile, the other components in the extract would not have any specific or chemical interaction with the Fe3O4@SiO2-XO nanoparticles. Finally, those bound potential XO inhibitors would be eluted by an organic solution and analyzed for further experiments. It can be seen in Figure 6b that two peaks appeared in the chromatogram of the eluent after screening with active Fe3O4@SiO2-XO nanoparticles; they are marked with numbers in Figure 6.
Deactivated Fe3O4@SiO2-XO nanoparticles, after high temperature process, were also used in screening to exclude nonspecific binding between active compounds and Fe3O4@SiO2-XO nanoparticles, and thus confirm the accuracy of the screening results. Figure 6c shows the chromatogram of eluent after screening with deactivated Fe3O4@SiO2-XO nanoparticles. Obviously, no peak was observed in the chromatogram at the same retention time of peak 1 and 2. Therefore, it could be ensured that the two compounds marked with numbers, which needed further identification and analysis, were specifically bound to Fe3O4@SiO2-XO nanoparticles.

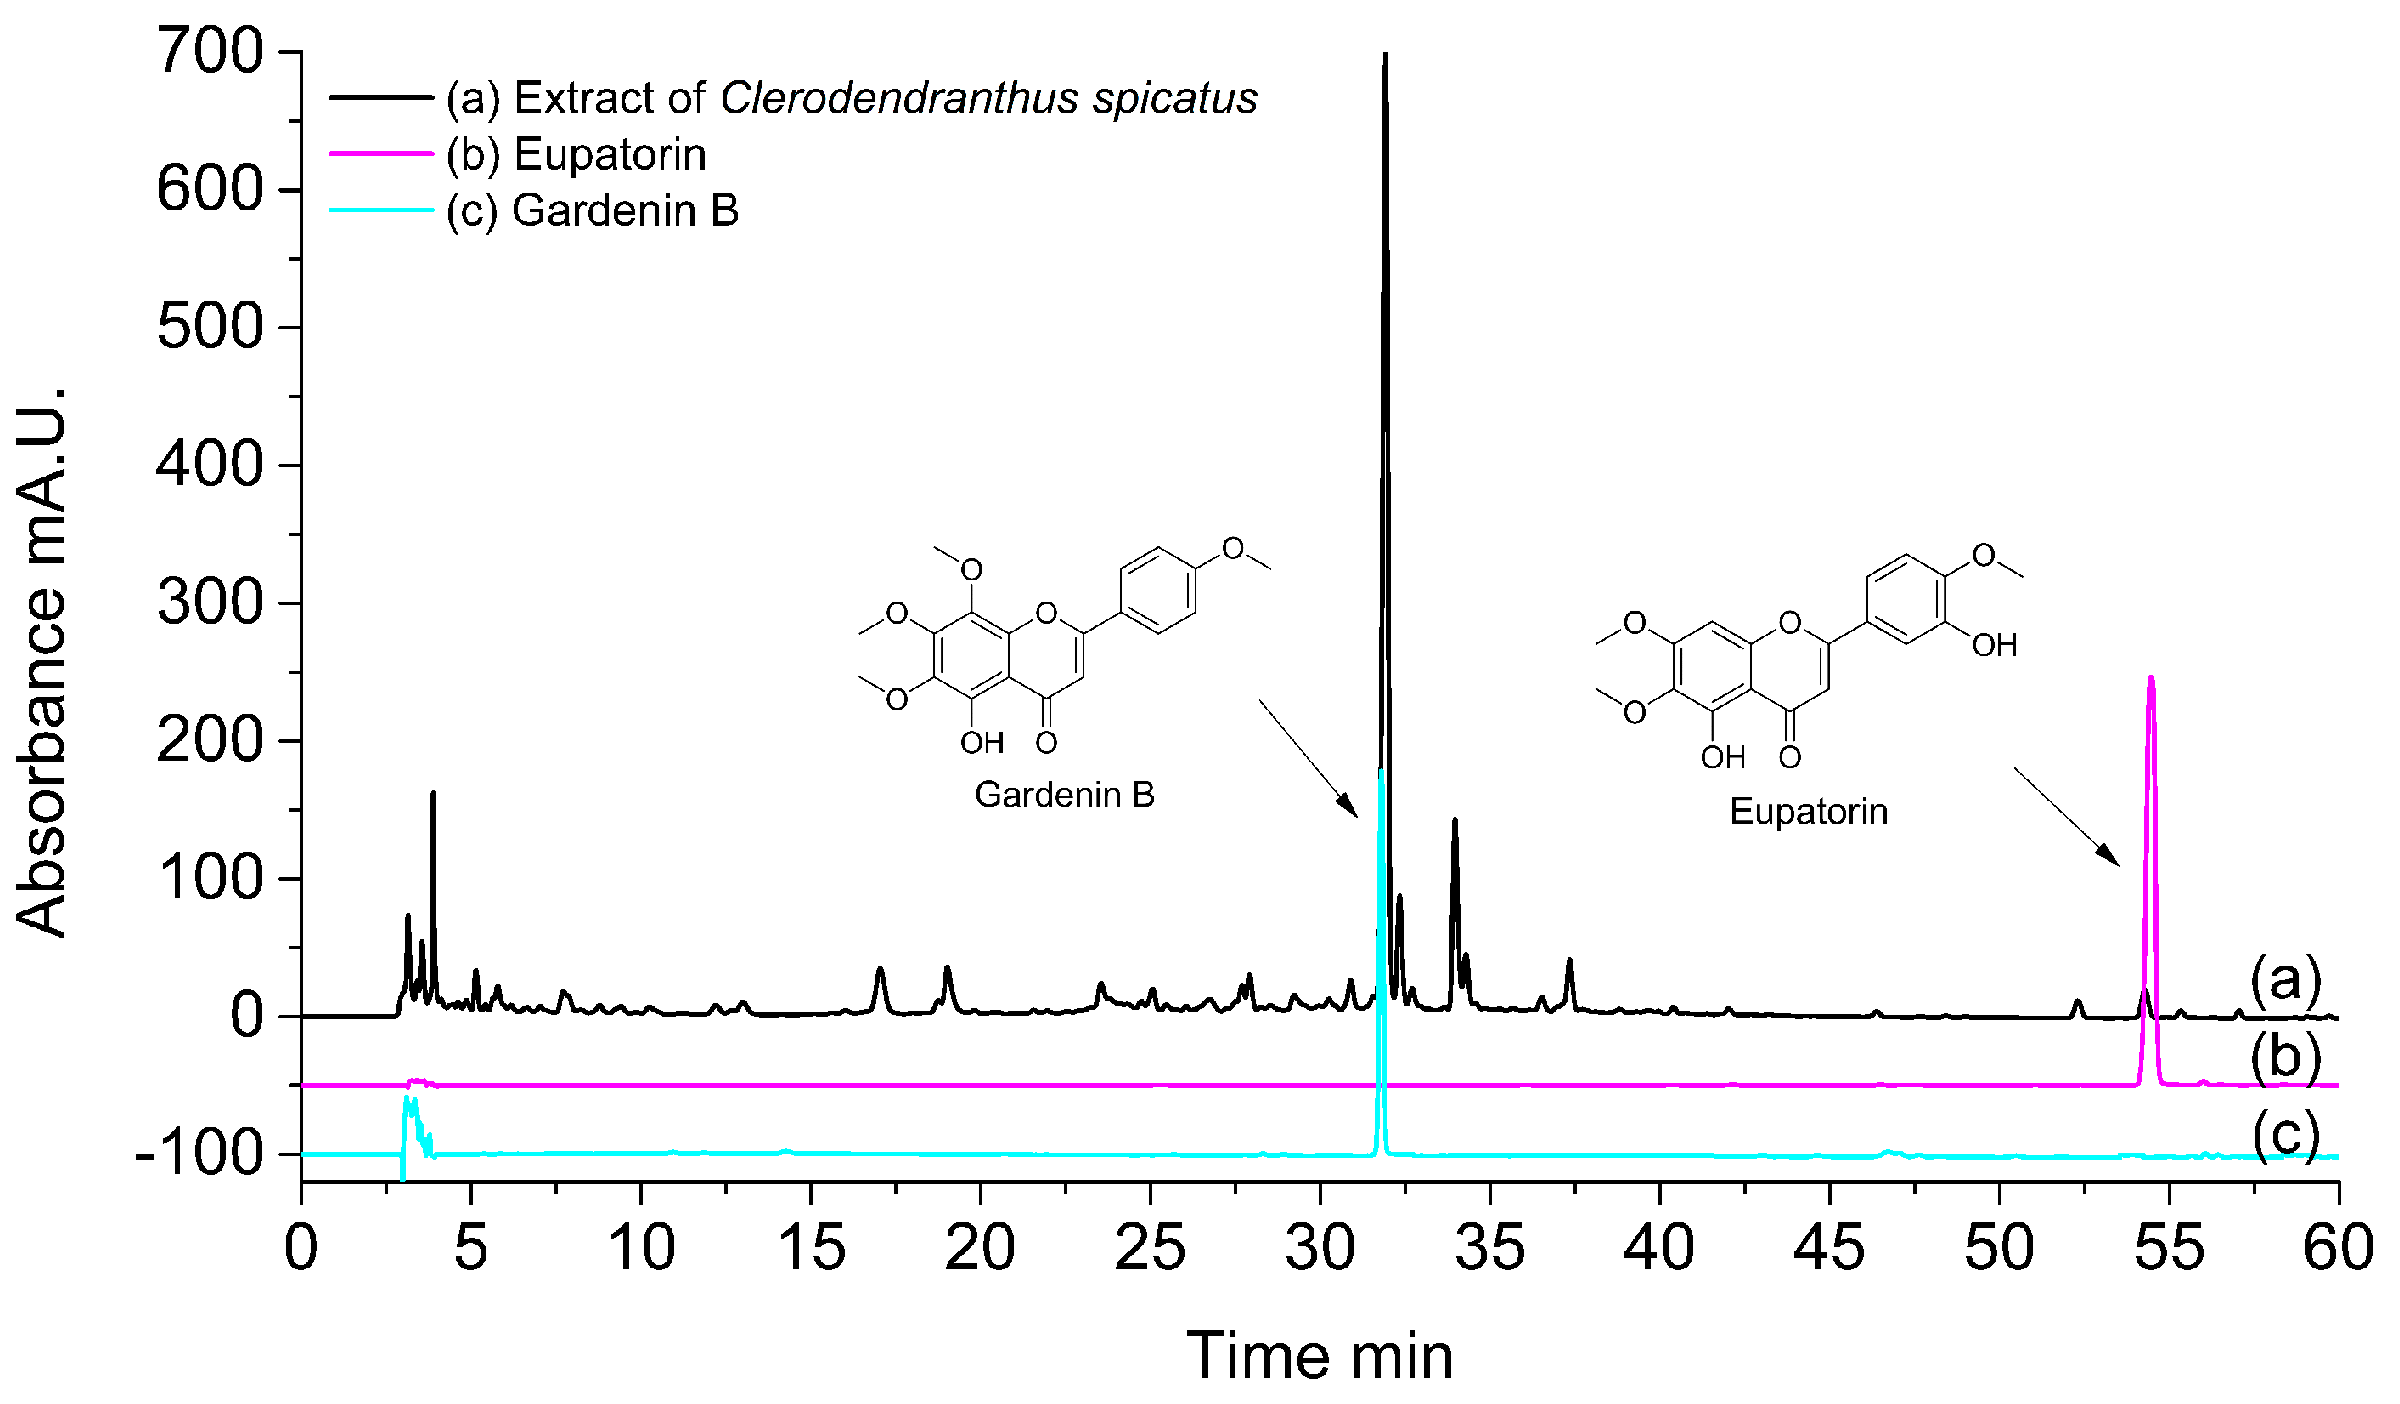
2.4. Identification of Screened Potential XO Inhibitors

In order to confirm the structures of the two screened potential XO inhibitors, High Performance Liquid Chromatography–Mass Spectrum (HPLC–MS) analysis was conducted and the related MS and UV data are shown in Table 1. Compound 1 exhibited two absorbance bands at 280 and 330 nm. In the negative ion mode of MS analysis, compound 1 showed the deprotonated molecular ion [M − H] at 357 m/z and [2M − H] at 715 m/z in the MS spectrum. According to the references, compound 1 was identified as gardenin B [26]. Compound 2 showed UV absorbance peaks at 250 nm, 275 nm and 340 nm. Meanwhile, the deprotonated molecular ion [M − H] at 343 m/z and [2M − H] at 687 m/z could be confirmed in the MS spectrum of compound 2 with the negative ion mode. In the positive ion mode, the protonated molecular ion [M + H]+ was found at 345 m/z, and [2M + Na]+ at 711 m/z. Therefore, the molecular weight of compound 2 could be considered as 344. Compound 2 was identified as eupatorin because the UV and MS data were in agreement with previous reports [27]. The standard gardenin B and eupatorin with high purities were also analysed by HPLC and the chromagtograms are shown in Figure 7. It can be seen that the retention time of the two standards were in accordance with those in the extract.

2.5. Inhibition on XO of Screened Potential XO Inhibitors

Since the screened potential XO inhibitors were identified as gardenin B and eupatorin, the XO inhibitory activities of them were evaluated. As a result, gardenin B and eupatorin exhibited inhibition on XO with IC50 values of 1.488 μg/mL and 11.197 μg/mL, respectively. According to reported literatures, eupatorin showed inhibition on XO [28]. The experiment results showed that both of these compounds could actually inhibit XO and they could prove the effectiveness of this screening method.

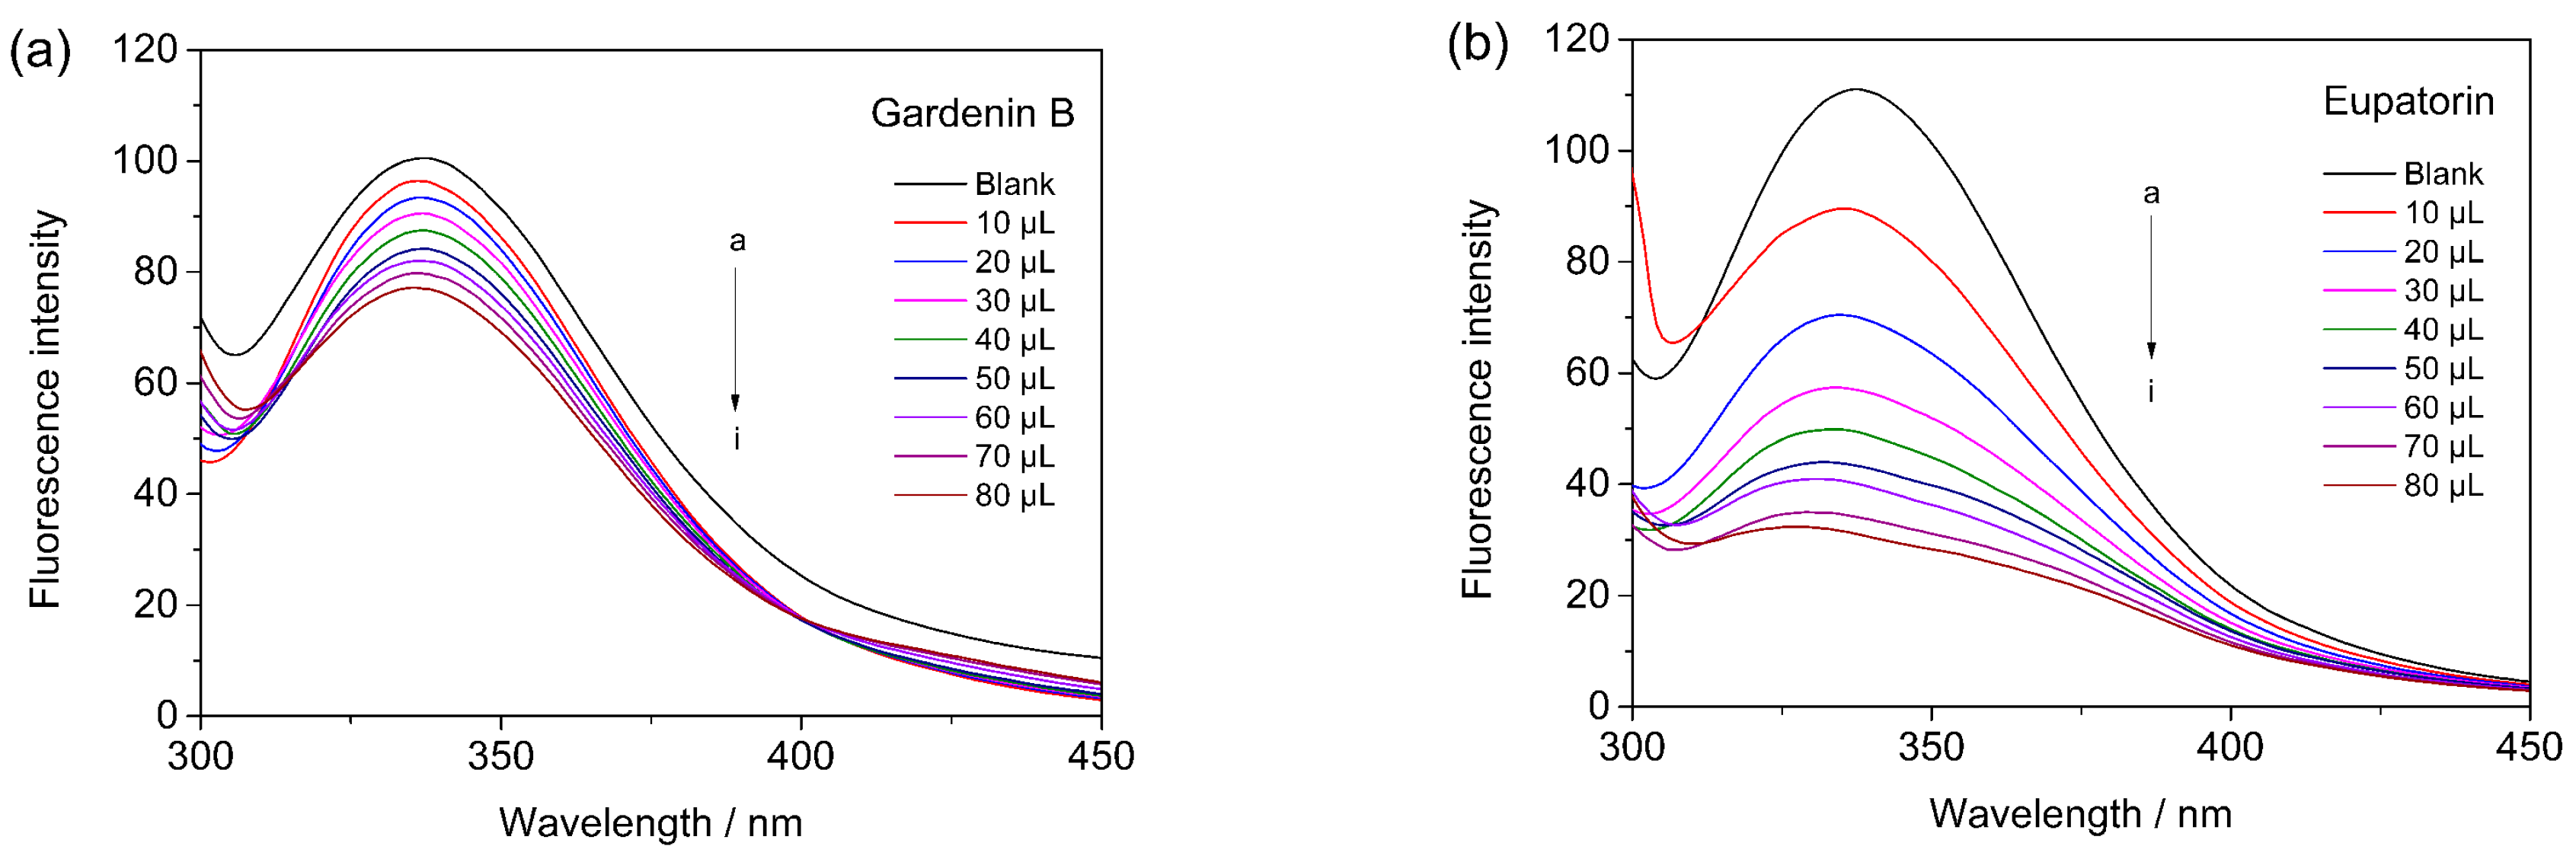
2.6. Fluorescent Quenching of Screened Compounds on XO

Since protein exhibits fluorescence spectrum light, fluorescent quenching could be used to investigate the binding between active compounds and protein. The fluorescence emission spectrum of XO and the spectra with the addition of gardenin B and eupatorin, respectively, are shown in Figure 8. XO showed a fluorescence emission peak at 337 nm with the excitation wavelength at 280 nm. Different levels of fluorescence quenchings could be observed when increasing concentrations of gardenin B and eupatorin were added. Therefore, the Stern–Volmer plots for XO fluorescence quenching by gardenin B and eupatorin were further investigated.
The plots are shown in Figure 9 and the binding parameters are summarized in Table 2. The Stern–Volmer plots of gardenin B and eupatorin were linear and the fitting degrees were 0.9988 and 0.9957, respectively. The satisfactory results reflected that the calculations of Kq and Ksv were suitable. The linear Stern–Volmer plots indicated a single way of quenching, which meant that either dynamic quenching or static quenching played a key role. The value of Kq reflected the efficiency of quenching and the accessibility of fluorophores. Based on previous research, if Kq is near 1.0 × 10¹⁰ L/mol/s, the quenching can be considered as dynamic quenching. Meanwhile, if Kq is greater than 2.0 × 10¹⁰ L/mol/s, the quenching can be considered as static quenching [29]. In this study, the Kq values of gardenin B and eupatorin were 600-fold (1.2194 × 10¹³ L/mol/s) and 500-fold (1.0097 × 10¹³ L/mol/s) greater than 2.0 × 10¹⁰ L/mol/s, respectively. This suggested that the quenching effects of gardenin B and eupatorin belong to static quenching mechanisms.

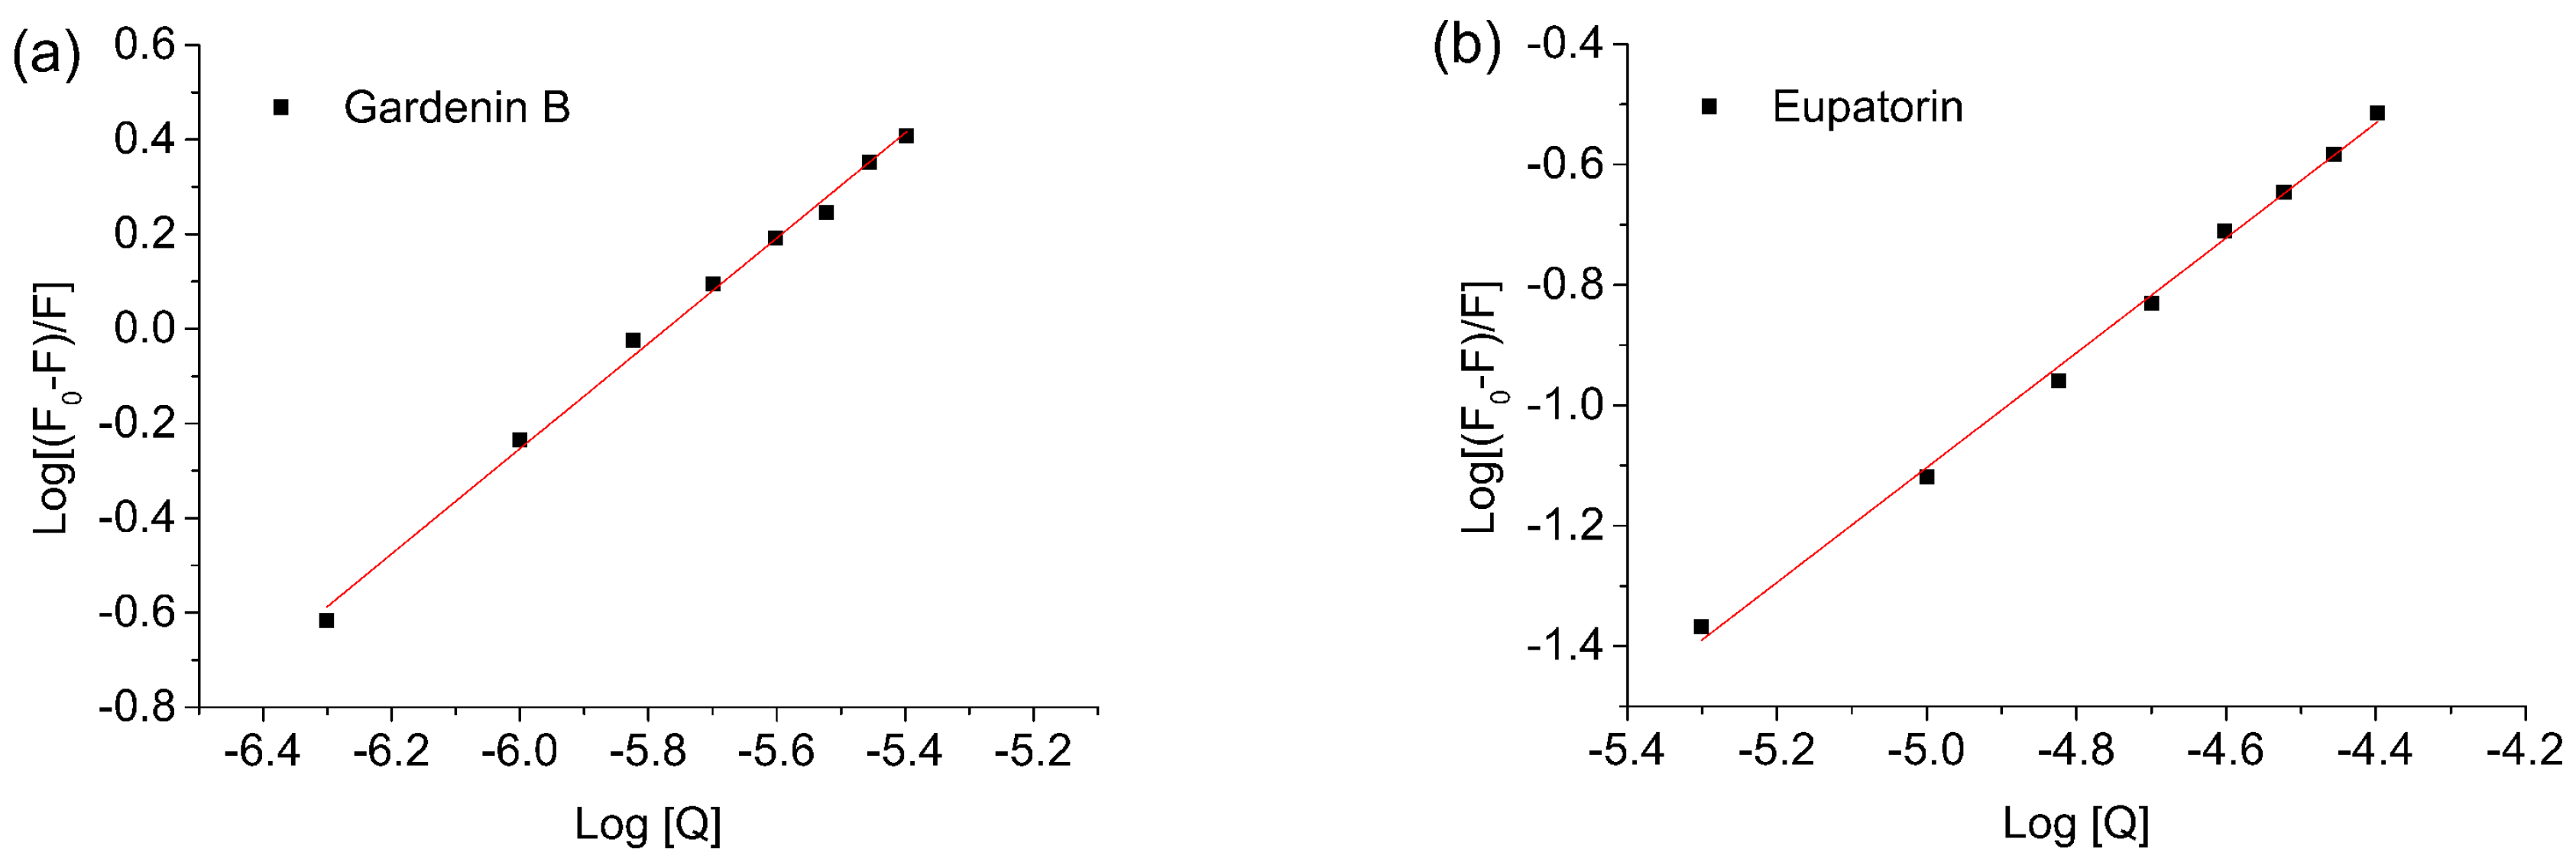
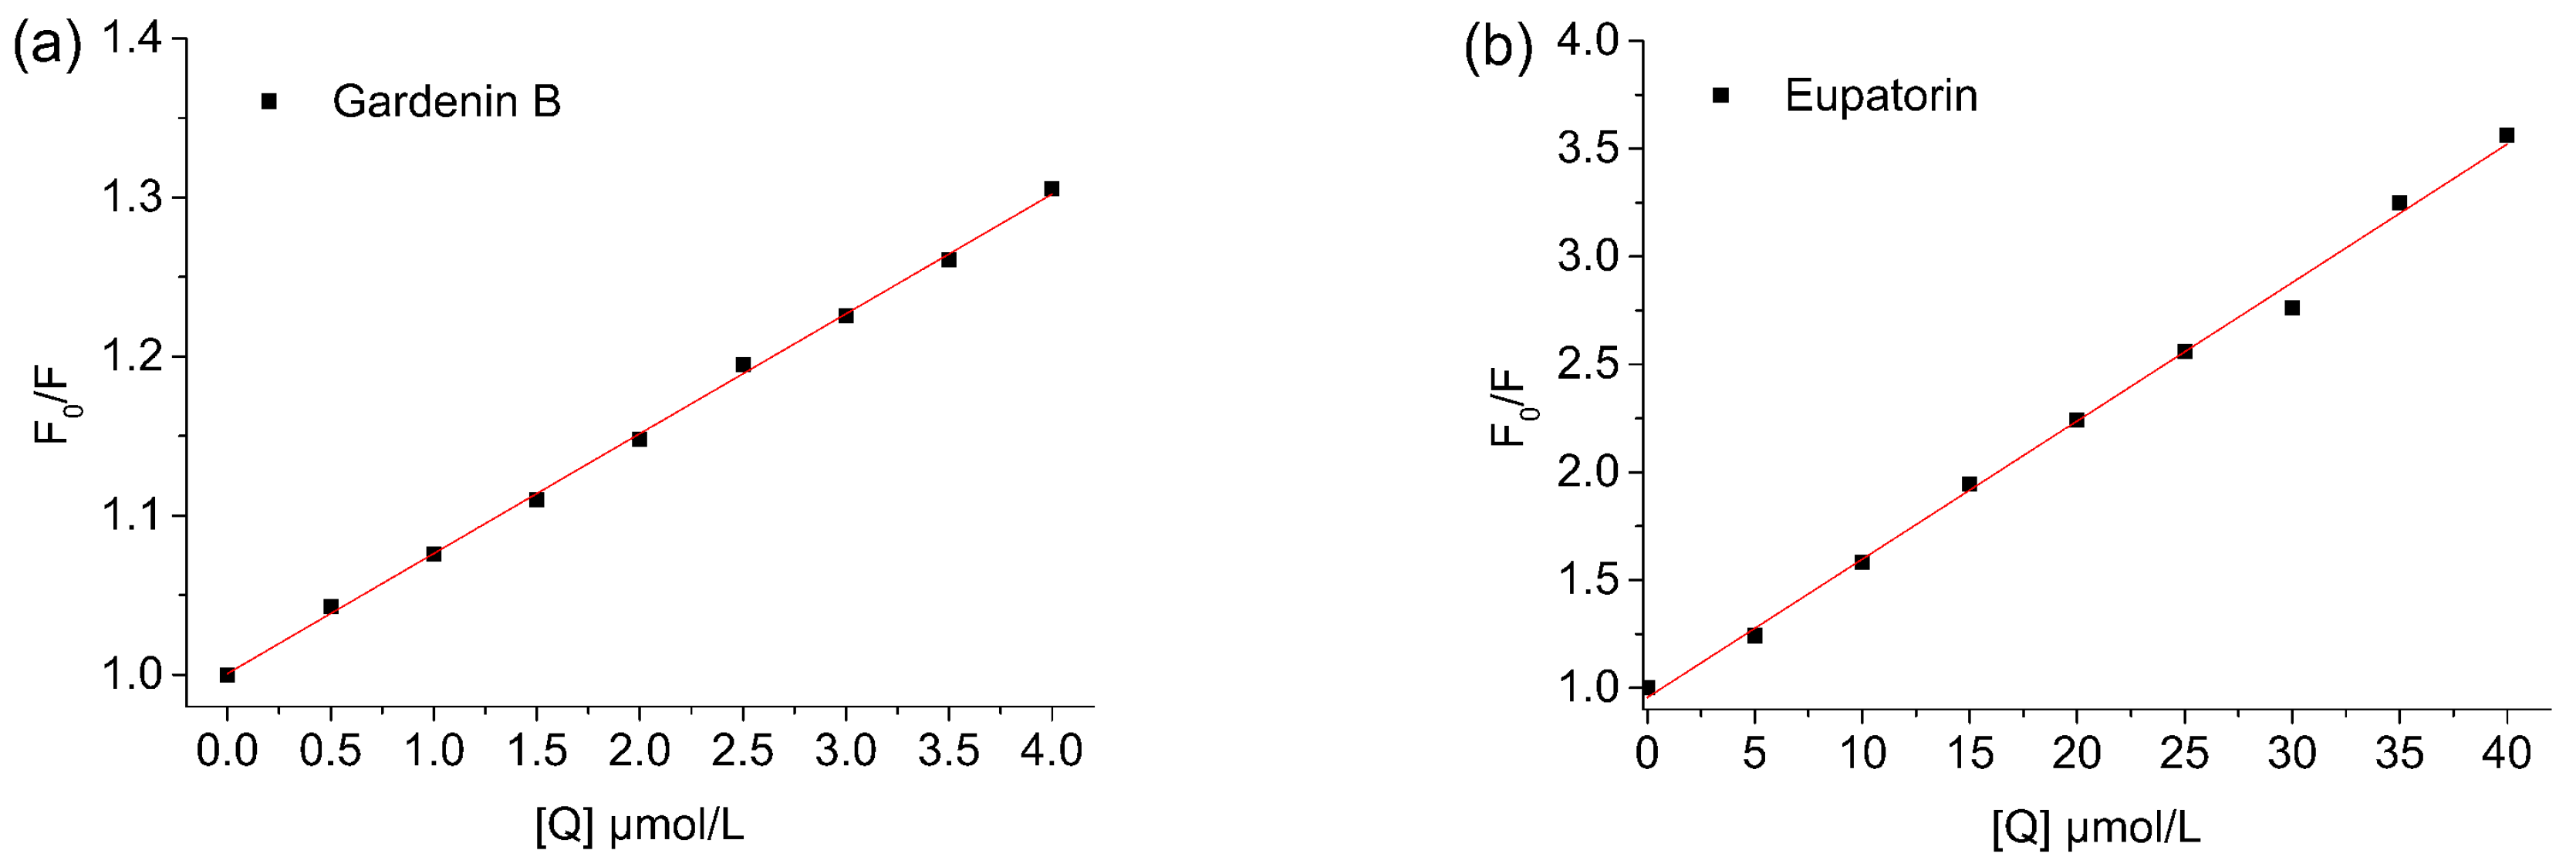
2.7. The Binding Constants and the Number of Binding Sites

For static quenching, the number of binding sites per protein molecule (n) and binding constants (Ka) could be calculated according to Equation (3). The plots of log[(F0 − F)/F] versus log[Q] for gardenin B and eupatorin are shown in Figure 10 and the calculations of slope and intercept are shown in Table 2. The double-logarithm curves were obviously linear and the fitting degrees were 0.9950 and 0.9962, indicating that the calculations were acceptable for this study [30]. The corresponding calculated Ka (n) values between gardenin B and eupatorin and XO were 2.636 × 10⁶ (1.1124) and 4.612 × 10³ (0.9534) at 300.15 K, respectively. Accordingly, gardenin B showed stronger binding capacity than eupatorin.

3. Materials and Methods

3.1. Materials

Xanthine oxidase powder was bought from Yuanye Biotechnology Co. (Shanghai, China). Xanthine, 3-aminopropyltriethoxysilane, tetraethyl orthosilicate, and glutaraldehyde were purchased from Sigma-Aldrich Chemicals (St. Louis, MO, USA). Clerodendranthus spicatus was bought from Kangmei Chinese medicines company (Bozhou, China). Gardenin B (95–99%) was bought from Biopurify Phytochemicals Ltd. (Chengdu, China) and eupatorin (>97%) was bought from Alfa Aesar, Thermo Fisher Scientific (Heysham, UK). Ultrapure water (18.2 MΩ cm resistivity) was obtained from the ELGA water purification system (ELGA Berkefeld, Veolia, Germany). HPLC grade acetonitrile was bought from Tedia Inc. (Phoenix, AZ, USA). All of other chemicals were acquired from Sinopharm Chemical Reagent Co., Ltd. (Shanghai, China) in analytical grade.

3.2. Preparation of Ethanol Extract of Clerodendranthus spicatus

20.0 g of powdered Clerodendranthus spicatus were dissolved in 200 mL of 90% (v/v) ethanol solution and extracted three times (each for 2 min) in a microwave oven with the power of 60%. After the reaction, the solvent was cooled down at room temperature and removed using vacuum rotary evaporation to obtain 2.46 g of deep green residues. Finally, the residues were dissolved in 50 mL of water and filtered through a 0.45 μm membrane. The final extract was stored at 4 °C for further experiments.

3.3. Preparation of Fe3O4@SiO2-XO Nanoparticles

The Fe3O4 nanoparticles were prepared according to our previous publications [31]. 1.35 g of FeCl3·6H2O, 3.60 g of sodium acetate and 1.00 g of polyethylene glycol 6000 were dissolved in 40 mL of ethylene glycol. The mixture was mechanical stirred under ultrasonic at room temperature for several minutes in order to acquire a homogeneous solution and the solution was poured in a Teflon-lined, stainless steel autoclave. The autoclave was heated at 180 °C for 6 h. The obtained black Fe3O4 nanoparticles were separated using a magnet and washed with ethanol three times and stored in 40 mL of ethanol.
For the preparation of the silica shell, 200 mg of Fe3O4 nanoparticles were dispersed in the mixture of 475 mL of ethanol, 140 mL of water and 15 mL of ammonia aqueous solution (28 wt. %). Under the mechanical stirring of 900 r/min, 6 mL of tetraethyl orthosilicate was added dropwise into the mixture. The silica coating reaction was performed at 25 °C for 8 h. The obtained Fe3O4@SiO2 nanoparticles were retained from the mixture by an ordinary magnet and washed with ethanol three times. Then the Fe3O4@SiO2 nanoparticles were dispersed in 200 mL of ethanol followed by the addition of 10 mL of 3-aminopropyltriethoxysilane, dropwise, at 25 °C to complete the amino modification of Fe3O4@SiO2 nanoparticles. After mechanical stirring of 900 r/min for 6 h, the prepared amino Fe3O4@SiO2 nanoparticles were washed with ethanol and water three times, and stored at 4 °C in water.
For the immobilization of XO on amino Fe3O4@SiO2 nanoparticles, 2 mL of glutaraldehyde solution (5% w/v) were added into 20 mg of the previously obtained amino Fe3O4@SiO2 nanoparticles. After being shaken in a thermostatic oscillator at 25 °C for 1 h, the activated Fe3O4@SiO2 nanoparticles were retained and then washed with water three times. Then, they were transferred into a tube containing 1 mL of XO solution (1.0 mg/mL in phosphate buffered saline) and shaken in thermostatic oscillator at 25 °C for 1 h. At last, the prepared Fe3O4@SiO2-XO nanoparticles were collected by magnet, washed with a buffer solution three times and dispersed in a buffer at 4 °C for further use.

3.4. Characterization of Fe3O4@SiO2-XO Nanoparticles

TEM was utilized to confirm the surface morphology of materials, using a Tecnai-G20 transmission electron microscope (FEI, Hillsboro, OR, USA). The XRD could confirm the crystalline structure of Fe3O4 and Fe3O4@SiO2 nanoparticles using powder X-ray Diffractometer (Rigaku RINT 2500, Rigaku Corporation, Tokyo, Japan) with Cu/Kα radiation at 30 mA and 40 kV. FT–IR spectra were observed by a Nicolet avatar 360 FT–IR spectrophotometer (Thermo Fisher Nicolet, Orlando, FL, USA). Magnetic properties of the prepared materials were measured at room temperature on a vibration sample magnetometer VSM7407 (Lake Shore, Westerville, OH, USA).

3.5. XO Activity and Inhibition Test

The activity test of XO was similar to other publications, with some modifications [32]. Firstly, 1 mL of water and 1 mL of xanthine (1.0 mg/mL) were mixed in the cuvette. Then, 20 μL of XO solution (1.0 mg/mL) was added into the cuvette and the absorbance at 295 nm was continuously monitored by an UV–VIS Spectrophotometer. The increase in absorbance at 295 nm in 40 s was recorded as the control. For the inhibition test, 1 mL of test samples with different concentrations were firstly mixed with 20 μL of XO solution (1 mg/mL) for one minute in the cuvette and then 1 mL of xanthine (1.0 mg/mL) was added. The increase in absorbance at 295 nm in 40 s was recorded by a UV–VIS Spectrophotometer. The inhibition of XO activity was calculated according to the following equation.
Inhibition % = (1 − ΔA/ΔA0) × 100%
where ΔA and ΔA0 are the absorbance increases of sample and control solution. The inhibition was expressed as the concentration of sample needed to inhibit 50% of the enzymatic activity (IC50). All the assays were performed in triplicate.

3.6. Screening of XO Inhibitors from Clerodendranthus spicatus

The screening of XO inhibitors from Clerodendranthus spicatus was conducted using Fe3O4@SiO2-XO nanoparticles according to our previous reports, with some modifications [33]. The first incubation step was conducted by mixing 50 mg of Fe3O4@SiO2-XO nanoparticles and 2.0 mL of extract of Clerodendranthus spicatus in the tube, and then shaking the tube in a thermostatic oscillator at 25 °C for 90 min. Then, the Fe3O4@SiO2-XO nanoparticles were magnetic separated from the mixture by using an ordinary magnet and washed with water three times in order to remove unspecific binding. Finally, 2.0 mL of methanol solution were added into Fe3O4@SiO2-XO nanoparticles and the mixture was shaking for 5 min. The Fe3O4@SiO2-XO nanoparticles were retained by magnet and the methanol solution was filtered through a 0.45 μm membrane and stored at 4 °C in refrigerator before the usage. In order to confirm that the binding was specific, a control experiment was done by using deactivated Fe3O4@SiO2-XO nanoparticles after high temperature processing as a substitution under the same screening procedures.

3.7. HPLC Analysis of Samples

HPLC separation was conducted for the qualitative analysis of the components in extract of Clerodendranthus spicatus. The HPLC analysis was completed on an Agilent 1260 HPLC system (Agilent Technologies, Santa Clara, CA, USA). The Waters Xbridge™ C18 reverse phase column (250 mm × 4.6 mm i.d., 5 μm) (Waters, Milford, MA, USA) was used as separation column. A gradient elution program was used with solvent A (water containing 0.1% (v/v) acetic acid) and solvent B (acetonitrile containing 0.1% (v/v) acetic acid) as follows: 0–10 min, 10% B; 10–50 min, 10–40% B; and 50–60 min, 40–70% B. The column temperature was maintained at 25 °C and the flow rate was 0.8 mL/min. 5 μL of sample after filtration by a 0.45 μm membrane was injected and the chromatogram was recorded at 254 nm with scan wavelength from 190 to 400 nm.

3.8. Identification of the Screened Compounds

The screened potential XO inhibitors from extract of Clerodendranthus spicatus were subsequently analyzed by HPLC–MS to identify the chemical structures. The HPLC conditions were the same as the afore-mentioned HPLC analysis conditions. HPLC–MS analysis was completed on the Agilent 6460 Triple Quadrupole LC–MS system (Agilent Technologies Inc., Santa Clara, CA, USA). An Electron Spray Ionization (ESI) interface was used in both positive and negative ionization mode. Full-scan mode from 100 to 1000 m/z was used as the mass detection mode.

3.9. XO Fluorescence Quenching

The fluorescence spectra of XO and the effects of samples on XO were performed using a Hitachi F-7000 fluorometer (Tokyo, Japan). The fluorescence quenching effect was evaluated to determine the binding constants between compounds and XO based on the procedures reported by previous literatures with some modifications [34]. 2.0 mL of XO solution (1.0 μmol/L in phosphate buffered saline, pH 7.4) was poured into a fluorescence quartz cuvette and the fluorescence emission spectra was recorded as blank from 300 nm to 450 nm under an excitation wavelength at 280 nm. Then, 10 μL of sample (0.1 mmol/L in dimethyl sulfoxide (DMSO) for gardenin B and 1.0 mmol/L in DMSO for eupatorin) was added dropwise into the cuvette containing XO solution. The fluorescence emission spectra under the same condition and the fluorescence intensities at 337 nm were recorded. Each test was performed in triplicate. The fluorescence quenching of XO with gardenin B and eupatorin was described using the following Stern–Volmer equation [35]:
F0/F = 1 + Kqτ0[Q] = 1 + Ksv[Q]
where F0 is the fluorescence intensity of XO at 337 nm, F is the fluorescence intensity at 337 nm in the presence of the sample, [Q] is the corresponding sample concentration, Kq and Ksv are the quenching constants, and τ0 is the average lifetime (6.2 ns).
The relationship between fluorescence quenching intensity at 337 nm and sample concentration was described by the binding constant formula:
Log10(F0 − F)/log10Ka + nlog10[Q]
where F0 is the fluorescence intensity of XO at 337 nm, F is the fluorescence intensity at 337 nm in the presence of the sample, [Q] is the corresponding sample concentration, Ka is the binding constant, and n is the number of binding sites per XO molecule. All the samples showed no emission spectra in the scanned range under excitation.

4. Conclusions

In this study, xanthine oxidase immobilized silica coated Fe3O4 nanoparticles were successfully prepared and characterized. The average diameter of Fe3O4 nanoparticles was about 300 nm to 350 nm and the thickness of the silica shell was 60 nm. The maximum saturation magnetization of Fe3O4@SiO2-XO nanoparticles was 44.9 emu/g, which ensures their separation from medium within one minute using an ordinary magnet. 93% of the initial screening capacity of Fe3O4@SiO2-XO nanoparticles could be retained after five rounds of screening. The XO inhibitor screening method using Fe3O4@SiO2-XO nanoparticles was established and utilized in the extract of Clerodendranthus spicatus. Two compounds were screened out and identified as gardenin B and eupatorin. The IC50 values of these two compounds were verified. These two compounds could quench the XO fluorescence spectrum. The quenching activity of both compounds belonged to static quenching mechanism and gardenin B showed stronger binding capacity than eupatorin. In conclusion, this screening method showed efficiency and reusability in the rapid screening and identification of enzyme inhibitors from complex mixtures.

Acknowledgments

This work was supported by the Natural Science Foundation of Hunan Province (Grant No. 2017JJ3348) and the risk assessment of agricultural products quality and safety project.

Author Contributions

Defang Li conceived and designed the experiments; Liangliang Liu and Mengmeng Yuan performed the experiments; Siqi Huang and Jianjun Li analyzed the data; Liangliang Liu and Lining Zhao wrote the paper.

Conflicts of Interest

The authors declare no conflict of interest.

References

  1. Newman, D.J.; Cragg, G.M. Natural products as sources of new drugs over the 30 years from 1981 to 2010. J. Nat. Prod. 2012, 75, 311–335. [Google Scholar] [CrossRef] [PubMed]
  2. Li, J.W.H.; Vederas, J.C. Drug discovery and natural products: End of an era or an endless frontier? Science 2009, 325, 161–165. [Google Scholar] [CrossRef] [PubMed]
  3. Li, M.; Wang, S.; He, L. Development of an analytical method coupling cell membrane chromatography with gas chromatography—Mass spectrometry via microextraction by packed sorbent and its application in the screening of volatile active compounds in natural products. J. Chromatogr. B 2015, 974, 9–16. [Google Scholar] [CrossRef] [PubMed]
  4. Pardo, A.; Mespouille, L.; Dubois, P.; Duez, P.; Blankert, B. Targeted extraction of active compounds from natural products by molecularly imprinted polymers. Cent. Eur. J. Chem. 2012, 10, 751–765. [Google Scholar] [CrossRef]
  5. Tang, C.; Liu, Z.S.; Qin, N.; Xu, L.; Duan, H.Q. Novel cell membrane capillary chromatography for screening active compounds from natural products. Chromatographia 2013, 76, 697–701. [Google Scholar] [CrossRef]
  6. Moreira, M.; Moldes-Diz, Y.; Feijoo, S.; Eibes, G.; Lema, J.; Feijoo, G. Formulation of laccase nanobiocatalysts based on ionic and covalent interactions for the enhanced oxidation of phenolic compounds. Appl. Sci. 2017, 7, 851. [Google Scholar] [CrossRef]
  7. Neng, J.; Tan, J.; Jia, K.; Sun, P. A fast and cost-effective detection of melamine by surface enhanced raman spectroscopy using a novel hydrogen bonding-assisted supramolecular matrix and gold-coated magnetic nanoparticles. Appl. Sci. 2017, 7, 475. [Google Scholar] [CrossRef]
  8. McDermott, S.; Guimaraes, A.R. Magnetic nanoparticles in the imaging of tumor angiogenesis. Appl. Sci. 2012, 2, 525–534. [Google Scholar] [CrossRef]
  9. Liu, Y.; Yan, M.; Geng, Y.; Huang, J. Laccase immobilization on poly(p-phenylenediamine)/Fe3O4 nanocomposite for reactive blue 19 dye removal. Appl. Sci. 2016, 6, 232. [Google Scholar] [CrossRef]
  10. Wang, T.; Li, D.; Yu, B.; Qi, J. Screening inhibitors of xanthine oxidase from natural products using enzyme immobilized magnetic beads by high-performance liquid chromatography coupled with tandem mass spectrometry. J. Sep. Sci. 2017, 40, 1877–1886. [Google Scholar] [CrossRef] [PubMed]
  11. Tang, C.; Mao, R.; Liu, F.; Yu, Y.; Xu, L.; Zhang, Y. Ligand fishing with cellular membrane-coated magnetic beads: A new method for the screening of potentially active compounds from natural products. Chromatographia 2017, 80, 1517–1525. [Google Scholar] [CrossRef]
  12. Liu, D.M.; Chen, J.; Shi, Y.P. Screening of enzyme inhibitors from traditional chinese medicine by magnetic immobilized α-glucosidase coupled with capillary electrophoresis. Talanta 2017, 164, 548–555. [Google Scholar] [CrossRef] [PubMed]
  13. Qi, J.; Sun, L.Q.; Qian, S.Y.; Yu, B.Y. A novel multi-hyphenated analytical method to simultaneously determine xanthine oxidase inhibitors and superoxide anion scavengers in natural products. Anal. Chim. Acta 2017, 984, 124–133. [Google Scholar] [CrossRef] [PubMed]
  14. Zhang, H.J.; Hu, Y.J.; Xu, P.; Liang, W.Q.; Zhou, J.; Liu, P.G.; Cheng, L.; Pu, J.B. Screening of potential xanthine oxidase inhibitors in gnaphalium hypoleucum dc. By immobilized metal affinity chromatography and ultrafiltration-ultra performance liquid chromatography-mass spectrometry. Molecules 2016, 21, 1242. [Google Scholar] [CrossRef] [PubMed]
  15. Bove, M.; Cicero, A.F.G.; Borghi, C. The effect of xanthine oxidase inhibitors on blood pressure and renal function. Curr. Hypertens. Rep. 2017, 19, 95. [Google Scholar] [CrossRef] [PubMed]
  16. Ishii, T.; Taguri, M.; Tamura, K.; Oyama, K. Evaluation of the effectiveness of xanthine oxidoreductase inhibitors on haemodialysis patients using a marginal structural model. Sci. Rep. 2017, 7, 14004. [Google Scholar] [CrossRef] [PubMed]
  17. Zheng, Q.; Sun, Z.; Zhang, X.; Yuan, J.; Wu, H.; Yang, J.; Xu, X. Clerodendranoic acid, a new phenolic acid from clerodendranthus spicatus. Molecules 2012, 17, 13656–13661. [Google Scholar] [CrossRef] [PubMed]
  18. Sun, Z.; Zheng, Q.; Ma, G.; Zhang, X.; Yuan, J.; Wu, H.; Liu, H.; Yang, J.; Xu, X. Four new phenolic acids from clerodendranthus spicatus. Phytochem. Lett. 2014, 8, 16–21. [Google Scholar] [CrossRef]
  19. Ma, G.X.; Zhang, X.P.; Li, P.F.; Sun, Z.H.; Zhu, N.L.; Zhu, Y.D.; Yang, J.S.; Chen, D.L.; Wu, H.F.; Xu, X.D. Four new phenolic acid with unusual bicycle [2.2.2] octane moiety from clerodendranthus spicatus and their anti-inflammatory activity. Fitoterapia 2015, 105, 61–65. [Google Scholar] [CrossRef] [PubMed]
  20. Luo, Y.; Cheng, L.Z.; Luo, Q.; Yan, Y.M.; Wang, S.M.; Sun, Q.; Cheng, Y.X. New ursane-type triterpenoids from clerodendranthus spicatus. Fitoterapia 2017, 119, 69–74. [Google Scholar] [CrossRef] [PubMed]
  21. Li, Q.; He, Y.N.; Shi, X.W.; Kang, L.Y.; Niu, L.Y.; Wang, X.G.; Feng, W. Clerodens e–j, antibacterial caffeic acid derivatives from the aerial part of clerodendranthus spicatus. Fitoterapia 2016, 114, 110–114. [Google Scholar] [CrossRef] [PubMed]
  22. Sheng, W.; Wei, W.; Li, J.; Qi, X.; Zuo, G.; Chen, Q.; Pan, X.; Dong, W. Amine-functionalized magnetic mesoporous silica nanoparticles for DNA separation. Appl. Surf. Sci. 2016, 387, 1116–1124. [Google Scholar] [CrossRef]
  23. Liu, L.; Leng, J.; Yang, X.; Liao, L.; Cen, Y.; Xiao, A.; Ma, L. Rapid screening and identification of bsa bound ligands from radix astragali using bsa immobilized magnetic nanoparticles coupled with hplc-ms. Molecules 2016, 21, 1471. [Google Scholar] [CrossRef] [PubMed]
  24. Tian, Z.; Yu, X.; Ruan, Z.; Zhu, M.; Zhu, Y.; Hanagata, N. Magnetic mesoporous silica nanoparticles coated with thermo-responsive copolymer for potential chemo- and magnetic hyperthermia therapy. Microporous Microporous Mater. 2018, 256, 1–9. [Google Scholar] [CrossRef]
  25. Al-Dhrub, A.H.A.; Sahin, S.; Ozmen, I.; Tunca, E.; Bulbul, M. Immobilization and characterization of human carbonic anhydrase i on amine functionalized magnetic nanoparticles. Process Biochem. 2017, 57, 95–104. [Google Scholar] [CrossRef]
  26. Maurya, P.; Singh, S.; Gupta, M.M.; Luqman, S. Characterization of bioactive constituents from the gum resin of gardenia lucida and its pharmacological potential. Biomed. Pharmacother. 2017, 85, 444–456. [Google Scholar] [CrossRef] [PubMed]
  27. Akowuah, G.A.; Zhari, I.; Norhayati, I.; Sadikun, A.; Khamsah, S.M. Sinensetin, eupatorin, 3′-hydroxy-5, 6, 7, 4′-tetramethoxyflavone and rosmarinic acid contents and antioxidative effect of orthosiphon stamineus from malaysia. Food Chem. 2004, 87, 559–566. [Google Scholar] [CrossRef]
  28. Tuzun, B.S.; Hajdu, Z.; Orban-Gyapai, O.; Zomborszki, Z.P.; Jedlinszki, N.; Forgo, P.; Kivcak, B.; Hohmann, J. Isolation of chemical constituents of centaurea virgata lam. And xanthine oxidase inhibitory activity of the plant extract and compounds. Med. Chem. 2017, 13, 498–502. [Google Scholar] [CrossRef] [PubMed]
  29. Li, S.; Tang, L.; Bi, H. Study on the interaction between pelargonidin-3-o-glucoside and bovine serum albumin using spectroscopic, transmission electron microscopy and molecular modeling techniques. Luminescence 2016, 31, 442–452. [Google Scholar] [CrossRef] [PubMed]
  30. Xiao, J.; Cao, H.; Wang, Y.; Yamamoto, K.; Wei, X. Structure–affinity relationship of flavones on binding to serum albumins: Effect of hydroxyl groups on ring A. Mol. Nutr. Food Res. 2010, 54, S253–S260. [Google Scholar] [CrossRef] [PubMed]
  31. Chen, J.; Leng, J.; Yang, X.; Liao, L.; Liu, L.; Xiao, A. Enhanced performance of magnetic graphene oxide-immobilized laccase and its application for the decolorization of dyes. Molecules 2017, 22, 221. [Google Scholar] [CrossRef] [PubMed]
  32. Liu, L.; Xiao, A.; Ma, L.; Li, D.; Liu, L.; Xiao, A.; Ma, L.; Li, D. Analysis of xanthine oxidase inhibitors from puerariae flos using centrifugal ultrafiltration coupled with hplc-ms. J. Braz. Chem. Soc. 2016, 28, 360–366. [Google Scholar]
  33. Liu, L.; Shi, S.; Zhao, H.; Yu, J.; Jiang, X.; Chen, X. Selective fishing and analysis of xanthine oxidase binders from two fabaceae species by coupling enzyme functionalized core–shell magnetic nanoparticles with hplc–ms. J. Chromatogr. B 2014, 945–946, 163–170. [Google Scholar] [CrossRef] [PubMed]
  34. Xiao, J.; Kai, G.; Ni, X.; Yang, F.; Chen, X. Interaction of natural polyphenols with [small alpha]-amylase in vitro: Molecular property-affinity relationship aspect. Mol. BioSyst. 2011, 7, 1883–1890. [Google Scholar] [CrossRef] [PubMed]
  35. Xiao, J.; Zhao, Y.; Wang, H.; Yuan, Y.; Yang, F.; Zhang, C.; Yamamoto, K. Noncovalent interaction of dietary polyphenols with common human plasma proteins. J. Agric. Food Chem. 2011, 59, 10747–10754. [Google Scholar] [CrossRef] [PubMed]
Figure 1. Transmission electron microscope (TEM) images of (a) Fe3O4 nanoparticles; (b) silica coated Fe3O4 nanoparticles (Fe3O4@SiO2) nanoparticles and (c) xanthine oxidase immobilized silica coated Fe3O4 nanoparticles (Fe3O4@SiO2-XO) nanoparticles.
Applsci 08 00158 g001
Figure 2. X-ray powder diffraction (XRD) patterns of (a) Fe3O4 nanoparticles and (b) Fe3O4@SiO2 nanoparticles.
Applsci 08 00158 g002
Figure 3. The Fourier transform infrared spectroscopy (FT–IR) spectrum of (a) Fe3O4 nanoparticles, (b) Fe3O4@SiO2 nanoparticles and (c) amino Fe3O4@SiO2 nanoparticles.
Applsci 08 00158 g003
Figure 4. The magnetization curves of (a) Fe3O4 nanoparticles, (b) Fe3O4@SiO2 nanoparticles and (c) Fe3O4@SiO2-XO nanoparticles.
Applsci 08 00158 g004
Figure 5. (a) Effect of screening time on the screening capacity. (b) Reusability of Fe3O4@SiO2-XO nanoparticles.
Applsci 08 00158 g005
Figure 6. The chromatograms of (a) extract of Clerodendranthus spicatus, (b) eluent with Fe3O4@SiO2-XO nanoparticles and (c) eluent with deactivated Fe3O4@SiO2-XO nanoparticles.
Applsci 08 00158 g006
Figure 7. The chromatograms of (a) extract of Clerodendranthus spicatus, (b) eupatorin and (c) gardenin B.
Applsci 08 00158 g007
Figure 8. The quenching effects of (a) gardenin B and (b) eupatorin on xanthine oxidase (XO) fluorescence spectra at 300.15 K. λex = 280 nm; XO, 1.0 μmol/L; the addition of gardenin B was from 0.5 to 4.0 μmol; the addition of eupatorin was from 5 to 40 μmol.
Applsci 08 00158 g008
Figure 9. The Stern–Volmer plots for XO fluorescence quenching by (a) gardenin B and (b) eupatorin at 300.15 K.
Applsci 08 00158 g009
Figure 10. The plots of log[(F0 − F)/F] versus log[Q] for (a) gardenin B and (b) eupatorin at 300.15 K.
Applsci 08 00158 g010
Table 1. The identification, retention time, MS and UV data of screened compounds.
No.IdentificationRetention Time (min)Molecular WeightProposed Ions (m/z)Ultraviolet Spectrum λmax (nm)
1Gardenin B31.90358 [M − H]357280, 330
[2M − H]−715
2Eupatorin54.28344 [M − H]343250, 275, 340
[2M − H]−687
[M + H]+345
[2M + Na]+711
Table 2. The affinity constants of gardenin B and eupatorin for XO. Abbreviations: Kq, Kav, R2, n, number of binding sites per protein molecule.
No.CompoundsKq (1013)Ksv (105)R2Log10KanR2
1Gardenin B1.21940.75600.99886.42091.11240.9950
2Eupatorin1.00970.62600.99573.66390.95340.9962

