Article

An Empirical Approach for Tunnel Support Design through Q and RMi Systems in Fractured Rock Mass

1
Department of Civil and Environmental Engineering, Hanyang University, 55 Hanyangdaehak-ro, Sangnok-gu, Ansan 426-791, Korea
2
Department of Mining Engineering, Faculty of Engineering, Baluchistan University of Information Technology, Engineering and Management Sciences (BUITEMS), Quetta 87300, Pakistan
3
Department of Geological Engineering, Faculty of Engineering, Baluchistan University of Information Technology, Engineering and Management Sciences (BUITEMS), Quetta 87300, Pakistan
4
Korea Railroad Research Institute, 176 Cheoldobangmulgwan-ro, Uiwang-si, Gyeonggi-do 16105, Korea
*
Author to whom correspondence should be addressed.
Appl. Sci. 2018, 8(12), 2659; https://doi.org/10.3390/app8122659
Submission received: 26 November 2018 / Revised: 13 December 2018 / Accepted: 14 December 2018 / Published: 18 December 2018

Abstract

:
Empirical systems for the classification of rock mass are used primarily for preliminary support design in tunneling. When applying the existing acceptable international systems for tunnel preliminary supports in high-stress environments, the tunneling quality index (Q) and the rock mass index (RMi) systems that are preferred over geomechanical classification due to the stress characterization parameters that are incorporated into the two systems. However, these two systems are not appropriate when applied in a location where the rock is jointed and experiencing high stresses. This paper empirically extends the application of the two systems to tunnel support design in excavations in such locations. Here, the rock mass characterizations and installed support data of six tunnel projects are used. The back-calculation approach is used to determine the Q value using the Q-system support chart, and these values are then used to develop the equations and charts to characterize the stress reduction factor (SRF), which is also numerically evaluated. These equations and charts reveal that the SRF is a function of relative block size, strength–stress ratio, and intact rock compressive strength. Furthermore, the RMi-suggested supports were heavier than the actual installed ones. If the approximate inverse relation between stress level (SL) and SRF is used, the difference between the actual and the recommended supports increases when using the RMi-recommended rock support chart for blocky ground. An alternate system is made for support recommendation using a Q-system support chart. In this system, the ground condition factor is modified from the available parameters, and a correlation is developed with a modified Q system.

1. Introduction

For the purposes of rock engineering design, eight modeling methods have been categorized, including pre-existing standard methods, analytical methods, basic and extended numerical methods, precedent type analysis, empirical classification systems, the basic system approach, and the combined system approach [1]. The empirical classification systems that have been developed for rock mass are the backbone for empirical support design in tunnels, and are currently widely used. These systems have been continuously updated for this particular purpose. In 1946, Terzaghi was the first to develop a rock mass classification system, which was known as rock load factor classification, and a number of systems for rock mass quality determination have been developed since. These systems consider the most essential parameters affecting the rock mass behavior to rate its quality. In designing tunnel supports, the geomechanical classifications, which are also known as the Rock Mass Rating (RMR) system, the tunneling quality index (Q) system, and the Rock Mass index (RMi), are currently internationally accepted, and are widely used in the field of tunneling for preliminary support designs [2]. Originally, these empirical classification systems were developed, refined, and updated for the tunnel support [3]. However, they also have applications in other engineering projects such as mining [4,5,6,7], slopes [8,9,10,11,12], and tunnel-boring machine (TBM) tunnels [13,14]. Comparing the application of these systems for tunneling in high-stress environments, the Q and RMi systems are preferred over the RMR, because their parameters are more relevant for the purpose [15].
The Q-system classification was developed in 1974 [16], and major changes in its characterizations and classifications were made in 1993 and 2002 [17,18]. In characterization, the foremost changes include the modification of the stress reduction factor (SRF) and intact rock uniaxial compressive strength (σc), respectively. The system was initially developed for tunneling cases in hard and jointed rock mass [19], and thus, this system is more often applied in jointed rock mass [20]. However, its application in tunnel support design is limited to an equivalent dimension (De) ranging from 2.5 to 30, and a Q value ranging from 0.1 to 40 [21].
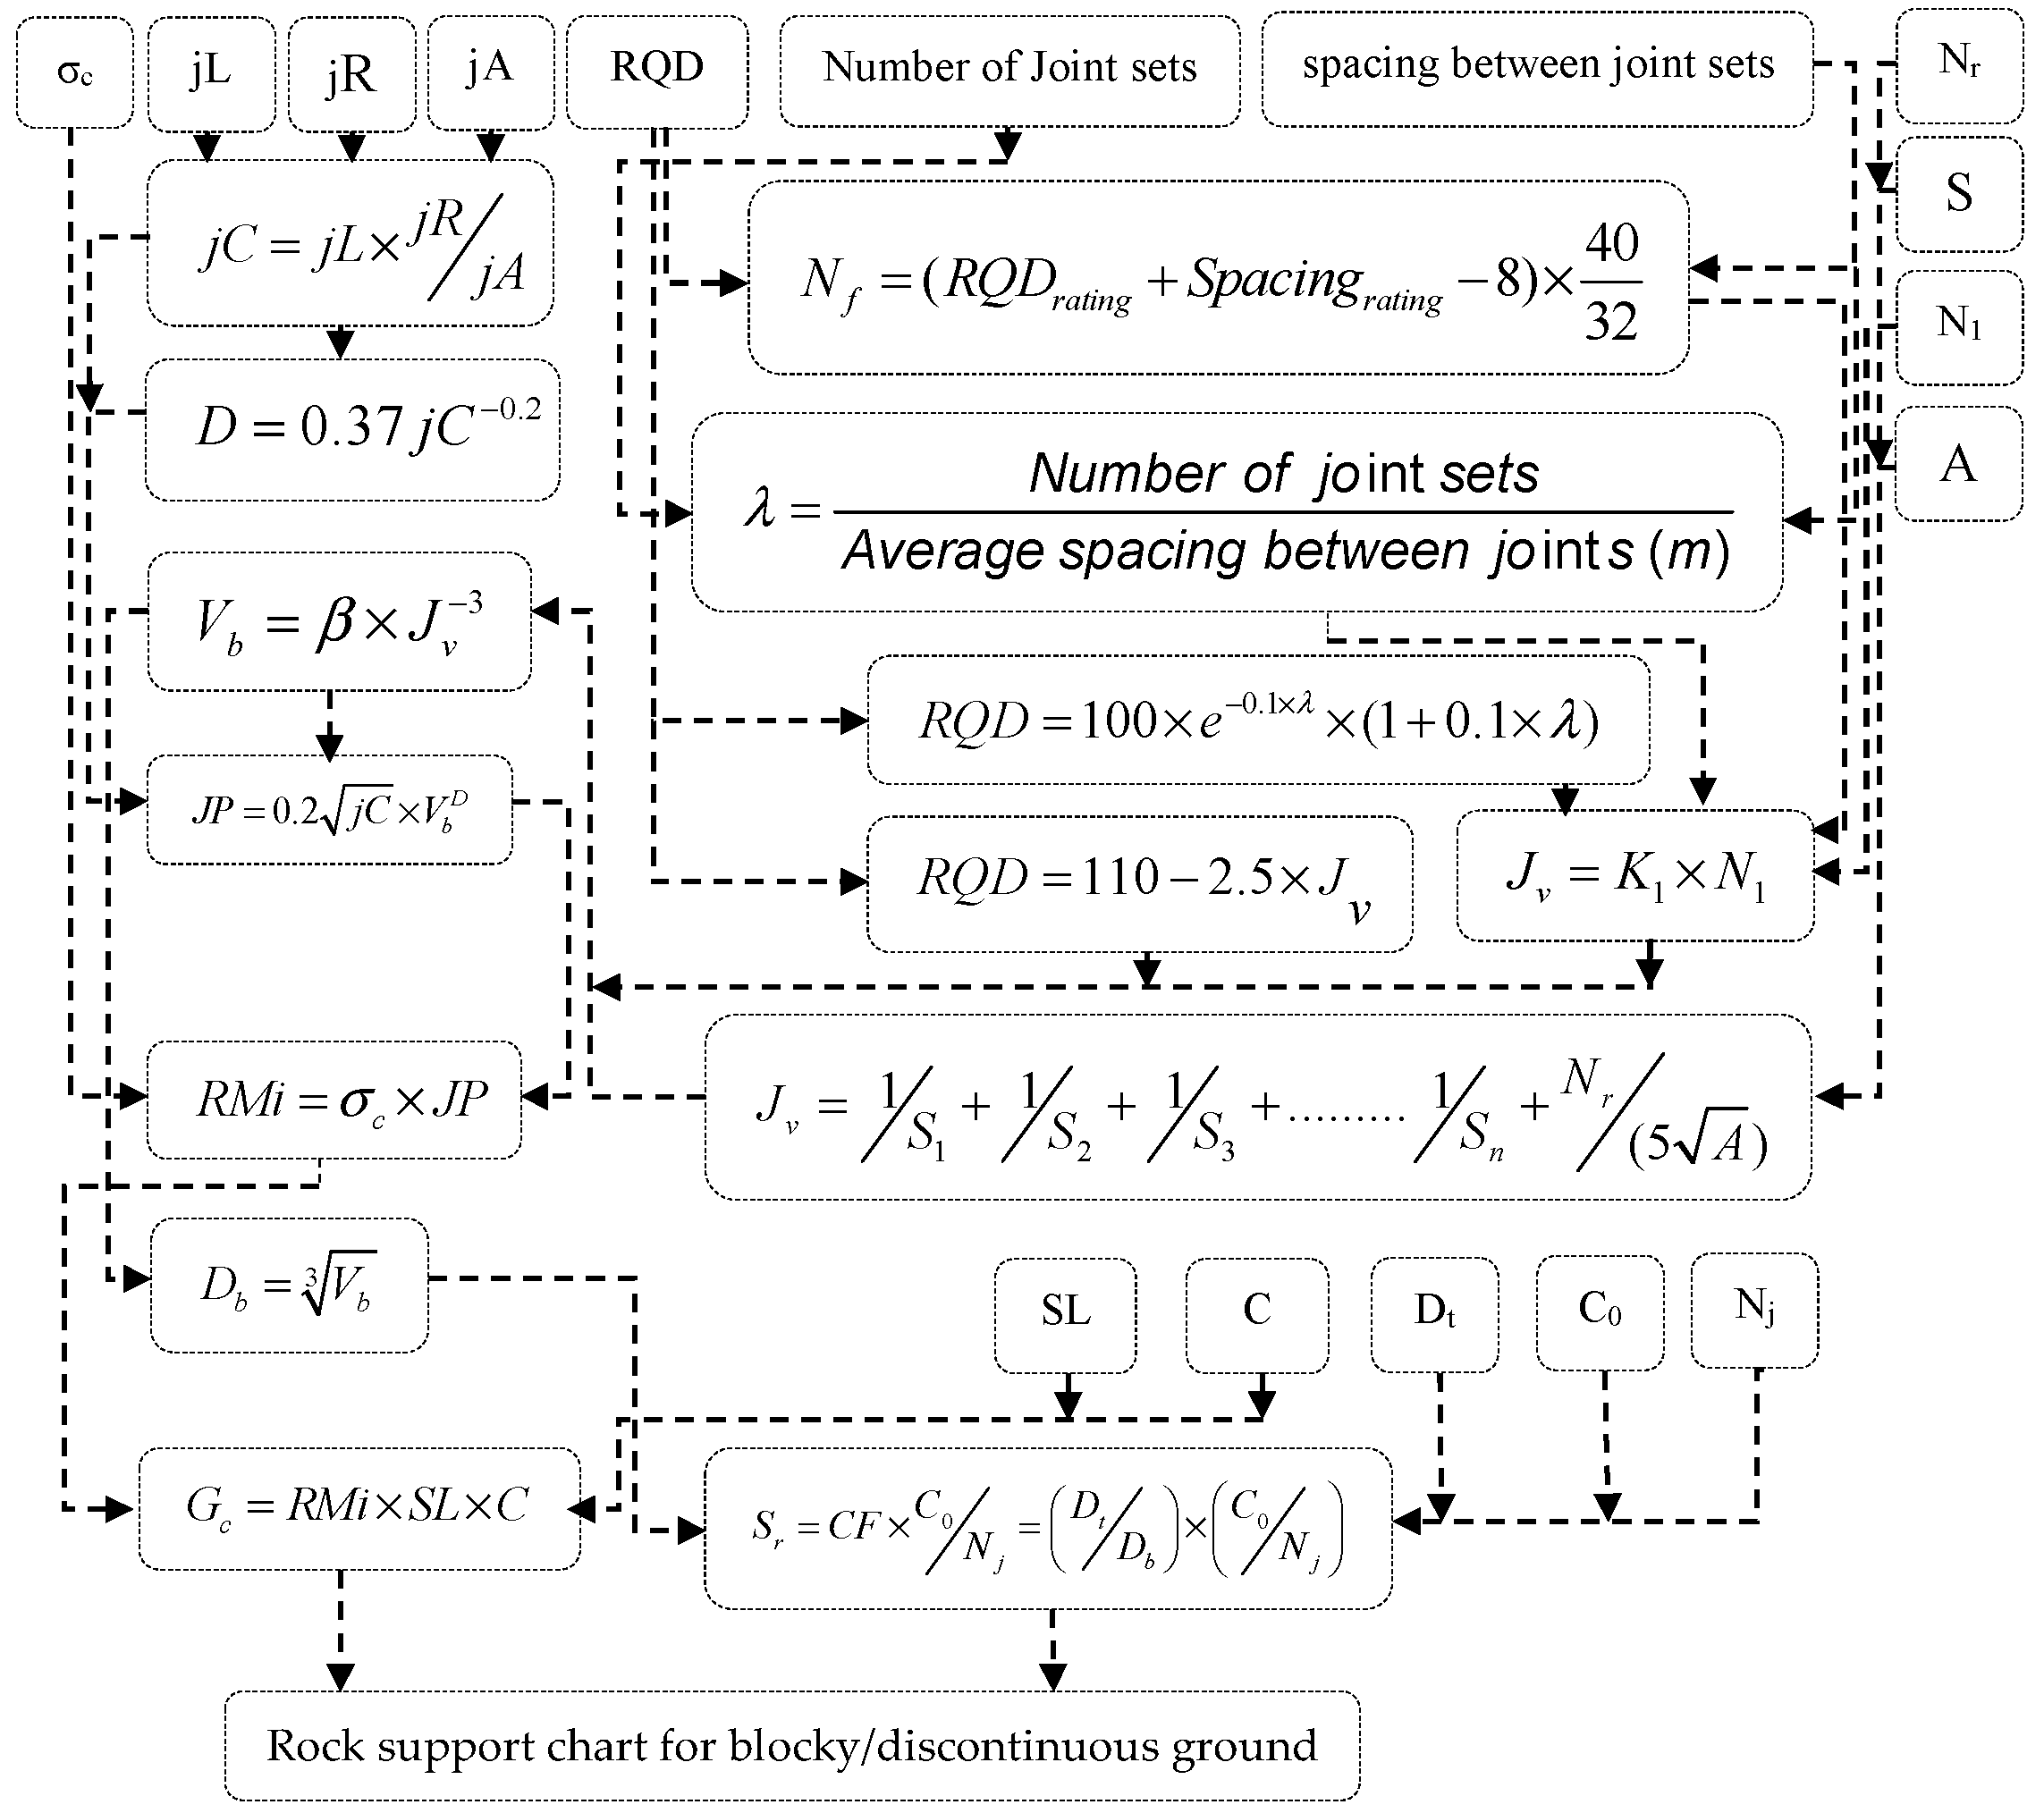
The Rock Mass index (RMi) system was proposed by Palmström in 1995 primarily for the reduced rock mass strength caused by jointing [22] and for rock support estimation in tunneling. The system was revised, and major developments and simplifications were made after five years of successful use and experience based on practical applications [23]. These simplifications are in terms of reduction in the input parameters and correlation between block volume (Vb) and volumetric joint count (Jv). This leads to easier and quicker calculations of the tunnel support parameters; i.e., the ground condition factor Gc and size ratio factor Sr, especially cases where limited field investigations have been performed.
In tunneling, in situ stresses are the key factors—besides rock mass and project-related features—that control the ground behavior, but empirical classification systems have limitations in application in high stress-environments [15,24]. The limitations of empirical classification systems, which are based on the ground behavior for underground excavation in rock engineering, are shown in Table 1. In comparing the Q system and RMi for preliminary tunnel support design in the case of high in-situ stresses, the Q system has a stress reduction factor (SRF) for the purpose, but it is limited to massive rock (Table 2) [17,25]. The RMi system uses stress level (SL) for the first three conditions of Table 2 for jointed rock mass, and has an inverse relation with SRF; it can also reveal that a high stress has a positive impact on the ground condition [22,23]. In high-stress rock mass environments, the presence of joints has a positive impact on tunneling [26], and for this reason de-stress blasting is successfully used as a rockburst preventive measure [27,28]. Neither system gives guidelines for SRF and SL in high-stressed jointed rock mass (the last three categories of Table 2), which is actually a limitation of the data on which these systems are based.
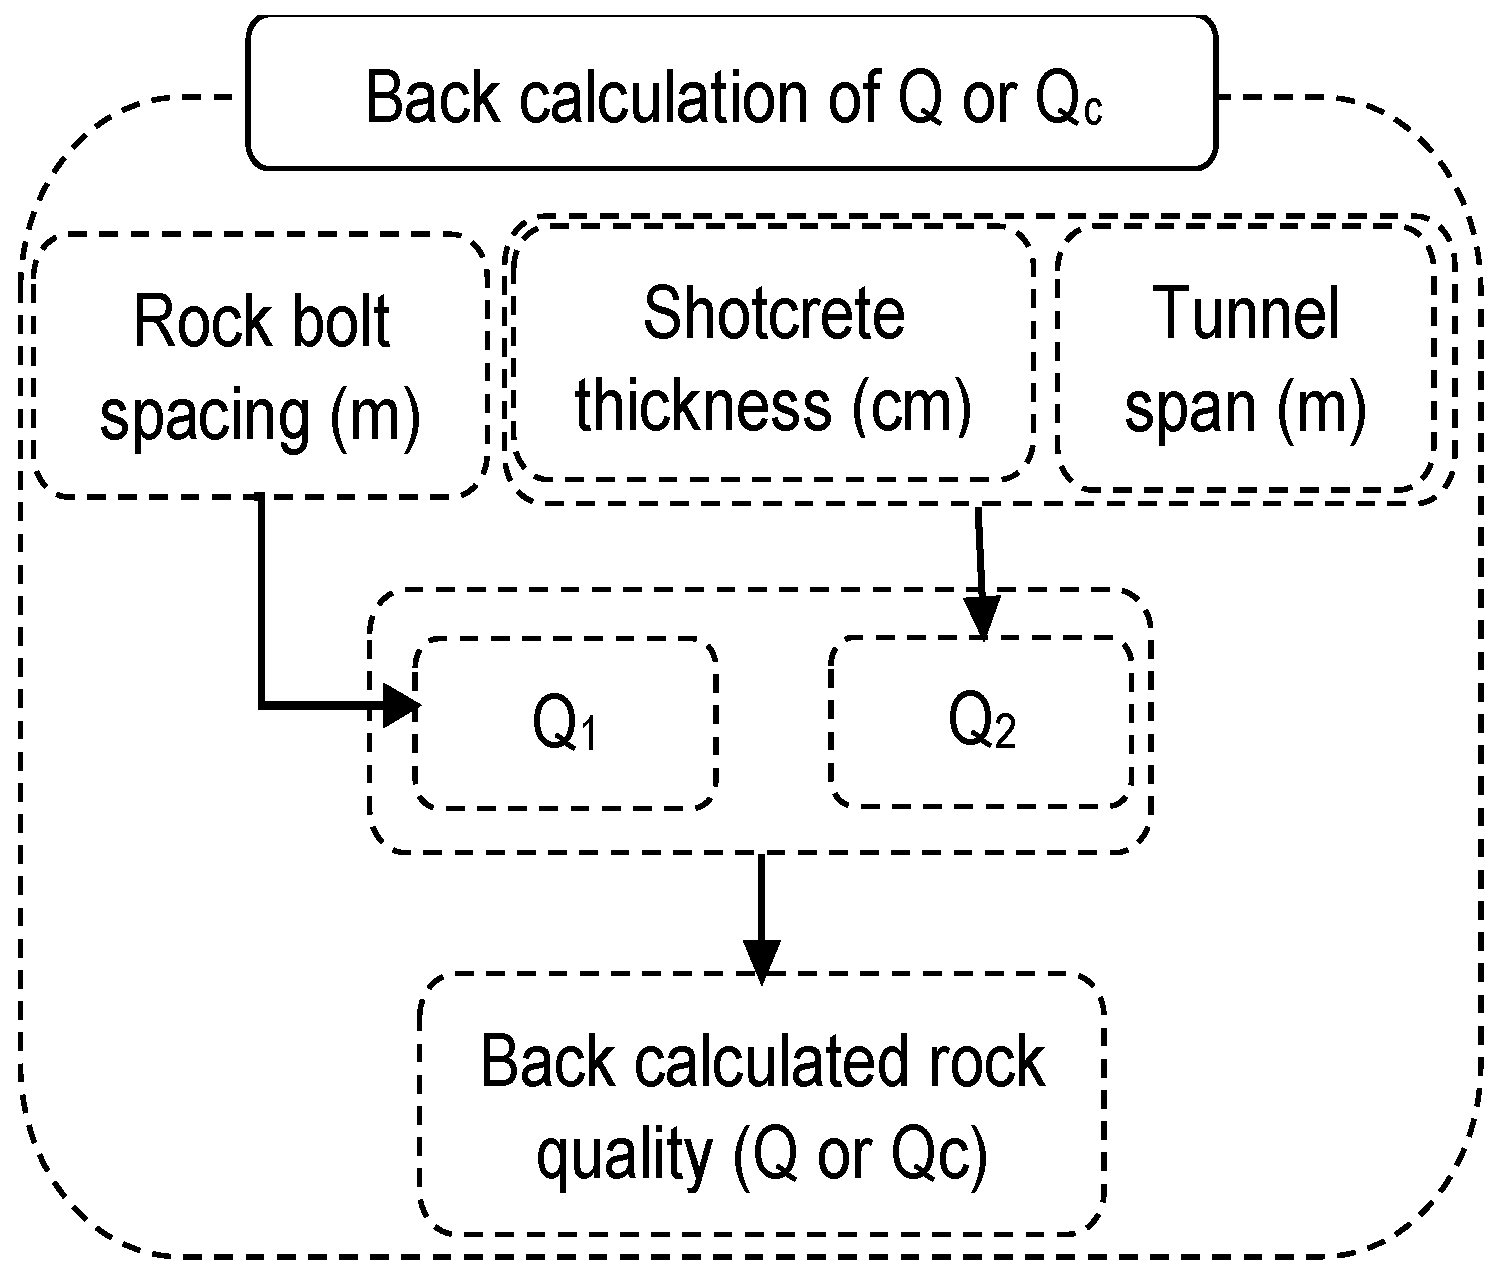
In this study, for the subclasses 4 and 5 of Table 2, application of the Q and RMi systems is extended from already-supported tunnel sections, which are excavated in high-stressed jointed rock mass. Equations and charts are recommended for the determination of SRF in order to extend the application of the Q system. An alternate approach of using the Q-system chart to recommend supports from a modified RMi system is taken.

2. Materials and Methods

From the tunneling viewpoint, the Himalayas pose the most challenging ground conditions in the world [29]. This mountain range is located in the north of the subcontinent and has great potential for hydropower generation; to harness this energy, deep tunneling here is the most tough job [30]. Along with these hydropower tunnels (completed, under construction, and planned), a number of road tunnels have also been completed recently in the northern part of Pakistan.

2.1. Project Descriptions

This section provides a brief overview of the six projects shown in Figure 1, whose data are used in this work. The first four projects are completed, and are presented in the manuscript as Project 1, 2, 3, and 4, which are based on the number of sections used in this work. The last two, Project 5 and 6, are the planned one, and their geotechnical data is used in the numerical modeling for validation.
Project 1
The Lowari Rail Tunnel (LRT) is 8.5 km, and is the longest transportation tunnel in Pakistan, connecting the north district, Chitral, with the remainder of the country for vehicle transportation on an all-weather link road. The cross-sectional design of the tunnel was modified by the National Highway Authority (NHA) of Pakistan after the excavation of the LRT (7.12 m in span), for a road tunnel and named the Modified Road Tunnel (MRT). This MRT (11.17 m in span) is a part of the extension of road network for connecting Central Asian countries with Pakistan through the Chitral district, traversing Vakhan (Afghanistan). The geological formation of the project area is located between the active Eurasian continental plate and the Indian plate, and due to the ongoing subduction of the Indian plate, this area belongs to the active seismic zone. Based on the geological investigations for the LRT, five major geological units were defined along the tunnel route: the granite unit, the meta sediment unit, the meta volcanic unit, the meta igneous unit, and the biotite granite unit [31]. The LRT and MRT were completed in 2009 and 2016, respectively, and became operational for traffic in 2017.
Project 2
The Neelum–Jhelum Hydroelectric Project (NJHEP) of the Water and Power Development Authority (WAPDA) of Pakistan is located in Muzaffarabad, within the Kashmir region in northeast Pakistan. A number of underground structures are part of this 969 MW run-of-the-river project, including a diversion tunnel, headrace tunnels, a tailrace tunnel, access tunnels, a powerhouse cavern, and pressure shafts. The 28.5-km headrace tunnels convey the water of the Neelum River and pass beneath the Jhelum River. These headrace tunnels are a combination of single and twin tunnels. The twin tunnels (each with a span of 9.68 m) were excavated by the conventional method and a tunnel-boring machine (TBM). These tunnels pass through the Murree Formation of alternating beds of sandstone (medium to fine-grained) and siltstone with layers of occasionally thin mudstone [30,32,33]. The sandstone (SS) is further divided into two subcategories, SS-1 and SS-2, based on their mechanical properties. SS-1 is made up of comparatively strong, well-cemented sandstone, of fine to medium grain. It is also thinly to thickly bedded, massive at places, blocky, moderately to closely jointed, and at places fractured [34].
Project 3
The Kohat Tunnel (KT)—also known the Pak–Japan Friendship Tunnel or simply the Friendship Tunnel—is an alternate route for traversing Kohat Pass in the Khyber Pakhtunkhwa province of Pakistan along the major national highway of NHA (known as the Indus highway), and follows the west bank of the Indus River. The 1.9-km, two-lane road tunnel was the first long road tunnel (9.4-m wide) in the country, and was open to traffic in 2003. Difficult geological sites were encountered during excavation. Along the tunnel route, the major rock types were limestone and shale [35].
Project 4
The Golen Gol Hydropower Project (GGHP) is the most recently completed 108-MW run-of-the-river project of the WAPDA. The project is located in the Chitral district, Khyber Pakhtunkhwa province, Pakistan. A number of underground structures, including a headrace tunnel, a pressure shaft, and a pressure tunnel, are the major components of the project. The total length of the 3.7-m wide single headrace tunnel for this project is 3.8 km. The maximum longitudinal section of the headrace tunnel passes through granite rock (2.8 m), followed by quartz mica schist, marble, and calcareous quartzite [36].
Project 5
Located at the boundary of the Khyber Pakhtunkhwa and Gilgit Baltistan provinces of Pakistan, the multipurpose planned Diamer Basha Dam project has a capacity of 4500 megawatts of hydroelectric power. The project is within a location where the subduction of the Indian plate beneath the Eurasian plate occurs and major rock types in this location is GN (gabbronorite) and UMA (ultramafic association) [37,38,39]. The planned 15.4-m span diversion tunnels on the right bank of the Indus River will be the first underground water passageway during the project construction.
Project 6
The planned Kohala hydropower project, a run-of-the-river project, is located on the Jhelum River in the Muzaffarabad district, Kashmir, Pakistan. The project includes a 17.5-km-long, 8.5-m span headrace tunnel for the generation of 1100 MW of electric power. Since the project is located in the same geological formation as Project 2, and also from local exploration, the expected major rock units will be SS-1 and SS-2 along the tunnel route [37]. The in situ stress measurement results show that high in situ stresses will be the major factor controlling the rock mass behavior [40].

2.2. Characterization of Rock Mass Based on the Q System

The tunneling data-based Q system categorizes rock mass into nine classes on a logarithmic scale, ranging in value from 0.001 to 1000 (exceptionally poor to exceptionally good, respectively). It is calculated through Equation (1) [16]:
Q = ( R Q D J n ) × ( J r J a ) × ( J w S R F ) ,
where RQD is the rock quality designation, Jn denotes the rating of the number of joint sets, Jr is the rating for the joint surface roughness, Ja denotes the rating for the degree of alteration or clay-filling joint set, Jw denotes the ratings for groundwater inflow and pressure effects, and SRF is the stress reduction factor. The ratio RQD/Jn is the relative block size in a selected domain, Jr/Ja is a measure of the inter-block frictional strength in that domain, and Jw/SRF is the effect of water, the strength–stress ratio, faulting, swelling or squeezing, and defined active stress.
The role of σc is substantial in the properties of rock mass. Therefore, a normalization factor was applied to Equation (1) and modified to Qc (Equation (2)) [18]:
Q c = ( R Q D J n ) × ( J r J a ) × ( J w S R F ) × ( σ c 100 ) .
The New Austrian Tunneling Method (NATM) approach, which considers the ground behavior, was used for the excavation and support of the tunnels in the first four projects. This approach also included the geological documentation in the construction of conventional tunneling [41]. Therefore, the available data from the excavation face mapping is appropriate for the characterization of the RQD, Jn, Jr, Ja, Jw, and σc.
Rockburst is a dynamic phenomenon that is linked with highly stressed environments in underground excavations. It is dominant in massive rock, and excavation in jointed rock mass has a positive impact under the same stress state as compared to massive rock. The increase in SRF that is shown in Table 2 is for massive rock based on RQD/Jn [17]. In jointed rock mass, the extreme value of the old SRF (1974 version) is proposed [42]. Equation (3) [43] and Equation (4) [42] are based on mining cases in South Africa and Australia, respectively, for the characterization of SRF (1974 version) for competent rock having rock stress problems.
S R F = 0.244 × K 0.346 × ( H σ c ) 1.322 + 0.176 × ( σ c H ) 1.413
S R F = 31 × ( σ 1 σ 3 ) 0.3 × ( σ c σ 1 ) 1.2
The average unit weight of the intact rock for maximum sections of the first four projects in this study is about 0.027 MN/m3. Equation (3) can be rewritten as Equation (5):
S R F = 28.29 × ( σ 1 σ 3 ) 0.346 × ( σ c σ 1 ) 1.322 + 0.00107 × ( σ c σ 1 ) 1.413
Equation (6) was developed for the calculation of SRF in the Q system using the data of the Nathpa Jhakri project in India [44]:
S R F = 5.84 × ( σ c H ) 0.001 × ( J r 3 J n ) + 2.58 .
Equation (6) can be rewritten, with 0.027 MN/m3 as the unit weight of the rock, as Equation (7):
S R F = 5.82 × ( σ c σ 1 ) 0.001 × ( J r 3 J n ) + 2.58 .
Barton [18] divided the rock mass into massive and jointed, based on its RQD/Jn ratio, and revealed that a massive rock can have a ratio from 25 to 200, while a jointed rock mass has a typical ratio of 10. According to the rock mass fabric index approach, the maximum limit of the RQD/Jn ratio for a jointed rock mass is 16.5 [45]. The relationship between the RQD/Jn ratio and SRF in hard rock under high stress directs that, for jointed rock mass, the SRF value that was suggested for massive rock in Table 2 is too high [17]. The Q-system parameters were characterized for those selected sections where the RQD/Jn ratio <16.5, and the intact rock strength to the major principal stress ratio (σc/σ1) is in the range of two to five.
The characterization parameters of Equation (2) for the first four projects are tabulated in Table 3, and details of RQD/Jn and σc/σ1 are displayed in Figure 2. In Figure 2a, the strength–stress ratio is in the range of two to five for Project 1 and 2. The data statistics show that all of the sections of Project 3 experienced a strength–stress ratio higher than 3.5. In the case of Project 4, this ratio is less than 3.5. In Figure 2b, the relative block sizes in the majority of the sections are in the range of six to eight.

2.3. SRF Calculation Through Back Analysis

A back-analysis procedure for the Q-value calculation of rock mass, as shown in Figure 3, was suggested using the installed rock bolts and fiber-reinforced, sprayed shotcrete [46]. The back-calculation is explained through Example 1 for the calculation of the Q value. The latest support chart of the Q system [19] is used for the back-calculation for all of the sections of the four projects. The support chart indicated that the shotcrete thickness is a function of De, in addition to the rock quality (Q or Qc); however, rock bolt spacing (Sb) is a function of rock quality only. This spacing of rock bolts was used for the back-calculation of the tunneling quality index (Q1). The thickness of the fiber-reinforced shotcrete is a function of the tunnel span and the tunneling quality index. The thickness of the fiber-reinforced shotcrete, along with the tunnel span, was also used for the back-calculation of the tunneling quality index (Q2). The De is the ratio of tunnel width/span and the excavation support ratio (ESR). The ESR value depends on the country safety standards [20] as well as on the quality of the rock mass [19]. The relation of rock bolt length (Lb) to De for hydropower tunnels, i.e., Project 2 and Project 4, reveals that a value of one for ESR is an appropriate rating for headrace tunnels, and was also used in this study.
Example 1
  • Tunnel span or De (m) = 11.17
  • Rock bolt spacing (m) = 1.6
  • Shotcrete thickness (cm) = 9
  • Q1 = 0.7
  • Q2 = 1.7
  • Q or Qc = 1.03
Although the modified Q value (Qc) was due to the additional normalized factor in Equation (1), the support chart remained unchanged. The resultant tunneling quality index from back analysis was defined as Q or Qc. Equations (1) and (2) were rearranged to Equations (8) and (9), respectively, and two different SRFs (SRFQ or SRFQC) were calculated, taking the back-calculated rock quality value of either Q or Qc, respectively.
S R F Q = ( R Q D J n ) × ( J r J a ) × ( J w Q )
S R F Q C = ( R Q D J n ) × ( J r J a ) × ( J w Q c ) × ( σ c 100 )

2.4. RMi System and Tunnel Support Design

2.4.1. Rock Mass Characterization by RMi System

The RMi system is a relative strength index for rock masses that numerically expresses the quality of the rock mass. The principle of this system is based on the reduction of σc due to the penetrated joints. The RMi system indicates the approximate uniaxial compressive strength of a rock mass by combining σc and a jointing parameter (JP) using Equation (10):
R M i = σ c × J P = σ c × 0.2 j C × V b D ,
where:
  • σc = Intact rock uniaxial compressive strength
  • JP = Joint parameter (a parameter that combines the main joint features in the rock mass)
  • jC = Joint condition factor (Equation (12))
  • Vb = Block volume (m3)
The superscript D in Equation (10) is defined through Equation (11):
D = 0.37 j C 0.2 .
In the RMi system, JP is a function of Vb and jC. The jC can be estimated by joint roughness (jR), joint alteration (jA), and joint size/length (jL) using Equation (12):
j C = j L × j R j A

2.4.2. Tunnel Support Design by RMi System in Discontinuous Ground

By definition, RMi is the uniaxial compressive strength (UCS) of rock mass, which only includes the inherent features affecting its strength. RMi has various applications in rock engineering, including tunnel support design. After the effective use of RMi in the tunneling field, some significant changes and adjustments for estimating preliminary rock supports by using the block volume and tunnel diameter were made [23]. The stability in blocky (jointed) ground is mainly influenced by the block size and shape, the shear strength of the joints delineating the blocks, and the orientation of the same joints relative to the tunnel axis. For the support application, RMi and tunnel span were adjusted based on the ground condition factor (Gc) and the size ratio factor (Sr), respectively, using Equations (13) and (14), as shown in Figure 4. The support parameters, which include all of these features, are used in the support chart.
G c = R M i × S L × C = σ c × 0.2 j C × V b D × S L × C
S r = C F × C 0 N j = ( D t D b ) × ( C 0 N j )
Here:
  • SL = Adjustment parameter for stress level
  • C = Gravity adjustment parameter for support in the roof or wall
  • CF = Continuity factor, which is the ratio of the tunnel diameter (Dt) and the block diameter (Db), differentiating between continuous and discontinuous ground and discontinuous ground having CF in the range from five to 100
  • C0 = Adjustment for joint orientation
  • Nj = Adjustment for number of joint sets
The RMi system uses more parameters than the Q system, and it is relatively more complicated to use than the Q system. According to Palmström and Stille [15], the groundwater factor is not properly included in the RMi system.
In this study, the rating for jL is equal to one, because the persistence of joints is from three to 10 m. According to the Q system [19], support at the wall and roof is independent of its location in a high-stress environment; therefore, the rating for the gravity adjustment factor (C) is also one. The ratings for joint roughness and joint alteration show that there are four different cases based on the Jr/Ja and jR/jA values, as shown in Table 4.
The RMi system uses block volume, which is formed by joints in a three-dimensional network in an underground environment. This parameter is usually determined on a two-dimensional surface or by a one-dimensional borehole or scan line. Only a limited part of a joint can be correctly measured in a given location, and the direct characterization of each block size is not practical at the excavation face. Since it can be difficult to recognize the actual size and shape of individual blocks, the block size and shape must sometimes be determined from reasonable simplifications. Indirect approaches are used for the determination of block size. The generalized correlation between the block volume (Vb) and the volumetric joint count (Jv) is given in Equation (15), where block shape influences the correlation [47]:
V b = β × J v 3 ,
where β is the block shape factor, which depends on the ratio of the longest and shortest dimension of the block; the common value is 36. Jv is the number of joints intersecting a volume of one m3.
Based on Jv, the degree of jointing is classified into six classes, from a very low degree of jointing (Jv < 1) to crushed rock (Jv > 60). Random joints may represent a significant part of the total number of discontinuities, and neglecting them would lead to the erroneous quantification of the discontinuity nature of the rock mass [48]. A rule of thumb for the calculation of Jv is given in Equation (16) [49]:
J v = 1 S 1 + 1 S 2 + 1 S 3 + 1 S n + N r ( 5 A ) ,
where S1, S2, and S3 are the average spacings for the joint sets, Nr is the number of random joints in the actual location, and A is the area in m2.
It is not possible to measure all of the joints in a unit volume. An alternate method to find Jv is from RQD or the joint frequency, as given in Equations (17) and (18) [22,47]:
R Q D = 110 2.5 × J v
J v = K 1 × N 1 ,
where K1 = 2 for the average condition, and N1 is the number of joints per unit length (joint frequency).
Joint frequency can be calculated directly or determined indirectly. The first indirect methodology used for fracture frequency is the mathematical equation between RQD and fracture frequency [50], which is given as follows:
R Q D = 100 × e 0.1 × λ × ( 1 + 0.1 × λ ) ,
where λ is the joint frequency.
Another method to determine the joint frequency is to use RQD and the joint spacing rating, by using Equation (20) [51] as follows:
N f = ( R Q D r a t i n g + S p a c i n g r a t i n g 8 ) × 40 32 ,
where Nf is the fracture frequency rating. The joint frequency can be calculated from Nf using a graph of rating for the discontinuity density [52].
In this case, when the data are available both in terms of the number of joint sets and the average spacing between the joints of each joint set, the joint frequency is determined using Equation (21) as follows [46]:
λ = Number   of   joint   sets Average   spacing   between   joints   ( m ) .
The details of the ground conditions based on the RMi system for all of the sections of the four projects are summarized in Table 5.

3. Results

3.1. Back-Calculated SRF Comparison with Previous Work

Equations (3) through (7) are for the SRF characterization of Equation (1); therefore, the back-calculated SRFQ values are compared with them. For the given values, Equation (4) gives a higher value of SRF than Equation (5). This exponential Equation (4) agreed with Barton for the calculation of SRF in highly stressed jointed rock mass [53]. The second part of Equation (5) has a negligible effect on the SRF value for σc/σ1 < 5. SRF was calculated from Equation (4) for different field stress ratios, and the details of the differences compared with back-calculated SRF (SRFQ) values are shown in Figure 5.
Due to the superscript value (0.001) in Equation (7), the variation of SRF is negligible with σc/σ1.

3.2. Suggested SRF for Highly Stressed Jointed Rock Mass

The back-analysis approach is used for the tunneling quality index calculation, using the procedure shown in Figure 3, and taking this value as Q. The SRF calculated from Equation (8) is defined as SRFQ for all of the sections. The SRFQ values are plotted against RQD/Jn for different σc/σ1 values, as shown in Figure 6a. These values are also plotted against σc/σ1 for different RQD/Jn values, as shown in Figure 6b. A strong relationship was found between SRFQ and RQD/Jn and σc/σ1. The relations between SRFQ, RQD/Jn, and σc/σ1 were used, and Equation (22), a new empirical equation, was developed:
S R F Q = 2.054 exp ( 0.205 R Q D J n ) + 14.865 exp ( 0.41 σ c σ 1 )
The tunneling quality index obtained from the back analysis is taken as Qc, and the SRF value calculated from Equation (9) is taken as SRFQC. This SRFQC value can also be obtained from Equation (23), using the normalized factor:
S R F Q C = ( S R F Q ) × ( σ c 100 ) .
The resultant SRFQC values calculated from Equation (9) or Equation (23) were plotted against RQD/Jn for different σc values and ranges of σc/σ1. The variation in SRFQC with RQD/Jn is shown in Figure 7.

3.3. Comparison of the Actual Installed Supports against the RMi-Suggested Supports

In the RMi system, the suggested rock support chart that was developed for blocky ground is based on CF (5 < CF < 100); therefore, only the sections that satisfy these limitations are considered here for rock support determination using the RMi system. Since the minimum value of CF is 7.84 in Table 5, cases with CF >100 are omitted. After applying these limitations, details of the Jv classification are given in Figure 8.
Comparing the actual installed supports with those suggested by RMi, out of the 49 sections of Project 3, only a single section showed that the actual rock bolt spacing was closer (5.88%) than the RMi-suggested spacing. In Project 4, the RMi system suggested rock bolt spacing of 2.5 m for five sections, but the actual spacing was 1.7 m. In Project 2, five sections were supported with rock bolts spaced at 1.4 m and shotcrete that was 12 cm thick, but the RMi system suggested a special design for these sections. The details of all of the sections of the four projects in terms of the difference (%) in rock bolt spacing and shotcrete thickness are shown in Figure 9.

3.4. Tunnel Support Design by RMi System on Discontinuous Ground Using the Q-System Support Chart

As shown in Table 6, SL ≈ 1/SRF [22]. If this relation for SL characterization in highly stressed, jointed rock mass is used, the already heavier supports suggested by the RMi system would be further increased. Since the SRF calculation was based on the Q-system support chart, an attempted has been made to use it for the RMi system, again in this particular case of a highly stressed, jointed rock mass.
The modified Q system from Equation (2) can be rewritten as Equation (24) using c = Jr/Ja. Similarly, the ground condition factors in Equation (13) can be rewritten as Equation (25) by introducing Nj and C0 into it from Equation (14), and replacing Vb in terms of RQD using Equation (17). The constants a and b depend on jR/jA:
Q c = ( c 100 ) × ( R Q D J n ) × ( σ c S R F ) × ( J w )
G c = a × ( σ c S R F ) × ( 1 ( 110 R Q D ) b ) × ( N j C 0 ) ,
where SRF = f (σc, σc/σ1 and RQD/Jn), and the constants a, b, and c are given in Table 7, depending on the case number as in Table 4.
As Jw and C0 are not properly included in the RMi and Qc systems, respectively [15,18], taking Jw = one (dry condition) and C0 = one (favorable joint orientation), the above two equations are based on the same parameters as the relation of Nj, and the number of joint sets is given in Equation (26) [23]:
N j = 3 n j ,
where nj is the number of joint sets.
The ratio between G c and Qc can be developed from the available data using Equations (24) and (25), keeping the limitations of the data of the four projects in this study.
Knowing the ratio, Table 8 can be used to adjust G c for joint orientation and corresponding Qc. This Qc value is then adjusted for Jw and used for the recommended support from the Q-system support chart. Ultimately, the groundwater factor is included in the RMi system and C0 is included in the Q system.

4. Numerical Modeling

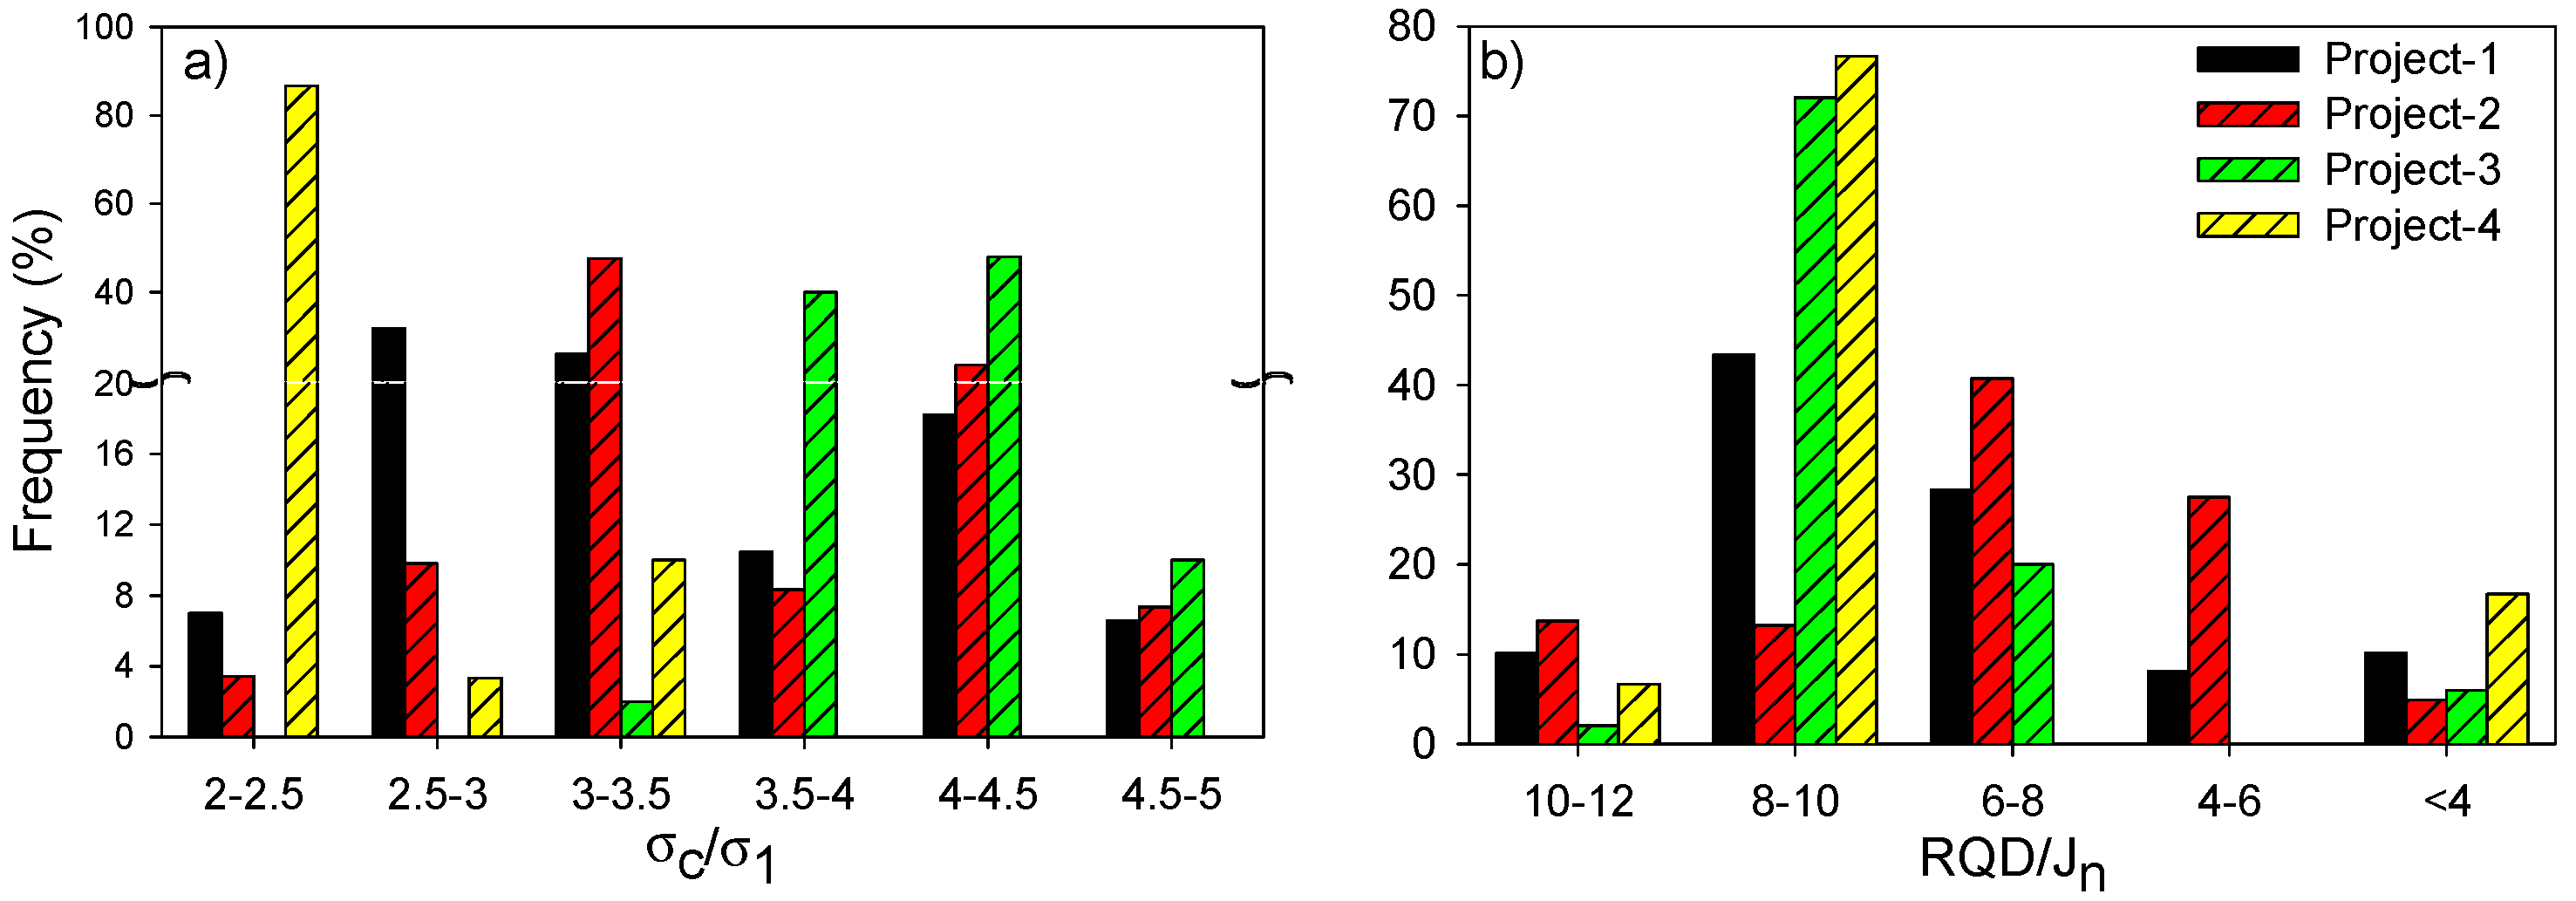
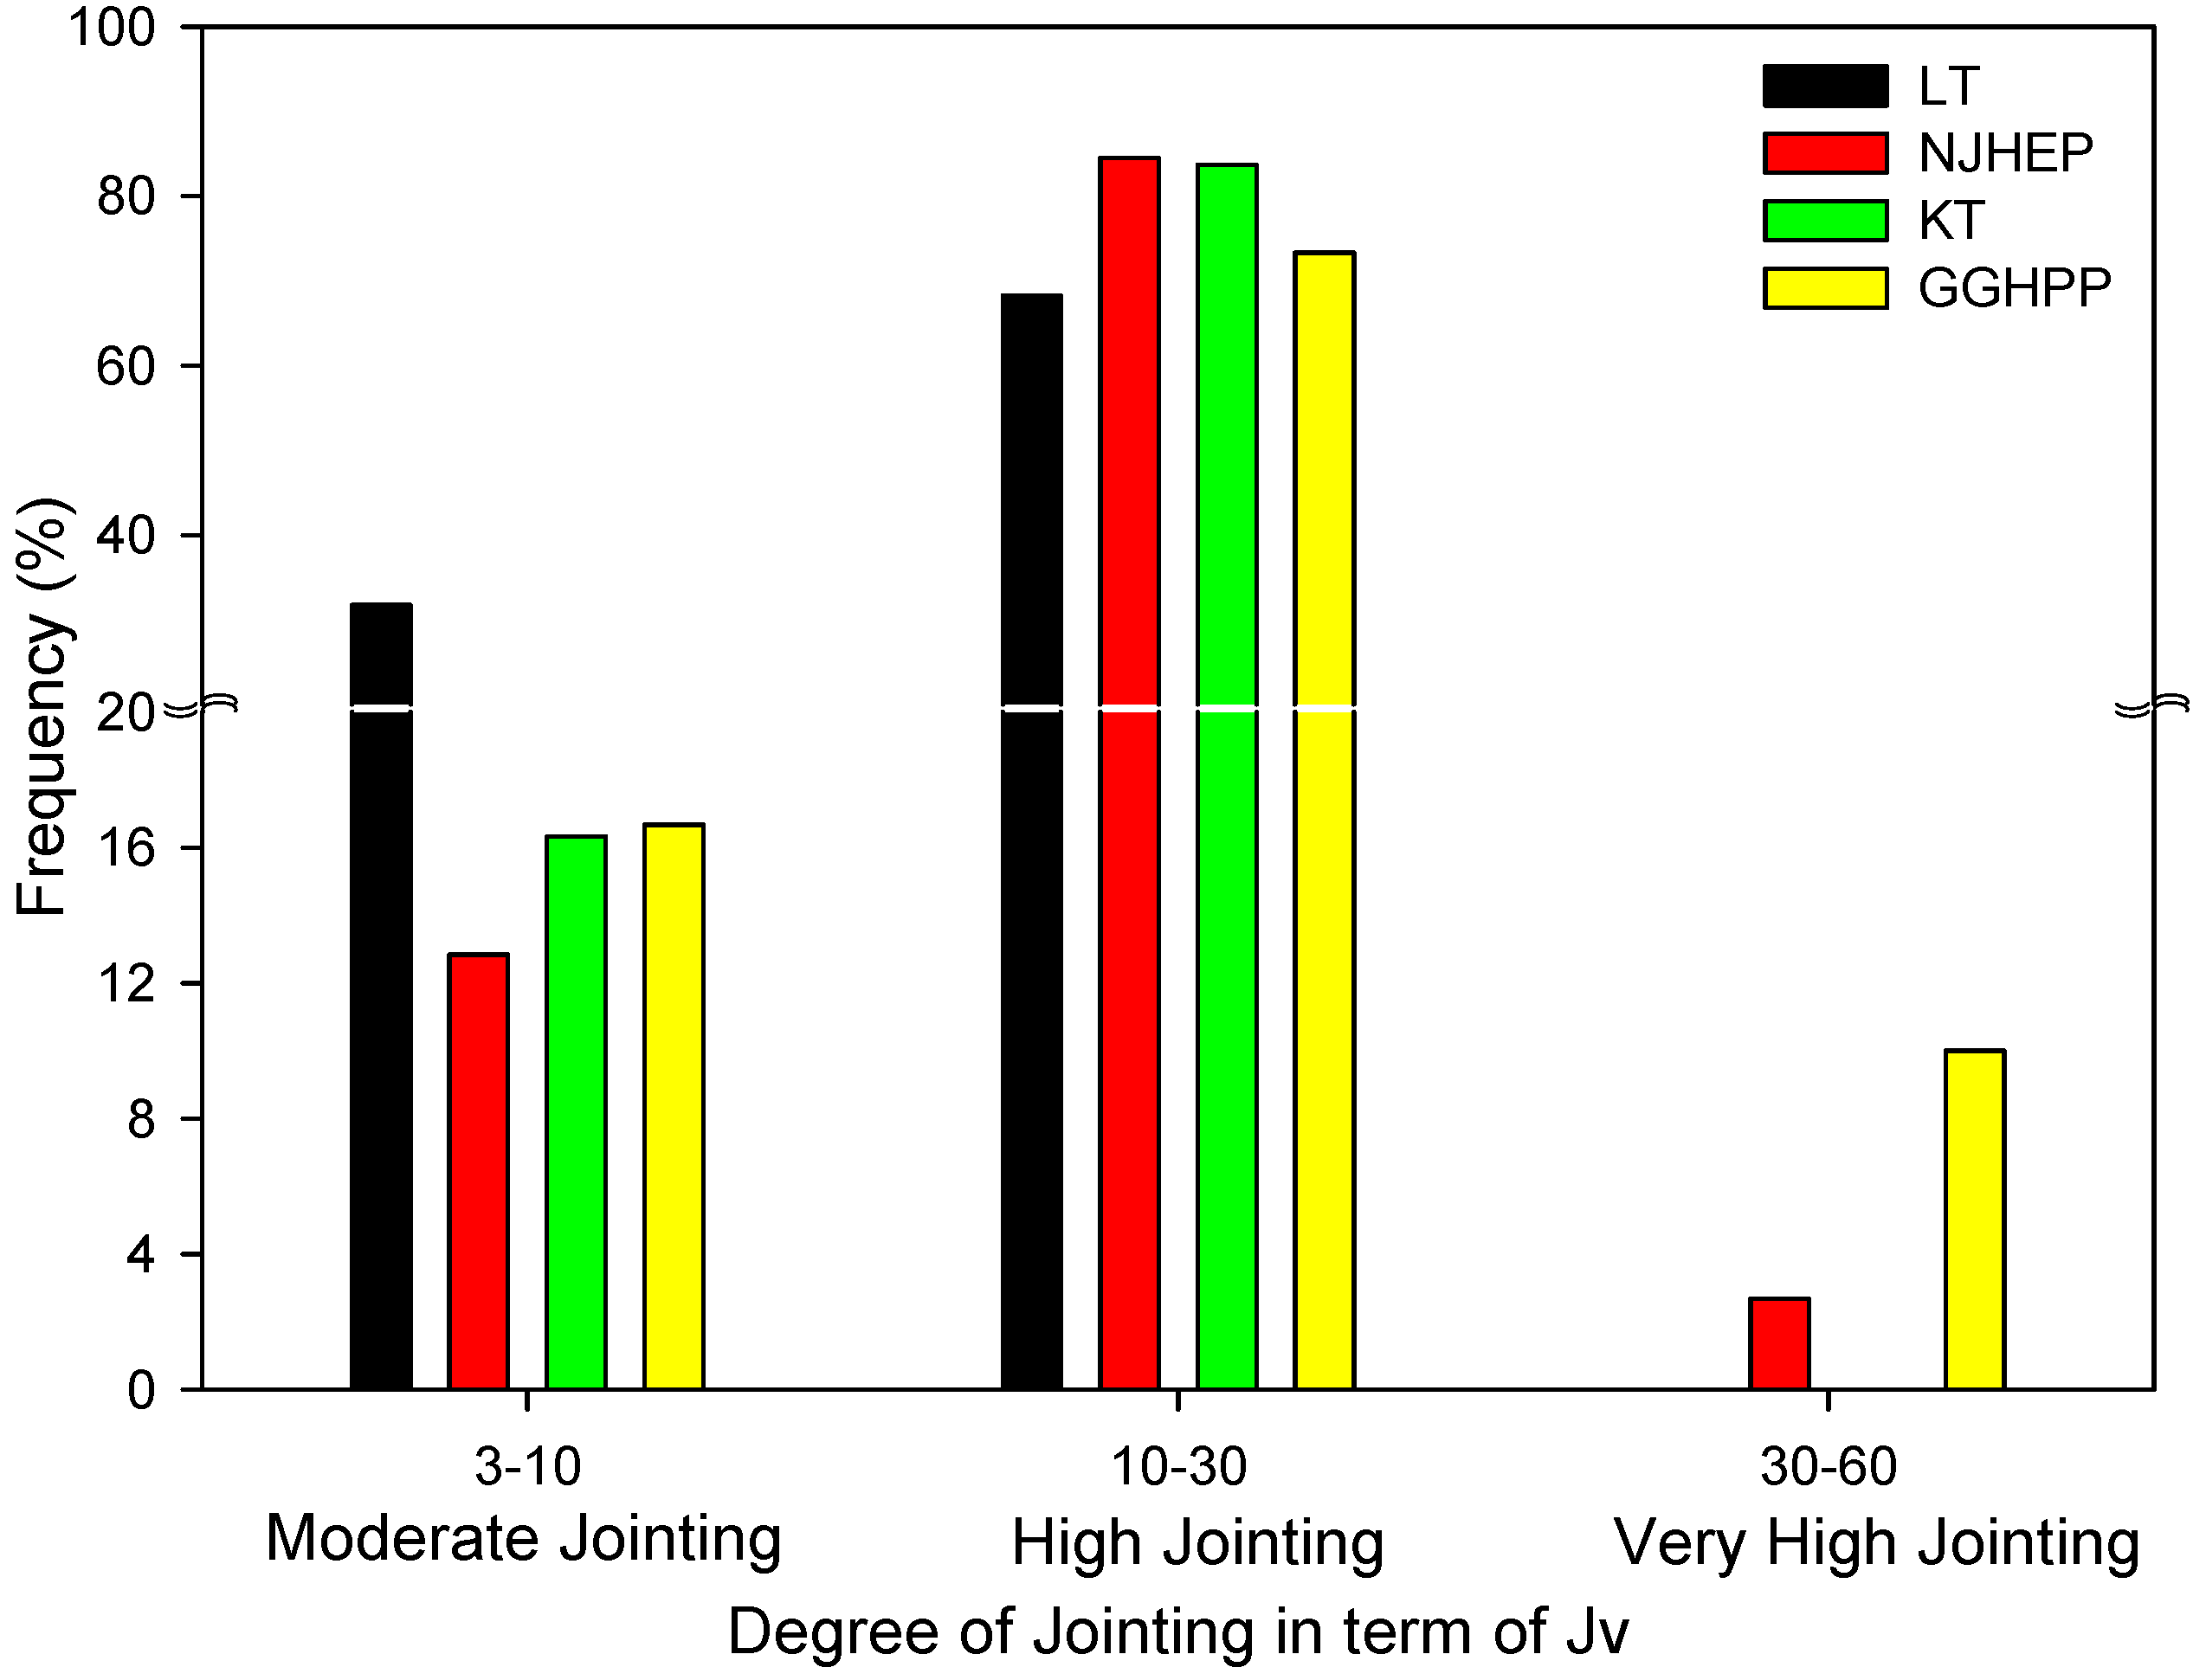
The results from seven boreholes (BDR-08, 10, 21, 22, 24, 25, and 26) along the diversion tunnels of Project 5 show that 75% of the RQD/Jn values were less than 16.5, and only 7.6% of the RQD/Jn values were greater than 25. Similarly, for Project 6, of 13 boreholes (BH-01, 02, 03, 04, 05, 08, 09, 10, 11, 12, 13, 15, 26), in most of them, the degree of jointing was high to very high, resulting in RQD < 50%. Only BH-09 and BH-26 in Project 6 had predominantly moderate jointing, which corresponds to a range of RQD from 50% to 75% [37]. For simplicity and to reduce the number of cases that were numerically evaluated, Jr = 3, Ja = 1, and Jw = 1 were used for empirical support design.
The average properties of the intact rock for different rock types of projects 5 and 6 are given in Table 9.
For the numerical validation of Equations (22) and (23), different overburdens were used for different scenarios of σc/σ1, within the limitations of this study (5 > σc/σ1 > 2). For different RQD/Jn and σc/σ1 values, SRF values were determined using Equations (22) and (23). Based on the calculated tunneling quality index (Q or Qc) from Equations (1) and (2), preliminary supports were determined from the support chart of the Q system; the details are shown in Table 10.
Table 11 shows the rock mass properties that were extrapolated from the intact rock strength properties of Table 9, and the geological strength index (GSI) values through the generalized Hoek–Brown failure criterion [54]. The GSI values that are shown in Table 11 are for the particular cases of Table 10, and are based on the rock mass fabric index approach, which was calculated from RQD/Jn and Jr/Ja values [45].
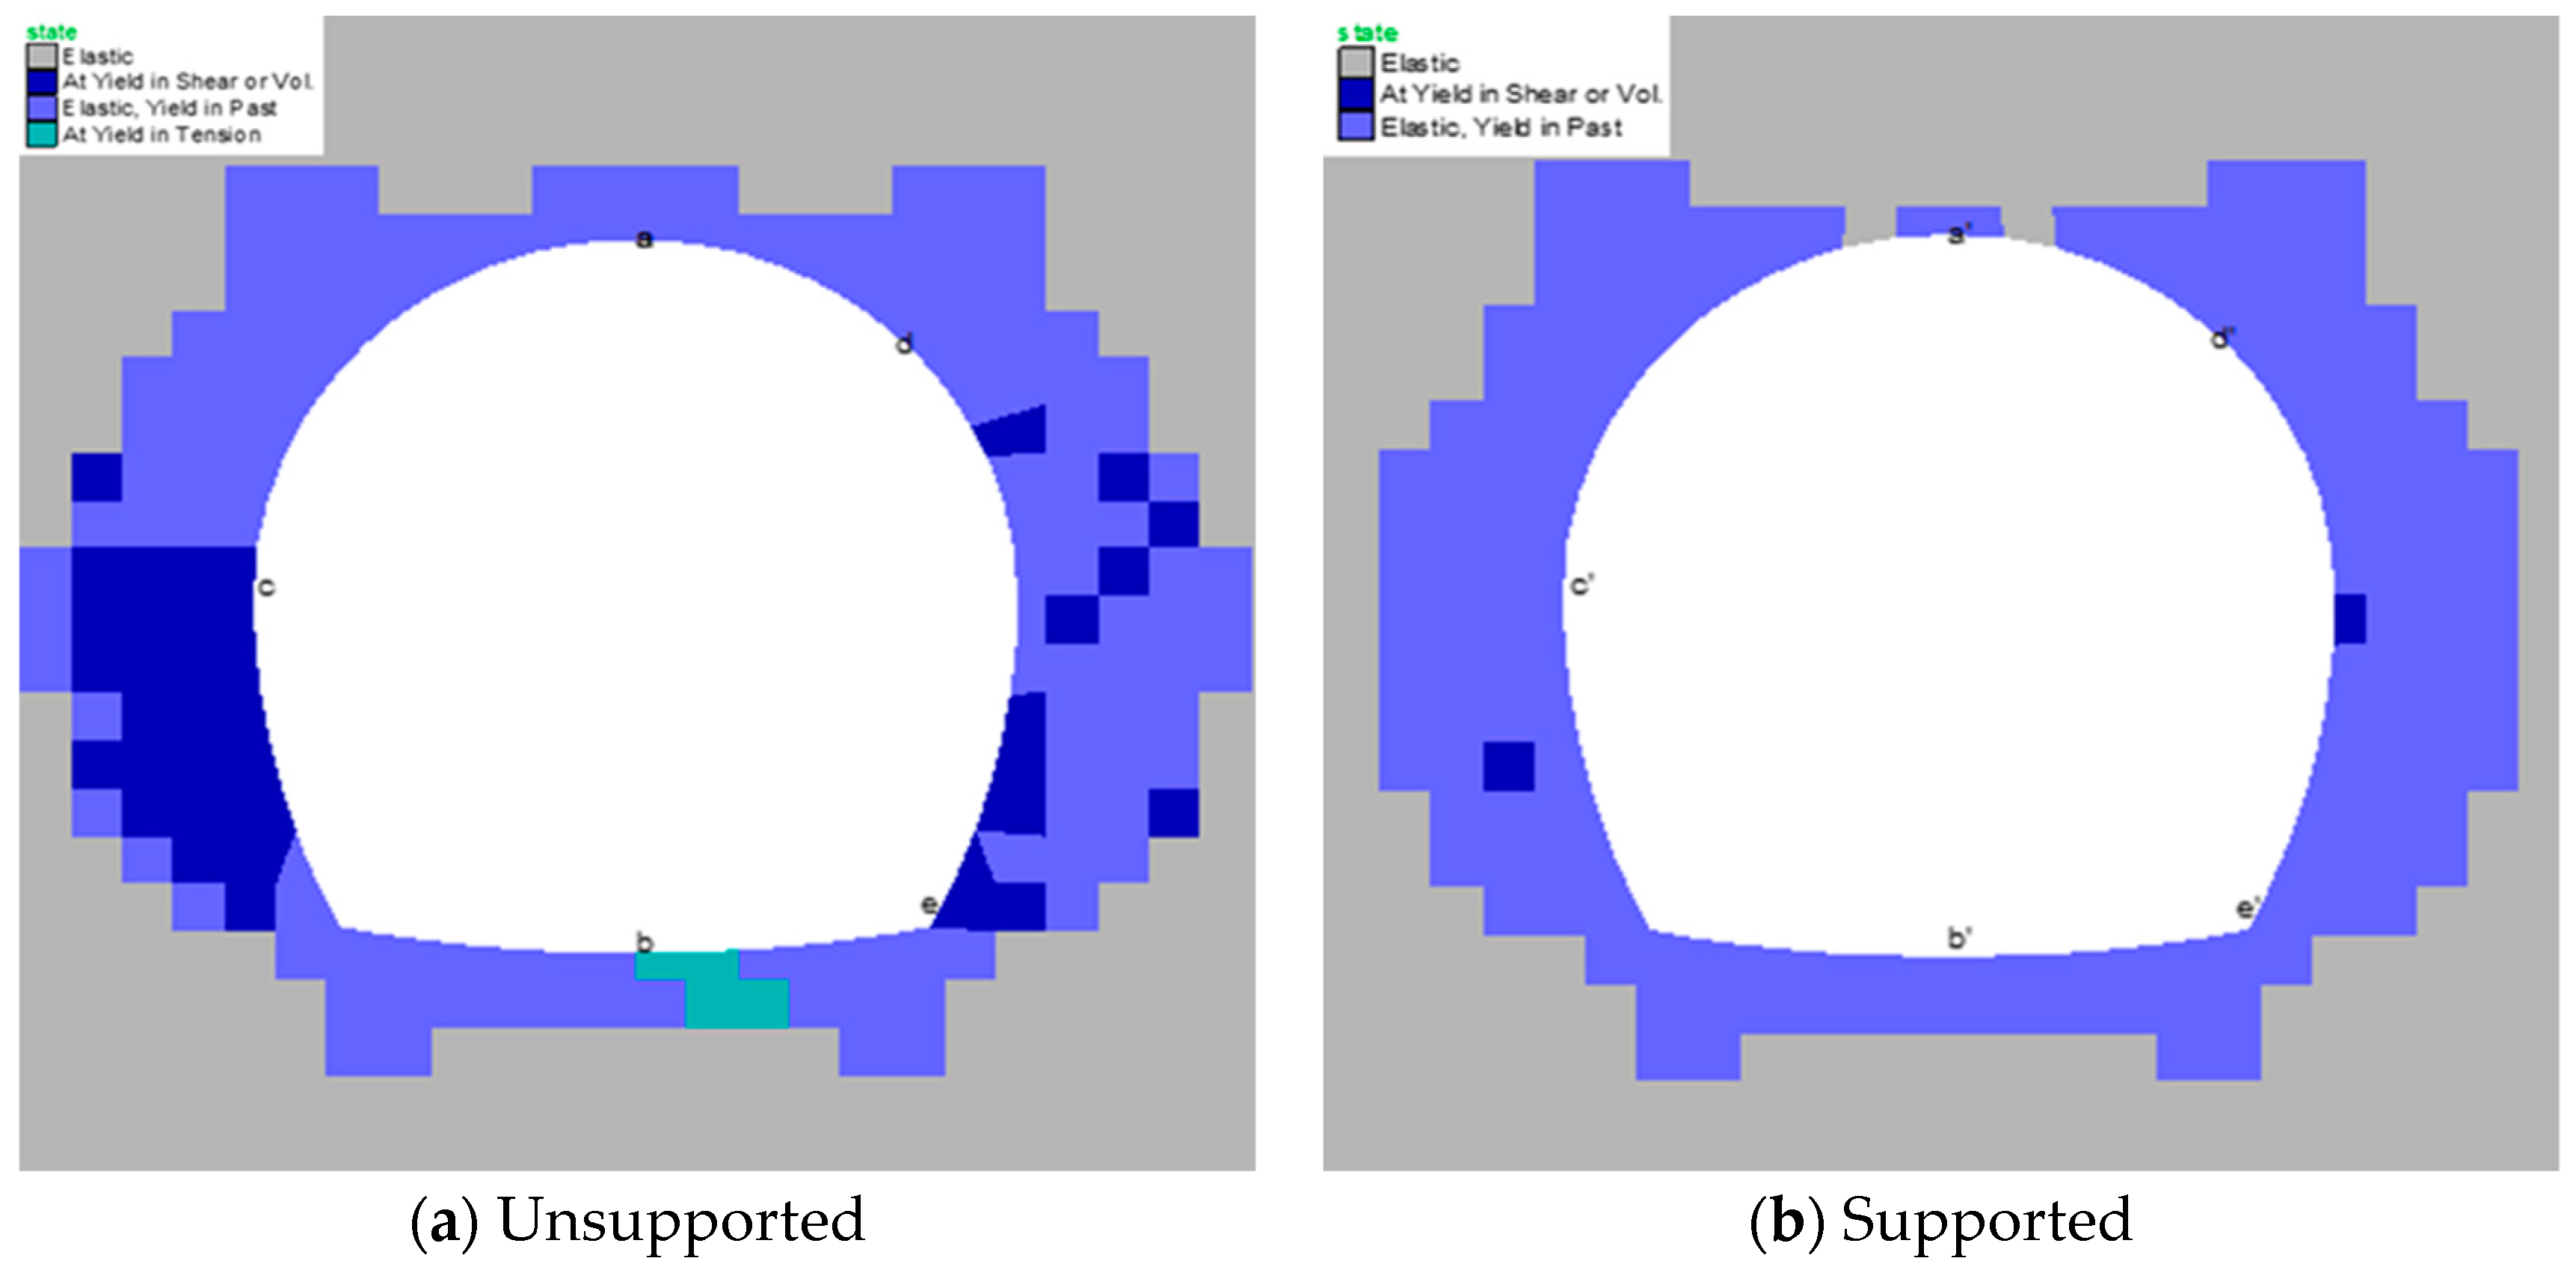
The empirically determined support system was used in numerical modeling to analyze the results before and after the support in terms of the plastic zones in the vicinity of the tunnels and displacement in rock mass. The total displacement at different points along the tunnel perimeter (Figure 10) are shown in Table 12. For the analysis, FLAC (Fast Lagrangian Analysis of Continua) version 7.0 is used. FLAC is an explicit two-dimensional (2D) finite difference program that is suited for sequential excavation modeling. A horseshoe-shaped tunnel was selected because it is a better shape for the drilling and blasting methods that are used in such circumstances, and is the most commonly used tunnel shape in Pakistan.
The two excavation stages (top heading and bench) and three construction steps (excavation, applying soft shotcrete and rock bolt, and hard shotcrete) in each stage are simulated for analysis. The model dimensions are 90 m × 80 m for both projects 5 and 6. The modified Hoek–Brown model was used for the analysis. This model is based on the nonlinear relation between major and minor principal stresses, σ1 and σ3, and the criterion is used for plastic yielding when σ3 is compressive. The fine mesh was simulated around the tunnel boundary for better results. The model was fixed at the sides and bottom, and vertical stresses (σyy) were applied at the top of the model. The in situ stress environment was created using gravity, σyy, and the FISH (a programming language embedded within FLAC that enables the user to define new variables and functions) function. During the three construction steps for each excavation stage, 40% 30%, and 30% relaxation were used.
To calculate the total displacement at points along the tunnel perimeter, the x and y displacement components were obtained from the grid points data. The plastic zones before and after support were analyzed for all four cases of the two projects. The plastic state zone was retrieved from the plot command using the zone condition in the model. For the SS-1 rock case of Project 6, the yield in shear was still the comparative maximum of all the cases, as shown in Figure 10; however, with the application of support, this decreased enormously.
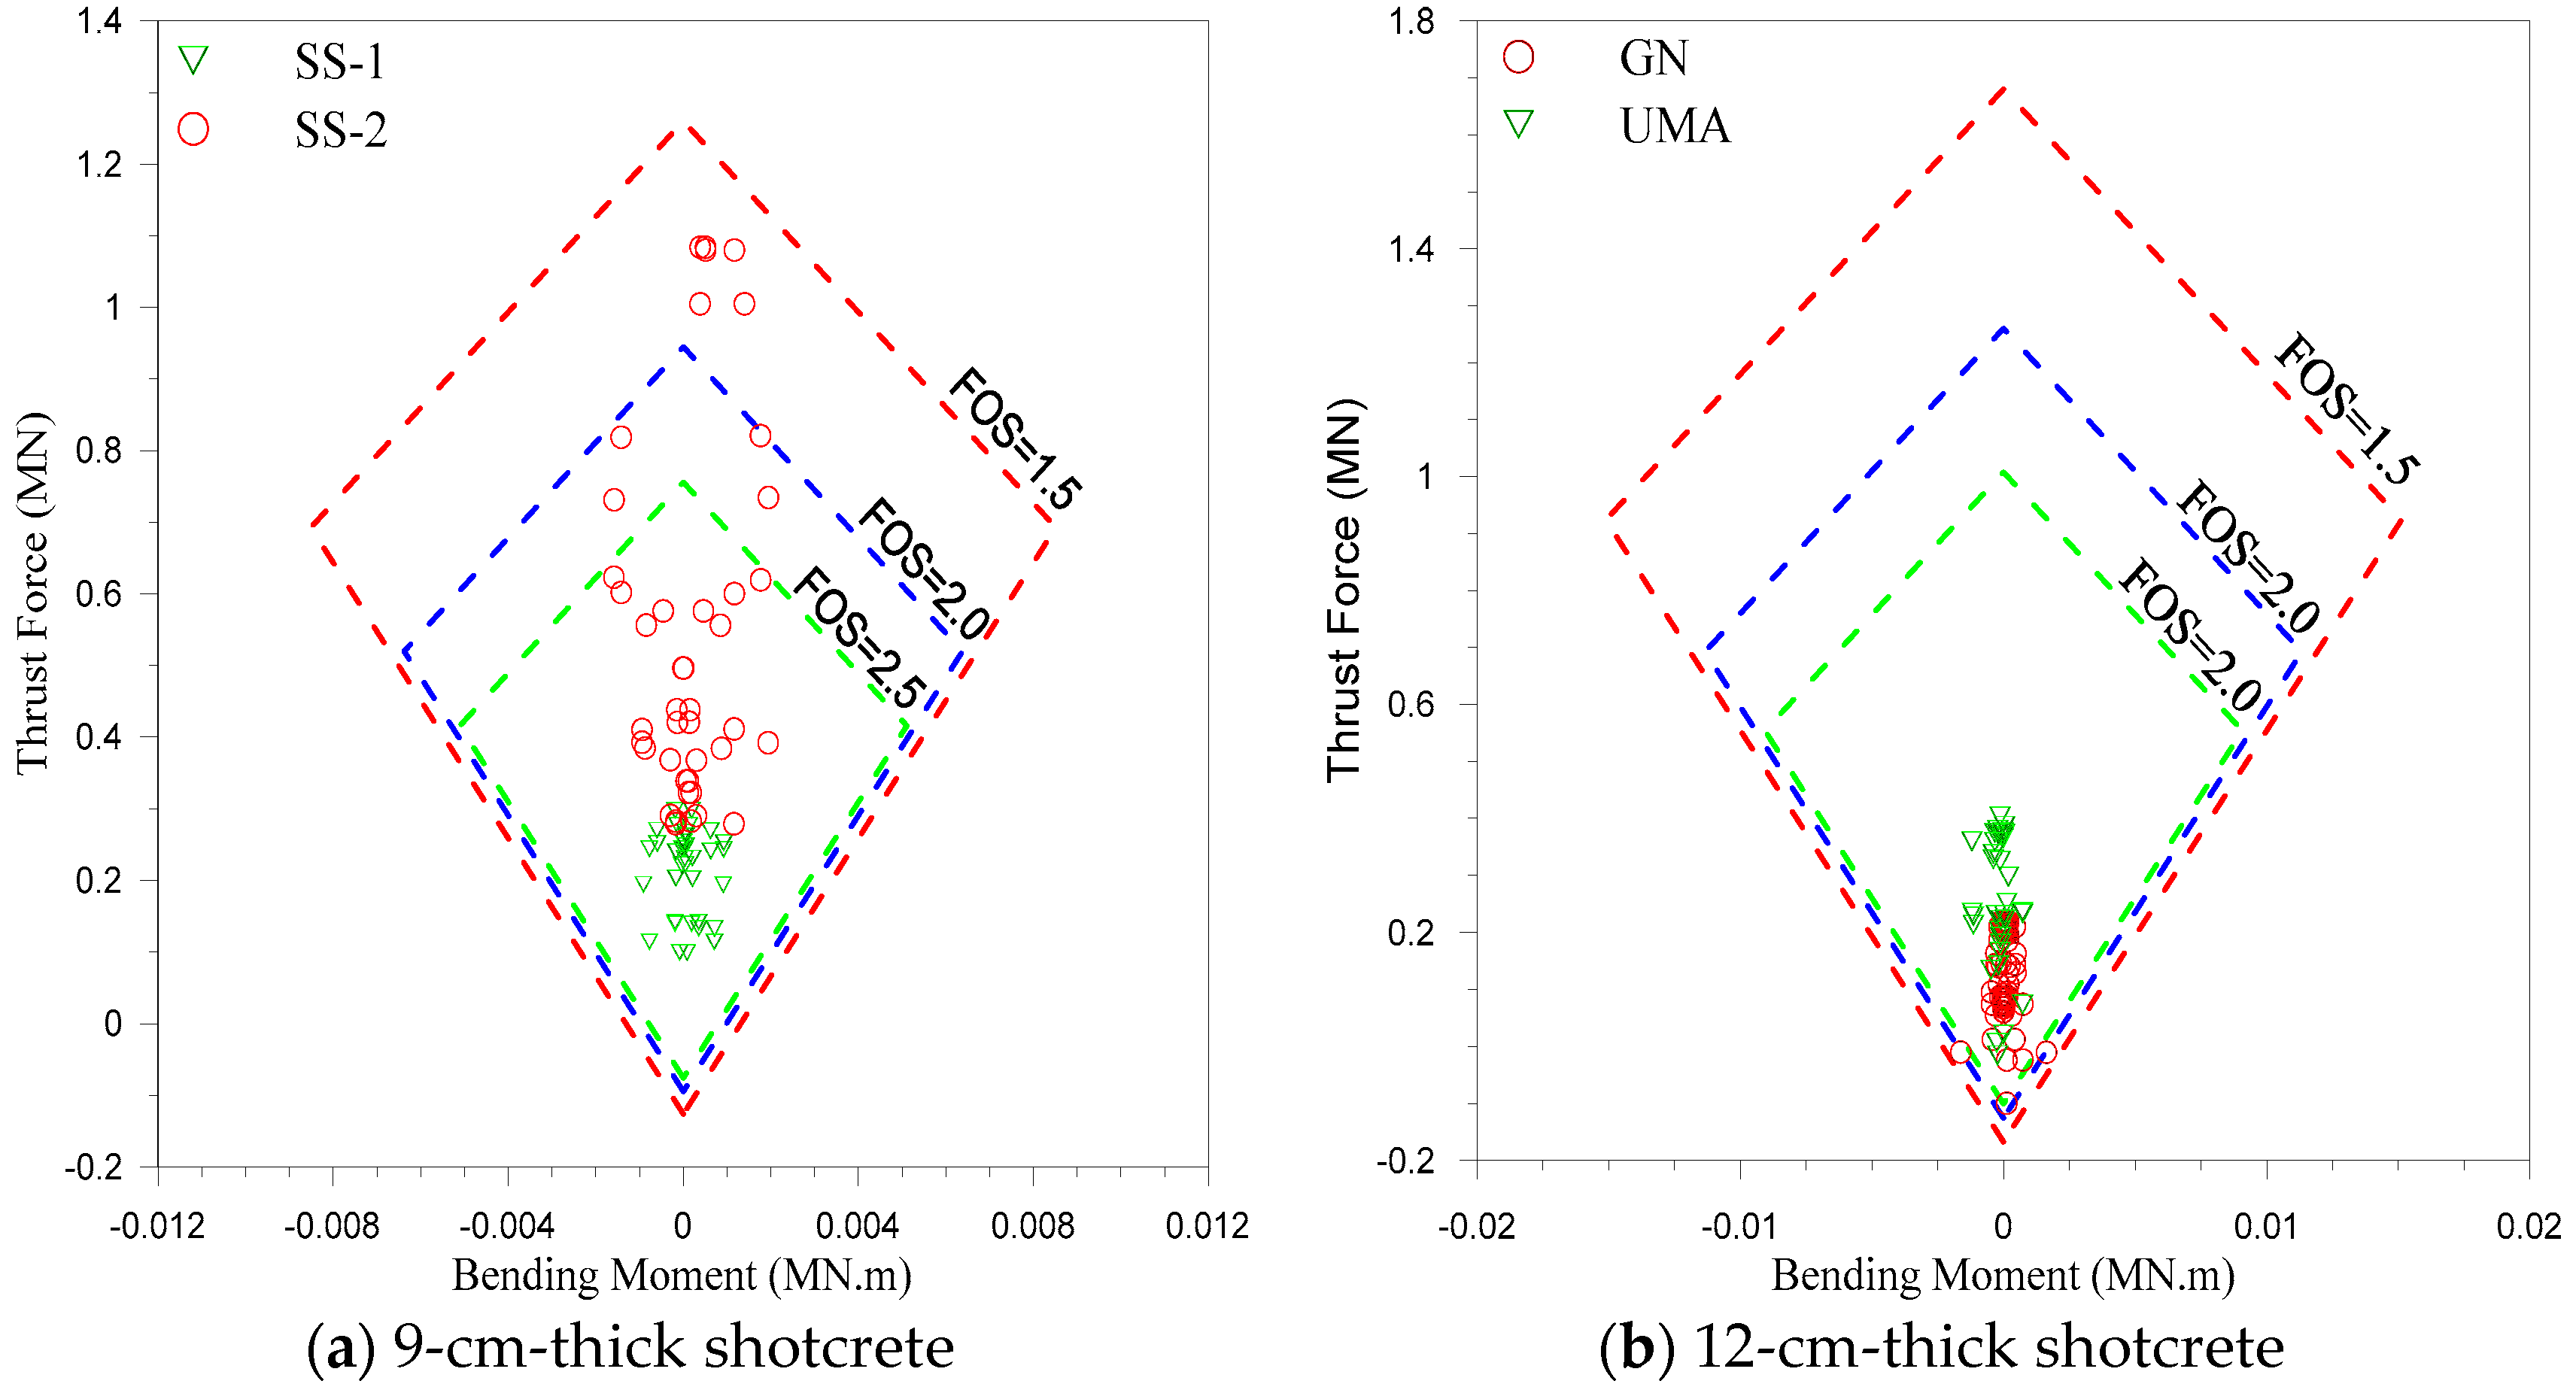
Capacity diagrams, which graphically represent the relationships between thrust-bending moments and thrust-shear forces, are used to evaluate the stability of liners [55]. For this, the structure’s liner information was obtained from the utility function command. Based on the proposed shotcrete thickness from Table 10, thrust-bending diagrams were plotted (Figure 11) for shotcrete thicknesses of 12 cm and 9 cm for factor of safety (FOS) values equal to 1.5, 2, and 2.5.

5. Discussion

The application of rock mass classification in tunnel support design is now acceptable worldwide, and a number of empirical systems have been developed since the first classification system was developed by Terzaghi in 1946, which was known as rock load classification. The application of such systems is not universal, due to the case histories on which each system is based. However, a few systems, including RMR, Q, and RMi, have gotten international attention. Compared to the other classification systems, these systems have still been widely used in tunnel design since their development, because they are continuously upgraded in terms of characterizations or support, or both [3]. The evaluations of the three systems indicate that the Q and RMi systems incorporate stress-related factors, making their application more suitable for tunnel support design, where stress is the major factor governing the ground behavior. However, these systems do not cover tunnels designed in jointed rock mass and high in situ stress fields. The two systems are limited by the case histories on which they are based. In this study, the application of these two systems are empirically extended from the relevant tunnel case records.
In the literature, the SRF factor is either a function of RQD/Jn or σc/σ1. In this study, the empirical equation that was developed for the characterization of SRF is a function of both RQD/Jn and σc/σ1, along with σc. 
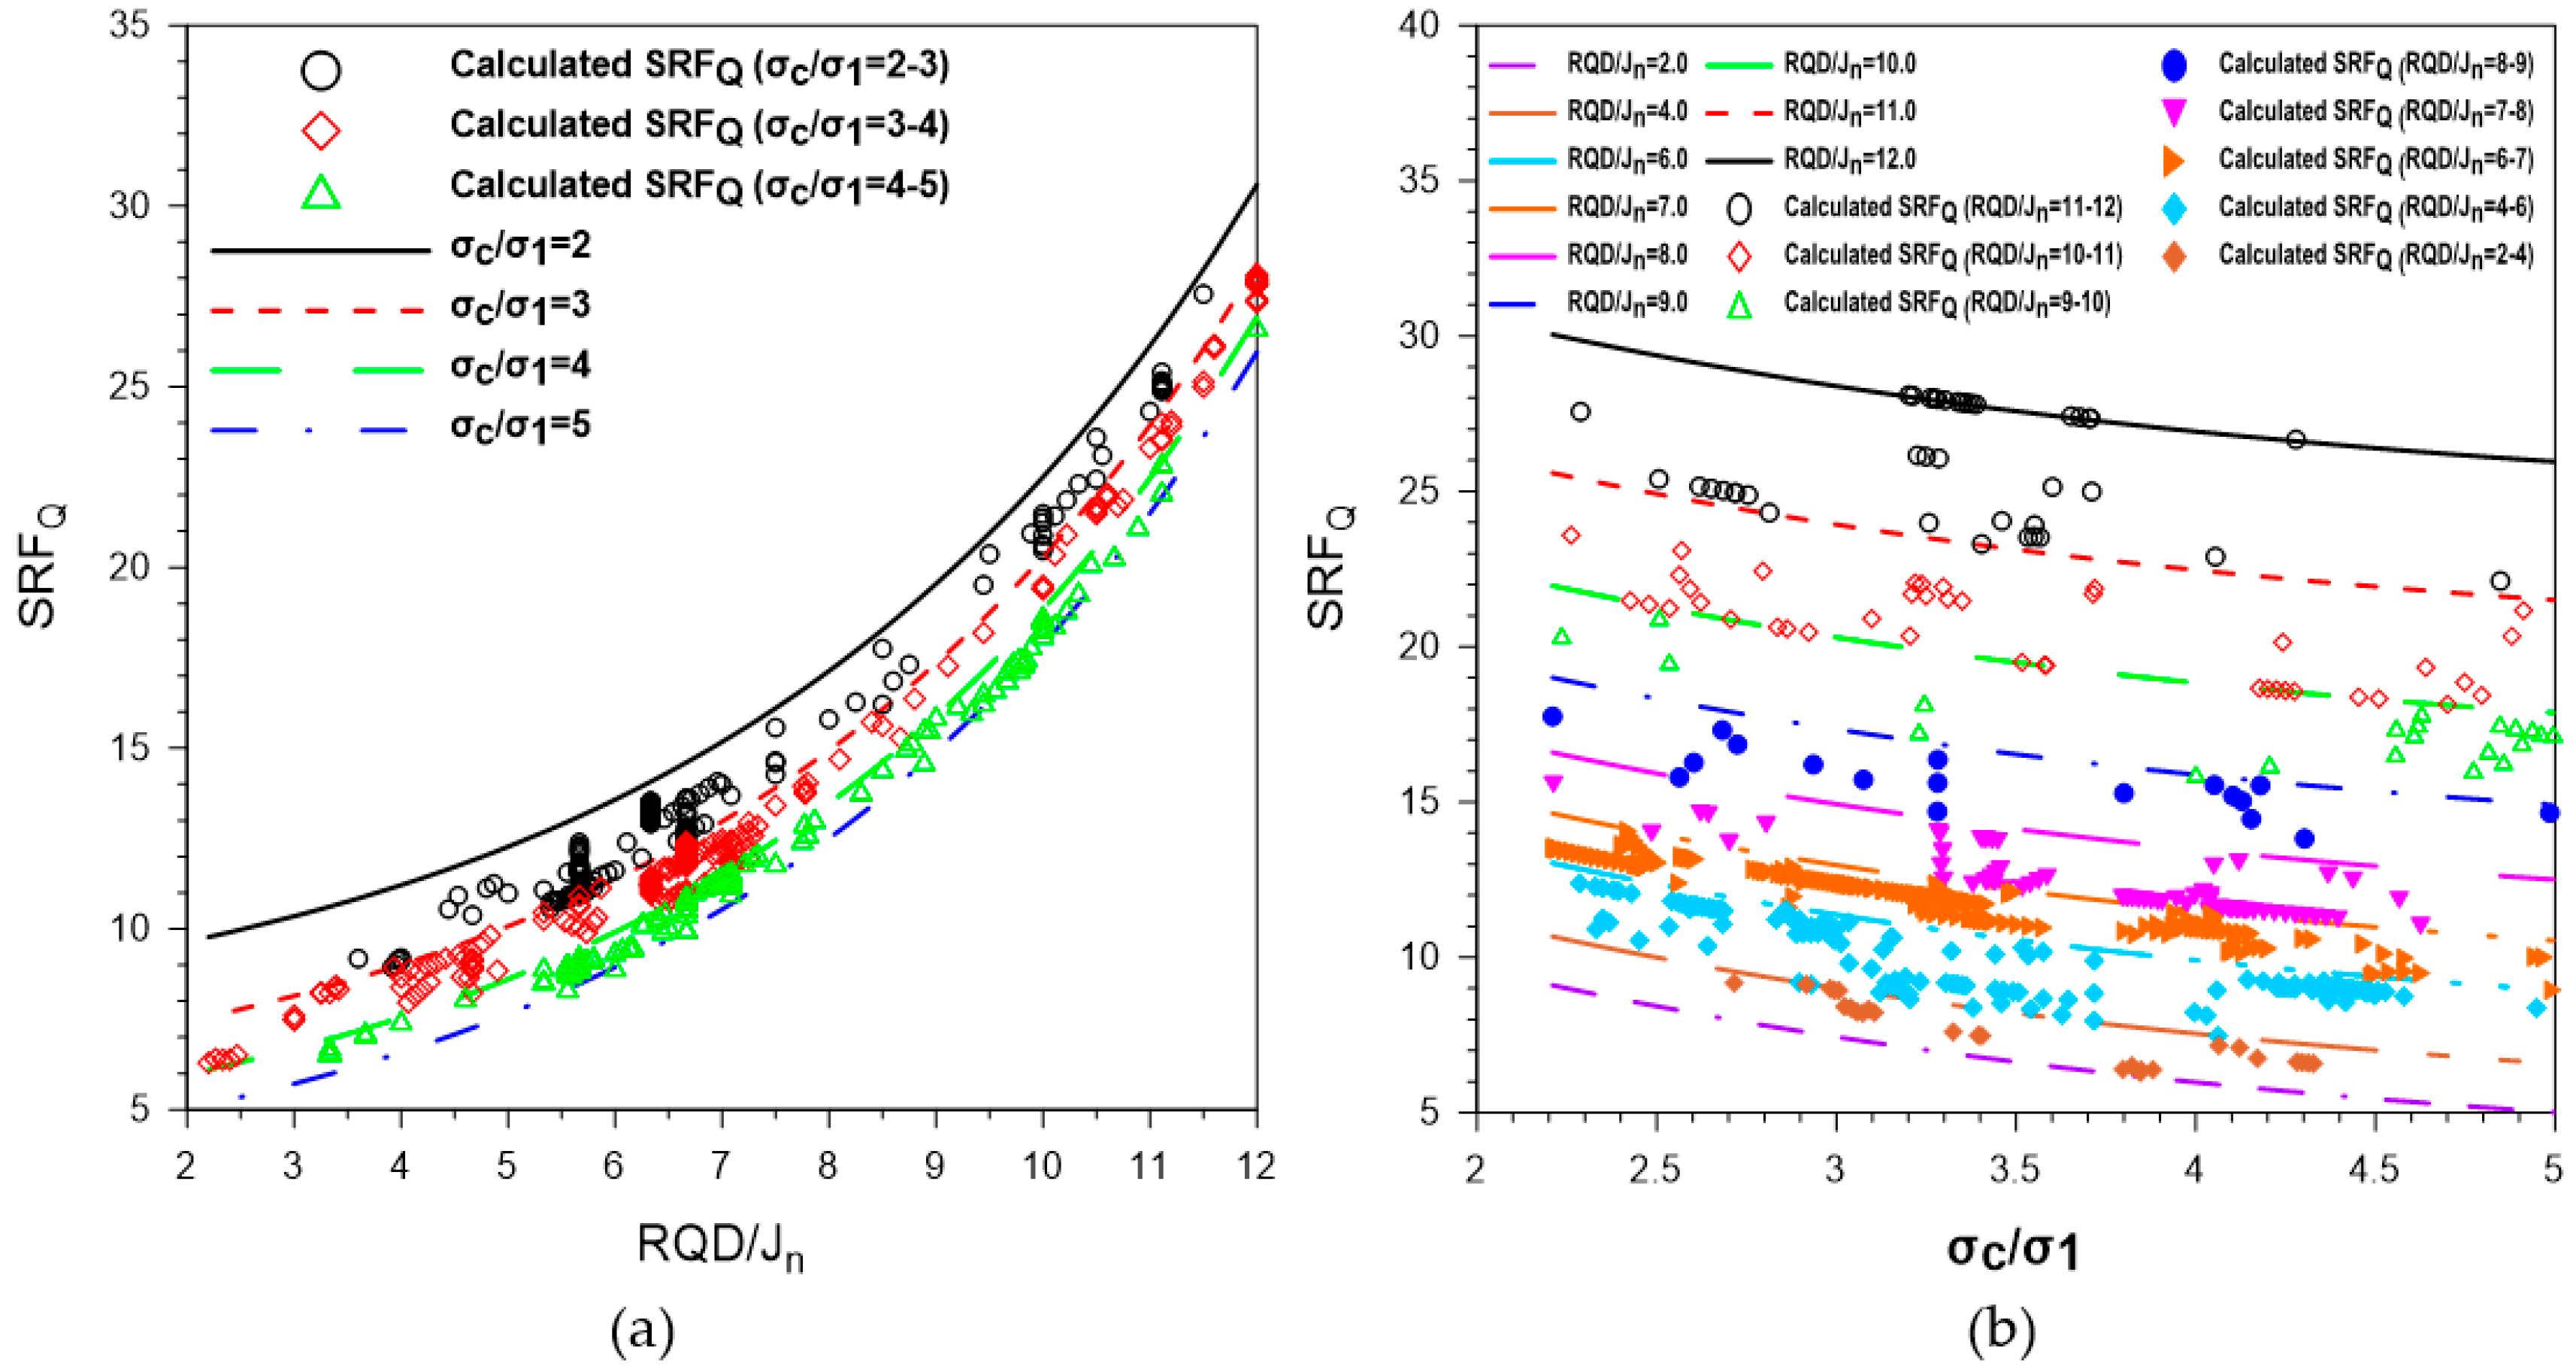
Figure 6a shows that SRFQ (the SRF value that was developed for the original Q-system equation, Equation (1)) significantly increases with relative block size. A maximum change in RQD/Jn of less than seven results in a variation of 5.4 for SRFQ, while for a maximum change in RQD/Jn greater than seven, SRFQ varies by approximately 15.05, which is larger by a factor of about 2.75. A total SRFQ change of 20.82 can be observed with RQD/Jn for a given value of σc/σ1. With an increase in RDQ/Jn, the difference of SRFQ for different values of σc/σ1 is comparatively low for a given value of RQD/Jn.
An opposite trend can be seen in Figure 6b. For RQD/Jn, the rate of decrease of SRFQ with respect to low values of σc/σ1 is large compared to high values of σc/σ1. For a σc/σ1 value below 3.5, the maximum fluctuation in σc/σ1 for a given value of RQD/Jn results in a variation of the SRFQ value of about 2.49. Fluctuation in σc/σ1 by an equal amount in its upper limit (above 3.5) can change SRFQ by 1.35 approximately, which is about 1.84 times smaller. The maximum change in SRFQ is 4.09 with σc/σ1 for any given value of RQD/Jn. The available data indicate that the maximum value of the relative block size is 12.
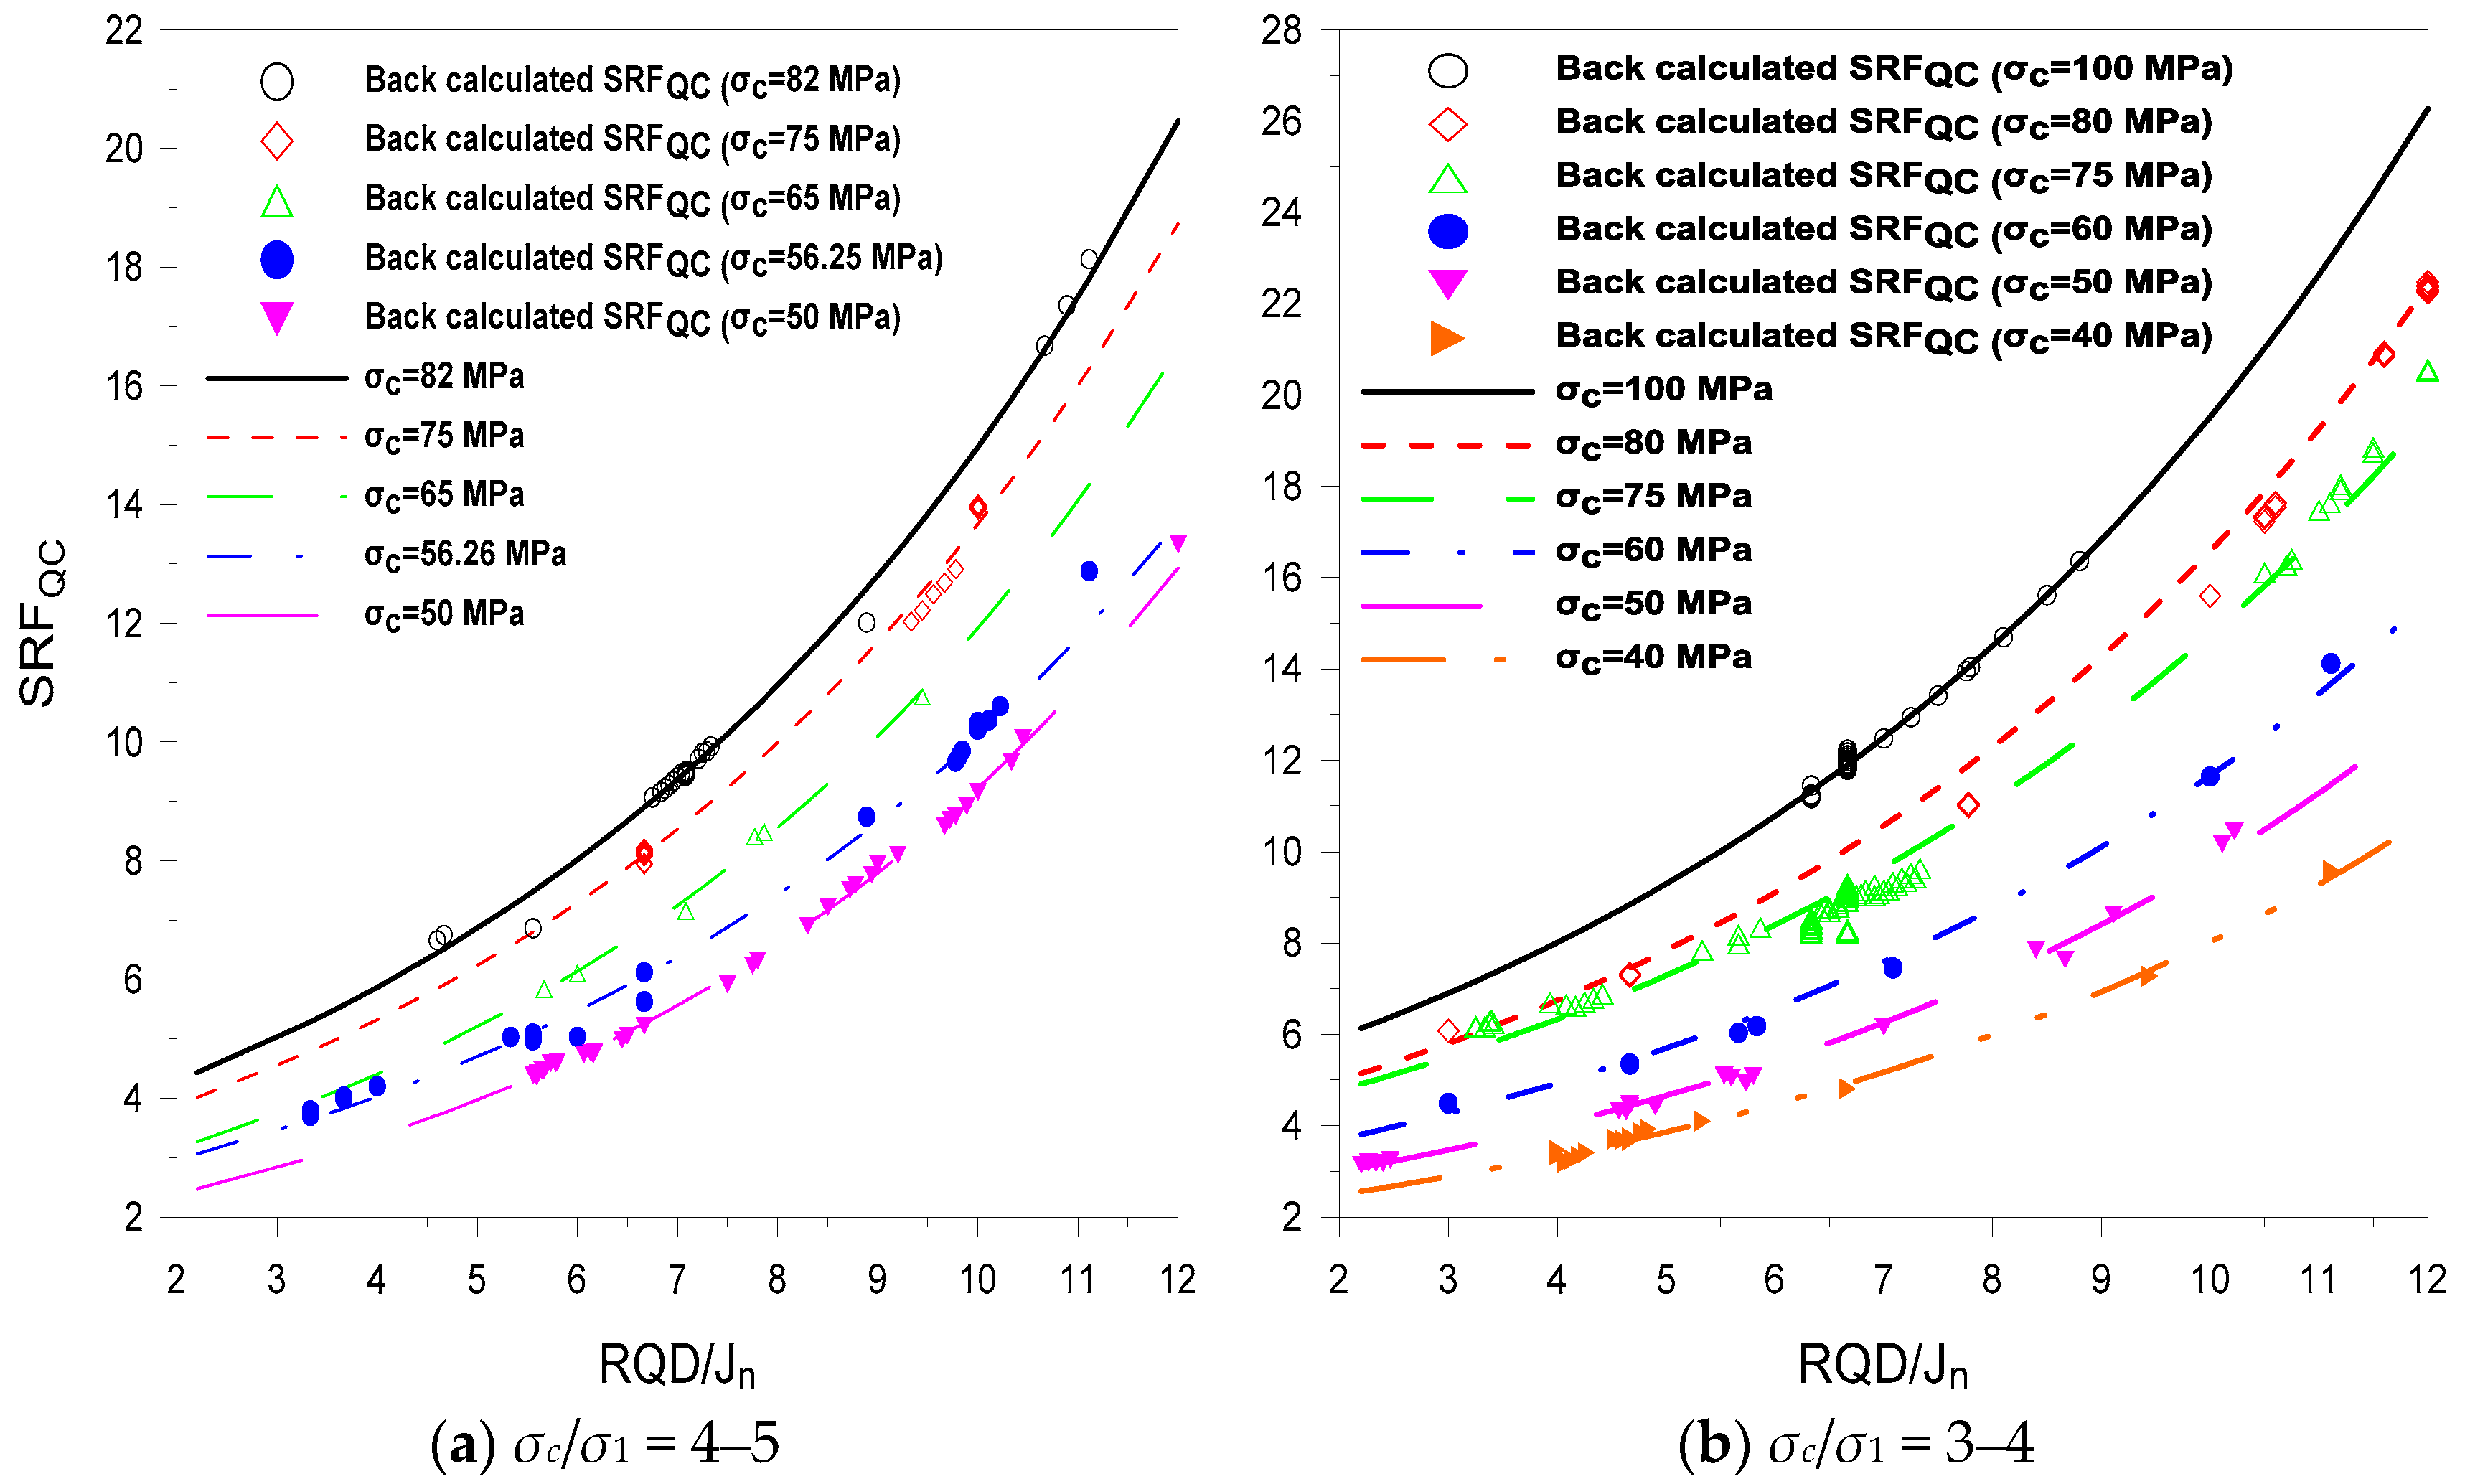
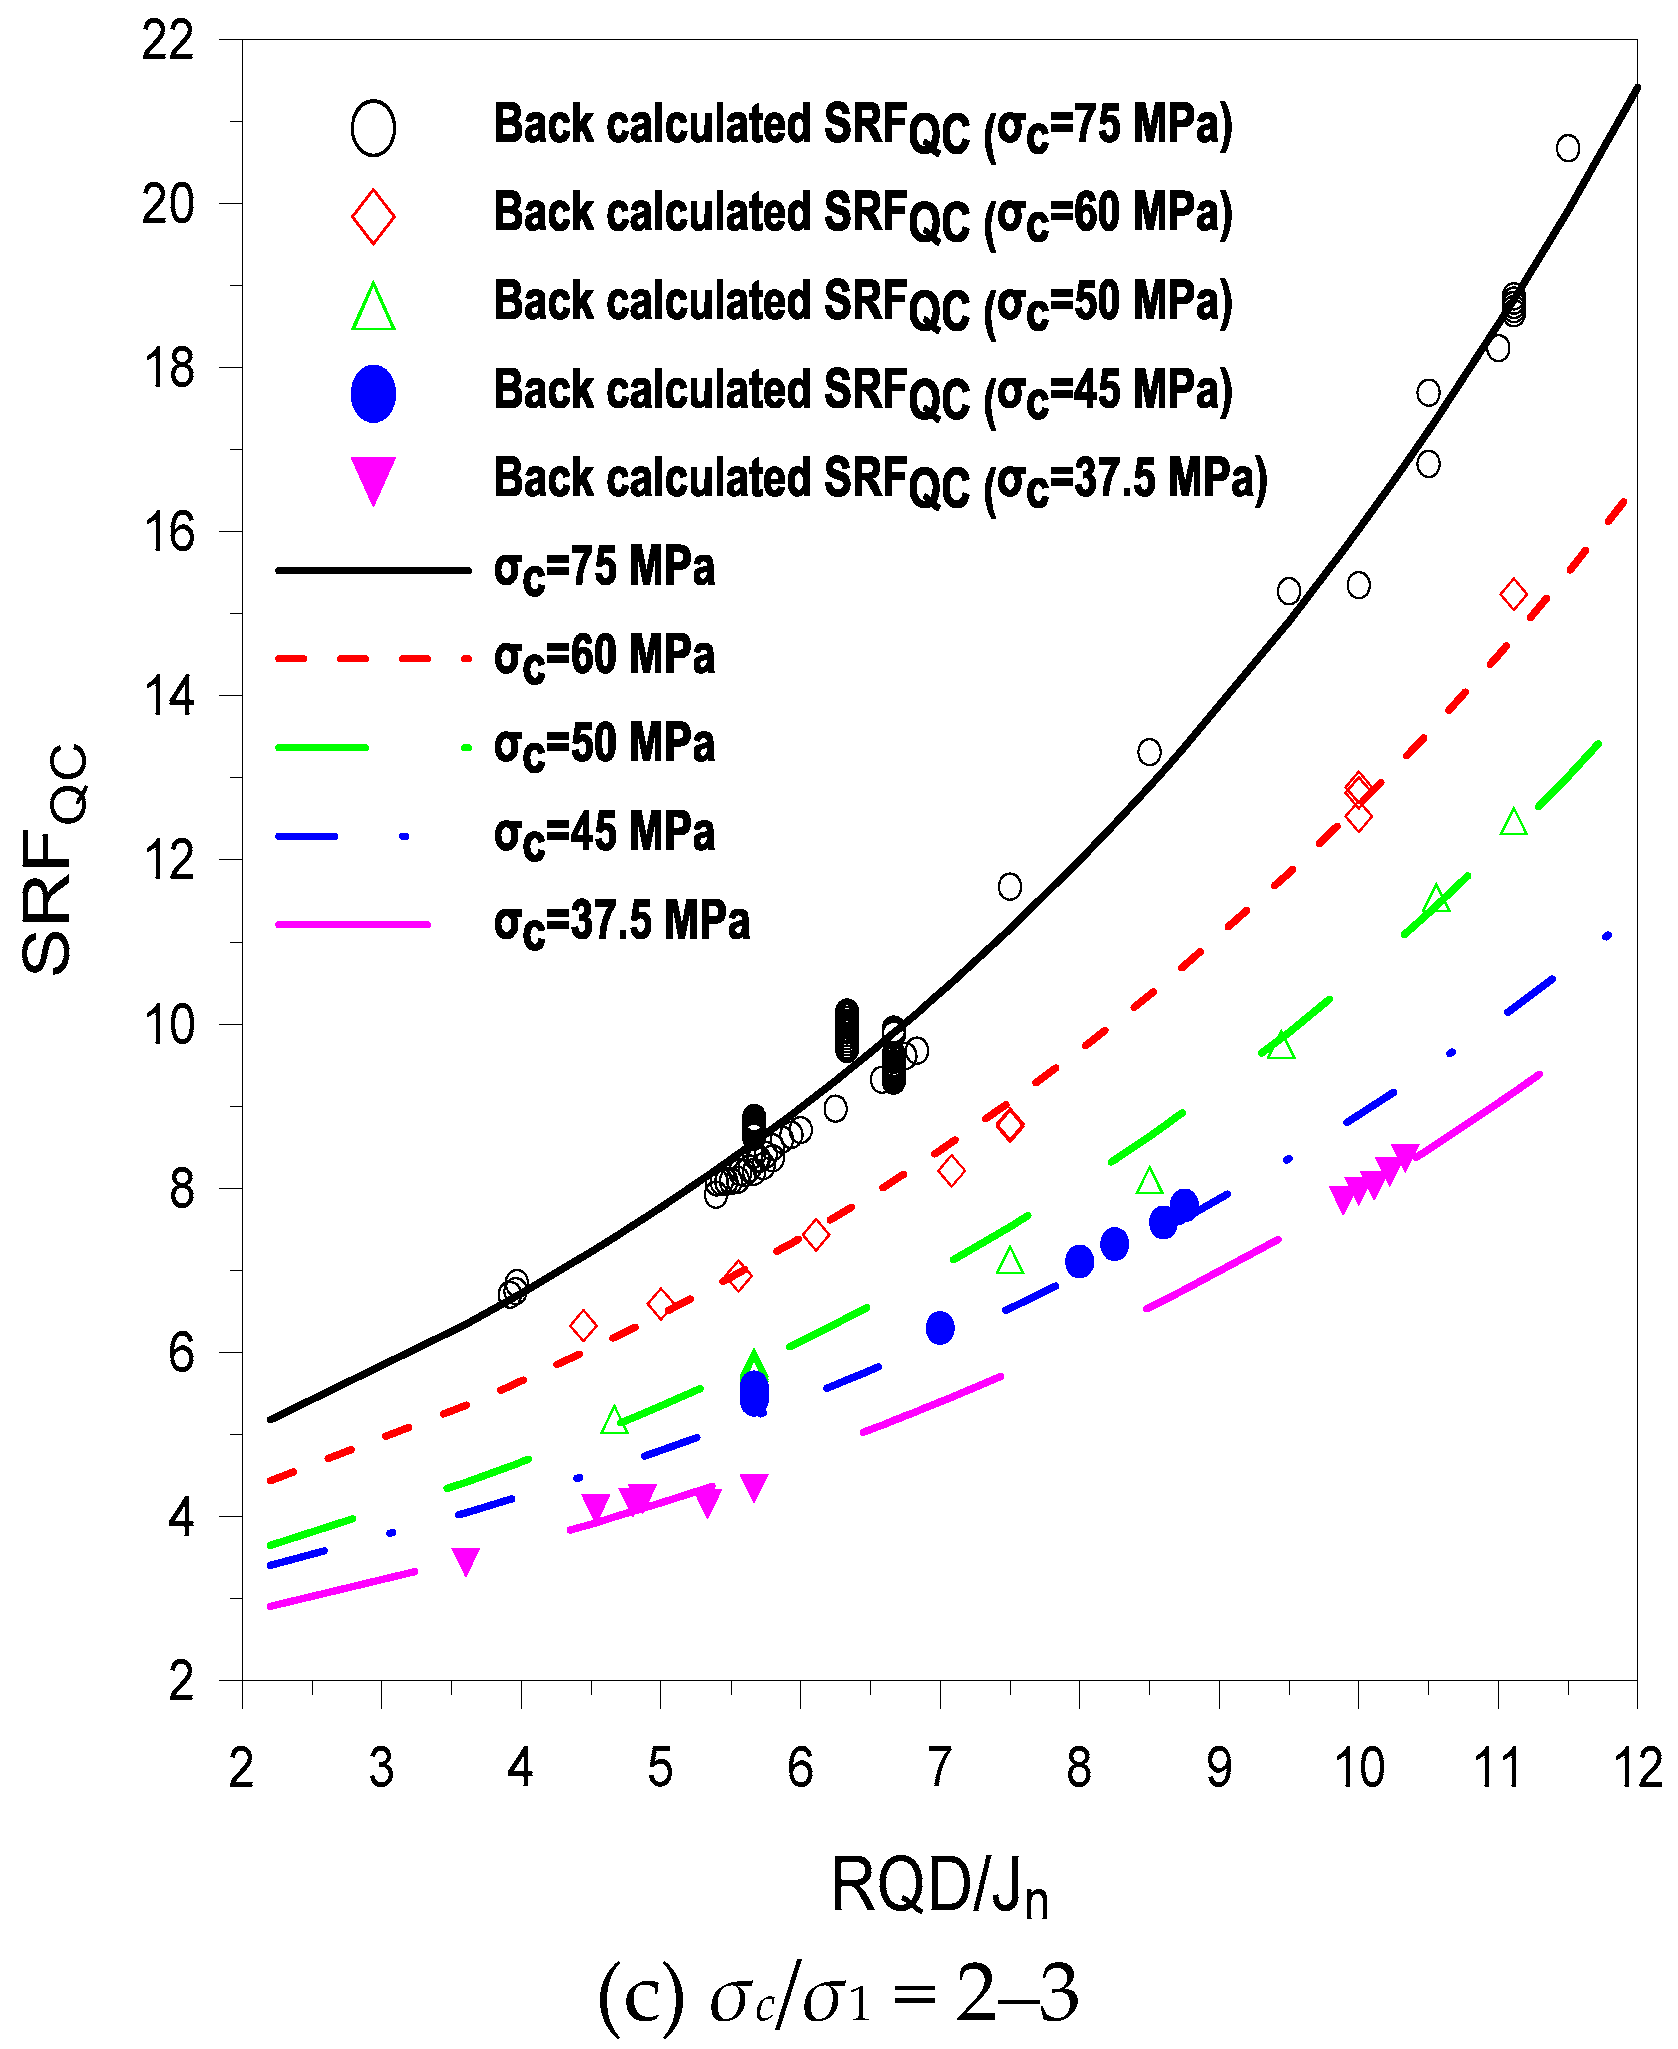
Figure 7 shows that the variation of SRFQC with RQD/Jn also depends on σc as well as σc/σ1. For the same value of σc/σ1, high principal stress (σ1) requires rock with a high σc value. The high level of stress means that more support is required, and hence, a high value of SRFQC. The maximum variation of SRFQC with RQD/Jn is 18.5 for σc = 100 MPa, with σc/σ1 ranging from three to four (Figure 7b), and the minimum variation is 7.38 for σc = 37.5 MPa (Figure 7c). During the design stage of a tunnel, when inadequate information exists, then, with knowledge of σc (which is the most basic parameter to be determined) and the location of the tunnel, Figure 7 can be used to approximate values of SRFQC for different values of RQD/Jn. In the construction phase of a tunnel, when most of the information is in hand at the excavation face, Equations (22) and (23) can be used to calculate SRFQC. The maximum rating of σc is 100, as shown in Table 3; therefore, the calculated SRFQ and SRFQC have the same value for tunnel sections where σc = 100 MPa. In the remaining sections, SRFQC < SRFQ, and the difference depends on σc.
The RMi system uses SL in its structure for the stress factor (Equation (13)), and its ratings are shown in Table 6. Comparing Table 6 with Table 2, SL is only applicable for the first three conditions of Table 2 where σc/σ1 > 5. Equation (13) shows that a high value of SL is favorable, but it is not applicable when σc/σ1 < 5, as shown in Table 2. The comparison of actual installed supports with those supports that are suggested by RMi showed that the suggested support was heavier than the actual. The equations for the calculation of Qc and Gc are rewritten in such a way that each equation is the function of the same parameter, and a relation is developed between the two, keeping in view the limitation of data.
The extension of the two systems is based on Equations (22) and (23); therefore, these equations are used for determining the empirical supports of four rock units, using the Q-system support chart. The support application is numerically evaluated in terms of a decrease in the total displacement at different points along the tunnel periphery, and in the plastic zone. The maximum decrease in total displacement occurred at the tunnel crowns, with a value of 1.3 mm for the SS-2 rock unit of Project 6 (Table 12). According to plasticity theory, a plastic zone occurs around a tunnel after excavation when the induced stresses exceed the rock mass strength. The application of empirically recommended support not only reduced the number of yield elements, but also substantially decreased the extent of the plastic zone in all of the cases. With support, yield in tension was not observed, while yield in shear was either zero or substantially reduced.
As can be seen from the capacity diagram in Figure 11, none of the cases cross the limit of FOS = 1.5. The capacity diagram for the liner shows that for the SS-2 rock unit of Project 6, the dominant failure mode was in compression; however, it too does not cross FOS = 1.5. In the case of the GN rock unit of Project 5, the dominant failure mode was in tension, but FOS > 1.5.

6. Conclusions

RMR, Q, and RMi classifications are based on jointed rock mass data, and are extensively used in the support design of tunnels, but are not used in highly stressed, jointed environments due to the limitations of the relevant data on which these systems are based. As a result, applications of these systems are limited under such conditions.
The Q system does not provide SRF values for highly stressed, jointed rock mass. To extend the Q-system application for such a situation, empirical equations are suggested for SRF characterization in competent rock that has rock stress problems. For jointed rock mass, the relevant data from the four existing tunnel projects that already have supports installed are used. In the proposed equations, SRF depends upon the intact rock strength, the ratio of intact rock strength to the major principal stress, and the relative block size.
The stress level (SL) in the RMi system has no allowance for highly stressed, jointed rock mass. Accordingly, the RMi system recommends heavier support than what is already installed. Using SL ≈ 1/SRF, the ground quality factor decreases, which results in a heavier support.
Therefore, an alternate approach using a tunneling quality index support chart to extend application of the RMi system in highly stressed, jointed rock mass was used. The equations that were proposed in this study for SRF characterization were used for the rock quality index value determination, as applied to two tunnels that were in the design stage. The empirical support suggested by the rock quality index system support chart was numerically evaluated, and found that with application of that support, the total displacement and the extent of plastic zone decreased. The various thicknesses of shotcrete were also evaluated with a capacity diagram to confirm their stability.

Author Contributions

H.-K.Y. supervised the research. J.L. and H.R. have developed the proposed research concept. A.M.N. contributed to reviewed the final paper and made important suggestions and recommendations for paper revision. J.-J.K. helped in writing and re-checking the paper technically as well as grammatically.

Funding

This research was funded by the Korea Agency for Infrastructure Technology Advancement under the Ministry of Land, Infrastructure and Transport of the Korean government grant number 18SCIP-B108153-04.

Acknowledgments

This research was supported by the Korea Agency for Infrastructure Technology Advancement under the Ministry of Land, Infrastructure and Transport of the Korean government (Project Number: 18SCIP-B108153-04). The authors (Hafeezur Rehman and Abdul Muntaqim Naji) are extremely thankful to the Higher Education Commission (HEC) of Pakistan for HRDI-UESTPs scholarship.

Conflicts of Interest

The authors declare no conflict of interest.

References

  1. Feng, X.-T.; Hudson, J.A. Rock Engineering Design; CRC Press: Boca Raton, FL, USA, 2011. [Google Scholar]
  2. Stille, H.; Palmström, A. Classification as a tool in rock engineering. Tunn. Undergr. Space Technol. 2003, 18, 331–345. [Google Scholar] [CrossRef]
  3. Rehman, H.; Ali, W.; Naji, A.; Kim, J.-J.; Abdullah, R.; Yoo, H.-K. Review of rock-mass rating and tunneling quality index systems for tunnel design: Development, refinement, application and limitation. Appl. Sci. 2018, 8, 1250. [Google Scholar] [CrossRef]
  4. Laubscher, D. Geomechanics classification of jointed rock masses-mining applications. Trans. Instn. Min. Met. 1977, 86, A1–A8. [Google Scholar]
  5. Laubscher, D. Design aspects and effectiveness of support systems in different mining conditions. Inst. Min. Met. Trans. 1984, 93, A70–A81. [Google Scholar]
  6. Liu, Z.-X.; Dang, W.-G. Rock quality classification and stability evaluation of undersea deposit based on m-irmr. Tunn. Undergr. Space Technol. 2014, 40, 95–101. [Google Scholar] [CrossRef]
  7. Unal, E. Modified rock mass classification: M-rmr system. In Milestones in Rock Engineering; A. A. Balkema: Rotterdamn, The Netherland, 1996. [Google Scholar]
  8. Tomás, R.; Delgado, J.; Serón, J. Modification of slope mass rating (smr) by continuous functions. Int. J. Rock Mech. Min. Sci. 2007, 44, 1062–1069. [Google Scholar] [CrossRef]
  9. Tomas, R.; Cuenca, A.; Cano, M.; García-Barba, J. A graphical approach for slope mass rating (smr). Eng. Geol. 2012, 124, 67–76. [Google Scholar] [CrossRef]
  10. Taheri, A.; Taheri, A.; Tani, K. Modified rock mass classification system for preliminary design of rock slopes. In Rock Mechanics in Underground Construction, Proceedings of the 4th Asian and International Rock Mechanics Symposium 2006 (with Cd-rom); World Scientific Publishing Co. Pte Ltd.: Singapore, 2006. [Google Scholar]
  11. Francioni, M.; Stead, D.; Sciarra, N.; Calamita, F. A new approach for defining slope mass rating in heterogeneous sedimentary rocks using a combined remote sensing gis approach. Bull. Eng. Geol. Environ. 2018, 1–22. [Google Scholar] [CrossRef]
  12. Pasculli, A.; Calista, M.; Sciarra, N. Variability of local stress states resulting from the application of monte carlo and finite difference methods to the stability study of a selected slope. Eng. Geol. 2018, 245, 370–389. [Google Scholar] [CrossRef]
  13. Barton, N. TBM perfomance estimation in rock using QTBM. Tunn. Tunn. Int. 1999, 31, 30–34. [Google Scholar]
  14. Von Preinl, Z.B.; Tamames, B.C.; Fernández, J.G.; Hernández, M.Á. Rock mass excavability indicator: New way to selecting the optimum tunnel construction method. Tunn. Undergr. Space Technol. Inc. Trenchless Technol. Res. 2006, 3, 237. [Google Scholar] [CrossRef]
  15. Palmstrom, A.; Stille, H. Ground behaviour and rock engineering tools for underground excavations. Tunn. Undergr. Space Technol. 2007, 22, 363–376. [Google Scholar] [CrossRef]
  16. Barton, N.; Lien, R.; Lunde, J. Engineering classification of rock masses for the design of tunnel support. Rock Mech. 1974, 6, 189–236. [Google Scholar] [CrossRef]
  17. Grimstad, E.; Barton, N. Updating the q-system for nmt. In Proceedings of the International Symposium on Sprayed Concrete-Modern Use of Wet Mix Sprayed Concrete for Underground Support, Fagemes, Norway, 18–21 October 1993. [Google Scholar]
  18. Barton, N. Some new q-value correlations to assist in site characterisation and tunnel design. Int. J. Rock Mech. Min. Sci. 2002, 39, 185–216. [Google Scholar] [CrossRef]
  19. NGI. Using the Q-System, Rock Mass Classification and Support Design. Available online: Https://www.ngi.no/eng/Services/Technical-expertise-A-Z/Engineering-geology-and-rock-mechanics/Q-system (accessed on 17 December 2018).
  20. Palmstrom, A.; Broch, E. Use and misuse of rock mass classification systems with particular reference to the q-system. Tunn. Undergr. Space Technol. 2006, 21, 575–593. [Google Scholar] [CrossRef]
  21. Palmstrom, A.; Blindheim, O.; Broch, E. The q-system-possibilities and limitations. In Proceedings of the Norwegian Annual Tunnelling Conference on Fjellsprengningsteknikk/Bergmekanikk/Geoteknikk, Oslo, Norway, 6–7 July 2002; pp. 41.1–41.43. [Google Scholar]
  22. Palmstrom, A. Rmi—A Rock Mass Characterization System for Rock Engineering Purposes. Ph.D. Thesis, University of Oslo, Oslo, Norway, 1995. [Google Scholar]
  23. Palmström, A. Recent developments in rock support estimates by the rmi. J. Rock Mech. Tunn. Technol. 2000, 6, 1–19. [Google Scholar]
  24. Stille, H.; Palmström, A. Ground behaviour and rock mass composition in underground excavations. Tunn. Undergr. Space Technol. 2008, 23, 46–64. [Google Scholar] [CrossRef]
  25. Naji, A.; Rehman, H.; Emad, M.; Yoo, H. Impact of shear zone on rockburst in the deep neelum-jehlum hydropower tunnel: A numerical modeling approach. Energies 2018, 11, 1935. [Google Scholar] [CrossRef]
  26. Barton, N. Deformation phenomena in jointed rock. Geotechnique 1986, 36, 147–167. [Google Scholar] [CrossRef]
  27. Konicek, P.; Soucek, K.; Stas, L.; Singh, R. Long-hole destress blasting for rockburst control during deep underground coal mining. Int. J. Rock Mech. Min. Sci. 2013, 61, 141–153. [Google Scholar] [CrossRef]
  28. Mazaira, A.; Konicek, P. Intense rockburst impacts in deep underground construction and their prevention. Can. Geotech. J. 2015, 52, 1426–1439. [Google Scholar] [CrossRef]
  29. Carter, T. Himalayan Ground Conditions Challenge Innovation for Successful TBM Tunnelling; Invited Paper in Proc. Hydrovision India 2011 Conf, Delhi. SESSION 5c: (Risk Management in Tunnelling); Golder Associates: Toronto, ON, Canada, 2011; 20p. [Google Scholar]
  30. Naji, A.M.; Emad, M.Z.; Rehman, H.; Yoo, H. Geological and geomechanical heterogeneity in deep hydropower tunnels: A rock burst failure case study. Tunn. Undergr. Space Technol. 2019, 84, 507–521. [Google Scholar] [CrossRef]
  31. Geoconsult-Typsa. Geotechnical Interpretative Report, Lowari Tunnel; National Highway Authority: Islamabad, Pakistan, 2004.
  32. Neelum-Jhelum-Consultants. Rock Parameters—Neelum Jhelum Project; Water and Power Development Authority (WAPDA): Lahore, Pakistan, 2011.
  33. Khan, M.S.; Tahir, S.; Gillani, A.; Khan, M.W. Evaluation of tunnel excavation methods for neelum jhelum hydro power project, pakistan. J. Am. Sci. 2011, 7, 1232–1236. [Google Scholar]
  34. Yang, J.; Chen, W.; Zhao, W.; Tan, X.; Tian, H.; Yang, D.; Ma, C. Geohazards of tunnel excavation in interbedded layers under high in situ stress. Eng. Geol. 2017, 230, 11–22. [Google Scholar] [CrossRef]
  35. Tahir, M. Determination of Strength Parameters for Kohat Tunnel-ii. Master’s Thesis, University of Engineering and Technology Peshawar, Peshawar, Pakistan, 2010. [Google Scholar]
  36. Hussain, S.; Ur Rehman, Z.; Mohammad, N.; Tahir, M.; Shahzada, K.; Wali Khan, S.; Salman, M.; Khan, M.; Gul, A. Numerical modeling for engineering analysis and designing of optimum support systems for headrace tunnel. Adv. Civ. Eng. 2018, 2018. [Google Scholar] [CrossRef]
  37. Khawar, M. Development of Correlation between Rock Classification System and Modulus of Deformation. Ph.D. Thesis, University of Engineering and Technology, Lahore, Pakistan, 2013. [Google Scholar]
  38. Ali, W.; Mohammad, N.; Tahir, M. Rock mass characterization for diversion tunnels at diamer basha dam, Pakistan—A design perspective. Int. J. Sci. Eng. Technol. 2014, 3, 1292–1296. [Google Scholar]
  39. Diamer-Basha-Consultants. Geology and Engineering Geology, Tender Design Report, Diamer Basha Dam Project; Water and Power Development Authority: Lahore, Pakistan, 2008.
  40. Wang, C.; Bao, L. Predictive analysis of stress regime and possible squeezing deformation for super-long water conveyance tunnels in Pakistan. Int. J. Min. Sci. Technol. 2014, 24, 825–831. [Google Scholar] [CrossRef]
  41. Schubert, W.; Goricki, A.; Riedmuller, G. The guideline for the geomechanical design of underground structures with conventional excavation. Felsbau 2003, 21, 13–18. [Google Scholar]
  42. Peck, W. Determining the stress reduction factor in highly stressed jointed rock. Aust. Geomech. 2000, 35, 57–60. [Google Scholar]
  43. Kirsten, H. Case histories of groundmass characterization for excavatability. In Rock Classification Systems for Engineering Purposes; ASTM International: West Conshohocken, PA, USA, 1988. [Google Scholar]
  44. Kumar, N.; Samadhiya, N.K.; Anbalagan, R. Application of rock mass classification systems for tunneling in Himalaya, India. Int. J. Rock Mech. Min. Sci. 2004, 41 (Suppl. S1), 852–857. [Google Scholar] [CrossRef]
  45. Tzamos, S.; Sofianos, A. A correlation of four rock mass classification systems through their fabric indices. Int. J. Rock Mech. Min. Sci. 2007, 44, 477–495. [Google Scholar] [CrossRef]
  46. Rehman, H.; Naji, A.; Kim, J.-J.; Yoo, H.-K. Empirical evaluation of rock mass rating and tunneling quality index system for tunnel support design. Appl. Sci. 2018, 8, 782. [Google Scholar] [CrossRef]
  47. Palmstrom, A. Measurements of and correlations between block size and rock quality designation (rqd). Tunn. Undergr. Space Technol. 2005, 20, 362–377. [Google Scholar] [CrossRef]
  48. Grenon, M.; Hadjigeorgiou, J. Evaluating discontinuity network characterization tools through mining case studies. Soil Rock Am. 2003, 1, 137–142. [Google Scholar]
  49. Palmström, A. The volumetric joint count-a useful and simple measure of the degree of rock jointing. Proc. 4th Int. Cong. Int. Assoc. Eng. Geol. 1982, 5, 221–228. [Google Scholar]
  50. Hudson, J.; Priest, S. Discontinuities and rock mass geometry. Int. J. Rock Mech. Min. Sci. Géoméch. Abstr. 1979, 16, 339–362. [Google Scholar] [CrossRef]
  51. Gibson, W. Rock mass strength derived from rock mass characterization. In Proceedings of the Alaska Rocks 2005, The 40th US Symposium on Rock Mechanics (USRMS), Anchorage, AK, USA, 25–29 June 2005. [Google Scholar]
  52. Lowson, A.; Bieniawski, Z. Critical Assessment of rmr Based Tunnel Design Practices: A Practical Engineer’s Approach. In Proceedings of the SME, Rapid Excavation and Tunnelling Conference, Washington, DC, USA, 23–26 June 2013; pp. 180–198. [Google Scholar]
  53. Barton, N. Rock mass characterization for excavations in mining and civil engineering. In Proceedings of the International Workshop on Rock Mass Classification in Underground Mining, Pittsburgh, PA, USA, 31 May 2007; pp. 3–13. [Google Scholar]
  54. Hoek, E.; Carranza-Torres, C.; Corkum, B. Hoek-brown failure criterion—2002 edition. Proc. NARMS-TAC Conf. 2002, 1, 267–273. [Google Scholar]
  55. Carranza-Torres, C.; Diederichs, M. Mechanical analysis of circular liners with particular reference to composite supports. For example, liners consisting of shotcrete and steel sets. Tunn. Undergr. Space Technol. 2009, 24, 506–532. [Google Scholar] [CrossRef]
Figure 1. Location of the projects.
Applsci 08 02659 g001
Figure 2. Percentage frequency of (a) intact rock strength (σc) to major principal stress (σ1) ratio (σc/σ1); (b) relative block size (RQD/Jn) for the first four tunnel projects.
Applsci 08 02659 g002
Figure 3. Procedure for the back-calculation of the tunnel quality index (Q or Qc) from actual tunnel spans and installed supports [46].
Applsci 08 02659 g003
Figure 4. Flowchart for the tunnel support estimation using the RMi system in discontinuous ground.
Applsci 08 02659 g004
Figure 5. Difference in back-calculated stress reduction factor (SRFQ) with calculated SRF through Equation (4).
Applsci 08 02659 g005
Figure 6. Relation of SRFQ with RQD/Jn and σc/σ1. (a) SRFQ vs. RQD/Jn for different σc/σ1 values; (b) SRFQ vs. σc/σ1 for different RQD/Jn values.
Applsci 08 02659 g006
Figure 7. Variation of SRFQC with relative block size for different values and ranges of σc and σc/σ1, respectively.
Applsci 08 02659 g007aApplsci 08 02659 g007b
Figure 8. Classification of Jv based on the degree of jointing [47].
Applsci 08 02659 g008
Figure 9. Actual and RMi-suggested support differences in term of (a) rock bolt spacing (b) shotcrete thickness (positive value on the x-axis indicates that the recommended support is heavier than the actual).
Applsci 08 02659 g009
Figure 10. Extent and number of plastic zones around the Project 6 tunnel before and after support.
Applsci 08 02659 g010
Figure 11. Shotcrete stability analysis through thrust-bending moment interaction diagrams.
Applsci 08 02659 g011
Table 1. The fitness of empirical rock mass classification systems for different ground behaviors during tunnel excavation. Q: tunneling quality index, RMi: rock mass index, RMR: Rock Mass Rating.
Ground BehaviorEmpirical Rock Mass Classification System
RMRQRMi
Stable221–2
Fragment(s) or block(s) fall1–21–21–2
Cave-in32–32
Running ground444
Buckling433
Rupturing from stress433
Slabbing, spalling422
Rock burst43–42
Plastic behavior (initial)43–43
Squeezing ground433
Raveling from slaking or friability444
Swelling ground433
Flowing ground444
Water ingress444
Fitness rating of different systems: 1, suitable; 2, fair; 3, poor; and 4, not applicable [15].
Table 2. The stress reduction factor (SRF) rating is the function of stress–strength ratios in the case of competent rock having rock-stress problems.
Stress Levelσθ/σcσc/σ1SRF **SRF *
1Open joints, low stress at shallow depth<0.01>2002.52.5
2Favorable stress condition at medium stress level0.01–0.3200–1011
3Very tight structure due to high in situ stresses0.3–0.410–50.5–20.5–2
4Moderate slabbing after one hour in massive rock05–0.655–35–505–9
5Slabbing and rockburst after a few minutes in massive rock0.65–1.03–250–2009–15
6Heavy rockburst (strain burst) and immediate dynamic deformation in massive rock>1.0<2200–40015–20
σc = Intact rock uniaxial compressive strength; σ1 = Major principal stress; σθ = tangential stress; ** Grimstad (1993) [17] * Barton (1974).
Table 3. Q-system parameters for the first four projects, and the tunnel spans.
ProjectNo. of Sectionsσc (MPa)JrJaJw
Project 125837.556.25606575311
Project 2204404550607580901001.511
2
1
3
Project 3508286310.66
0.66
Project 4305475311
Table 4. Ratio of joint roughness and joint alteration rating based on Q and RMi systems for the four projects.
Case No.Jr/JajR/jAProject
135LT, KT, GGHPP
21.51.5NJHEP
30.750.5NJHEP
40.50.375NJHEP
LT = Lowari Tunnel; KT = Kohat Tunnel; GGHPP = Golen Gol Hydropower Project; NJHEP = Neelum–Jhelum Hydroelectric Project.
Table 5. Ground conditions (Gc) and size ratios (Sr) for all of the tunnel sections of the four tunnels.
ParameterProject
1234
UCS (MPa)37.5–7540–10082 and 8654 and 75
jR/jA50.375–1.555
jL1111
Jv5.0769–42.7696.7–49.776.8–87.07–37.05
Vb (m3)0.00046–0.2750.00029–0.11940.000055–0.11420.00071–0.105
Db0.0772–0.650380.066–0.4920.038–0.4850.0891–0.4717
JP0.05697–0.316380.00314–0.0990.032–0.250.0639–0.244
CF17.175–159.00919.659–145.919.375–247.677.84–41.52
C01–31–31–32 and 3
Nj0.75–1.20.75–1.20.5–10.8–1.5
SL1.51.51.51.5
C1111
Gc4.8–35.590.26–9.813.21–25.337.193–27.49
Sr45.37–636.03640.85–583.6229.54–371.5115.69–110.72
Table 6. Stress levels and their ratings per RMi system.
Stress Level (SL)Approximate OverburdenRating
Very low<10 m0.1
Low10–35 m0.5
Moderate35–350 m1
High>350 m1.5
Table 7. Constants a, b, and c for Equations (24) and (25) based on Table 4.
Case No.abc
12.440.8043
22.1231.0231.5
32.0581.1730.75
42.081.2750.5
Table 8. Adjustment ratings for joint orientation.
Joint OrientationRating of C0
Favorable1
Fair1.5
Unfavorable2
Very unfavorable3
Table 9. Intact rock properties for different rock types of projects 5 and 6.
ProjectRock TypeCase NumberUnit Weight (KN/m3)UCS (MPa)Young’s Modulus E (GPa)Poisson’s Ratiomi
5GN128.6100420.223
UMA231.780240.15225
6SS-132780400.217
SS-242750300.1517
mi = material constant in the generalized Hoek–Brown criterion [54]. UCS: uniaxial compressive strength.
Table 10. Recommended empirical supports for two tunnel projects using the Q system.
Case No.Tunnel Span (m)RQD/JnJr/Jaσc/σ1Q or QcRock Bolt Length (m)Rock Bolt Spacing (m)Shotcrete Thickness (cm)
115.411351.541.7–1.89–12
28.5341.741.7–1.89–12
38.56331.62.91.7–1.86–9
4332.20.92.91.79
Table 11. Rock mass properties for different rocks units of the four projects.
Case No.GSImbsac (MPa)ɸ °E (GPa)σt (MPa)
1759.4180.06220.5015.37452.2934.290.66
2729.1970.04460.5014.56550.6918.4450.388
3685.4210.02860.5024.644.3126.5450.422
4583.7930.00940.5032.89939.0914.240.124
GSI = geological strength index; mb = reduced value of mi; s and a are rock mass constants in Hoek–Brown failure criterion; c and ф are equivalent strength parameters in Mohr–Coulomb failure criterion and σt tensile strength of rock mass [54].
Table 12. Total displacement (mm) at different points along the tunnel perimeter with and without support.
Case No.aa’bb’cc’dd’ee’
19.99.66.86.42.82.67.57.52.92.8
218.517.413.312.64.64.314.514.55.95.7
39.08.67.37.12.52.36.66.64.03.9
416.415.113.312.75.24.4613.213.28.68.2

