Article

Multidisciplinary Design Optimization for a Centrifugal Compressor Based on Proper Orthogonal Decomposition and an Adaptive Sampling Method

1
School of Energy and Power Engineering, Beihang University, Beijing 100191, China
2
AECC Hunan Aviation Powerplant Research Institute, Zhuzhou 412002, China
*
Author to whom correspondence should be addressed.
Appl. Sci. 2018, 8(12), 2608; https://doi.org/10.3390/app8122608
Submission received: 11 November 2018 / Revised: 6 December 2018 / Accepted: 7 December 2018 / Published: 13 December 2018
(This article belongs to the Special Issue Radial Turbomachinery Aerodynamics)

Abstract

:

Featured Application

A centrifugal compressor used in a small aero-engine is optimized. The experiences can also be used for other turbomachines.

Abstract

A centrifugal compressor is required to increase aerodynamic efficiency, ensure structural integrity, and reduce processing costs. This paper presents a dimension reduction technique based on proper orthogonal decomposition (POD) in combination with an adaptive sampling method to reduce computational costs. Design of experiment (DOE) is first used to choose initial sampling points. Then, parts of the sampling points are selected to format the snapshot matrix. Subsequently, the number of principal components to be retained is determined after POD analysis. An adaptive sampling point adding approach is used to increase new sampling points. The approach places more points around the regions of initial optimum designs by learning the information from previous data through POD analysis. Finally, the POD coefficients are selected to act as new design variables in the following multidisciplinary design optimization process. The method is first tested by three mathematical benchmark functions. The proposed method is then used to optimize a centrifugal compressor, of which the results are verified by tests. A normalized isentropic efficiency improvement of 3.7% and 3.0% in the maximum speed state and cruise state has been obtained after optimization. Additionally, the processing costs are reduced by about 30% owing to the number of blades reduced.

1. Introduction

Centrifugal compressors have been widely used in small and medium aero-engines due to their apparent advantages in size, pressurization capability, and operating range. With the increasing demand for higher aerodynamic efficiency, broader operating range, and better structural integrity, the optimization of centrifugal compressors has been extensively investigated. Many researchers have focused on a single discipline design optimization for centrifugal compressors, such as the aerodynamic optimization or the structural optimization [1,2,3]. With the upgrading of the design requirements, the multidisciplinary design optimization (MDO) methodology has been carried out so as to consider the couplings of different disciplines and the trade-offs among different performance indexes. In recent years, the MDO for centrifugal compressors has drawn an increasing amount of attention. The studies involve the aerodynamic optimizations with stress or eigenfrequency constraints [4,5] and the structural optimizations with aerodynamic performance constraints [6].
In the optimization of a centrifugal compressor, there may be dozens or even hundreds of design variables. With the increase in design variables, the iteration number of the optimization grows exponentially. The MDO for the centrifugal compressor is a typical multi-objective and multi-point optimization problem. The compressor has to meet the requirements from multiple disciplines and improve the performance at both the design point and off-design points, which may lead to high computational costs. It is inefficient to apply global optimization algorithms, such as evolutionary methods, to find the global optimum of the high dimensionality optimization problem due to the high computational costs of the multidisciplinary design analysis (MDA) simulations. Therefore, the surrogate models have been widely used to reduce searching time. The results have proved that the methods have the potential to satisfy industrial design needs. The commonly used surrogate models in these studies include Kriging [7,8], radial basis function (RBF) [9], artificial neural networks (ANNs) [10], polynomial response surface (PRS) [11], and support vector regression (SVR) [12]. The accuracy of surrogate models has a great influence on optimization results and may lead to the failure of optimization. To ensure the accuracy of the surrogate models, a large number of initial sampling points should be chosen for a high-dimensional optimization problem, which may be still plagued by the curse of dimensionality. A great deal of literature has utilized the inverse design technique, which is characterized by the parameterization of blade geometry with very few design parameters to overcome this issue [13,14]. However, the technique could not directly control the parameters that indicate the improvement of the performance. In addition, it is not clear if the global optimum could be achieved by taking the aerodynamic-performance-related parameters (such as the distribution of the blade loading) as local variables.
An alternative way is to use the proper orthogonal decomposition (POD), which has been widely used in the field of computational fluid dynamics, such as the flow field reconstruction [15,16], the airfoil inverse design [17], and the flow characteristics prediction [18]. In the field of optimization, POD is mainly used to construct the reduced order model (ROM) of the high-fidelity simulations to reduce the computational costs [19,20,21,22]. The technique could also be used for the design space reduction [23,24]. Traditional variable screening techniques reduce the dimensionality of the optimization problem by removing variables that seem to be irrelevant to the problem. They may fail when all variables are equally relevant in the problem or when some variables are relevant only in part of the space [25]. Additionally, the traditional variable screening techniques may also reduce the flexibility of the geometry parameterization and the ability to achieve a better design. The POD-based method combines the advantage of the design space reduction and variable screening and retains the flexibility of the original optimization problem [24]. Ghoman et al. [26,27] proposed a similar POD-based scheme for the design space reduction and demonstrated that the method could effectively reduce the number of design variables.
In the present work, a POD-based dimension reduction technique coupling with an adaptive sampling method is proposed and applied to optimize a centrifugal compressor to improve its aerodynamic efficiency and reduce the processing costs. The sampling approach places more points in the regions of interest by learning the information from previous data through POD analysis. The proposed method has great potential to decrease the total sampling points required and further reduce the computational costs.
The remainder of the paper is organized as follows. Section 2 presents the basic information of the researched centrifugal compressor. Section 3 describes the details of the optimization framework, which involves the geometrical parameterization, the multidisciplinary analysis, the proposed pod-based dimension reduction technique coupled with an adaptive sampling method, and the formulation of the optimization problem. Section 4 presents the validation for the proposed method. Section 5 introduces a practical engineering optimization problem for a centrifugal compressor and proves the benefits of the dimension reduction strategy for the MDO of the centrifugal compressor. Section 6 shows the experimental verification for the optimization results. The last section concludes the study and discusses the research prospects.

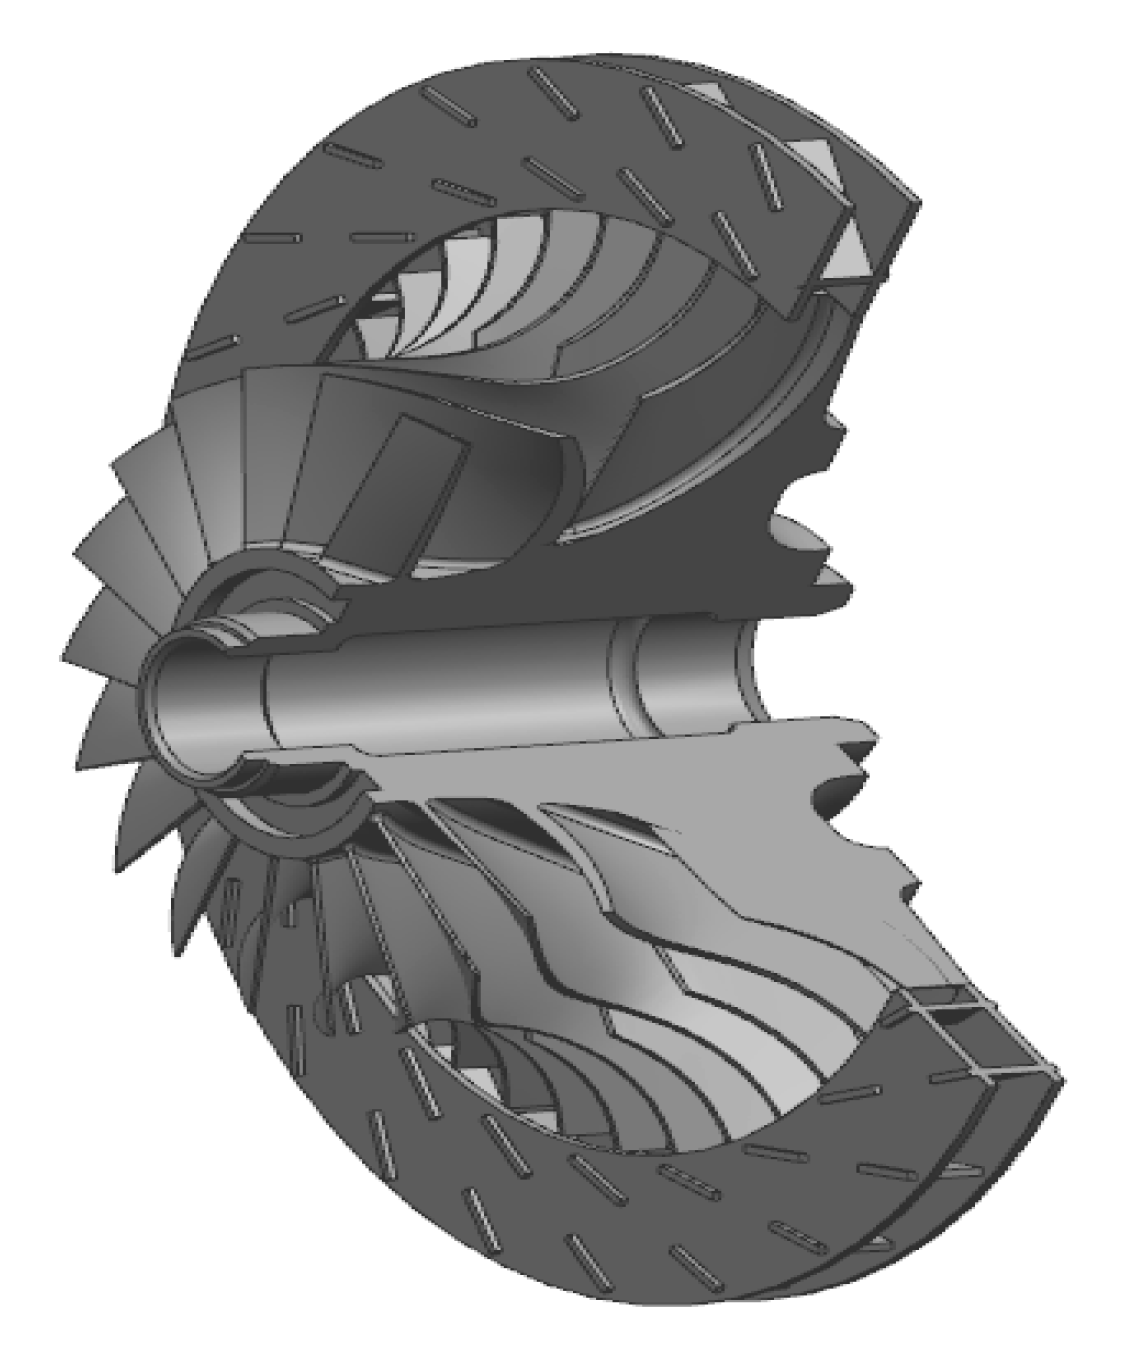
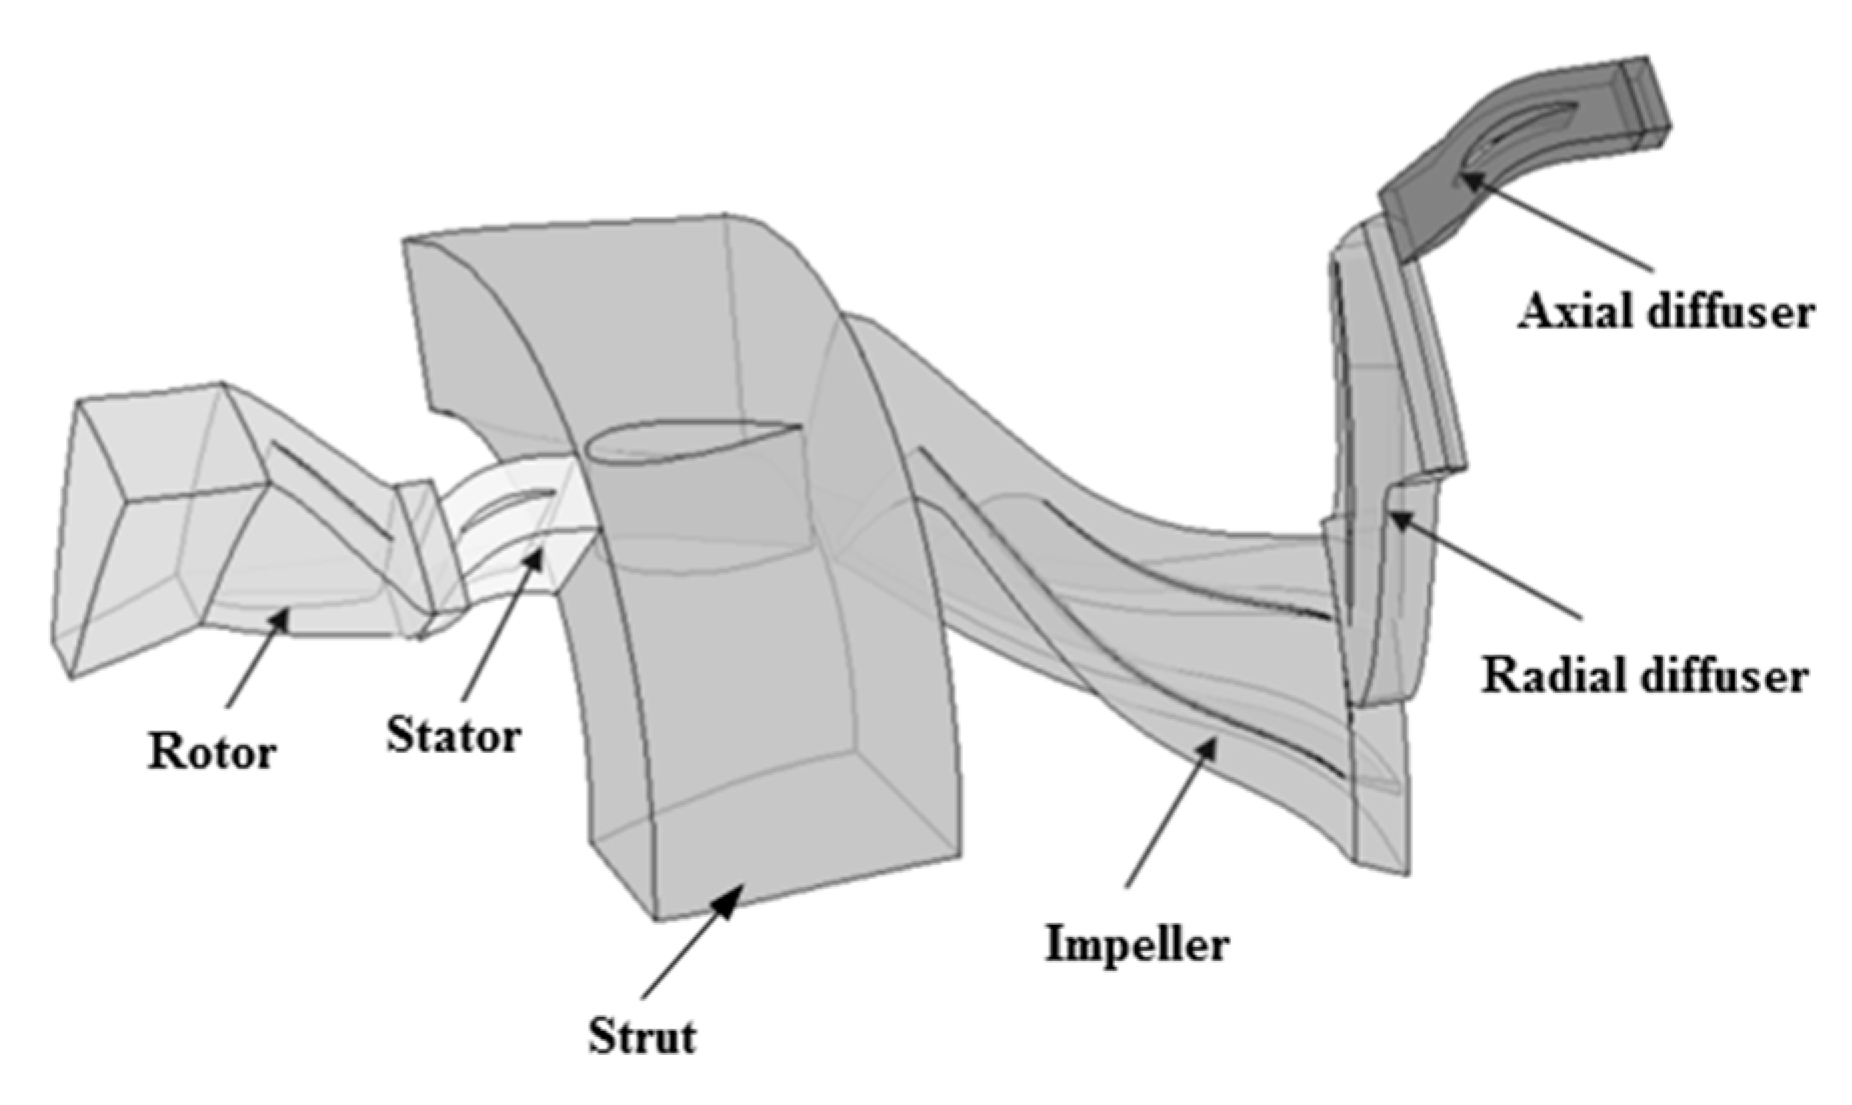
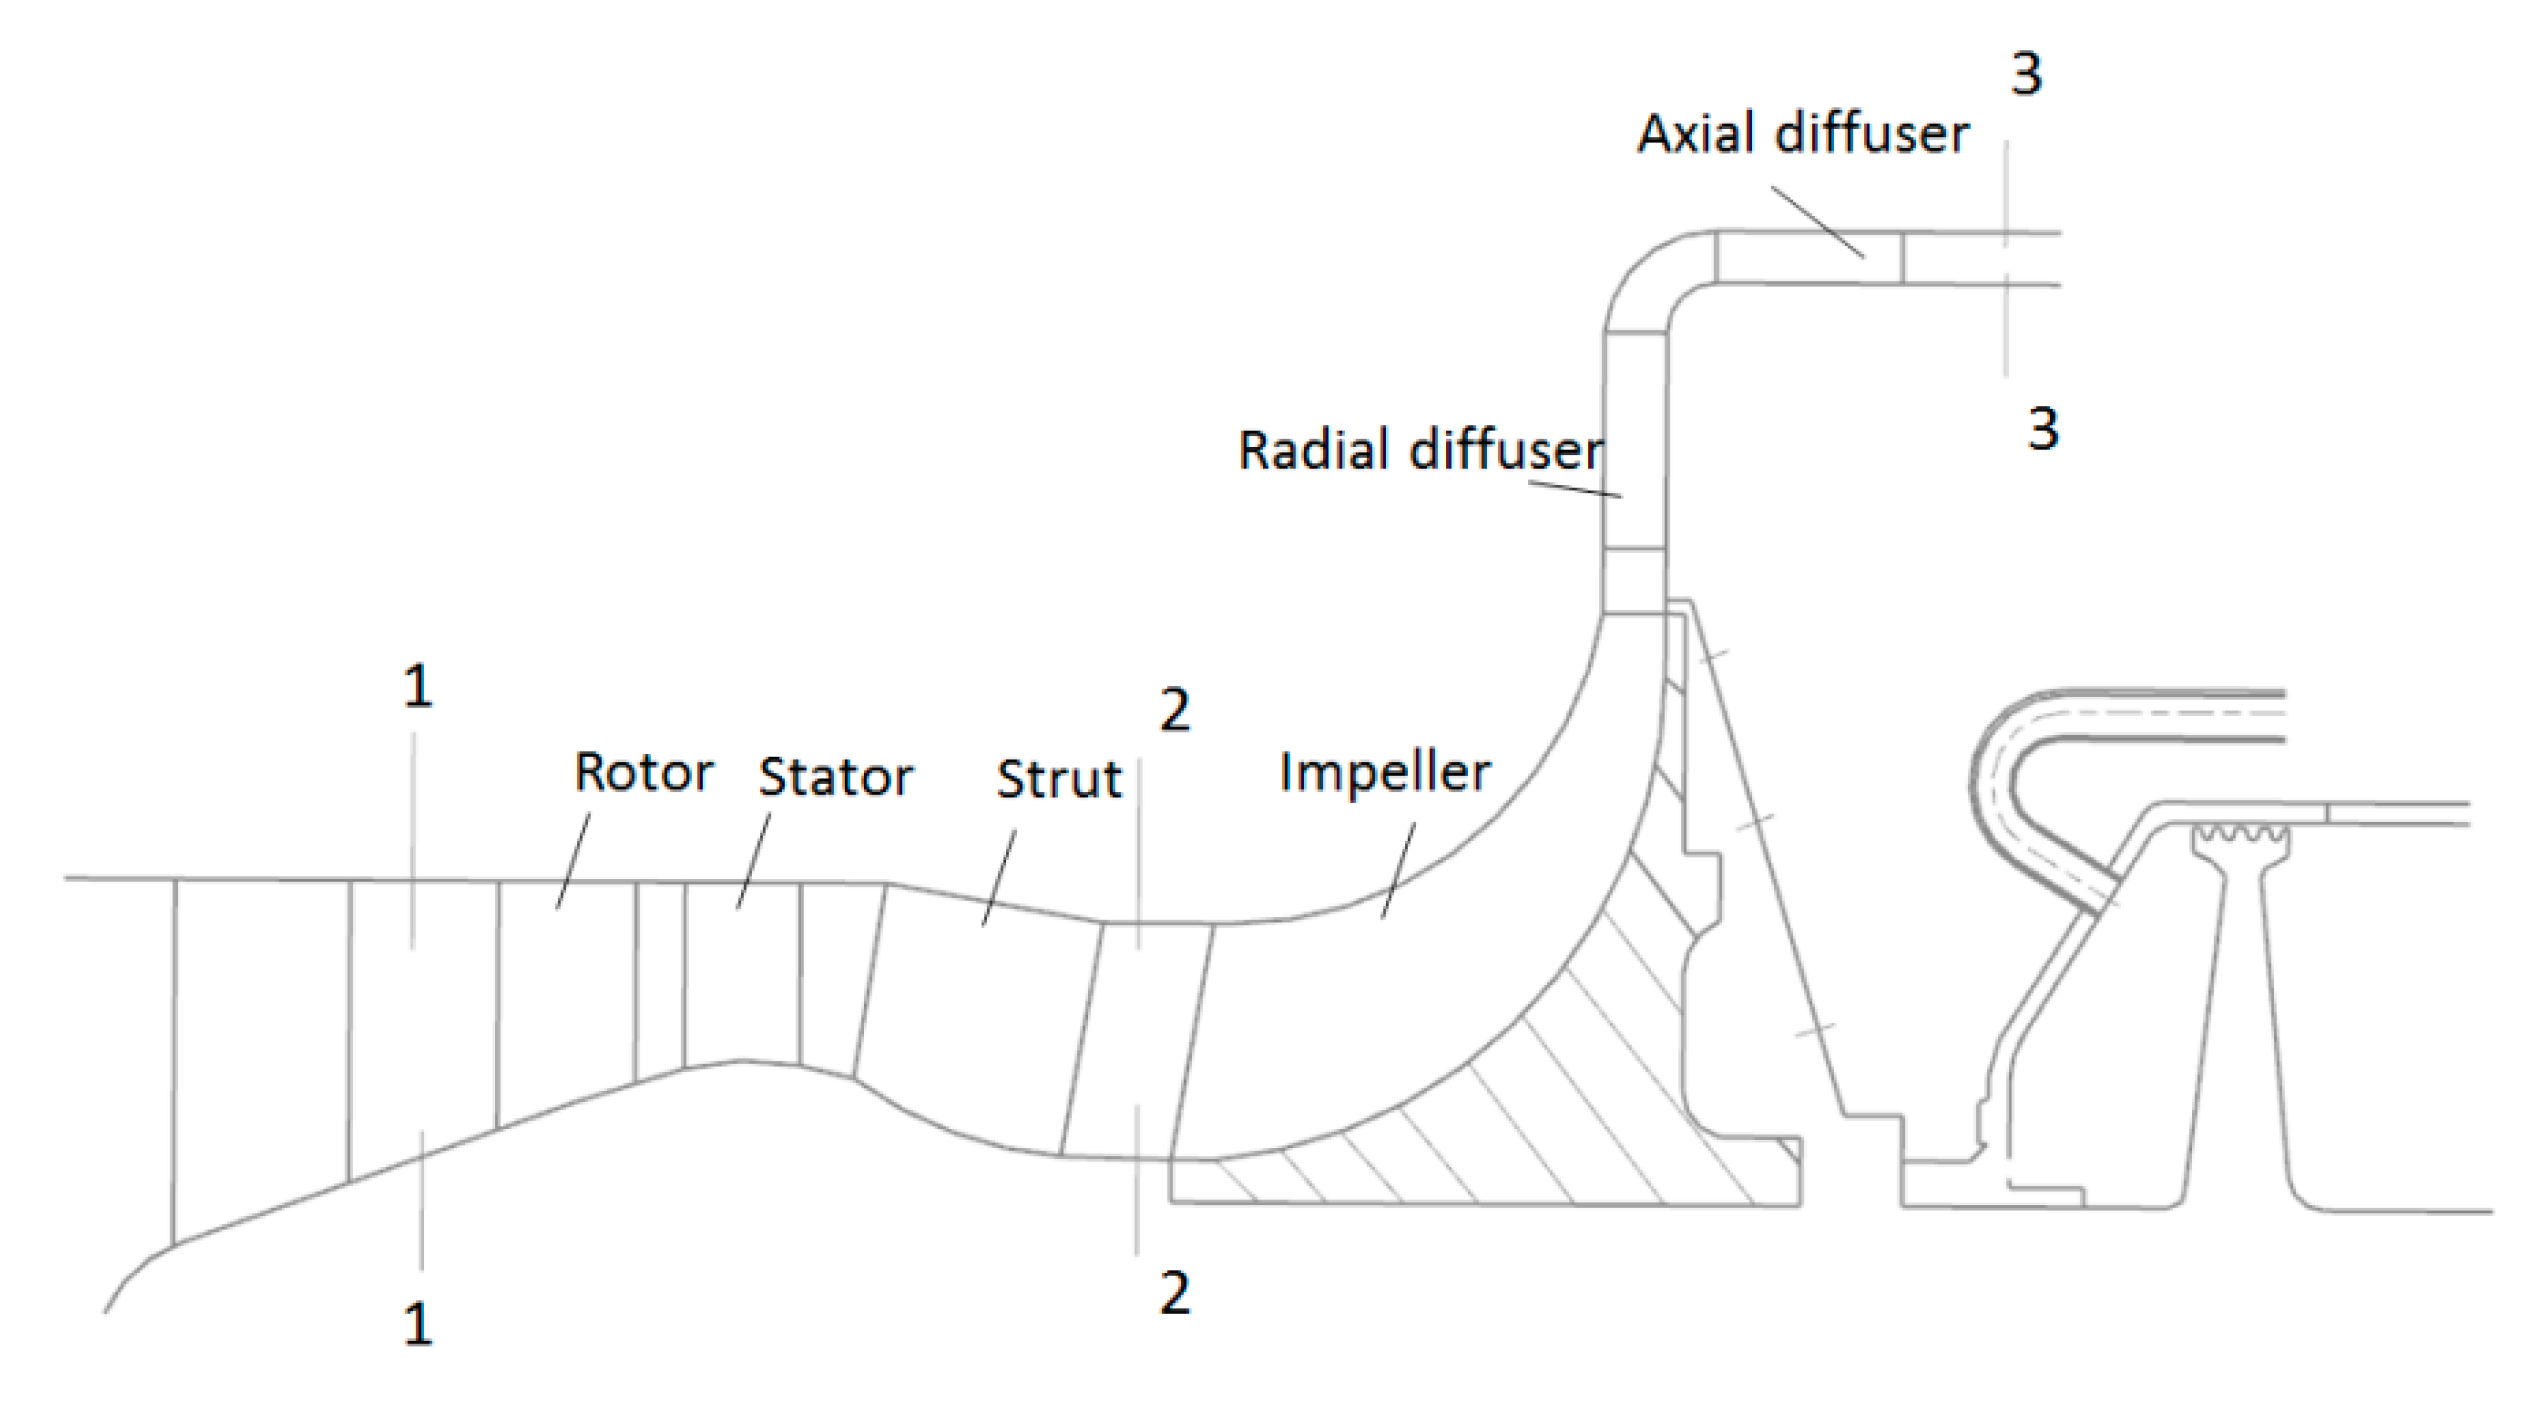
2. Researched Centrifugal Compressor

The compressor of an aero-engine is a combined compressor including a one-stage axial compressor and a one-stage centrifugal compressor. Particularly, the pressure ratio of the axial stage is 1.4, and for the centrifugal stage, this figure is 4.1, which suggests that the compressor work of the centrifugal stage is five times the axial one. Therefore, the efficiency of the centrifugal stage dominates the efficiency of this combined compressor. The present paper only focuses on the MDO of the centrifugal stage (including impeller and diffuser). In Figure 1, a three-dimensional (3D) view of the original centrifugal compressor is sketched. The initial impeller consists of 19 sectors, each one containing a full-size blade and a splitter blade. Due to the dense distribution of impeller blades, the processing is difficult and the rejection rate is relatively high. The radial diffuser consists of 25 blades with a plain configuration. The material of the impeller and the radial diffuser is cast aluminum.
The purpose of this study is to improve the power of the aero-engine and reduce the processing costs of the centrifugal compressor. On the one hand, the power of the aero-engine is related to the compressor efficiency. Thus, the adiabatic efficiency of the combined compressor at maximum state and cruise state are selected as two optimization objectives. On the other hand, the cost of impeller and radial diffuser processing is closely related to the number of blades. Thus, the number of blades of the impeller and radial diffuser are chosen as two other optimization objectives.

3. Optimization Framework

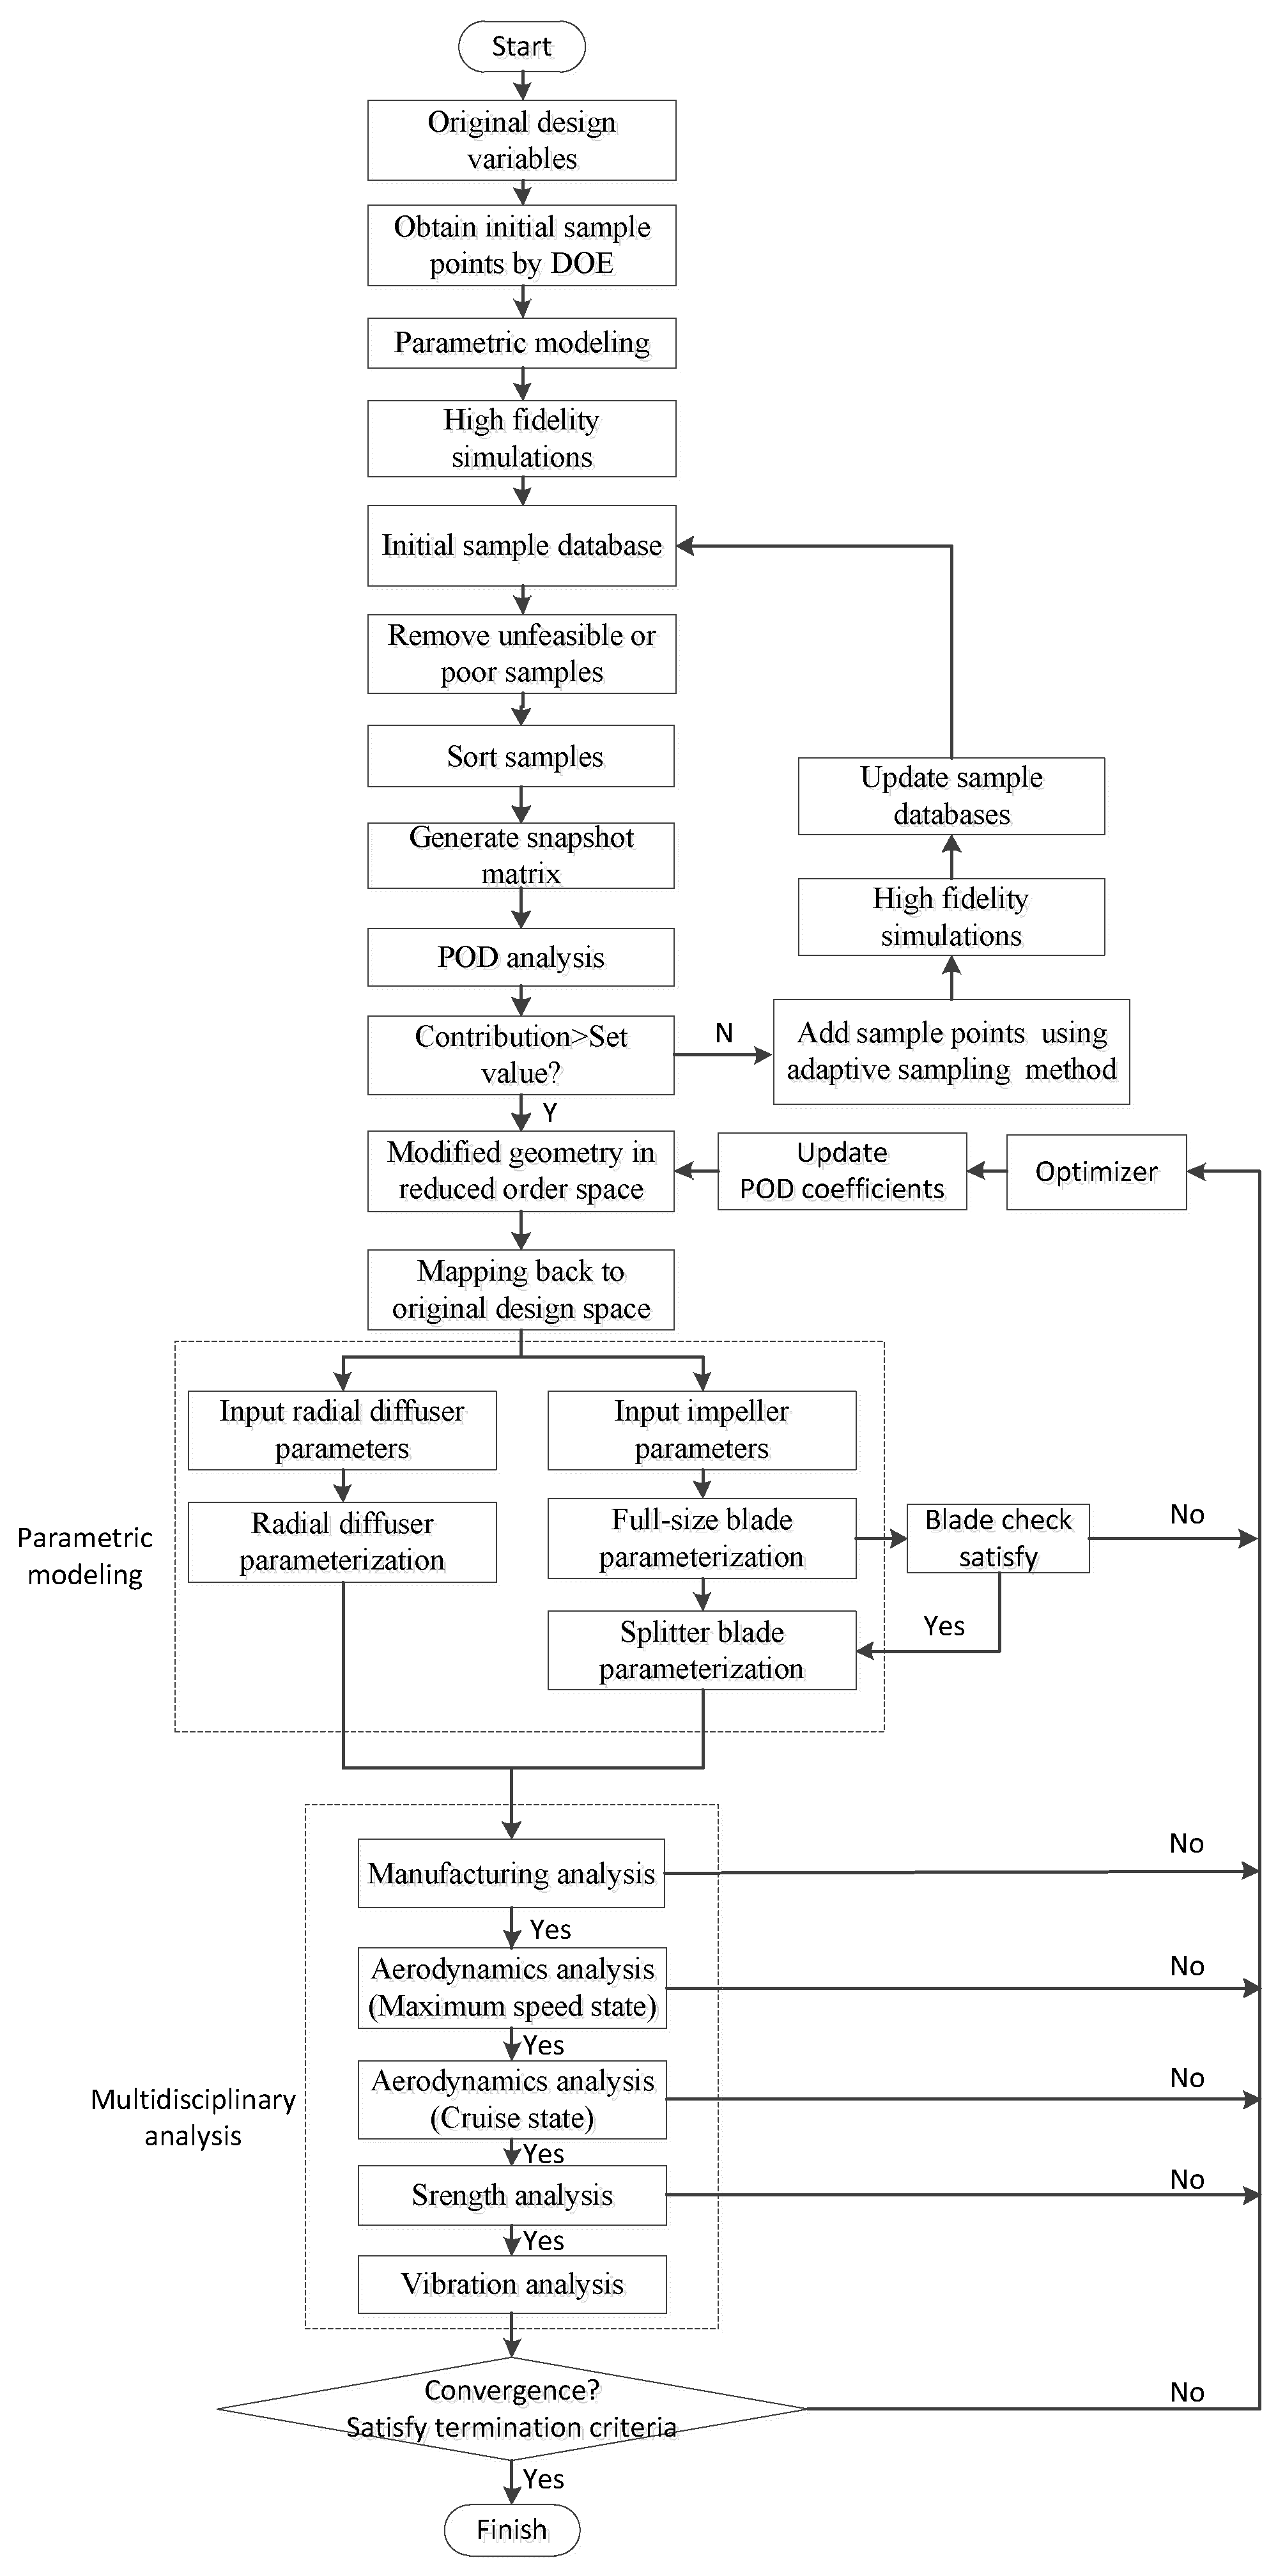
3.1. Optimization Process

To achieve a better aerodynamic performance and more economical processing costs, we propose a POD-based integrated optimization method. Figure 2 shows the process of the method, and the detailed procedure is as follows:
  • Select the design variables and determine their lower and upper bounds.
  • Choose an appropriate design of experiment (DOE) to generate initial sample points. There are several types of DOEs, such as fractional factorial, full factorial, orthogonal array, Latin hypercube, and parameter study. In this study, the Latin hypercube was chosen to carry out 600 experiments, as it allows many points and more combinations can be studied for each factor, and the engineer has total freedom in selecting the number of designs to run as long as it is greater than the number of factors.
  • Utilize the parametric modeling method to generate the new geometry of the impeller and radial diffuser for all the samples obtained from Step (2). Additionally, the mass of blades can be obtained during this process. The parametric modeling method will be introduced in Section 3.2.
  • Conduct high-fidelity simulations such as computational fluid dynamics (CFD) and finite element analysis (FEA) and obtain the relevant responses (objectives and constraints) for all the sample points.
  • Generate the initial sample database by combing the sample points and their relevant responses.
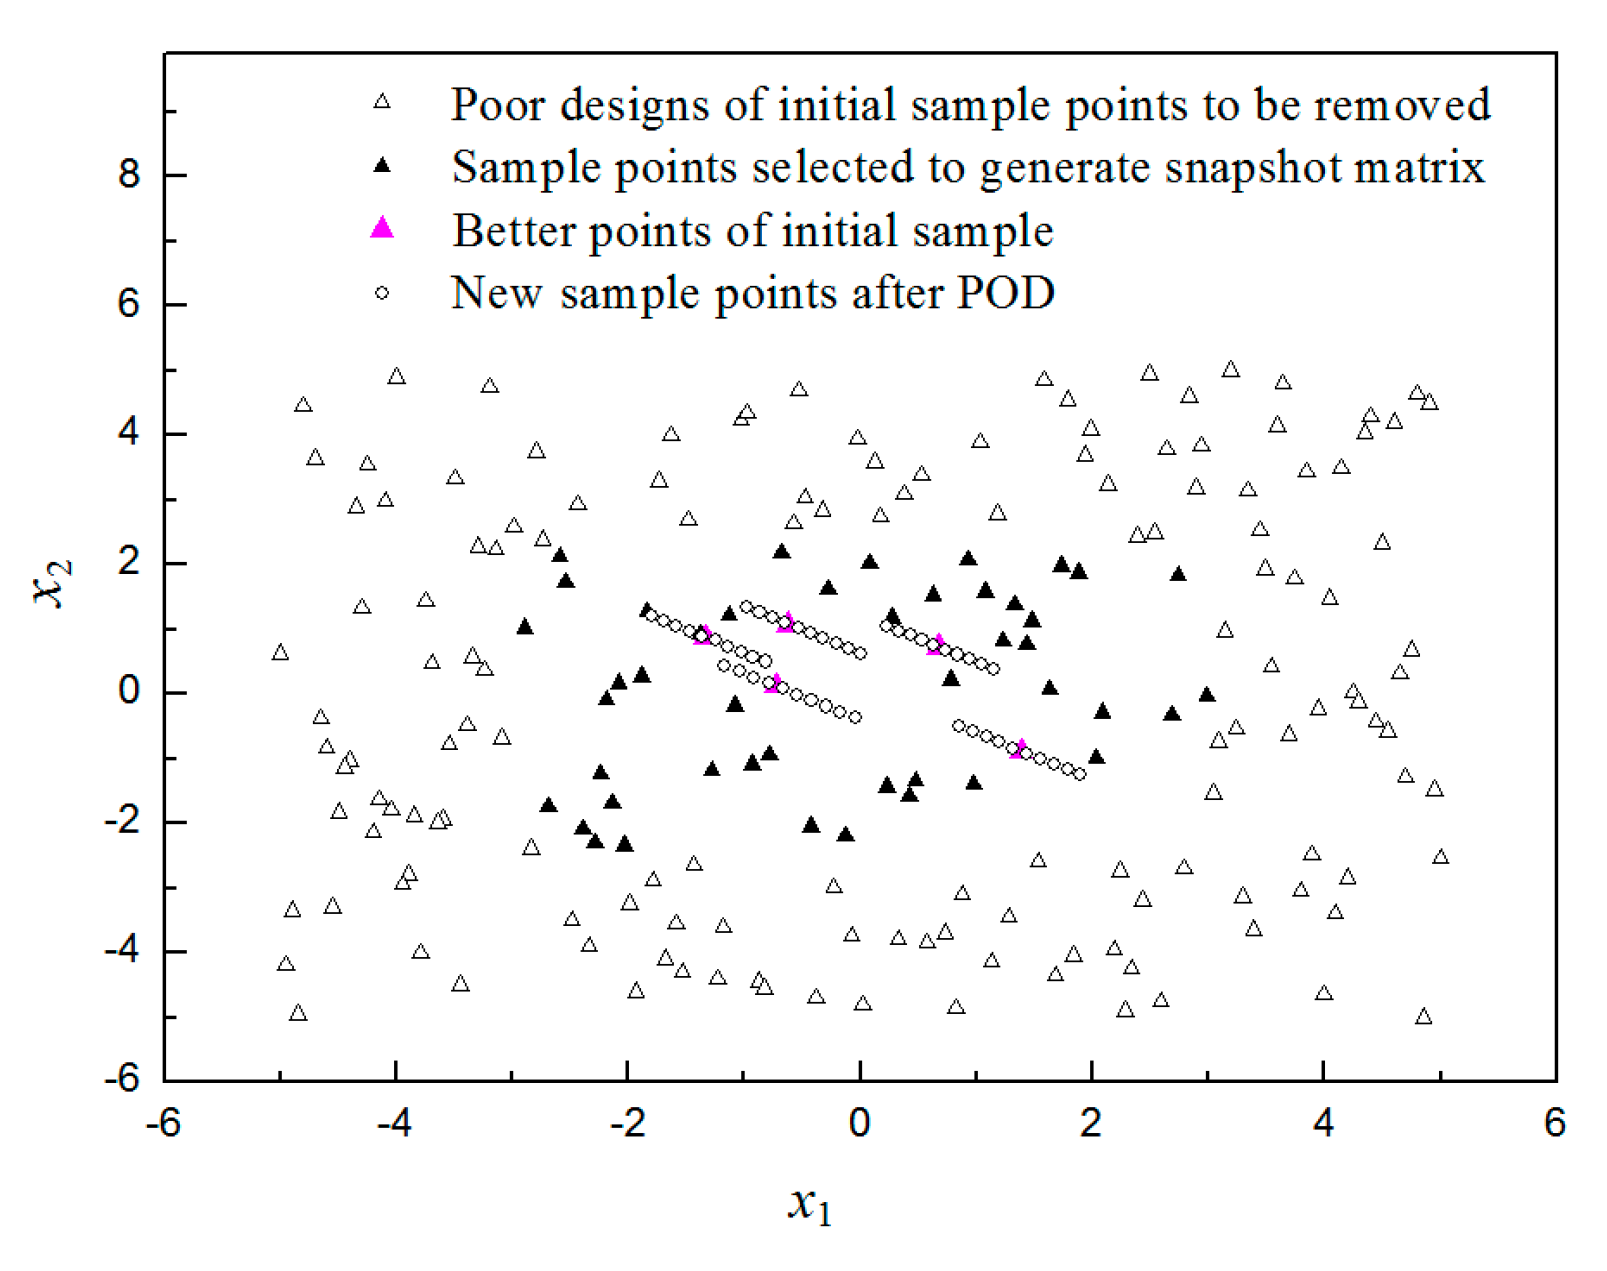
  • Remove some of the samples (unfeasible or poor designs) and the samples are then sorted according to the satisfaction of the objectives and constraints. In other words, the best point in the samples is placed in the first place, and the suboptimal point is placed in the second place, and so on.
  • Generate a snapshot matrix. The data were standardized to have a zero mean and unit variance. In this study, 120 sample points were chosen to generate the snapshot matrix.
  • Conduct a POD analysis of the snapshot matrix, and determine the number of principal components to be retained. In this study, only four principal components were retained. The POD method will be introduced in Section 3.4.1.
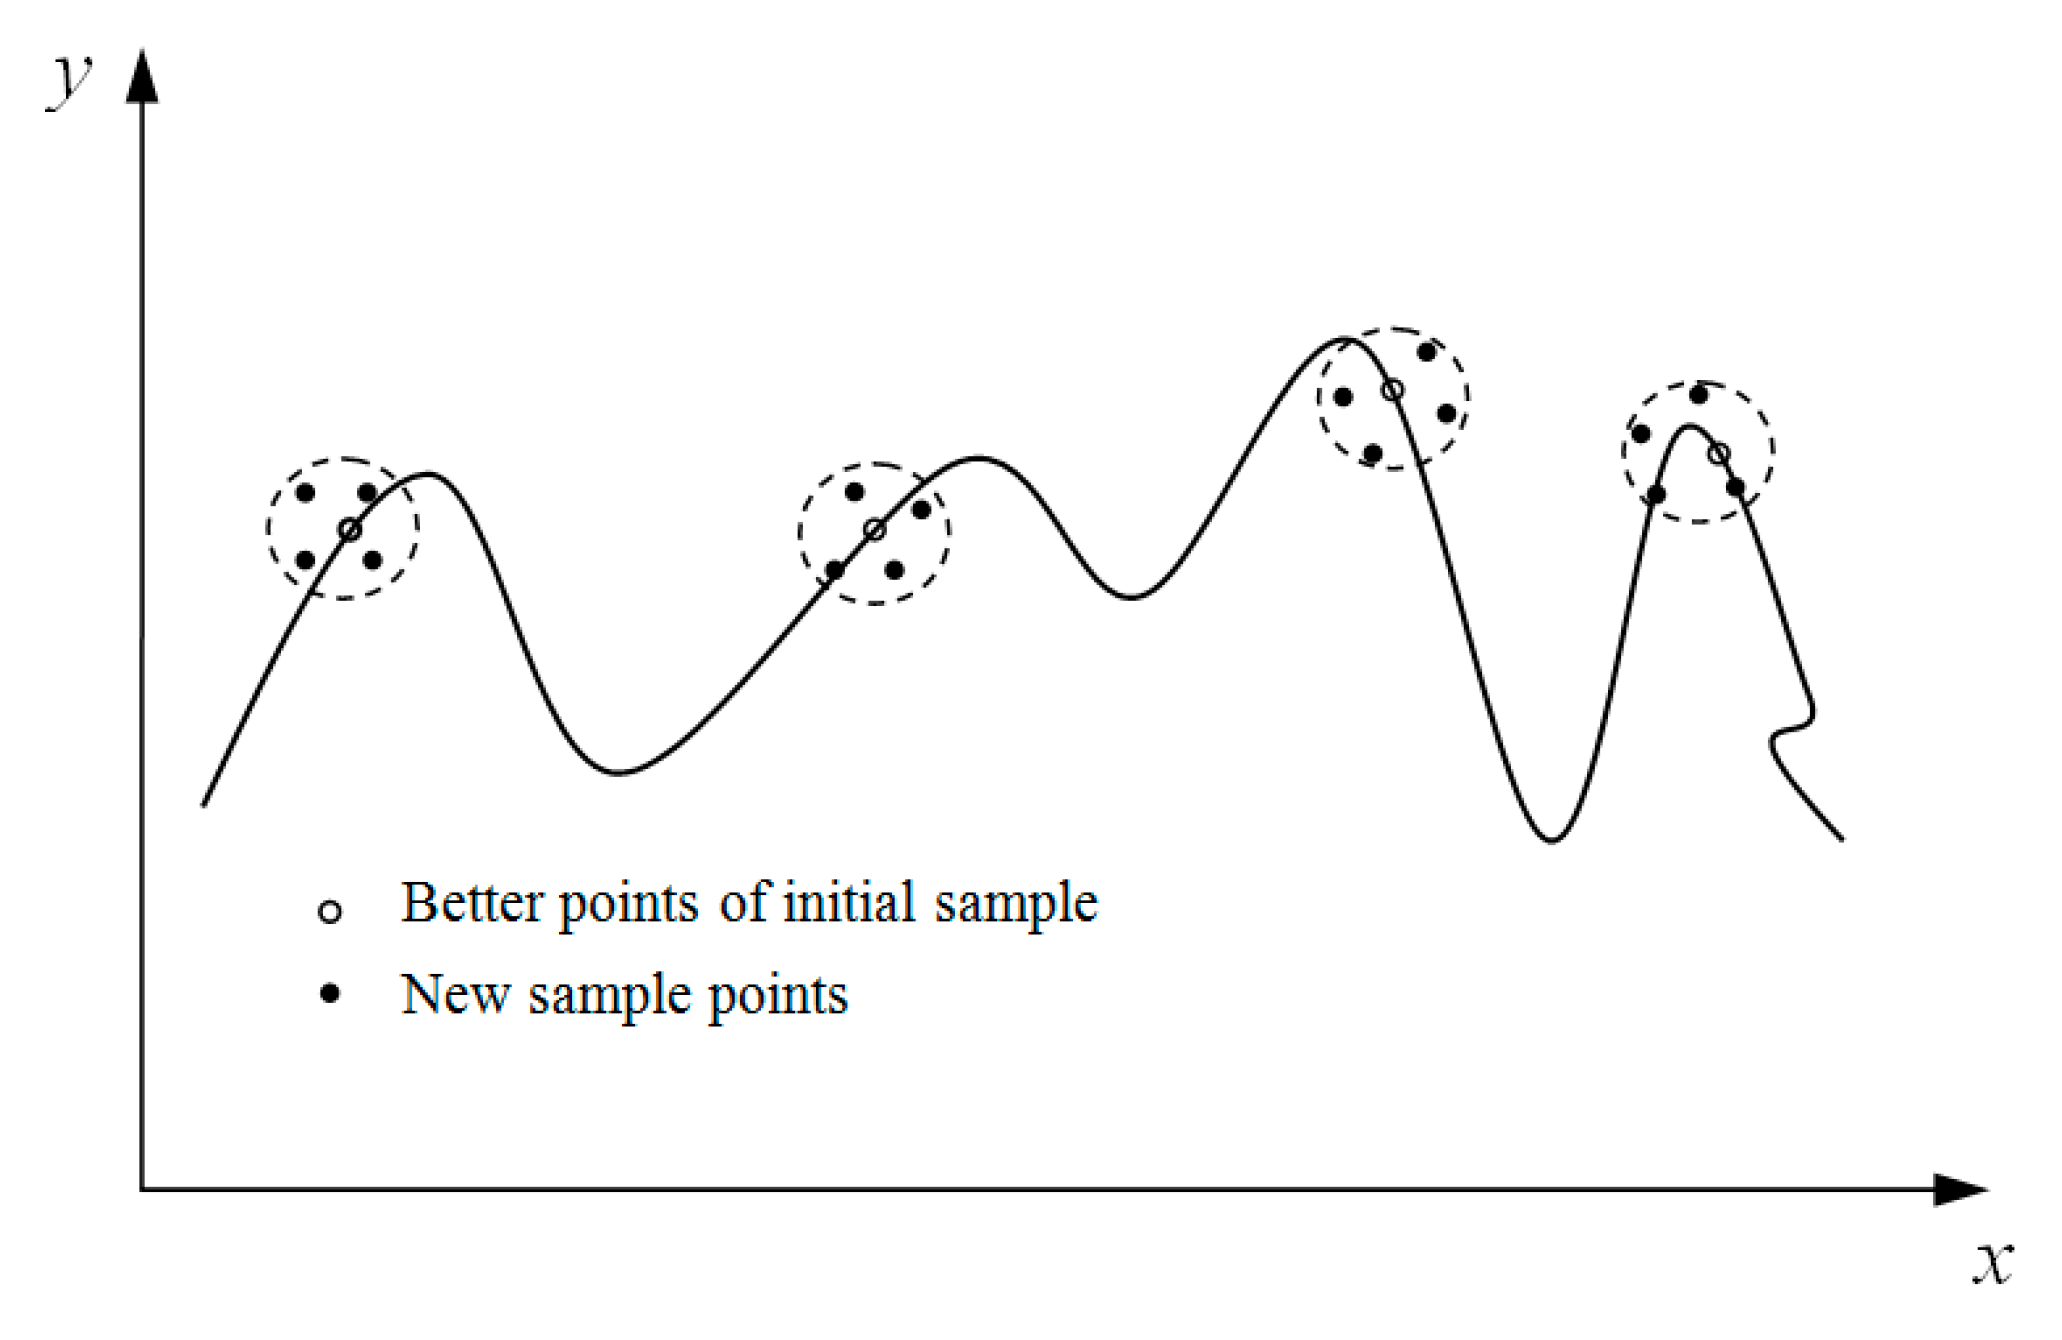
  • Check whether the contribution rate is satisfied or not. If not, increase the sample points using an adaptive sampling method and then update the snapshot matrix. If yes, the cycle will continue. In this study, only one cycle of the sample point adding process is performed to satisfy the requirement of the set value for the contribution rate (85%), and 150 new sample points are added. The sample point adding strategy will be introduced in Section 3.4.2.
  • Select POD coefficients to act as new design variables and a modified geometry in the reduced order space by changing the POD coefficients. Then, project the data back to the original space.
  • Utilize the parametric modeling method to generate the new geometry of the impeller and radial diffuser as Step (3).
  • Conduct a multidisciplinary analysis in sequence. The analysis includes aerodynamics analysis, strength analysis, and vibration analysis, which will be introduced in Section 3.3.
  • Optimize the POD coefficients using an appropriate algorithm. The formulation of the optimization problem will be introduced in Section 3.5. In this study, a hybrid optimization searching algorithm was adopted. The genetic algorithm (GA) was firstly used to search the optimized point and then sequential quadratic programming (SQP) was employed for local optimization. The whole process was integrated and optimized by commercial software iSIGHT (Version 5.9.4, Dassault Systems, Vélizy-Villacoublay, France, 2015) [28].
  • Check whether a convergence or termination criterion is satisfied or not. If not, repeat Steps (10)–(13). If yes, the cycle will be finished, and an optimal design will be obtained.
  • The feedbacks are set up in the process to reduce searching time, which is stated as follows:
    Parameterization part: Check the requirements of the exit lean angle. The given condition is as follows: 0° ≤ exit lean angle ≤ 15°.
    Aerodynamics analysis part: Check the requirements of the adiabatic aerodynamic efficiency, the mass flow, and the pressure ratio.
    Strength analysis part: Check the requirements of the blade stress.
    Termination criteria: Reach the maximum number of iterations (for the present case: 200 steps).

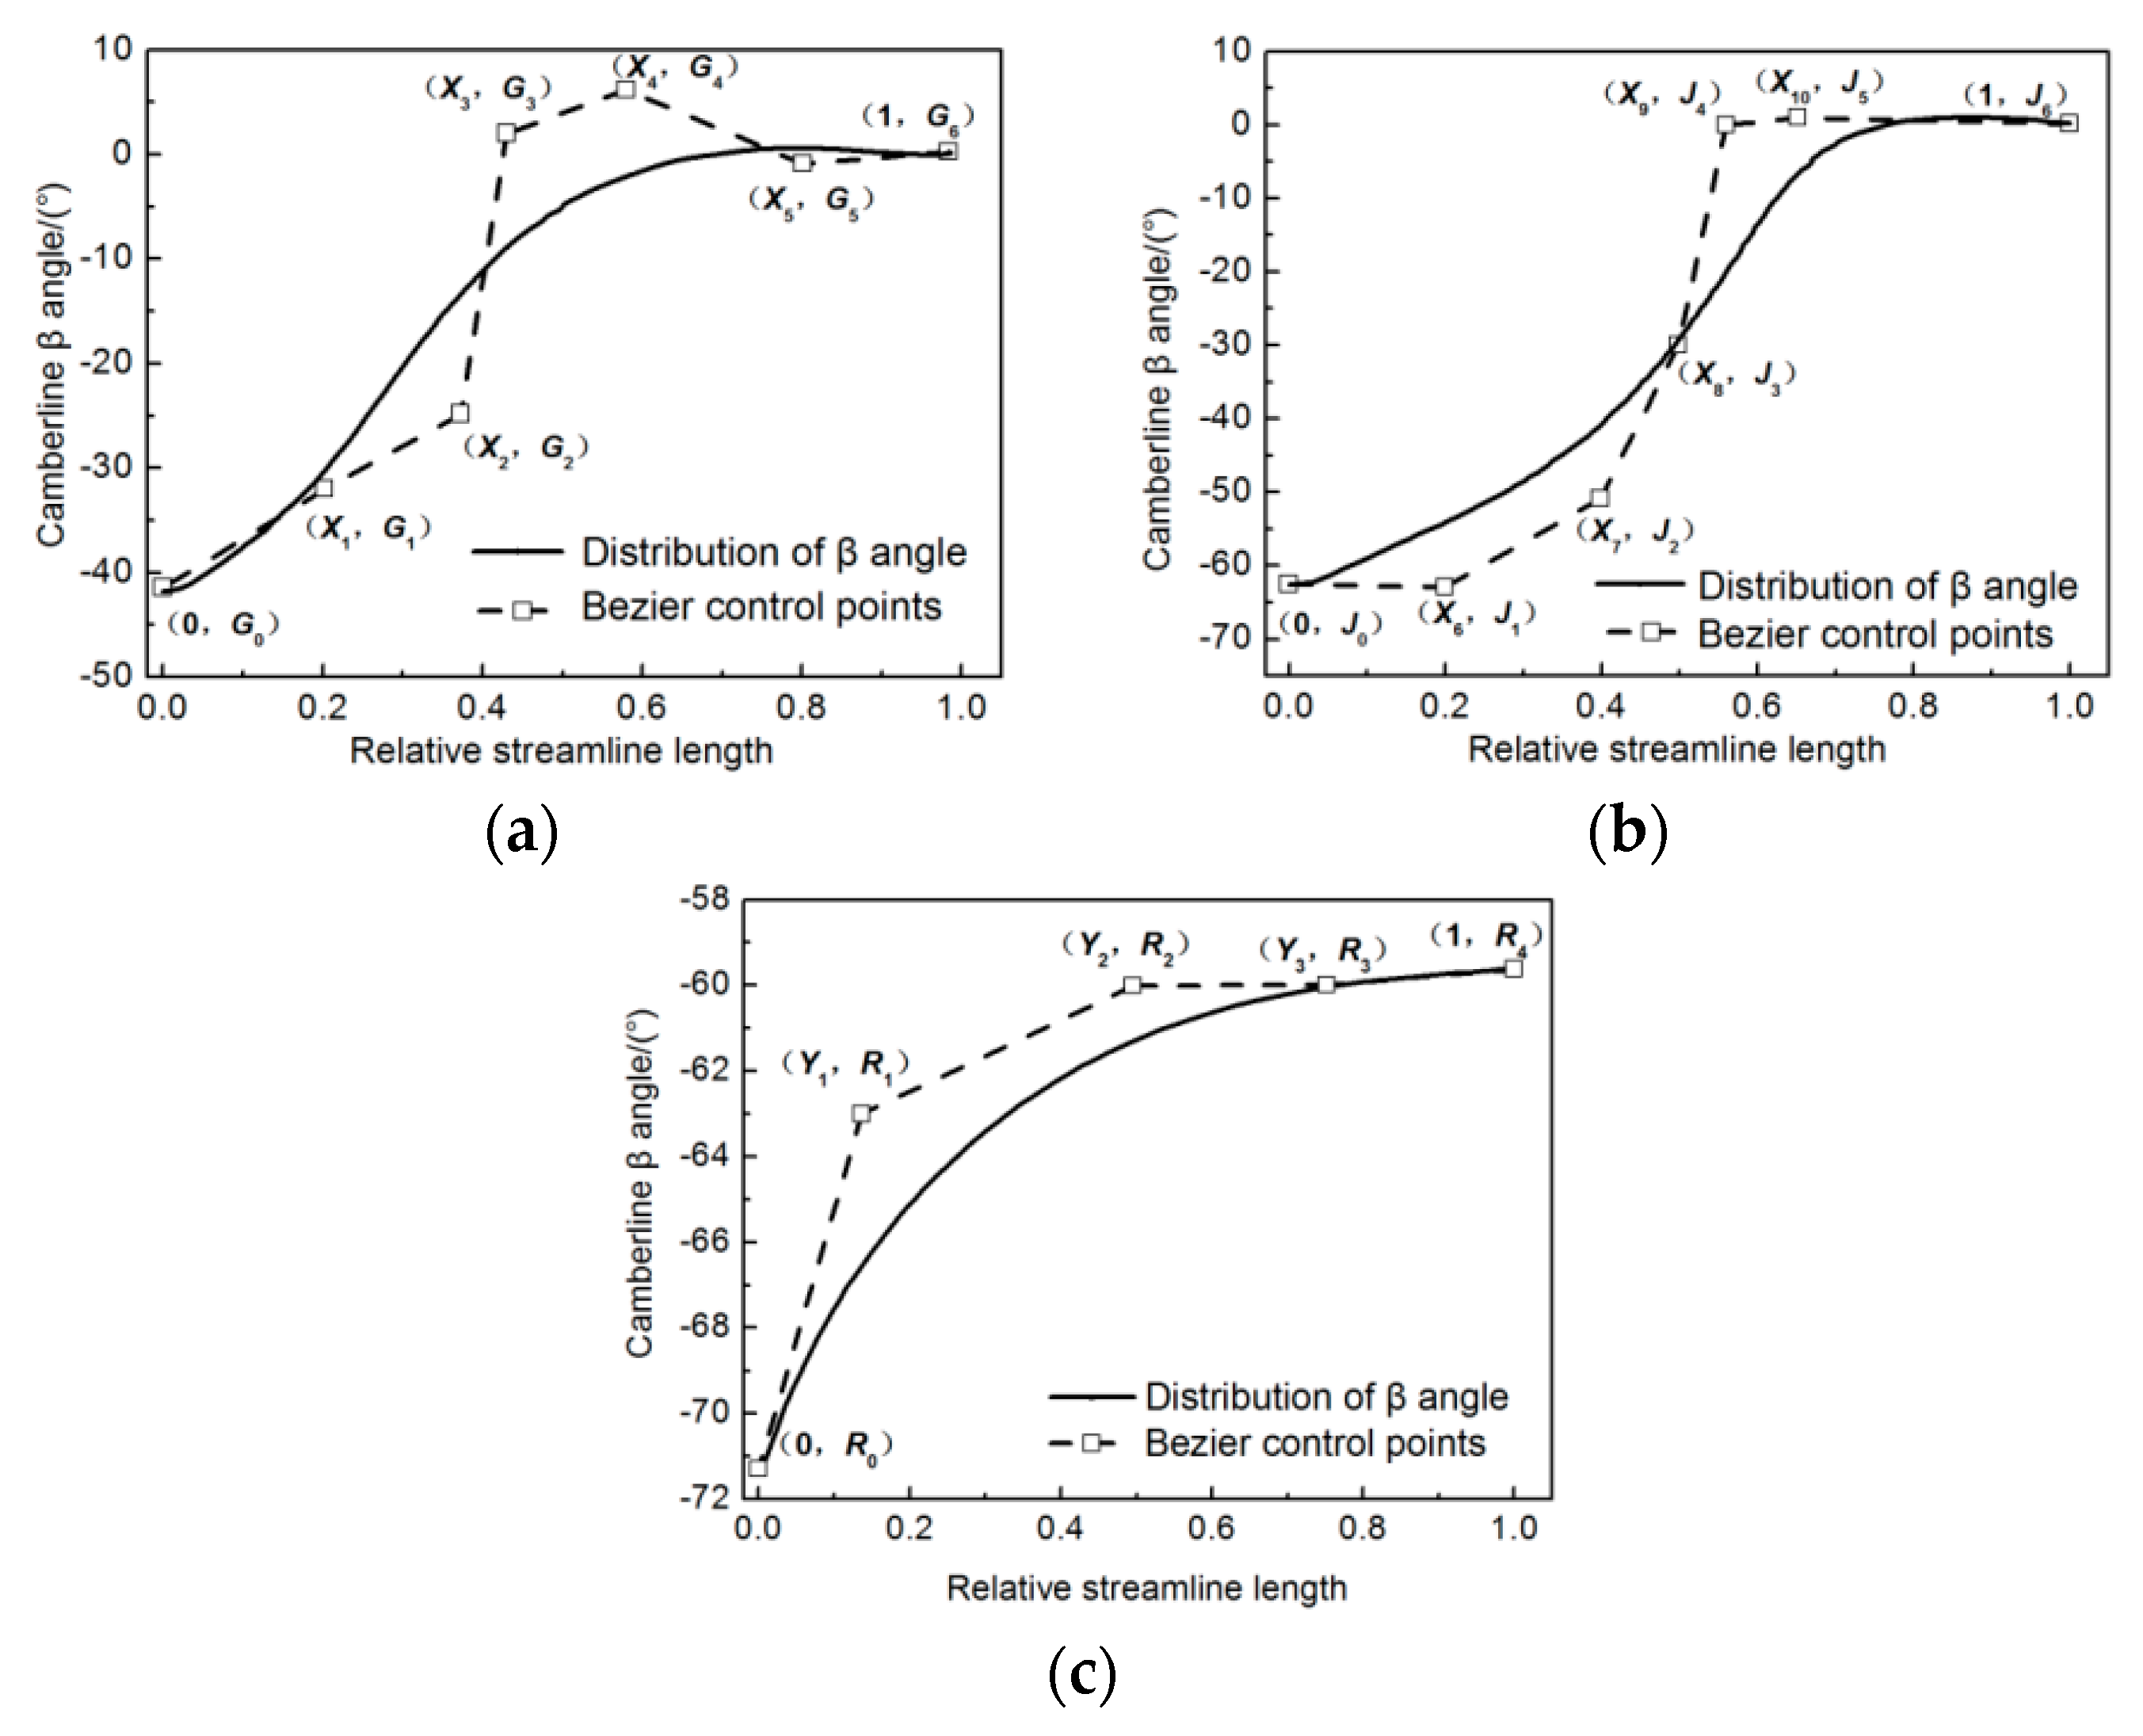
3.2. Geometrical Parameterization

The blades of the impeller and the radial diffuser have a ruled surface. Two blade sections at hub and shroud, respectively, have been employed for the blade parameterization. Each blade section of the impeller was obtained by the superposition of thickness law and the blade camber law, and the blade has a rounded leading edge and a blunt trailing edge. The camber line is composed of two third-order Bezier curves sequentially connected, while the thickness law span-wise is linear. Figure 3a,b shows the camber law of hub and shroud, respectively, and corresponding control parameters. The blade angle distribution at the hub and shroud of the radial diffuser is identical, and only one fifth-order Bezier curve is utilized to model the diffuser, as shown in Figure 3c. Xs ( s = 1 , , 10 ), Ge ( e = 0 , , 5 ), Jh ( h = 0 , , 5 ), Yz ( z = 1 , 2 , 3 ), and Rc ( c = 0 , 1 , 2 , 3 , 4 ) represent the coordinates of the control points and the values.

3.3. Multidisciplinary Analysis

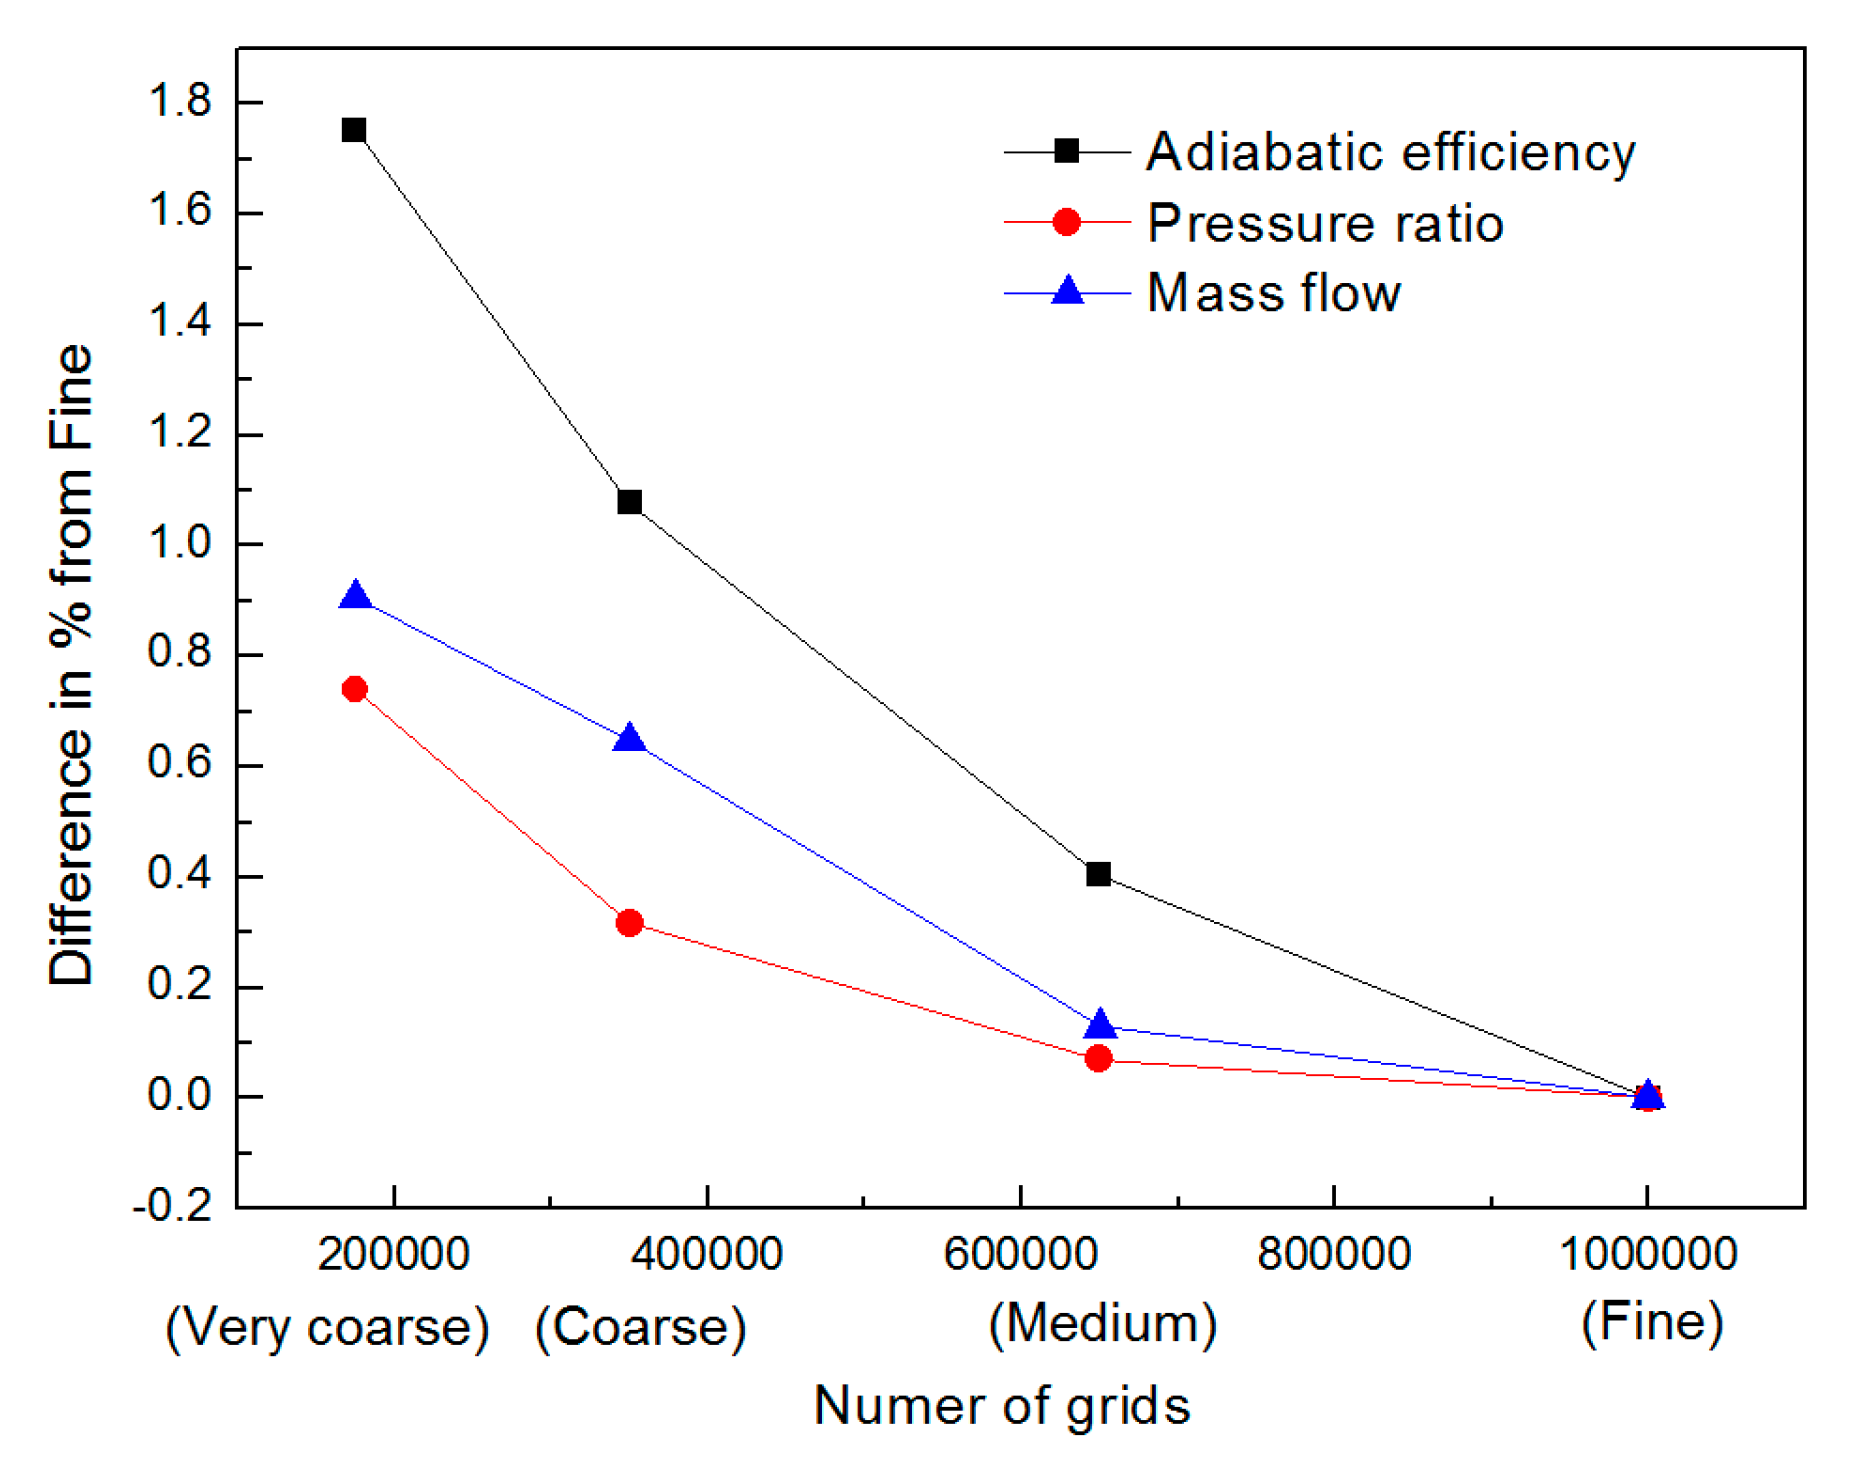
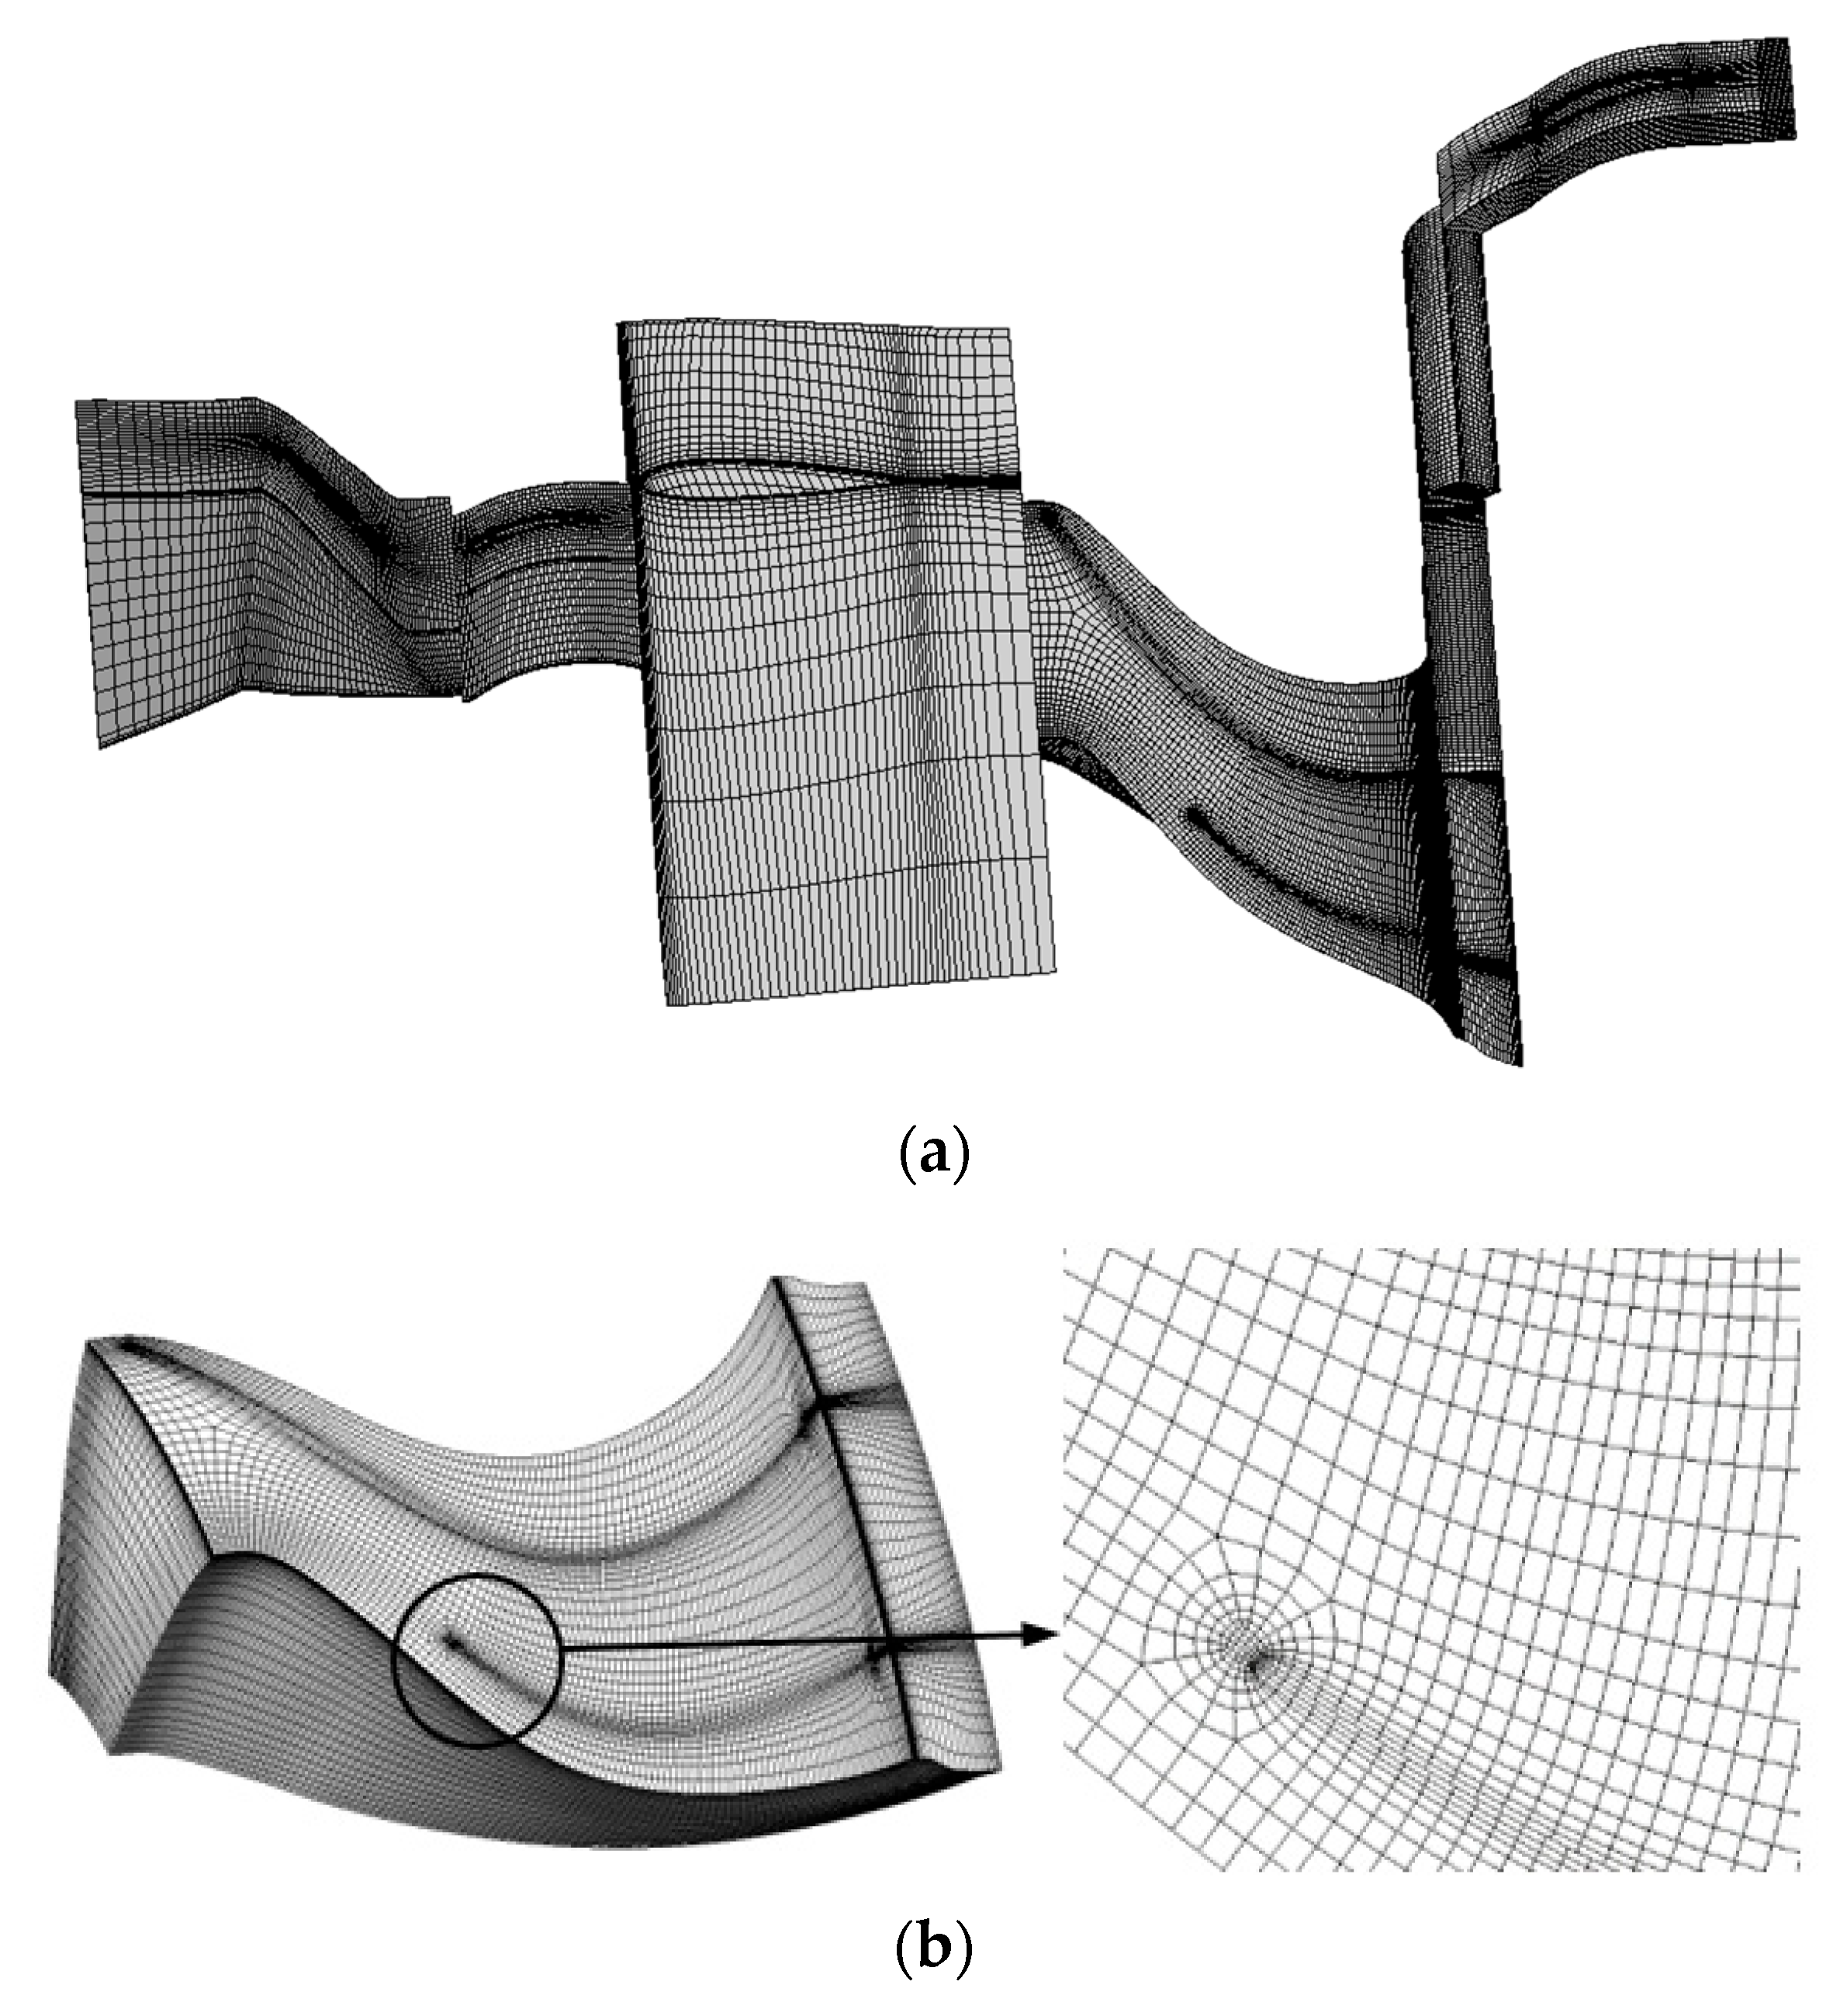
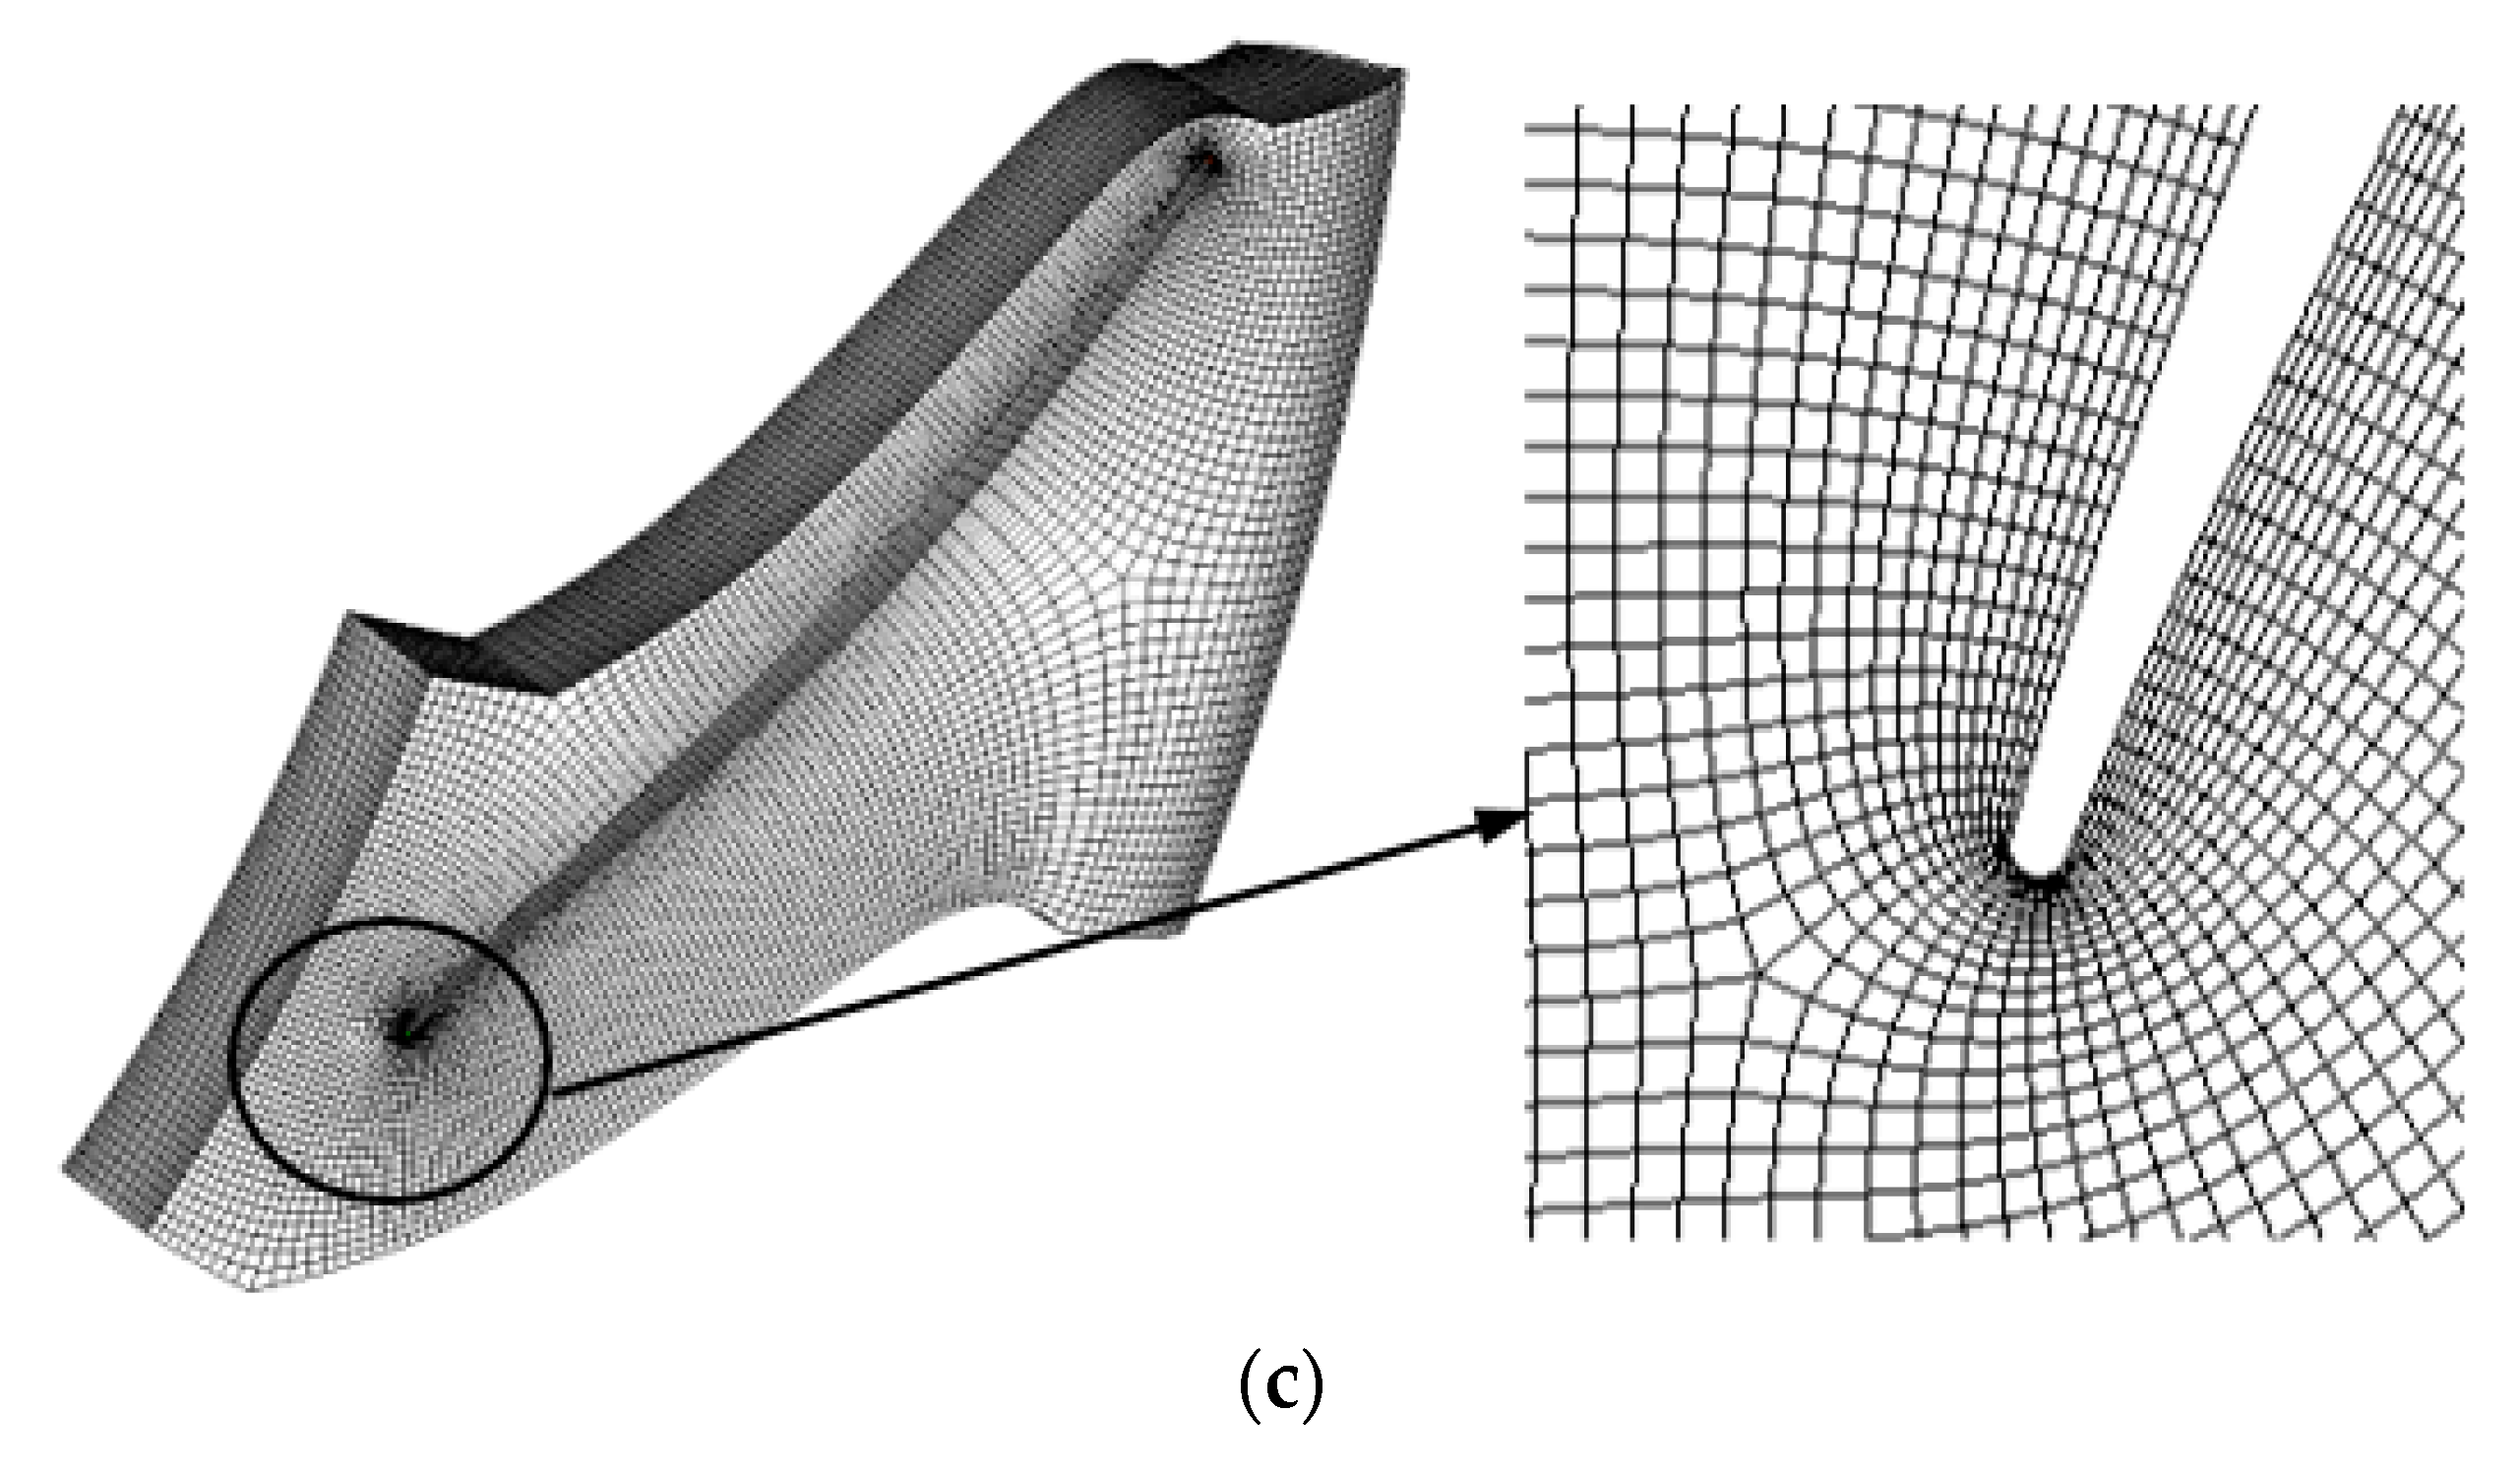
3.3.1. Aerodynamic Analysis

The work of aerodynamic analysis is to solve the basic equations of the three-dimensional flow to gain the pressure ratio, efficiency, mass flow, etc. of each blade row. Three-dimensional aerodynamic analysis for the compressor was evaluated by the commercial package ANSYS CFX (Version 10.0 64-bit, ANSYS: Canonsburg, PA, USA, 2010) [29]. The axial compressors have a surge margin, which can deteriorate the behavior of the centrifugal compressor. The combined compressor has no geometric adjustment and no inter-stage ventilation, so the axial stage enters a surge before the centrifugal stage at low and medium rotating speeds. Thus, although only the centrifugal stage was optimized, the optimization of the centrifugal stage was carried out in the combined compressor. The calculation model includes six rows of blades from the inlet rotor to the axial diffuser outlet. Because of a large number of blades, a periodic unit was arranged in each row of blades, as shown in Figure 4.
A periodic multi-block grid was generated by the TurboGrid module of ANSYS CFX. The grids are made up of H-type hexahedral elements. A grid-independence study was conducted to eliminate the effect of grid resolution on the flow solutions. The computations were performed with four different meshes (very coarse, coarse, medium, and fine). Figure 5 shows the results of the mesh study. Mesh independence was evaluated by the performance parameters (adiabatic efficiency, pressure ratio, and mass flow) at the design point. The difference shown for the mesh sizes is given in relation to the corresponding performance parameter evaluated for the fine mesh. When the number of the grid points is more than 0.65 million, the effect of the grid resolution on the flow solutions is small. Figure 6 shows a three-dimensional CFD mesh. The size of the centrifugal impeller and radial diffuser grids are about 0.16 million and 0.105 million, respectively. A tip clearance of 0.25 mm is included in the axial rotor and the impeller. Turbulence model k-ε was used in the calculation, and artificial dissipation was added. The inlet boundary conditions provide the total pressure, the total temperature, and the direction of air flow. The outlet boundary conditions set the average static pressure. Adiabatic non-slip was imposed on the wall boundary conditions, and a mixing-plan interface was used to connect the junction surfaces. The advection convection scheme was of a high resolution. The order of turbulence numeric was of the first order. The residual type of convergence criteria was Root Mean Square (RMS), and the residual target was 10−6.

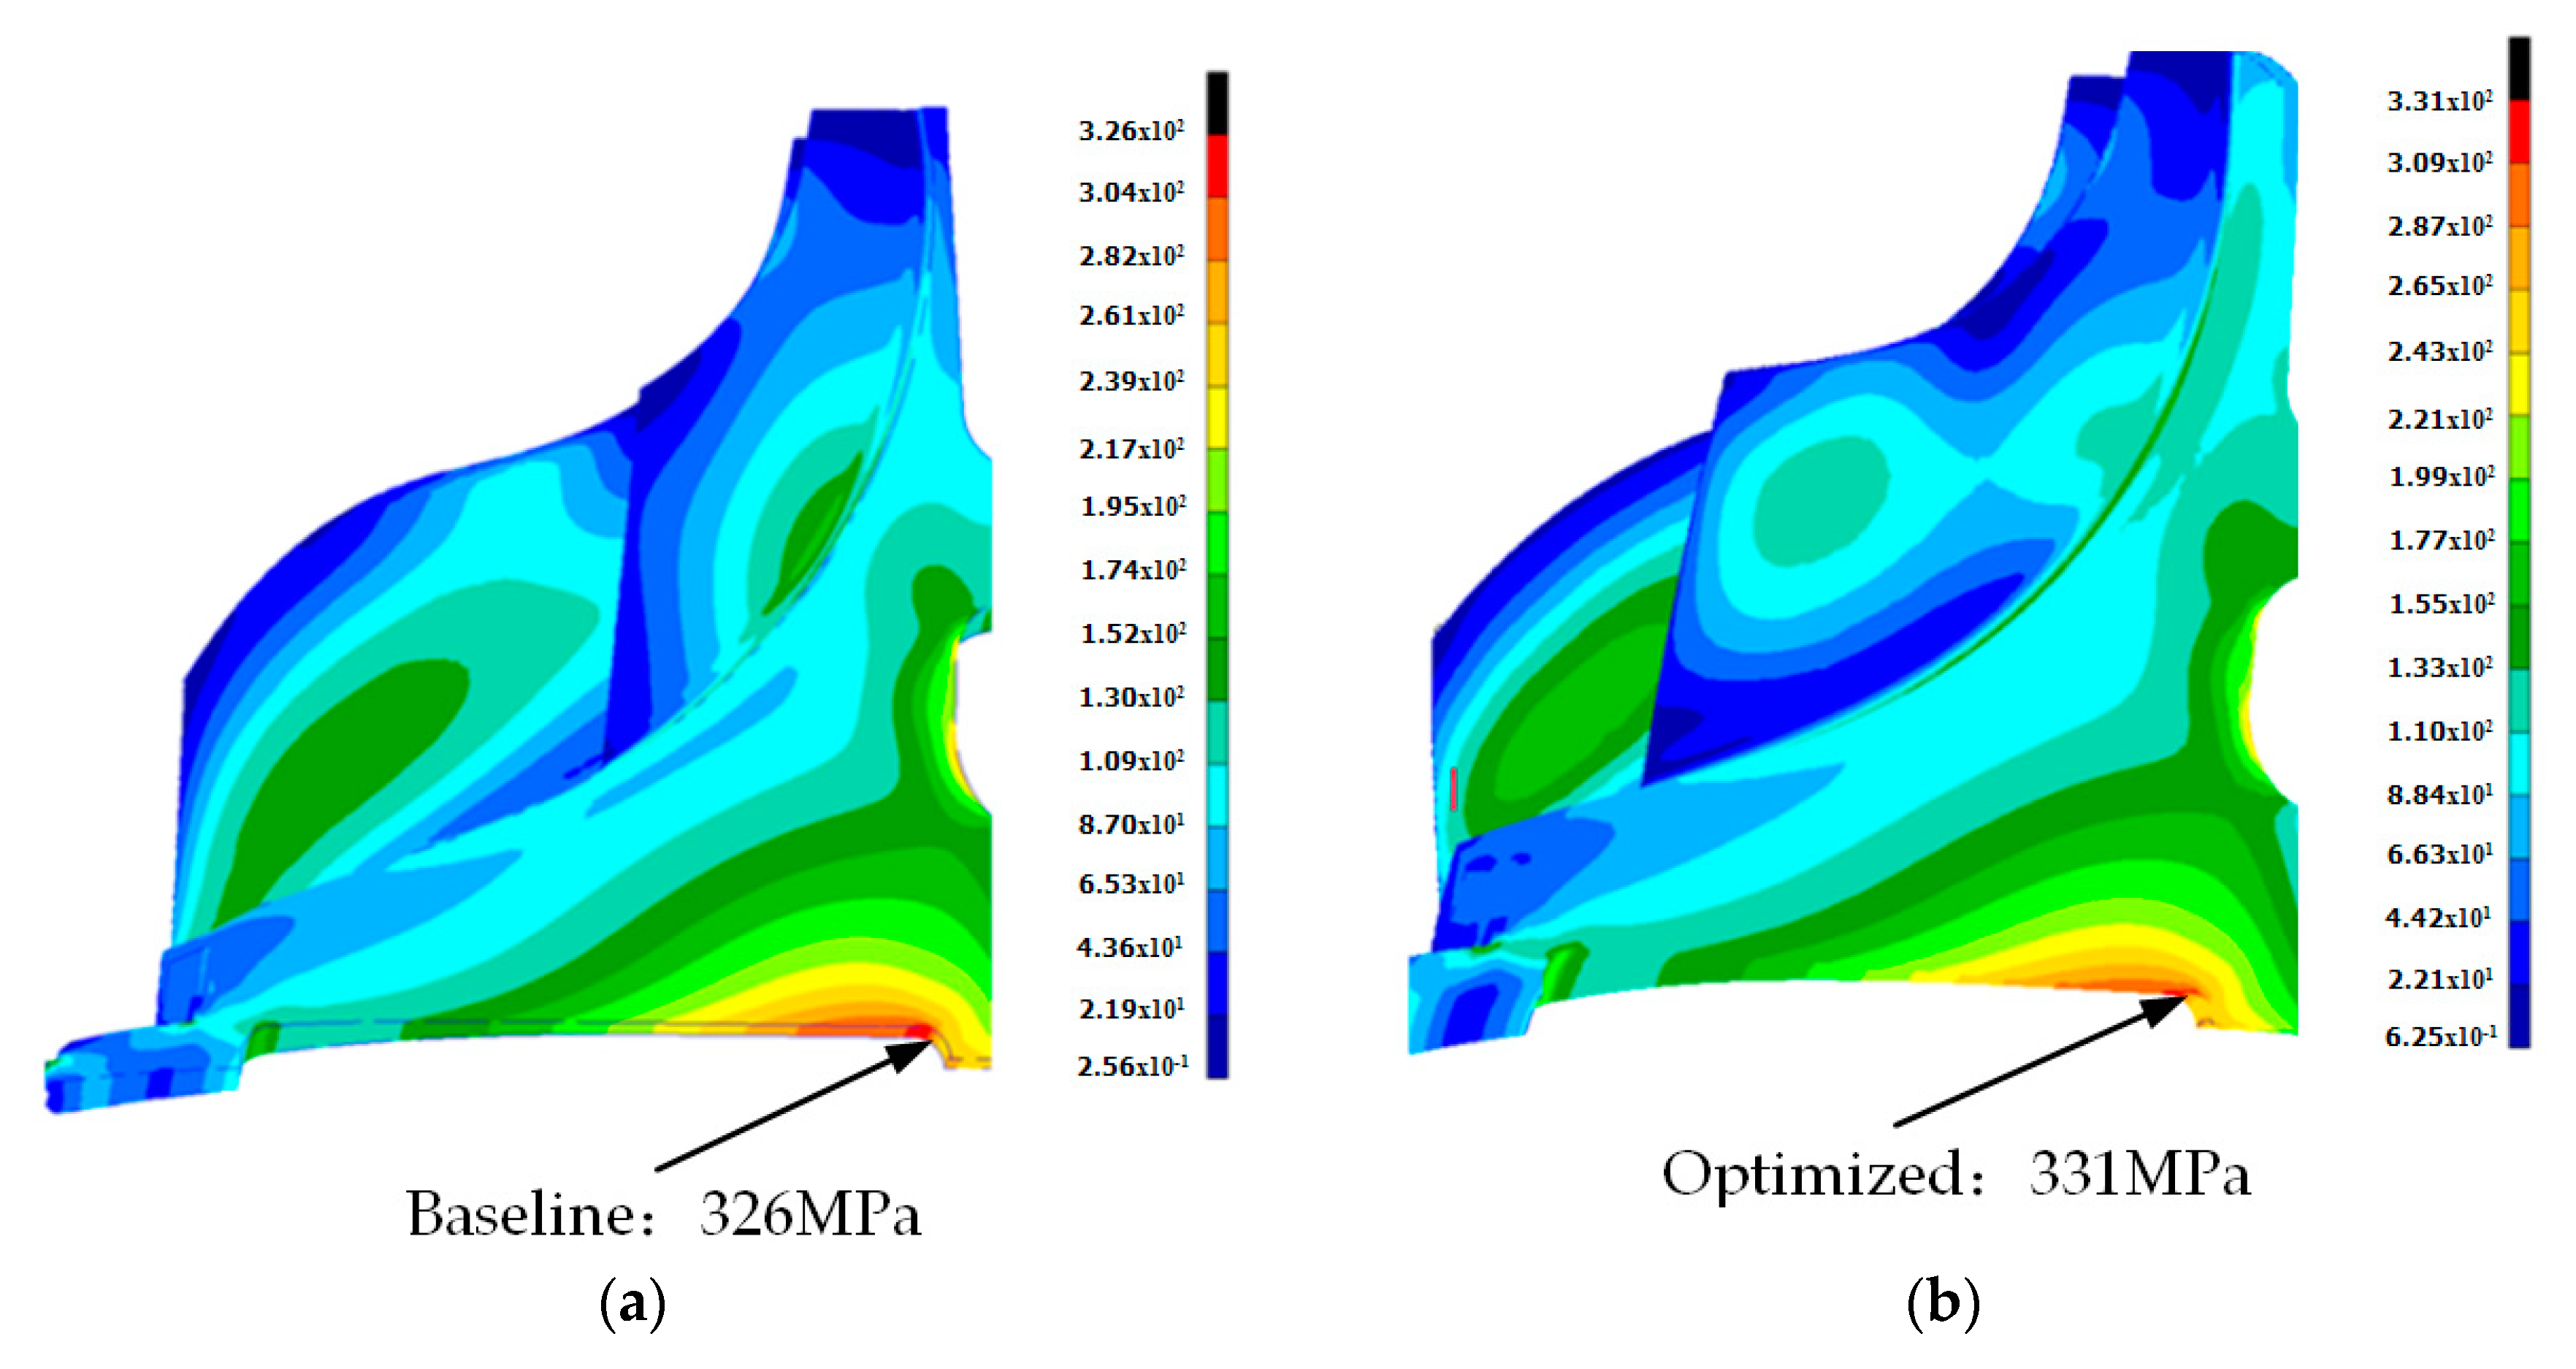
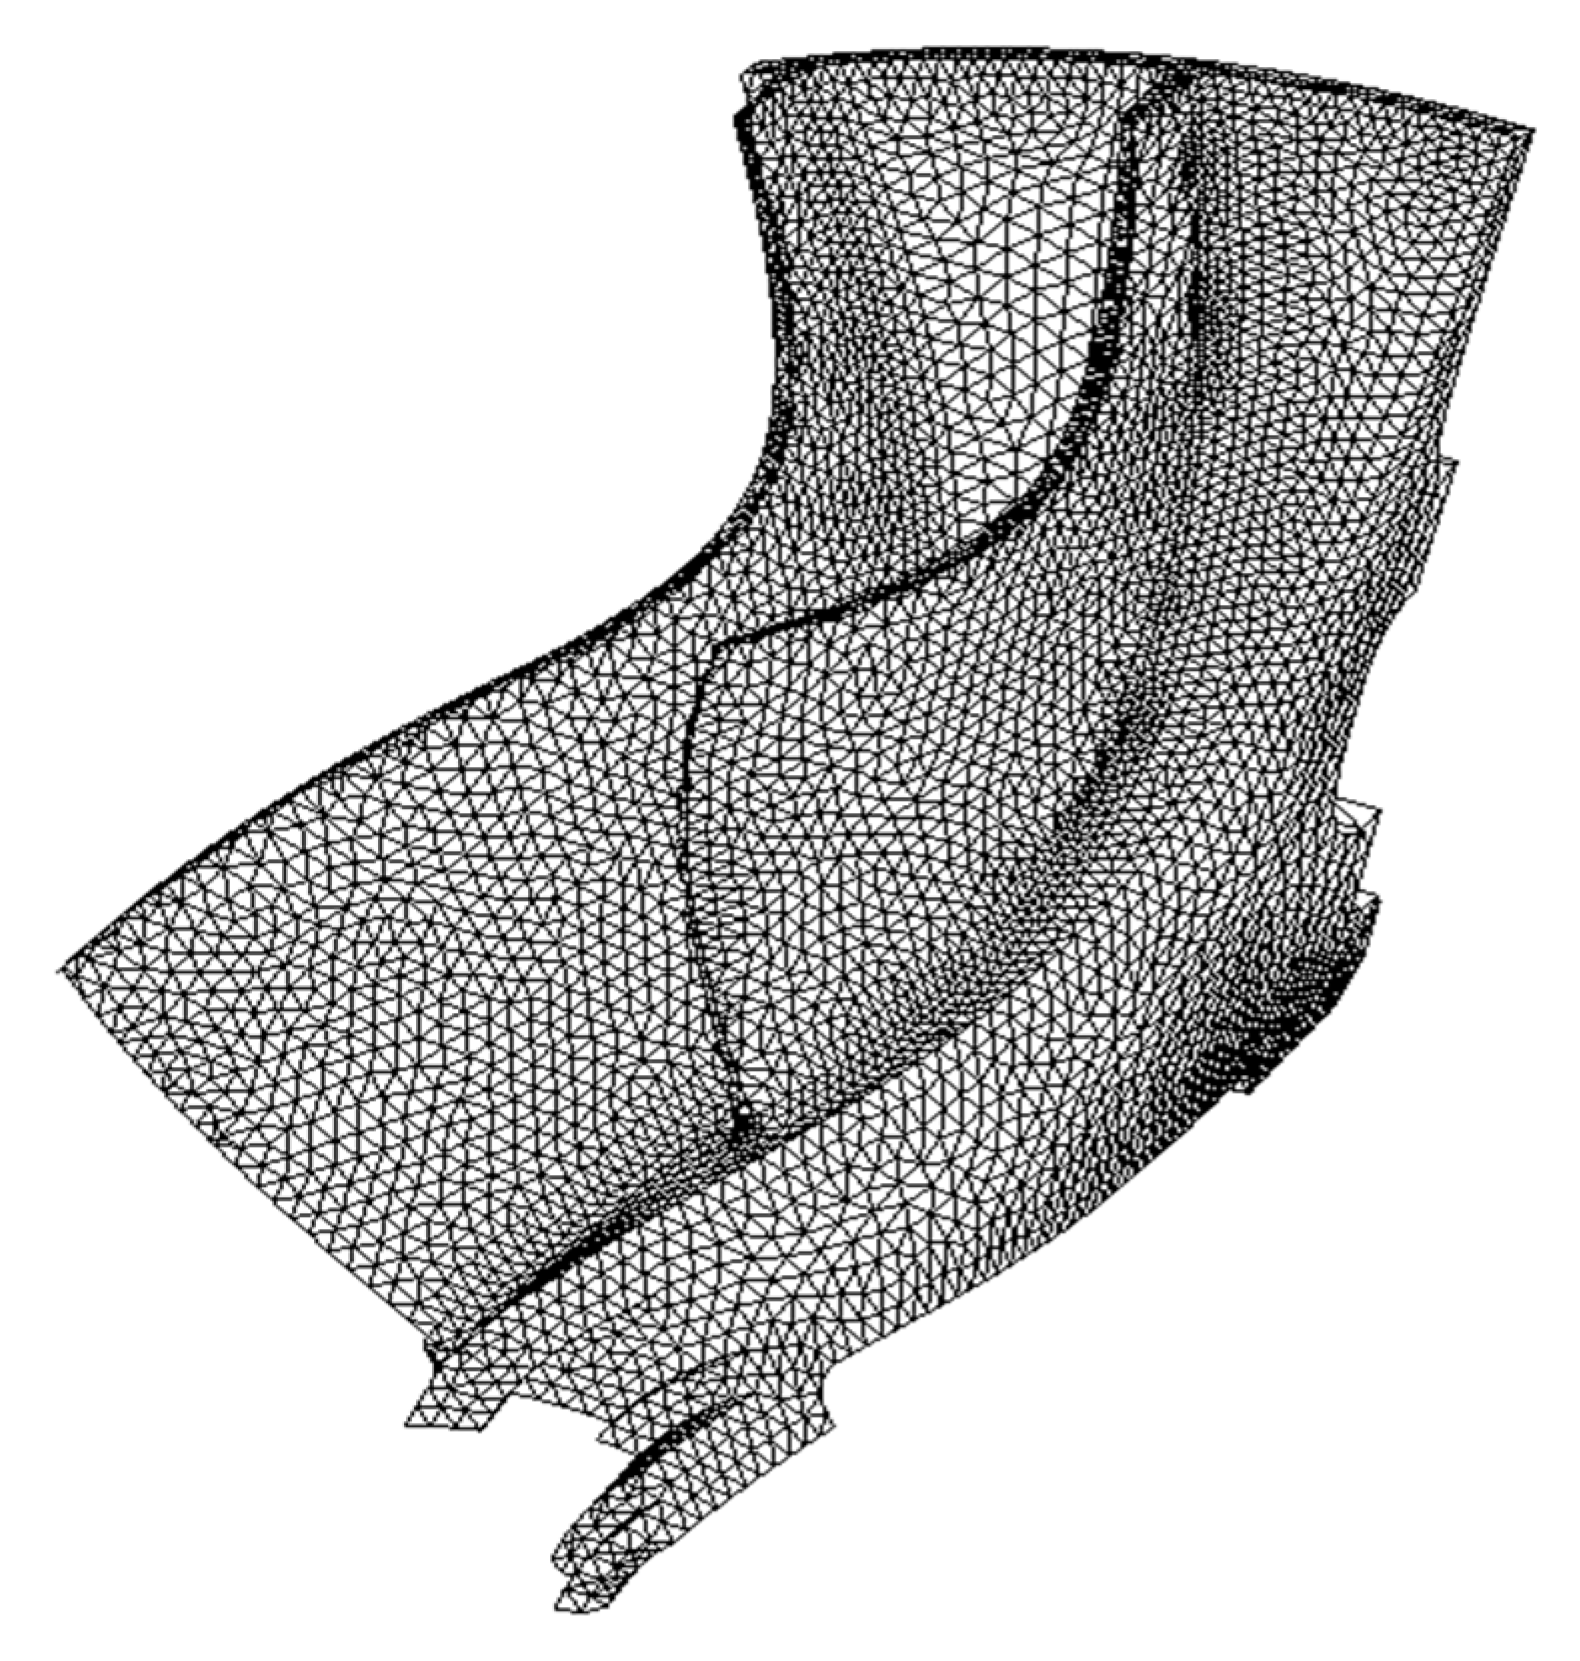
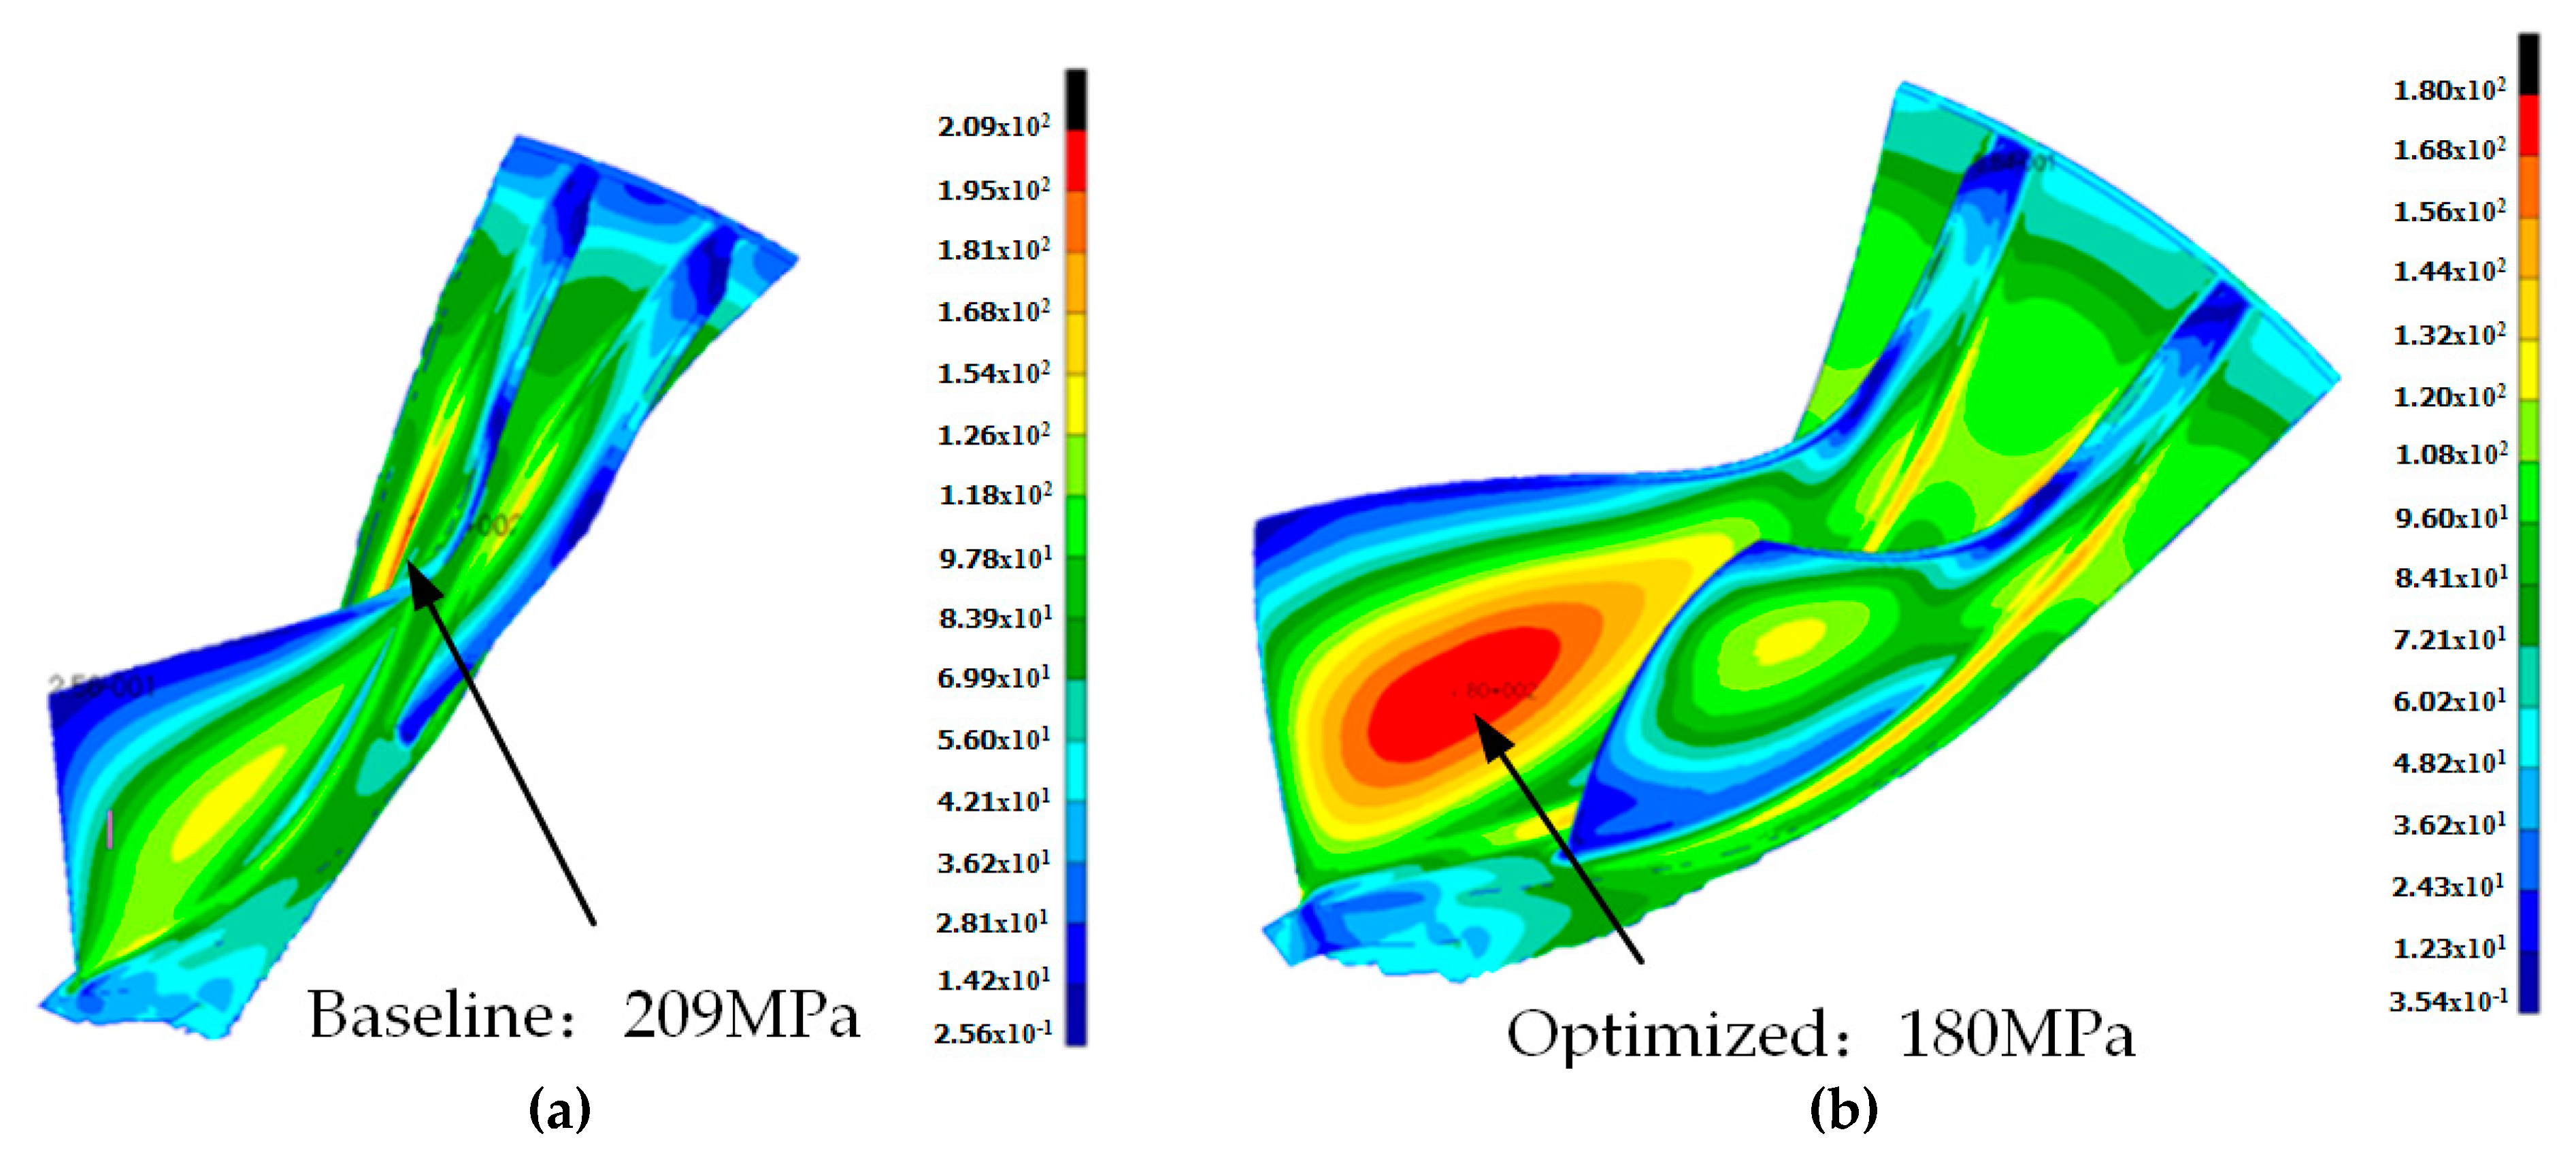
3.3.2. Strength Analysis

The objective of strength analysis is to determine the stress, displacement, and the life of the impeller to guarantee the safety of the impeller. The commercial software MSC (Version 2012 64-bit; MSC Software: Santa Ana, CA, USA, 2012) [30] was selected for strength analysis. An all-trial mesh was generated for the impeller with a total number of 152,000 elements as shown in Figure 7. The centrifugal force and the thermal load were defined in the computer-aided engineering (CAE) model. The centrifugal force was applied based on a spin speed of 50,000 rpm. The temperature field distribution data obtained from heat analysis were used for the thermal loading. The maximum von Mises of the impeller was observed after the strength calculation was completed.

3.3.3. Vibration Analysis

Vibration analysis first solves the frequency of each order of the blade. The vibration margin of each order is then calculated considering the excitation sources to justify whether the designing criteria is satisfied. The vibration analysis was conducted utilizing commercial package ANSYS Mechanical (Version 15.0 64-bit; ANSYS: Canonsburg, PA, USA, 2015) [31]. A course mesh with only half the mesh size for strength analysis was adopted to reduce model analysis time during the optimization process.

3.4. POD-Based Dimension Reduction Technique and an Adaptive Sampling Method

3.4.1. POD-Based Dimension Reduction Technique

The POD-based optimization method includes choosing snapshot sample points and building a reduced order model (ROM). The sample points have a great impact on the final optimization results and can be obtained in a variety of ways, such as selecting from initial optimization results and obtaining by DOE. The procedure of building ROM based on POD is as follows.
Given the data matrix X = [ x ( 1 ) x ( i ) x ( n ) ] , where x ( i ) = [ x 1 ( i ) , x 2 ( i ) , x m ( i ) ] t is the ith sample, m is the number of design variables.
Then, solve the eigenvector function:
XX t U = U Λ .
It equivalent to solve the following function:
XX t φ ( i ) = λ i φ ( i ) , i = 1 , , n ,
where U stands for eigenvectors matrix of XX t , and the columns of U = [ φ 1 φ ( i ) φ ( n ) ] are basis eigenvectors. Λ represents the diagonal matrix of eigenvalues λ i .
Using the above method, mapping the data from the original design space to projected design space:
X proj [ m , n ] = U T [ m , n ] X [ m , n ] .
By retaining only the most significant components after POD analysis, an ROM of original design space is constructed:
X ROM [ k , n ] = U T [ k , n ] X [ m , n ] .
Given a new point X proj in the projected design space:
X proj [ m , 1 ] = X proj opt [ m , 1 ] μ [ 1 , m ] .
The correspondent point in the original design space is:
X [ m , 1 ] = U [ m , n ] X proj [ m , 1 ] ,
where μ [ 1 , m ] = [ μ 1 , μ 2 , , μ k , 1 , 1 , 1 ] T are POD coefficients.
The POD coefficients act as the new design variables. The number of design variables is reduced as the number of POD coefficients is much less than original parameters (k is far less than m).

3.4.2. The Adaptive Sampling Method

To reduce the total number of sample points, an adaptive sampling approach was used. Firstly, fewer sample points were used for initial sampling, which is insufficient for the accuracy requirement. New sample points were then added after POD analysis. The approach places more points around regions of initial optimum designs by learning information from previous data through POD analysis. The initial sample points usually contain better points for the multimodal optimization problem. However, which point among these is near the optimal solution is uncertain. Our solution is to add new points around several better points of the initial sample, as shown in Figure 8. Consequently, the method has great potential to decrease the total sample points required and further reduce computational costs.

3.5. Formulation of the Optimization Problem

The definition of the MDO problem includes the determination of design variables, constraints, and objectives. The main modeling parameters for the impeller and radial diffuser include the distribution of the blade angle of the mean camber line at the blade hub and blade tip and the distribution of thickness. Specifically, the distribution of blade angle can mainly determine the aerodynamic performance of the impeller and can dominate the characteristics of impeller strength and vibration simultaneously. Therefore, only the distribution of the blade angle of the impeller and diffuser is optimized in the present paper, and the distribution of thickness remains the same. During the optimization process, the control points of Bezier curves (shown in Figure 3) are selected as design variables, the values of which are listed in Table 1.
Constraints are typically the requirements of aerodynamics, strength, vibration, etc. For aerodynamics, the blade shape should satisfy the criteria of aerodynamic design accurately, and the major constraints of aerodynamics of the current MDO are the mass flow, the pressure ratio, and the surge margin. From a strength perspective, the blade should not be broken under the working loads, and the maximum radial stress should therefore be less than the allowable stress in the present research. Low cycle fatigue is the most important factor affecting the life of the impeller disc. In the process of engine development, low cycle fatigue life is guaranteed to meet the user-specified design life requirements mainly through design and test. The TBO (time between overhaul) life of this engine is 1000 h. According to the requirement of TBO and flight load spectrum, the life of the impeller needs to reach 9000 cycles. Once the maximum von Mises stress is obtained, the life of the blade can be calculated according to the same classical methods with the material properties. Therefore, the maximum von Mises stress is employed as a constraint. When considering the vibration, the blade resonance should be avoided. After frequency analysis, the natural frequency of former orders of the blade can be gained and current investigation only focuses on the vibration frequency (dynamic frequency) of the four former orders of the blade. The index to evaluate regarding whether the blade can be kept away from resonance is the resonance margin. For the present MDO, the resonance margin should not be less than 10%.
In the current research, the objective was to gain the optimized isentropic efficiency and minimize the number of blades.
The optimization problem is presented as Equation (7). The aerodynamic efficiency, mass flow, pressure ratio, and the number of blades are normalized by Equation (8):
min : { 1 / η 1 * , 1 / η 2 * , n 1 * , n 2 * } f i n d : X s , G e , J h , Y z , R c s . t .   : { X s l X s X s u G e l G e G e u J h l J h J h u     Y z l Y z Y z u R c l R c R c u     0 α 15 0.98 m r e f * m 1 * 1.03 m r e f * 0.90 m r e f * m 2 * 0.95 m r e f * 0.98 m r e f * π 1 * 1.02 m r e f * 0.75 m r e f * π 2 * 0.79 m r e f * δ 1 10 % δ 2 10 %   150 σ blade 200   300 σ disc 331 ,
η 1 * = η 1 / η 1 ( 0 ) ,   η 2 * = η 2 / η 1 ( 0 ) m 1 * = m 1 / m 1 ( 0 ) ,   m 2 * = m 2 / m 1 ( 0 ) π 1 * = π 1 / π 1 ( 0 ) ,   π 2 * = π 2 / π 1 ( 0 ) n 1 * = n 1 / n 1 ( 0 ) ,   n 2 * = n 2 / n 2 ( 0 ) ,
where η1 and η2 represent aerodynamic efficiency at maximum speed state and cruise state, respectively; n1 and n2 represent the number of blades of the impeller and radial diffuser, respectively; m1 and m2 represent the mass flow at maximum speed state and cruise state, respectively, kg/s; π1 and π2 represent the pressure ratio at the maximum speed state and cruise state, respectively; the superscript l denotes the lower limit, u denotes the upper limit; the superscript ref denotes the reference value; the superscript (0) denotes the value before optimization; the superscript * denotes the normalized value; α is exit lean angle; δ1 and δ2 represent the vibration margin at maximum speed state and cruise state, respectively; σblade and σdisc represent the maximum von Mises of the impeller blade and disc, respectively, MPa.

4. Method Validation

4.1. Numerical Experiments

Three mathematical test functions (TFs) were selected to evaluate the performance of POD in comparison with the M-POD (POD coupling with adaptive sampling method). Additionally, the surrogate model of the radial basis function (RBF) was included to prove the advantages of the modified POD:
TF1: Six Hump Function:
f ( x ) = 4 x 1 2 2.1 x 1 4 + x 1 6 3 + x 1 x 2 4 x 2 2 + 4 x 2 4 ,
where 5 x 1 , x 2 5 .
The function has six local optimal solutions and two global optimal solutions. The global minimum is located at
x * = f ( 0.0898 , 0.7126 )   and   x * = f ( 0.0898 , 0.7126 ) ,   f ( x * ) = 1.0316 .
TF2: Styblinski–Tang Function [32]:
f ( x ) = 1 2 i = 1 D ( x i 4 16 x i 2 + 5 x i ) ,
where D = 5, and 5 x i 5 .
The global minimum is located at
x * = f ( 2.903534 , 2.903534 , 2.903534 , 2.903534 , 2.903534 ) ,   f ( x * ) = 195.831 .
TF3: Rosenbrock Function [33]:
f ( x ) = i = 1 D 1 [ 100 ( x i + 1 x i 2 ) 2 + ( x i 1 ) 2 ] ,
where D = 10, and 5 x i 5 .
The global minimum is located at x * = f ( 1 , , 1 ) , f ( x * ) = 0 .

4.2. Numerical Results

Taking TF1 as an example, the optimization process is described as follows:
The Latin hypercube was chosen to carry out 200 experiments. Next, 150 poor designs of sample points were removed, and the remaining sample points were then selected to generate the snapshot matrix. Subsequently, only one principal component was retained after POD analysis, and 50 new sample points were then added around the regions of five initial optimum designs. Figure 9 shows the corresponding distribution of the sample points. Finally, one POD coefficient acted as the new design variable, and GA was used in the following optimization process. Table 2 shows the parameter settings of M-POD. Table 3 is a compilation of results from the POD, M-POD, and RBF. The same total number of sample points was used to compare the accuracy of the three methods. Additionally, the sample points generated by the Latin hypercube are random since a different random seed was used. The f-value in Table 2 is the average of 10 runs to reduce random variation in the results.
The optimization process of TF2 and TF3 is similar to TF1. Therefore, the optimization process is not described, and only the parameter settings and results are listed. The comparison results clearly show that M-POD is more accurate than POD and RBF and thus obtains better solutions. It is demonstrated that M-POD is a better promising approach when the number of sample points is not enough to make the surrogate model obtain accurate results.

5. Results and Discussion

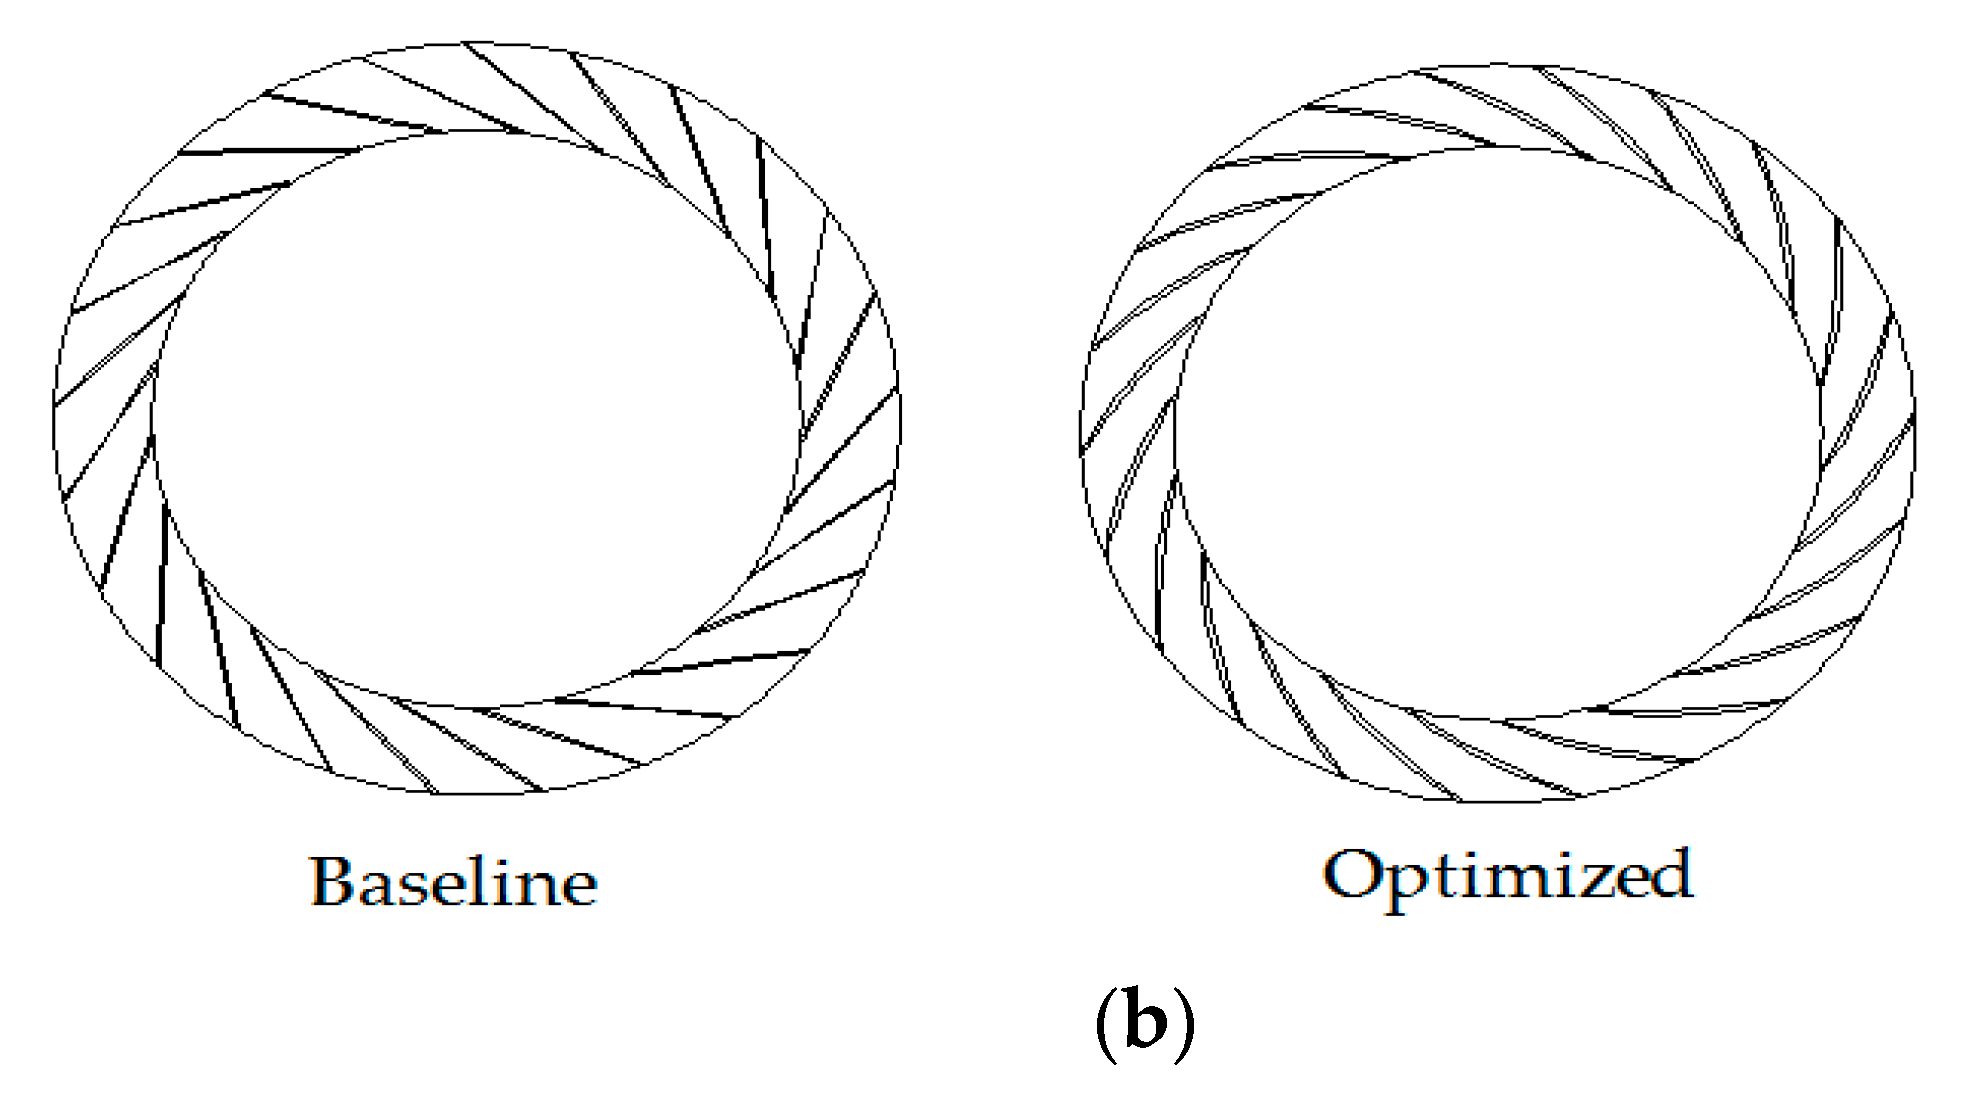
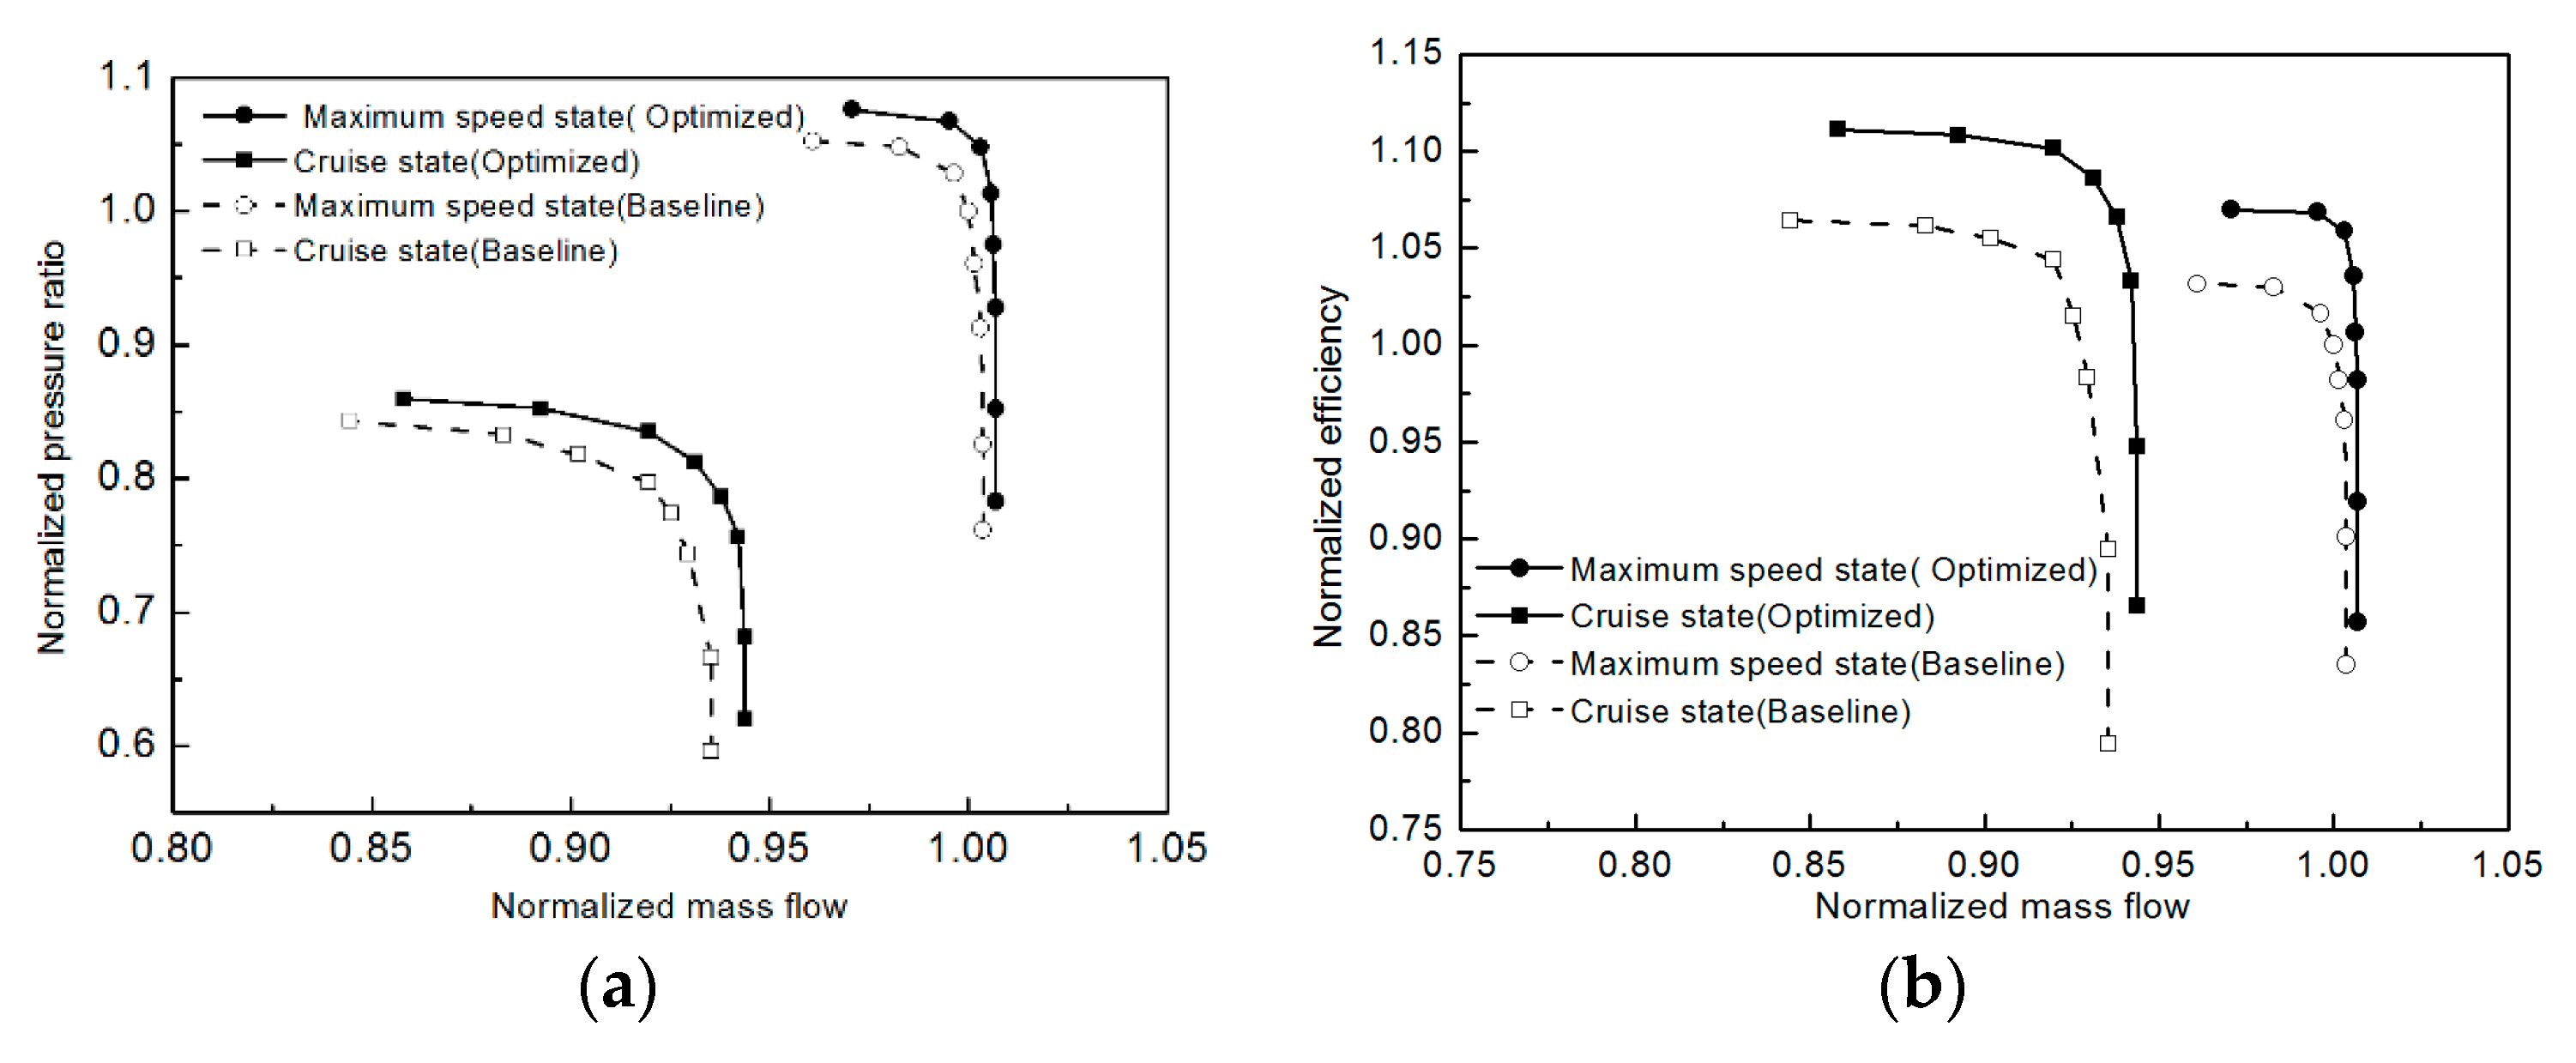
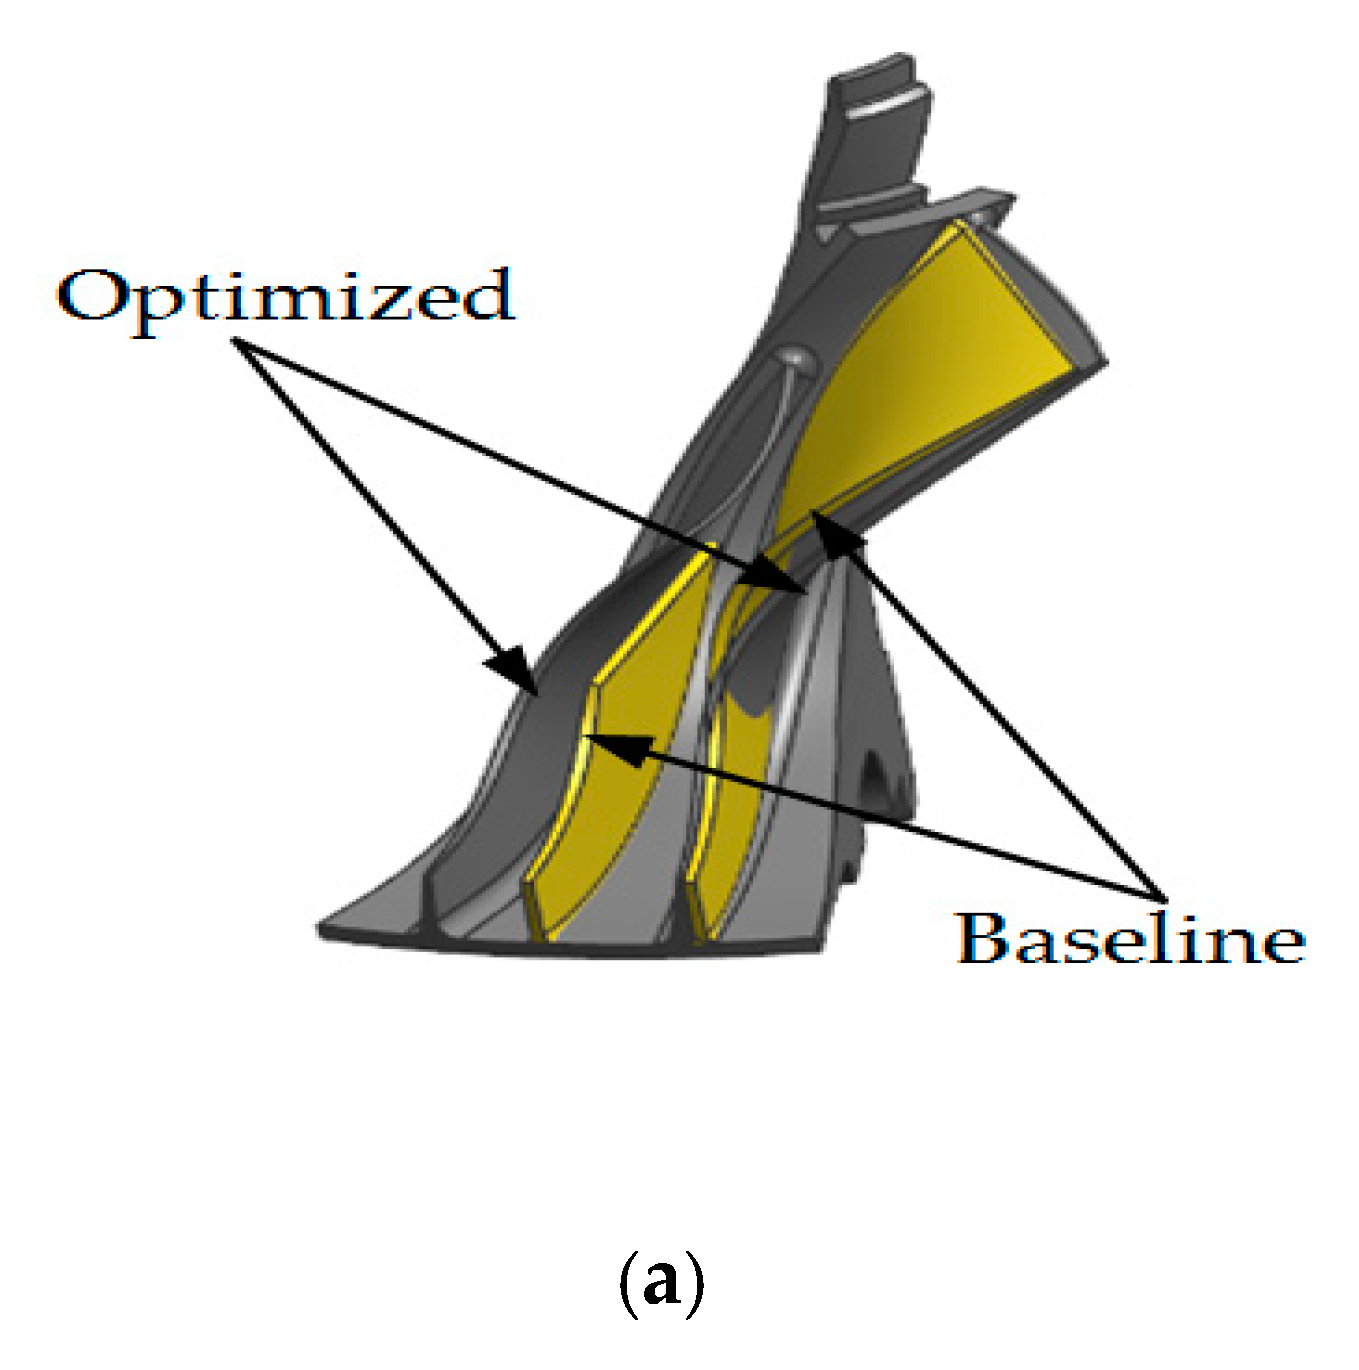
5.1. Optimization Results

After optimization, the distribution of the blade angle of the impeller and diffuser is shown in Figure 10. Structure is illustrated in Figure 11. The radial diffuser has changed from a plain configuration to a blade configuration. Main performance indexes are listed in Table 4.
Table 4 suggests that the aerodynamic performance at the design point is relatively enhanced when all constraints are satisfied. The normalized efficiency at maximum state and cruise state increased 3.6% and 4.0%, respectively. Baseline and optimum characteristics are shown in Figure 12. The performance of the design point and non-design point is improved. Additionally, the processing costs reduced by about 30% owing to the number of blades reduced.

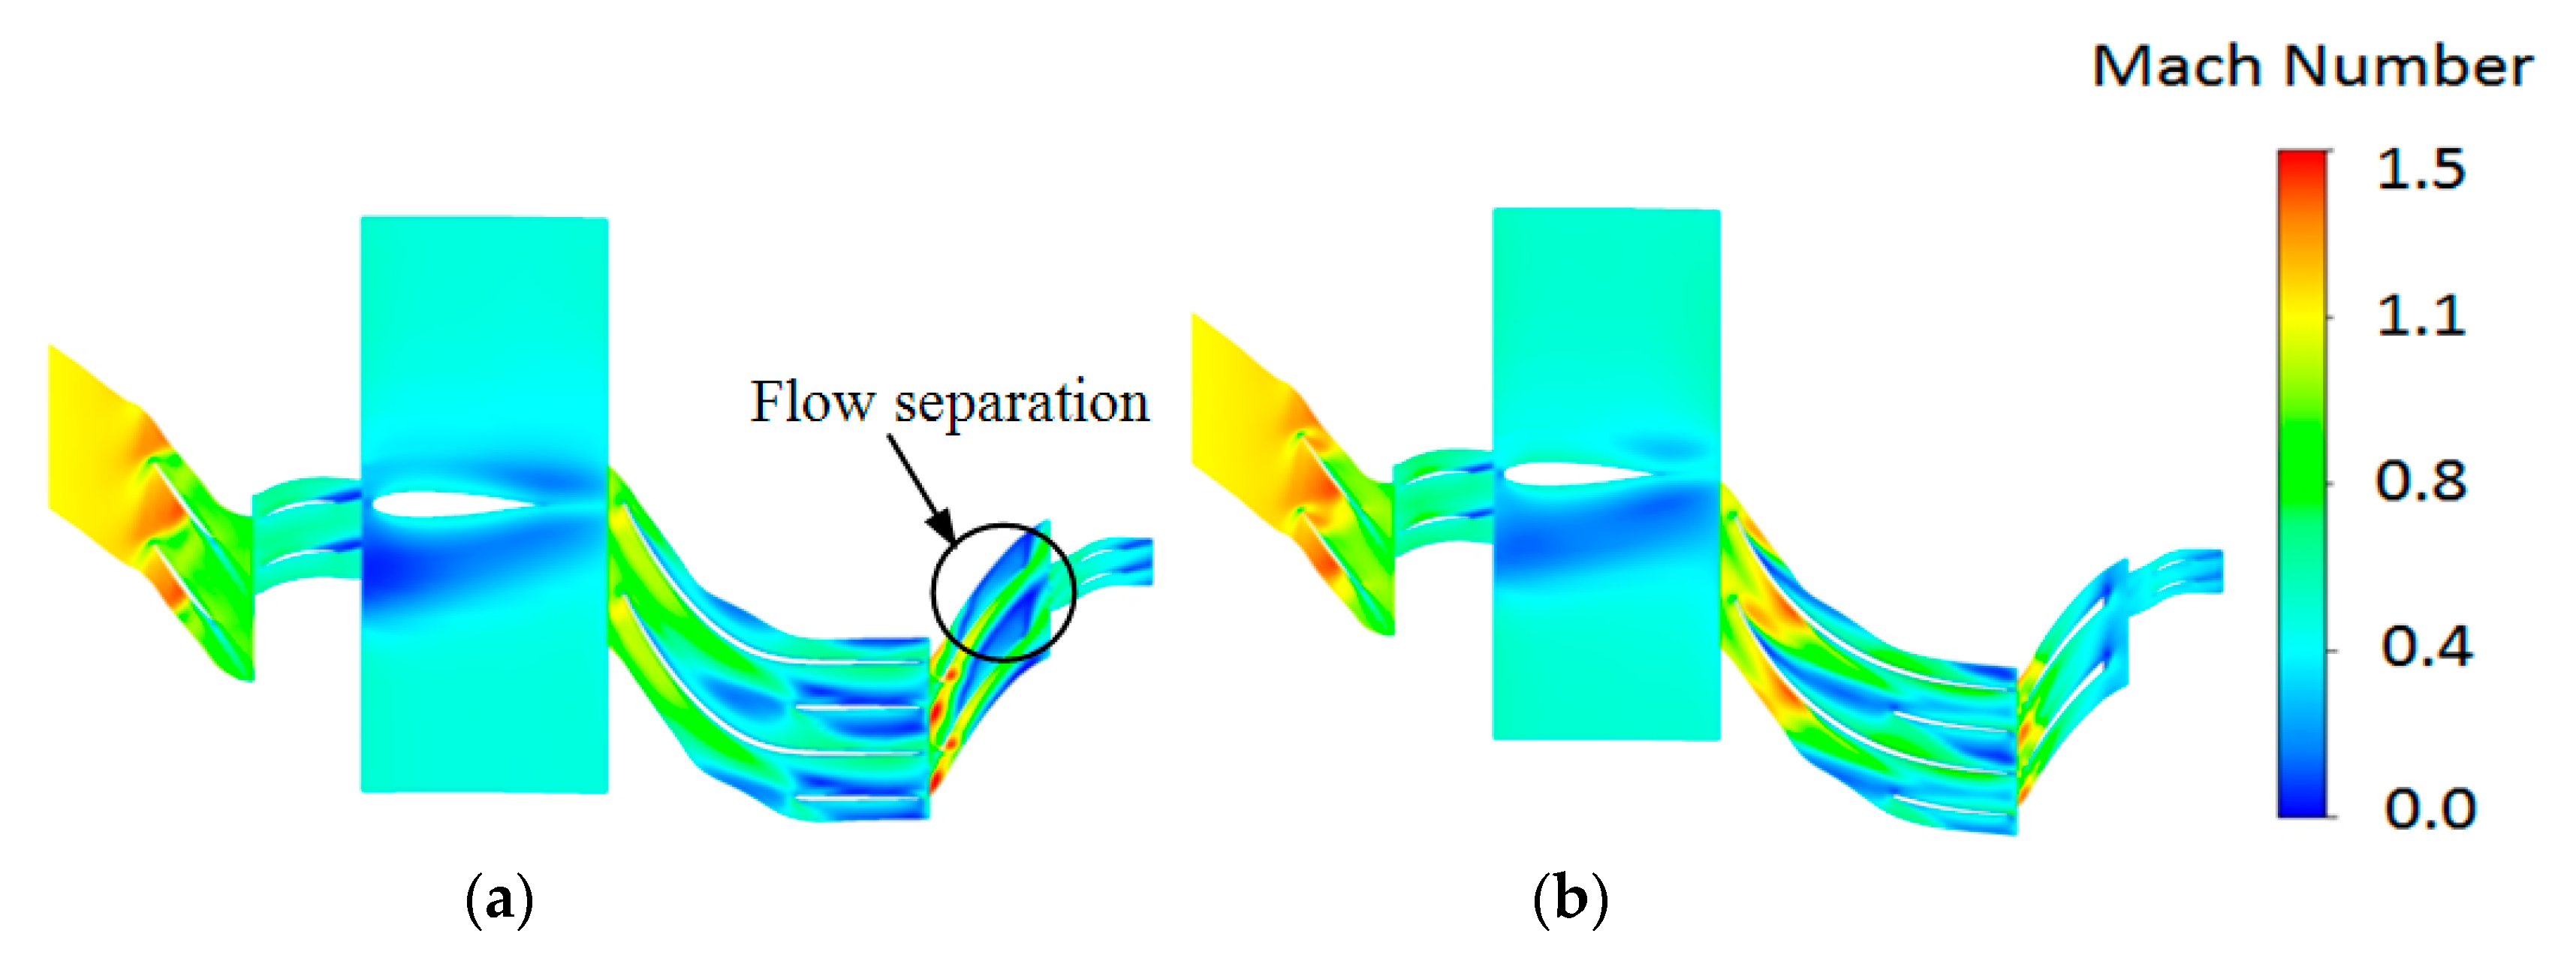
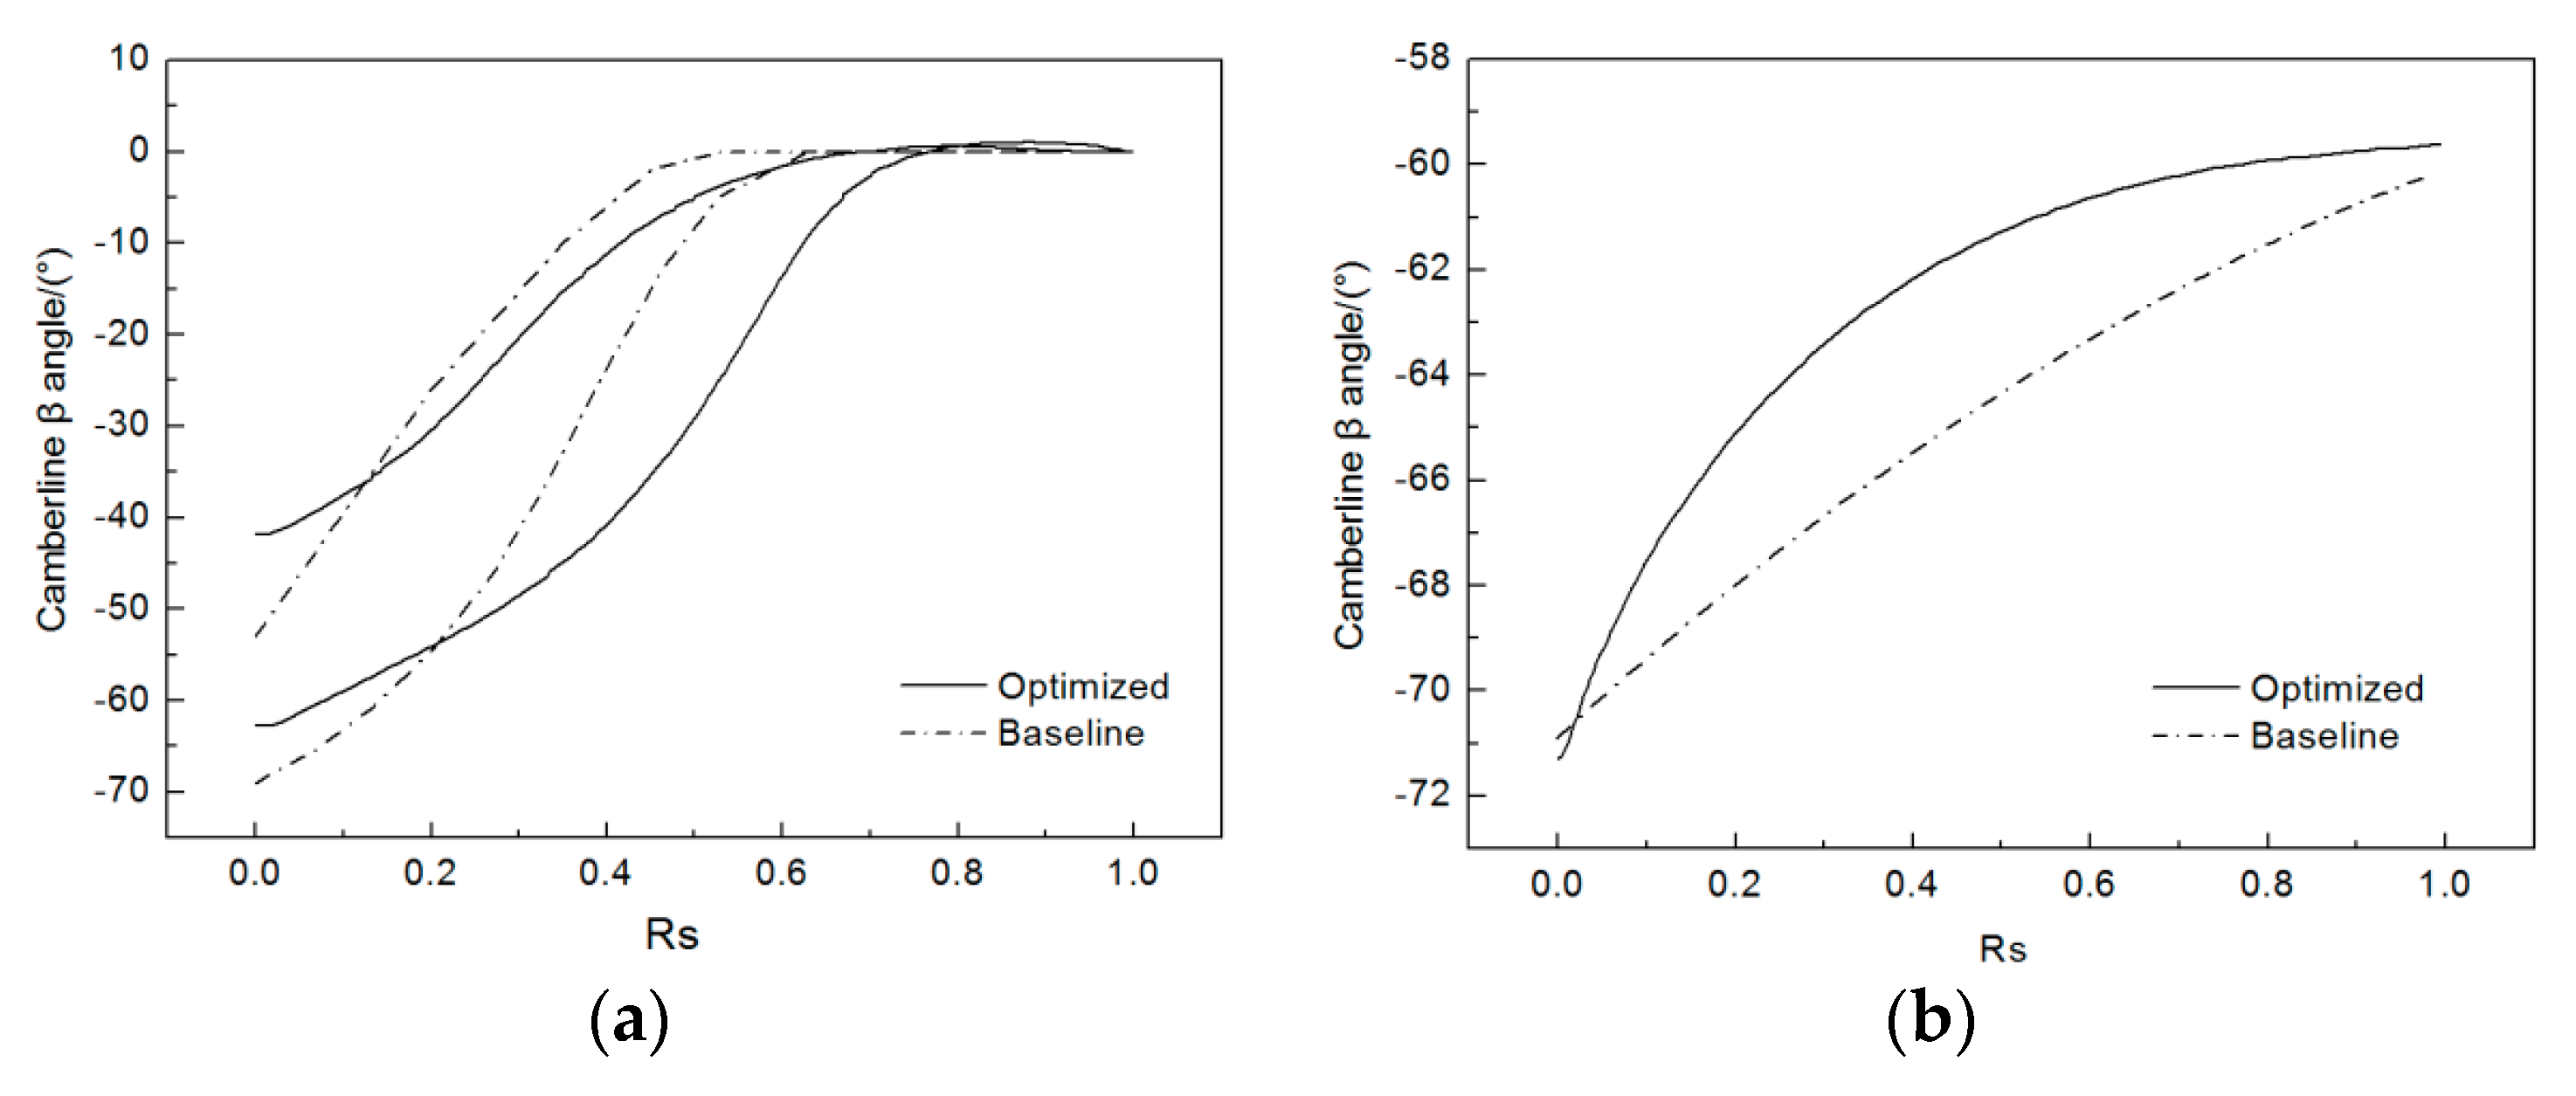
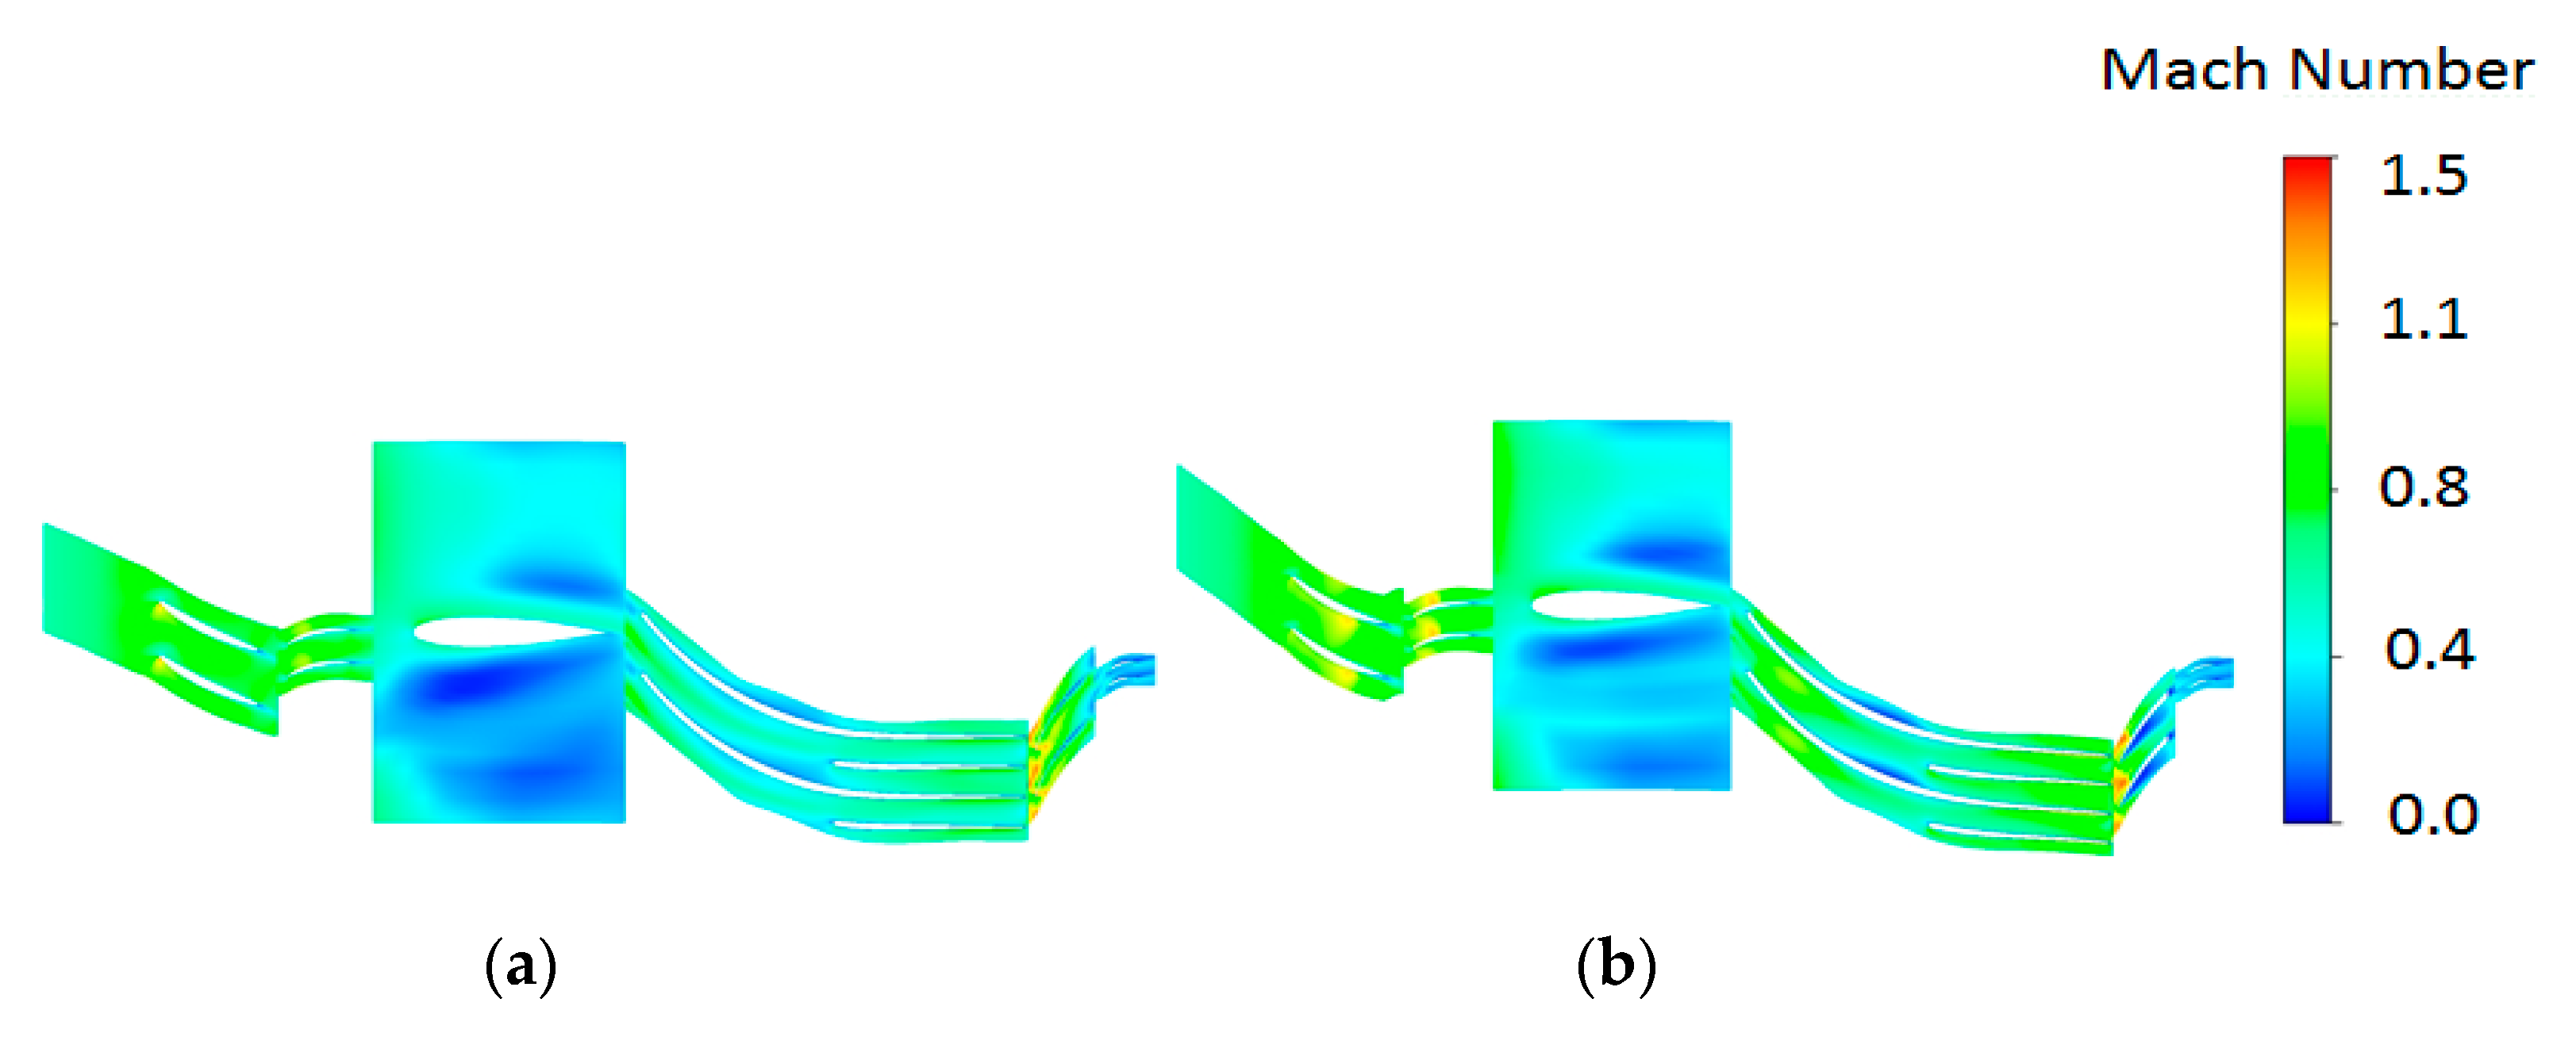
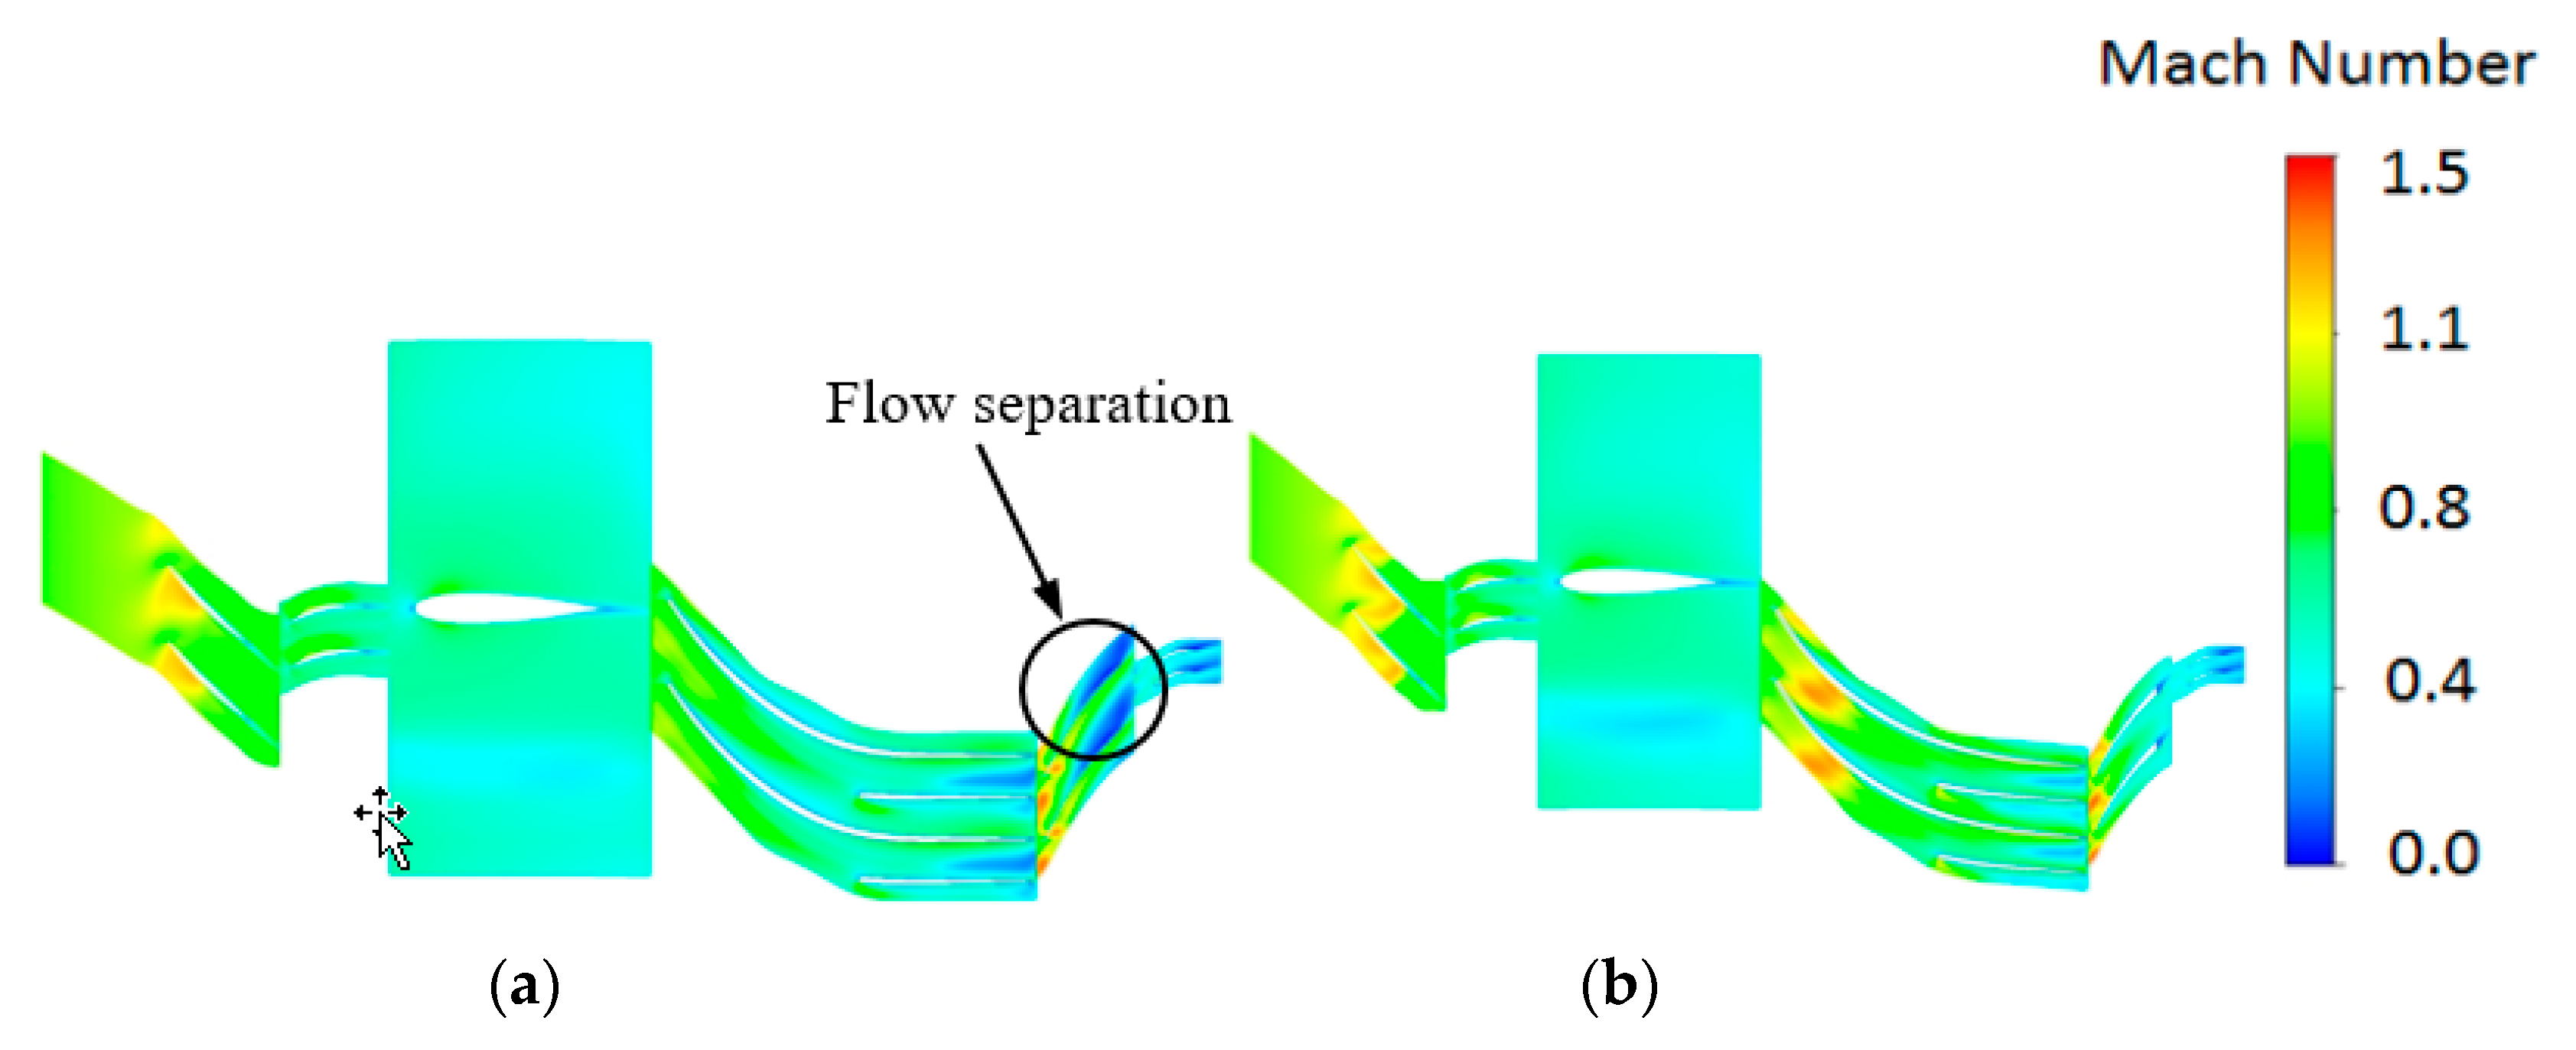
5.2. Details Analysis

The Mach number distribution at the design point is shown in Figure 13, Figure 14 and Figure 15. The optimization of the impeller and diffuser mainly influences the Mach number distribution of the impeller blade row, and the influence on the axial stage is relatively small. The low energy stall region is weakened and moves to the leading edge when the impeller and diffuser are optimized. Specifically, for the splitter blade, before optimization, the low energy region exists at the 95% blade span for both the suction and pressure surface, which could choke the passage flow in a certain extent. The passage choking caused by low energy flow mass is alleviated after optimization, especially at a 50% and 95% blade span, and the flow separation decreased significantly.
After optimization, both strength and vibration can satisfy the design criteria. The von Mises stress distribution of the initial design and the optimized design is shown in Figure 16 and Figure 17. The maximum von Mises stress of the initial design and the optimized impeller is 326 and 331 MPa, and the maximum von Mises stress slightly increased. The maximum von Mises stress of blades reduced from 209 to 180 MPa. Additionally, the natural frequency and resonance margin of each order of the optimized impeller is similar to the initial design.

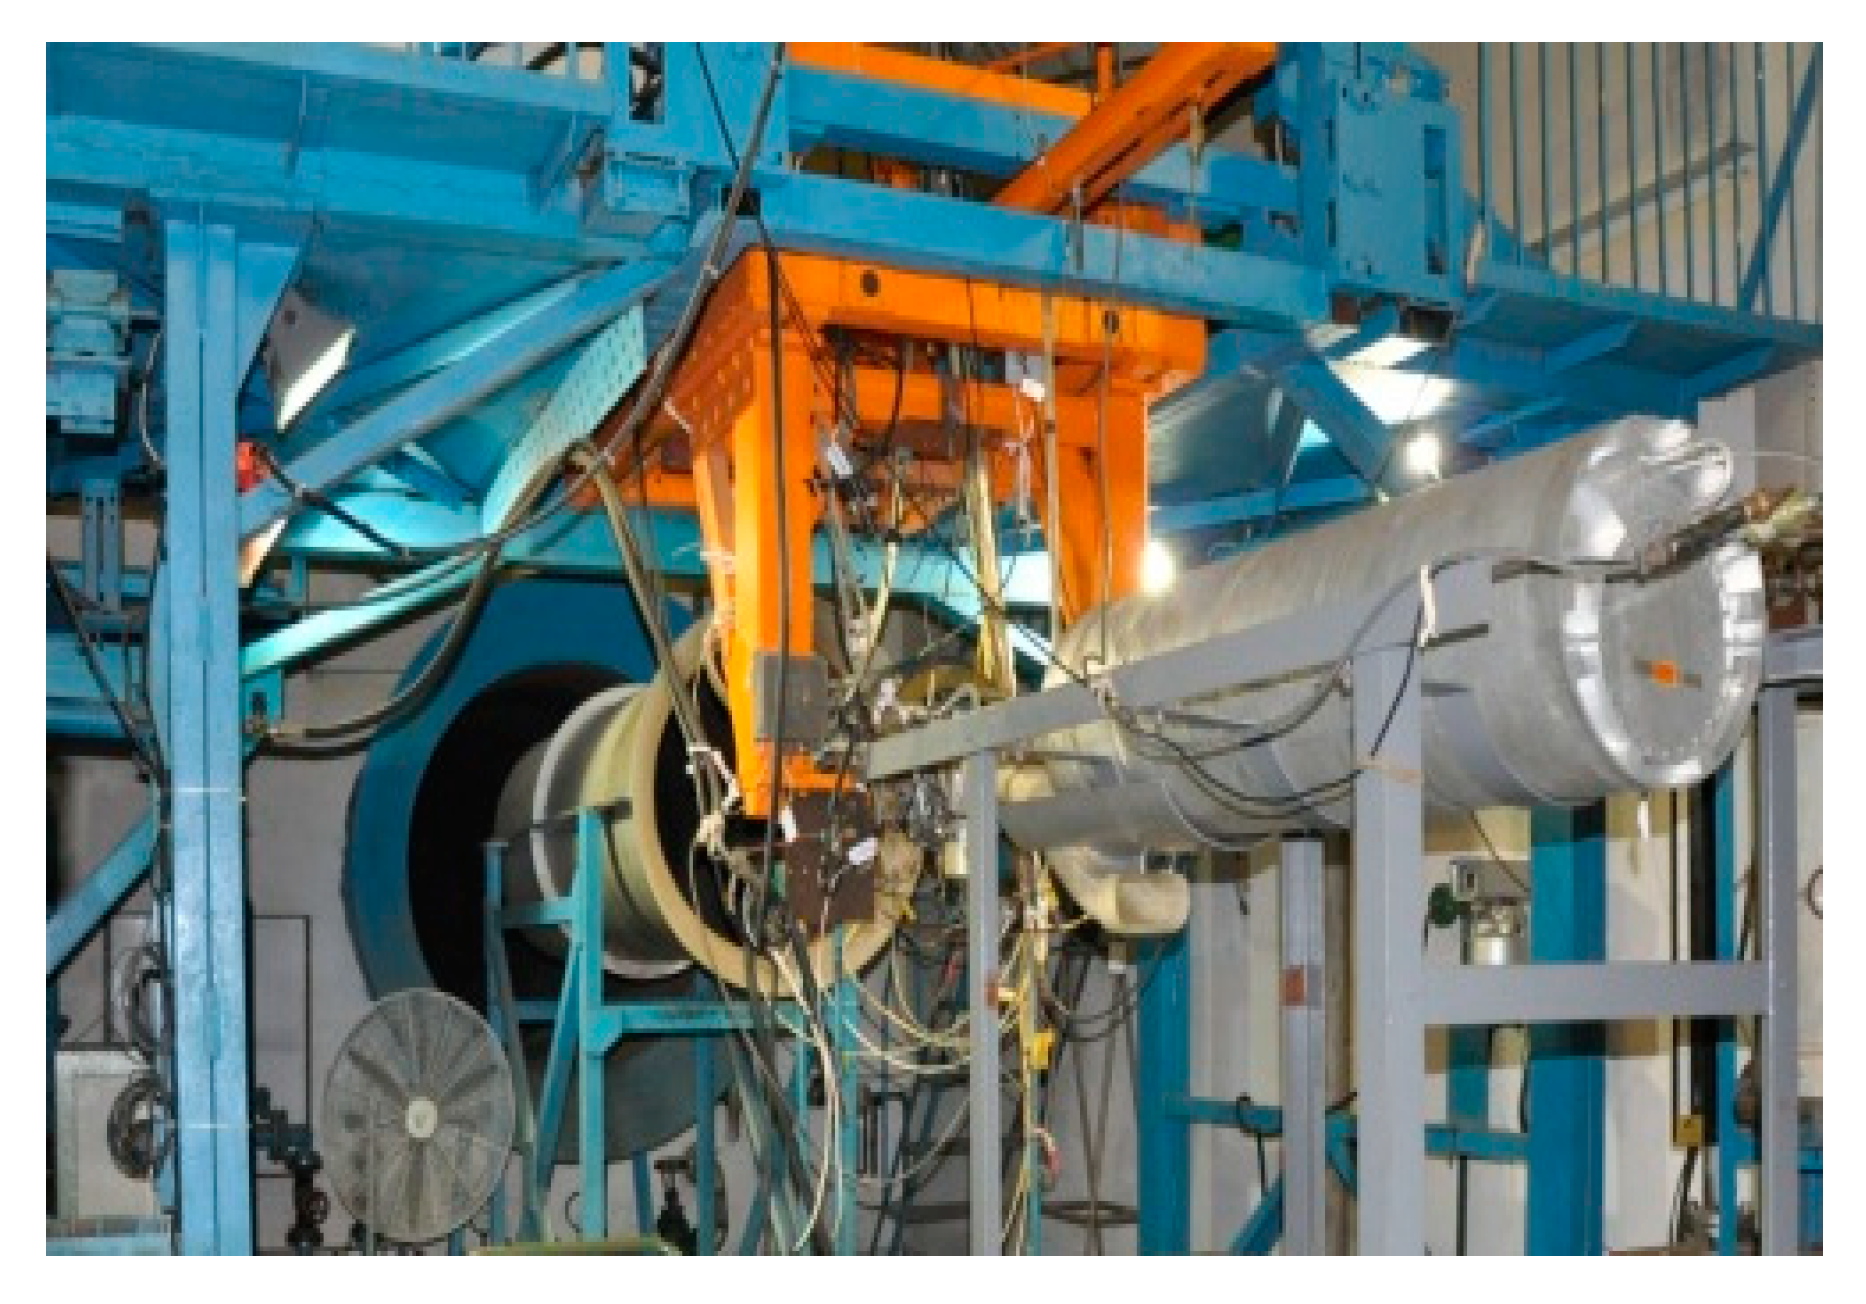
6. Test Verification
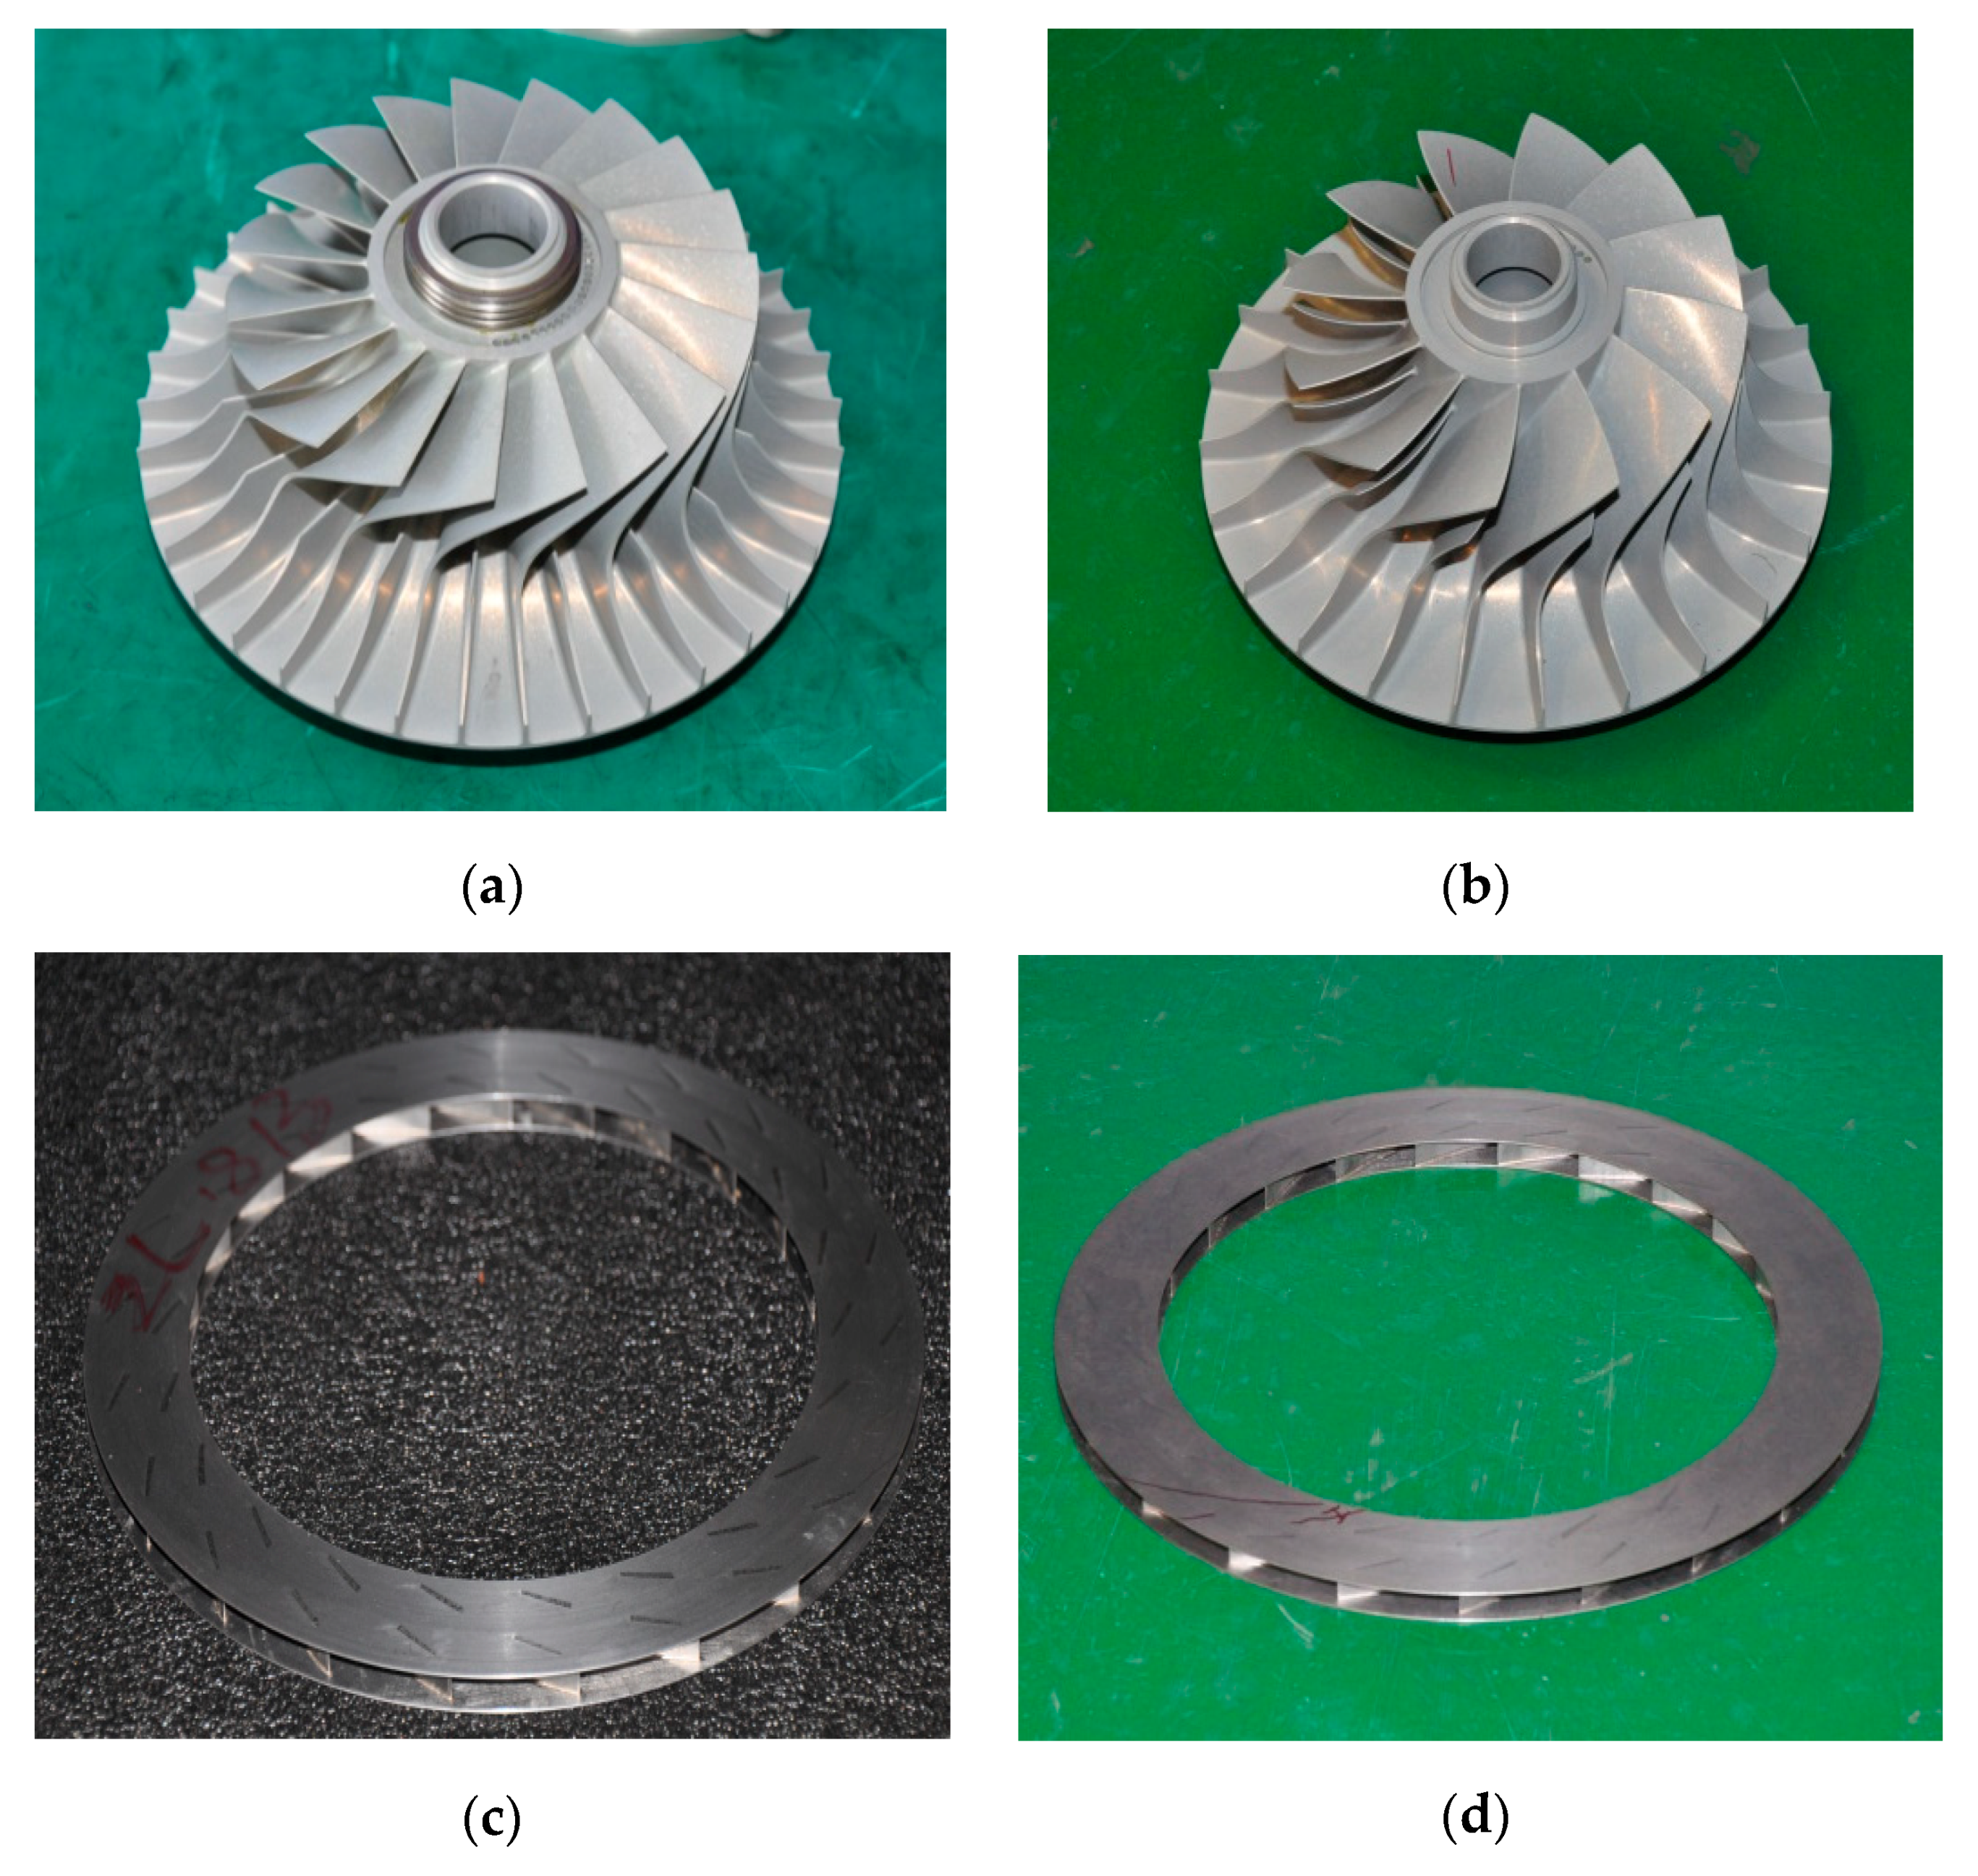
6.1. Test Part

To verify the effect of the optimization, test parts of the centrifugal impeller and radial diffuser are processed. Figure 18 shows these parts before and after optimization.

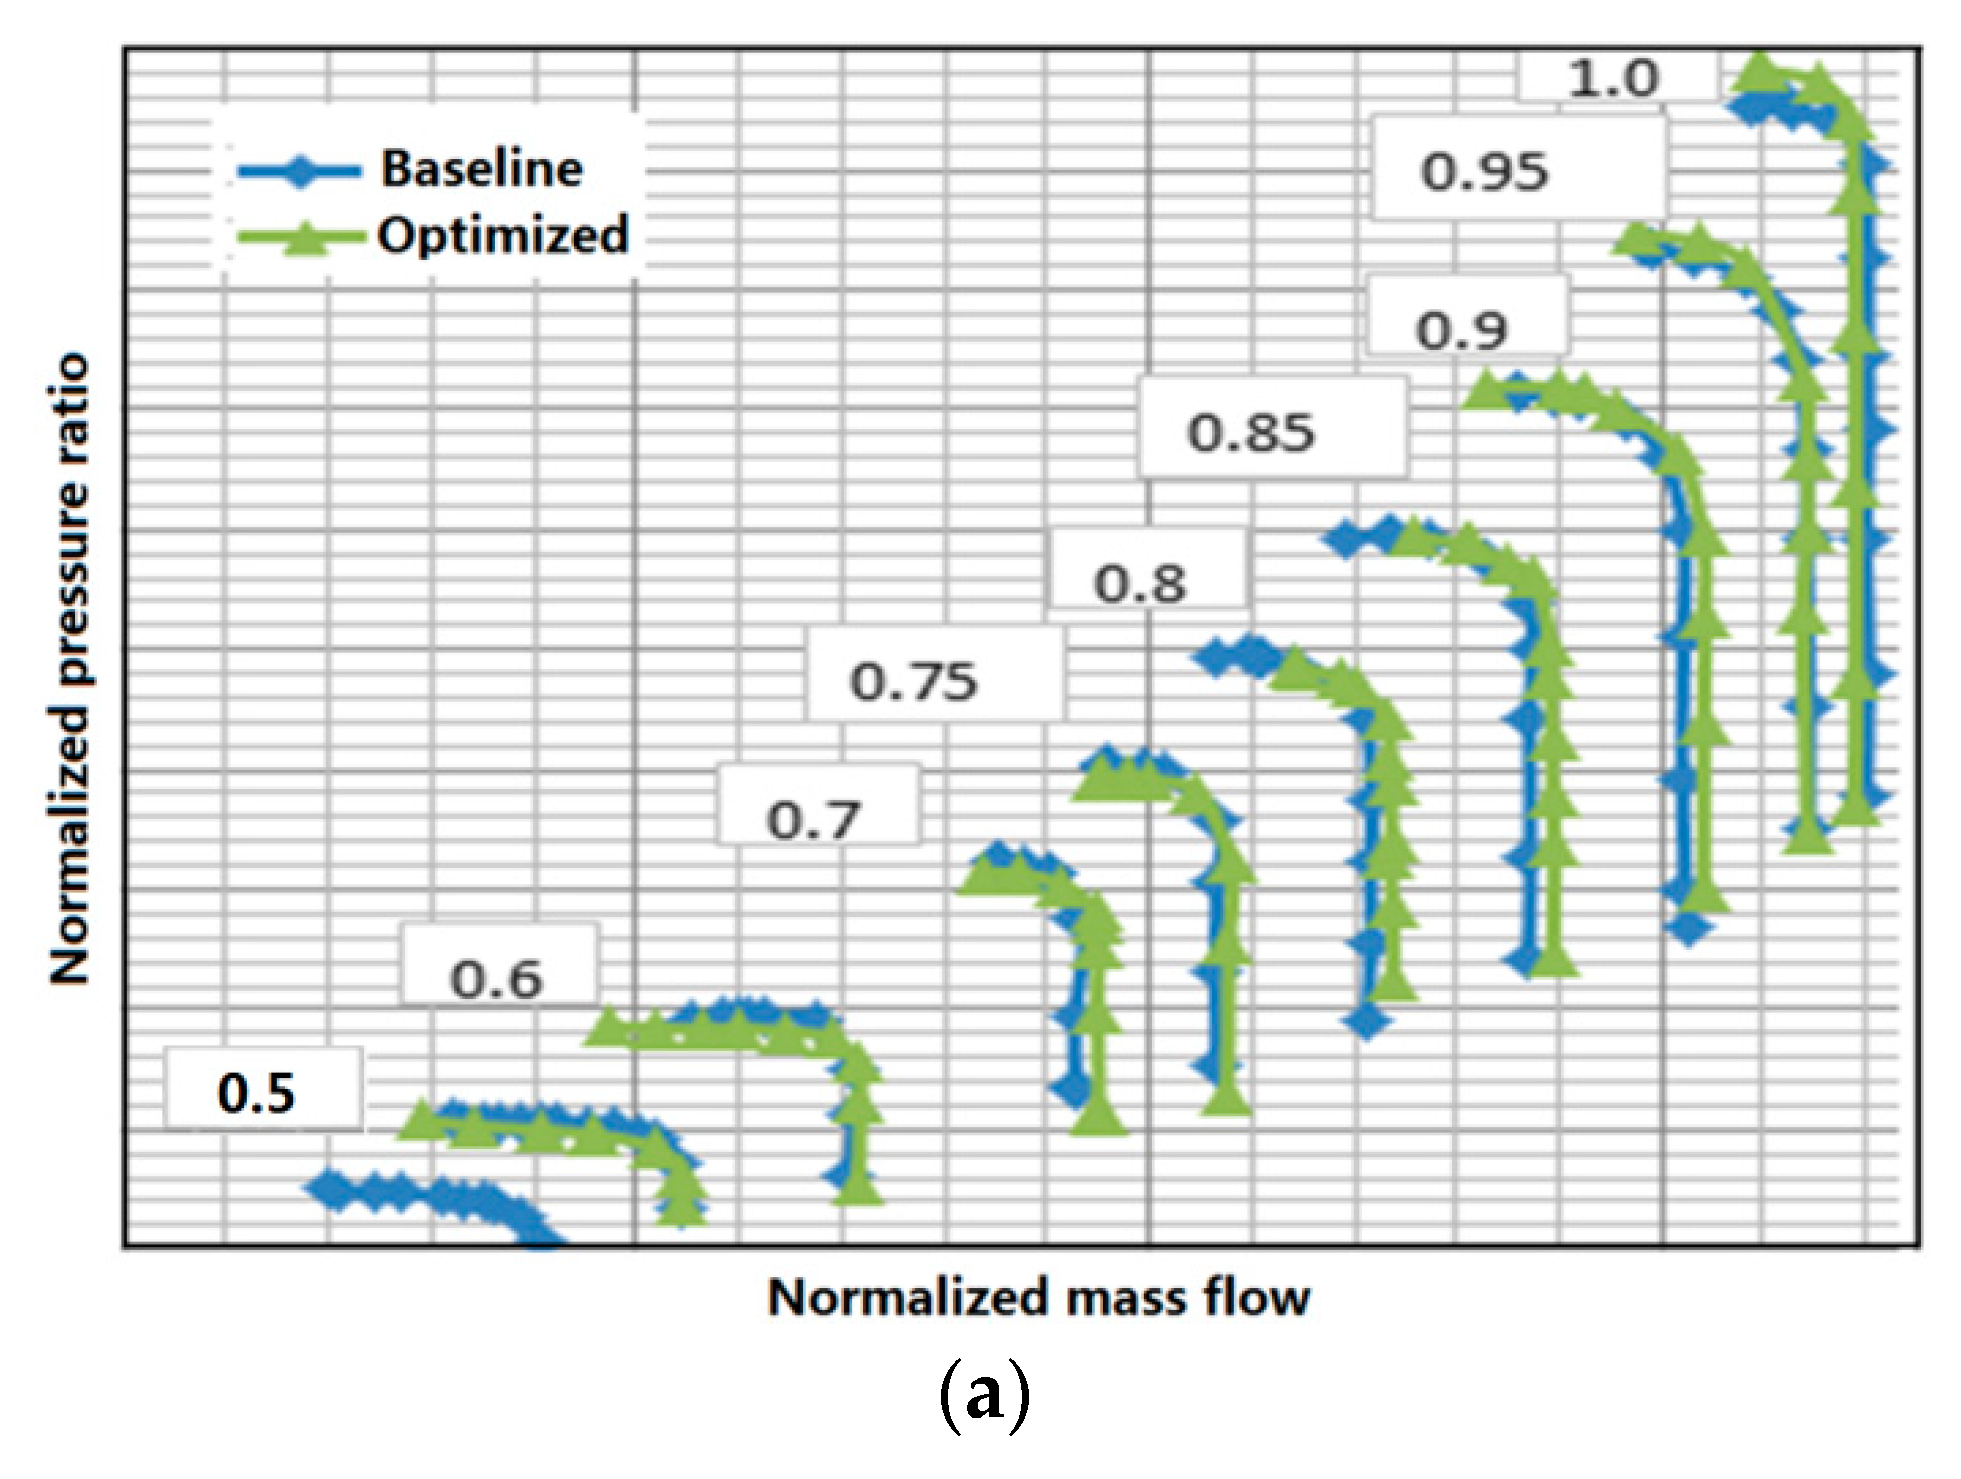
6.2. Performance Test Verification

An actual combined compressor test to evaluate the aerodynamic performance was carried out with the optimized impeller and radial diffuser on the original test platform, and the inlet and outlet interface parts, the pneumatic parameter measuring probes and the clearance between impeller and impeller cover are consistent with the initial design. Figure 19 shows an overview of the combined compressor test facility.
Figure 20 shows the schematic of the combined compressor test part. There are three test stations in the test parts. Station 1-1 is located at the exit of the axial rotor, measuring the total pressure and the static wall pressure. Station 2-2 is arranged at the inlet of the centrifugal impeller, measuring total temperature, total pressure, and the static wall pressure. Station 3-3 is placed at the outlet of these test parts, measuring total temperature, total pressure, and the static wall pressure. A dynamic static pressure measuring probe is arranged at Station 1-1 as well as 3-3 for compressor surge detection. The value of the mass flow of the test is obtained by the flow tube, which is installed at the exit of the test parts. Total temperature measuring probes are placed on the dust-proof net, which is in front of the flow tube, and the compressor inlet total temperature is the arithmetic mean value of all the data measured by the total temperature probes on the dust-proof net. The total pressure ratio is the specific value of the total pressure arithmetic mean value of Section 3-3 to the total pressure arithmetic mean value of Section 1-1. The total temperature ratio is the specific value of the total temperature arithmetic mean value of Section 3-3 to the compressor inlet total temperature. Efficiency is the isentropic adiabatic efficiency with variable specific heat ratio.
The aerodynamic performance test of the combined compressor recorded characteristic curves. Each record of the characteristic curve made the test rotating speed steady at the corresponding speed and collected the performance of the compressor by adjusting the outlet flow control valve. Figure 21 shows characteristic curves under corrected speeds of 1.0, 0.95, 0.9, 0.85, 0.8, 0.75, 0.7, 0.6, and 0.5. The performance was improved under a corrected speed of 0.8–1.0. The performance at low speed was lower than that before optimization. The engine works mainly at high speed (a corrected speed of 0.9 and 1.0). Thus, we only focused on the performance at high speeds. It can be seen in Figure 21 that normalized aerodynamic efficiency rose 3.7% and 3.0% under a corrected speed of 1.0 (maximum speed state) and 0.9 (cruise state), the pressure ratio slightly reduced, and the performance obtained a certain improvement, which is basically in concordance with the result of the calculation. The test results show a very good agreement and confirm the improvement of the compressor performance. It needs to be pointed out that the test did not reach a surge point except for the corrected speed of 0.9.

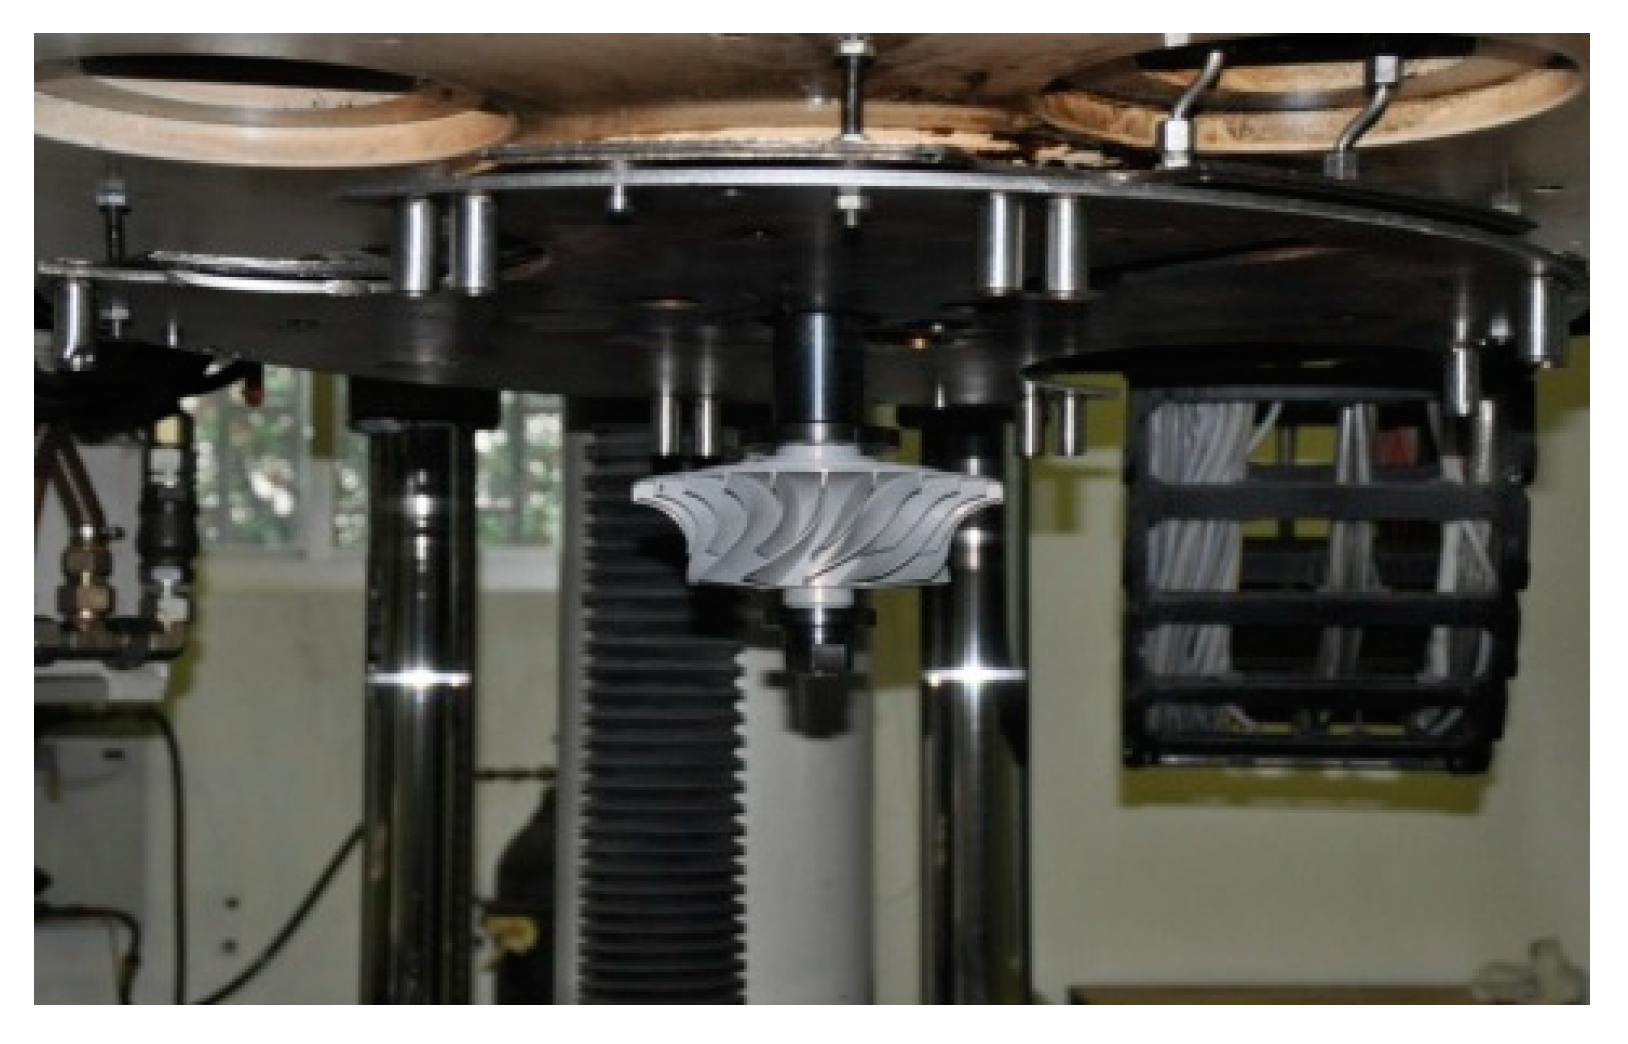
6.3. Structure Strength Test Verification

The over speed and burst test is carried out on the disc over speed tester. Figure 22 shows the installation photo of the test part.
The impeller is installed in the test chamber of the tester according to the test outline requirement. Under normal temperature, the vacuum in the test chamber is pumped below 400 Pa, and the impeller is loaded to the over speed test speed 115% ng (Maximum Permissible Steady Speed), stable operation under the speed 300 s before shutting down, over speed test is finished. The residual deformation rate of the impeller was 0.003%, and the crack was not detected by non-destructive inspection; the impeller passes the over speed test. Then, the impeller is loaded to the burst speed test speed 122% ng, and there is stable operation under the speed 30 s before shutting down, and burst speed test is completed. The centrifugal impeller was not broken after the burst test, and the impeller passes the burst speed test.

7. Conclusions

A multidisciplinary design optimization strategy for a centrifugal compressor based on POD technology and adaptive sampling has been presented and verified by tests. By using this technique, the optimization problem with 30 design variables was reduced to an optimization problem with only four POD coefficients, which acted as new design variables. After optimization and validation by testing, the normalized isentropic efficiency of the design point in the maximum speed state and cruise state increased by 3.7% and 3.0%, respectively. Additionally, the processing costs reduced by about 30% owing to the number of blades reduced. The results show its validity for the multidisciplinary design optimization of turbomachinery and show the advantage of coupling POD technique with adaptive sampling to reduce the exploration time.
Because the aim of building a reduced order model is design space, adding a constraint or an objective to the model does not affect the algorithm. Thus, the proposed method is suitable for multi-objective optimization problems.
Due to some information about the original space after POD analysis being neglected, there is a deviation between the obtained optimal solution and the real optimal solution. For complex optimization problems with a large number of design variables, it is difficult and costly to find an actual optimal solution, so the deviation is considered acceptable relative to the decrease in computational costs.

Author Contributions

Conceptualization, L.Z., C.Y., D.M. and F.T.; Methodology, L.Z. and C.Y.; Software, L.Z., D.M. and C.Y.; Validation, L.Z., C.Y., F.T. and D.M.; Formal analysis, L.Z. and C.Y.; Investigation, L.Z. and C.Y.; Resources, D.M.; Data curation, L.Z.; Writing—original draft preparation, L.Z.; Writing—review and editing, C.Y.; Visualization, L.Z., C.Y. and F.T.; Supervision, C.Y.; Project administration, D.M.

Funding

This research received no external funding.

Conflicts of Interest

The authors declare no conflict of interest.

References

  1. Barsi, D.; Costa, C.; Cravero, C.; Ricci, G. Aerodynamic design of a centrifugal compressor stage using an automatic optimization strategy. In Proceedings of the ASME Turbo Expo 2014: Turbine Technical Conference and Exposition, Dusseldorf, Germany, 16–20 June 2014; pp. 1–11. [Google Scholar] [CrossRef]
  2. Bellis, F.D.; Guidotti, E.; Rubino, D.T. Centrifugal compressors return channel optimization by means of advanced 3D CFD. In Proceedings of the ASME Turbo Expo 2015: Turbine Technical Conference and Exposition, Montreal, QC, Canada, 15–19 June 2015; pp. 1–9. [Google Scholar] [CrossRef]
  3. Hehn, A.; Mosdzien, M.; Grates, D.; Jeschke, P. Aerodynamic optimization of a transonic centrifugal compressor by using arbitrary blade surface. J. Turbomach. 2018, 140, 051011. [Google Scholar] [CrossRef]
  4. Demeulenaere, A.; Bonaccorsi, J.-C. Multi-disciplinary multi-point optimization of a turbocharger compressor wheel. In Proceedings of the ASME Turbo Expo 2015: Turbine Technical Conference and Exposition, Montreal, QC, Canada, 15–19 June 2015; pp. 1–9. [Google Scholar] [CrossRef]
  5. Geller, M.; Schemmann, C.; Kluck, N. Optimization the operation characteristic of a highly stressed centrifugal compressor impeller using automated optimization and metamodeling methods. In Proceedings of the ASME Turbo Expo 2017: Turbomachinery Technical Conference and Exposition, Charlotte, NC, USA, 26–30 June 2017; pp. 1–11. [Google Scholar] [CrossRef]
  6. Salnikov, A.; Danilov, M. A centrifugal compressor impeller: A multidisciplinary optimization to improve its mass, strength, and gas-dynamic characteristics. In Proceedings of the ASME Turbo Expo 2017: Turbomachinery Technical Conference and Exposition, Charlotte, NC, USA, 26–30 June 2017; pp. 1–10. [Google Scholar] [CrossRef]
  7. Mattia, O.; David, P.; Antonio, G.; Stefano, R. Three-dimensional turbulent optimization of vane diffusers for centrifugal compressors based on metamodel-assisted genetic algorithms. Optim. Eng. 2014, 15, 973–992. [Google Scholar] [CrossRef]
  8. Chen, J.; Wu, G. Kriging-assisted design optimization of the impeller geometry for an automotive torque converter. Struct. Multidiscip. Optim. 2018, 57, 2503–2514. [Google Scholar] [CrossRef]
  9. Khalfallah, S.; Ghenaiet, A.; Benini, E.; Bedon, G. Surrogate-based shape optimization of stall margin and efficiency of centrifugal compressor. J. Propul. Power 2015, 31, 1607–1620. [Google Scholar] [CrossRef]
  10. Derakhshan, S.; Bashiri, M. Investigation of an efficient shape optimization procedure for centrifugal pump impeller using eagle strategy algorithm and ANN (case study: Slurry flow). Struct. Multidiscip. Optim. 2018, 58, 459–473. [Google Scholar] [CrossRef]
  11. Yan, C.; Shen, X.; Guo, F. Novel two-stage method for low-order polynomial model. Math. Probl. Eng. 2018, 2018, 1–13. [Google Scholar] [CrossRef]
  12. Yan, C.; Shen, X.; Guo, F. An improved support vector regression using least squares method. Struct. Multidiscip. Optim. 2018, 57, 2431–2445. [Google Scholar] [CrossRef]
  13. Bonaiuti, D.; Zangeneh, M. On the Coupling of inverse design and optimization techniques for the multiobjective, multipoint design of turbomachinery blades. J. Turbomach. 2009, 131, 021014. [Google Scholar] [CrossRef]
  14. Zangeneh, M.; Mendonca, F. 3D multidisciplinary inverse design based optimization of a centrifugal compressor impeller. In Proceedings of the ASME Turbo Expo 2014: Turbine Technical Conference and Exposition, Dusseldorf, Germany, 16–20 June 2014; pp. 1–8. [Google Scholar] [CrossRef]
  15. Luo, J.; Zhu, Y.; Tang, X.; Liu, F. Flow reconstructions and aerodynamic shape optimization of turbomachinery blades by POD-based hybrid models. Sci. China Technol. Sci. 2017, 60, 1658–1673. [Google Scholar] [CrossRef]
  16. Tan, B.T.; Damodaran, M.; Willcox, K.E. Aerodynamic data reconstruction and inverse design using proper orthogonal decomposition. AIAA J. 2004, 42, 1505–1516. [Google Scholar] [CrossRef]
  17. Bai, J.; Qiu, Y.; Hua, J. Improved airfoil inverse design method based on Gappy POD. Acta Aeronaut. Astronaut. Sin. 2013, 34, 762–771. [Google Scholar] [CrossRef]
  18. Wang, Y.; Yu, B.; Cao, Z.; Zou, W.; Yu, G. A comparative study of POD interpolation and POD projection methods for fast and accurate prediction of heat transfer problems. Int. J. Heat. Mass. Trans. 2012, 55, 4827–4836. [Google Scholar] [CrossRef]
  19. Braconnier, T.; Ferrier, M.; Jouhaud, J.C.; Montagnac, M.; Sagaut, P. Towards an adaptive POD/SVD surrogate model for aeronautic design. Comput. Fluids 2011, 40, 195–209. [Google Scholar] [CrossRef]
  20. Filomeno Coelho, R.; Breitkopf, P.; Knopf-Lenoir, C. Model reduction for multidisciplinary optimization-application to a 2D wing. Struct. Multidiscip. Optim. 2008, 37, 29–48. [Google Scholar] [CrossRef]
  21. Filomeno Coelho, R.; Breitkopf, P.; Knopf-Lenoir, C.; Villon, P. Bi-level model reduction for coupled problems-application to a 3D wing. Struct. Multidiscip. Optim. 2009, 39, 401–418. [Google Scholar] [CrossRef]
  22. Luliano, E.; Quagliarella, D. Proper Orthogonal decomposition, surrogate modeling and evolutionary optimization in aerodynamic design. Comput. Fluids 2013, 84, 327–350. [Google Scholar] [CrossRef]
  23. Molinari, M.; Jarrett, J.; Clarkson, P.; Dawes, W. Characterizing the design space in multiobjective axial compressor blade optimization. In Proceedings of the 47th AIAA/ASME/ASCE/AHS/ASC Structures, Structural Dynamics, and Materials Conf., Newport, RI, USA, 1–4 May 2006. [Google Scholar] [CrossRef]
  24. Total, D.J.; Bressloff, N.W.; Keane, A.J.; Holden, C.M.E. Geometric filtration using proper orthogonal decomposition for aerodynamic design optimization. AIAA J. 2010, 48, 916–928. [Google Scholar] [CrossRef]
  25. Viswanath, A.; Forrester, A.I.J.; Keane, A.J. Dimension reduction for aerodynamic design optimization. AIAA J. 2011, 49, 1256–1266. [Google Scholar] [CrossRef]
  26. Ghoman, S.; Wang, Z.; Chen, P.; Kapania, R. A POD-based reduced order design scheme for shape optimization of air vehicles. In Proceedings of the 53rd AIAA/ASME/ASCE/AHS/ASC Structures, Structural Dynamics and Materials Conference, Honolulu, HI, USA, 23–26 April 2012. [Google Scholar] [CrossRef]
  27. Ghoman, S.; Wang, Z.; Chen, P.; Kapania, R. Hybrid optimization framework with Proper-Orthogonal-Decomposition-based Order Reduction and Design space Evolution scheme. J. Aircr. 2013, 50, 1776–1786. [Google Scholar] [CrossRef]
  28. Dassault. Dassault Systems, Isight, Simulia Execution Engine, version 5.9.4; Dassault Systems: Vélizy-Villacoublay, France, 2015. [Google Scholar]
  29. ANSYS. Ansys Products, Ansys Icem CFX, version 10.0 64-bit; ANSYS: Canonsburg, PA, USA, 2010. [Google Scholar]
  30. MSC.Software. Patran, version 2012 64-bit; MSC Software: Santa Ana, CA, USA, 2012.
  31. ANSYS. Ansys Products, Ansys Icem Mechnical, version 15.0 64-bit; ANSYS: Canonsburg, PA, USA, 2015. [Google Scholar]
  32. Jamil, M.; Yang, X.-S. A literature survey of benchmark functions for global optimization problems. Int. J. Math. Model. Numer. Optim. 2013, 4, 151–194. [Google Scholar] [CrossRef]
  33. Duan, X.; Wang, G.G.; Kang, X.; Niu, Q.; Naterer, G.; Peng, Q. Performance study of model-pursuing sampling method. J. Eng. Optim. 2009, 41, 1–21. [Google Scholar] [CrossRef]
Figure 1. 3D view of the original centrifugal compressor.
Applsci 08 02608 g001
Figure 2. Optimization process.
Applsci 08 02608 g002
Figure 3. Schematic for the centrifugal compressor blade camber law and corresponding control parameters: (a) impeller hub; (b) impeller shroud; (c) radial diffuser.
Applsci 08 02608 g003
Figure 4. Computational fluid dynamics (CFD) computational domain of the compressor.
Applsci 08 02608 g004
Figure 5. Results of the mesh study.
Applsci 08 02608 g005
Figure 6. A three-dimensional CFD mesh: (a) grids of the combined compressor; (b) grids of the impeller; (c) grids of the radial diffuser.
Applsci 08 02608 g006aApplsci 08 02608 g006b
Figure 7. Finite element mesh of the impeller.
Applsci 08 02608 g007
Figure 8. Adaptive sampling point adding strategy.
Applsci 08 02608 g008
Figure 9. Corresponding distribution of the sample points.
Applsci 08 02608 g009
Figure 10. Blade angle distribution: (a) impeller; (b) radial diffuser.
Applsci 08 02608 g010
Figure 11. Structure: (a) impeller; (b) radial diffuser.
Applsci 08 02608 g011aApplsci 08 02608 g011b
Figure 12. Baseline and optimum characteristics: (a) diagram of normalized pressure ratio with respect to normalized mass flow; (b) diagram of normalized efficiency with respect to normalized mass flow.
Applsci 08 02608 g012
Figure 13. Design point Mach number distribution (5% blade span): (a) baseline; (b) optimized.
Applsci 08 02608 g013
Figure 14. Design point Mach number distribution (50% blade span): (a) baseline; (b) optimized.
Applsci 08 02608 g014
Figure 15. Design point Mach number distribution (95% blade span): (a) baseline; (b) optimized.
Applsci 08 02608 g015
Figure 16. The von Mises stress distribution (units: MPa): (a) baseline; (b) optimized.
Applsci 08 02608 g016
Figure 17. The von Mises distribution of blades (units: MPa): (a) baseline; (b) optimized.
Applsci 08 02608 g017
Figure 18. Test parts: (a) baseline impeller; (b) optimized impeller. (c) baseline radial diffuser; (d) optimized radial diffuser.
Applsci 08 02608 g018
Figure 19. Compressor test facility.
Applsci 08 02608 g019
Figure 20. Schematic of the combined compressor test part.
Applsci 08 02608 g020
Figure 21. Results of aerodynamic performance test: (a) diagram of normalized pressure ratio with respect to normalized mass flow; (b) diagram of normalized efficiency with respect to normalized mass flow.
Applsci 08 02608 g021aApplsci 08 02608 g021b
Figure 22. Structure strength test equipment.
Applsci 08 02608 g022
Table 1. Design variables.
Design VariableLower BoundUpper BoundDesign VariableLower BoundUpper BoundDesign VariableLower BoundUpper Bound
G0−55−38J4−1515X90.40.8
G1−47−17J5−1010X100.61.0
G2−41−11X10.10.3R0−74−68
G3−1317X20.20.5R1−67−37
G4−921X30.30.6R2−76−46
G5−1010X40.40.8R3−75−45
J0−68−62X50.61.0R4−65−58
J1−78−48X60.10.3Y100.5
J2−66−36X70.20.5Y20.250.75
J3−45−15X80.30.6Y30.51.0
Table 2. Parameter settings of M-POD (POD coupling with adaptive sampling method).
ProblemNumber of Initial Sample PointsNumber of Sample Points Selected to Generate Snapshot MatrixNumber of Design Variables RetainedNumber of New Sample Points
TF120050150
TF210003002200
TF3500010005500
Table 3. Summarized results.
ProblemOptimum f-ValueNumber of Total Sample PointsAverage f-Value
PODM-PODRBF
TF1−1.0316250−0.9998−1.0315−0.9682
TF2−195.8311200−177.5−188.3−174.1
TF305500250.374.7608.9
Table 4. Optimization results for main performance indexes.
Main Performance IndexesBaselineOptimized
η1*1.0001.036
η2*1.0441.086
m1*1.0001.006
m2*0.9200.931
π1*1.0001.014
π2*0.7710.782
n1*1.0000.6315
n2*1.0000.8800
δ114.512.7
δ218.623.1
σblade209180
σdisc326331

