Influence of Contextual Factors on Soundscape in Urban Open Spaces


Abstract
Featured Application
Abstract
1. Introduction
2. Methodology
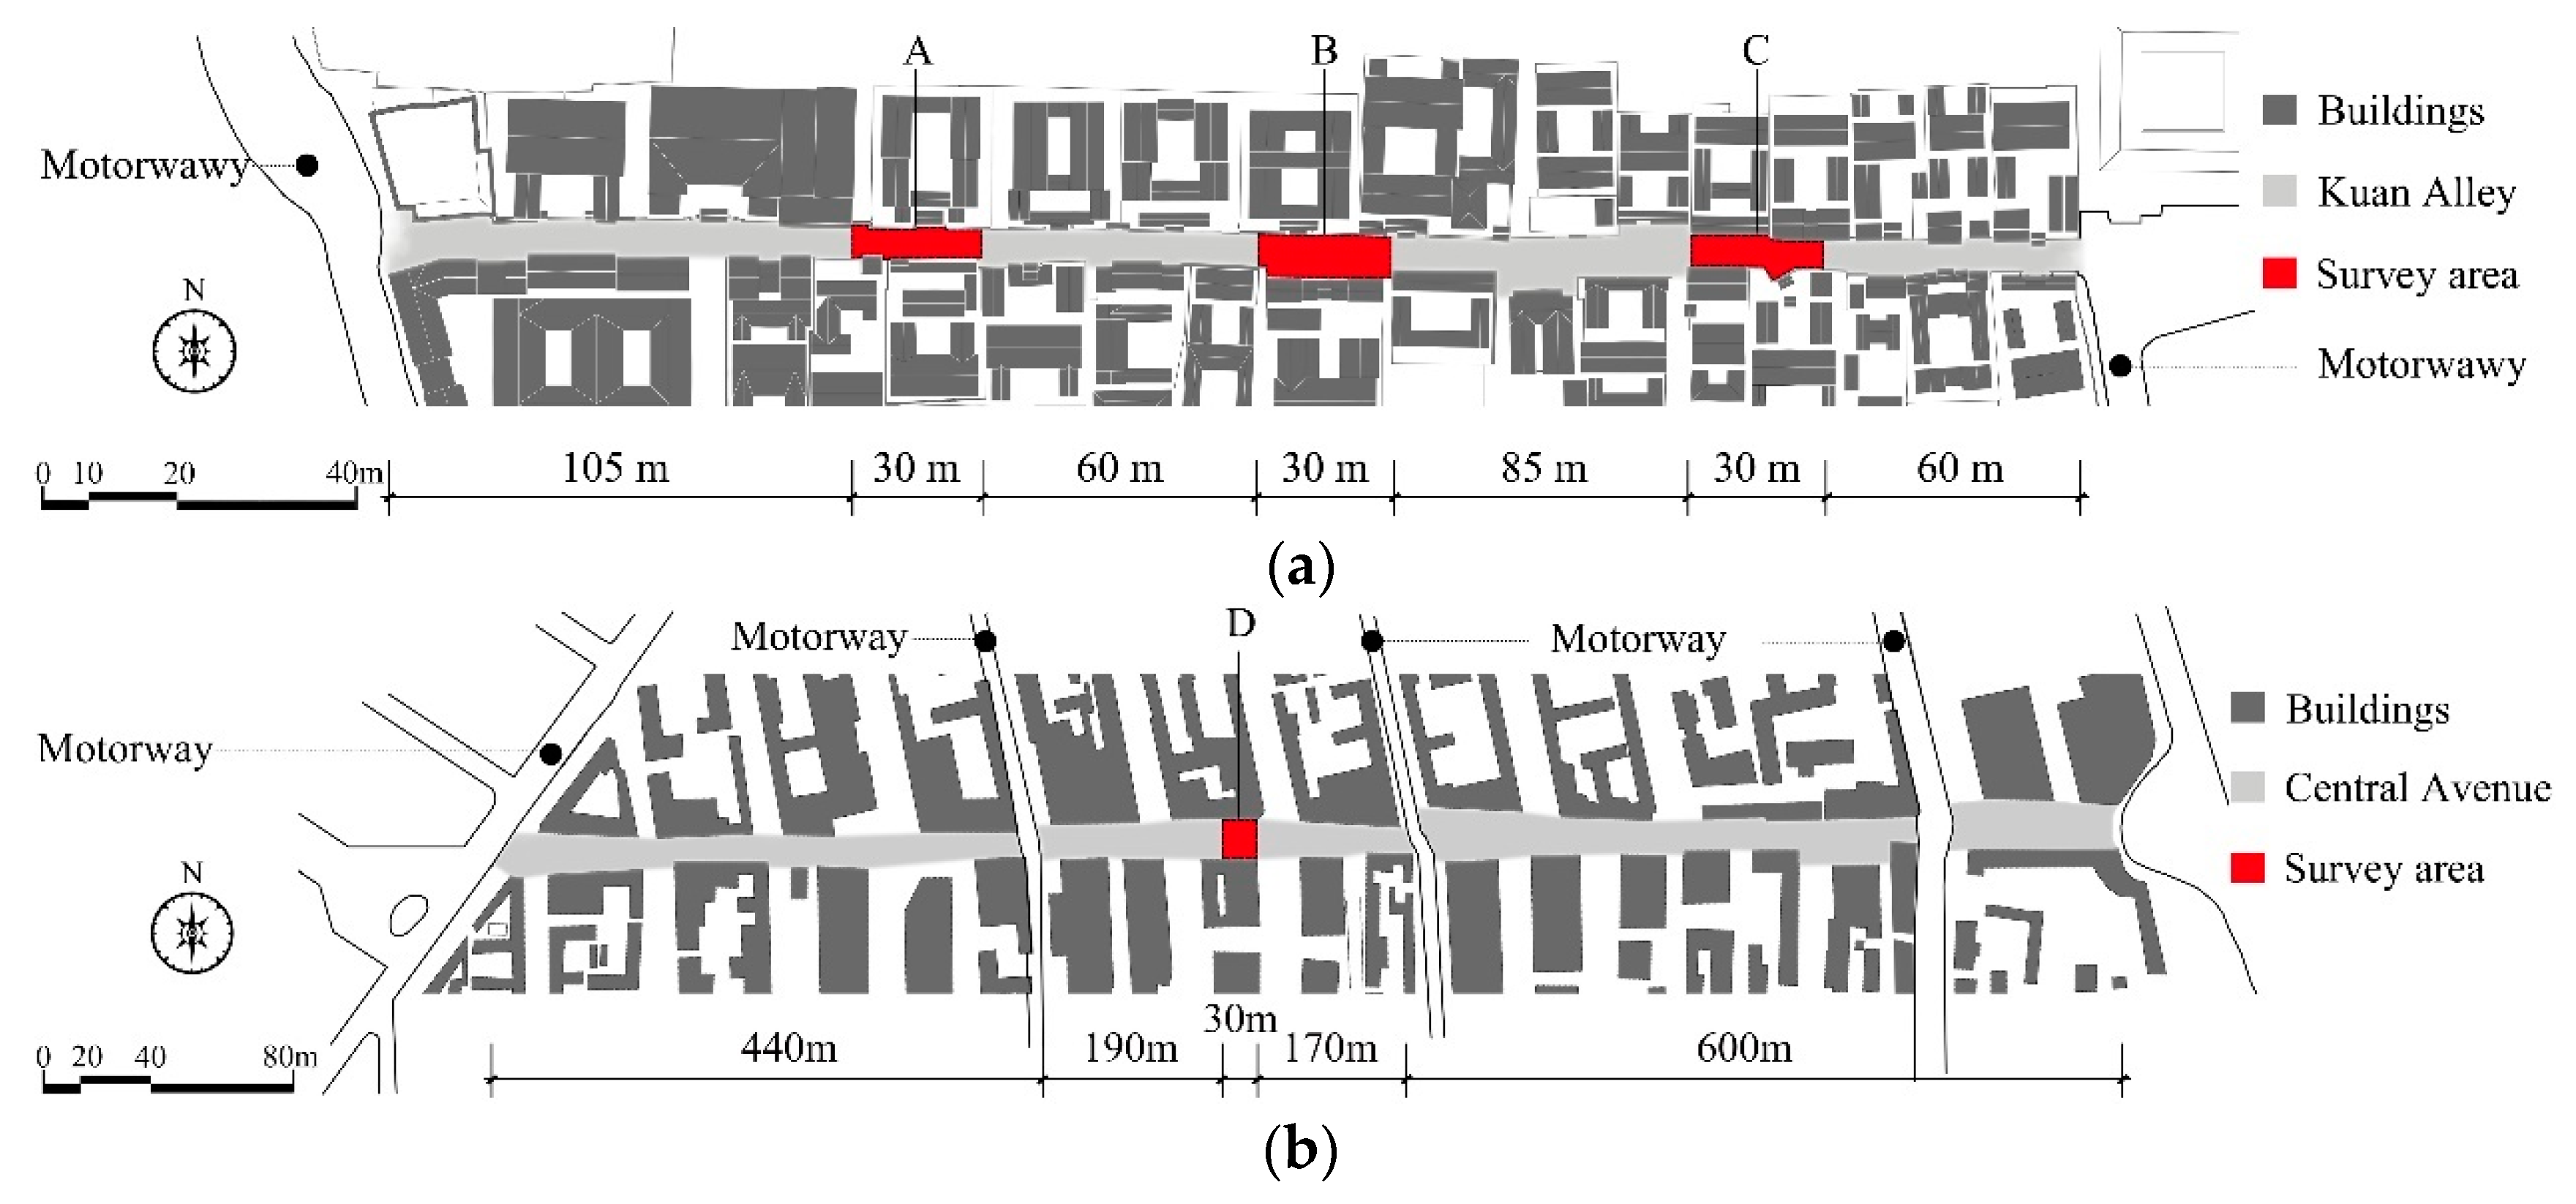
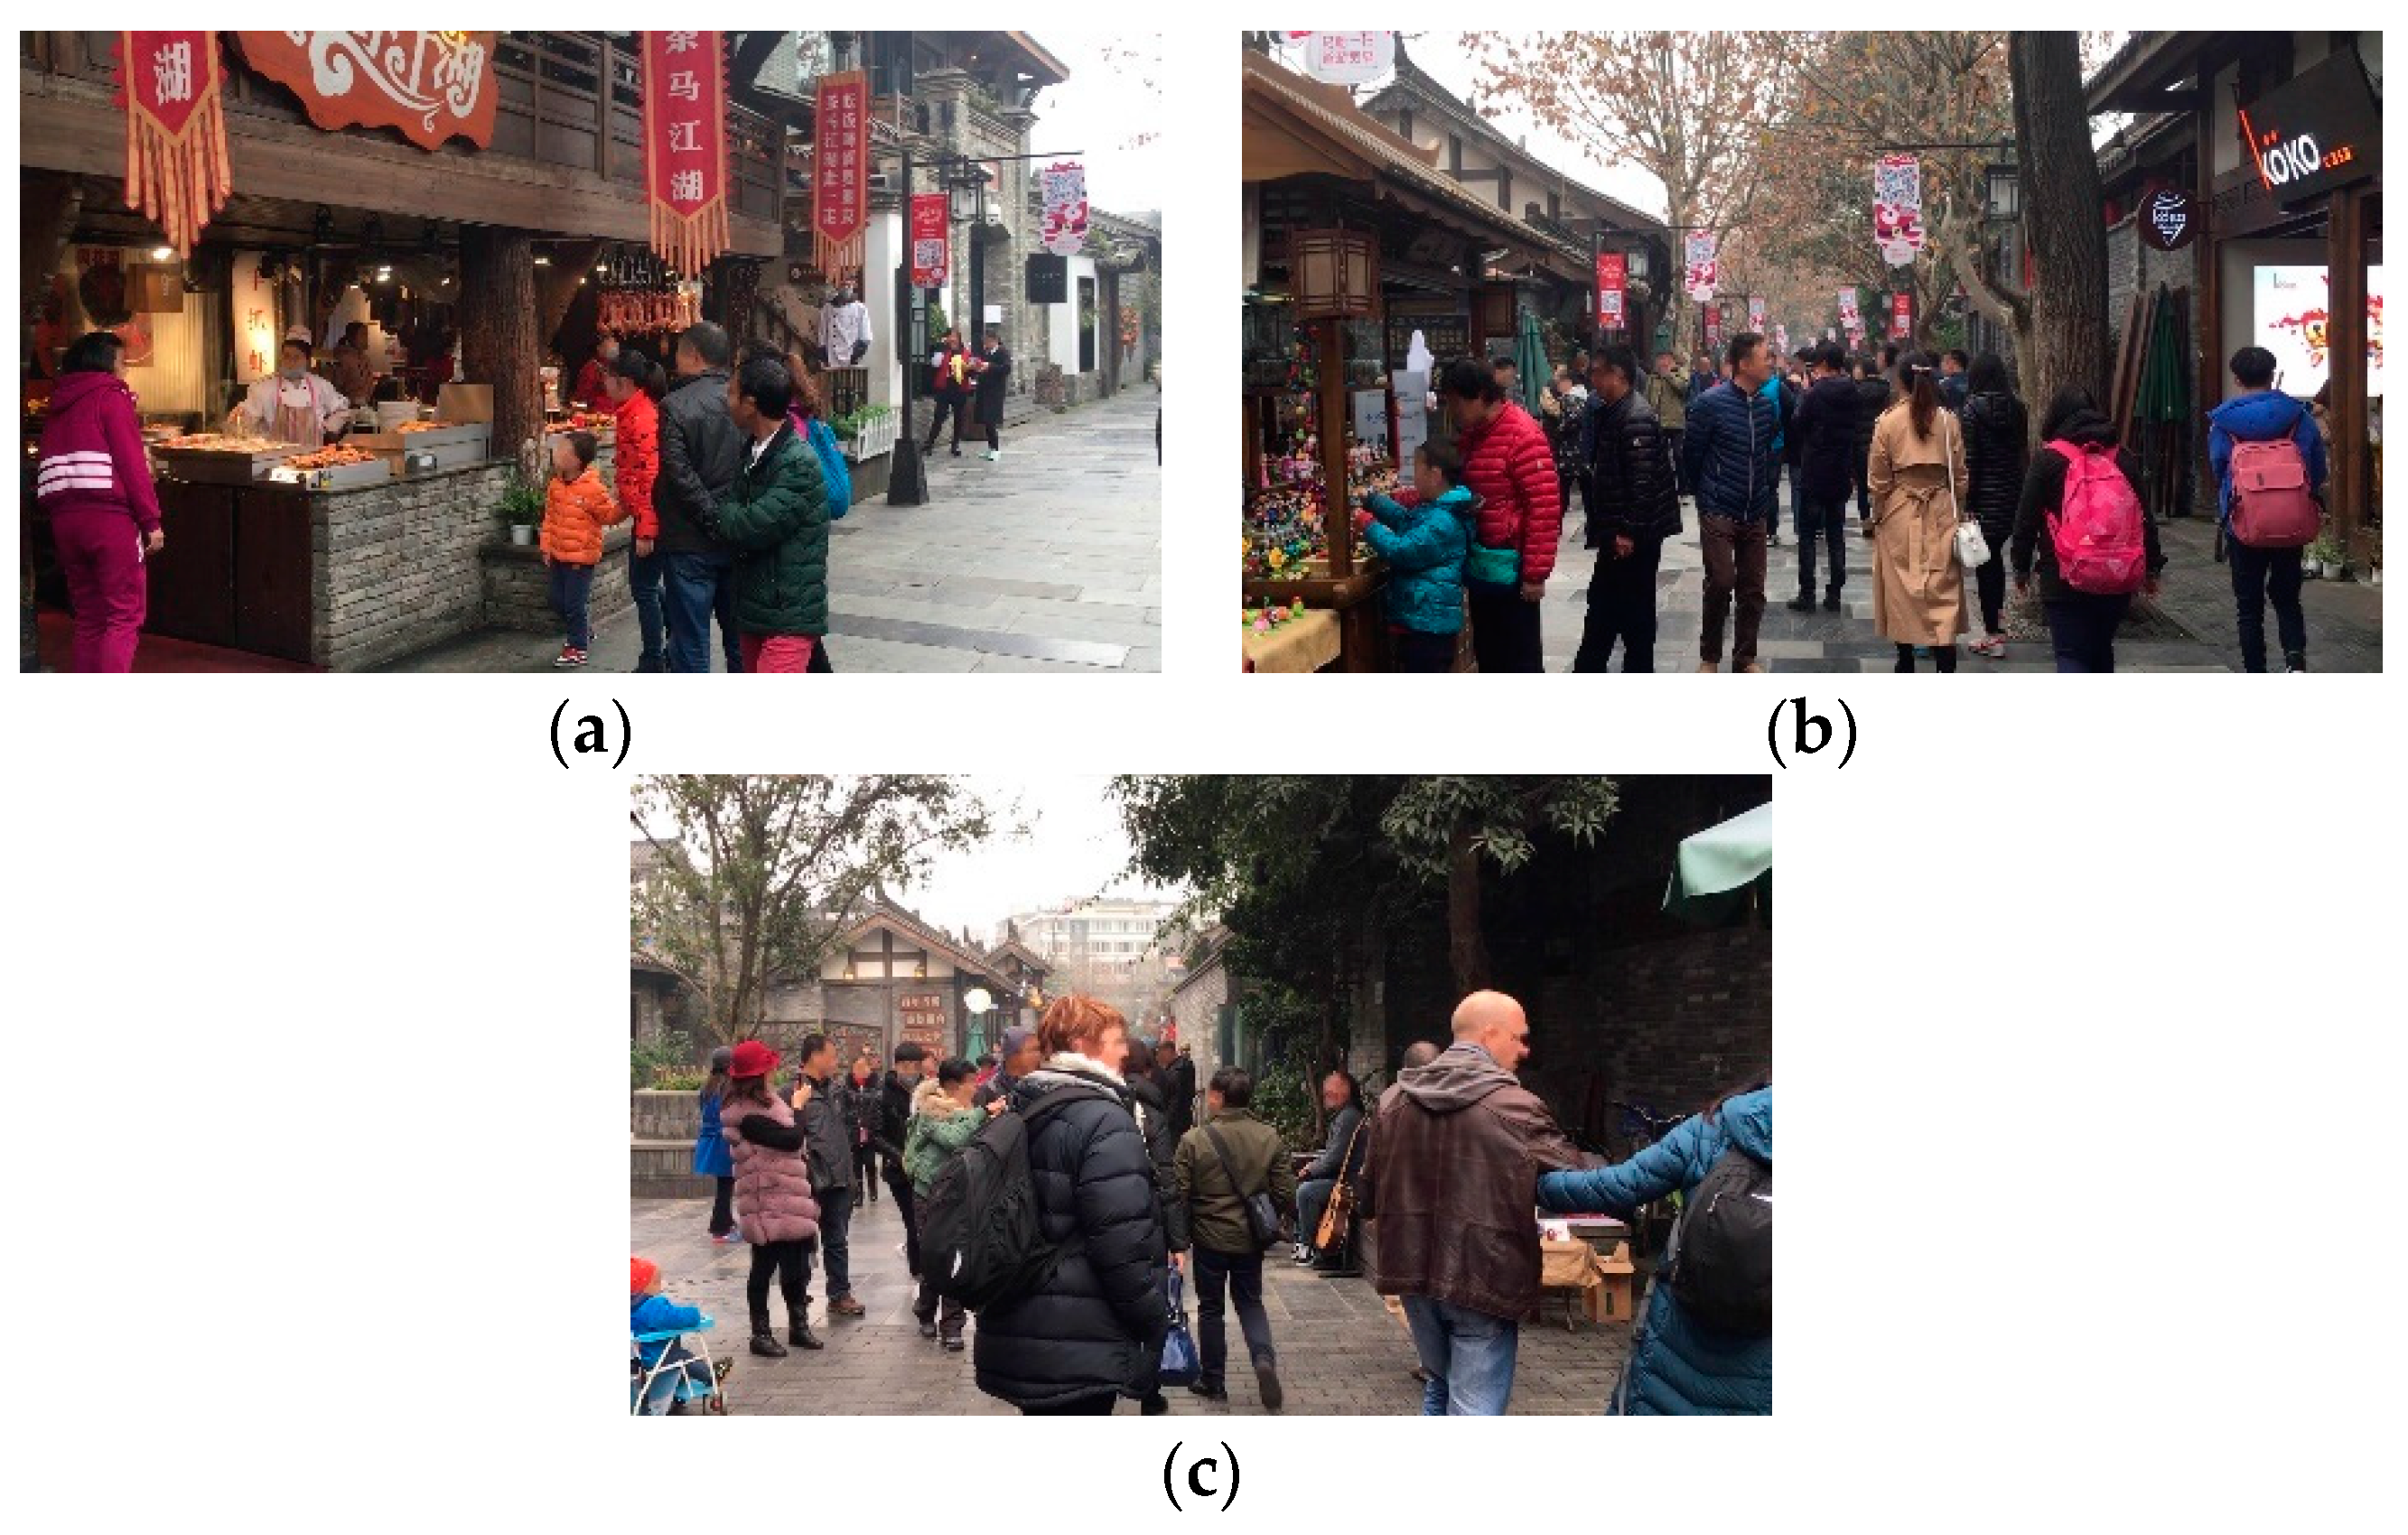
2.1. Survey Sites
2.2. Survey Planning
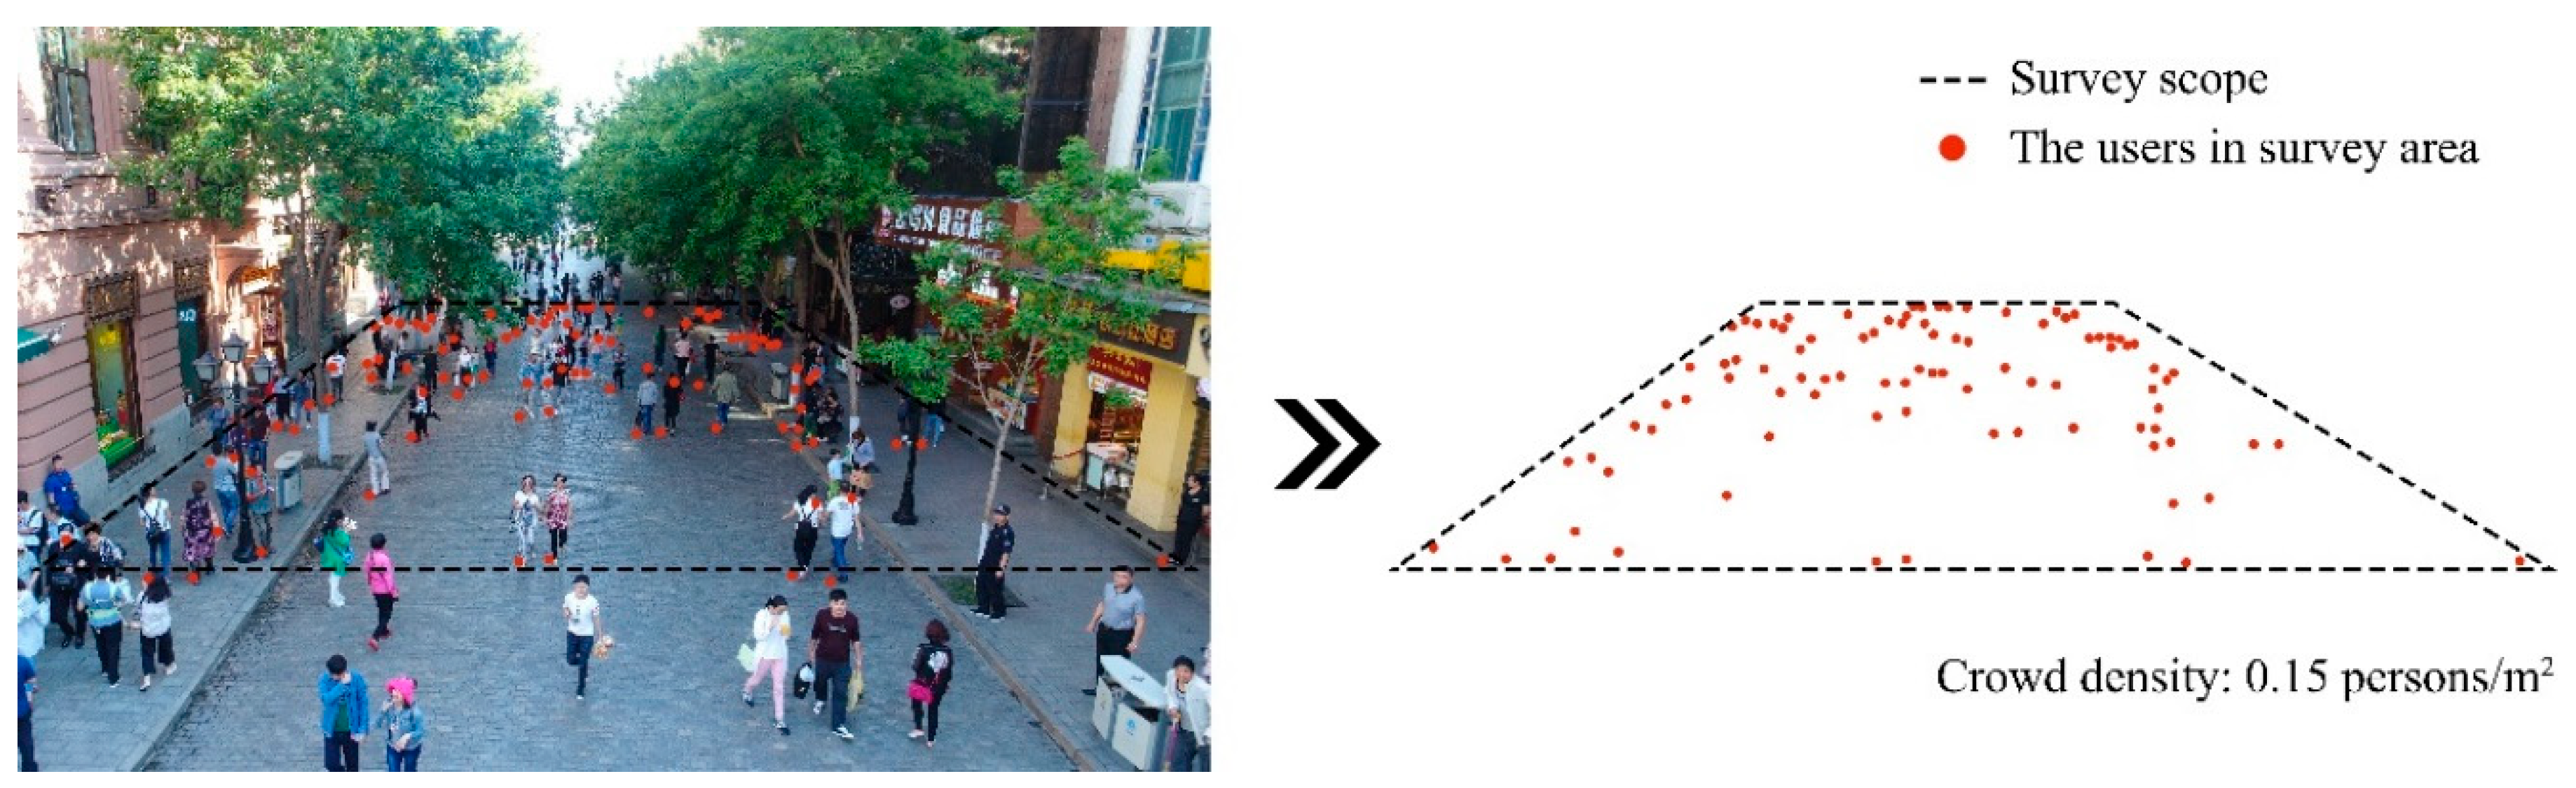
2.3. Crowd Density Measurement
2.4. Conversation Behavior Measurement
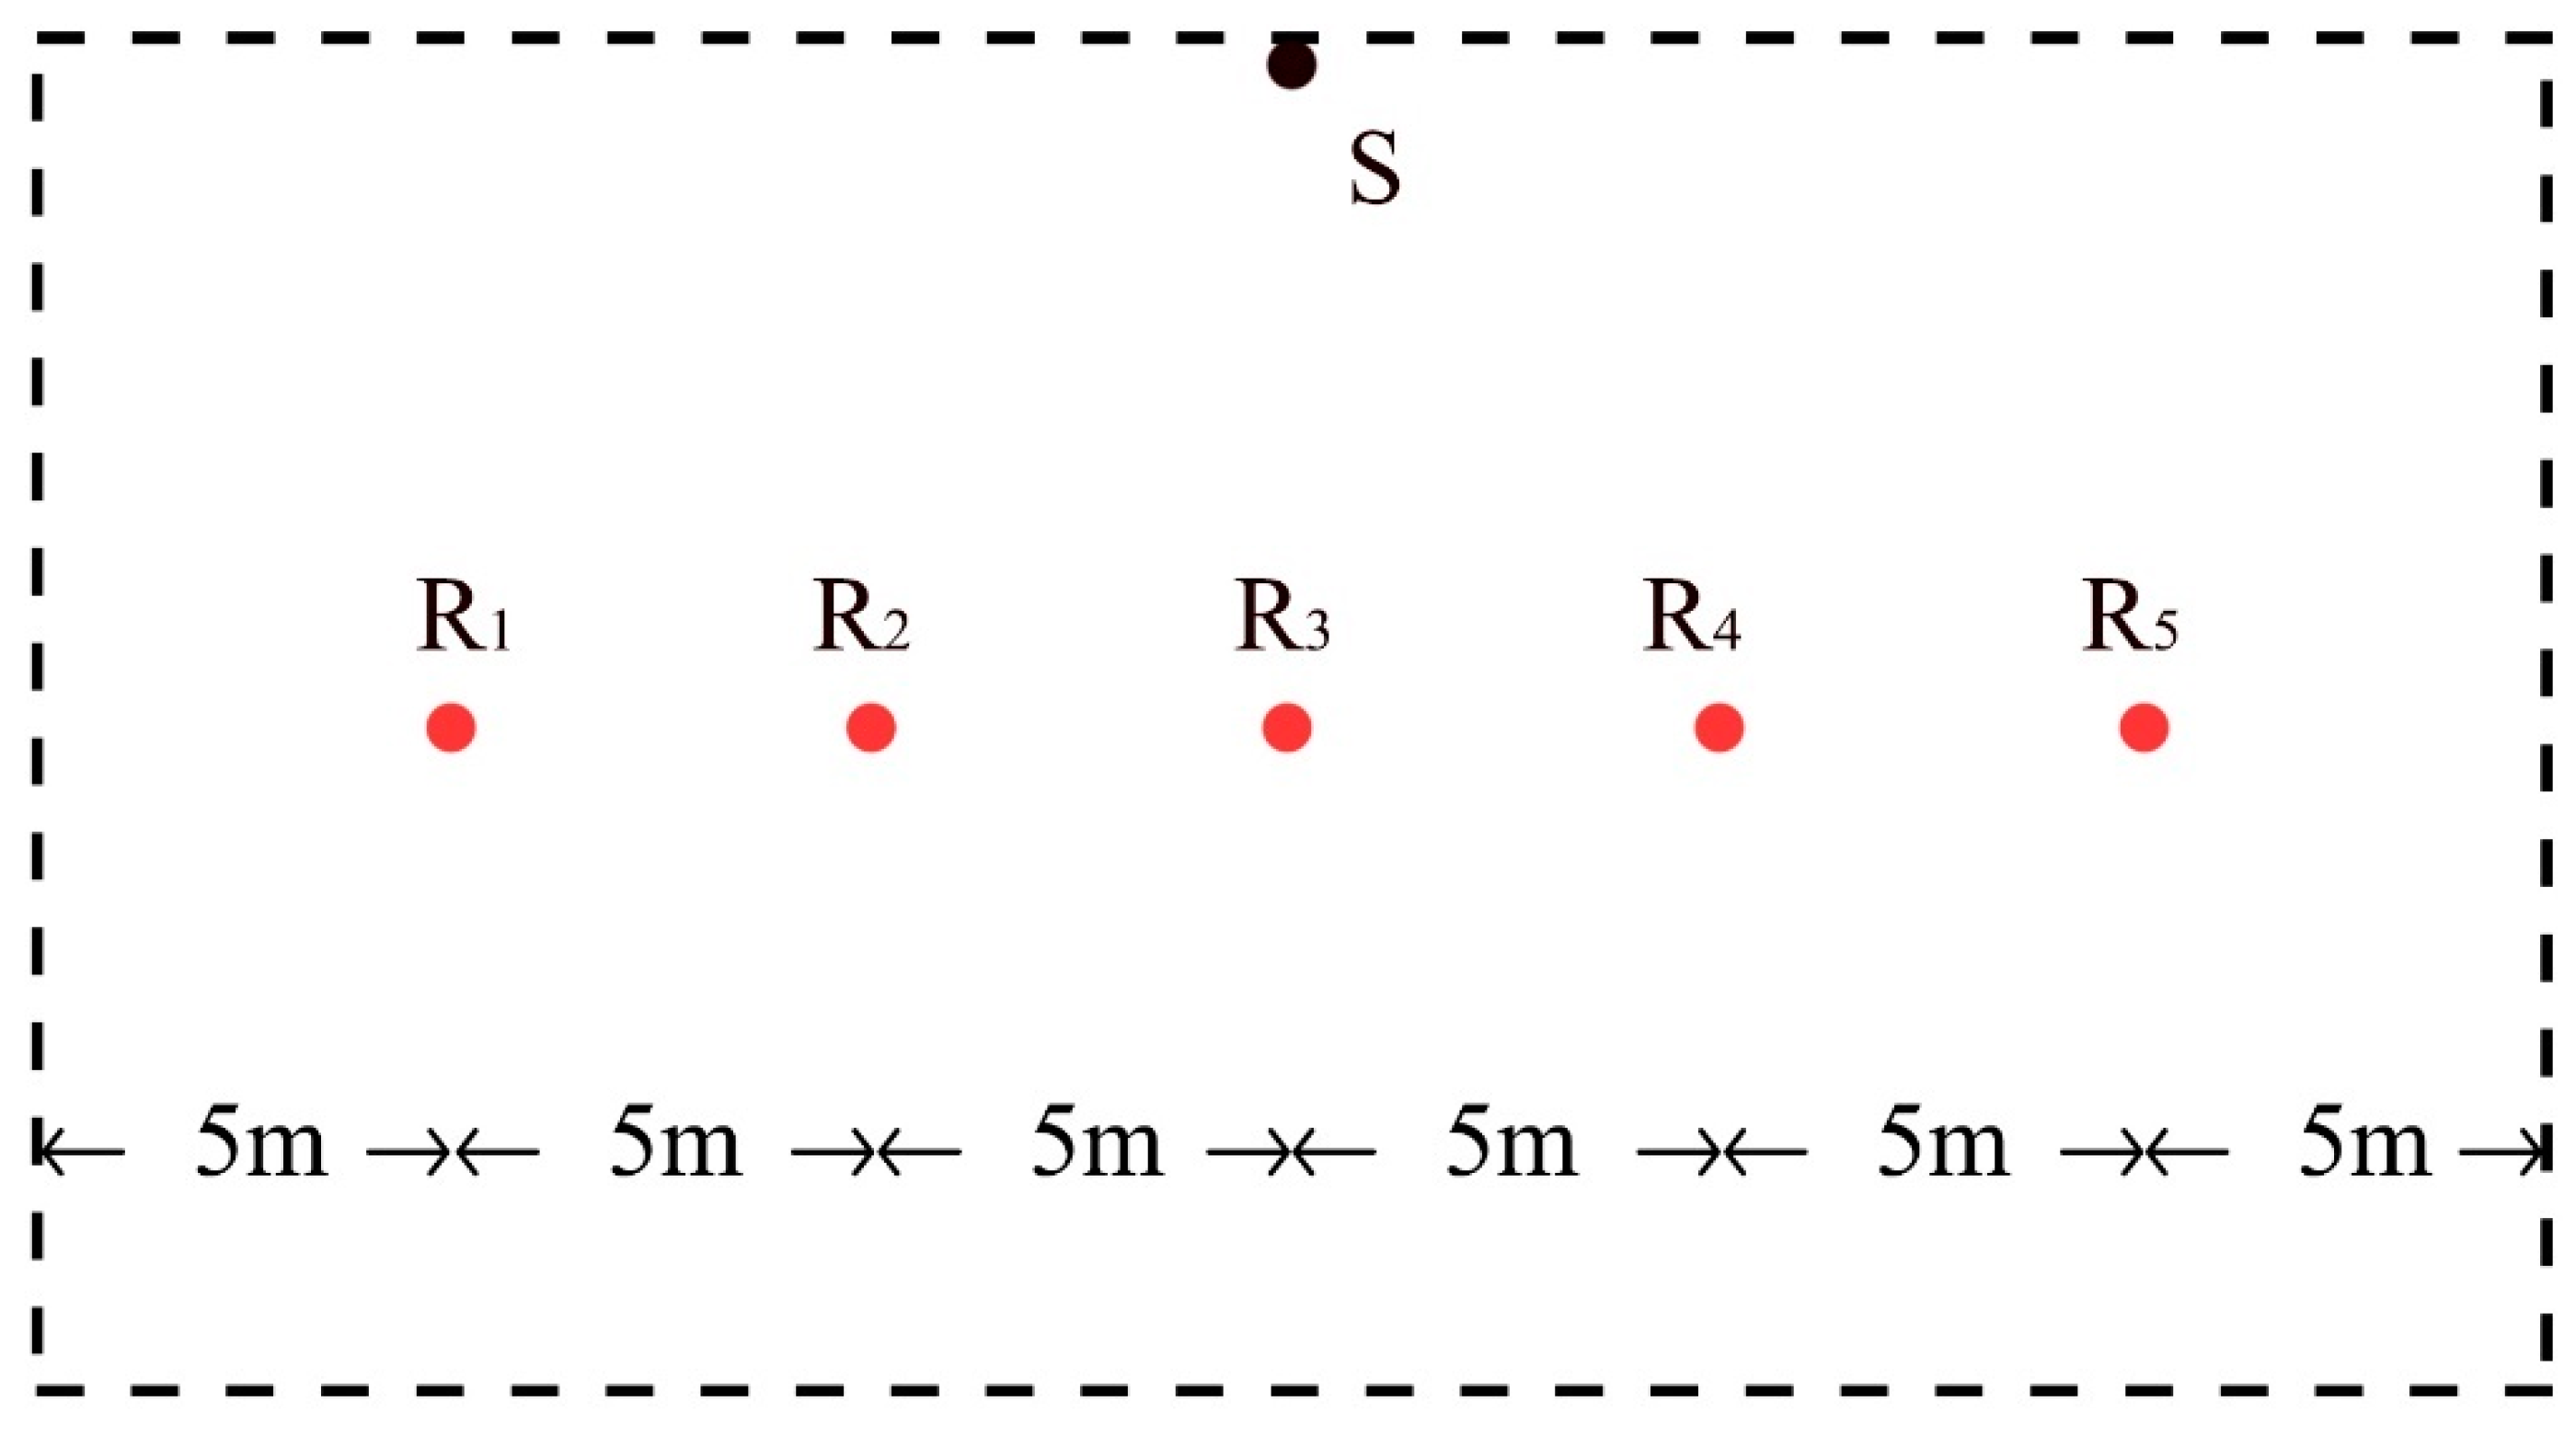
2.5. Acoustic Environment Measurement
2.6. Questionnaire Survey
2.7. Data Analysis
3. Results
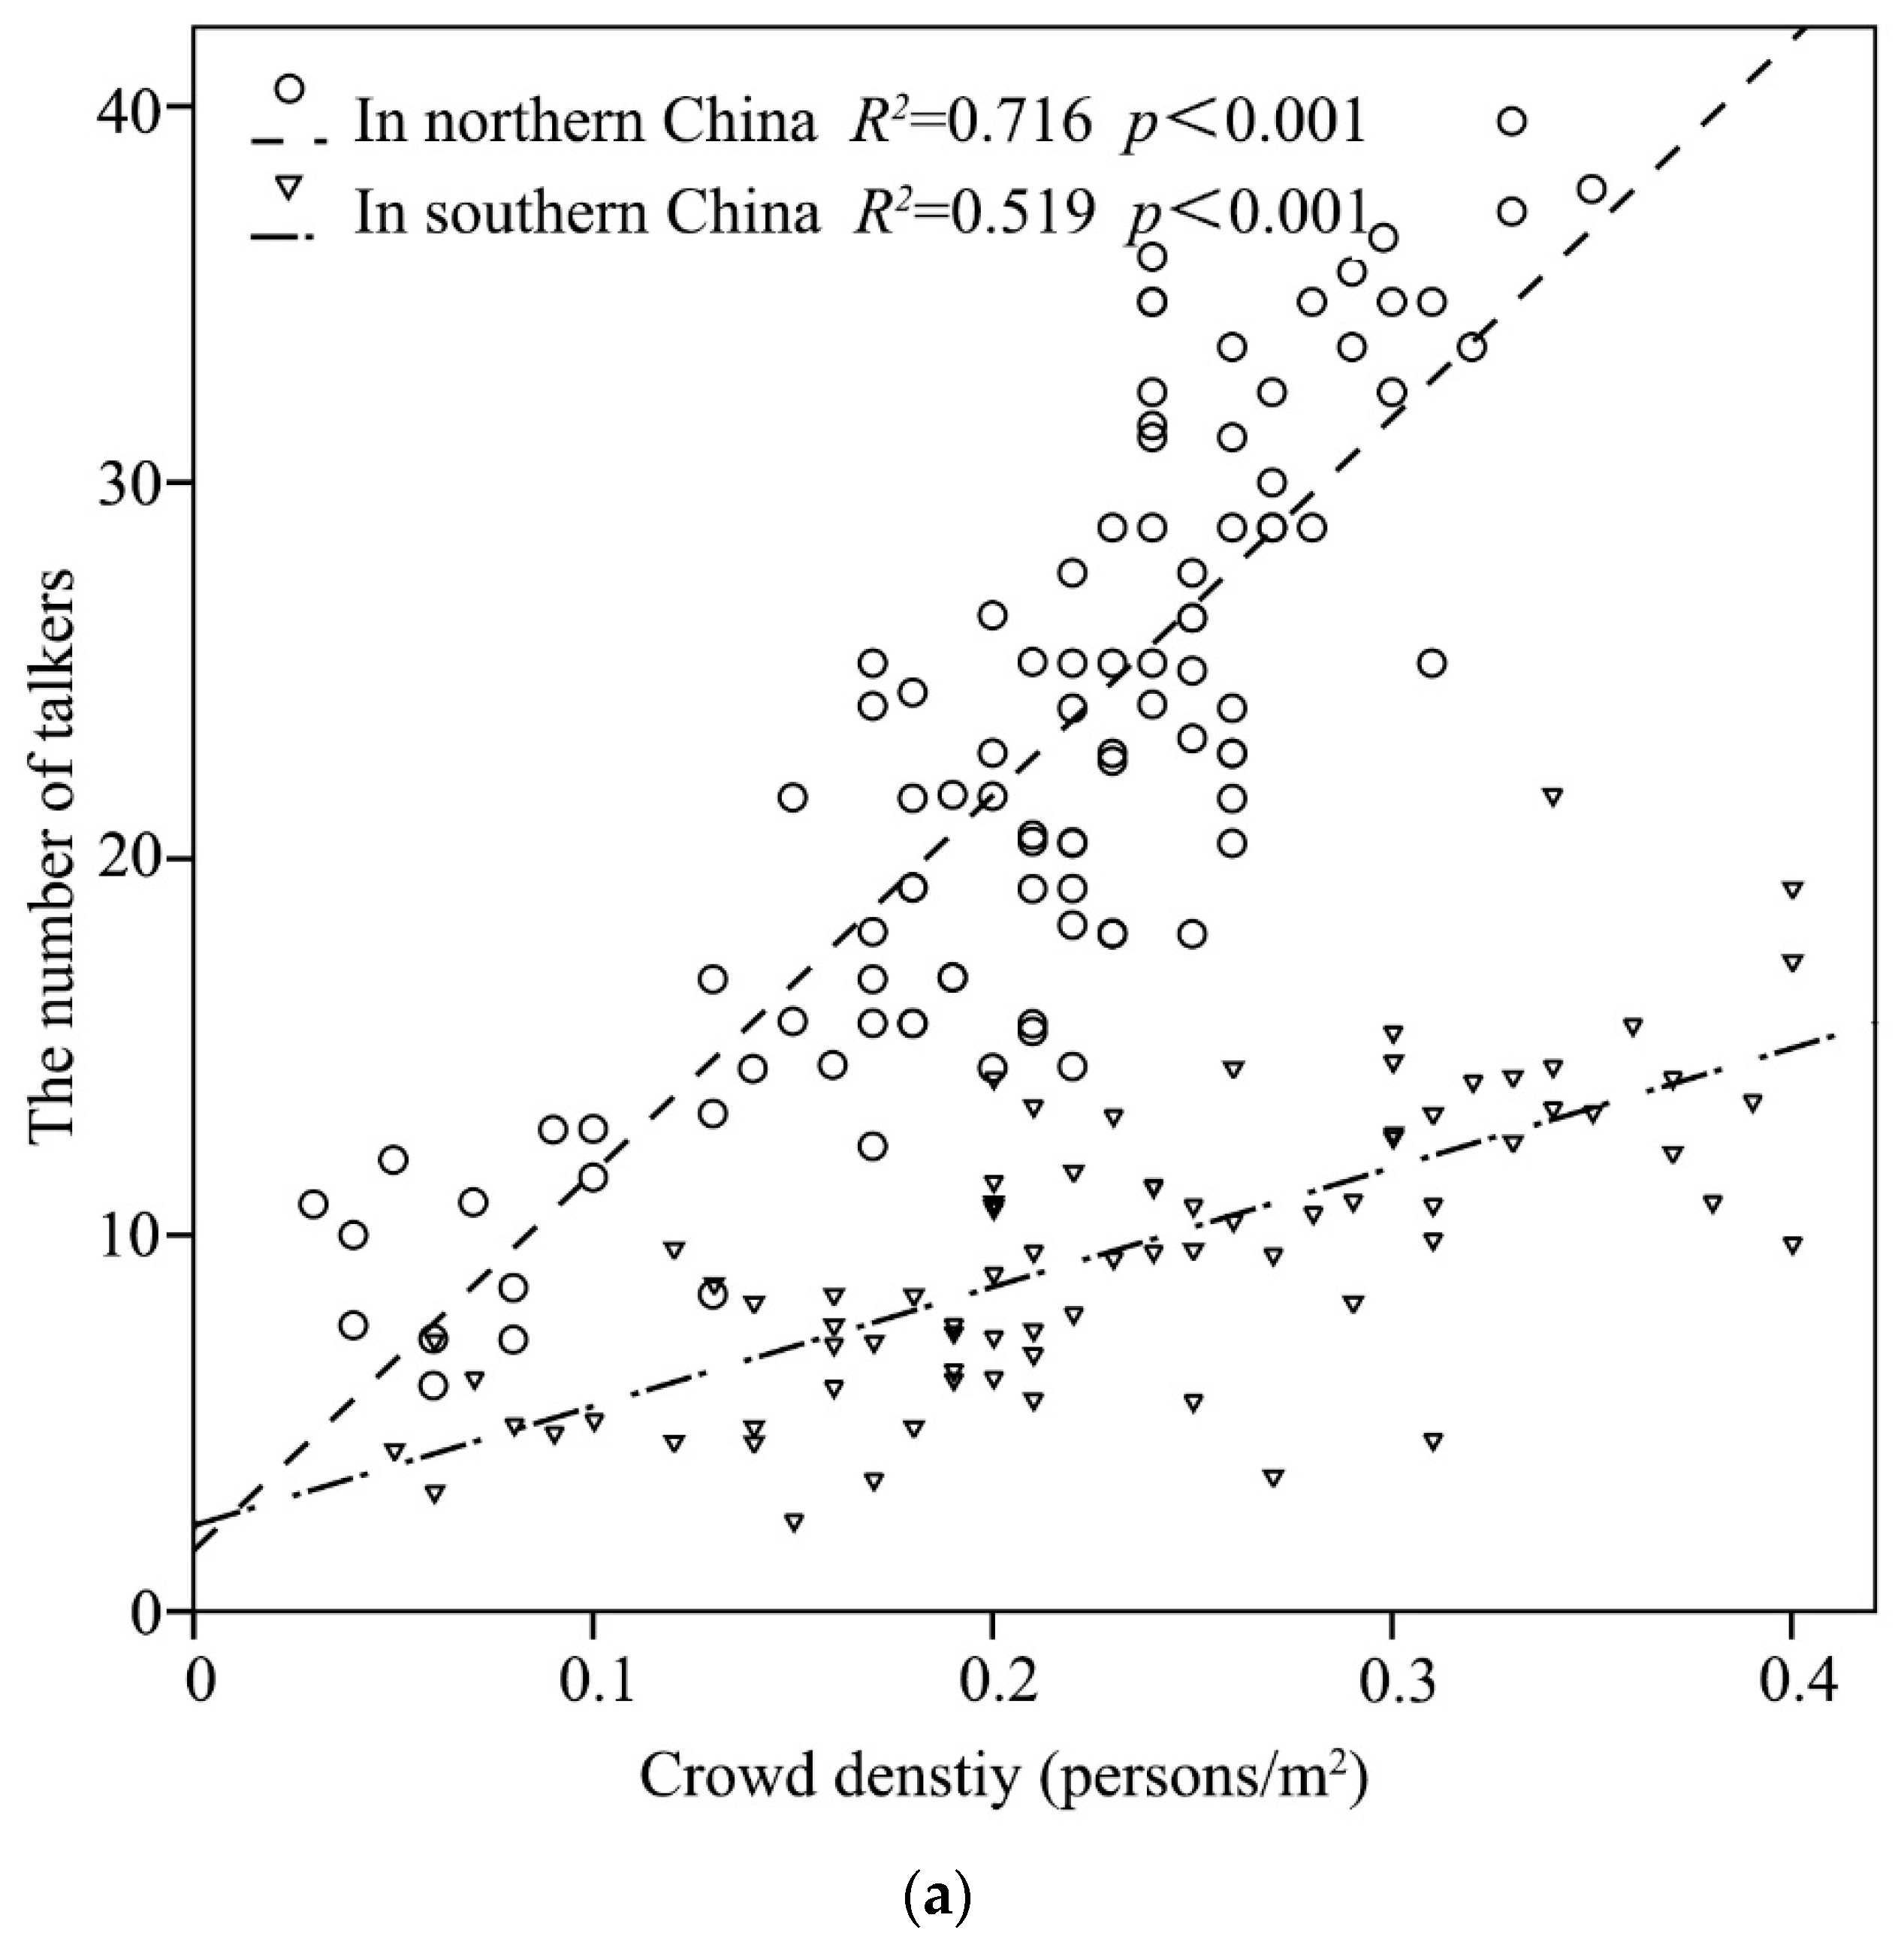
3.1. The Influence of Shop Openness
3.1.1. The Influence on the Number of Talkers
3.1.2. The Influence on the Sound Environment
3.1.3. The Influence on Acoustic Comfort
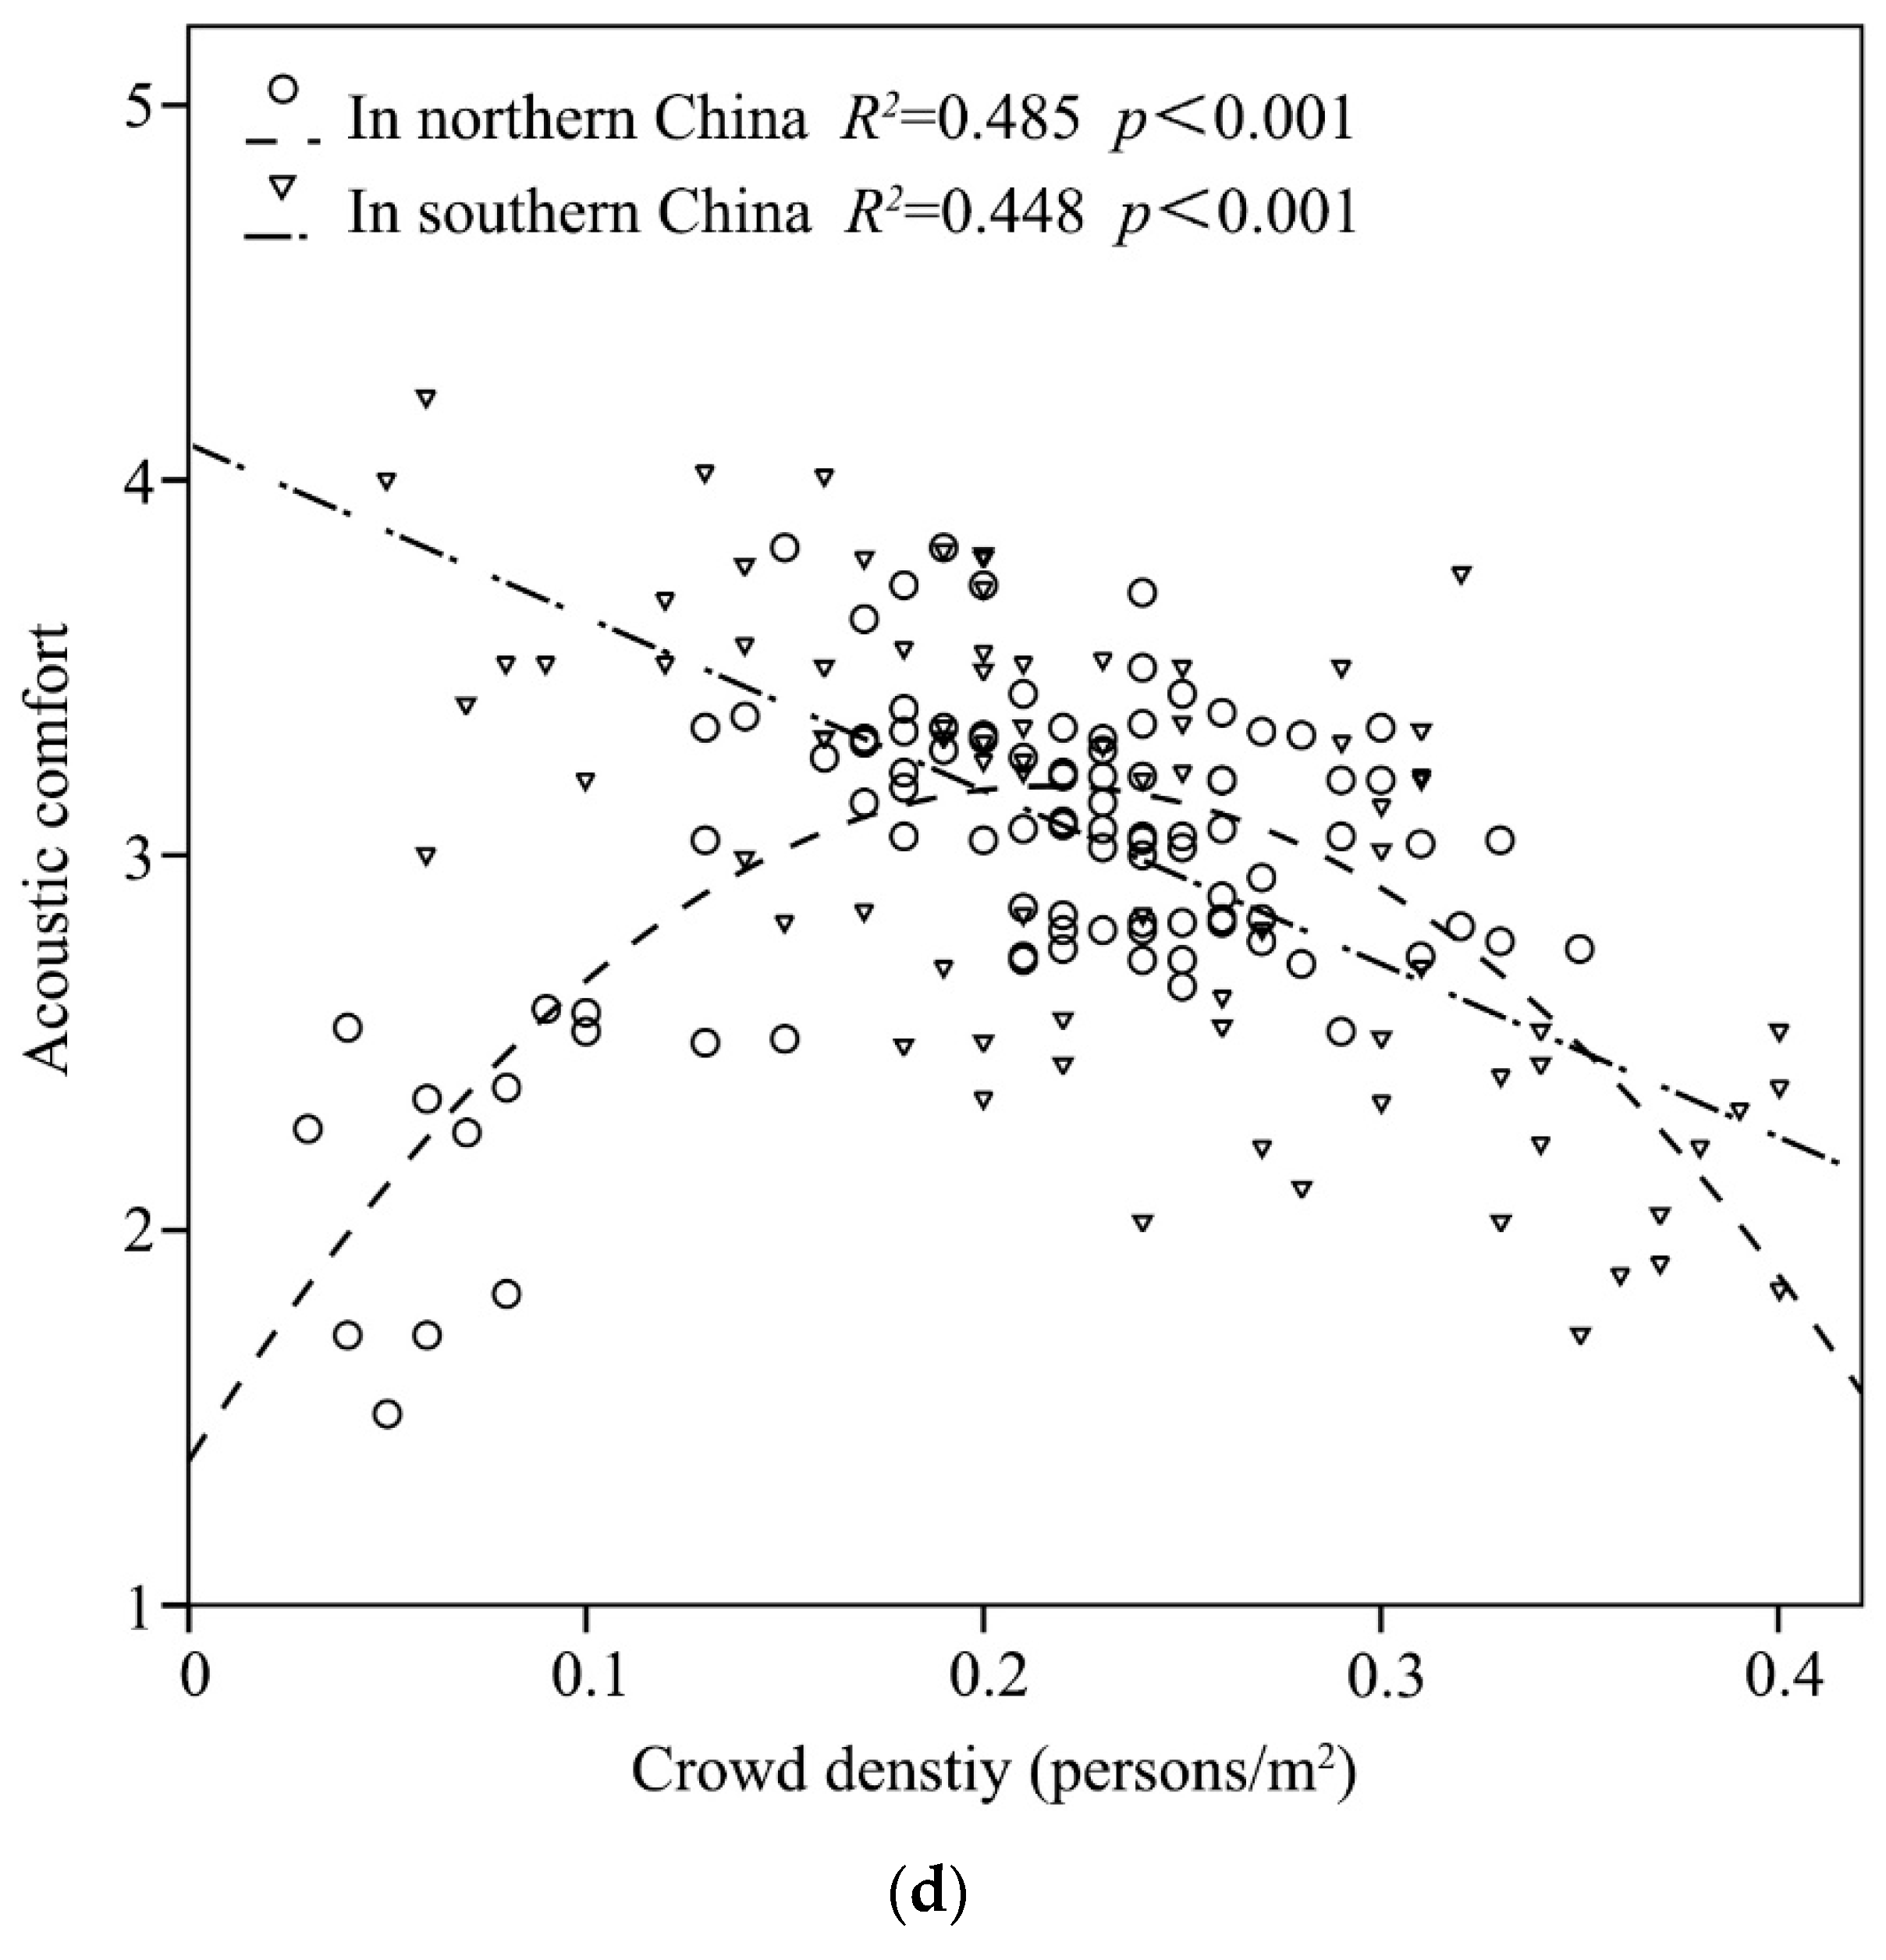
3.2. The Influence of Season
3.2.1. The Influence on the Number of Talkers
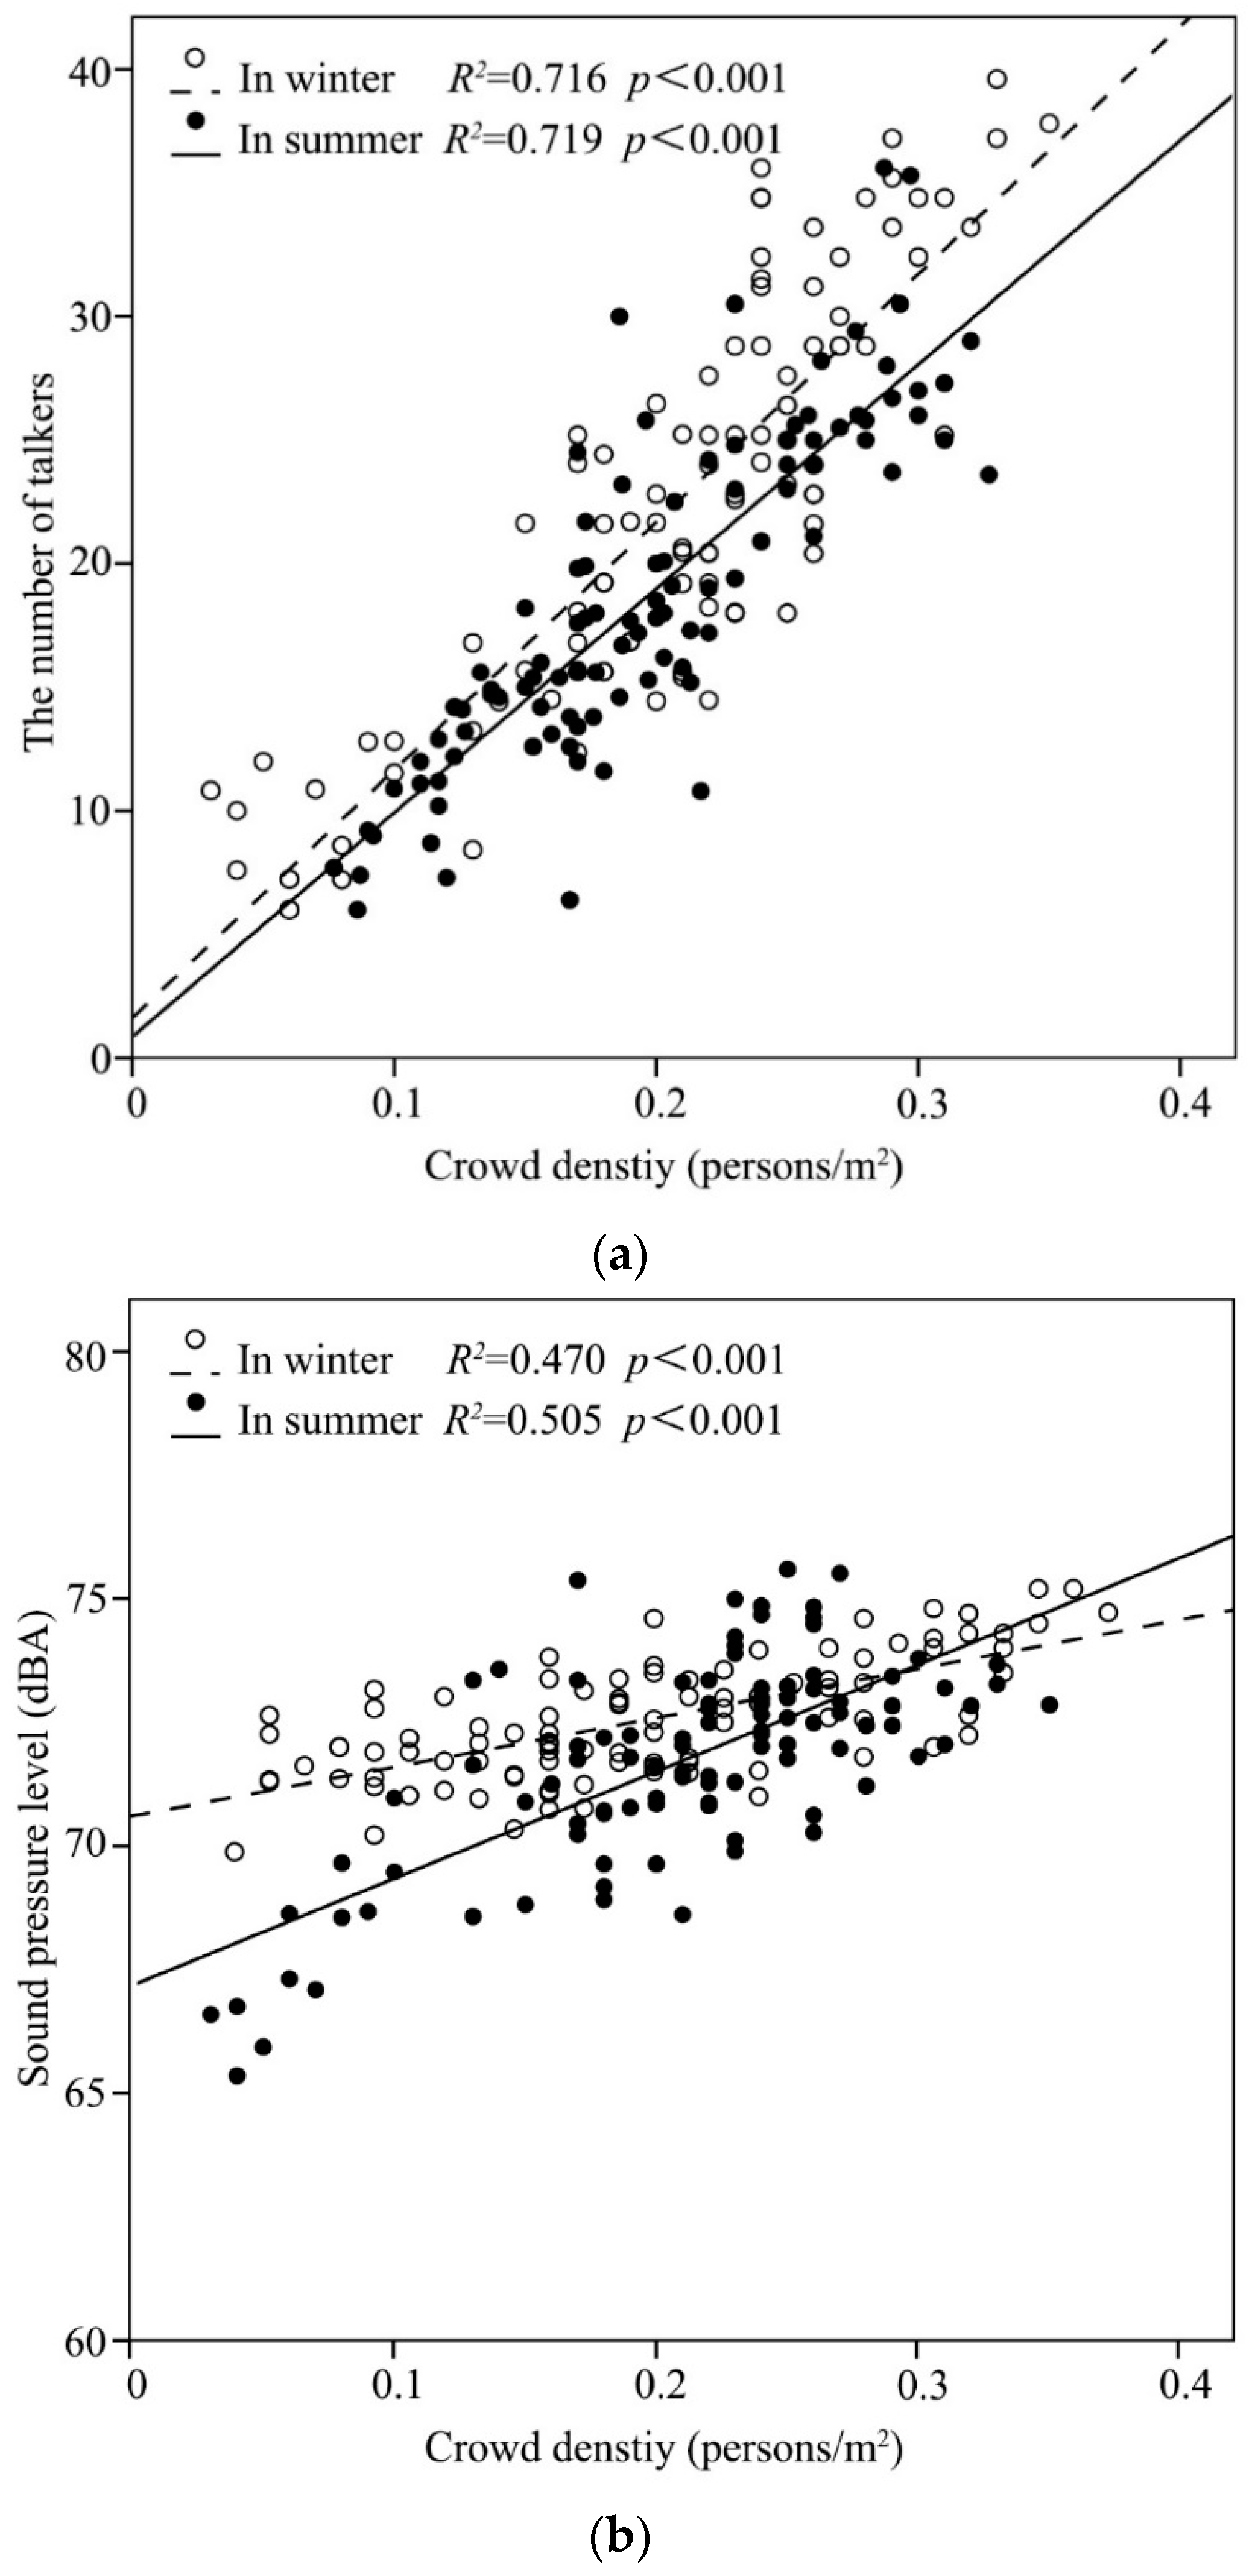
3.2.2. The Influence on Sound Environment
3.2.3. The Influence on Acoustic Comfort
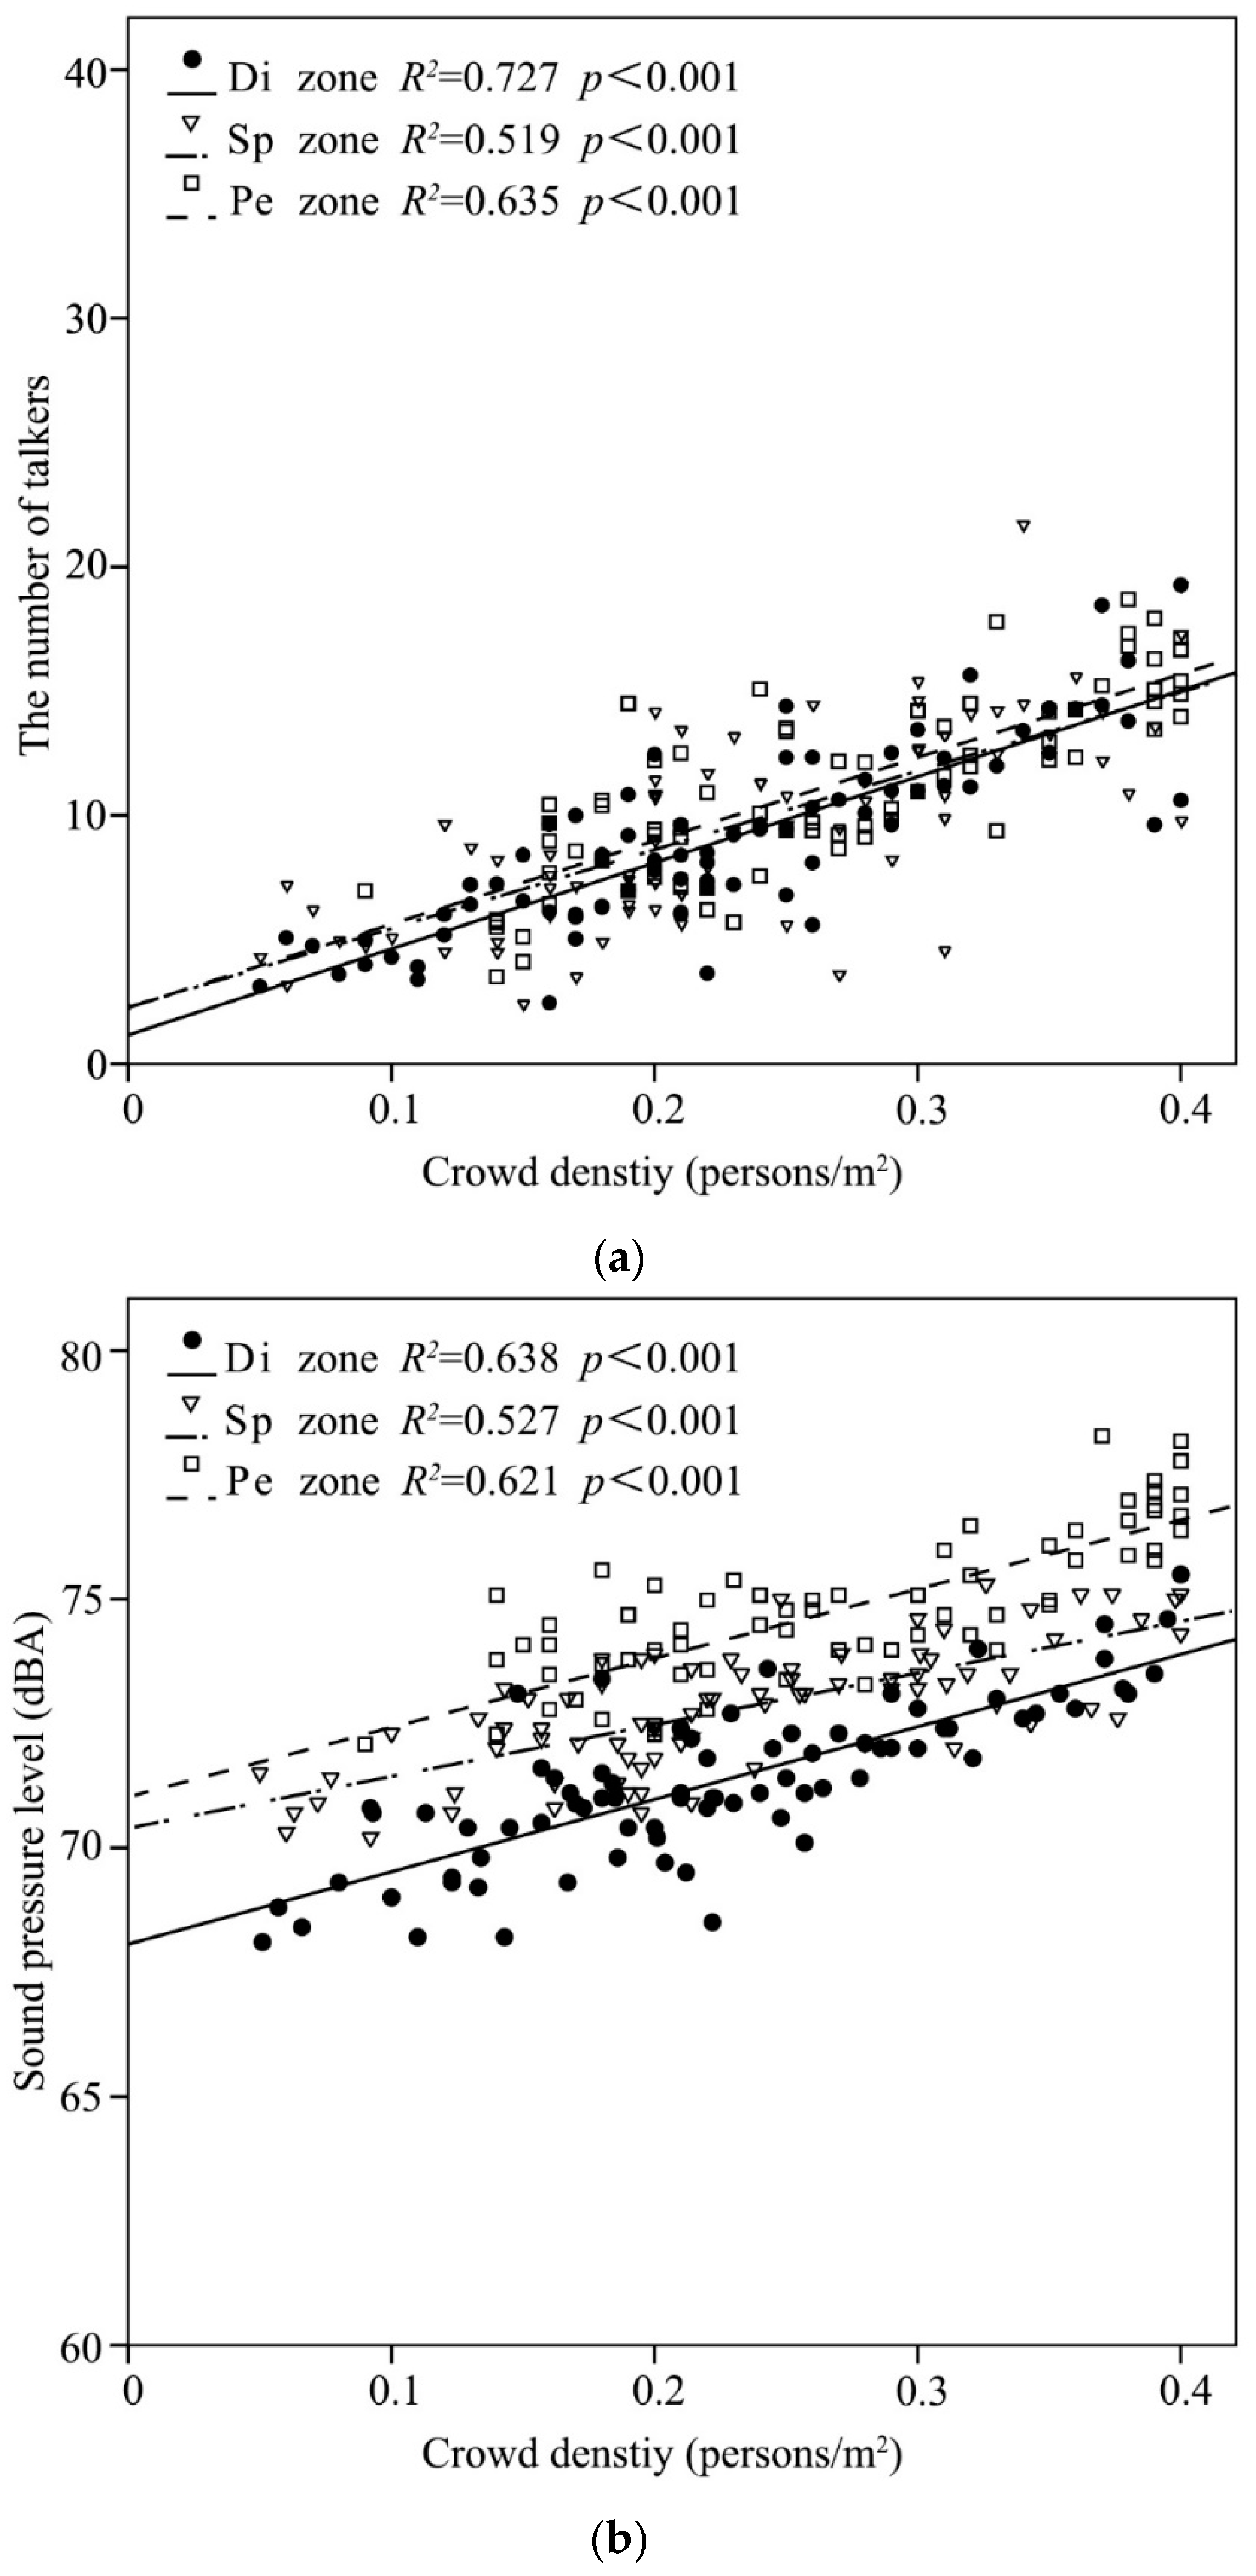
3.3. The Influence of Commercial Function
3.3.1. The Influence on the Number of Talkers
3.3.2. The Influence on Sound Environment
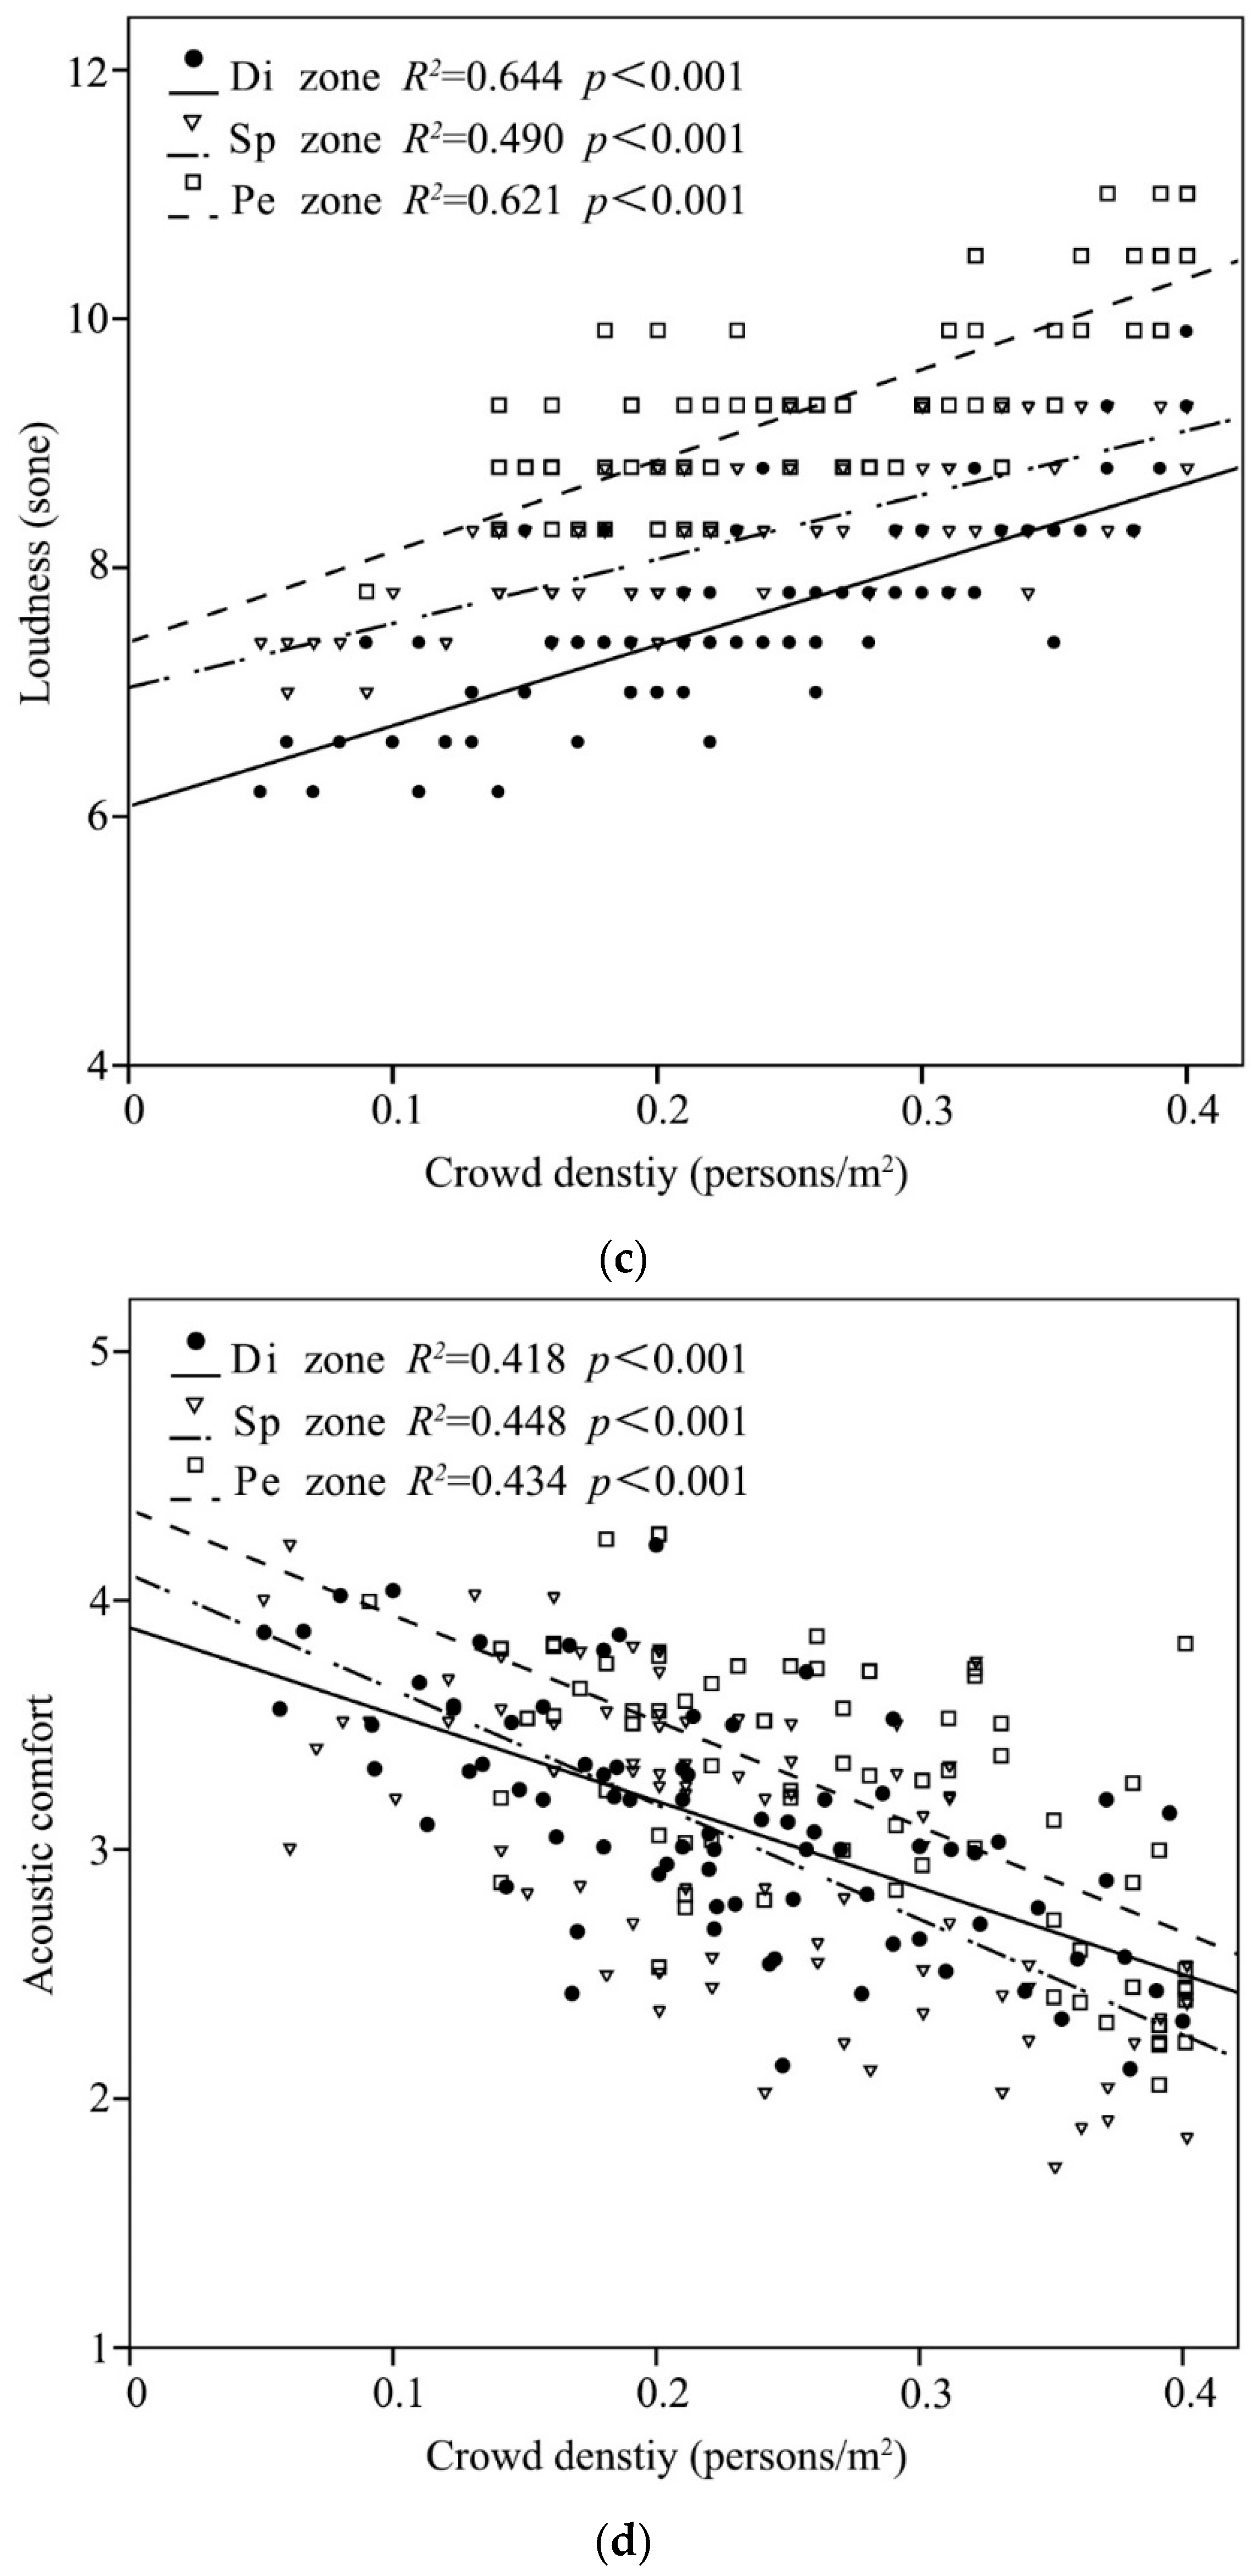
3.3.3. The Influence on Acoustic Comfort
4. Discussion
5. Conclusions
Author Contributions
Funding
Acknowledgments
Conflicts of Interest
References
- Rehan, R.M. The phonic identity of the city urban soundscape for sustainable spaces. HBRC J. 2016, 12, 337–349. [Google Scholar] [CrossRef]
- Rey, G.G.; Barrigón, J.M.; Montes, D.G.; Atanasio, P.M. Relationships among satisfaction, noise perception, and use of urban green spaces. Sci. Total Environ. 2018, 624, 438–450. [Google Scholar]
- Zhang, X.; Ba, M.; Kang, J.; Meng, Q. Effect of soundscape dimensions on acoustic comfort in urban open public spaces. Appl. Acoust. 2018, 133, 73–81. [Google Scholar] [CrossRef]
- Barclay, M.; Kang, J.; Sharples, S. Combining noise mapping and ventilation performance for non-domestic buildings in an urban area. Build. Environ. 2012, 52, 68–76. [Google Scholar] [CrossRef]
- Defrance, J.; Jean, P. Integration of the efficiency of noise barrier caps in a 3D ray tracing method. Case of a T-shaped diffracting device. Appl. Acoust. 2003, 64, 765–780. [Google Scholar] [CrossRef]
- Bastiánmonarca, N.A.; Suárez, E.; Arenas, J.P. Assessment of methods for simplified traffic noise mapping of small cities: Casework of the city of Valdivia, Chile. Sci. Total Environ. 2016, 550, 439–448. [Google Scholar] [CrossRef] [PubMed]
- Aguilera, I.; Foraster, M.; Basagaña, X.; Corradi, E.; Deltell, A.; Morelli, X.; Phuleria, H.C.; Ragettli, M.S.; Rivera, M.; Thomasson, A.; et al. Application of land use regression modelling to assess the spatial distribution of road traffic noise in three European cities. J. Expo. Sci. Environ. Epidemiol. 2014, 25, 97. [Google Scholar] [CrossRef] [PubMed]
- Fecht, D.; Hansell, A.L.; Morley, D.; Dajnak, D.; Vienneau, D.; Beevers, S.; Toledano, M.B.; Kelly, F.J.; Anderson, H.R.; Gulliver, J. Spatial and temporal associations of road traffic noise and air pollution in London: Implications for epidemiological studies. Environ. Int. 2016, 88, 235–242. [Google Scholar] [CrossRef] [PubMed]
- Adler, A.C.; Nathanson, B.H.; Raghunathan, K.; Mcgee, W.T. Effects of body surface area-indexed calculations in the morbidly obese: A mathematical analysis. J. Cardiothorac. Vasc. Anesth. 2013, 27, 1140–1144. [Google Scholar] [CrossRef]
- Hong, J.Y.; Jin, Y.J. Relationship between spatiotemporal variability of soundscape and urban morphology in a multifunctional urban area: A case study in Seoul, Korea. Build. Environ. 2017, 126, 382–395. [Google Scholar] [CrossRef]
- Meng, Q.; Kang, J. Effect of sound-related activities on human behaviours and acoustic comfort in urban open spaces. Sci. Total Environ. 2016, 573, 481–493. [Google Scholar] [CrossRef] [PubMed]
- Liu, J.; Kang, J.; Behm, H.; Luo, T. Effects of landscape on soundscape perception: Soundwalks in city parks. Landsc. Urban Plan. 2014, 123, 30–40. [Google Scholar] [CrossRef]
- Kang, J. Noise management: Soundscape approach. In Encyclopedia of Environmental Health; Elsevier: Amsterdam, The Netherlands, 2011; pp. 174–184. [Google Scholar]
- Jin, Y.J.; Lee, P.J.; You, J.; Kang, J. Acoustical characteristics of water sounds for soundscape enhancement in urban open spaces. J. Acoust. Soc. Am. 2012, 131, 2101–2109. [Google Scholar] [CrossRef] [PubMed]
- Buratti, C.; Belloni, E.; Merli, F.; Ricciardi, P. A new index combining thermal, acoustic, and visual comfort of moderate environments in temperate climates. Build. Environ. 2018, 139, 27–37. [Google Scholar] [CrossRef]
- Chen, Z.; Li, Z.; Wang, S.; Yin, F. A microphone position calibration method based on combination of acoustic energy decay model and TDOA for distributed microphone array. Appl. Acoust. 2015, 95, 13–19. [Google Scholar] [CrossRef]
- Yu, L.; Kang, J. Factors influencing the sound preference in urban open spaces. Appl. Acoust. 2010, 71, 622–633. [Google Scholar] [CrossRef]
- Kang, J. Urban sound environment. Build. Acoust. 2013, 14, 159–160. [Google Scholar] [CrossRef]
- Liu, F.; Kang, J. A grounded theory approach to the subjective understanding of urban soundscape in Sheffield. Cities 2016, 50, 28–39. [Google Scholar] [CrossRef]
- Zhang, M.; Kang, J. A cross-cultural semantic differential analysis of the soundscape in urban open public spaces. Tech. Acoust. 2006, 25, 523–532. [Google Scholar]
- Salomons, E.M.; Pont, M.B. Urban traffic noise and the relation to urban density, form, and traffic elasticity. Landsc. Urban Plan. 2012, 108, 2–16. [Google Scholar] [CrossRef]
- Meng, Q.; Kang, J. The influence of crowd density on the sound environment of commercial pedestrian streets. Sci. Total Environ. 2015, 511, 249–258. [Google Scholar] [CrossRef] [PubMed]
- Lai, F.O.; Ghosh, S. Urban cities and road traffic noise: Reduction through vegetation. Appl. Acoust. 2017, 120, 15–20. [Google Scholar]
- Kang, J. Numerical modeling of the sound fields in urban squares. J. Acoust. Soc. Am. 2005, 117, 3695–3706. [Google Scholar] [CrossRef] [PubMed]
- Pérez-Martínez, G.; Martinez, A.J.; Ruiz, D.P. Soundscape assessment of a monumental place: A methodology based on the perception of dominant sounds. Landsc. Urban Plan. 2018, 169, 12–21. [Google Scholar] [CrossRef]
- Yang, H.S.; Kang, J.; Kim, M.J. An experimental study on the acoustic characteristics of outdoor spaces surrounded by multi-residential buildings. Appl. Acoust. 2017, 127, 147–159. [Google Scholar] [CrossRef]
- Meng, Q.; Zhang, S.; Kang, J. Effects of typical dining styles on conversation behaviours and acoustic perception in restaurants in China. Build. Environ. 2017, 121, 148–157. [Google Scholar] [CrossRef]
- Meng, Q.; Sun, Y.; Kang, J. Effect of temporary open-air markets on the sound environment and acoustic perception based on the crowd density characteristics. Sci. Total Environ. 2017, 601–602, 1488–1495. [Google Scholar] [CrossRef]
- Hong, J.Y.; Jin, Y.J. Influence of urban contexts on soundscape perceptions: A structural equation modeling approach. Landsc. Urban Plan. 2015, 141, 78–87. [Google Scholar] [CrossRef]
- Song, X.; Lv, X.; Yu, D.; Wu, Q. Spatial-temporal change analysis of plant soundscapes and their design methods. Urban For. Urban Gree. 2018, 29, 96–105. [Google Scholar] [CrossRef]
- Djekic, J.; Djukic, A.; Vukmirovic, M.; Djekic, P.; Brankovic, M.D. Thermal comfort of pedestrian spaces and the influence of pavement materials on warming up during summer. Energ Build. 2018, 159, 474–485. [Google Scholar] [CrossRef]
- Tan, Z.; Roberts, A.C.; Christopoulos, G.I.; Kwok, K.W.; Car, J.; Li, X.; Soh, C.K. Working in underground spaces: Architectural parameters, perceptions and thermal comfort measurements. Tunn. Undergr. Space Technol. 2018, 71, 428–439. [Google Scholar] [CrossRef]
- Tsitoura, M.; Tsoutsos, T.; Daras, T. Evaluation of comfort conditions in urban open spaces. Application in the island of Crete. Energy Convers. Manag. 2014, 86, 250–258. [Google Scholar] [CrossRef]
- Qaoud, R.; Djamal, A. The impact of constructivism density of the urban tissue in improving the physical urban ambience of the free space—The street-for Saharian cities. The study of the case city of Biskra. Energy Procedia 2017, 119, 201–213. [Google Scholar] [CrossRef]
- Han, X.; Huang, X.; Liang, H.; Ma, S.; Gong, J. Analysis of the relationships between environmental noise and urban morphology. Environ. Pollut. 2018, 233, 755–763. [Google Scholar] [CrossRef] [PubMed]
- Liu, J.; Kang, J.; Luo, T.; Behm, H.; Coppack, T. Spatiotemporal variability of soundscapes in a multiple functional urban area. Landsc. Urban Plan. 2013, 115, 1–9. [Google Scholar] [CrossRef]
- Shi, J.; Cui, L.; Ma, Y.; Du, H.; Wen, K. Trends in temperature extremes and their association with circulation patterns in China during 1961–2015. Atmos. Res. 2018, 212, 259–272. [Google Scholar] [CrossRef]
- Kisenwether, J.S.; Sataloff, R.T. The Effect of Microphone Type on Acoustical Measures of Synthesized Vowels. J. Voice Off. J. Voice Found. 2015, 29, 548–551. [Google Scholar] [CrossRef]
- Wiens, S.; Szychowska, M.; Eklund, R.; Nilsson, M.E. Data on the auditory duration mismatch negativity for different sound pressure levels and visual perceptual loads. Data in Brief 2017, 11, 159–164. [Google Scholar] [CrossRef]
- Kang, J.; Meng, Q.; Jin, H. Effects of individual sound sources on the subjective loudness and acoustic comfort in underground shopping streets. Sci. Total Environ. 2012, 435–436, 80–89. [Google Scholar] [CrossRef]
- Turchet, L.; Serafin, S. Investigating the amplitude of interactive footstep sounds and soundscape reproduction. Appl. Acoust. 2013, 74, 566–574. [Google Scholar] [CrossRef]
- Goel, N.; Etwaroo, G.R. Bright light, negative air ions and auditory stimuli produce rapid mood changes in a student population: A placebo-controlled study. Psychol. Med. 2006, 36, 1253–1263. [Google Scholar] [CrossRef] [PubMed]
- Yogameena, B.; Nagananthini, C. Computer vision based crowd disaster avoidance system: A survey. Int. J. Disast. Risk Reduct. 2017, 22, 95–129. [Google Scholar] [CrossRef]
- Chan, A.B.; Liang, Z.S.J.; Vasconcelos, N. Privacy preserving crowd monitoring: Counting people without people models or tracking. In Proceedings of the IEEE Conference on Computer Vision and Pattern Recognition, Anchorage, AK, USA, 24–26 June 2008; pp. 1–7. [Google Scholar]
- Oakes, S.; North, A.C. Using music to influence cognitive and affective responses in queues of low and high crowd density. J. Mark. Manag. 2008, 24, 589–602. [Google Scholar] [CrossRef]
- Primeau, K.E.; Witt, D.E. Soundscapes in the past: Investigating sound at the landscape level. J. Archaeol. Sci. Rep. 2017, 19, 875–885. [Google Scholar] [CrossRef]
- Huffman, A.H.; Werff, B.R.V.D.; Henning, J.B.; Watrous-Rodriguez, K. When do recycling attitudes predict recycling? An investigation of self-reported versus observed behavior. J. Environ. Psychol. 2014, 38, 262–270. [Google Scholar] [CrossRef]
- Haataja, E.; Malmberg, J.; Järvelä, S. Monitoring in collaborative learning: Co-occurrence of observed behavior and physiological synchrony explored. Comput. Hum. Behav. 2018, 87, 337–347. [Google Scholar] [CrossRef]
- Greendemers, I.; Pelletier, L.G.; Ménard, S. The impact of behavioural difficulty on the saliency of the association between self-determined motivation and environmental behaviours. Can. J. Behav. Sci. 1997, 29, 157–166. [Google Scholar] [CrossRef]
- Paulhus, D.L.; Vazire, S. The self-report method. In Handbook of Research Methods in Personality Psychology; Guilford Press: New York, NY, USA, 2009; pp. 224–239. [Google Scholar]
- Vining, J.; Ebreo, A. Emerging theoretical and methodological perspectives on conservation behavior. Isr. J. Med. Sci. 2002, 3, 541–558. [Google Scholar]
- Corral-Verdugo, V.C. Dual ‘realities’ of conservation behavior: Self-reports vs. observations of re-ues and recycling behavior. J. Environ. Psychol. 1997, 17, 135–145. [Google Scholar] [CrossRef]
- Grint, N.J.; Beths, T.; Jean, Y.S.; Whay, H.R.; Murrell, J.C. Analysis of behaviors observed during mechanical nociceptive threshold testing in donkeys and horses. J. Equine Vet. Sci. 2017, 50, 102–109. [Google Scholar] [CrossRef]
- Beechey, T.; Buchholz, J.; Keidser, G. Measuring communication difficulty through effortful speech production during conversation. Speech Commun. 2018, 100, 18–29. [Google Scholar] [CrossRef]
- Duives, D.C.; Daamen, W.; Hoogendoorn, S.P. State-of-the-art crowd motion simulation models. Transp. Res. C Emerg. 2013, 37, 193–209. [Google Scholar] [CrossRef]
- Haghani, M.; Sarvi, M. Crowd behaviour and motion: Empirical methods. Transp. Res. B Meth. 2018, 107, 253–294. [Google Scholar] [CrossRef]
- Lu, L.; Chan, C.Y.; Wang, J.; Wang, W. A study of pedestrian group behaviors in crowd evacuation based on an extended floor field cellular automaton model. Transp. Res. C Emerg. 2016, 81, 317–329. [Google Scholar] [CrossRef]
- Zhang, D.; Zhang, M.; Liu, D.; Kang, J. Soundscape evaluation in Han Chinese Buddhist temples. Appl. Acoust. 2016, 111, 188–197. [Google Scholar] [CrossRef]
- Hong, J.Y.; Jin, Y.J. Exploring spatial relationships among soundscape variables in urban areas: A spatial statistical modelling approach. Landsc. Urban Plan. 2017, 157, 352–364. [Google Scholar] [CrossRef]
- Zhang, E.; Zhang, Q.; Xiao, J.; Hou, L.; Guo, T. Acoustic comfort evaluation modeling and improvement test of a forklift based on rank score comparison and multiple linear regression. Appl. Acoust. 2018, 135, 29–36. [Google Scholar] [CrossRef]
- International Organization for Standardization (ISO). Acoustics-Soundscape-Part 2: Data Collection and Reporting Requirements; (ISO/TS 12913-2); ISO: Geneva, Switzerlan, 2018; pp. 1–29. [Google Scholar]
- Liu, F.; Kang, J. Relationship between street scale and subjective assessment of audio-visual environment comfort based on 3D virtual reality and dual-channel acoustic tests. Build. Environ. 2018, 129, 35–45. [Google Scholar] [CrossRef]
- Ren, X.; Kang, J. Effects of the visual landscape factors of an ecological waterscape on acoustic comfort. Appl. Acoust. 2015, 96, 171–179. [Google Scholar] [CrossRef]
- Zhang, S.; Meng, Q.; Kang, J. The influence of crowd density on evaluation of soundscape in typical Chinese restaurant. In Proceedings of the INTER-NOISE 2016—45th International Congress and Exposition on Noise Control Engineering: Towards a Quieter Future, Hamburg, Germany, 21–24 August 2016; pp. 6150–6155. [Google Scholar]
- Dubois, D.; Guastavino, C.; Raimbault, M. A cognitive approach to soundscapes : Using verbal data to access auditory categories. Acta Acust. United Acust. 2006, 92, 865–874. [Google Scholar]
- Yu, L.; Kang, J. Modeling subjective evaluation of soundscape quality in urban open spaces: An artificial neural network approach. J. Acoust. Soc. Am. 2009, 126, 1163–1174. [Google Scholar] [CrossRef] [PubMed]
- Kang, J. Urban Sound Environment; Taylor and Francis: London, UK, 2007. [Google Scholar]
- Nordin, S.; Palmquist, E.; Claeson, A.S. The environmental symptom-attribution scale: Metric properties andnormative data. J. Environ. Psychol. 2013, 36, 9–17. [Google Scholar] [CrossRef]
- Feeney, B.C. A Simple Guide to IBM SPSS Statistics for Version 20.0; Cengage Learning: Boston, MA, USA, 2012. [Google Scholar]
- Zhang, D.; Zhang, M.; Liu, D.; Kang, J. Sounds and sound preferences in Han Buddhist temples. Build. Environ. 2018, 142, 58–69. [Google Scholar] [CrossRef]
- Azizi, A.; Ghaedrahmati, R. Optimizing and evaluating the operational factors affecting the cyanide leaching circuit of the Aghdareh gold processing plant using a CCD model. Proc. R. Soc. A Math. Phys. 2015, 471, 27–40. [Google Scholar] [CrossRef]
- Ganic, E.; Dobrota, M.; Babic, O. Noise abatement measures at airports: Contributing factors and mutual dependence. Appl. Acoust. 2016, 112, 32–40. [Google Scholar] [CrossRef]
- Tian, Y.; Liu, Y.; Liu, X.; Kong, X.; Liu, G. Restructuring rural settlements based on subjective well-being (SWB): A case study in Hubei province, central China. Land Use Policy 2017, 63, 255–265. [Google Scholar] [CrossRef]
- Kang, J. A method for predicting acoustic indices in long enclosures. Appl. Acoust. 1997, 51, 169–180. [Google Scholar] [CrossRef]
- Kang, J. The unsuitability of the classic room acoustical theory in long enclosures. Archit. Sci. Rev. 1996, 39, 89–94. [Google Scholar] [CrossRef]


| Commercial Pedestrian Street | Kuan Alley | Central Avenue | ||||
|---|---|---|---|---|---|---|
| Location | In southern China | In northern China | ||||
| Dating from | In 1718 A.D. | In 1898 A.D. | ||||
| Architectural style | Archaize quadrangle style | Mission revival, Chinese Baroque style | ||||
| Shop openness | Semi-open | Closed | ||||
| Survey season | Winter | Summer | Winter | |||
| Commercial function | Di | Sp | Pe | Sp | ||
| D/H | Height B | 1.15:1 | 1.36:1 | |||
| Height A | 1.3:1 | 1.43:1 | ||||
| Section/Truncation surface |  |  | ||||
| View photograph |  |  | ||||
| Music style | - | pop | pop | pop | ||
| Music tempo | - | 95–100 bpm | 95–100 bpm | 95–100 bpm | ||
| Number/Percentage | |||
|---|---|---|---|
| Commercial Pedestrian Street | Kuan Alley | Central Avenue | |
| Survey season | Winter | 3030 (100%) | 1130 (53.2%) |
| Summer | - | 993 (46.8%) | |
| Commercial function | Di | 966 (31.9%) | - |
| Sp | 1024 (33.8%) | 2123 (100%) | |
| Pe | 1040 (34.3%) | - | |
| Gender | Male | 1231 (40.6%) | 833 (39.2%) |
| Female | 1799 (59.4%) | 1290 (60.8%) | |
| Identity | Tourist | 2272 (75.0%) | 1179 (55.5%) |
| Resident | 758 (25.0%) | 944 (44.5%) | |
| Age | 18–30 years | 1256 (41.5%) | 952 (44.8%) |
| 31–45 years | 1031 (34.0%) | 755 (35.6%) | |
| 46–55 years | 743 (24.5%) | 416 (19.6%) | |
| Total | 3030 (100%) | 2123 (100%) | |
| Commercial Pedestrian Street | Kuan Alley | Central Avenue | ||||
|---|---|---|---|---|---|---|
| Commercial Function | Di | Sp | Pe | Sp | ||
| Survey Season | Winter | Summer | Winter | |||
| Crowd density | Skewness | 0.217 | 0.128 | 0.119 | 0.171 | −0.727 |
| Kurtosis | −0.764 | −0.535 | −0.129 | −0.782 | 0.276 | |
| Variance | 0.008 | 0.007 | 0.007 | 0.004 | 0.005 | |
| The number of talkers | Skewness | 0.577 | 0.610 | −0.003 | 0.287 | 0.053 |
| Kurtosis | −0.089 | 0.458 | −0.827 | −0.485 | −0.810 | |
| Variance | 12.924 | 15.662 | 13.170 | 44.252 | 68.872 | |
| Sound pressure level | Skewness | 0.069 | −0.058 | 0.301 | 0.274 | −0.744 |
| Kurtosis | −0.234 | −0.657 | −0.282 | −0.592 | 0.528 | |
| Variance | 2.438 | 1.586 | 2.165 | 1.443 | 4.547 | |
| Acoustic comfort | Skewness | 0.086 | −0.387 | −0.492 | −0.600 | −0.992 |
| Kurtosis | −0.417 | −0.919 | −0.683 | -0.395 | 0.877 | |
| Variance | 0.213 | 0.380 | 0.309 | 0.313 | 0.183 | |
| Commercial Pedestrian Street | Kuan Alley | Central Avenue | ||||
|---|---|---|---|---|---|---|
| Commercial Function | Di | Sp | Pe | Sp | ||
| Survey Season | Winter | Summer | Winter | |||
| R/Sig | Crowd density and the number of talkers | 0.853 0.000 ** | 0.720 0.000 ** | 0.797 0.000 ** | 0.846 0.000 ** | 0.848 0.000 ** |
| Crowd density and sound pressure level | 0.798 0.000 ** | 0.723 0.000 ** | 0.788 0.000 ** | 0.710 0.000 ** | 0.685 0.000 ** | |
| Crowd density and loudness | 0.803 0.000 ** | 0.700 0.000 ** | 0.788 0.000 ** | 0.662 0.000 ** | 0.653 0.000 ** | |
| Crowd density and acoustic comfort | −0.647 0.000 ** | −0.669 0.000 ** | −0.659 0.000 ** | 0.697 0.000 ** | 0.658 0.000 ** | |
| Commercial Pedestrian Street | Kuan Alley | Central Avenue | |||
|---|---|---|---|---|---|
| Commercial Function | Di | Sp | Pe | Sp | |
| Survey Season | Winter | Summer | Winter | ||
| R/ Sig | 0.721 0.000 ** | 0.541 0.000 ** | 0.680 0.000 ** | 0.670 0.000 ** | 0.606 0.000 ** |
| The Number of Talkers | Sound Pressure Level | |||||
|---|---|---|---|---|---|---|
| 68–70 dBA | 70–72 dBA | 72–74 dBA | 74–76 dBA | Total | ||
| 0–10 persons | a b | 25 13.9% | 65 36.1% | 66 36.7% | 24 13.3% | 180 100.0% |
| 10–20 persons | a b | 7 3.6% | 59 30.4% | 83 42.8% | 45 23.2% | 194 100.0% |
| 20–30 persons | a b | 3 3.9% | 19 25.0% | 35 46.1% | 19 25.0% | 76 100.0% |
| 30–40 persons | a b | 0 0% | 2 8.0% | 18 72.0% | 5 20.0% | 25 100.0% |
| Total | a b | 35 7.4% | 145 30.5% | 202 42.5% | 93 19.6% | 475 100.0% |
| Influence Factors | Model Fitting Criteria | Chi-Square | df | Sig |
|---|---|---|---|---|
| Shop openness | 301.857 | 12.103 | 3 | 0.007 ** |
| season | 291.479 | 1.725 | 3 | 0.631 |
| Commercial function | 321.074 | 31.320 | 6 | 0.000 ** |
| Crowd density | 384.414 | 94.659 | 9 | 0.000 ** |
| The number of talkers | 307.046 | 17.291 | 12 | 0.139 |
| Sound pressure level | 300.004 | 10.249 | 12 | 0.594 |
| Loudness | 293.694 | 3.939 | 9 | 0.915 |
© 2018 by the authors. Licensee MDPI, Basel, Switzerland. This article is an open access article distributed under the terms and conditions of the Creative Commons Attribution (CC BY) license (http://creativecommons.org/licenses/by/4.0/).
Share and Cite
Zhao, X.; Zhang, S.; Meng, Q.; Kang, J. Influence of Contextual Factors on Soundscape in Urban Open Spaces. Appl. Sci. 2018, 8, 2524. https://doi.org/10.3390/app8122524
Zhao X, Zhang S, Meng Q, Kang J. Influence of Contextual Factors on Soundscape in Urban Open Spaces. Applied Sciences. 2018; 8(12):2524. https://doi.org/10.3390/app8122524
Chicago/Turabian StyleZhao, Xiaolong, Shilun Zhang, Qi Meng, and Jian Kang. 2018. "Influence of Contextual Factors on Soundscape in Urban Open Spaces" Applied Sciences 8, no. 12: 2524. https://doi.org/10.3390/app8122524
APA StyleZhao, X., Zhang, S., Meng, Q., & Kang, J. (2018). Influence of Contextual Factors on Soundscape in Urban Open Spaces. Applied Sciences, 8(12), 2524. https://doi.org/10.3390/app8122524