Article

The Effect of Isomorphic Pitch Layouts on the Transfer of Musical Learning

by
Sophia Stanford
,
Andrew J. Milne
*,‡ and
Jennifer MacRitchie
The MARCS Institute for Brain, Behaviour and Development, Western Sydney University, Penrith, NSW 2751, Australia
*
Author to whom correspondence should be addressed.
This paper reports the results of a study that was preregistered on OSF at https://osf.io/xt3n8/register/565fb3678c5e4a66b5582f67.
Current address: Locked Bag 1797, Penrith, NSW 2751, Australia.
Appl. Sci. 2018, 8(12), 2514; https://doi.org/10.3390/app8122514
Submission received: 14 November 2018 / Revised: 29 November 2018 / Accepted: 30 November 2018 / Published: 6 December 2018

Abstract

:

Featured Application

The results obtained in this paper are applicable to the design of new musical instruments intended to facilitate the learning and playing of music.

Abstract

The physical arrangement of pitches in most traditional musical instruments—including the piano and guitar—is non-isomorphic, which means that a given spatial relationship between two keys, buttons, or fretted strings can produce differing musical pitch intervals. Recently, a number of new musical interfaces have been developed with isomorphic pitch layouts where these relationships are consistent. Since the nineteenth century, it has been widely considered that isomorphic pitch layouts facilitate the learnability and playability of instruments, particularly when a piece is transposed into a different key; however, prior to this paper, this has not been experimentally tested. To address this, we investigated four different pitch layouts to examine whether isomorphism facilitates retention and transfer of musical learning within and across keys. Both non-musicians and musicians were tested on two training tasks: two immediate retention tasks and a transfer task. Each participant played every task on two distinct layouts—one being an isomorphic layout (Wicki or Bosanquet), the other being a minimally adjusted non-isomorphic version. For musicians, isomorphism was found to facilitate transfer of learning to a novel task; for non-musicians, the results were mixed. This study provides insight into features that are important to music instrument design.

1. Introduction

Music instrument learning is a domain commonly associated with numerous social, emotional and cognitive benefits. These include increased self-esteem [1,2], increased sense of social identity [3,4], and the provision of a medium for self-expression [5]. Cognitive benefits include improved fluid intelligence [6] increased IQ [7], slowed cognitive decline [8] and increased executive functioning in older adults [9].
In an age where computers are so prevalent and technological advances are constant, it seems desirable for musical instruments also to advance so as to increase accessibility to the many benefits of music learning. Indeed, a number of new music interfaces, such as the Thummer [10], AXiS-49 [11], LinnStrument [12], and Lightpad Block [13] have been developed over the last decade. So far, however, none of these have achieved widespread or “mainstream” acceptance. This may be due to a lack of clear and agreed upon guidelines as to what the important features of successful musical instruments (traditional or digital) are [14]. Paine and colleagues [10] suggested that desirable features to control on musical instruments include pitch, dynamics, articulation, attack/release, and vibrato. “Touchability”, that is, the ability to make a physical connection with an interface, is another desirable trait of musical interfaces, relating primarily to the user’s ability to control the quality of an instrument’s sound.
However, before aspects of sound quality can be accurately manipulated, deciphering and memorising the placement of pitches is a crucial first step in learning how to play any given instrument (traditional or digital). MacRitchie and Milne [15] argued that learnability and playability are important features of instrument design in terms of their influences on how fast a new motor control program is devised by the learner. Learnability, in this instance, refers to how easy it is to understand and acquire the skills required to play an instrument, that is, to understand and remember the patterns of musical pitches contained within a certain layout. Playability refers to how easy it is to execute the physical motions involved in playing an instrument.
These two aspects are related to the first two of three stages of motor learning described by Schmidt and Lee [16]. In the cognitive phase, patterns are appraised and potential motor techniques are tested to determine which solution is optimal. In the fixation stage, the optimal motor solution identified in the previous phase is practised and eventually mastered. When the autonomous stage is reached, less conscious attention is required for the performer to execute the motor skill. This study focuses on the cognitive phase of motor skill development—a phase that is, according to the above characterisation, foundational.
Two features of pitch layouts that have been empirically tested so far for their effects on learnability and playability are major second adjacency (whether pitches a major second apart are next to each other or not) and shear (whether the pitch axis is vertical or slanted) [15]. The results showed that the accuracy of musicians’ performances on a series of tasks was higher on layouts with adjacent major seconds than on layouts with non-adjacent major seconds. The results also hinted at an overall positive effect of a vertical pitch axis on accuracy (in an isomorphic layout, the pitch axis is the direction in which pitches ascend [17,18]—see Figures 5 and 7 for examples). However, this latter effect was inconsistent across the different tasks within the study. Furthermore, only isomorphic pitch layouts were assessed.
An isomorphic pitch layout is one in which each given spatial relationship between two note-playing “triggers” (e.g., keys, buttons, or fretted strings) always produces the same musical interval. A non-isomorphic layout is one where a given spatial relationship between two pitch triggers can produce differing musical pitch intervals. For example the ubiquitous piano keyboard is non-isomorphic in that playing two adjacent white keys can produce either a wholetone or a semitone depending on the actual pair of keys pressed (other examples are provided in [15]). The hypothesised advantage of isomorphic layouts is that once a given musical sequence—such as a chord, scale, melody, or entire piece—is learned in one key, it should be straightforward to play the same sequence in any other key; all that is required is to replicate the same spatial pattern (hence using the same fingering) but just starting from a different location on the instrument [19].

Current Study

The above advantages of isomorphic layouts have been proposed since the nineteenth century [20,21,22]; however, despite this long history and the recent development of multiple music interfaces utilising isomorphic pitch layouts (e.g., Array Mbira [23], Thummer [14], AXiS-49 [11], Musix Pro [24], LinnStrument [12], Lightpad Block [13], Terpstra [25]), no study has directly compared isomorphic and non-isomorphic layouts. To address this long-standing, but untested suggestion, in this study, we investigated whether the learnability and playability of a musical instrument increase with the use of isomorphic pitch layouts both within and, crucially, across keys. In doing so, we aimed to extend the research done by [15] to clarify cognitive and sensory-motor aspects of playing instruments in order to inform the design of musical instruments that facilitate learning.
Participants were tested on two variants of two well-established pitch layouts: the Wicki layout [20] and the Bosanquet layout [21,26]. In each case, one version of each type of layout was isomorphic (i.e., in its standard form), while another was slightly adjusted to make it non-isomorphic. The resulting four layouts are detailed in Section 2.2 and Figures 5–8. These layouts are also all broadly congruent with the SMARC (spatial-musical association of response codes) effect. The SMARC effect is a phenomenon described by Rusconi et al. [27] whereby pitch is mapped on a spatial representation such that high pitches correspond to upward right-hand positions and low pitches correspond to downward left-hand positions. This effect is similar to the SNARC (spatial-numerical association of response codes) effect described by Dehaene, Bossini and Giraux [28], which maps numbers in the same way. The pitches on the Wicki-like and Bosanquet-like layouts ascend in an upwards direction and a rightwards direction, respectively. While congruency with this effect was not examined in this study, it does have implications for the learnability of pitch layouts. Ensuring the layouts tested in this study were congruent with the SMARC effect was done to eliminate it as confounding variable. All layouts also had adjacent major seconds. This is a factor that, as previously mentioned, has already been established to impact learnability and playability [15], so, like the SMARC effect, it is helpful that the chosen layouts eliminate this as a potential confound.
It should be noted that a comparison of the two broad layout types (that is, Wicki vs. Bosanquet) was not of primary interest in this study, but, instead, the use of two different layout types facilitated an exploration of whether or not any general benefits of isomorphism occurred . The Wicki layout has been used previously in the development of the Thummer musical interface and in Wicki–Hayden concertinas. The Bosanquet layout has been examined with reference to its isomorphic properties since 1877 [21] (here, Helmholtz specifically suggested that the arrangement of keys on Bosanquet’s keyboard reduces the number of chord forms a player must learn), and has been implemented in various slightly different forms in a variety of instruments, such as the Jankó keyboard.
As in MacRitchie and Milne [15], this study utilised a series of tasks on a multi-touch tablet (see Figure 1 in Section 2.2) involving exercises typically used in the teaching of musical instruments, namely scales and arpeggios. These exercises are useful in music learning because they relate to how musical pieces are structured, and they introduce learners to the different intervals between pitches. For example, scales are made up of major and minor seconds, which are the most common intervals found in Western melodies. Similarly, arpeggios are made up of major and minor thirds, and perfect fourths, which occur frequently in harmonies and bass lines, respectively. The scale and arpeggio tasks served to teach participants where pitches lie in relation to each other on the novel musical interface. These tasks were taught using an audiovisual demonstration (training tasks), and tested immediately after training (immediate retention).
Another task involved participants playing a well-known but unlearned melody (transfer task). This task assessed transfer of learning by examining how participants applied their learning of intervals in the scale and arpeggio tasks to a novel sequence. It is important to assess this aspect of learning considering the amount of time and effort required to learn a new motor skill—it is pertinent to know how well the newly learned skill can be applied outside the context in which it was originally acquired. Musically, the ability to apply information learned in exercises such as scales and arpeggios is important for learning pieces written by other composers and for composing music oneself. This is also important when transposing music into another key. Transposition is often required when harmonising different instruments, such as the clarinet and the flute. This is because the clarinet is a B♭ instrument (most commonly) and so when a C fingering is applied on the clarinet, a B♭ is sounded. To account for such skills, this task also required participants to play the melody both in the key in which they were trained for the scale and arpeggio tasks and in an additional, untrained key.
This study included both musicians and non-musicians. This was useful to allow testing of the initial learnability of the layouts of interest. That is, this allowed the assessment of learning for those who were not transferring or modifying their existing motor skills, but were developing them in their first form. This also facilitated exploration of differences across levels of expertise, that is, whether or not particular layouts were easier for beginners and whether this changed with increased experience. The testing of non-musicians was also conducted to determine the generalisability of the findings to a wider population. Finally, this study also made use of semi-structured interviews to allow a greater depth of assessment of factors affecting learning.
Given previous suggestions that isomorphic pitch layouts are advantageous to music learning due to their property of transpositional invariance, it was expected that the accuracy of participants’ performances would be higher for tasks completed on isomorphic layouts than those completed on non-isomorphic layouts (H1). It was also expected that the accuracy of participants’ performances in the untrained key would be lower than that of those completed in the trained key (H2). However, as spatial relationships between pitches are maintained on isomorphic layouts when modulating to a new key, it was expected that the accuracy of participants’ performances in an untrained key on the non-isomorphic layout would be lower than those in an untrained key on the isomorphic layout (H3).
To acknowledge some of the other factors relevant to learning tasks, such as practice effects (as observed in the previous study [15]), secondary predictions were made. Due to the differences in previous development of relevant motor skills, it was expected that accuracy of musicians’ performances would be higher than that of non-musicians’ performances (H4). It was also expected that accuracy of participants’ performances would increase with each performance given and each new layout learned (H5). Finally, it was expected that accuracy would exhibit a ceiling effect where further improvement was harder to achieve (H6).

2. Materials and Methods

2.1. Participants

All participants gave their informed consent for participation in the study, which was approved by the Human Research Ethics Committee of Western Sydney University (H12504).
Sixty-eight participants were recruited (46 males, 22 females). Participants ranged in age from 18 to 69 (M = 24.88, SD = 9.38). Twenty-six of these were musicians and forty-two were non-musicians. Musicians had five or more years of formal training on a musical instrument or equivalent (M = 6.12, SD = 1.32 years). Piano was the primary instrument played by musicians (54%). Other instruments played by musicians included the drums, guitar, violin, and flute. Non-musicians had less than five years of formal training on a musical instrument (M = 2.07, SD = 1.5 years) and played the drums, guitar, bongo, recorder, or had singing lessons. Thirty-nine participants (57%) stated they were Australian with the remainder of participants primarily ranging in origin from Asia, Europe, or the Middle East. Non-musicians were recruited via Western Sydney University’s online recruitment system, SONA, and were given course credit for their participation. Musicians were recruited via email through personal contacts, fliers, and social media and were paid $40 for their participation.
Data from one participant was discarded as they made multiple statements in the experimental session that indicated that they did not understand the instructions being provided.

2.2. Materials

The experimental tasks were completed on a Microsoft Surface Tablet. The tasks were presented in the program Hex 2.1.1 (a version specially adapted for multitouch, pictured in Figure 1), and performances were recorded and saved as MIDI files using a Max patch (Cycling ’74, Max 7), which was also used to program the layouts and control the tasks that participants were presented with. Examples of the scales, arpeggios, and melody sequences are provided in Figure 2, Figure 3 and Figure 4. Examples of the layouts on which participants played are provided in Figure 5, Figure 6, Figure 7 and Figure 8; these are screenshots of the software here overlaid with note names that were not visible to the participants.

2.3. Procedure

Each participant completed three phases of experimental tasks involving (1) scales, (2) arpeggios, and (3) the melody Frère Jacques on two different layouts. These three phases were completed on both an isomorphic and non-isomorphic version of either a Wicki-like or a Bosanquet-like layout. Those who were assessed on the Wicki-like layouts completed all of the training and retention tasks in the key B♭ major or in the key of E♭ major and the transfer task in both keys; hence, one key was untrained in the transfer task. Those who were assessed on the Bosanquet-like layouts completed the training and retention tasks in B♭ major or F major and the transfer task in both keys; hence, one key was untrained in the transfer task. The choice of layout type and training key was randomised and balanced, and the order in which the layouts were presented was counterbalanced across participants.
These tasks proceeded in a manner similar to that of the study by MacRitchie and Milne [15]. The scale and arpeggio phases comprised a training task and an immediate retention task. The training tasks involved participants watching one audiovisual demonstration of either a scale (phase 1) or an arpeggio (phase 2), played at a tempo of 90 bpm on the tablet. Participants then played the scale/arpeggio on the tablet at the same time as the audiovisual demonstration a further three times. Each audiovisual demonstration was preceded by eight metronome beats. The immediate retention tasks involved participants giving two performances of the previously trained sequence without any audiovisual support. A metronome beat at 90 bpm was provided during these tasks as a timing reference.
Phase 3 involved a transfer task to test the generalisation of learning. Participants listened to an audio recording of a well-known, but unlearned melody (Frère Jacques) in either the same key in which they had completed the previous tasks or in an untrained key. The first note of the melody was then indicated to participants by the experimenter. Following this, participants were given either 20 s (musicians) or 60 s (non-musicians) to explore the layout in order to determine the correct notes, timing, and rhythm of the melody. After the onset of a 90 bpm metronome beat indicating the end of the exploration time, participants were required to give two performances of the melody. In the same manner, participants then completed the transfer task again in the alternate key. The order in which keys were presented in this phase was counterbalanced across participants. Similarly, the keys in which participants completed the first two phases was also counterbalanced.
As in [29], following the experimental tasks, 66 out of 68 participants completed a semi-structured interview with the experimenter. These were audio-recorded and transcribed. The interview consisted of three primary questions with follow up questions asked when necessary to further clarify meaning. The primary questions were
  • Did you have a preference for either layout?
  • What did you prefer about that layout?
  • Do you have any other comments about the layouts or the tasks?

2.4. Data Analysis

Data analysis and modelling was performed using the brms package (version 2.6.0) [30,31] in R Studio (version 1.1.456) and R (version 3.5.1). The scripts and data are available at https://osf.io/6vgph/. Preliminary data screening and processing was performed using MATLAB (version R2016b) by examining how well the pitches of the notes performed by participants matched the template performance of the task. To establish which notes of the performed sequence in any of the tasks were “correctly” pitched, we used the Note Time Playing Path software [32] (version 0.1), which uses a windowing process to identify where extra, skipped, or substituted (wrongly pitched) notes occur. For performances where there were large numbers of pitch errors (more than five), this matching process was visually confirmed. Of the original 1876 performance files (67 participants × 2 layouts × 14 performances) over the three experimental phases, 1752 were retained for data analysis (93.4%). Sixteen performance files failed to be recorded as a result of computer error. A further 16 files were empty because participants had failed to produce any performance for the task. Ninety-two files were deleted as the performed data could not be reconciled with the relevant templates of ideal performances. This occurred when files contained too many errors (e.g., too many extra, skipped, or substituted notes as compared to the template performance such that the Note Time Playing Path software could not continue to track any correct notes) or tracked too few notes (e.g., when the participant had played only one or two notes in total in a performance).

2.4.1. Accuracy: Training Tasks

MATLAB was also used to calculate the dependent variable, performance accuracy, henceforth denoted Accuracy. Our measure of Accuracy accounted for both whether the correct pitch was played, and how accurate its timing was. Some changes were made to the calculations detailed in MacRitchie and Milne [15] in order to ensure that Accuracy was strictly bounded in the open unit interval, that is, 0 < Accuracy < 1 .
In the training tasks, the participant played along with the audiovisual highlighted sequence. Here, a “correct” performance constituted playing the correct pitches at the correct times in the sequence, that is, matching the sequence being produced aurally and visually onscreen. For each target note in the audiovisual demo, a window of 666 ms (the interonset interval at 90 bpm), centred around the target note, was created. The first performed note within this window to match the target’s MIDI note number was used. In this way, inserted notes that did not match the expected MIDI note were not penalised if the “correct” note was played at some point in the time window. If no matching MIDI note number was identified within this window, a zero score was allocated for this target note in the sequence. The first matching MIDI note number was then assigned a score reflecting its timing accuracy—a value of 1, if played at the same time as the target, linearly reducing to 0 as the timing error increased to the boundary of the window ( ± 333  ms). The resulting scores for each performance were summed to a total performance score, denoted Score, and then normalised into a final Accuracy value, as detailed in (1).
For the training tasks, the calculation was
S c o r e = n = 1 N 1 | t p t n | 333 A c c u r a c y = 0.5 + 999 × S c o r e / N 1000 ,
where
  • N is the total number of notes in the target sequence
  • t n is the time in milliseconds of nth target note
  • t p is the time in milliseconds of first performed note within the t n ± 333 time window that matches the pitch of the target note.
Note that the ratio of 999/1000 is arbitrary, its purpose merely being to ensure that exact zeros and exact ones cannot occur. This ratio very slightly reduces the range of possible values [33] so that exact zeros were increased by 0.0005, exact ones were reduced by 0.0005, and all numbers in-between were changed proportionately.

2.4.2. Accuracy: Retention and Transfer Tasks

In the immediate retention and transfer tasks, the participant played the test sequence along with a 90 bpm metronome. Here, a “correct” performance constituted playing the correct notes in the expected sequence as before but with one caveat related to penalising errors. Because these tasks were accompanied only aurally by a metronome beat, the performer might add an extra note or leave a gap so that all subsequent notes were then played one metronome beat late. In situations such as this, it is reasonable to penalise the first late note, but not the subsequent notes, which are then correct subject to a delay. The same argument holds if a performer were to play two or three extra notes before returning to the correct sequence of pitches. Only the extra notes should be penalised. Similarly, a performer might skip a note, or multiple notes, hence all subsequent notes would be one or several metronome beats early. As before, it is reasonable only to penalise the first pitch error. The final penalty was then calculated by the total number of such “first” errors, designated by the letter E in (2). The calculation used to summarise the overall accuracy was
Score = c = 1 C 1 | t c t m | 333 Accuracy = 0.5 + 999 × Score / N ( 1 + E / N ) 1000
where
  • N is the total number of notes in the target sequence.
  • C is the total number of notes in the corrected performance.
  • t c is the time in milliseconds of the cth note in the corrected performance.
  • t m is the time of the metronome beat closest to the performed note t c .
  • E is the number of “first errors” calculated.

2.4.3. Semi-Structured Interviews

Recordings of the semi-structured interviews were transcribed into Microsoft Word (2011). Using the Review function in Microsoft Word, statements were then coded under two pre-determined themes, Layout preference and Reason for layout preference, which were effectively defined by the first two interview questions. Statements relevant to the third interview question were also coded. Following this initial coding process, the codes were assessed for commonalities in order to identify further themes and sub-themes. Interview transcripts were independently coded by a third party for the purpose of minimising bias. Codes identified by the two independent coders were then compared, with disagreements discussed and resolved by both parties. Finally, the numbers of statements identified for each theme and sub-theme were calculated in order to assess their relative prominence.

2.5. Statistical Approach

For each of the five tasks (scale training, scale retention, arpeggio training, arpeggio retention, melody transfer), a multilevel Bayesian beta regression was conducted on Accuracy ( 0 , 1 ) as the dependent variable, with IsNonIsomorphic { 0 , 1 } , IsUntrainedKey { 0 , 1 } (only in the melody transfer task), IsBosanquet { 0 , 1 } , LayoutNo { 0 , 1 } , PerfNo { 0 , 1 , 2 , 3 } , and IsMusician { 0 , 1 } as the discrete regression inputs. All interactions between IsMusician, IsNonIsomorphic, IsBosanquet (in all tasks), and IsUntrained (only in the melody transfer task), and all interactions between IsMusician, LayoutNo, and PerfNo were included. With one exception, group-level (random) effects were also added for all of the above predictors that were between subjects (as recommended by Barr et al. [34]); the exception was the model for the arpeggio retention task, where it was necessary to remove the interaction LayoutNo × PerfNo to achieve convergence.
Because Accuracy is a real number in the open unit interval, it was modelled with a beta distribution, which is a standard choice for such dependent variables. A logit link was used to transform the Accuracy score from the unit interval to the full real-line, thereby making it suitable for linear prediction. This means that the exponential of any effect gives the multiplicative factor by which the ratio Accuracy/Inaccuracy of a performance changes, where Inaccuracy is defined as 1 Accuracy , which also implies that Accuracy = Accuracy / Inaccuracy 1 + ( Accuracy / Inaccuracy ) (in Table A1, Table A2, Table A3, Table A4, Table A5 and Table A6, we show the linear effect in the “Estimate” column and its exponential in the “Eff.Fact” column). For example, for an effect of 0.5, a unit increase in the corresponding predictor results in a multiplicative increase in Accuracy / Inaccuracy by e 0.5 = 1.65 , that is, an increase in Accuracy / I n a c c u r a c y of 65%. More concretely, imagine an expected Accuracy at a given set of conditions of 0.6; this implies that Accuracy / Inaccuracy = 0.6 / 0.4 = 1.5 . If a predictor (whose effect is 0.5) is increased by one unit, keeping all else the same, the model tells us that the resulting Accuracy / Inaccuracy ratio would now have an expected value of 1.65 × 1.5 = 2.48 ; hence, the expected Accuracy would become 2.48 / ( 1 + 2.48 ) = 0.71 .

2.5.1. Bayesian Regression

An important advantage of Bayesian regression is that, given the observed data and a prior distribution (see Section 2.5.2 for a discussion of priors), it calculates the whole posterior probability distribution of each predictor’s effect rather than only a point-estimate of each predictor’s most probable effect. This allows for credibility intervals to be calculated; unlike the confidence intervals in classical regression, credibility intervals have a straightforward and intuitive meaning: the 95% credibility interval of an effect is the interval that we can be 95% certain contains the effect’s true value. It also allows evidence ratios to be calculated; these are the odds (probability ratios) in favour of directional hypotheses (such as a given effect being greater than zero). For example, if the integral of the posterior distribution over the interval ( 0 , ) is p, the evidence ratio in favour of the effect being greater than 0 is p / ( 1 p ) ; so, if the lower boundary of a (one-sided) 95% credibility interval is precisely zero, this implies that there is a 5% probability the effect is less than zero and a 95% probability it is greater than zero; hence, the evidence ratio is 0.95 / 0.05 = 19 .
To qualify the weight of evidence for or against any given hypothesis (e.g., that an effect is greater than 0), we followed the guidelines proposed by Jeffreys (1961 as cited by [35,36]) in which evidence ratios of 1–3 represent no evidence for the tested hypothesis; evidence ratios of 3–10 are “moderate” evidence for the hypothesis; evidence ratios of 10–30 are “strong” evidence; and evidence ratios above 30 are “very strong” evidence.
The convergence of each such model was assessed with Rhat values (in all cases, these values were acceptable, as can be seen in the tables). Posterior predictive checks showed that each model predicted data with a distribution similar to that of the observed data; furthermore, every model had a high a Bayesian R-squared value [37] (0.89, 0.89, 0.95, 0.94, and 0.94 for the five respective performance tasks).

2.5.2. Priors

The priors used in all of our models are what are termed weakly informative priors [38]. These reflect a minimal amount of knowledge that we possess about the effects’ sizes, as now detailed. All of our predictors were close to having a scale of approximately 1 standard deviation (ranging from 0.5 SDs for the binary variables and just over 1 for PerfNo), while the dependent variable had a standard deviation of approximately 0.25. This immediately implies that we would be unlikely to see effect sizes with very high magnitudes. For example, although it would not be surprising to see an effect size of, say, 0.1 or 1.2 , it would be surprising to see an effect size of 10 or 10 , while an effect size of 1,000,000 or −1,000,000 would be so unlikely that it would immediately suggest a coding error. A prior can and should reflect this prior knowledge.
For all population level effects, except for the intercept, we used a prior with a Student’s t-distribution with 3 degrees of freedom, a mean of 0, and a scale of 3. Crucially, the zero mean indicates that our prior beliefs weakly favour the null hypothesis of zero effect size and—in comparison to using a flat uninformative prior—regularises the estimations, thereby reducing overfitting. The prior on the intercept was the brms default, which is a Student’s t-distribution with 3 degrees of freedom, a mean of 0, and a scale of 10; the latter reflecting that, in standardised models, intercepts can take on larger sizes than the effects.
The group level effects (which are standard deviations) were given the default brms prior, which is a half-Student’s t-distribution with 3 degrees of freedom, a mean of 0, and a scale of 10 (hence reflecting weak prior support for zero standard deviations); the correlation matrix had an lkj(1) prior which corresponds to a uniform distribution for correlations and standard deviations (respectively, off-diagonals and diagonals in the multivariate normal distribution’s covariance matrix).

3. Results

This section is divided into two parts. First, there is an outline of the confirmatory analysis. Secondly, there is a more substantive description of an exploratory analysis that includes a number of important interactions that were not anticipated in the pre-registration but which provide greater insight into the underlying processes involved in learning and the transfer of learning.

3.1. Confirmatory Analysis

In the principal task—the transfer task—directional hypothesis tests showed strong evidence that performances in the trained key were better on isomorphic layouts than on non-isomorphic layouts. The evidence ratio was 39 and performances, as quantified by the ratio Accuracy / Inaccuracy (see Section 2.5), increased by 14% on isomorphic versions of the layouts. However, evidence for participants performing better on isomorphic layouts in the untrained key was only moderate—the evidence ratio was 8.5 with an increase in performance of 12%. Table A6 and Table A7 provide full details.
For the remaining training and immediate retention tasks, strong evidence of an effect of isomorphism was found only in the arpeggio training task where, counter to expectation, the non-isomorphic layout improved performance (an evidence ratio of 3999.0 with a performance increase of 60%). As can be seen in the next section, this effect was driven principally by the Bosanquet-like layouts only.
As expected, there was generally strong evidence in favour of learning effects: Accuracy increased with the second layout and over successive performances of each layout, but these increases reduced over time due to approaching a performance ceiling. Musicians also performed substantially better than non-musicians.
It is quite evident from the descriptive graphs provided in Section 3.2 that the impact of isomorphism was strongly moderated by both the type of layout (IsBosanquet) and by musicianship (IsMusician). For this reason, we henceforth focus on an exploratory analysis that includes these interactions in the model. These models were checked with approximate leave-one-out cross-validation and their fits to unseen data were not significantly different to those of the simpler confirmatory models (hence, they were not overfitting the data).

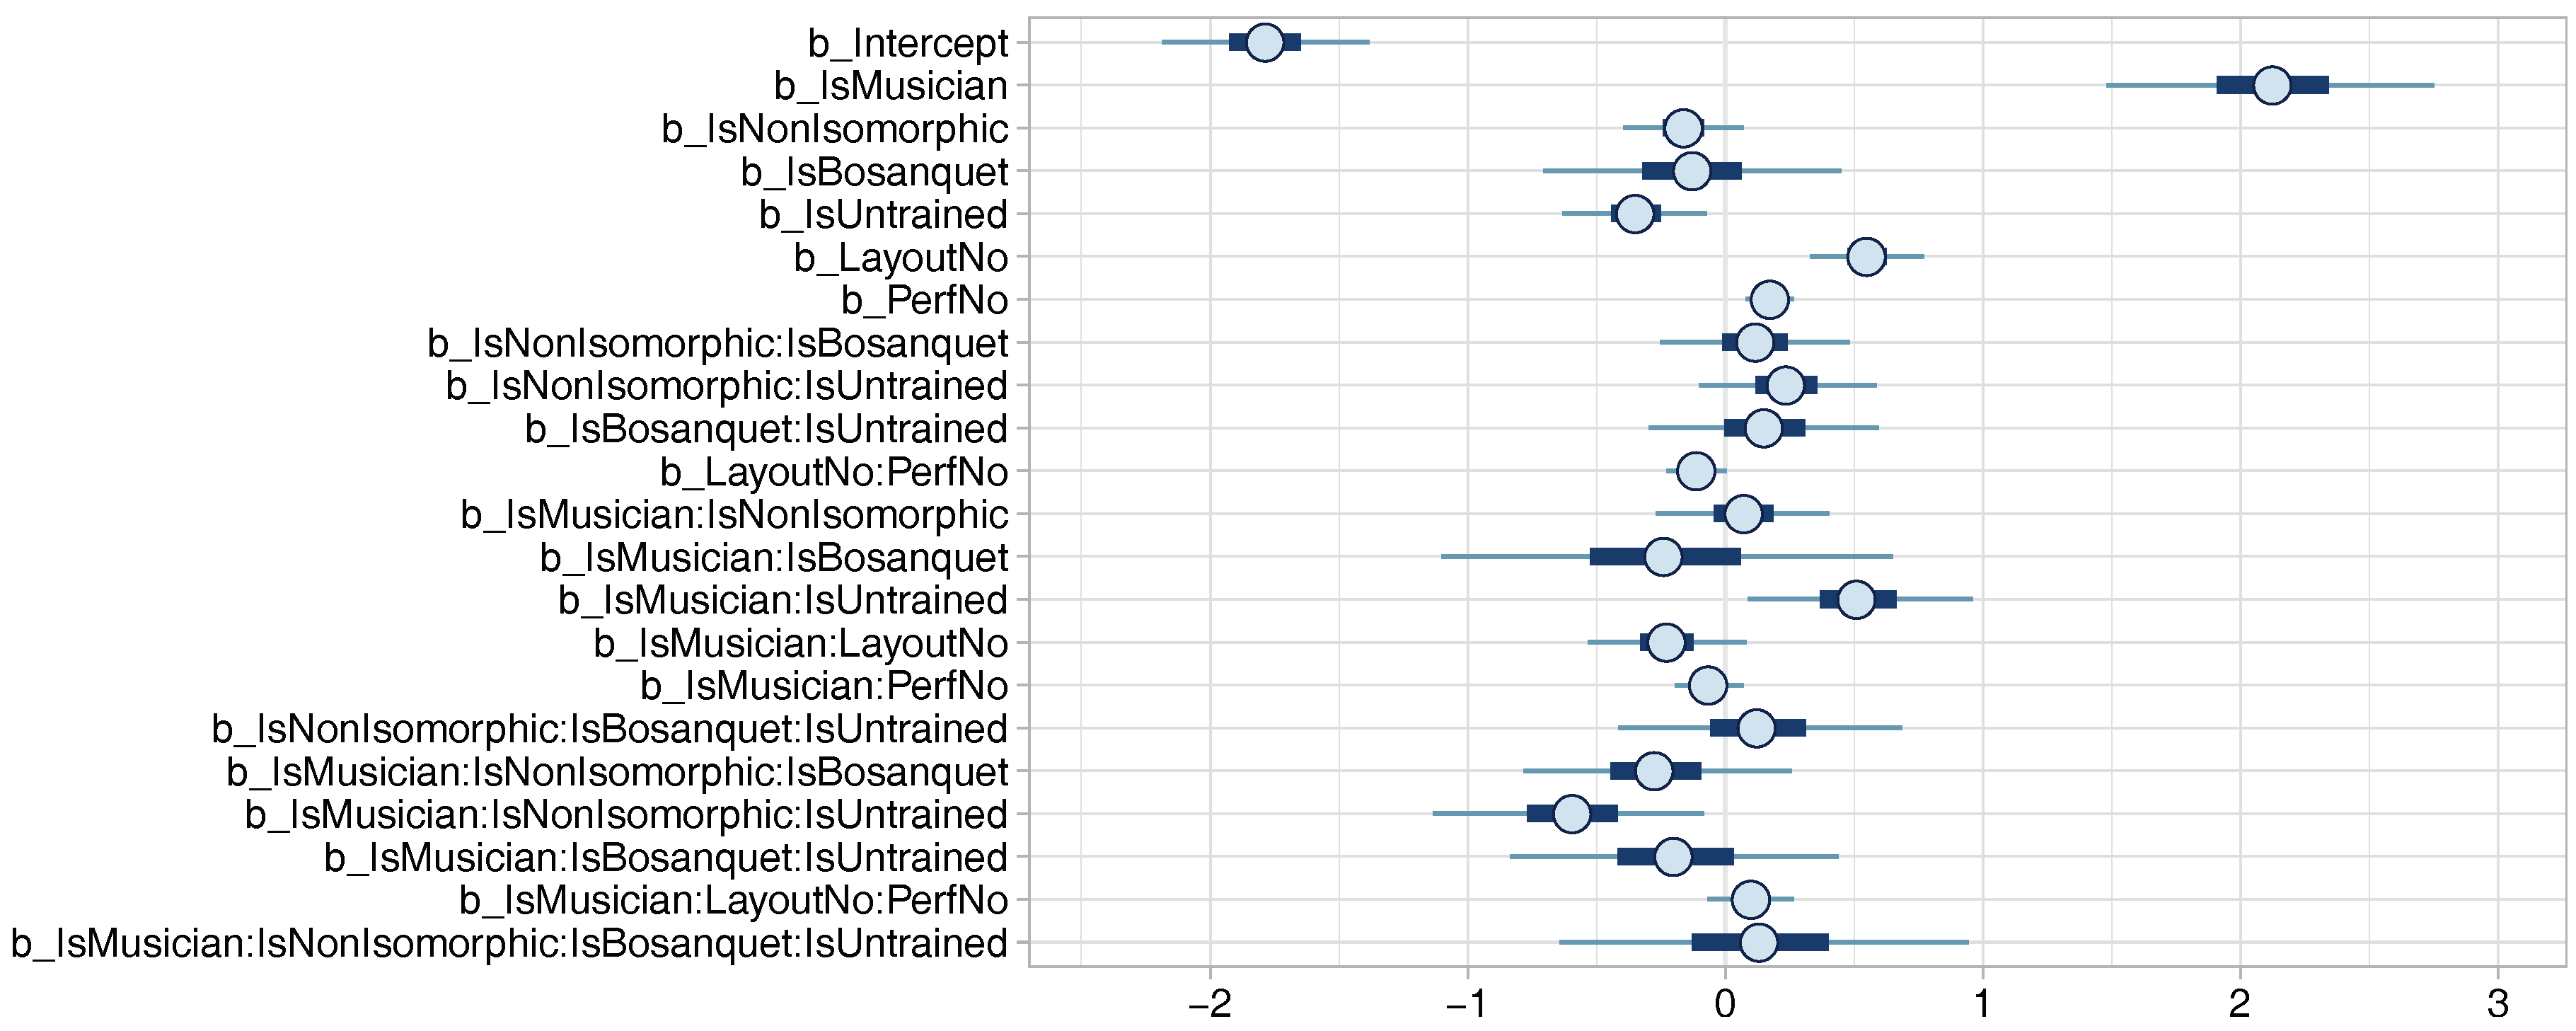
3.2. Exploratory Analysis

For each of the five tasks performed by our participants (scale training, scale retention, arpeggio training, arpeggio retention, and melody transfer), we follow the same format and present the results in both graphical form (Figure 9, Figure 10, Figure 11, Figure 12, Figure 13, Figure 14, Figure 15, Figure 16, Figure 17, Figure 18, Figure 19, Figure 20, Figure 21, Figure 22 and Figure 23) and tabular form (Table 1, Table 2, Table 3, Table 4 and Table 5). Firstly, we provide descriptive graphs of the mean accuracies for each of the four layouts across the successive performances and successive layouts for that task. Separate graphs are provided for non-musicians and musicians, and the means are displayed with 95% confidence intervals calculated with 10,000 bootstrap samples. Secondly, we provide a plot of the model’s regression coefficients with their 95% credibility intervals (tables of their numerical values are included in Appendix A). Thirdly, we graph the marginal effects on performance accuracy associated with IsNonIsomorphic, IsBosanquet, and, for the final task, IsUntrained. Again, separate plots are provided for musicians and non-musicians. Fourth, we present a table of directional hypothesis tests for relevant effects as follows: the impact of IsNonIsomorphic conditioned on the different values for IsMusician, IsBosanquet, and, for the final task, IsUntrained; the impact of IsBosanquet conditioned on the different values for IsMusician, IsNonIsomorphic, and, for the final task, IsUntrained; the impact of IsMusician conditioned on the different values for IsNonIsomorphic, IsBosanquet, and, for the final task, IsUntrained; the impacts of LayoutNo, PerfNo, and their interaction, conditioned on IsMusician’s two values. In the table, the effect under examination is shown first, while the values it is conditioned on are shown in the following parentheses. Finally, a verbal description of all effects of interest with evidence ratios of at least 10 is provided.

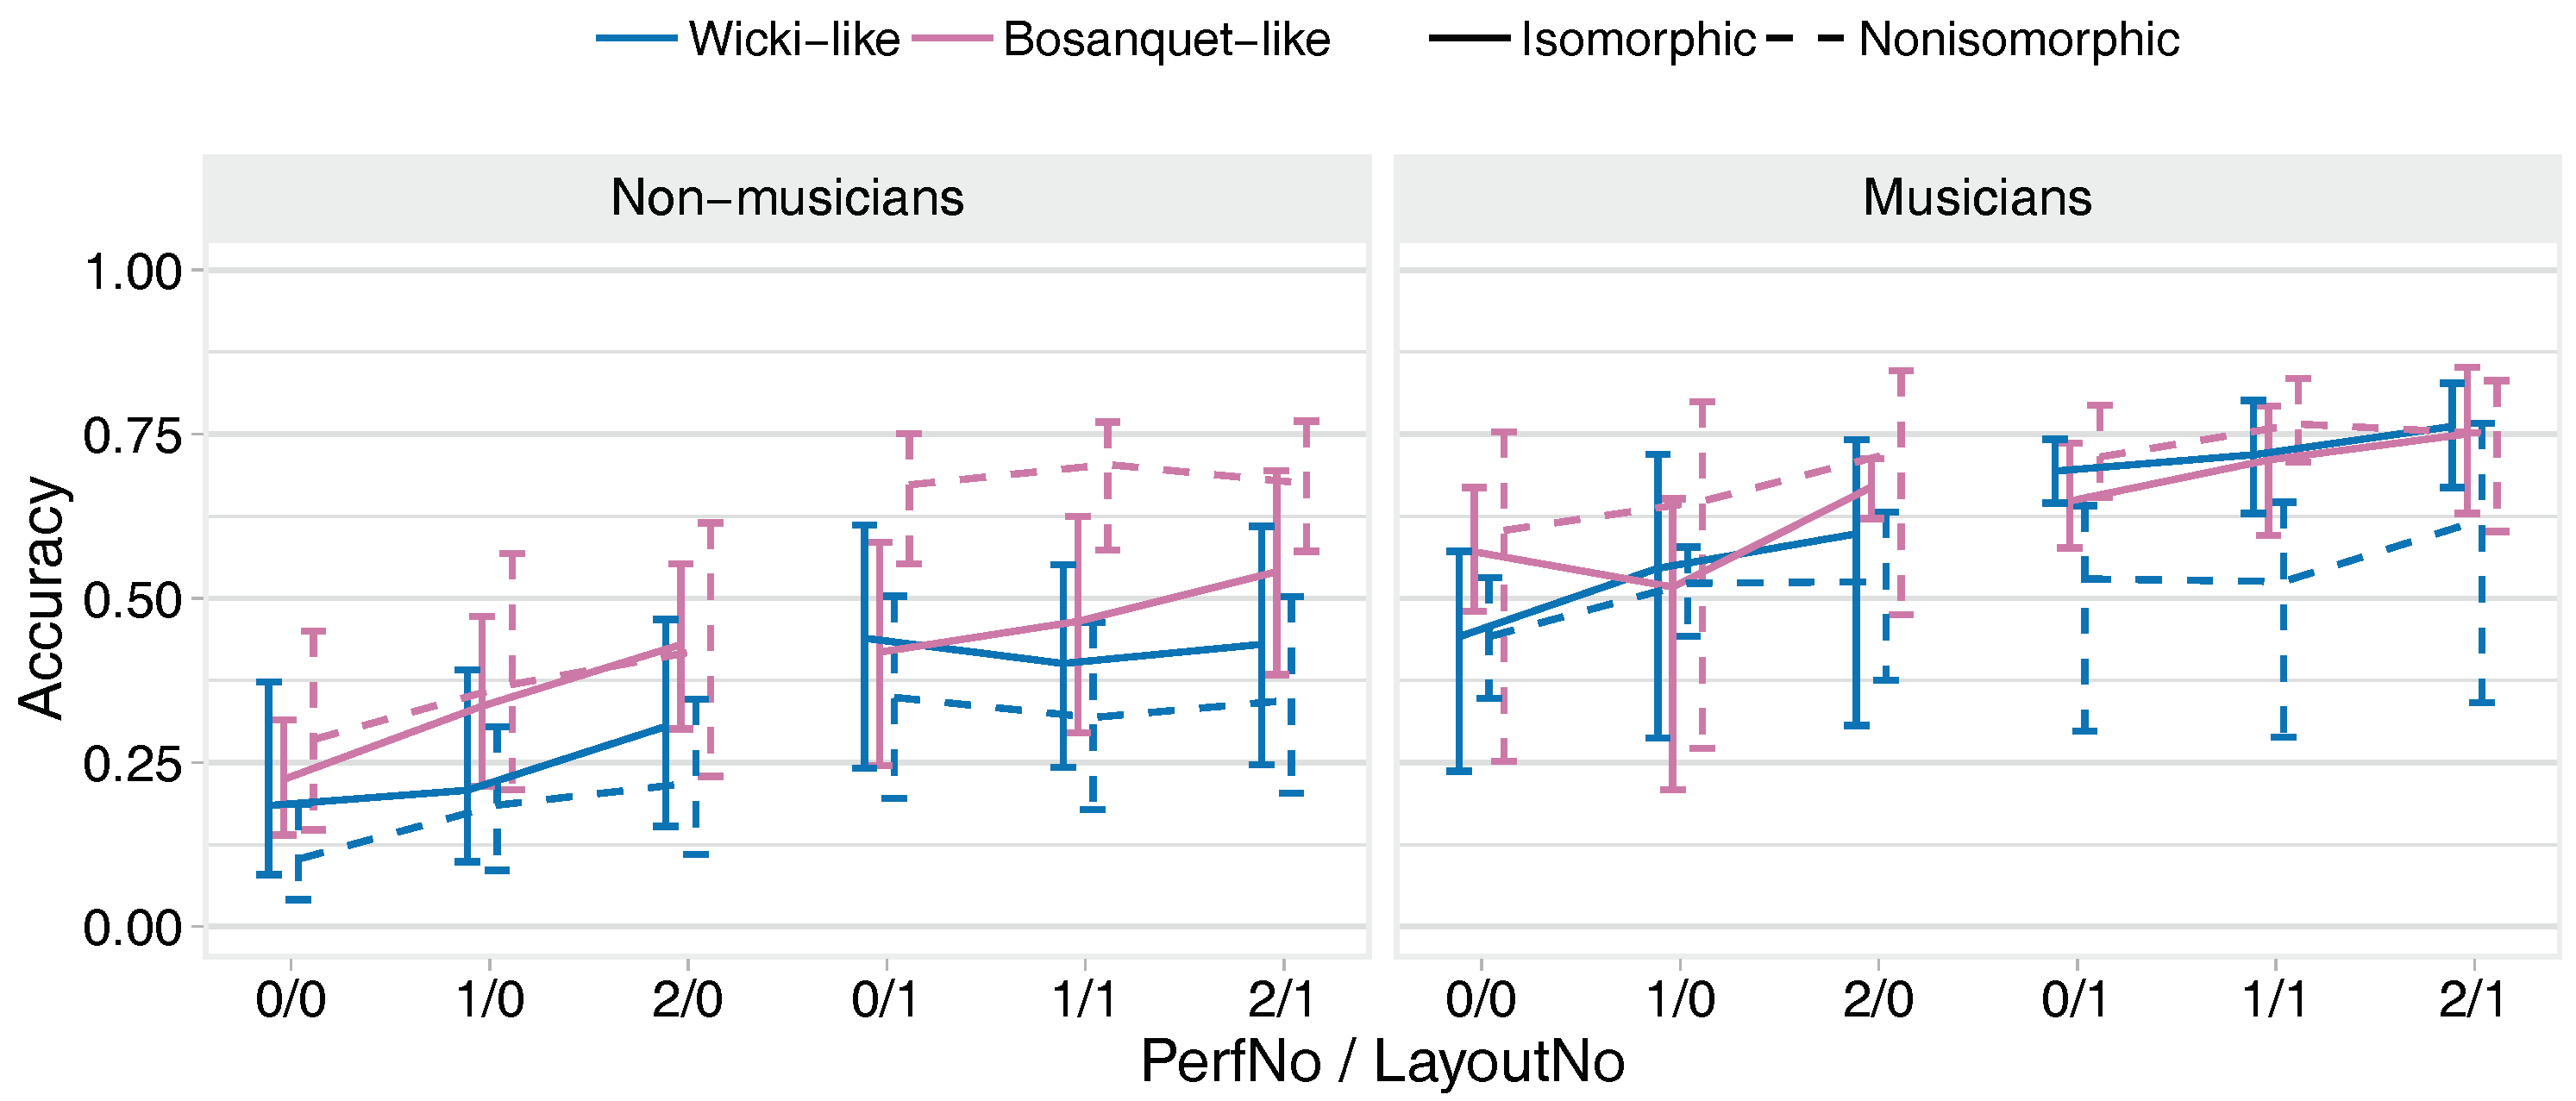
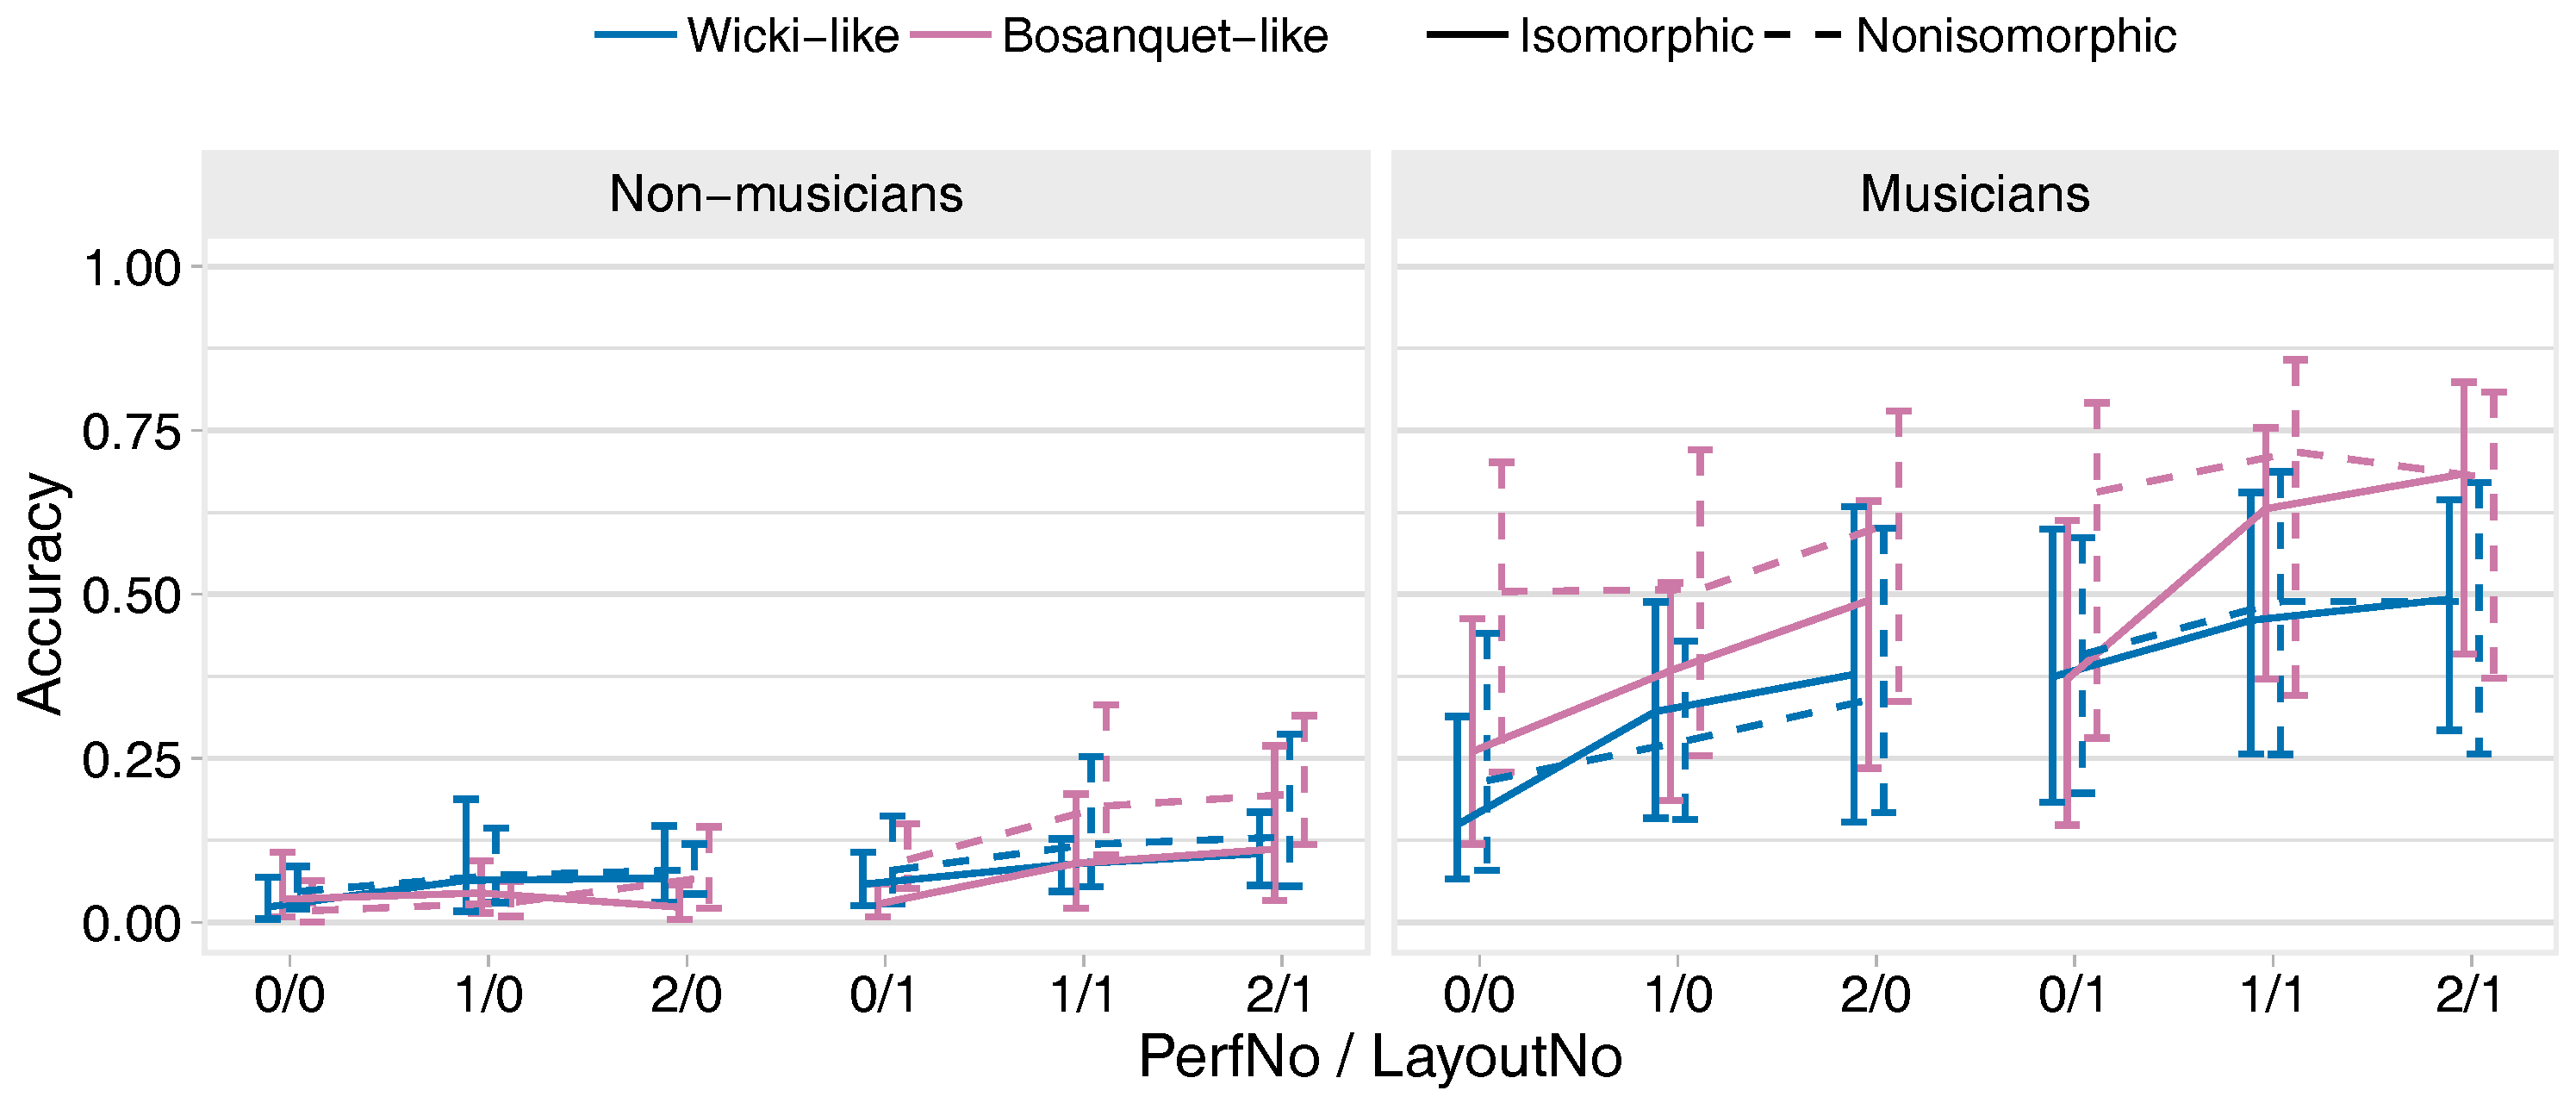
3.2.1. Scale Training Task

  • Strong evidence that, on the Wicki-like layouts, non-musicians and musicians performed better on the isomorphic versions; conversely, on the Bosanquet layouts, non-musicians and musicians performed better on the non-isomorphic versions.
  • Strong evidence that performances were better on Bosanquet-like layouts than on Wicki-like layouts in all cases except for musicians playing the isomorphic layout (mean effect across all conditions was 0.88).
  • Very strong evidence that musicians performed substantially better than non-musicians under all conditions (mean effect across all conditions was 1.84).
  • Very strong evidence that accuracy improved across successive performances of the task and in the second-played layout, although the improvement was smaller for non-musicians when both were high.

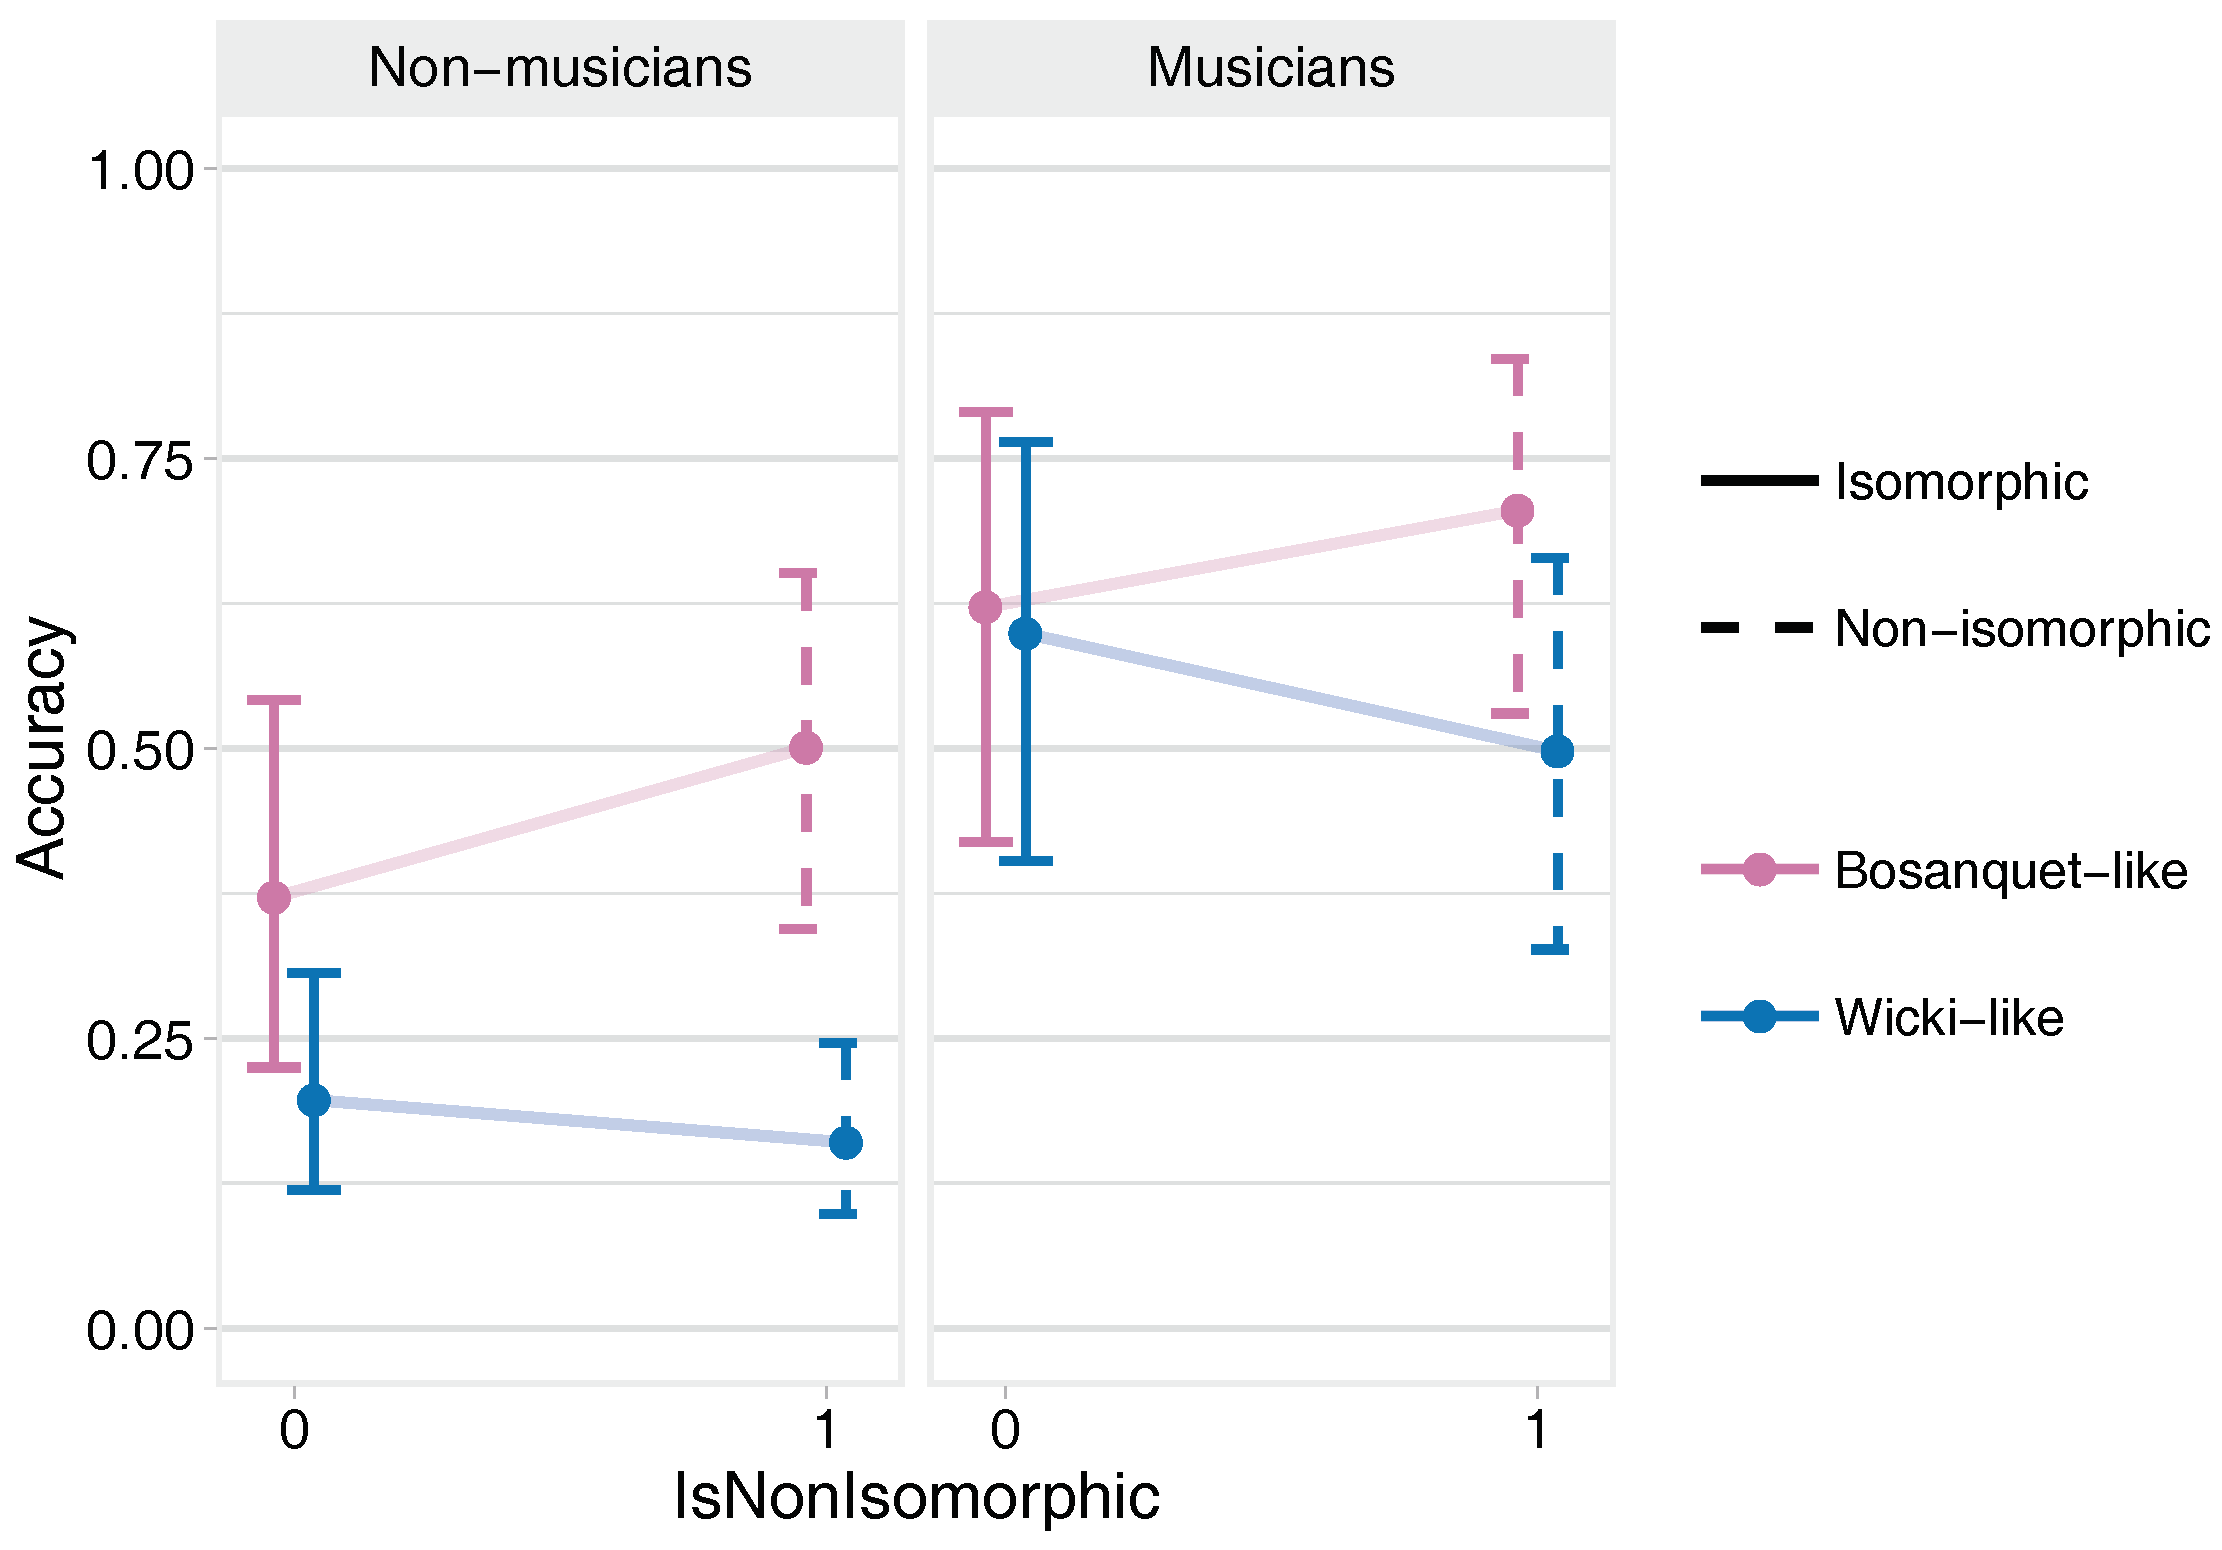
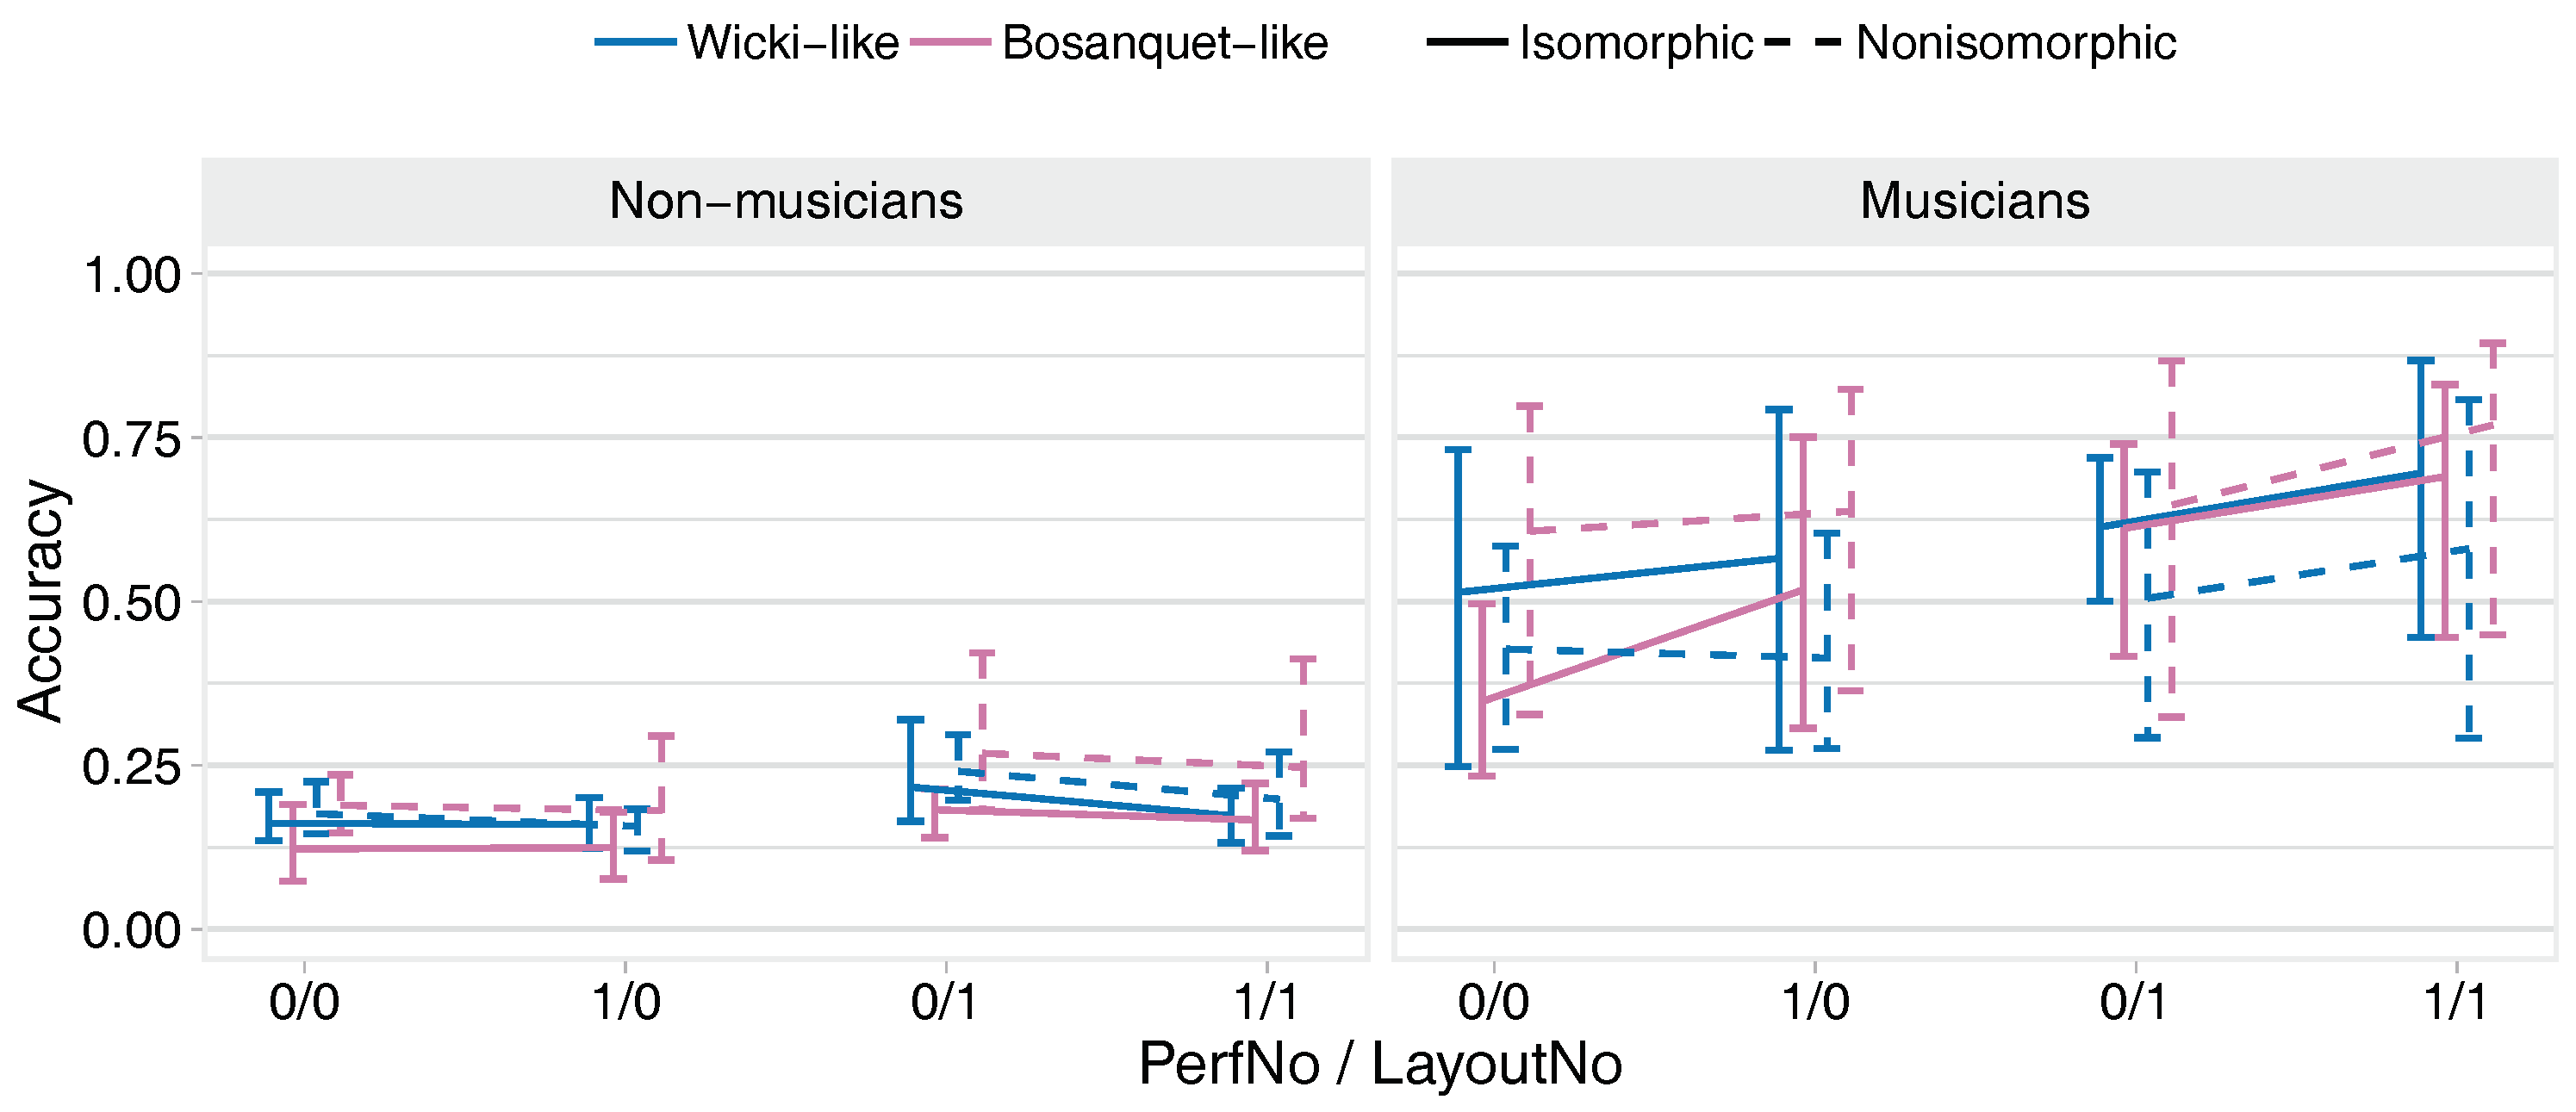
3.2.2. Scale Immediate Retention Task

  • No strong evidence for any impact of isomorphism on accuracy.
  • Strong evidence that non-musicians performed better on the non-isomorphic Bosanquet-like layout than on the non-isomorphic Wicki-like layout.
  • Very strong evidence that musicians performed substantially better than non-musicians under all conditions (mean effect across all conditions was 1.08).
  • Very strong evidence that accuracy improved in the second-played layout. However, only musicians improved with successive performances, and the improvements for musicians reduced for their second-played layout.

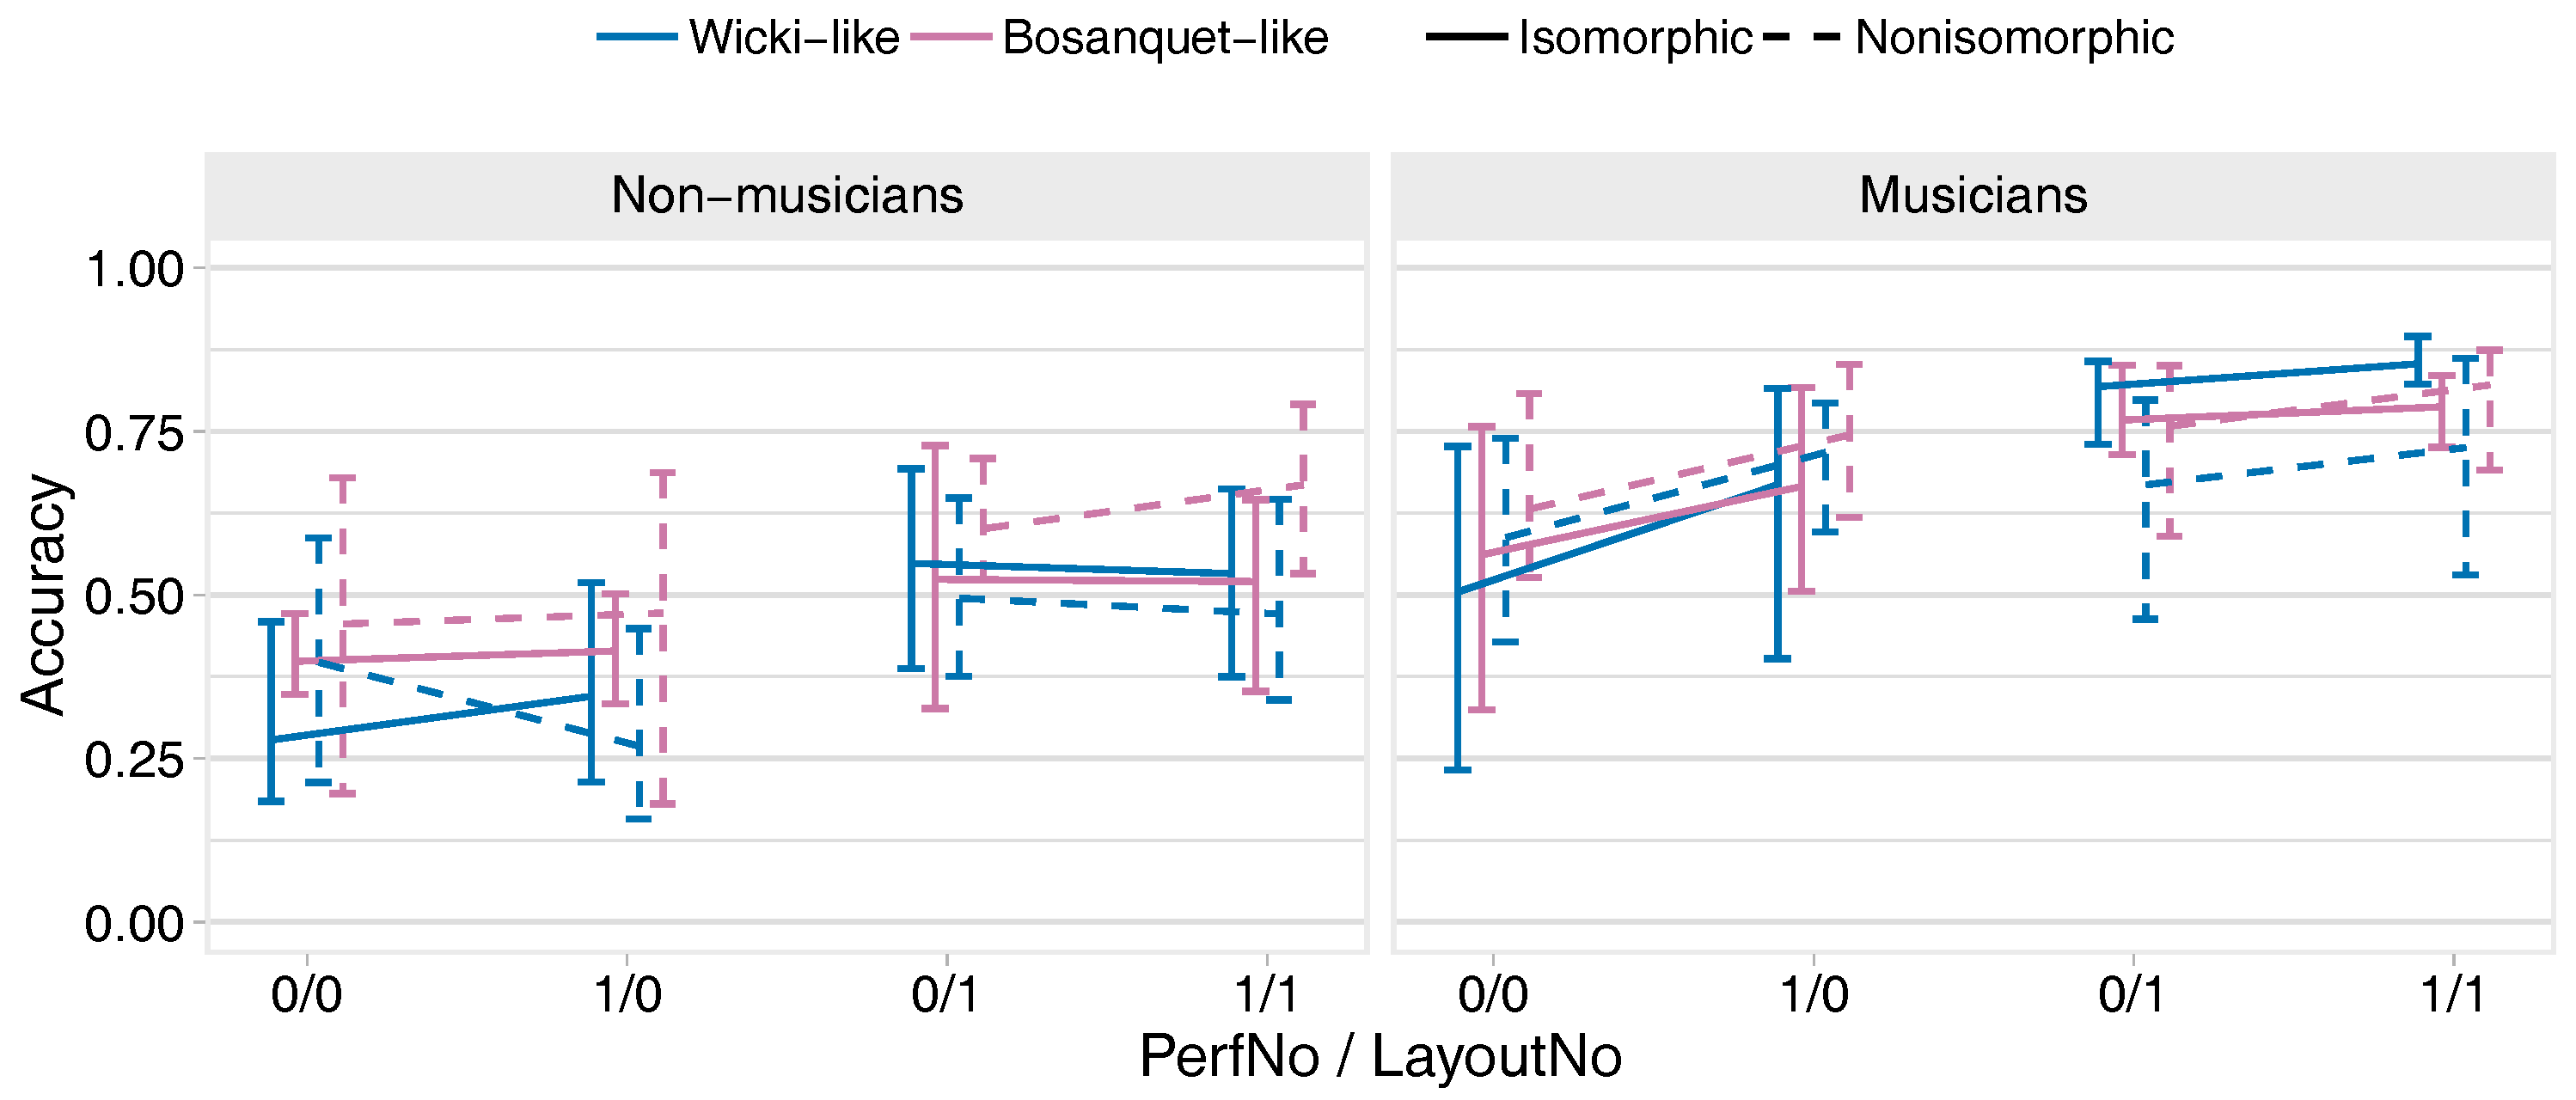
3.2.3. Arpeggio Training Task

  • Strong evidence that, for the Bosanquet layouts, non-musicians and musicians performed better on the non-isomorphic versions.
  • Very strong evidence that musicians performed better on the non-isomorphic Bosanquet-like layout than on the non-isomorphic Wicki-like layout.
  • Very strong evidence that musicians performed substantially better than non-musicians under all conditions (mean effect across all conditions is 2.41).
  • Very strong evidence that accuracy improved across successive performances of the task and in the second-played layout.

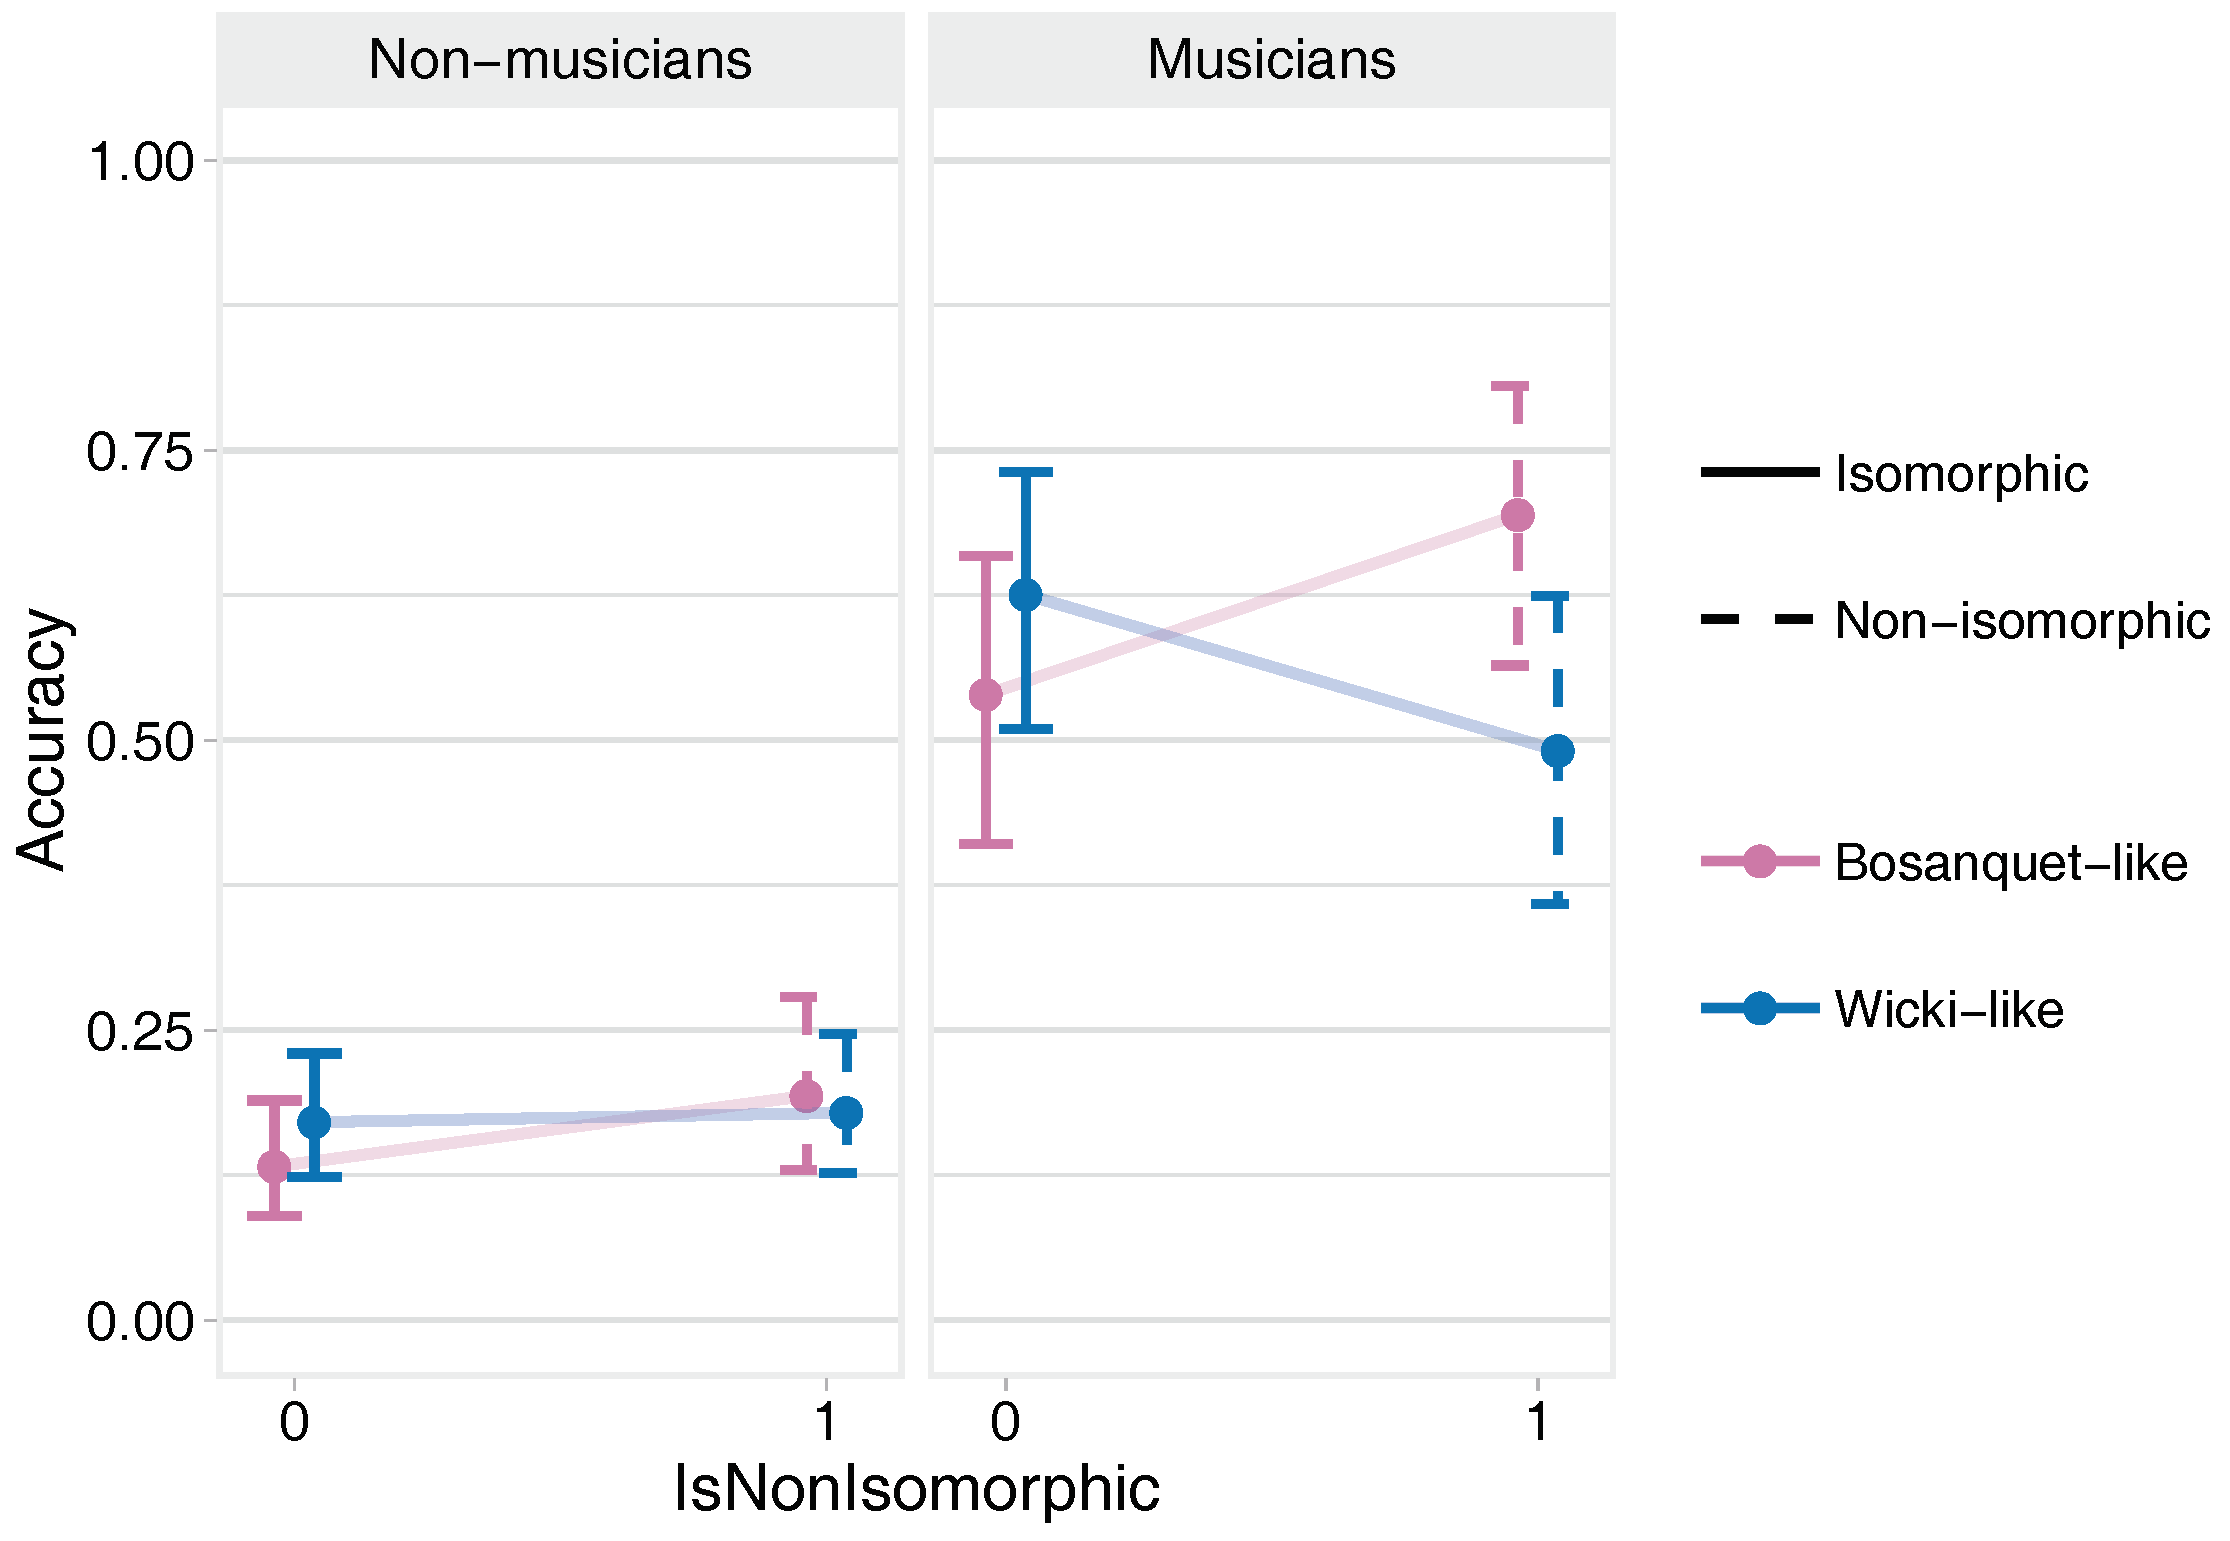
3.2.4. Arpeggio Immediate Retention Task

Table 4 and Figure 20 show:
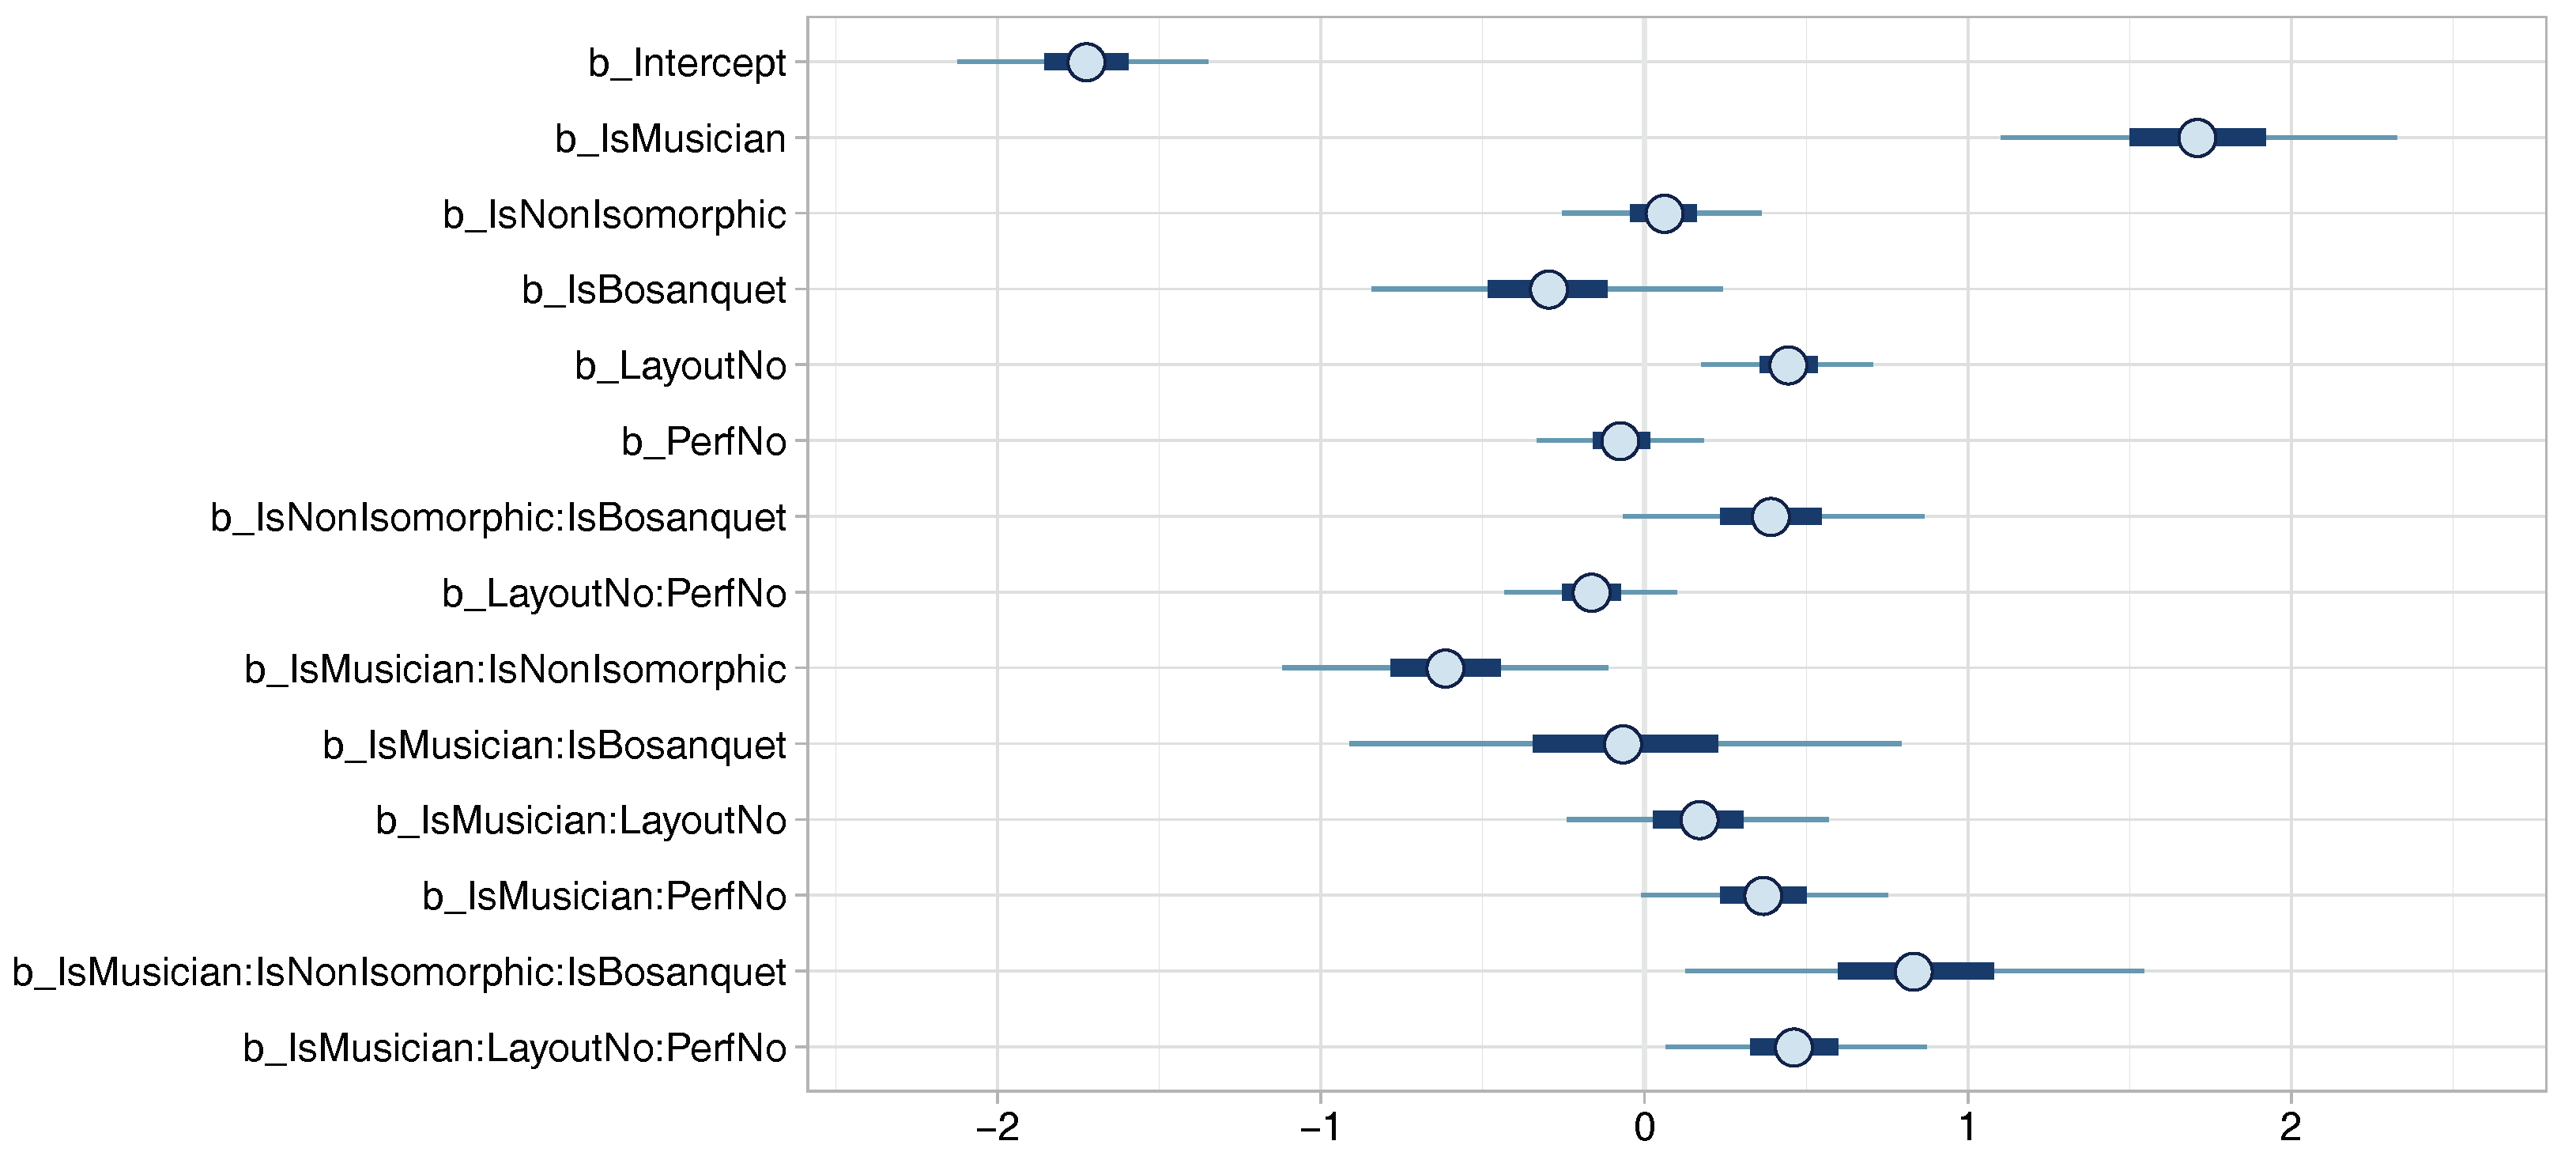
  • Strong evidence that, for the Wicki-like layouts, musicians performed better on the isomorphic version; for the Bosanquet-like layouts, non-musicians and musicians both performed better on the non-isomorphic versions.
  • Very strong evidence that musicians performed better on the non-isomorphic Bosanquet-like layout than on the non-isomorphic Wicki layout.
  • Strong evidence that musicians performed substantially better than non-musicians under all conditions (mean effect across all conditions is 1.58).
  • Very strong evidence that accuracy improved for the second-played layout. For musicians only, performance also improved with successive performances of the task but less so on the second layout.

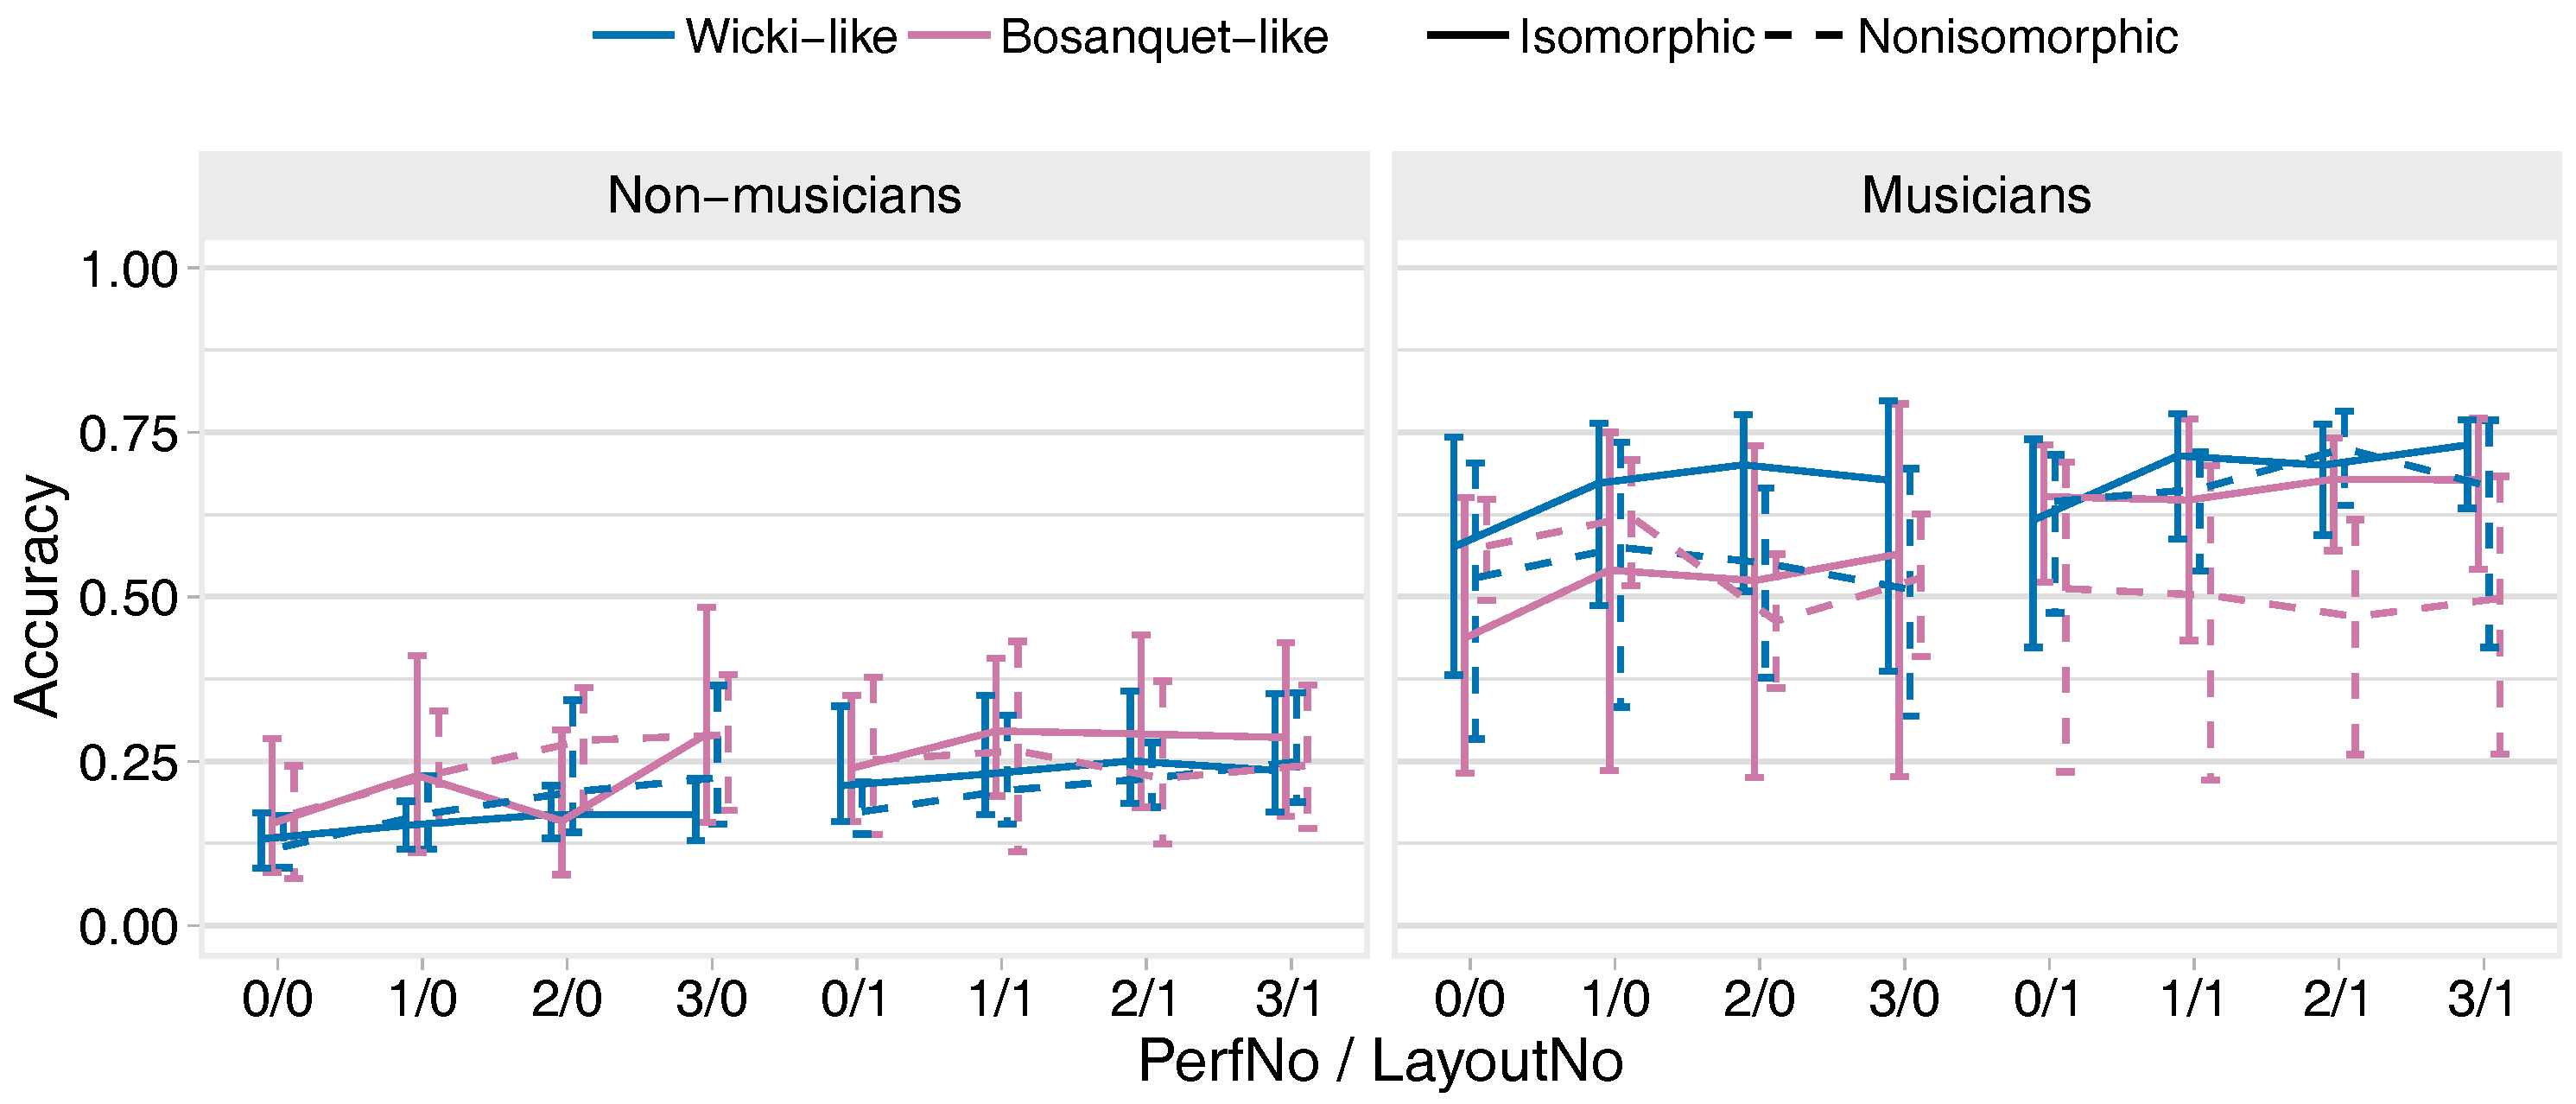
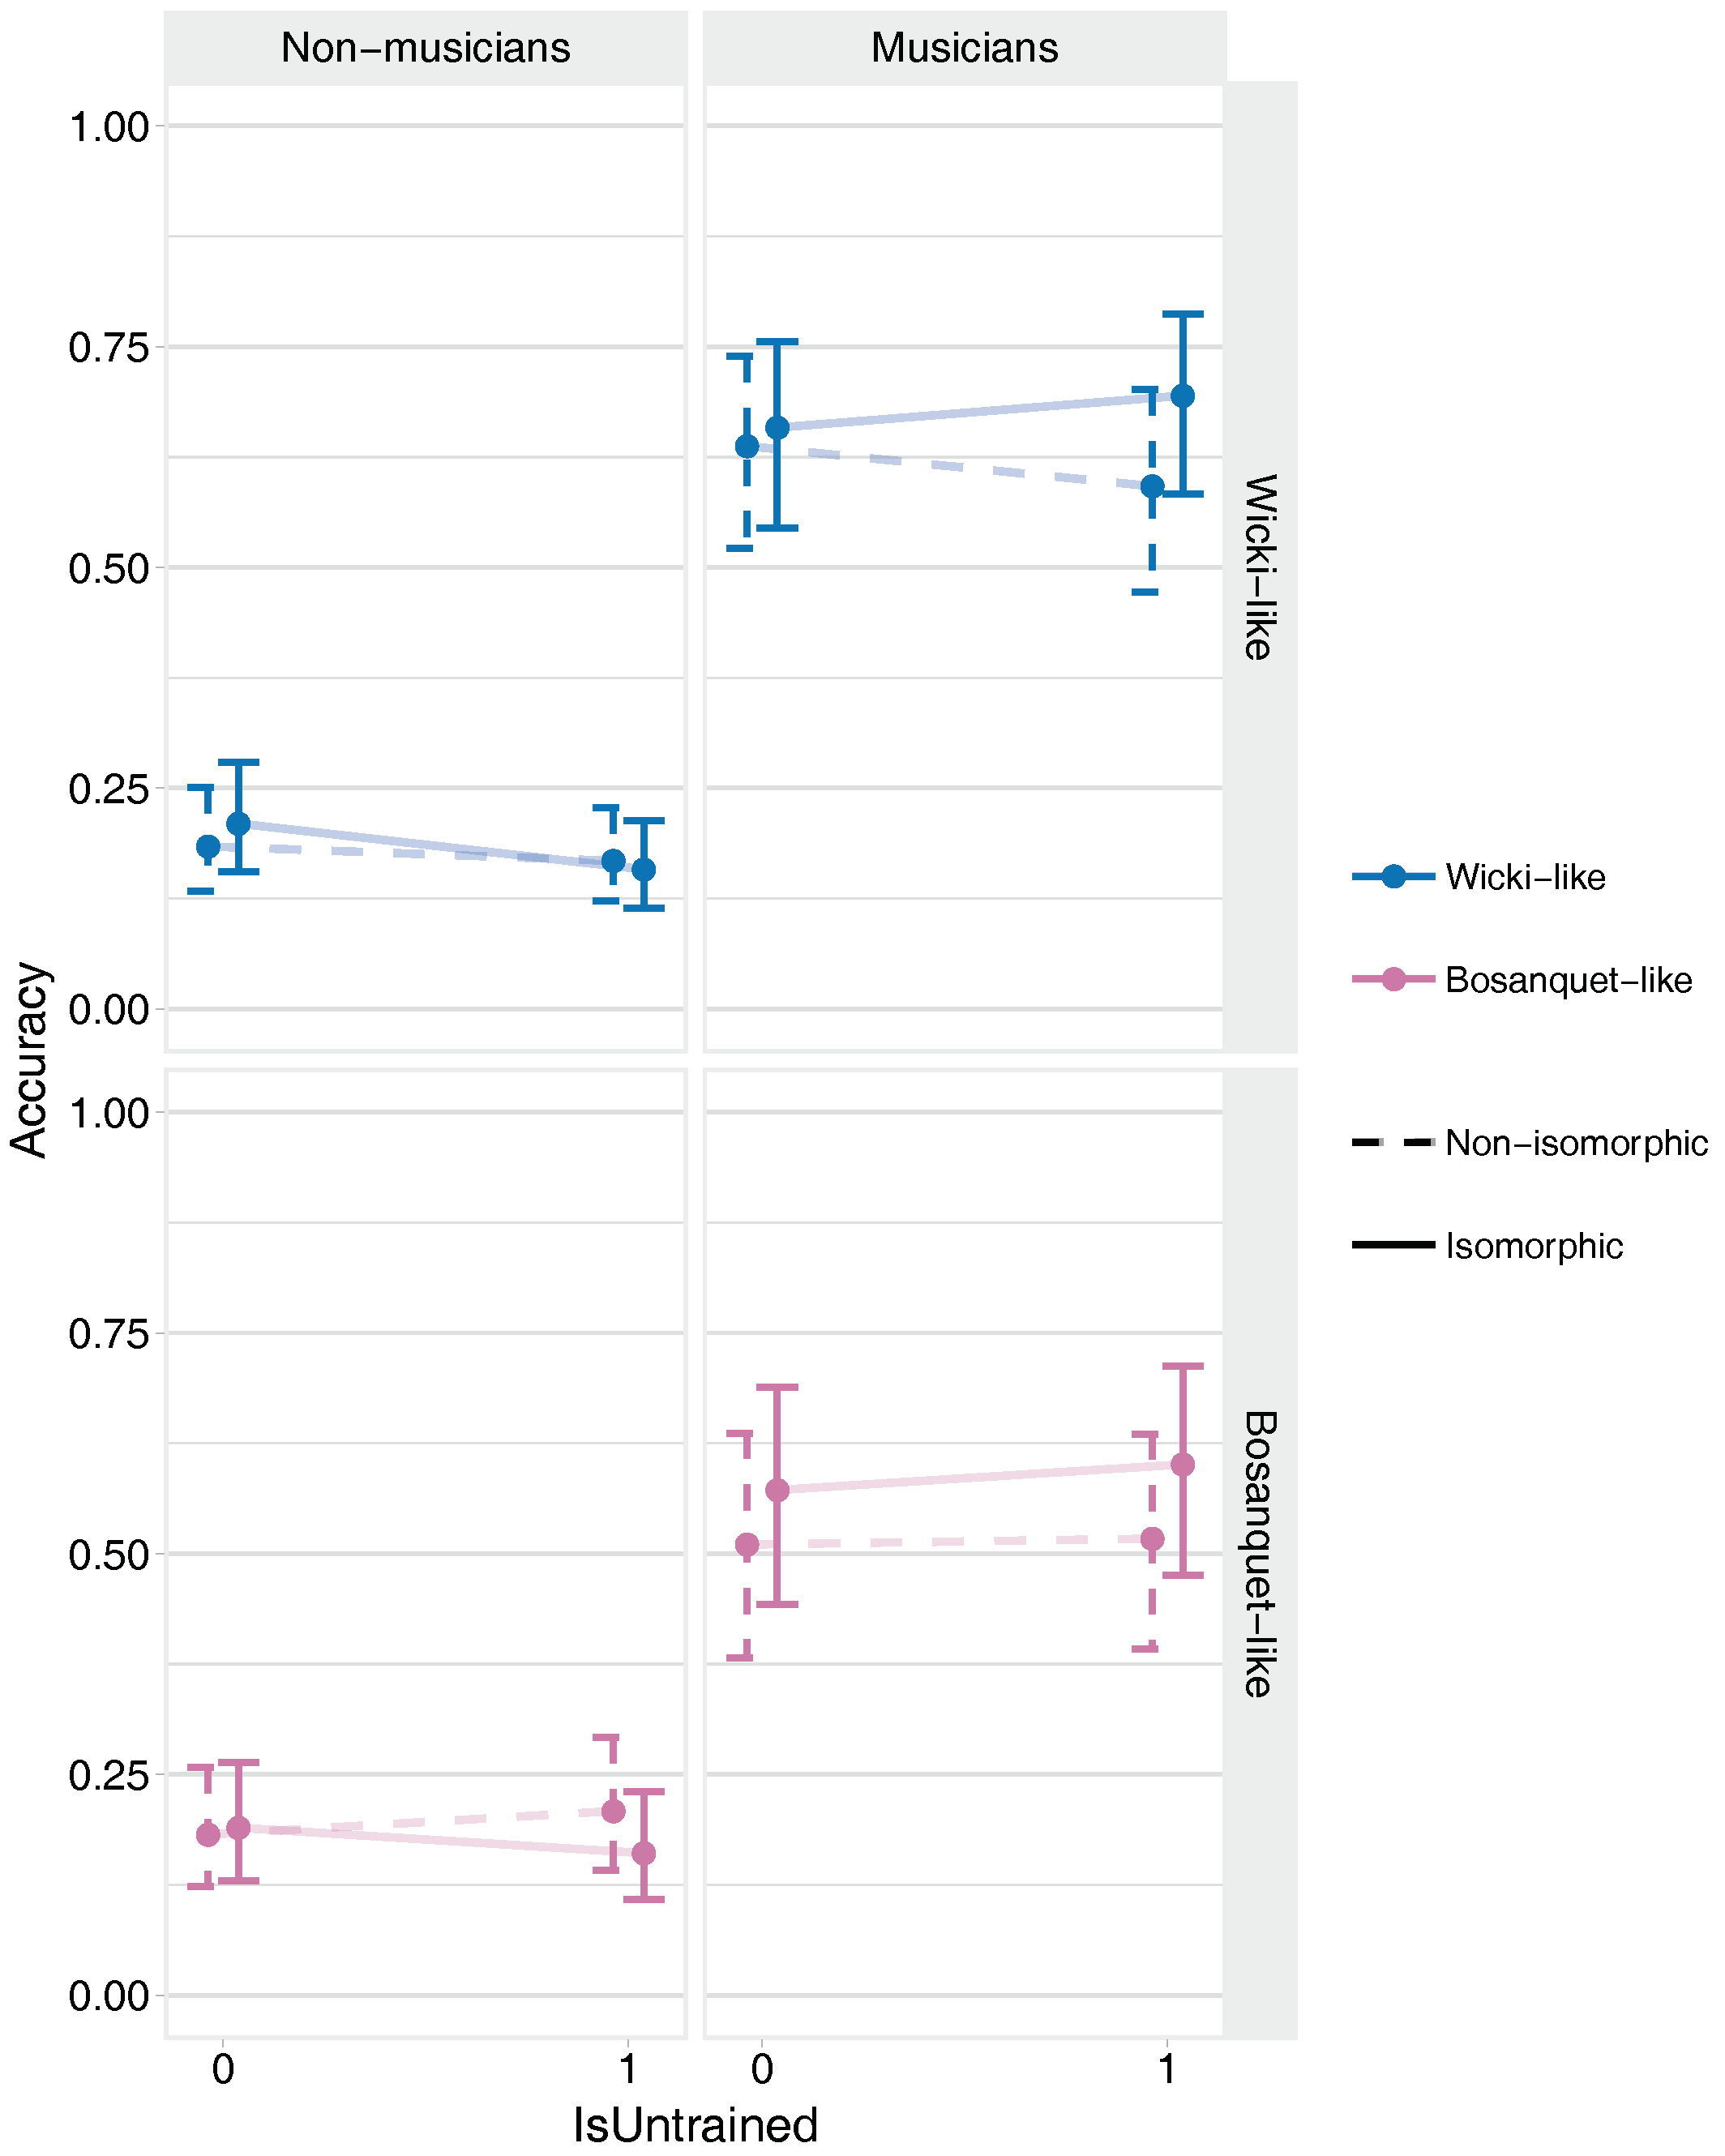
3.2.5. Melody Transfer Task

Table 5 and Figure 23 show:
  • Strong evidence that non-musicians’ performances in the trained key were better on the isomorphic Wicki layout compared with the non-isomorphic version; strong evidence that musicians’ performances in the trained key were better using the isomorphic Bosanquet layout than using the non-isomorphic version.
  • Strong evidence that non-musicians’ performances in the untrained key were worse on the isomorphic Bosanquet than the non-isomorphic Bosanquet layout; very strong evidence that musicians’ performances in the untrained key were better on the isomorphic versions of both types of layout (mean effect of 0.79).
  • Strong evidence that musicians’ performances in the trained key were better on the non-isomorphic Bosanquet than the non-isomorphic Wicki layout.
  • Very strong evidence that musicians performed better than non-musicians across all conditions (mean effect was 2.05).
  • Very strong evidence that performance improved with the second layout and with successive performances, although for non-musicians this reduced on the second layout.

3.3. Qualitative Content Analysis

3.3.1. Layout Preference

Table 6 shows how many participants had preferences for particular pitch layouts. A large majority of participants (44%) indicated a preference for isomorphic pitch layouts. This was particularly evident amongst those who played on the Wicki-like isomorphic layout, where 35% of musicians and 29% of non-musicians preferred this layout. In contrast, 20% of participants indicated a preference for a non-isomorphic layout. However, it should be noted that there was a greater preference for the non-isomorphic version of the Bosanquet-like layout compared with the isomorphic version. In particular, approximately 20% of non-musicians preferred this layout compared to 7% of musicians.

3.3.2. Reason for Layout Preference

Positive participant statements ( N = 59 statements) regarding why particular layouts were preferred were categorised into the following sub-themes: Layout structure, Intuitiveness, Similarity to piano, Identifying reference note, and Practice effects. Table 7 shows examples of statements from each sub-theme, as well as the number of statements per sub-theme. Table 8 shows the layout preferences for the numbers of participants who made statements fitting into each sub-theme.
The sub-theme Layout structure contained statements made by separate participants suggesting how identifiable aspects of the pitch layouts influenced their layout preferences. Such aspects included the positions of notes, the way notes were grouped, and the pattern sequences followed. Layout structure accounted for the largest proportion of statements (approximately 37%) contained under Reason for layout preference. Additionally, approximately 57% of statements were made by participants who preferred isomorphic layouts, whereas 22% of statements were made by those who preferred non-isomorphic layouts. However, of those who preferred non-isomorphic layouts, all statements were made by those who played on Bosanquet-like layouts. Furthermore, for four of these five participants (two musicians, two non-musicians), statements were related to the greater number of pitches per row on the non-isomorphic layout. The statements for this sub-theme were largely made by musicians, who made more statements for this sub-theme than any other sub-theme (58% of musicians made statements under this sub-theme). Statements of this type also accounted for the second greatest proportion of non-musicians’ statements (20%).
The sub-theme Practice effects accounted for the second largest proportion (approximately 32%) of statements included under Reason for layout preference. It contained statements that mentioned that developing familiarity with the device over the experimental session had influenced layout preference. For the 17 participants in this sub-theme who had specified a preference for a particular layout, the preferred layout was the one presented second to the participant. Furthermore, 50% of statements were made by those who preferred isomorphic pitch layouts, whereas 40% of statements were made by those who preferred non-isomorphic pitch layouts. In addition, Practice effects accounted for the largest proportion of statements under Reason for layout preference made by non-musicians (37%) and the second largest proportion of statements made by musicians (19%).
The remaining sub-themes, Intuitiveness, Similarity to piano, and Identifying reference note accounted for approximately 15%, 3%, and 8% of the statements included under Reason for layout preference, respectively. Intuitiveness included statements indicating that playing came more easily, or was generally understood more easily on particular layouts. Similarity to piano contained statements citing common features between particular layouts and a piano. Both of these statements were made by musicians. However, the primary instrument they played was not always the piano. Identifying reference note contained statements indicating the relative ease of locating the position of the starting note for any exercise/melody on a particular layout. Similar to Layout structure and Practice effects, the majority of statements under these sub-themes were made by participants who preferred isomorphic pitch layouts.

3.3.3. Challenging Aspects

Participant statements ( N = 30 statements) regarding the features of the experiment that made it difficult were categorised into three sub-themes: Layout structure, Pace of audiovisual (AV) demonstration, and Familiarity of interface. Table 9 shows the number of statements assigned to each sub-theme as well as example statements from each.
The sub-theme Layout structure consisted of negative statements which indicated difficulty tracking the positions of pitches and the patterns in which they were laid out throughout the experiment. As such, it can be seen as the counterpart to Layout structure under the previous theme. As in the previous theme, this sub-theme also accounted for the largest proportion of statements (approximately 67%) coded under the theme Challenging aspects. In addition, more musicians (50%) and non-musicians (17%) made statements for this sub-theme than any other sub-theme.
The sub-themes Familiarity of interface and Pace of AV demonstration accounted for the remaining 27% and 6% of statements included under Challenging aspects, respectively. Familiarity of interface included statements that indicated a lack of experience with the type of interface used. Statements of this type were primarily made by musicians. Pace of AV demonstration included statements (made by musicians only) that described the difficulty some participants experienced in keeping up with the AV demonstration utilised in the training tasks.

4. Discussion

This study was conducted to examine whether the use of isomorphic pitch layouts on a novel musical instrument would facilitate learning better than non-isomorphic pitch layouts. Accuracy was measured for participants’ performances on a series of musical training, immediate retention, and transfer tasks so as to infer learning. The transfer task was the primary task in which the effects of interest were expected to be most evident. This was because it required the application of previously learned pitch combinations to an untrained task, which would occur both in the key in which they were trained and in an additional untrained key. Thus, it did not merely require the repetition of a previously played sequence. Effects seen in the transfer task would suggest elements that facilitate sustained learning, rather than any temporary learning effects that may be seen in the training and immediate retention tasks. The strong evidence in the transfer task for the effect of isomorphism in the trained key and moderate evidence for the untrained key seen in the confirmatory analysis only partly explained the differences seen across performances. The exploratory analysis more fully delineated the moderating effects of the type of layout (Wicki or Bosanquet), and the musical experience of the participant (musician or non-musician).

4.1. Melody Transfer Task

For the transfer task, the most important hypothesis test (H3, in Section 1.1) was whether participants performed better in an untrained key when playing on an isomorphic pitch layout than when playing a non-isomorphic layout. For musicians, this hypothesis was strongly confirmed—their performances, as quantified by the ratio Accuracy / Inaccuracy (see Section 2.5), were 57% better on the isomorphic Wicki version than on the non-isomorphic version and 40% better on the isomorphic Bosanquet than the non-isomorphic version. However, for non-musicians playing the Bosanquet-like layouts, the results were counter to this hypothesis—performances were better on the non-isomorphic version (by 38%).
There are at least two plausible mechanisms (detailed in Section 1) to explain the advantages of isomorphic layouts for musicians: (a) any given spatial relationship always produces the same sized musical interval, so they are more consistent; (b) they have a consistent pitch axis, which allows players to assess the pitch of any given button purely by its spatial position. Neither is true for non-isomorphic layouts (by definition). Arguably, these advantages are only of relevance to players who already have some degree of musical sophistication, for example, the capacity to aurally distinguish differently sized intervals rather than being aware only of a general melodic contour.
The above argument implies that, for non-musicians, we would see a reduced positive effect or no distinct effect at all. For non-musicians, although we saw no distinct effect with the Wicki-like layouts, we unexpectedly saw a distinct negative effect with the Bosanquet-like layouts. A possible reason for this—as can be seen in Figure 8—is that, on the non-isomorphic Bosanquet-like layout, all the scale pitches within a given octave are arranged on two rows rather than three. This means that, just by sticking to a single row and following the contour of the melody, a moderate number of correct pitches would result. In other words, the non-isomorphic Bosanquet layout allows for a simple playing strategy to achieve moderate accuracy (there is no difference in the numbers of rows per octave in the isomorphic and non-isomorphic versions of the Wicki-like layouts). It is also worth noting that the Accuracy values for non-musicians in this task were low (hovering around 0.25, see Figure 21). It may be that the simple strategy just described is useful for improving performance from low levels, whereas isomorphism is useful for improving performance from higher levels. This also raises another question, which is whether a one-dimensional isomorphic layout—a single row of buttons each ascending by a semitone—would be advantageous for learning. However, that is beyond the scope of this article.
The next most important hypothesis test investigated whether participants perform better in the trained key when playing on an isomorphic version of a given layout. There was distinct evidence in favour of this hypothesis—non-musicians’ performances on the Wicki-like layouts, as quantified by the ratio Accuracy / Inaccuracy , were 17% better on the isomorphic version; musicians’ performances on the Bosanquet-like layouts were 28% better on the isomorphic version. Under the other two conditions (non-musicians playing Bosanquet-like layouts and musicians playing Wicki-like layouts), there was no strong evidence pro or contra isomorphism.
Although no formal hypothesis tests were performed, Figure 23 shows that performances in the untrained key were not, on average, worse than those in the trained key.
We made no hypothesis for the impact of Bosanquet-like versus Wicki-like layouts and, indeed, there was no evidence provided for such an effect in any of the eight tested conditions shown in Table 5.
As expected, learning effects, as quantified by PerfNo, LayoutNo, and their interaction were distinct and in the expected directions—generally, Accuracy improved with successive performances and layouts with a subtle ceiling effect for non-musicians. Also, as expected, musicians performed considerably better in this task than non-musicians.

4.2. Training and Immediate Retention Tasks

The training and immediate retention tasks differed fundamentally from the transfer task in that they measured pattern learning. They also served the crucial purpose of training participants for doing the final task. Any effects seen here demonstrate temporary influences on the rate of learning a new layout. Although informative about how learning takes place during training, it is only when considered with the effects seen in the transfer task that an idea of the influences that promote sustained learning over time can be gained.
In three of the tasks (scale training, arpeggio training, and arpeggio immediate retention), performances on the non-isomorphic version of the Bosanquet-like layouts were distinctly better than those on the isomorphic version. This is counter to our expectations. As suggested in the previous subsection, it may be that the non-isomorphic Bosanquet-like layout benefits from using less rows per octave than the isomorphic version.
Performances on the isomorphic version of the Wicki-layout were better in the scale training task and, only for musicians, in the arpeggio retention task. This is suggestive of a positive effect of isomorphism for the Wicki-like layouts.
We made no hypothesis for the impact of Bosanquet-like versus Wicki-like layouts. However, Table 1, Table 2, Table 3 and Table 4 show that, for the non-isomorphic layouts, performance was often better on the Bosanquet-like than the Wicki-like layout. For the standard isomorphic versions, the Bosanquet layout was better than the Wicki layout only for non-musicians in the scale training task; across all other tasks and conditions, there was no distinct difference between them. These results, once again point to the non-isomorphic version of the Bosanquet layout benefiting from having fewer rows per octave.
There is very strong evidence for expected learning effects: accuracy improved from the first to second layout and usually over successive performances within a given layout. In the scale training task, there was strong evidence that both non-musicians and musicians approached a ceiling, while musicians also approached a ceiling in the scale retention and arpeggio training tasks. This probably reflects the greater difficulty of these latter tasks combined with musicians already starting from a higher base level of skill. Indeed, as expected, musicians were distinctly better at all training and retention tasks than non-musicians.

4.3. Summary of All Tasks

For the training and retention tasks, the reversal of the effect of isomorphism across the two layout types suggests that additional factors may need to be considered. The models used here had very good fits to the data collected, as shown by the R-squared values in Table A1, Table A2, Table A3, Table A4, Table A5 and Table A6, but the strong moderation of isomorphism by layout type (IsBosanquet) suggests that features specific to that non-isomorphic layout (such as the extent to which pitches lie on a single row) are also important.
For the transfer task, the moderation of the effect of isomorphism by IsBosanquet was less evident (across all eight tested conditions, isomorphism had a distinctly positive impact in four and a distinctly negative impact in one), perhaps because we would expect to see isomorphism playing a stronger positive role in the transfer task than in the training and retention tasks.
The results are suggestive of a positive impact of isomorphism on the ability to transfer learning from scales and arpeggios to previously unplayed melodies and to new keys. However, the contradictory results for the non-musicians playing the Bosanquet-like layout in the transfer task and the results of the training and retention tasks suggest a need to test more isomorphic/non-isomorphic pairs to obtain greater confidence in the general effect of isomorphism.

4.4. Semi-Structured Interviews

Interview responses provided further insight to the effects described above. There was a greater overall preference for isomorphic pitch layouts. However, this effect was largely driven by those who played on Wicki-like layouts and more so by musicians than non-musicians. In contrast, there was a greater preference for the non-isomorphic layout amongst those who played on Bosanquet-like layouts, which was largely driven by non-musicians. Findings from responses under Reason for layout preference shed further light on this. The sub-theme Layout structure was the most prominent (it contained the greatest number of statements) and comprised statements primarily made by musicians rather than non-musicians. Statements under this sub-theme also primarily corresponded to those with a preference for the Wicki-like isomorphic layout. However, all statements corresponding to non-isomorphic layouts related to the Bosanquet-like arrangement and, with the exception of one statement, referred to how many pitches were contained on each row. The difference in the patterns of layout preferences across layout types hints at the presence of additional factors that influence learning. The commonalities between statements made by those with a preference for the non-isomorphic Bosanquet-like layout provide support for the previous suggestion that one such factor is likely the number of pitches per row.
The second most prominent sub-theme under Reason for layout preference was Practice effects, which largely comprised statements made by non-musicians. Additionally, musicians made more statements for this sub-theme than any other sub-theme indicating that, for non-musicians, Practice effects were the most influential factor when learning on a novel musical interface. This is in contrast to musicians who made the highest number of statements for the sub-theme Layout structure. The differing proportions of musicians and non-musicians across layout preferences suggests differences between how base learning and advanced learning occur.
As for Reason for layout preference, the sub-theme Layout structure was also the most prominent of the theme Challenging aspects. The consistency of this sub-theme’s level of prominence within its respective themes indicates that structure—that is, note positions, note groupings, and sequence patterns—is the most important factor contributing to an individual’s experience with a pitch layout.

4.5. Limitations and Future Directions

There were several limitations to this study. Firstly, the generalisability of these results is somewhat limited by the demographic factors of this study, such as the age and nationality of the participants. Secondly, given the nature of the way in which performances were scored, it was possible for performances in which, say, only two notes were played but played correctly, to achieve higher accuracy scores than performances where an attempt was made to play the entire sequence in question but many errors were made. Therefore, highly inaccurate scores were not necessarily a reliable representation of what a participant had learned. Thirdly, as already mentioned, it is hard to make general statements about high-level features such as isomorphism without having tested a greater variety of layouts. However, given the time-consuming nature of the experiments, there was a practical limitation as to the number of layouts that could be feasibly tested. Fourth, as in [15], only melody performances were tested; bearing in mind that melodies often comprise numerous major seconds, different results might be obtained when participants play bass lines (which often comprise numerous fourths and fifths) and harmonies (which often comprise numerous thirds and sixths as well as fourths and fifths). Lastly, while the instruments played by musicians were identified, they were not controlled for. Piano was the primary instrument played by a large proportion of musicians in this study, and it is possible that their results may be biased with respect to the broader population of musicians. As such, future research could aim to include equal numbers of participants playing a range of instruments so as to eliminate this potential bias.
Future research could also investigate whether learnability is better facilitated by pitch layouts congruent with the SMARC effect, something that was not tested here because all our layouts were congruent. Furthermore, there are still open questions regarding the individual importance of various interval directions in pitch layouts, such as the directions of the pitch axis, the octave axis, and the major second axis, the impacts of which have, to date, been only partially differentiated [15].

5. Conclusions

Overall, this study provides insights into the cognitive and sensory-motor aspects of playing pitches on musical instruments. This is useful for informing the design of new musical instruments so as to enhance their learnability and playability. We showed strong evidence that, for musically sophisticated participants, isomorphic pitch layouts facilitate the transfer of previously learned scales and arpeggios to an unlearned melody in the same key and in a new key. Results for non-musicians were, however, contradictory. Generally, performances—particularly in the training and retention tasks—on the non-isomorphic Bosanquet-like layout were unexpectedly good. This suggests that other aspects that were not explicitly modelled here (such as the number of rows per octave) also play roles. Further investigation is required to more clearly identify the general effects of isomorphism and to explore other features that contribute to the learnability and playability of pitch layouts in new musical instruments.

Author Contributions

Author contributions were as follows: Conceptualisation, S.S., A.J.M. and J.M.; Methodology, S.S., A.J.M. and J.M.; Software, A.J.M.; Validation, S.S, A.J.M. and J.M.; Formal analysis, S.S. and A.J.M.; Data curation, S.S.; Writing—original draft preparation, S.S. and A.J.M.; Writing—review and editing, S.S., A.J.M. and J.M.; Visualisation, A.J.M.; Supervision, A.J.M. and J.M.

Funding

Andrew Milne is the recipient of an Australian Research Council Discovery Early Career Researcher Award (project number DE170100353) funded by the Australian Government.

Acknowledgments

The authors would like to thank Anthony Prechtl for specially recoding Hex to make it respond to multitouch input.

Conflicts of Interest

The authors declare no conflict of interest.

Appendix A. Exploratory Model Summaries

Table A1. Summary of scale training model.
Family:beta
Links:mu = logit; phi = identity
Formula:Accuracy ~ IsMusician * (IsNonIsomorphic * IsBosanquet + LayoutNo * PerfNo)
+ (IsNonIsomorphic + LayoutNo * PerfNo | ID)
Data:PitchLayoutsDataTask0 (Number of observations: 399)
Samples:4 chains, each with iter = 4000; warmup = 2000; thin = 1;
total post-warmup samples = 8000
Group-Level Effects:
ID (Number of Levels: 67)EstimateEst.Errorl-95% CIu-95% CIEff.SampleRhat
sd(Intercept)1.560.161.261.9024601.00
sd(IsNonIsomorphic)0.440.220.040.853251.03
sd(LayoutNo)0.600.210.130.963361.02
sd(PerfNo)0.120.080.010.308111.01
sd(LayoutNo:PerfNo)0.100.080.000.3310681.01
cor(Intercept,IsNonIsomorphic)−0.380.26−0.770.2929101.00
cor(Intercept,LayoutNo)−0.420.21−0.730.0822811.00
cor(IsNonIsomorphic,LayoutNo)−0.220.28−0.700.3916001.00
cor(Intercept,PerfNo)−0.050.34−0.670.6591371.00
cor(IsNonIsomorphic,PerfNo)−0.120.37−0.780.6332361.00
cor(LayoutNo,PerfNo)0.380.37−0.510.8916011.00
cor(Intercept,LayoutNo:PerfNo)−0.060.38−0.740.69107601.00
cor(IsNonIsomorphic,LayoutNo:PerfNo)−0.010.40−0.750.7467391.00
cor(LayoutNo,LayoutNo:PerfNo)−0.090.41−0.790.7130191.00
cor(PerfNo,LayoutNo:PerfNo)−0.240.44−0.910.6821681.00
Population-Level Effects:EstimateEst.Errorl-95% CIu-95% CIEff.SampleRhatEff.Fact
Intercept−2.510.33−3.17−1.8817201.000.08
IsMusician2.310.521.303.3416751.0010.07
IsNonIsomorphic−0.250.18−0.610.1141191.000.78
IsBosanquet0.880.46−0.051.7816431.002.41
LayoutNo1.680.181.332.0434201.005.37
PerfNo0.480.080.330.6248981.001.62
IsNonIsomorphic:IsBosanquet0.780.280.241.3336391.002.18
LayoutNo:PerfNo−0.410.10−0.60−0.2251311.000.66
IsMusician:IsNonIsomorphic−0.160.29−0.740.4237201.000.85
IsMusician:IsBosanquet−0.780.70−2.160.5618231.000.46
IsMusician:LayoutNo−0.950.27−1.46−0.4031891.000.39
IsMusician:PerfNo−0.180.11−0.390.0442031.000.84
IsMusician:IsNonIsomorphic:IsBosanquet0.010.43−0.820.8340191.001.01
IsMusician:LayoutNo:PerfNo0.300.150.000.5946991.001.35
Family Specific Parameters:EstimateEst.Errorl-95% CIu-95% CIEff.SampleRhat
phi15.931.6113.1019.3718631.01
Model fit:EstimateEst.Errorl-95% CIu-95% CI
BayesR20.890.010.870.90
Table A2. Summary of scale retention model.
Family:beta
Links:mu = logit; phi = identity
Formula:Accuracy ~ IsMusician * (IsNonIsomorphic * IsBosanquet + LayoutNo * PerfNo)
+ (IsNonIsomorphic + LayoutNo * PerfNo | ID)
Data:PitchLayoutsDataTask1 (Number of observations: 230)
Samples:4 chains, each with iter = 4000; warmup = 2000; thin = 1;
total post-warmup samples = 8000
Group-Level Effects:
ID (Number of Levels: 65)EstimateEst.Errorl-95% CIu-95% CIEff.SampleRhat
sd(Intercept)1.140.140.891.4417091.00
sd(IsNonIsomorphic)0.530.330.021.082161.02
sd(LayoutNo)0.660.310.041.142431.01
sd(PerfNo)0.180.120.010.4611541.01
sd(LayoutNo:PerfNo)0.230.170.010.626871.01
cor(Intercept,IsNonIsomorphic)−0.180.31−0.650.578311.00
cor(Intercept,LayoutNo)−0.490.25−0.820.249891.00
cor(IsNonIsomorphic,LayoutNo)0.020.33−0.640.6810541.00
cor(Intercept,PerfNo)−0.280.35−0.830.5056621.00
cor(IsNonIsomorphic,PerfNo)0.110.38−0.660.7833271.00
cor(LayoutNo,PerfNo)0.090.37−0.660.7753641.00
cor(Intercept,LayoutNo:PerfNo)−0.010.36−0.710.6863001.00
cor(IsNonIsomorphic,LayoutNo:PerfNo)0.110.38−0.650.7835761.00
cor(LayoutNo,LayoutNo:PerfNo)−0.090.39−0.770.6925591.00
cor(PerfNo,LayoutNo:PerfNo)−0.120.41−0.810.6923211.00
Population-Level Effects:EstimateEst.Errorl-95% CIu-95% CIEff.SampleRhatEff.Fact
Intercept−0.880.26−1.40−0.3615251.000.41
IsMusician1.260.410.452.0620761.003.53
IsNonIsomorphic−0.210.25−0.710.3034681.000.81
IsBosanquet0.240.36−0.450.9519071.001.27
LayoutNo0.960.210.541.3632051.002.61
PerfNo−0.010.13−0.270.2550801.000.99
IsNonIsomorphic:IsBosanquet0.470.38−0.281.1930351.001.60
LayoutNo:PerfNo0.040.17−0.290.3749571.001.04
IsMusician:IsNonIsomorphic0.020.37−0.720.7434971.001.02
IsMusician:IsBosanquet−0.380.54−1.440.6721271.000.68
IsMusician:LayoutNo−0.070.31−0.660.5532911.000.93
IsMusician:PerfNo0.660.190.291.0448821.001.93
IsMusician:IsNonIsomorphic:IsBosanquet0.000.54−1.061.0830601.001.00
IsMusician:LayoutNo:PerfNo−0.410.26−0.940.0952541.000.66
Family Specific Parameters:EstimateEst.Errorl-95% CIu-95% CIEff.SampleRhat
phi25.625.2118.0537.596941.01
Model fit:EstimateEst.Errorl-95% CIu-95% CI
BayesR20.890.020.850.93
Table A3. Summary of arpeggio training task model.
Family:beta
Links:mu = logit; phi = identity
Formula:Accuracy ~ IsMusician * (IsNonIsomorphic * IsBosanquet + LayoutNo * PerfNo)
+ (IsNonIsomorphic + LayoutNo * PerfNo | ID)
Data:PitchLayoutsDataTask2 (Number of observations: 393)
Samples:4 chains, each with iter = 4000; warmup = 2000; thin = 1;
total post-warmup samples = 8000
Group-Level Effects:
ID (Number of levels: 67)EstimateEst.Errorl-95% CIu-95% CIEff.SampleRhat
sd(Intercept)1.320.151.051.6524811.00
sd(IsNonIsomorphic)0.430.310.021.041951.03
sd(LayoutNo)0.860.290.171.312431.02
sd(PerfNo)0.090.070.000.2523161.00
sd(LayoutNo:PerfNo)0.500.090.350.7016311.00
cor(Intercept,IsNonIsomorphic)−0.000.33−0.570.7012001.00
cor(Intercept,LayoutNo)−0.180.23−0.530.436491.01
cor(IsNonIsomorphic,LayoutNo)−0.250.32−0.800.477081.00
cor(Intercept,PerfNo)0.050.37−0.660.7499241.00
cor(IsNonIsomorphic,PerfNo)−0.030.41−0.770.7347341.00
cor(LayoutNo,PerfNo)0.130.40−0.690.7955071.00
cor(Intercept,LayoutNo:PerfNo)−0.060.19−0.440.3115301.00
cor(IsNonIsomorphic,LayoutNo:PerfNo)0.200.34−0.560.787181.01
cor(LayoutNo,LayoutNo:PerfNo)−0.470.22−0.830.0510471.00
cor(PerfNo,LayoutNo:PerfNo)−0.250.39−0.840.609791.00
Population-Level Effects:EstimateEst.Errorl-95% CIu-95% CIEff.SampleRhatEff.Fact
Intercept−3.960.32−4.59−3.3522301.000.02
IsMusician1.920.490.972.9118951.006.82
IsNonIsomorphic0.270.24−0.220.7439601.001.31
IsBosanquet−0.230.44−1.100.6221271.000.79
LayoutNo0.690.230.221.1440981.001.99
PerfNo0.290.090.100.4750721.001.34
IsNonIsomorphic:IsBosanquet0.400.38−0.331.1432151.001.49
LayoutNo:PerfNo0.080.15−0.200.3742161.001.08
IsMusician:IsNonIsomorphic−0.030.36−0.740.6737691.000.97
IsMusician:IsBosanquet0.920.69−0.452.2920001.002.51
IsMusician:LayoutNo0.410.33−0.251.0635711.001.51
IsMusician:PerfNo0.240.120.010.4851471.001.27
IsMusician:IsNonIsomorphic:IsBosanquet0.180.54−0.871.2531661.001.20
IsMusician:LayoutNo:PerfNo−0.210.21−0.610.2142071.000.81
Family Specific Parameters:EstimateEst.Errorl-95% CIu-95% CIEff.SampleRhat
phi23.372.6518.6128.9127321.00
Model fit:EstimateEst.Errorl-95% CIu-95% CI
BayesR20.950.010.930.96
Table A4. Summary of arpeggio immediate retention task model.
Family:beta
Links:mu = logit; phi = identity
Formula:Accuracy ~ IsMusician * (IsNonIsomorphic * IsBosanquet + LayoutNo * PerfNo)
+ (IsNonIsomorphic + LayoutNo + PerfNo | ID)
Data:PitchLayoutsDataTask3 (Number of observations: 258)
Samples:4 chains, each with iter = 4000; warmup = 2000; thin = 1;
total post-warmup samples = 8000
Group-Level Effects:
ID (Number of levels: 66)EstimateEst.Errorl-95% CIu-95% CIEff.SampleRhat
sd(Intercept)0.800.100.631.0126761.00
sd(IsNonIsomorphic)0.550.140.150.774011.01
sd(LayoutNo)0.210.170.010.613471.01
sd(PerfNo)0.500.080.360.6727961.00
cor(Intercept,IsNonIsomorphic)−0.060.21−0.430.4218921.00
cor(Intercept,LayoutNo)−0.200.38−0.820.6742501.00
cor(IsNonIsomorphic,LayoutNo)0.130.37−0.680.8053721.00
cor(Intercept,PerfNo)0.210.18−0.140.5632691.00
cor(IsNonIsomorphic,PerfNo)−0.380.21−0.770.0614331.00
cor(LayoutNo,PerfNo)0.010.40−0.760.775761.00
Population-Level Effects:EstimateEst.Errorl-95% CIu-95% CIEff.SampleRhatEff.Fact
Intercept−1.730.20−2.12−1.3533211.000.18
IsMusician1.710.311.102.3332441.005.53
IsNonIsomorphic0.060.16−0.260.3651711.001.06
IsBosanquet−0.300.28−0.840.2434271.000.74
LayoutNo0.440.130.180.7164941.001.55
PerfNo−0.070.13−0.330.1864231.000.93
IsNonIsomorphic:IsBosanquet0.390.24−0.070.8654061.001.48
LayoutNo:PerfNo−0.160.14−0.430.1078671.000.85
IsMusician:IsNonIsomorphic−0.610.25−1.12−0.1153761.000.54
IsMusician:IsBosanquet−0.060.43−0.910.7930271.000.94
IsMusician:LayoutNo0.170.21−0.240.5758701.001.19
IsMusician:PerfNo0.370.20−0.010.7565261.001.45
IsMusician:IsNonIsomorphic:IsBosanquet0.840.360.131.5456111.002.32
IsMusician:LayoutNo:PerfNo0.460.200.070.8779731.001.58
Family Specific Parameters:EstimateEst.Errorl-95% CIu-95% CIEff.SampleRhat
phi39.566.3828.3053.0314671.00
Model fit:EstimateEst.Errorl-95% CIu-95% CI
BayesR20.940.010.920.96
Table A5. Summary of melody transfer task model.
Family:beta
Links:mu = logit; phi = identity
Formula:Accuracy ~ IsMusician * (IsNonIsomorphic * IsBosanquet + LayoutNo * PerfNo)
+ (IsNonIsomorphic + LayoutNo * PerfNo | ID)
Data:PitchLayoutsDataTask4 (Number of observations: 472)
Samples:4 chains, each with iter = 4000; warmup = 2000; thin = 1;
total post-warmup samples = 8000
Group-Level Effects:
ID (Number of levels: 67)EstimateEst.Errorl-95% CIu-95% CIEff.SampleRhat
sd(Intercept)0.870.100.691.0736941.00
sd(IsNonIsomorphic)0.200.120.010.436351.01
sd(IsUntrained)0.470.080.330.6325381.00
sd(LayoutNo)0.150.090.010.348661.00
sd(PerfNo)0.060.040.000.1512901.00
sd(IsNonIsomorphic:IsUntrained)0.470.140.170.749081.00
sd(LayoutNo:PerfNo)0.130.050.020.2211261.00
cor(Intercept,IsNonIsomorphic)0.000.27−0.510.5676071.00
cor(Intercept,IsUntrained)−0.270.16−0.560.0557321.00
cor(IsNonIsomorphic,IsUntrained)0.080.29−0.530.5911831.00
cor(Intercept,LayoutNo)−0.250.31−0.750.4538731.00
cor(IsNonIsomorphic,LayoutNo)0.060.34−0.610.6936391.00
cor(IsUntrained,LayoutNo)0.170.31−0.480.7261791.00
cor(Intercept,PerfNo)0.150.31−0.500.7082261.00
cor(IsNonIsomorphic,PerfNo)0.130.34−0.580.7336401.00
cor(IsUntrained,PerfNo)−0.040.32−0.630.6062471.00
cor(LayoutNo,PerfNo)0.190.36−0.550.7919331.00
cor(Intercept,IsNonIsomorphic:IsUntrained)0.030.20−0.370.4048191.00
cor(IsNonIsomorphic,IsNonIsomorphic:IsUntrained)−0.420.33−0.870.408341.00
cor(IsUntrained,IsNonIsomorphic:IsUntrained)−0.470.20−0.780.0121761.00
cor(LayoutNo,IsNonIsomorphic:IsUntrained)−0.130.32−0.710.5322791.00
cor(PerfNo,IsNonIsomorphic:IsUntrained)−0.120.32−0.700.5321831.00
cor(Intercept,LayoutNo:PerfNo)−0.230.24−0.660.2757511.00
cor(IsNonIsomorphic,LayoutNo:PerfNo)−0.100.31−0.670.5216901.00
cor(IsUntrained,LayoutNo:PerfNo)−0.000.26−0.520.5041171.00
cor(LayoutNo,LayoutNo:PerfNo)0.070.33−0.580.6916021.00
cor(PerfNo,LayoutNo:PerfNo)−0.060.34−0.670.6123781.00
cor(IsNonIsomorphic:IsUntrained,LayoutNo:PerfNo)0.100.27−0.430.6137101.00
Population-Level Effects:EstimateEst.Errorl-95% CIu-95% CIEff.SampleRhatEff.Fact
Intercept−1.790.20−2.19−1.3817031.000.17
IsMusician2.120.321.482.7520061.008.33
IsNonIsomorphic−0.160.12−0.400.0733491.000.85
IsBosanquet−0.130.29−0.710.4520371.000.88
IsUntrained−0.350.14−0.63−0.0732041.000.70
LayoutNo0.550.110.330.7741361.001.73
PerfNo0.170.050.080.2642761.001.19
IsNonIsomorphic:IsBosanquet0.110.19−0.250.4833471.001.12
IsNonIsomorphic:IsUntrained0.240.18−0.100.5931761.001.27
IsBosanquet:IsUntrained0.150.23−0.300.6029801.001.16
LayoutNo:PerfNo−0.110.06−0.230.0039941.000.90
IsMusician:IsNonIsomorphic0.070.17−0.270.4031871.001.07
IsMusician:IsBosanquet−0.240.44−1.100.6521451.000.79
IsMusician:IsUntrained0.510.220.090.9633611.001.67
IsMusician:LayoutNo−0.230.16−0.530.0841641.000.79
IsMusician:PerfNo−0.070.07−0.200.0741431.000.93
IsNonIsomorphic:IsBosanquet:IsUntrained0.130.28−0.420.6930511.001.14
IsMusician:IsNonIsomorphic:IsBosanquet−0.270.26−0.780.2633351.000.76
IsMusician:IsNonIsomorphic:IsUntrained−0.600.27−1.13−0.0834001.000.55
IsMusician:IsBosanquet:IsUntrained−0.200.33−0.840.4432771.000.82
IsMusician:LayoutNo:PerfNo0.100.09−0.070.2742391.001.11
IsMusician:IsNonIsomorphic:IsBosanquet:IsUntrained0.140.40−0.640.9430101.001.15
Family Specific Parameters:EstimateEst.Errorl-95% CIu-95% CIEff.SampleRhat
phi42.624.3334.5551.5516351.00
Model fit:EstimateEst.Errorl-95% CIu-95% CI
BayesR20.940.010.930.95

Appendix B. Confirmatory Model Summaries

Table A6. Summary of melody transfer task confirmatory model.
Family:beta
Links:mu = logit; phi = identity
Formula:Accuracy ~ IsNonIsomorphic * IsUntrained + IsBosanquet + LayoutNo * PerfNo + IsMusician
+ (IsNonIsomorphic * IsUntrained + LayoutNo * PerfNo | ID)
Data:PitchLayoutsDataTask4 (Number of observations: 472)
Samples:4 chains, each with iter = 4000; warmup = 2000; thin = 1;
total post-warmup samples = 8000
Group-Level Effects:
ID (Number of levels: 66)EstimateEst.Errorl-95% CIu-95% CIEff.SampleRhat
sd(Intercept)0.850.100.681.0624501.00
sd(IsNonIsomorphic)0.180.110.010.406191.00
sd(IsUntrained)0.500.080.360.6522071.00
sd(LayoutNo)0.180.100.010.376151.00
sd(PerfNo)0.080.040.000.178041.01
sd(IsNonIsomorphic:IsUntrained)0.510.130.250.758671.00
sd(LayoutNo:PerfNo)0.120.050.020.218511.00
cor(Intercept,IsNonIsomorphic)0.050.29−0.510.6248941.00
cor(Intercept,IsUntrained)−0.280.16−0.560.0630041.00
cor(IsNonIsomorphic,IsUntrained)0.030.30−0.570.616801.01
cor(Intercept,LayoutNo)−0.280.28−0.730.3830071.00
cor(IsNonIsomorphic,LayoutNo)0.040.33−0.610.6521501.00
cor(IsUntrained,LayoutNo)0.120.29−0.470.6547891.00
cor(Intercept,PerfNo)0.210.29−0.380.7245661.00
cor(IsNonIsomorphic,PerfNo)0.150.34−0.540.7315241.00
cor(IsUntrained,PerfNo)−0.100.30−0.650.5343851.00
cor(LayoutNo,PerfNo)0.200.35−0.550.7611441.00
cor(Intercept,IsNonIsomorphic:IsUntrained)0.090.19−0.300.4628641.00
cor(IsNonIsomorphic,IsNonIsomorphic:IsUntrained)−0.330.33−0.810.456771.01
cor(IsUntrained,IsNonIsomorphic:IsUntrained)−0.540.17−0.80−0.1419651.00
cor(LayoutNo,IsNonIsomorphic:IsUntrained)0.010.30−0.600.5717041.00
cor(PerfNo,IsNonIsomorphic:IsUntrained)−0.130.31−0.690.5214261.00
cor(Intercept,LayoutNo:PerfNo)−0.230.24−0.660.2746461.00
cor(IsNonIsomorphic,LayoutNo:PerfNo)−0.060.31−0.640.5518991.00
cor(IsUntrained,LayoutNo:PerfNo)−0.040.26−0.540.5040781.00
cor(LayoutNo,LayoutNo:PerfNo)0.130.32−0.530.7112881.00
cor(PerfNo,LayoutNo:PerfNo)−0.100.33−0.670.5718981.00
cor(IsNonIsomorphic:IsUntrained,LayoutNo:PerfNo)0.110.27−0.410.6132041.00
Population-Level Effects:EstimateEst.Errorl-95% CIu-95% CIEff.SampleRhatEff.Fact
Intercept−1.760.17−2.10−1.4317421.000.17
IsNonIsomorphic−0.130.07−0.26−0.0041551.000.88
IsUntrained−0.090.09−0.260.0831821.000.91
IsBosanquet−0.130.20−0.510.2717451.000.88
LayoutNo0.430.080.280.5843871.001.54
PerfNo0.130.040.060.2035221.001.14
IsMusician1.980.221.542.3912801.007.24
IsNonIsomorphic:IsUntrained0.020.10−0.190.2242111.001.02
LayoutNo:PerfNo−0.050.04−0.140.0339091.000.95
Family Specific Parameters:EstimateEst.Errorl-95% CIu-95% CIEff.SampleRhat
phi342.764.3034.7351.5713811.00
Model fit:EstimateEst.Errorl-95% CIu-95% CI
BayesR20.940.010.930.95
Table A7. Melody transfer task: directional hypothesis tests for the confirmatory effects of IsNonIsomorphic, IsBosanquet, and IsMusician, LayoutNo, PerfNo.
HypothesisEstimateEst.ErrorCI.LowerCI.UpperEvid.RatioPost.ProbStar
IsNonIso (IsUnTra = 0) < 0−0.130.07−Inf−0.0239.000.98*
IsNonIso (IsUnTra = 1) < 0−0.110.09−Inf0.048.500.89
IsBos < 0−0.130.20−Inf0.202.960.75
LayoutNo > 00.430.080.30InfInf1.00*
PerfNo > 00.130.040.08Inf2665.671.00*
IsMus > 01.980.221.62InfInf1.00*
IsUntra < 0−0.090.09−Inf0.065.410.84
LayoutNo:PerfNo < 0−0.050.04−Inf0.028.030.89
‘*’: The expected value under the hypothesis lies outside the 95% CI.

References

  1. Rickard, N.S.; Appelman, P.; James, R.; Murphy, F.; Gill, A.; Bambrick, C. Orchestrating life skills: The effect of increased school-based music classes on children’s social competence and self-esteem. Int. J. Music Educ. 2013, 31, 292–309. [Google Scholar] [CrossRef]
  2. Costa-Giomi, E. Effects of three years of piano instruction on children’s academic achievement, school performance and self-esteem. Psychol. Music 2004, 32, 139–152. [Google Scholar] [CrossRef]
  3. North, A.C.; Hargreaves, D.J.; O’Neill, S.A. The importance of music to adolescents. Br. J. Educ. Psychol. 2000, 70, 255–272. [Google Scholar] [CrossRef] [PubMed]
  4. Tarrant, M.; North, A.C.; Hargreaves, D.J. Social categorization, self-esteem, and the estimated musical preferences of male adolescents. J. Soc. Psychol. 2001, 141, 565–581. [Google Scholar] [CrossRef] [PubMed]
  5. Hallam, S.; Creech, A.; Varvarigou, M.; McQueen, H. Perceived benefits of active engagement with making music in community settings. Int. J. Community Music 2012, 5, 155–174. [Google Scholar] [CrossRef]
  6. Oechslin, M.S.; Descloux, C.; Croquelois, A.; Chanal, J.; Van De Ville, D.; Lazeyras, F.; James, C.E. Hippocampal volume predicts fluid intelligence in musically trained people. Hippocampus 2013, 23, 552–558. [Google Scholar] [CrossRef] [PubMed] [Green Version]
  7. Schellenberg, E.G. Long-term positive associations between music lessons and IQ. J. Educ. Psychol. 2006, 98, 457–468. [Google Scholar] [CrossRef]
  8. Mansens, D.; Deeg, D.J.; Comijs, H.C. The association between singing and/or playing a musical instrument and cognitive functions in older adults. Aging Ment. Health 2017, 1–8. [Google Scholar] [CrossRef] [PubMed]
  9. Seinfeld, S.; Figueroa, H.; Ortiz-Gil, J.; Sanchez-Vives, M.V. Effects of music learning and piano practice on cognitive function, mood and quality of life in older adults. Front. Psychol. 2013, 4, 1–13. [Google Scholar] [CrossRef]
  10. Paine, G.; Stevenson, I.; Pearce, A. The Thummer Mapping Project (ThuMP). In Proceedings of the 2007 Conference on New Interfaces for Musical Expression (NIME07), New York, NY, USA, 6–10 June 2007; pp. 70–77. [Google Scholar] [CrossRef]
  11. C-Thru Music. The AXiS-49 USB Music Interface. Available online: http://www.c-thru-music.com/cgi/?page=prod_axis-49 (accessed on 14 November 2018).
  12. Roger Linn Design. LinnStrument: A Revolutionary Expressive Musical Performance Controller. Available online: http://www.rogerlinndesign.com/linnstrument.html (accessed on 14 November 2018).
  13. ROLI. ROLI|BLOCKS. Available online: https://roli.com/products/blocks (accessed on 14 November 2017).
  14. Paine, G. Towards unified design guidelines for new interfaces for musical expression. Organ. Sound 2009, 14, 142–155. [Google Scholar] [CrossRef]
  15. MacRitchie, J.; Milne, A. Exploring the Effects of Pitch Layout on Learning a New Musical Instrument. Appl. Sci. 2017, 7, 1218. [Google Scholar] [CrossRef]
  16. Schmidt, R.A.; Lee, T.D. Motor Control and Learning. A Behavioural Emphasis; Human Kinetics: Champaign, IL, USA, 2011. [Google Scholar]
  17. Milne, A.J.; Sethares, W.A.; Plamondon, J. Tuning continua and keyboard layouts. J. Math. Music 2008, 2, 1–19. [Google Scholar] [CrossRef] [Green Version]
  18. Prechtl, A.; Milne, A.J.; Holland, S.; Laney, R.; Sharp, D.B. A MIDI sequencer that widens access to the compositional possibilities of novel tunings. Comput. Music J. 2012, 36, 42–54. [Google Scholar] [CrossRef]
  19. Milne, A.; Sethares, W.; Plamondon, J. Isomorphic controllers and dynamic tuning: Invariant fingering over a tuning continuum. Comput. Music J. 2007, 31, 15–32. [Google Scholar] [CrossRef]
  20. Wicki, K. Tastatur für Musikinstrumente. Switzerland Patent Nr. CH13329, 30 October 1896. [Google Scholar]
  21. Helmholtz, H.L.F. On the Sensations of Tone as a Physiological Basis for the Theory of Music; Dover: New York, NY, USA, 1877. [Google Scholar]
  22. Keislar, D. History and Principles of Microtonal Keyboards. Comput. Music J. 1987, 11, 18–28. [Google Scholar] [CrossRef]
  23. Array Instruments. The Array Mbira. Available online: http://www.arraymbira.com (accessed on 14 November 2018).
  24. Park, B.; Gerhard, D. Rainboard and Musix: Building dynamic isomorphic interfaces. In Proceedings of the International Conference on New Interfaces for Musical Expression, Daejeon, Korea, 27–30 May 2013; pp. 319–324. [Google Scholar]
  25. Terpstra, S.; Horvath, D. Terpstra Keyboard. Available online: http://terpstrakeyboard.com (accessed on 14 November 2017).
  26. Bosanquet, R.H.M. Elementary Treatise on Musical Intervals and Temperament; Macmillan: London, UK, 1877. [Google Scholar]
  27. Rusconi, E.; Kwana, B.; Giordano, B.L.; Umilta, C.; Butterworth, B. Spatial representation of pitch height: The SMARC effect. Cognition 2006, 99, 113–129. [Google Scholar] [CrossRef]
  28. Dehaene, S.; Bossini, S.; Giraux, P. The mental representation of parity and number magnitude. J. Exp. Psychol. Gener. 1993, 122, 371–396. [Google Scholar] [CrossRef]
  29. MacRitchie, J.; Milne, A.J. Evaluation of the learnability and playability of pitch layouts in new musical instruments. In Proceedings of the 14th Sound and Music Computing Conference, Espoo, Finland, 5–8 July 2017; Lokki, T., Pätynen, J., Välimäki, V., Eds.; Aalto University: Helsinki, Finland, 2017; pp. 450–457. [Google Scholar]
  30. Bürkner, P.C. brms: An R Package for Bayesian Multilevel Models Using Stan. J. Stat. Softw. 2017, 80, 1–28. [Google Scholar] [CrossRef]
  31. Bürkner, P.C. Advanced Bayesian Multilevel Modeling with the R Package brms. R J. 2018, 10, 395–411. [Google Scholar]
  32. Jayanthakumar, J.; Schubert, E.; de Graaf, D.L.E. NTPP (Note Time Playing Path) MIDI Performance Analyser (Version 0.1); Empirical Musicology Laboratory, University of New South Wales: Sydney, Australia.
  33. Verkuilen, M.S.J. A better lemon squeezer? Maximum-likelihood regression with beta-distributed dependent variables. Psychol. Methods 2006, 11, 54–71. [Google Scholar] [CrossRef]
  34. Barr, D.J.; Levy, R.; Scheepers, C.; Tilyc, H.J. Random effects structure for confirmatory hypothesis testing: Keep it maximal. J. Mem. Lang. 2013, 68, 255–278. [Google Scholar] [CrossRef] [PubMed] [Green Version]
  35. Kruschke, J.K.; Liddell, T.M. Bayesian data analysis for newcomers. Psychon. Bull. Rev. 2018, 25, 155–177. [Google Scholar] [CrossRef] [PubMed]
  36. Dienes, Z.; McLatchie, N. Four reasons to prefer Bayesian analyses over significance testing. Psychon. Bull. Rev. 2018, 25, 207–218. [Google Scholar] [CrossRef] [PubMed]
  37. Gelman, A.; Goodrich, B.; Gabry, J.; Ali, I. R-squared for Bayesian regression models. Available online: http://www.stat.columbia.edu/~gelman/research/unpublished/ (accessed on 14 November 2018).
  38. Gelman, A.; Carlin, J.B.; Stern, H.S.; Dunson, D.B.; Vehtari, A.; Rubin, D.B. Bayesian Data Analysis, 3rd ed.; CRC Press: Boca Raton, FL, USA, 2014. [Google Scholar]
Figure 1. The multitouch interface used in the experiment.
Applsci 08 02514 g001
Figure 2. E♭ major scale played in the scale training and immediate retention tasks.
Applsci 08 02514 g002
Figure 3. E♭ arpeggio sequence played in the arpeggio training and immediate retention tasks.
Applsci 08 02514 g003
Figure 4. Frère Jacques in E♭ major played in the transfer tasks.
Applsci 08 02514 g004
Figure 5. The isomorphic Wicki layout. The red and green lines show the respective paths traced out by two octaves of the B♭ and E♭ major scales. The blue arrow shows the pitch axis—if the layout is rotated to make the pitch axis vertical, the pitch of every button is proportional to its height.
Applsci 08 02514 g005
Figure 6. The non-isomorphic Wicki-like layout. The red and green lines show the respective paths traced by two octaves of the B♭ and E♭ major scales. Note how—compared with the isomorphic version—after every two rows, the pitches are cumulatively shifted one button to the right. This means that the same spatial relationship will produce inconsistent interval sizes. For example, the button “northeast” of G 4 is a perfect fourth (5 semitones) higher (C 5 ); the button northeast of C 5 is a perfect fifth (7 semitones) higher (G 5 ). These types of inconsistencies mean there is no consistent pitch axis.
Applsci 08 02514 g006
Figure 7. The isomorphic Bosanquet layout. The red and green lines show the respective paths traced by two octaves of the B♭ and F major scales. The blue arrow shows the pitch axis—it is perfectly horizontal, so the pitch of every button is proportional to its left–right position.
Applsci 08 02514 g007
Figure 8. The non-isomorphic Bosanquet-like layout. The red and green lines show the respective paths traced by two octaves of the B♭ and F major scales. Note how—compared with the isomorphic version—after every 12 columns, the pitches are cumulatively shifted northeast. This means that the same spatial relationship will produce inconsistent interval sizes. For example, the button two steps to the right of F 4 is a major third (4 semitones) higher (A 4 ); the button two steps to the right of G 4 is a minor third (3 semitones) higher (B 4 ). Such inconsistencies mean there is no consistent pitch axis.
Applsci 08 02514 g008
Figure 9. Scale training task: mean Accuracy scores with 95% confidence intervals obtained from 10,000 bootstrap samples.
Applsci 08 02514 g009
Figure 10. Scale training task: the model’s population level effects and 95% credibility intervals (see Table A1 for numerical values).
Applsci 08 02514 g010
Figure 11. Scale training task: the estimated marginal effects on Accuracy (and their 95% credibility intervals) of IsNonIsomorphic and IsBosanquet for non-musicians and musicians.
Applsci 08 02514 g011
Figure 12. Scale retention task: mean Accuracy scores with 95% confidence intervals obtained from 10,000 bootstrap samples.
Applsci 08 02514 g012
Figure 13. Scale retention task: the model’s population level effects and 95% credibility intervals (see Table A2 for numerical values).
Applsci 08 02514 g013
Figure 14. Scale retention task: the estimated marginal effects on Accuracy (and their 95% credibility intervals) of IsNonIsomorphic and IsBosanquet for non-musicians and musicians.
Applsci 08 02514 g014
Figure 15. Arpeggio training task: mean Accuracy scores with 95% confidence intervals obtained from 10,000 bootstrap samples.
Applsci 08 02514 g015
Figure 16. Arpeggio training task: the model’s population level effects and 95% credibility intervals (see Table A3 for numerical values).
Applsci 08 02514 g016
Figure 17. Arpeggio training task: the estimated marginal effects on Accuracy (and their 95% credibility intervals) of IsNonIsomorphic and IsBosanquet for non-musicians and musicians.
Applsci 08 02514 g017
Figure 18. Arpeggio retention task: mean Accuracy scores with 95% confidence intervals obtained from 10,000 bootstrap samples.
Applsci 08 02514 g018
Figure 19. Arpeggio retention task: the model’s population level effects and 95% credibility intervals (see Table A4 for numerical values).
Applsci 08 02514 g019
Figure 20. Arpeggio retention task: the estimated marginal effects on Accuracy (and their 95% credibility intervals) of IsNonIsomorphic and IsBosanquet for non-musicians and musicians.
Applsci 08 02514 g020
Figure 21. Melody transfer task: mean Accuracy scores with 95% confidence intervals obtained from 10,000 bootstrap samples.
Applsci 08 02514 g021
Figure 22. Melody transfer task: the model’s population level effects and 95% credibility intervals (see Table A5 for numerical values).
Applsci 08 02514 g022
Figure 23. Melody transfer task: the estimated marginal effects on Accuracy (and their 95% credibility intervals) of IsUntrained and IsNonIsomorphic for Bosanquet-like and Wicki-like layouts and for non-musicians and musicians.
Applsci 08 02514 g023
Table 1. Scale training task: directional hypothesis tests for the effects of IsNonIsomorphic, IsBosanquet, and IsMusician, LayoutNo, PerfNo, and their interaction LayoutNo:PerfNo across the conditions shown in parentheses.
HypothesisEstimateEst.ErrorCI.LowerCI.UpperEvid.RatioPost.ProbStar
IsNonIso (IsMus = 0, IsBos = 0) < 0−0.250.18−Inf0.0510.760.92
IsNonIso (IsMus = 0, IsBos = 1) > 00.530.220.18Inf155.860.99*
IsNonIso (IsMus = 1, IsBos = 0) < 0−0.410.23−Inf−0.0527.470.96*
IsNonIso (IsMus = 1, IsBos = 1) > 00.380.25−0.03Inf14.660.94
IsBos (IsMus = 0, IsNonIso = 0) > 00.880.460.11Inf30.870.97*
IsBos (IsMus = 0, IsNonIso = 1) > 01.660.420.96InfInf1.00*
IsBos (IsMus = 1, IsNonIso = 0) > 00.090.56−0.81Inf1.270.56
IsBos (IsMus = 1, IsNonIso = 1) > 00.880.510.05Inf25.060.96*
IsMus (IsNonIso = 0, IsBos = 0) > 02.310.521.46Inf7999.001.00*
IsMus (IsNonIso = 0, IsBos = 1) > 02.150.491.35Inf7999.001.00*
IsMus (IsNonIso = 1, IsBos = 0) > 01.520.570.59Inf209.531.00*
IsMus (IsNonIso = 1, IsBos = 1) > 01.370.540.49Inf199.001.00*
LayoutNo (IsMus = 0) > 01.680.181.38InfInf1.00*
LayoutNo (IsMus = 1) > 00.740.210.39Inf7999.001.00*
PerfNo (IsMus = 0) > 00.480.080.35InfInf1.00*
PerfNo (IsMus = 1) > 00.300.080.16Inf3999.001.00*
LayoutNo:PerfNo (IsMus = 0) < 0−0.410.10−Inf−0.25Inf1.00*
LayoutNo:PerfNo (IsMus = 1) < 0−0.110.11−Inf0.084.690.82
‘*’: The expected value under the hypothesis lies outside the 95% CI.
Table 2. Scale retention task: directional hypothesis tests for the effects of IsNonIsomorphic, IsBosanquet, and IsMusician, LayoutNo, PerfNo, and their interaction LayoutNo:PerfNo across the conditions shown in parentheses.
HypothesisEstimateEst.ErrorCI.LowerCI.UpperEvid.RatioPost.ProbStar
IsNonIso (IsMus = 0, IsBos = 0) < 0−0.210.25−Inf0.223.980.80
IsNonIso (IsMus = 0, IsBos = 1) > 00.270.28−0.21Inf4.700.82
IsNonIso (IsMus = 1, IsBos = 0) < 0−0.190.28−Inf0.273.110.76
IsNonIso (IsMus = 1, IsBos = 1) > 00.290.31−0.22Inf4.690.82
IsBos (IsMus = 0, IsNonIso = 0) > 00.240.36−0.35Inf2.920.74
IsBos (IsMus = 0, IsNonIso = 1) > 00.710.390.07Inf28.520.97*
IsBos (IsMus = 1, IsNonIso = 0) > 0−0.150.43−0.84Inf0.570.36
IsBos (IsMus = 1, IsNonIso = 1) > 00.330.44−0.39Inf3.470.78
IsMus (IsNonIso = 0, IsBos = 0) > 01.260.410.59Inf399.001.00*
IsMus (IsNonIso = 0, IsBos = 1) > 01.280.450.55Inf499.001.00*
IsMus (IsNonIso = 1, IsBos = 0) > 00.880.470.12Inf32.200.97*
IsMus (IsNonIso = 1, IsBos = 1) > 00.900.480.10Inf30.370.97*
LayoutNo (IsMus = 0) > 00.960.210.61InfInf1.00*
LayoutNo (IsMus = 1) > 00.890.230.51Inf7999.001.00*
PerfNo (IsMus = 0) < 0−0.010.13−Inf0.201.180.54
PerfNo (IsMus = 1) > 00.650.140.42InfInf1.00*
LayoutNo:PerfNo (IsMus = 0) > 00.040.17−0.24Inf1.390.58
LayoutNo:PerfNo (IsMus = 1) < 0−0.380.20−Inf−0.0532.470.97*
‘*’: The expected value under the hypothesis lies outside the 95% CI.
Table 3. Arpeggio training task: directional hypothesis tests for the effects of IsNonIsomorphic, IsBosanquet, and IsMusician, LayoutNo, PerfNo, and their interaction LayoutNo:PerfNo, across the conditions shown in parentheses.
HypothesisEstimateEst.ErrorCI.LowerCI.UpperEvid.RatioPost.ProbStar
IsNonIso (IsMus = 0, IsBos = 0) > 00.270.24−0.13Inf6.980.87
IsNonIso (IsMus = 0, IsBos = 1) > 00.680.290.20Inf99.000.99*
IsNonIso (IsMus = 1, IsBos = 0) > 00.240.28−0.21Inf4.250.81
IsNonIso (IsMus = 1, IsBos = 1) > 00.820.310.32Inf204.131.00*
IsBos (IsMus = 0, IsNonIso = 0) < 0−0.230.44−Inf0.492.320.70
IsBos (IsMus = 0, IsNonIso = 1) > 00.170.47−0.60Inf1.830.65
IsBos (IsMus = 1, IsNonIso = 0) > 00.690.54−0.20Inf8.800.90
IsBos (IsMus = 1, IsNonIso = 1) > 01.260.560.36Inf83.210.99*
IsMus (IsNonIso = 0, IsBos = 0) > 01.920.491.13InfInf1.00*
IsMus (IsNonIso = 0, IsBos = 1) > 01.890.521.06InfInf1.00*
IsMus (IsNonIso = 1, IsBos = 0) > 02.840.551.93InfInf1.00*
IsMus (IsNonIso = 1, IsBos = 1) > 02.980.572.02InfInf1.00*
LayoutNo (IsMus = 0) > 00.690.230.30Inf570.431.00*
LayoutNo (IsMus = 1) > 01.090.250.68InfInf1.00*
PerfNo (IsMus = 0) > 00.290.090.13Inf1332.331.00*
PerfNo (IsMus = 1) > 00.530.070.41InfInf1.00*
LayoutNo:PerfNo (IsMus = 0) > 00.080.15−0.15Inf2.530.72
LayoutNo:PerfNo (IsMus = 1) < 0−0.120.15−Inf0.124.150.81
‘*’: The expected value under the hypothesis lies outside the 95% CI.
Table 4. Arpeggio retention task: directional hypothesis tests for the effects of IsNonIsomorphic, IsBosanquet, and IsMusician, LayoutNo, PerfNo, and their interaction LayoutNo:PerfNo across the conditions shown in parentheses.
HypothesisEstimateEst.ErrorCI.LowerCI.UpperEvid.RatioPost.ProbStar
IsNonIso (IsMus = 0, IsBos = 0) > 00.060.16−0.20Inf1.870.65
IsNonIso (IsMus = 0, IsBos = 1) > 00.450.190.14Inf116.650.99*
IsNonIso (IsMus = 1, IsBos = 0) < 0−0.560.20−Inf−0.23295.301.00*
IsNonIso (IsMus = 1, IsBos = 1) > 00.670.210.33Inf2665.671.00*
IsBos (IsMus = 0, IsNonIso = 0) < 0−0.300.28−Inf0.165.970.86
IsBos (IsMus = 0, IsNonIso = 1) > 00.100.31−0.41Inf1.650.62
IsBos (IsMus = 1, IsNonIso = 0) < 0−0.360.34−Inf0.206.170.86
IsBos (IsMus = 1, IsNonIso = 1) > 00.870.400.21Inf58.260.98*
IsMus (IsNonIso = 0, IsBos = 0) > 01.710.311.21InfInf1.00*
IsMus (IsNonIso = 0, IsBos = 1) > 01.100.350.52Inf1332.331.00*
IsMus (IsNonIso = 1, IsBos = 0) > 01.650.341.09InfInf1.00*
IsMus (IsNonIso = 1, IsBos = 1) > 01.870.391.23InfInf1.00*
LayoutNo (IsMus = 0) > 00.440.130.22Inf3999.001.00*
LayoutNo (IsMus = 1) > 00.610.160.36InfInf1.00*
PerfNo (IsMus = 0) < 0−0.070.13−Inf0.142.440.71
PerfNo (IsMus = 1) > 00.290.150.06Inf47.780.98*
LayoutNo:PerfNo (IsMus = 0) < 0−0.160.14−Inf0.067.760.89
LayoutNo:PerfNo (IsMus = 1) > 00.300.150.05Inf40.030.98*
‘*’: The expected value under the hypothesis lies outside the 95% CI.
Table 5. Melody transfer task: directional hypothesis tests for the effects of IsNonIsomorphic, IsBosanquet, and IsMusician, LayoutNo, PerfNo, and their interaction LayoutNo:PerfNo across the conditions shown in parentheses.
HypothesisEstimateEst.ErrorCI.LowerCI.UpperEvid.RatioPost.ProbStar
IsNonIso (IsMus = 0, IsBos = 0, IsUnTra = 0) < 0−0.160.12−Inf0.0310.610.91
IsNonIso (IsMus = 0, IsBos = 1, IsUnTra = 0) < 0−0.050.15−Inf0.191.700.63
IsNonIso (IsMus = 1, IsBos = 0, IsUnTra = 0) < 0−0.090.13−Inf0.113.180.76
IsNonIso (IsMus = 1, IsBos = 1, IsUnTra = 0) < 0−0.250.14−Inf−0.0123.100.96*
IsNonIso (IsMus = 0, IsBos = 0, IsUnTra = 1) > 00.080.14−0.16Inf2.360.70
IsNonIso (IsMus = 0, IsBos = 1, IsUnTra = 1) > 00.320.190.01Inf21.040.95*
IsNonIso (IsMus = 1, IsBos = 0, IsUnTra = 1) < 0−0.450.17−Inf−0.17209.531.00*
IsNonIso (IsMus = 1, IsBos = 1, IsUnTra = 1) < 0−0.340.18−Inf−0.0531.520.97*
IsBos (IsMus = 0, IsNonIso = 0, IsUnTra = 0) < 0−0.130.29−Inf0.352.070.67
IsBos (IsMus = 0, IsNonIso = 1, IsUnTra = 0) < 0−0.020.30−Inf0.481.080.52
IsBos (IsMus = 1, IsNonIso = 0, IsUnTra = 0) < 0−0.360.35−Inf0.205.760.85
IsBos (IsMus = 1, IsNonIso = 1, IsUnTra = 0) < 0−0.520.35−Inf0.0613.390.93
IsBos (IsMus = 0, IsNonIso = 0, IsUnTra = 1) > 00.020.29−0.47Inf1.140.53
IsBos (IsMus = 0, IsNonIso = 1, IsUnTra = 1) > 00.260.30−0.24Inf4.330.81
IsBos (IsMus = 1, IsNonIso = 0, IsUnTra = 1) < 0−0.090.41−Inf0.591.390.58
IsBos (IsMus = 1, IsNonIso = 1, IsUnTra = 1) < 0−0.300.35−Inf0.274.240.81
IsMus (IsNonIso = 0, IsBos = 0, IsUnTra = 0) > 02.120.321.59InfInf1.00*
IsMus (IsNonIso = 0, IsBos = 1, IsUnTra = 0) > 02.190.331.65InfInf1.00*
IsMus (IsNonIso = 1, IsBos = 0, IsUnTra = 0) > 01.890.361.30InfInf1.00*
IsMus (IsNonIso = 1, IsBos = 1, IsUnTra = 0) > 01.690.371.09InfInf1.00*
IsMus (IsNonIso = 0, IsBos = 0, IsUnTra = 1) > 02.640.342.09InfInf1.00*
IsMus (IsNonIso = 0, IsBos = 1, IsUnTra = 1) > 02.110.331.56InfInf1.00*
IsMus (IsNonIso = 1, IsBos = 0, IsUnTra = 1) > 02.200.361.59InfInf1.00*
IsMus (IsNonIso = 1, IsBos = 1, IsUnTra = 1) > 01.540.370.93InfInf1.00*
LayoutNo (IsMus = 0) > 00.550.110.37InfInf1.00*
LayoutNo (IsMus = 1) > 00.320.110.14Inf379.951.00*
PerfNo (IsMus = 0) > 00.170.050.09Inf7999.001.00*
PerfNo (IsMus = 1) > 00.110.050.03Inf70.430.99*
LayoutNo:PerfNo (IsMus = 0) < 0−0.110.06−Inf−0.0133.480.97*
LayoutNo:PerfNo (IsMus = 1) < 0−0.010.06−Inf0.091.420.59
‘*’: The expected value under the hypothesis lies outside the 95% CI.
Table 6. Participant preferences for pitch layouts.
Layout Type Number of Participants
MusiciansNon-Musicians
IsomorphicWicki-like912
Bosanquet-like44
Non-isomorphicWicki-like02
Bosanquet-like38
No preference 88
No specification made 17
Table 7. Example statements for the sub-themes under Reason for layout preference.
Sub-ThemeExample StatementNumber of Statements
MusNon-Mus
Layout structure
“I found it’s more structured as to the rows 4 and then 3 and 4 before
you change into the next note.” (ID1).
158
Intuitiveness

“I felt like I could feel the notes better in this layout…Like the way my
brain put together like playing the notes and the sounds—it felt
easier to do in this layout basically.” (ID14).
45
Similarity to piano
“It was kind of like the piano, so it was easier to remember I guess because
I could do it with my fingers in the same way as for scales.” (ID22).
20
Identifying reference note

“Well for the first one [Wicki-like non-isomorphic],…I couldn’t find the
reference note. For the second one [Wicki-like isomorphic] it was easier to
know where the C was I guess or whatever the tonic was.” (ID7).
23
Practice effects

“I think because I did it the first time, so the second time was like kinda the
same thing but I had more practice. I guess I was more familiar with it by then.”
(ID44).
515
Table 8. Number of statements for each sub-theme of Reason for layout preference according to preferred layout.
Sub-ThemeIsomorphicNon-IsomorphicNo Preference
Wicki-LikeBosanquet-LikeWicki-LikeBosanquet-Like
Layout structure103055
Practice effects64262
Intuitiveness34020
Similarity to piano11000
Identifying reference note40010
Table 9. Example statements from the sub-themes under Challenging aspects.
Sub-ThemeExample StatementNumber of Statements
Layout structure
But just trying to figure out where all the notes were at, it was more of a
challenge of making something work. Like where the intervals were.” (ID24).
20
Familiarity of interface
But umm for this sort of task and especially when it’s an interface that I’m not
familiar with…because it’s so alien to me, it’s not as simple to pick up.” (ID15).
8
Pace of AV demonstration
I think sometimes the keys, with the highlighting, it flashed a little fast, like
you’re trying to catch up with it.” (ID2).
2

