Article

Design and Experiment of a Variable Spray System for Unmanned Aerial Vehicles Based on PID and PWM Control

1
Engineering Foundation Teaching and Training Center, South China Agricultural University, Guangzhou 510642, China
2
National Center for International Collaboration Research on Precision Agriculture Aviation Pesticides Spraying Technology, Guangzhou 510642, China
3
Engineering College, South China Agricultural University, Guangzhou 510642, China
*
Author to whom correspondence should be addressed.
Appl. Sci. 2018, 8(12), 2482; https://doi.org/10.3390/app8122482
Submission received: 12 October 2018 / Revised: 20 November 2018 / Accepted: 30 November 2018 / Published: 3 December 2018
(This article belongs to the Special Issue Advanced Mobile Robotics)

Abstract

:
Unmanned aerial vehicle (UAV) variable-rate spraying technology, as the development direction of aviation for plant protection in the future, has been developed rapidly in recent years. In the actual agricultural production, the severity of plant diseases and insect pests varies in different locations. In order to reduce the waste of pesticides, pesticides should be applied according to the severity of pests, insects and weeds. On the basis of explaining the plant diseases and insect pests map in the target area, a pulse width modulation variable spray system is designed. Moreover, the STMicroelectronics-32 (STM32) chip is invoked as the core of the control system. The system combines with sensor technology to get the prescription value through real-time interpretation of prescription diagram in operation. Then, a pulse square wave with variable duty cycles is generated to adjust the flow rate. A closed-loop Proportional-Integral-Derivative (PID) control algorithm is used to shorten the time of system reaching steady state. The results indicate that the deviation between volume and target traffic is stable, which is within 2.16%. When the duty cycle of the square wave is within the range of 40% to 100%, the flow range of the single nozzle varies from 0.16 L/min to 0.54 L/min. Variable spray operation under different spray requirements is achieved. The outdoor tests of variable spray system show that the variable spray system can adjust the flow rapidly according to the prescription value set in the prescription map. The proportion of actual droplet deposition and deposition density in the operation unit is consistent with the prescription value, which proves the effectiveness of the designed variable spray system.

1. Introduction

Pests and diseases of crops are a major factor affecting the yield and quality of crops, and chemical pesticides are the main means for their prevention and control. The pesticide application method currently used in China is mainly based on uniform spraying. Therefore, the utilization rate of pesticides and herbicides is still low [1]. According to statistics, as of 2017, the pesticide utilization rate in china was only 36.6%, which was lower than the level of 50% in developed countries [2,3,4,5]. The extensive use of pesticides directly endangers the ecological environment and human health. Therefore, pesticide reduction and efficiency have been realized worldwide. In the field of plant protection, the variable spray technology can be applied on demand. It has definite prospects and potentialities in improving the utilization rate of pesticides and reducing pesticide residues [6]. Chen et al. [7] developed a field information processing system based on a Beidou positioning embedded vehicle variable sprayer. The system was able to complete the spray operation according to the generated job prescription map. However, the performance of field information processing system was not completely verified by the field testing. Perez-Ruiz et al. [8] used a geospatial prescription map prepared for olive trees, along with Real-Time Kinematic-Global Positioning System (RTK-GPS)-based position information to control the spray rate. This system only implements variable spray based on tree shape, and does not combine the degree of disease and pest with tree shape. Qiu et al. [9] used a variable-pressure spray system that controls the flow rate with an electric control valve. The step responses of the five target flows were measured experimentally. The results showed that the rise time, peak time and overshoot of the nonlinear system have amplitude correlation. However, the way of regulating flow by an electronic control valve is only applicable to ground machinery. Compared with the high-speed flight of plant protection unmanned aerial vehicles (UAV), the response time of the electronic control valve has a greater impact on the system. Gonzalez et al. [10] designed a nonlinear variable spray system based on pressure regulation. By establishing the transfer function of the open-loop system, the nonlinear control of the variable spray system was realized. However, for the low volume spray of plant protection UAV, the droplet size and the effect of spraying operation will be affected by the pressure. Shahemabadi and Moayed [11] proposed an algorithm to improve the Pulse width modulation (PWM) algorithm. By controlling the rising or falling state of the valve opening corresponding to the high and low pulse levels, an adjustment range of the flow rate from 0% to 100% can be realized according to the adjustment precision of 2.5%. The response time by using pulse to adjust valve opening cannot meet the requirements of UAV high-speed flight.
At present, the precision variable spraying technology for ground plant protection machinery in China is developing more rapidly. However, the technology of agricultural aviation plant protection is still in its infancy, mainly because the plant protection UAV is faster than the ground plant protection machinery. UAV has the characteristics of high control precision and fast response speed to the variable spray system. In this study, a plant protection UAV variable spray system is designed based on the interpretation of the work prescription map. The system obtains prescription information for real-time location through graphic interpretation of plant protection UAV, and PWM-Proportional–Integral–Derivative (PID) control is used to adjust the spray volume quickly and accurately. The stability and feasibility of the system are verified by experiments, which provide a theoretical reference for the research of plant protection UAV variable spray system and extend to the field of modern agricultural aviation for plant protection.
The paper is organized as follows: Section 2 introduces the working principle of the plant protection UAV variable spray system based on prescription diagram interpretation. Section 3 introduces the components, design and simulation of PID algorithm in detail. Section 4 presents the results of the experiments and discussion. Finally, Section 5 provides the concluding remarks.

2. System Composition and Working Principle

The plant protection drone variable spray system designed by the research team is presented in Figure 1. It comprises a prescription graphic translation subsystem and a variable spraying subsystem. At first, the prescription value of the medication is interpreted by the prescription graphic translation subsystem from the prescription map of the work area. Subsequently, the prescription value is transmitted to the variable spray system. At last, the closed-loop PID control algorithm is utilized to adjust the duty cycle according to the prescription value received. By assigning a value to the single-chip timer counter, a square wave signal with an adjustable duty cycle is generated to adjust the rotation speed of the micro-diaphragm pump. Therefore, the way of variable spraying is realized. In the spray system pipeline, the flow information in the spray pipeline is fed back to the STM32 controller by the Hall flow sensor. Meanwhile, the instantaneous flow rate, real-time position, flight parameters and prescription values are displayed through the liquid crystal display (LCD).

3. System Design

3.1. Prescription Map Generation and Interpretation

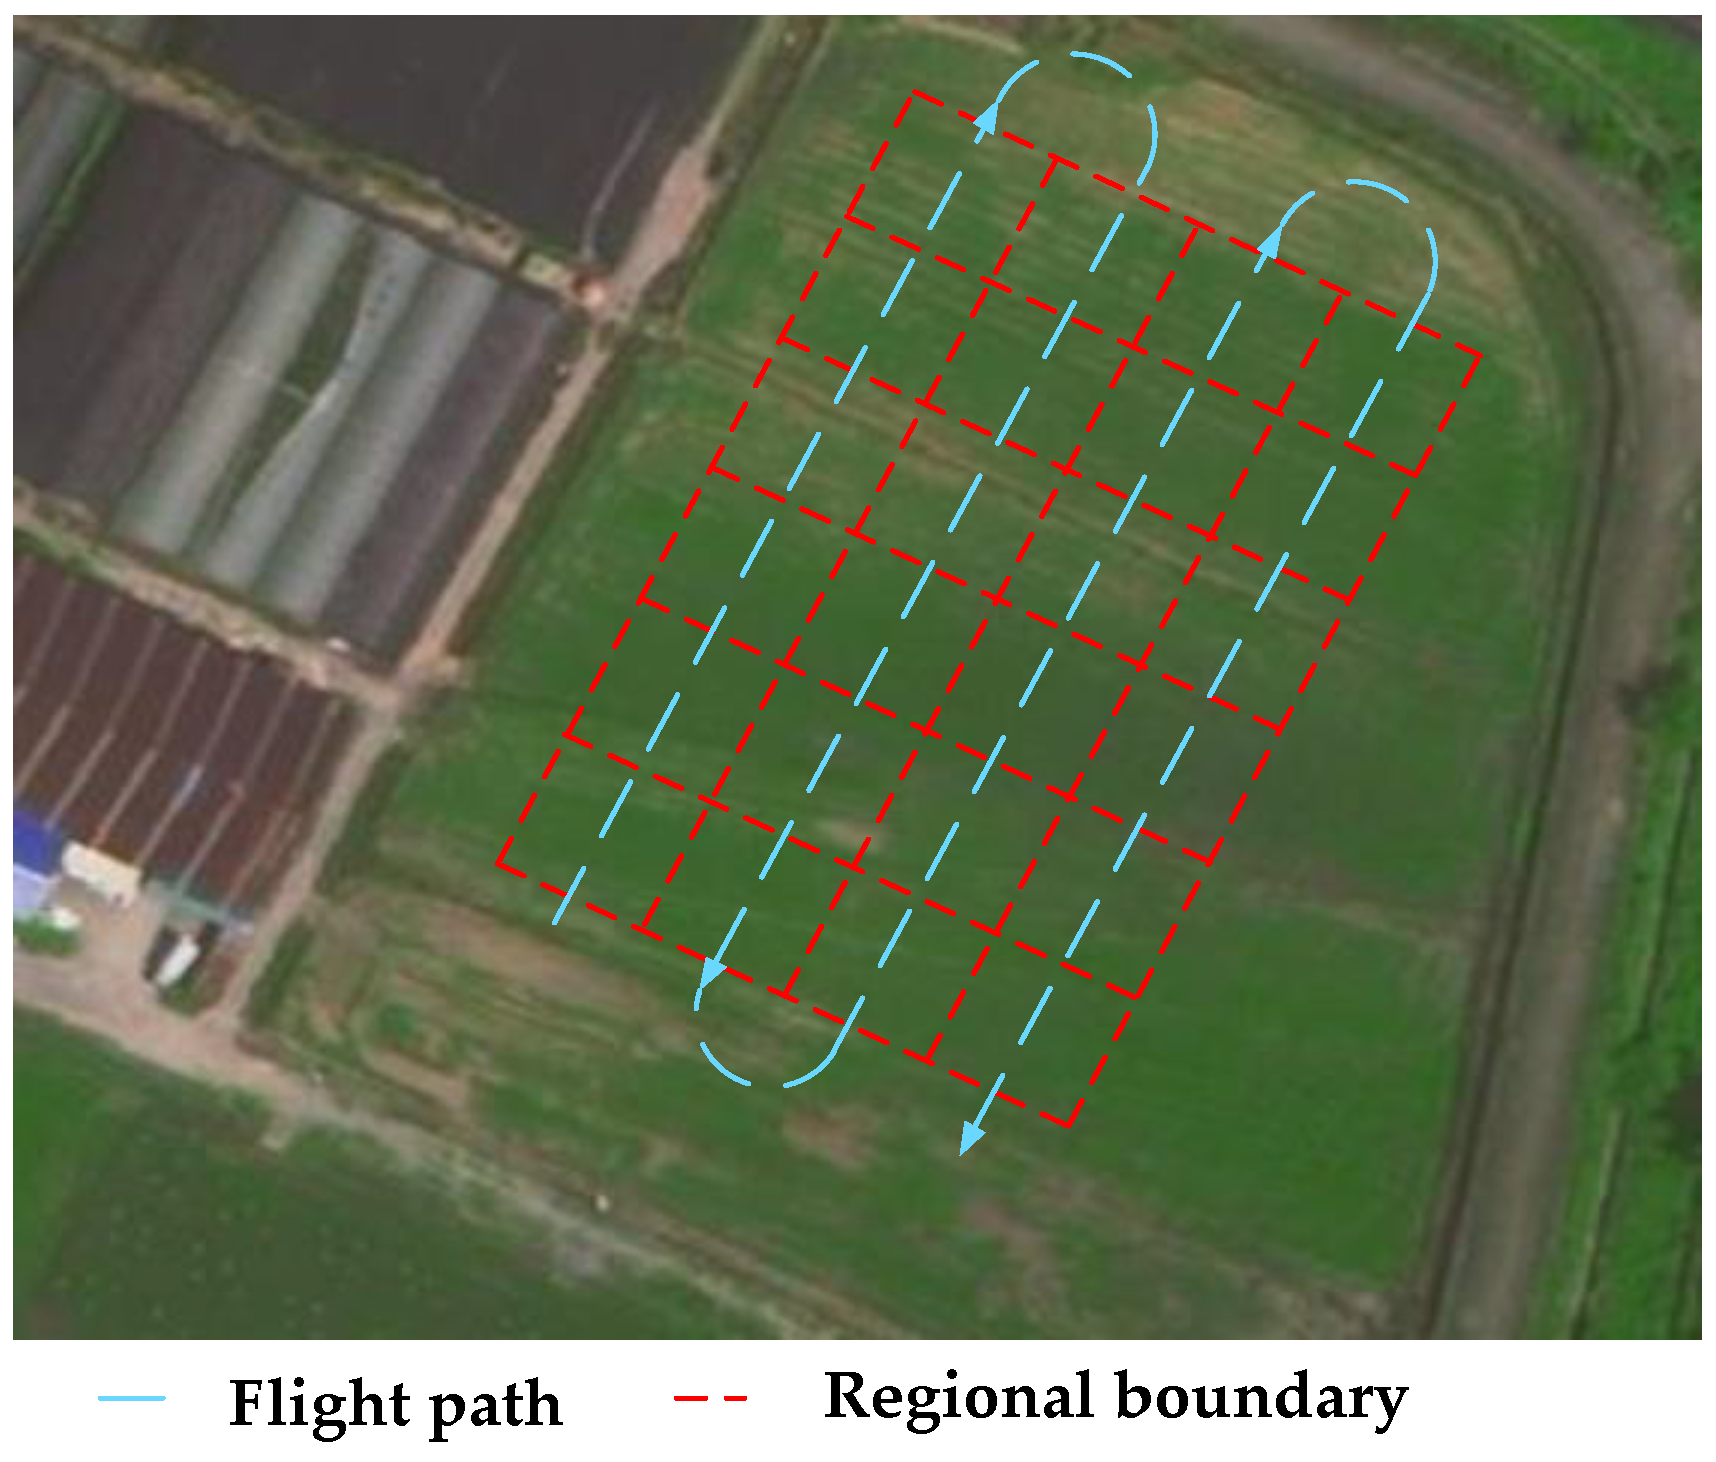
In order to get the prescription map, the ArcMap software (Environment System Research Institute, ESRI) was used to generate a prescription map with different prescription values, so that the variable spray system can be guided by the prescription map. At the same time, in order to verify the effectiveness of the system, a 40 m × 60 m field experimental field was selected in the Zengcheng Experimental Teaching Base of South China Agricultural University in Guangzhou, China (113°38′15″ E, 23°14′37″N). The target area was divided into small slices of 10 m × 10 m. The UAV flew over the center of each operation unit. The flight path and unit division are shown in Figure 2.
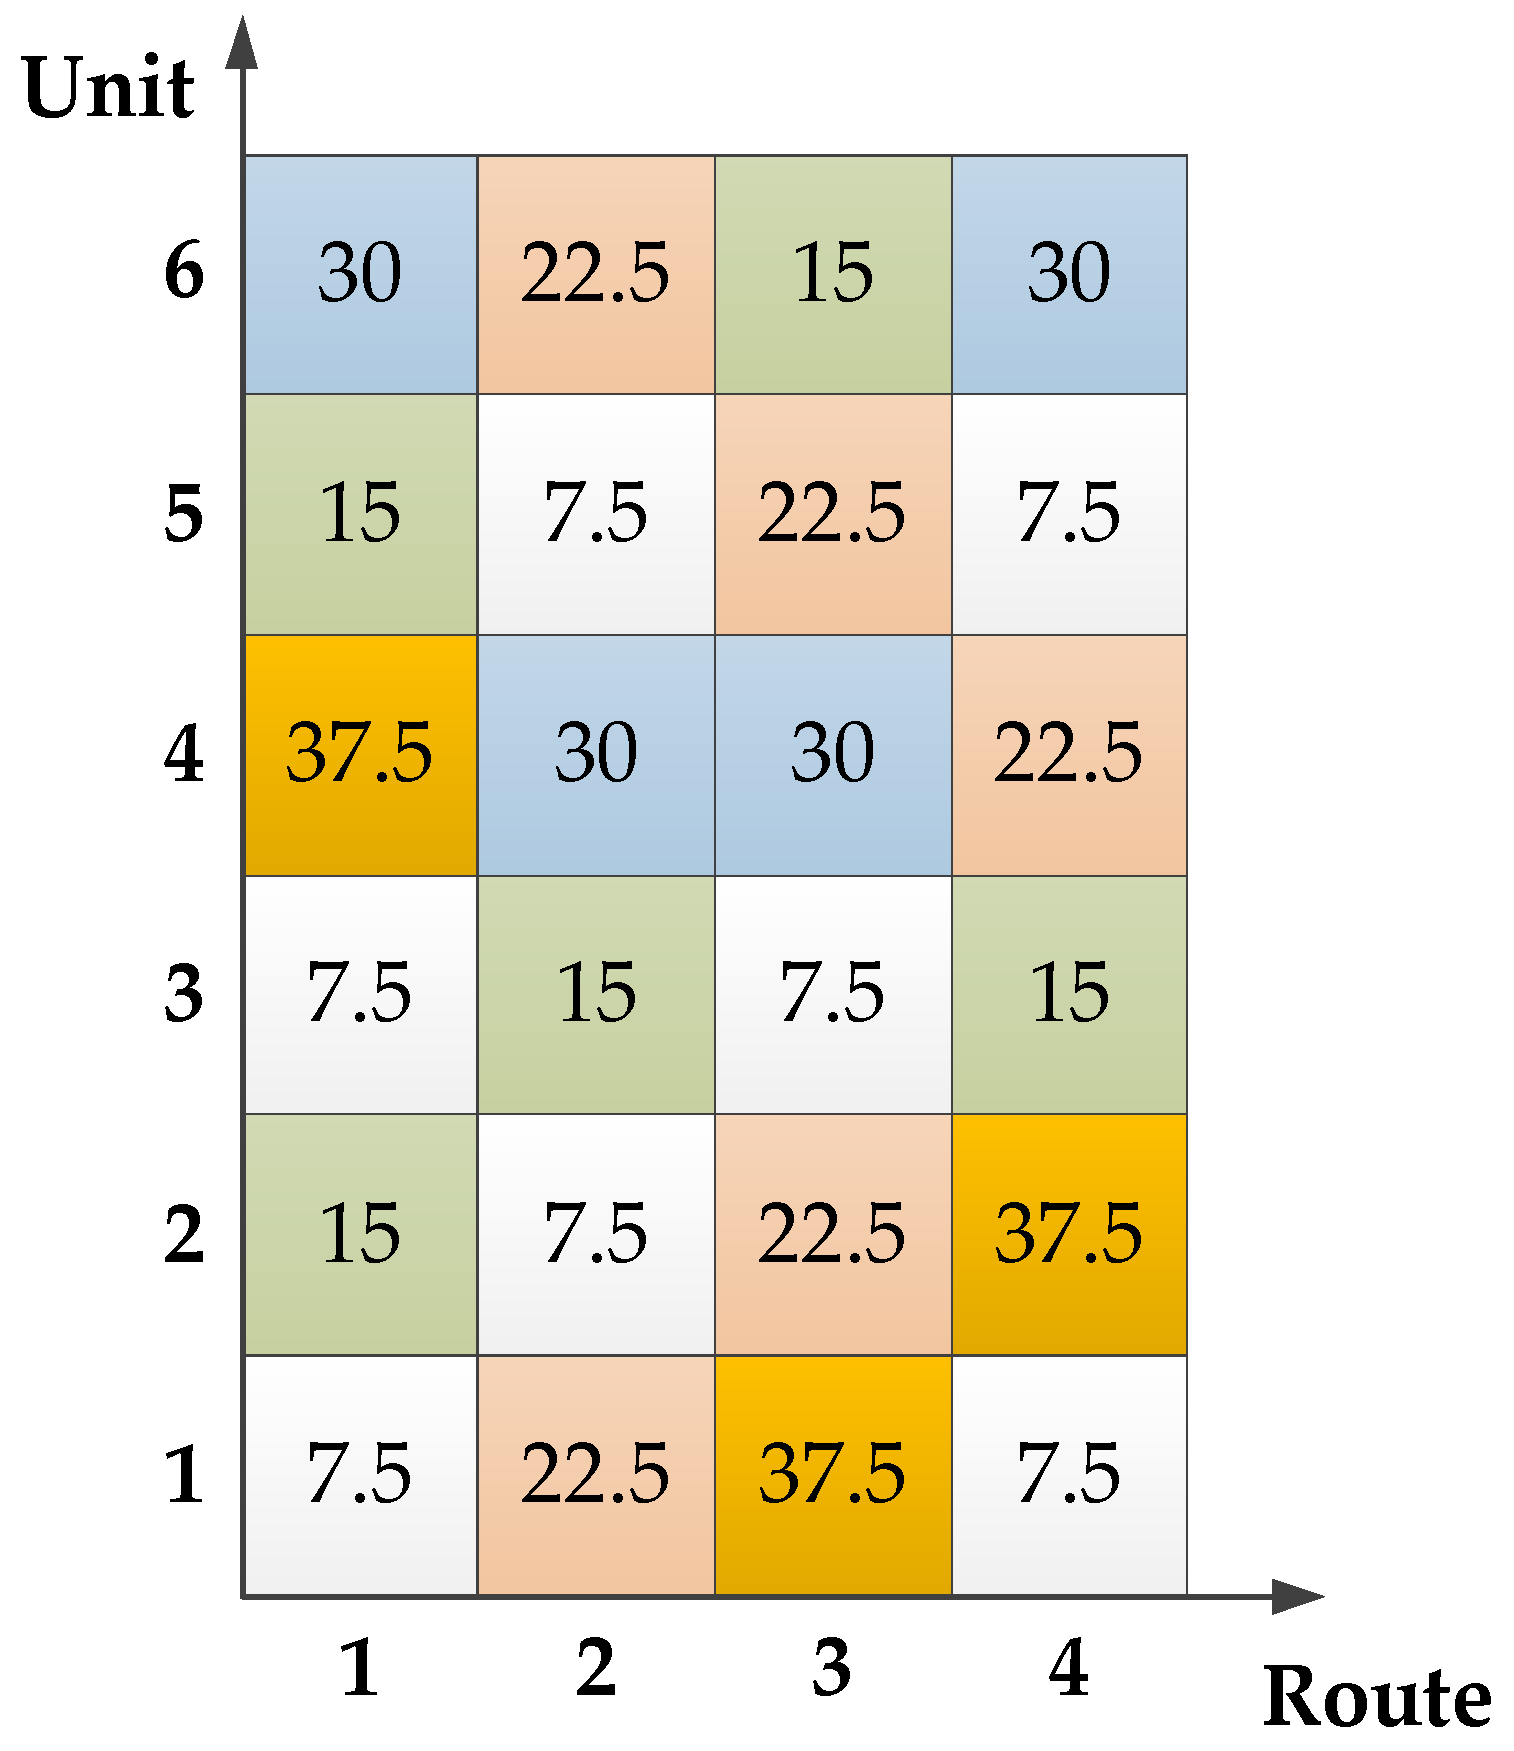
Each 10 m × 10 m area is an operational unit, and a spraying amount is presented in each operational unit. According to the performance of each component of the variable spray system, five different levels of dosage (7.5 L/hm2, 15 L/hm2, 22.5 L/hm2, 30 L/hm2, and 37.5 L/hm2) were set up. The prescription value of each operation unit was selected randomly from the above 5 gradient prescription values, which are shown in Figure 3.
Before the experiment, the working area was located by LocaSpace Viewer software (Beijing 3D Vision Technology Co., Ltd.). Then, the geographic position information of the working field was obtained, and the longitude and latitude were input into Microsoft Excel (Microsoft Corporation, USA) file. As a result, the ArcMap software was imported to generate the line map layer grid [12,13,14]. Eventually, the prescription map was created. By adding element classes to generate fishing nets, the grid can be edited and read. Finally, the longitude and latitude information of each unit and the dosage information were inserted by the linear difference method to generate the prescription map of the work area.
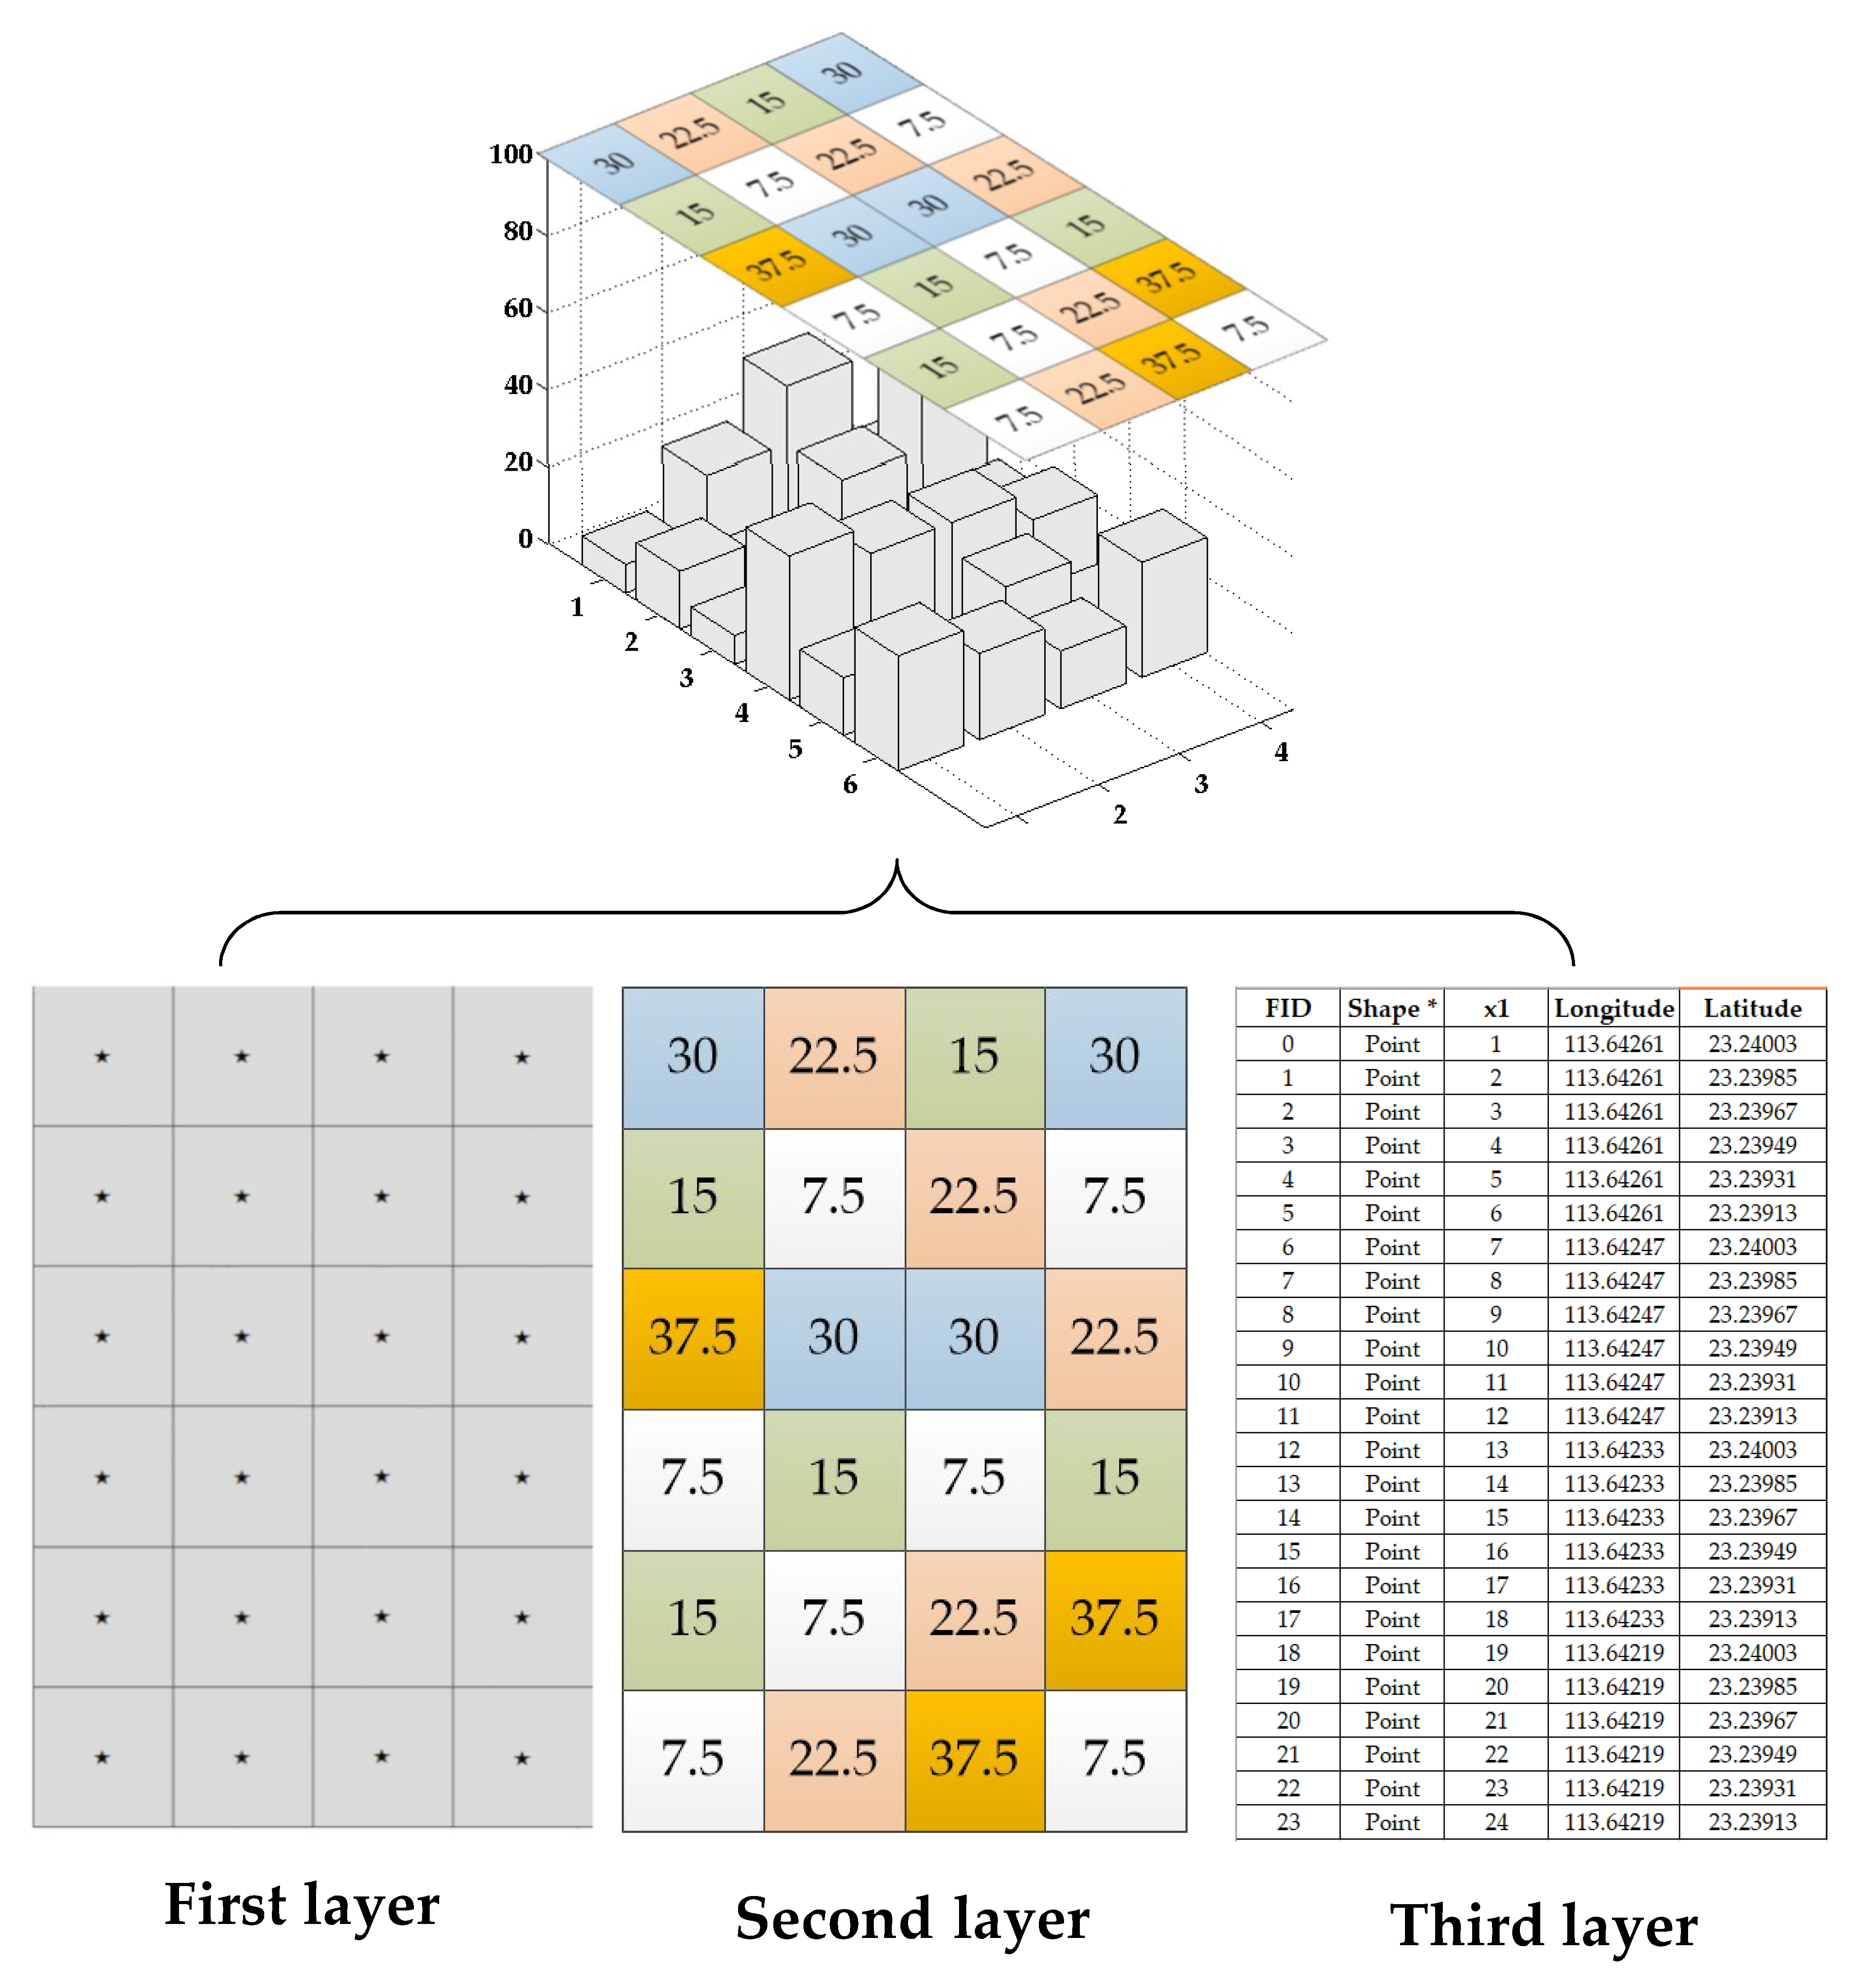
The prescription diagram mainly contains three layers of information, as shown in Figure 4. The first layer is raster information, which is a rectangular raster of equal size according to the effective spray amplitude and flight speed of UAV. The second layer is prescription value information layer, which is based on the grid dosage obtained by the expert system of pesticide application, and different colors represent different prescription values. The third level is the geographic information layer, which is mainly the latitude and longitude information of raster rows and columns.
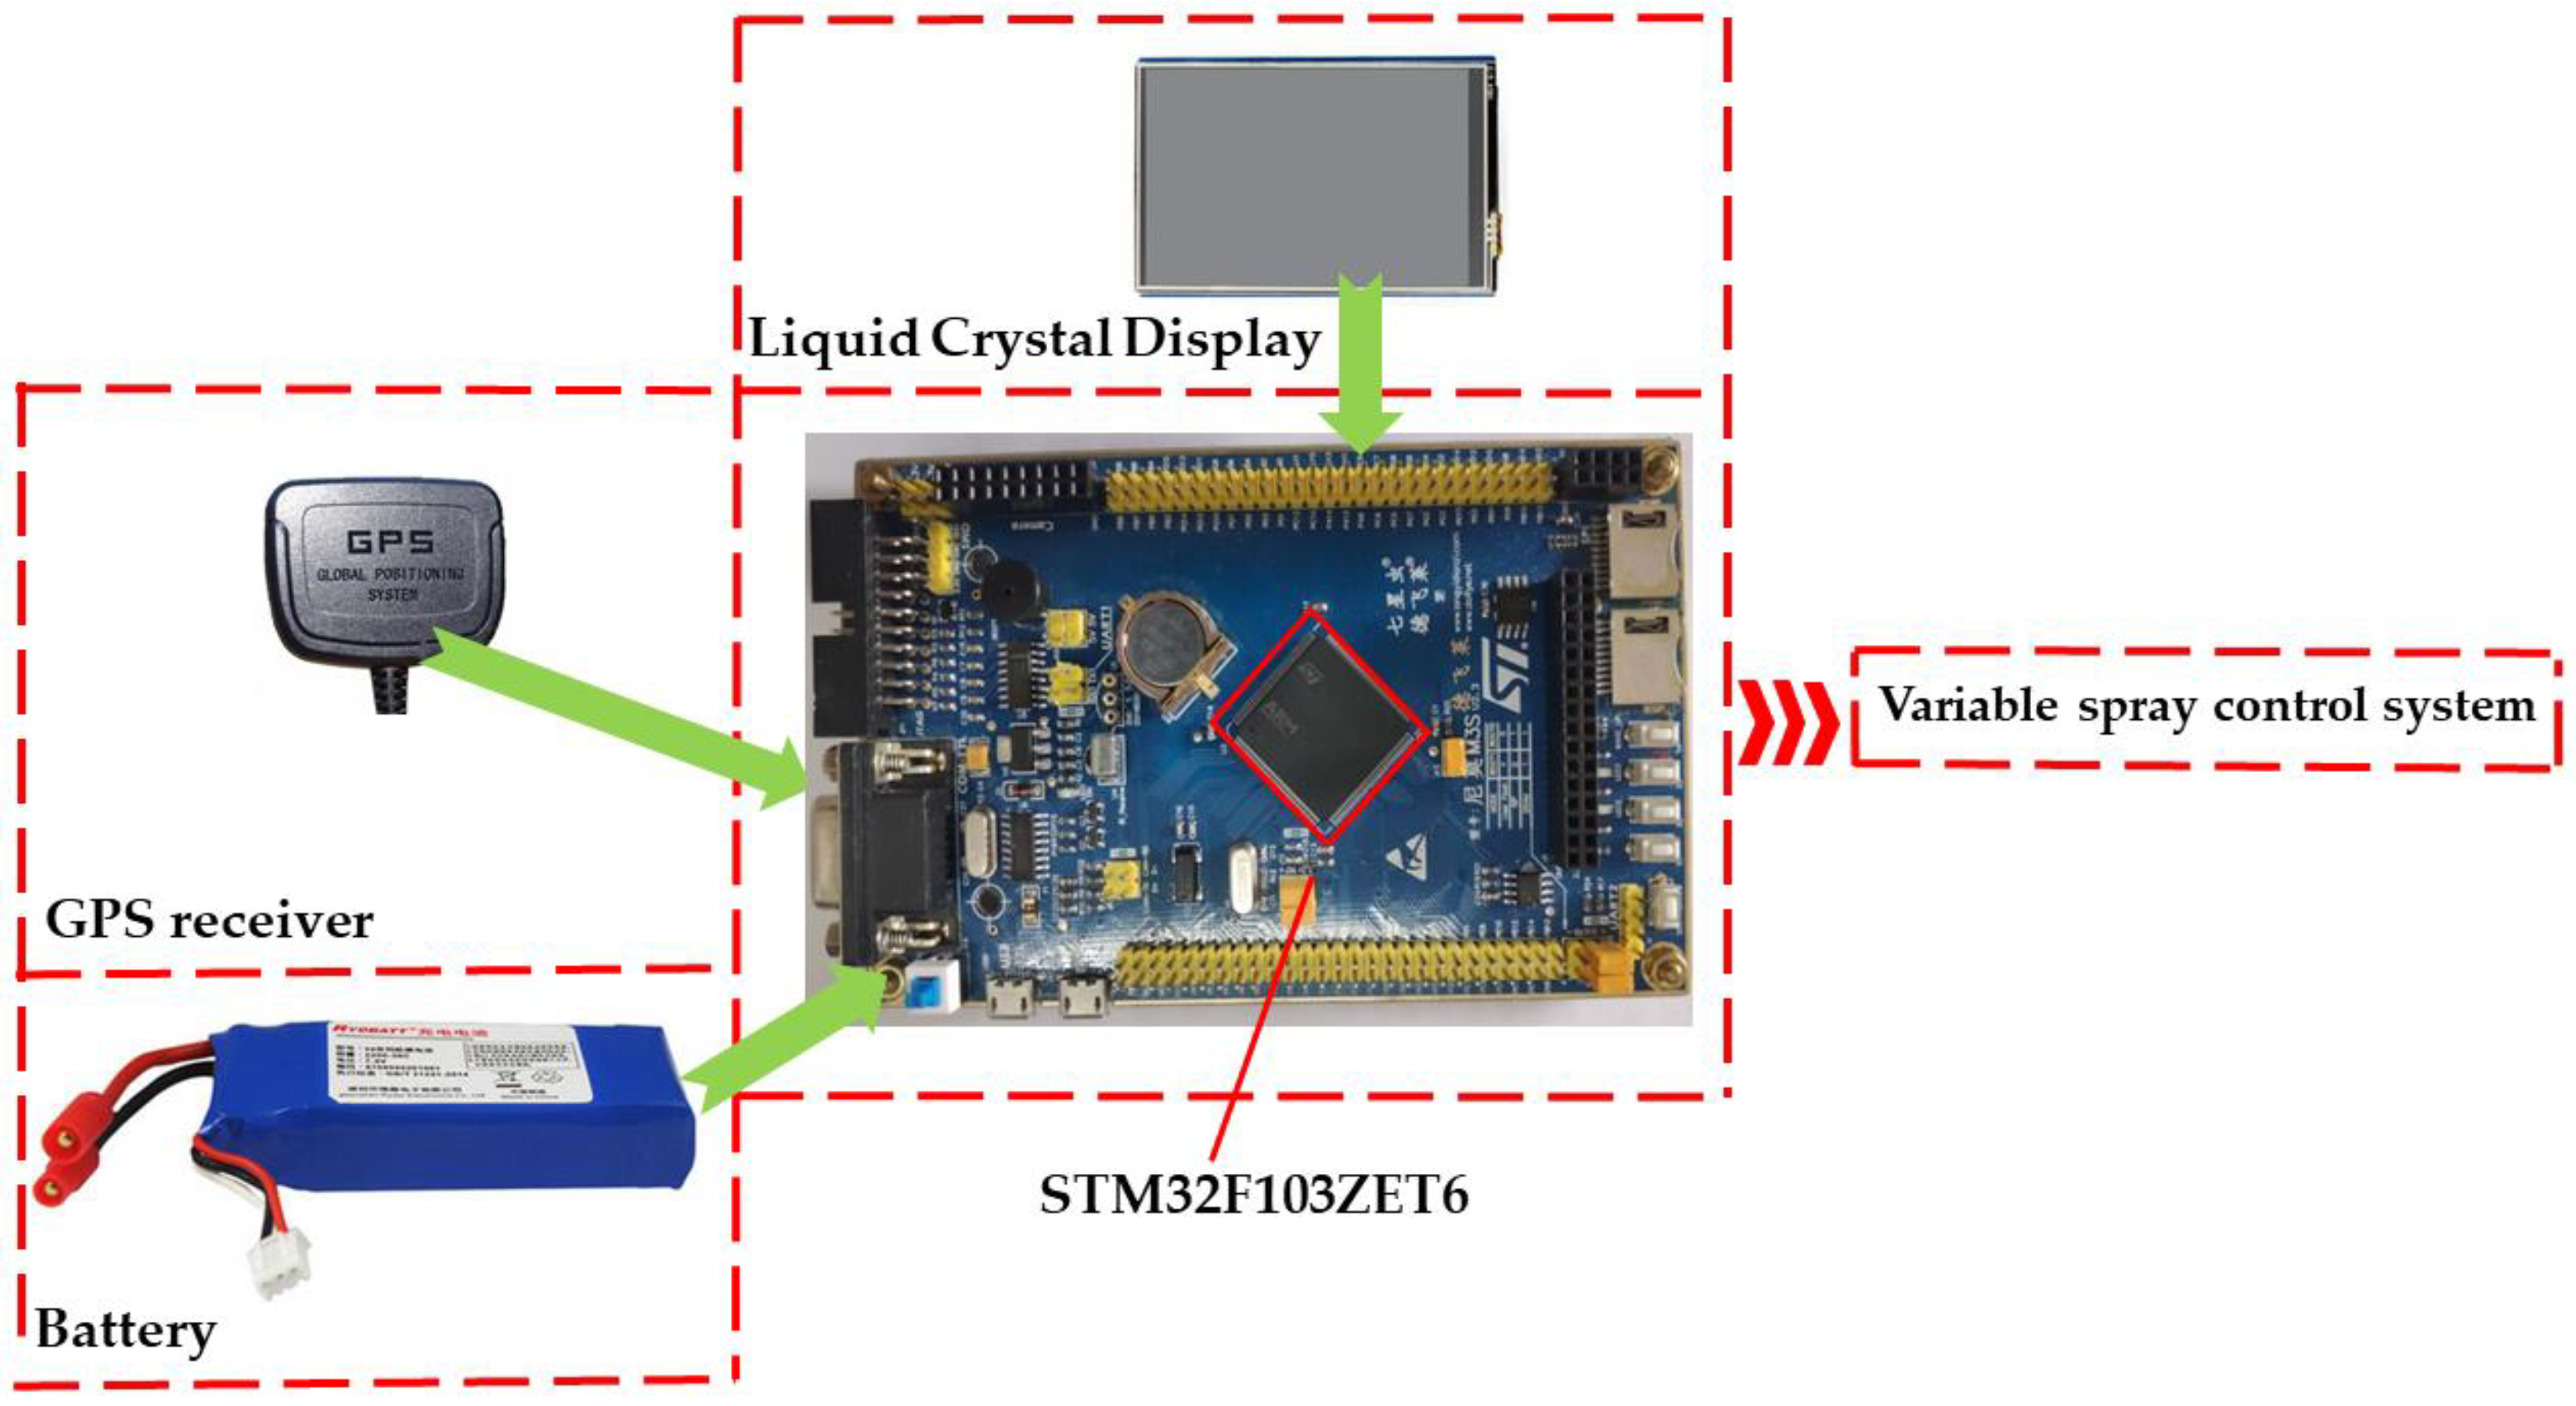
The prescription map generated by the ArcMap software simulation mainly includes information such as the latitude and longitude and the amount of spraying of each unit, and programs the information of each unit to be stored in the STM32 controller. During the spraying operation, the on-board high-precision GPS transmits the position information of the plant protection drone to the STM32 controller in real time, and matches the position information contained in the work prescription map to determine the unit area where the UAV is currently located. When the position information of UAV is successfully matched, the prescription value of the current location is obtained. The obtained spray quantity information is transmitted to the variable spray controller to perform spray operation. The schematic diagram of hardware representing the prescription graphic translation system is shown in Figure 5.

3.2. Variable Spray System Design

The overall structure of the plant protection drone variable spray system is illustrated in Figure 6. The self-developed subsystems of prescription graphic translation and spray controller were installed in the M23 UAV (Shenzhen Hi-tech New Agriculture Technologies Co, Ltd., Shenzhen, China). Along with the medicine box, a miniature diaphragm pump (PLD-2201, Shijiazhuang Prandi Co, Ltd., Shijiazhuang, China) and a pressure nozzle (110-015 types, LECHLER Company, Germany) were used. Among these, the STM32 chip (STM32F103ZET6, Langyi Electronic Technology Co, Ltd., Shanghai, China) was the spray controller core. The Hall flow sensor (MJ-HZ06K, Mocho Technology Co, Ltd., Shenzhen, China) was used to measure the flow of the system, and the measuring range of the hall flow sensor was 0.1–1 L/min.
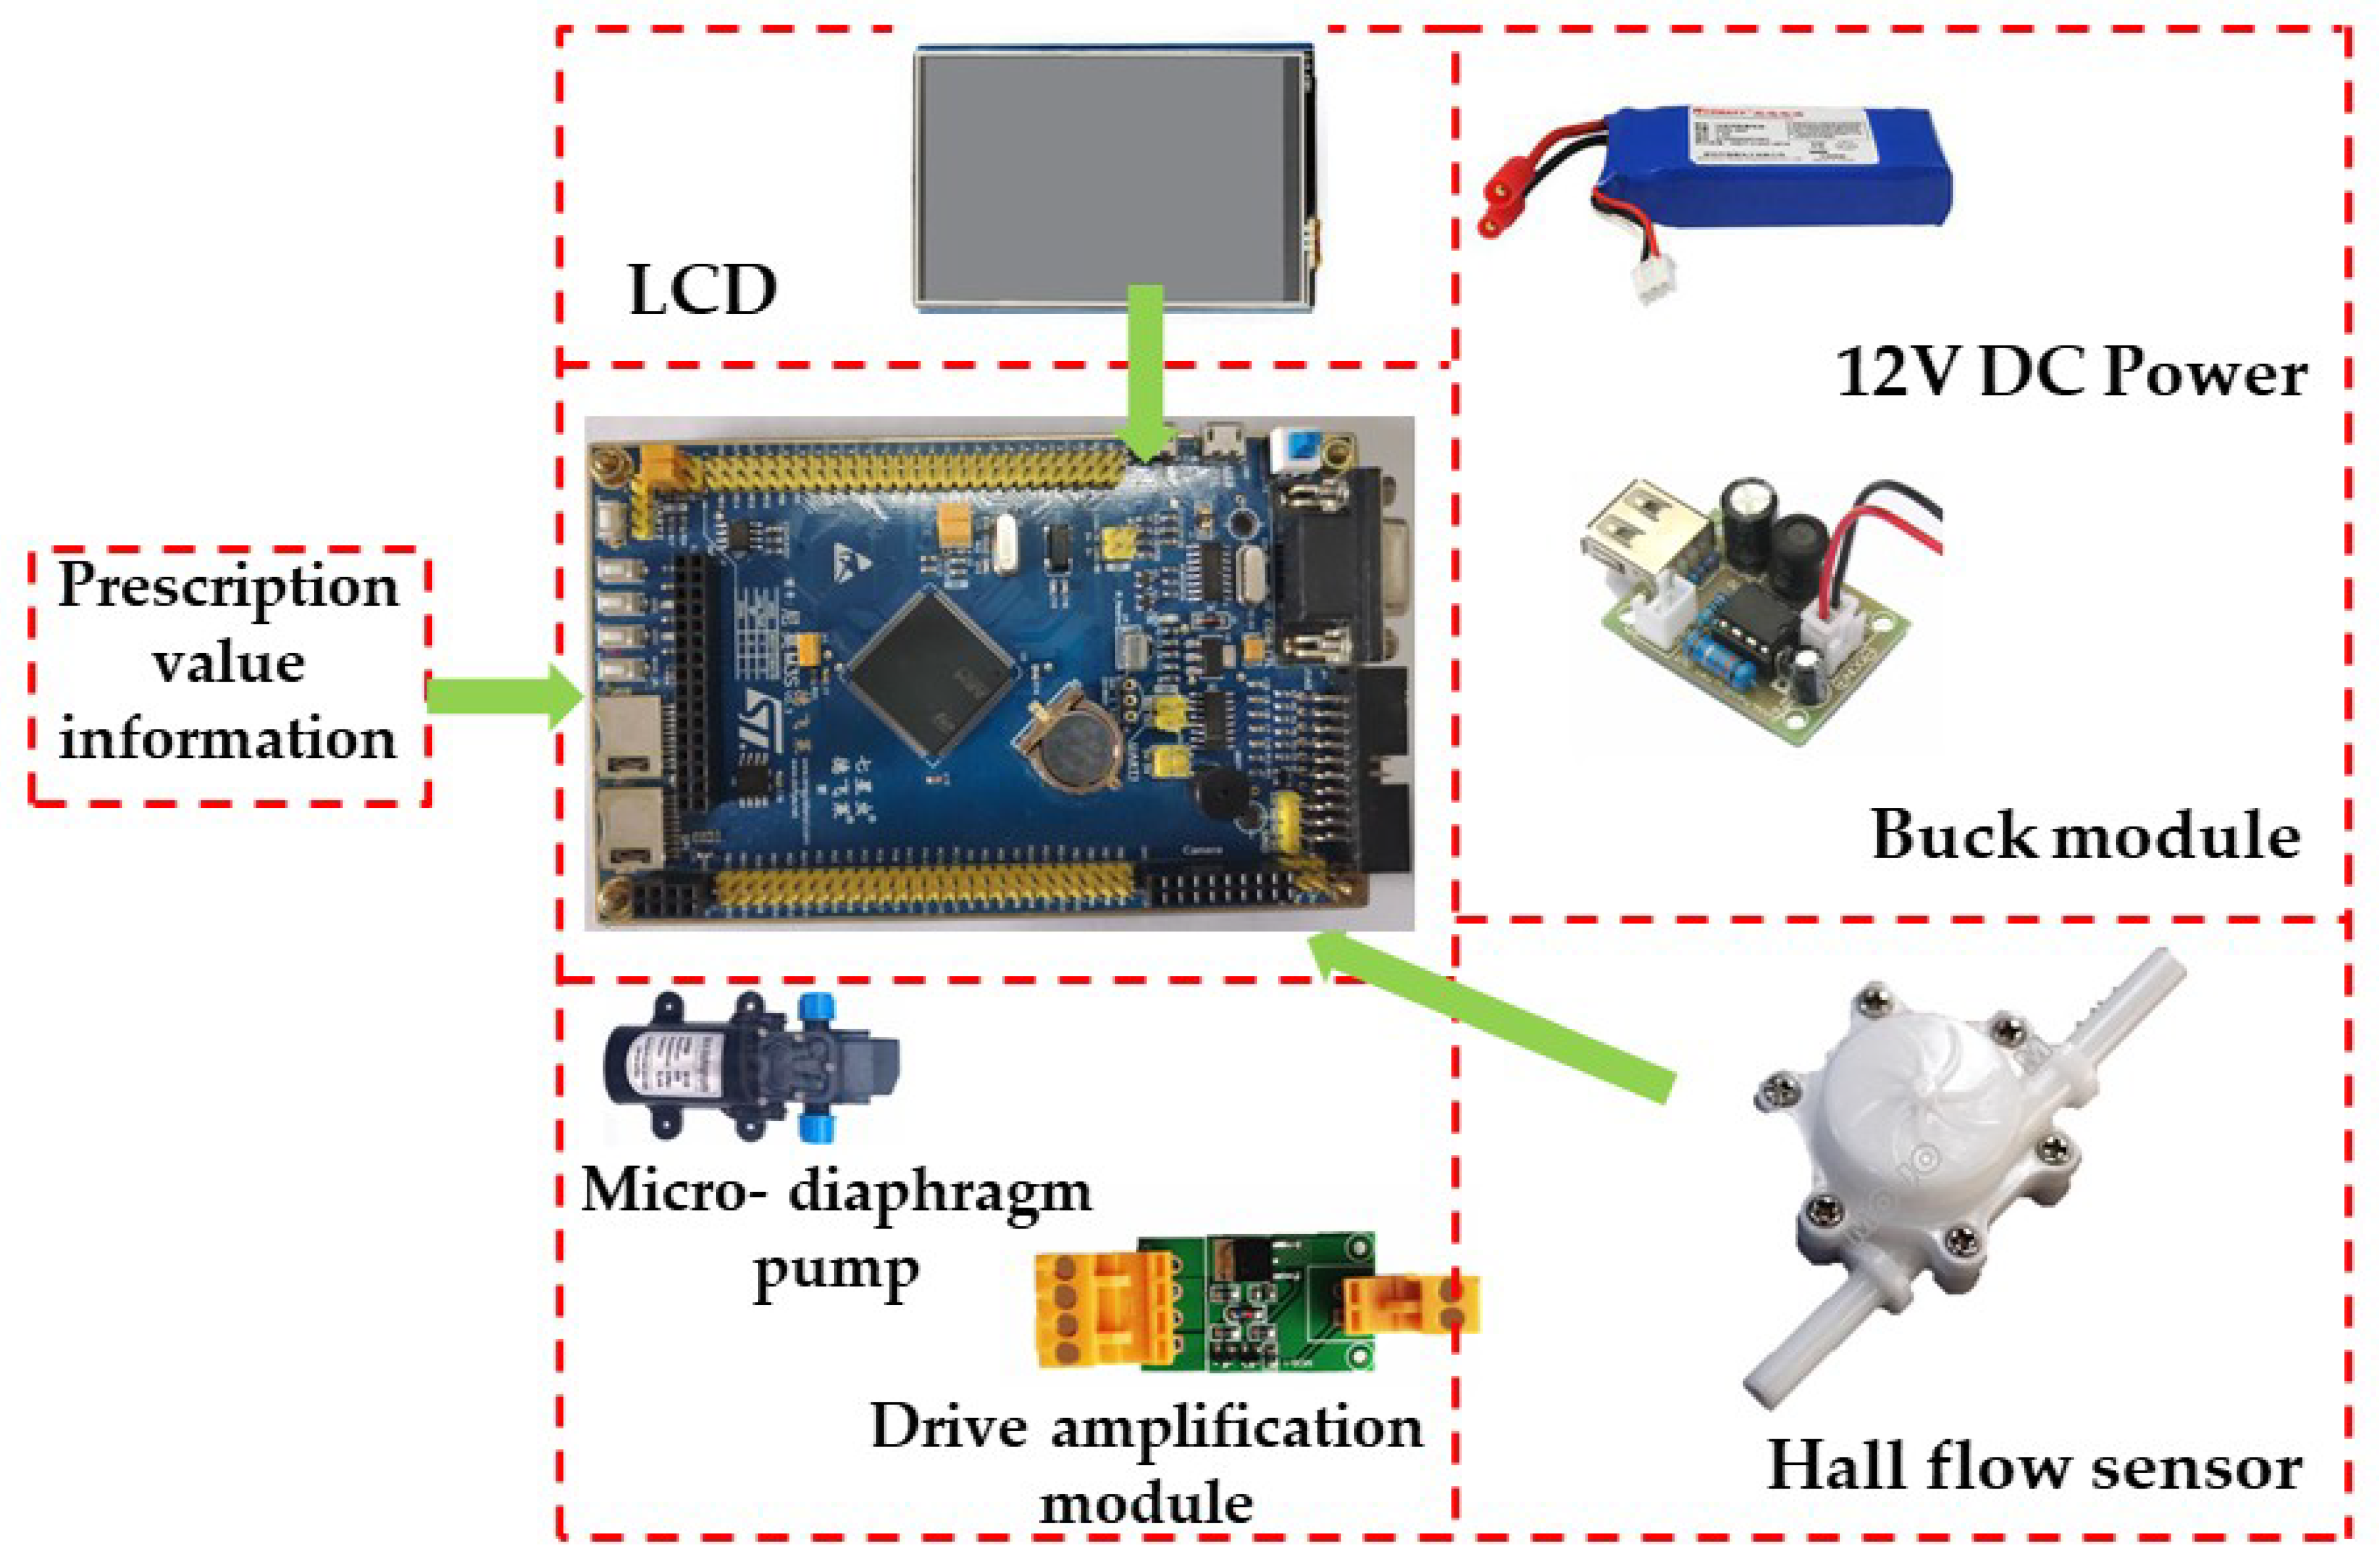
The micro-diaphragm pump was controlled by the signal sent by the interpretation system. The liquid in the medicine box was transported to the nozzles and fractured into tiny droplets under pressure. The Hall flow sensor was used to measure the flow inside the system, and the flow rate information was fed back to the spray controller. Subsequently, the PWM was adjusted according to the deviation between the actual flow and the target flow. The schematic diagram of hardware representing the variable spray controller is shown in Figure 7.

3.3. Micro-Diaphragm Pump Drive

The micro-diaphragm pump was controlled by the PWM technology. When the spray controller received the prescription value information, the high-level time was used as the percentage of the whole cycle of change, thus obtaining the PWM square wave signals with different duty cycles. Since the PWM signal generated by the STM32 series microcomputer (MCU) was 5 V and the rated voltage of the micro-diaphragm pump was 12 V, the PWM square wave output from the I/O port of the MCU cannot directly drive the micro-diaphragm pump. As a result, the driving amplification effect of the metal–oxide–semiconductor (MOS) transistor was used. Moreover, the rotation of the micro-diaphragm pump was drive by the PWM square wave signal.
When the UAV was in flight operation, the variable spray system adjusted the rotational speed of the diaphragm pump by changing the duty ratio of the PWM square wave signal according to the prescription value. As a result, the flow rate of the system was adjusted. The period of the PWM square wave signal was set to 200 ms. When the duty ratio was lower than 40%, the micro-diaphragm pump could not be started. To ensure normal operation of micro-diaphragm pump, the duty ratio changed within the range of 40% to 100% during the test. In order to measure the change of flow clearly, the duty cycle of the PWM square wave signal was increased by 5% each time.
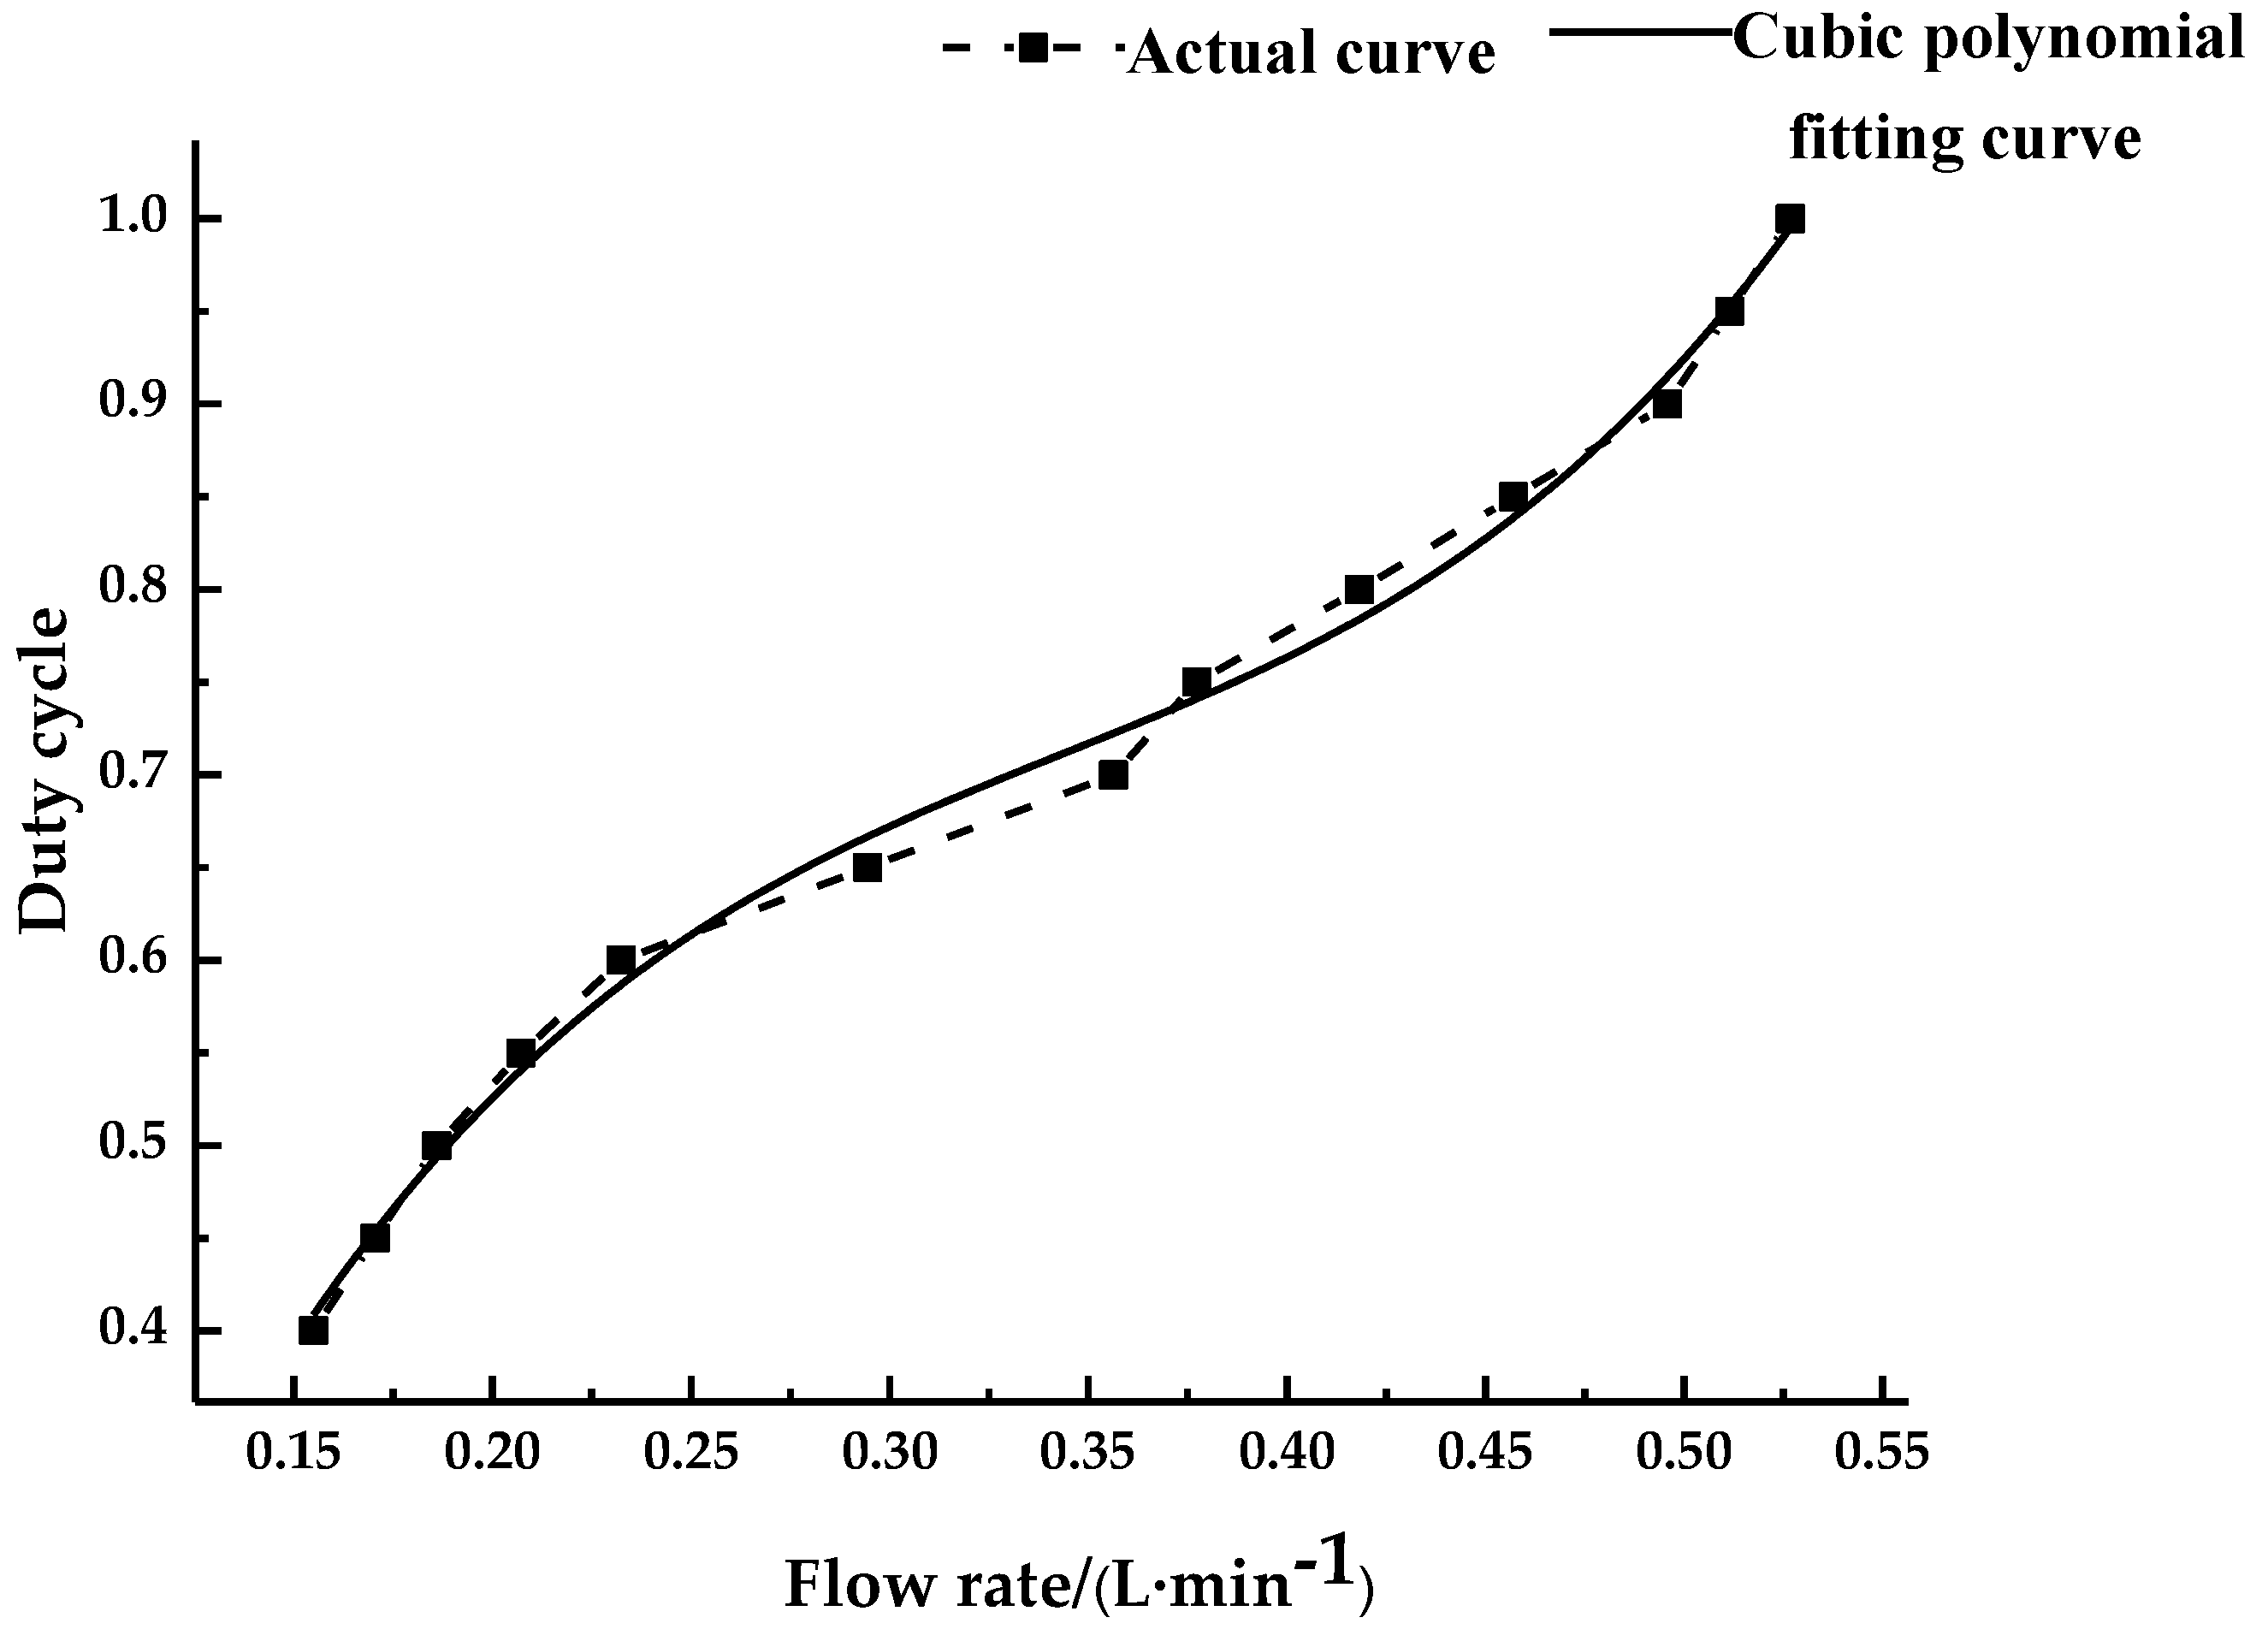
The Hall flow sensor was used to measure the single nozzle flow rate of the micro-diaphragm pump under different duty ratios. Additionally, the relationship between the flow rate of the micro-diaphragm pump and the duty ratio of PWM square wave signal was obtained. The result is shown in Figure 8. By using the cubic polynomial to fit the actual flow rate and duty cycle curve [15,16], the relationship between the flow rate of the variable system and the duty cycle of the PWM square-wave signal is:
d u t y = ( 20.776 v 3 21.452 v 2 + 8.242 v 0.431 ) × 100 %
where v is the flow rate of a nozzle in L/min, and duty is the duty cycle of the PWM square wave signal in %.

3.4. Nozzle Installation of Variable Spray System

The spray amplitude of the plant protection UAV is related to the installation distance of the nozzle. In order to get the theoretical spray size of the variable spray system designed by the project group, four standard angle sector nozzles (110-015 types, LECHLER Company, Germany) were installed side by side. The spray was gradually sharpened at the edge, and the theoretical spray angle of the nozzle was 110 degrees. The plant protection UAV spray system was dismantled and carried out by spraying with self-designed sprays. According to the basic requirement of the spray nozzle, the installation space of the adjacent sprinkler must be more than 50 cm, and thus a better spraying effect can be obtained when spraying [17,18]. Therefore, the installation space of the nozzle of the project group was 50 cm. A schematic diagram of the nozzle installation is shown in Figure 9.
It can be seen from Figure 9 that the equation to calculate the spray width of a single nozzle is:
d = 2 h tan θ 2
where d is the nozzle spray of the corresponding height in m; h is the height of the nozzle at the tip of the crop in m; and θ is the number of spray angles in °.
In order to achieve a uniform spraying effect, the complementary spraying range of the nozzle should be 25–30% of the single spraying range [19,20]. As shown in Figure 9, when the adjacent two nozzles are located in the complementary region, the effective spraying range of the four nozzles is 25% of the single spraying range. The effective pray width of the four nozzles can be expressed as:
D = 11 2 h tan θ
The height of the plant protection UAV is the height of the GPS from the ground. The height of rice, wheat and other crops is about 50 cm. The spray bar designed by the research team was installed on the frame of the drone. The height of the nozzle is about 70 cm away from the GPS. Therefore, when the flying operation height of the drone is about 2 m, regardless of the influence of other external environmental factors, it can be discerned from Equation (3) that the effective spray width of the four nozzles is about 6 m.

3.5. Control Program Design of Variable Spray System

The program was utilized to control the variable spray system and process various signals. It was written in Keil Software (ARM Germany GmbH, USA), which was mainly composed of the PWM duty cycle adjustment module, serial communication module, LCD module and PID control module. The program control flow chart is shown in Figure 10. When the system works, the GPS communication protocol (NMEA0183) is used to analyze the information acquired by the GPS in real time [21], so the position information of the current plant protection drone is obtained. Then, the prescription value is extracted through the prescription graphic translation system which processes the information. The prescription values are sent to the variable spray system. When the variable spray system receives the prescription value information, the timing and counter are turned on. The number of pulses of the flow sensor is fed back every 50 ms, and the current system instantaneous flow is obtained through calculation. The deviation between the instantaneous flow rate and the target flow of the system is used as the input of the PID controller. After the PID control algorithm is operated, a duty value is output, and the variable spray controller generates a PWM square wave with the corresponding duty ratio.

3.6. PID Control Algorithm

Due to the fact that the actual spray operation is affected by many factors, the system has a certain delay from receiving the flow change signal to adjusting the flow to the target value. Therefore, the actual flow will fluctuate around the target flow. The PID control algorithm is based on a control law of the system error. The algorithm is an optimal control adjusted by proportion (P), integration (I), and differentiation (D). It has the characteristics of a simple principle, high control precision, easy implementation and strong practicability [22]. The PID control algorithm has obvious effects on the process of the dynamic system calibration of continuous systems. In order to accurately control the flow of the system and ensure the accuracy and stability of the variable spray operation, the PID control algorithm is used to achieve the closed-loop control of the system [23]. The equation of PID control is as follows:
u ( k ) = K P e ( k ) + T K P T I i = 0 k e ( i ) + K P T D e ( k ) e ( k 1 ) T = K P e ( k ) + K I i = 0 k e ( i ) + K D [ e ( k ) e ( k 1 ) ]
where KP is the proportional gain; KI = TKP/TI is the integral time constant; KD = KPTD is the differential time constant; u(k) is the output of the control system at sampling time k; e(k) is the system output deviation from the input quantity at sampling time k, and is described as e(k) = y(k) − r(k), y(k) is the output feedback value, and r(k) is the reference input value.
The flow control process of the miniature diaphragm pump has the characteristics of large inertia lag and time variance. The process of adjusting the variable spray of the micro-diaphragm pump can be described as a second-order pure lag system. The transfer function is as follows:
G ( s ) = C ( s ) R ( s ) = K e τ s ( T 1 s + 1 ) ( T 2 s + 1 )
where K is the amplification factor; τ is the pure lag time in second; T1 and T2 are time coefficients.
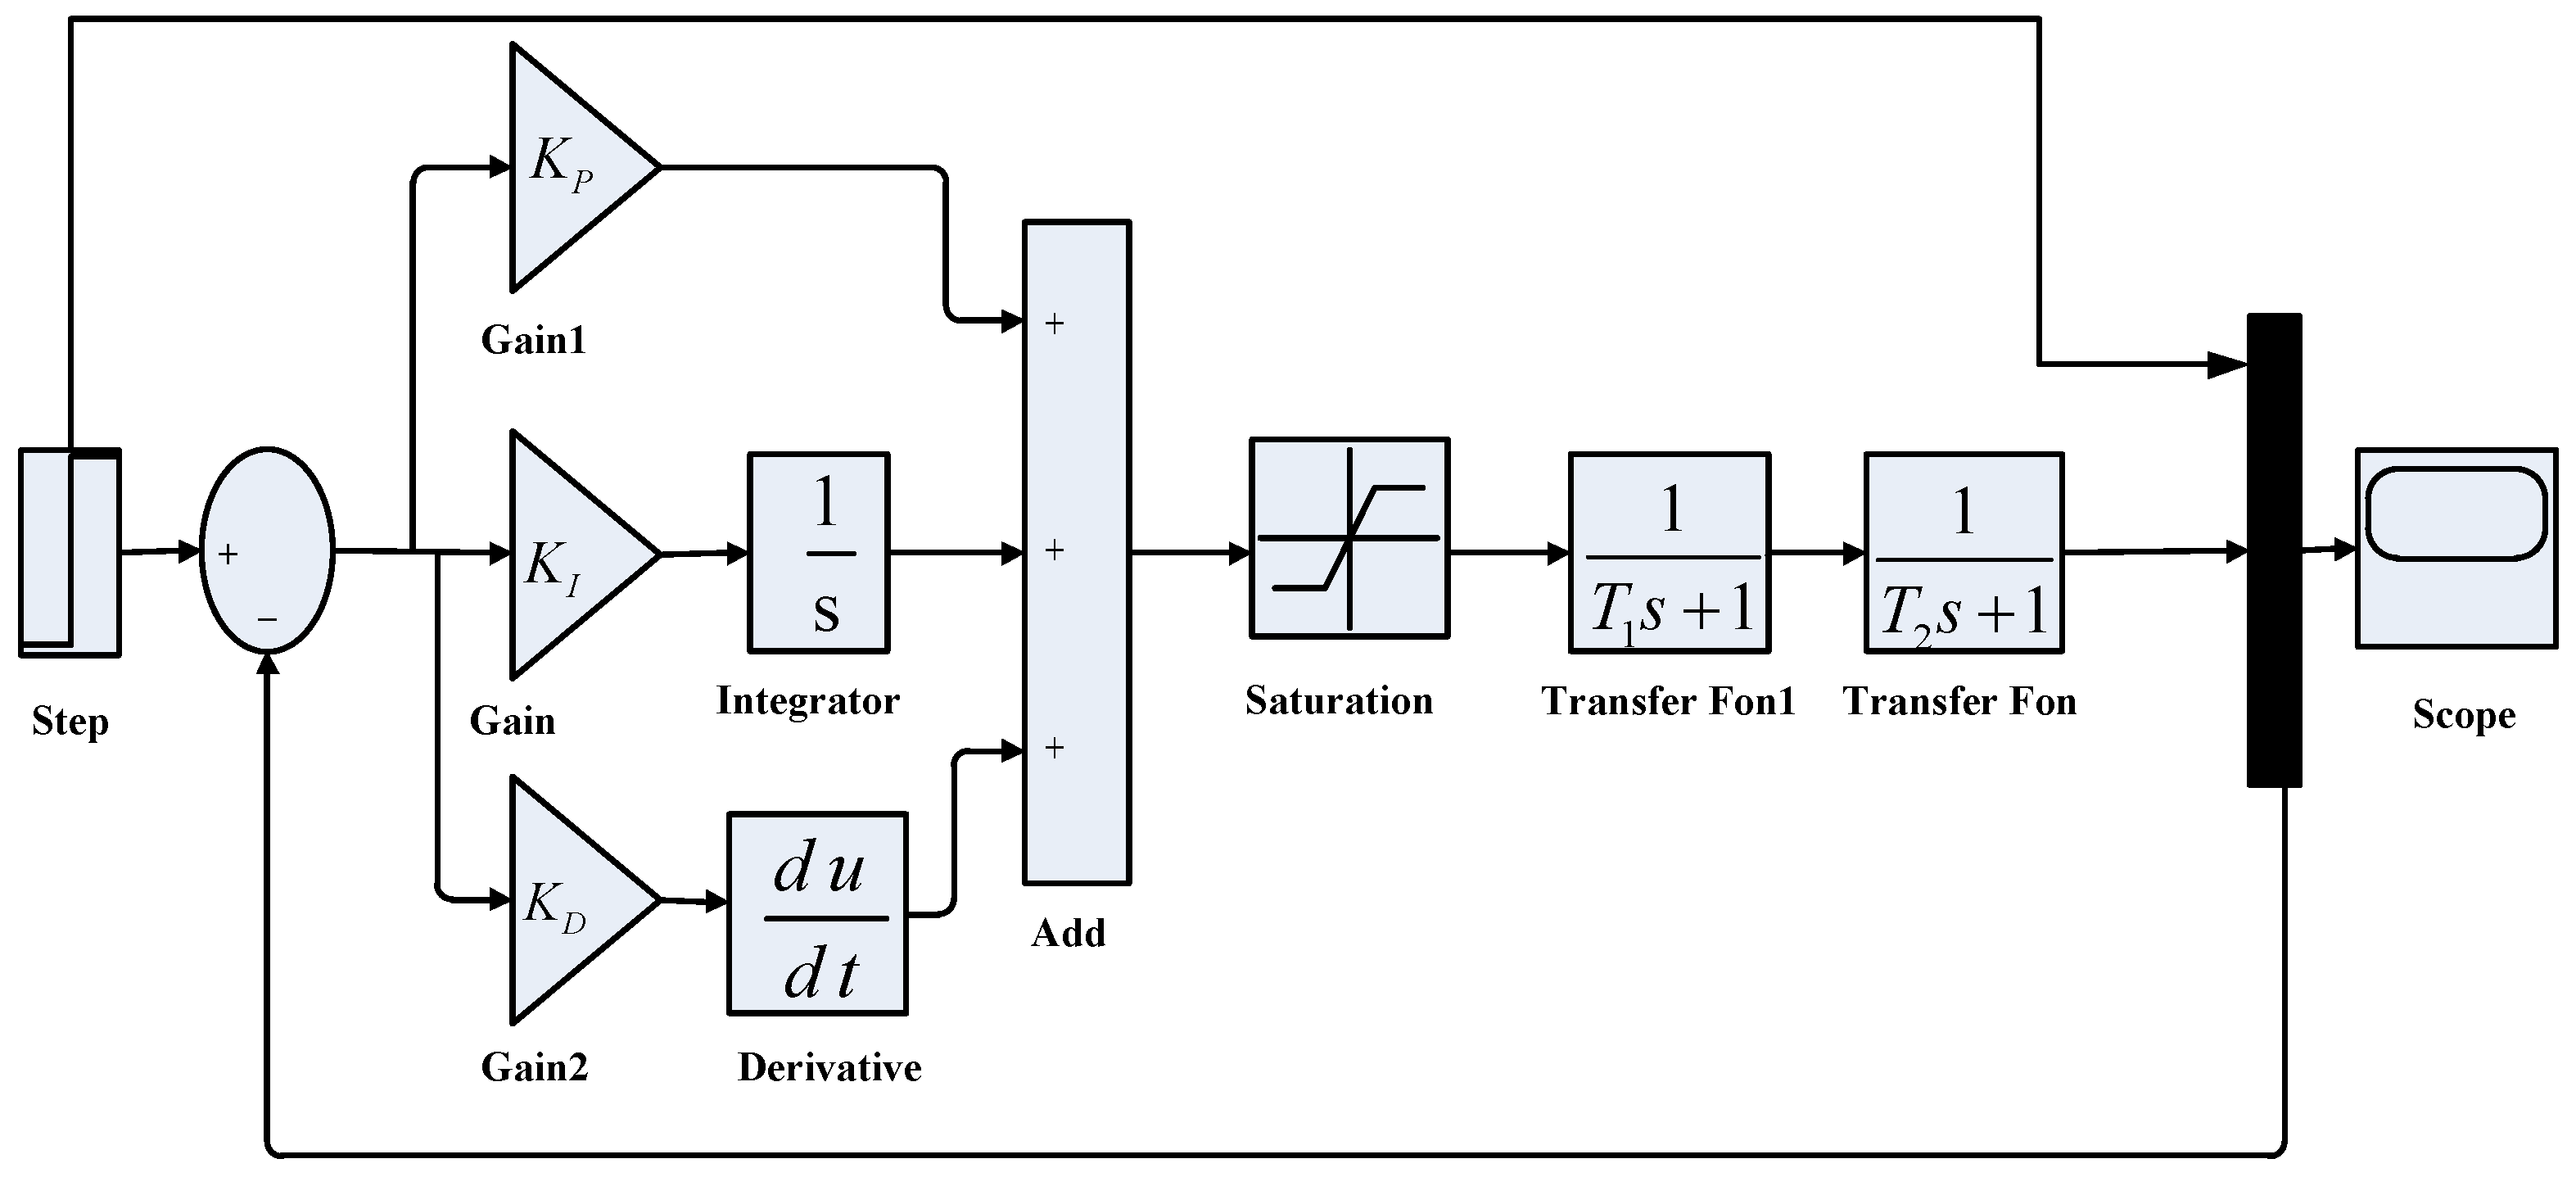
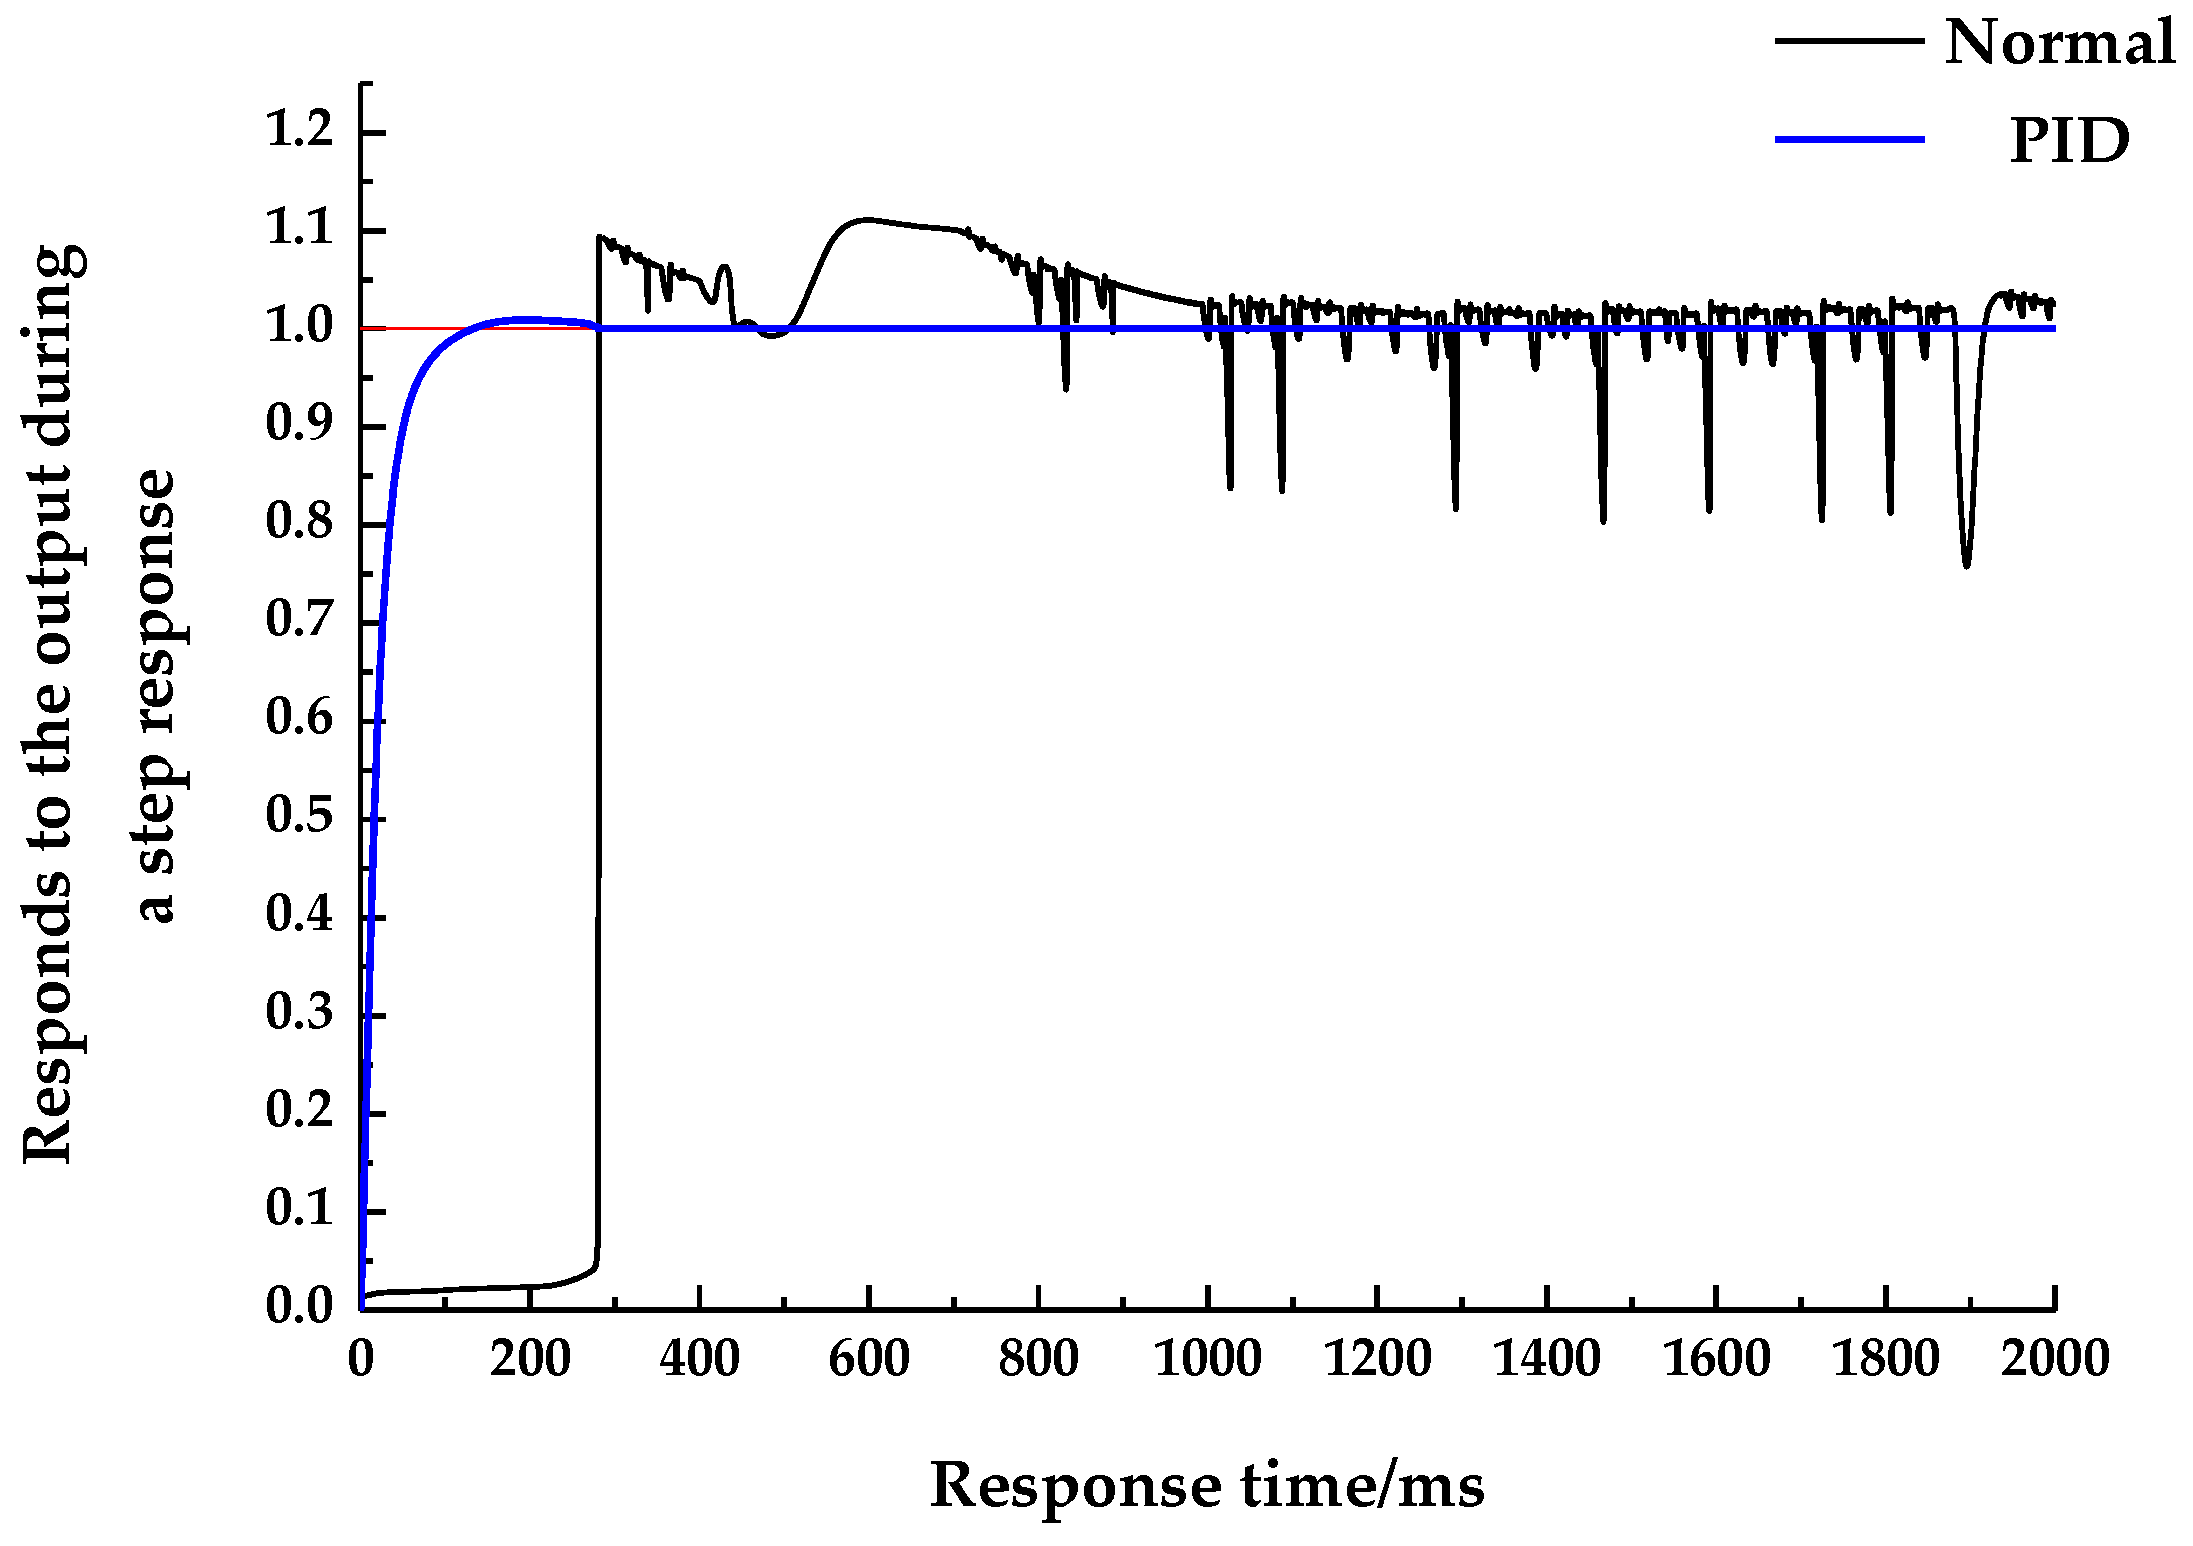
In the process of adjusting the flow rate of the diaphragm pump, K, τ, T1 and T2 are closely related to the performance of the system components and environmental factors [24]. The numerical value of the parameters was obtained through simulation. Therefore, the value of the amplification factor K is 1, the value of the pure lag time τ is 0.25, and the values of the time constants T1 and T2 are 0.05 and 1.849, respectively. The variable spray system PID control model was created by the simulink component of MATLAB software (MathWorks, USA), as shown in Figure 11. According to the simulation model, when the given signal is a unit step signal, the PID simulation coefficient is debugged by the optimized parameter design method to obtain the optimal control effect. In actual use, the algorithm needs to be run through the STM32 chip. After repeated simulation and experiments, the values of KP, KI, and KD are set to 6, 0.8, and 0.5, respectively. When the input is the unit “1”, the response curve obtained from the step response output of the system is shown in Figure 12.
According to the step response curve of the system in Figure 12, the target flow is set to “1”. When the PID algorithm is not added, the system receives the change signal of the flow and has a certain delay in response. About 300 ms of time is needed to change the flow to the target value; moreover, after reaching the target value, the actual flow value fluctuates around the target value, which has a certain deviation from the target flow. However, after the PID control, the response time is shortened to about 15 ms. At the same time, the actual flow reaches the target flow value and then stabilizes in the vicinity of the target value. To a certain extent, the system response speed and stability are improved.

4. Experiment

4.1. Effect of Duty Ratio on Droplet Size and Spray Angle

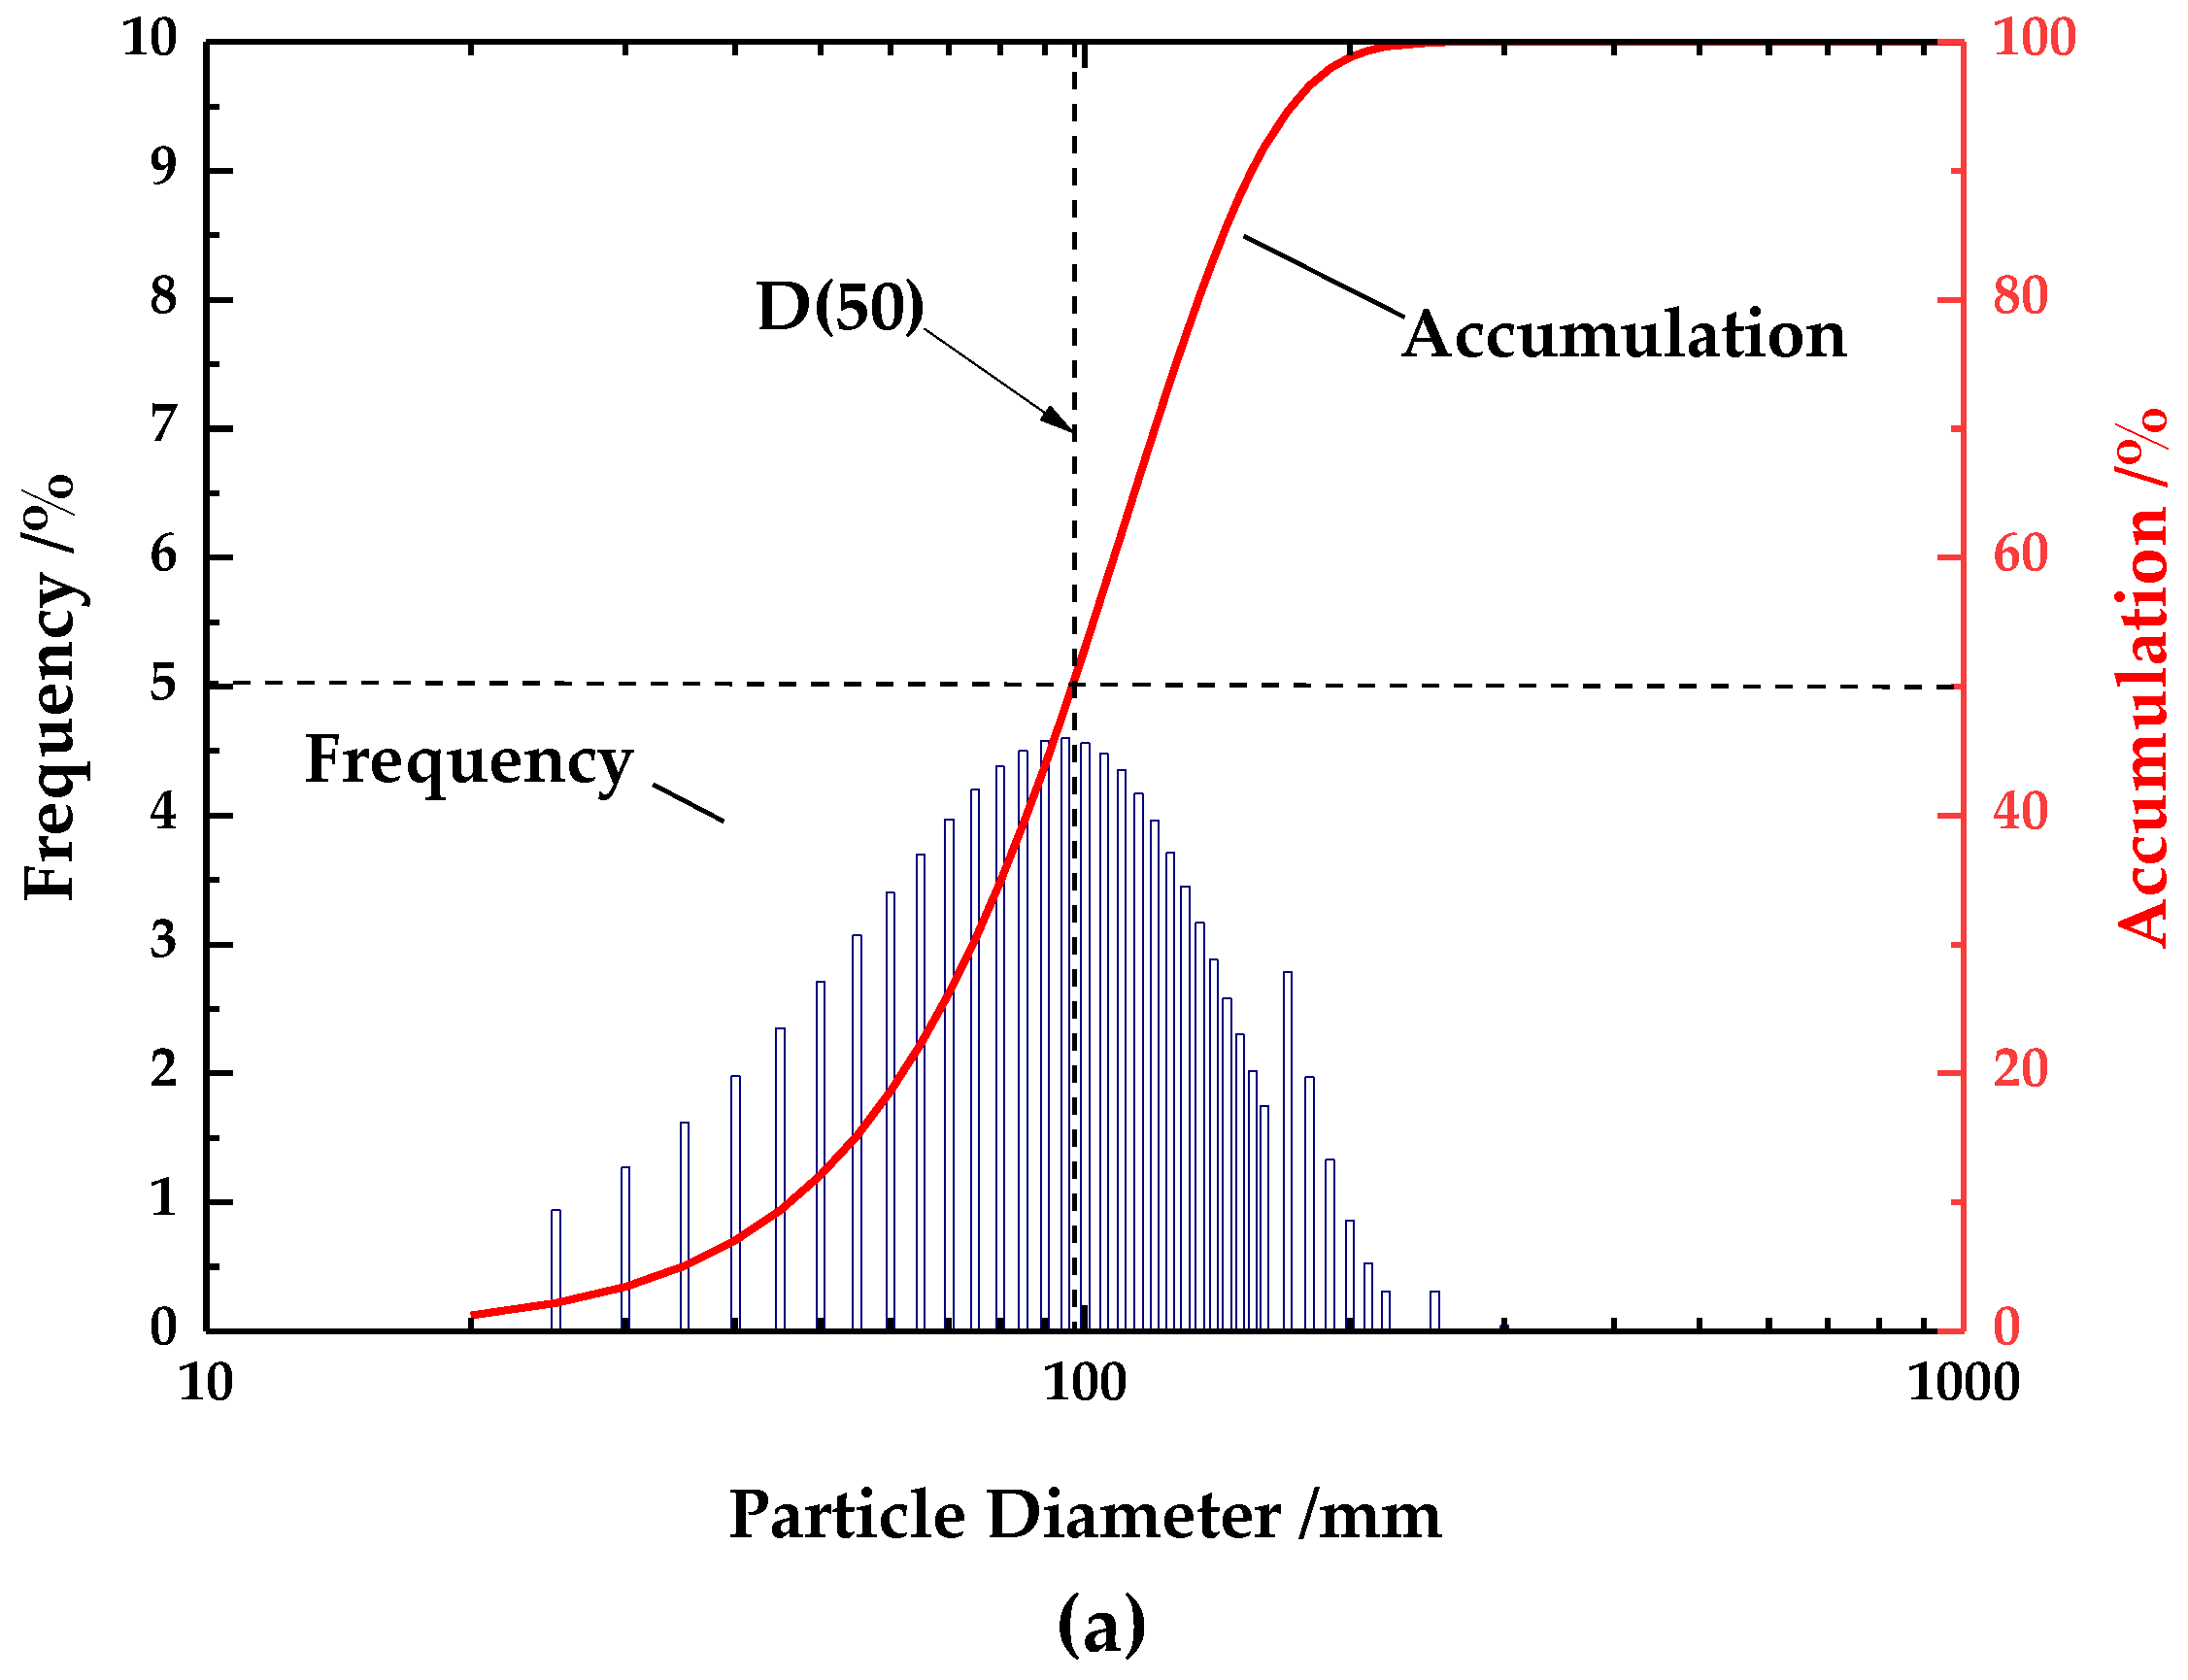
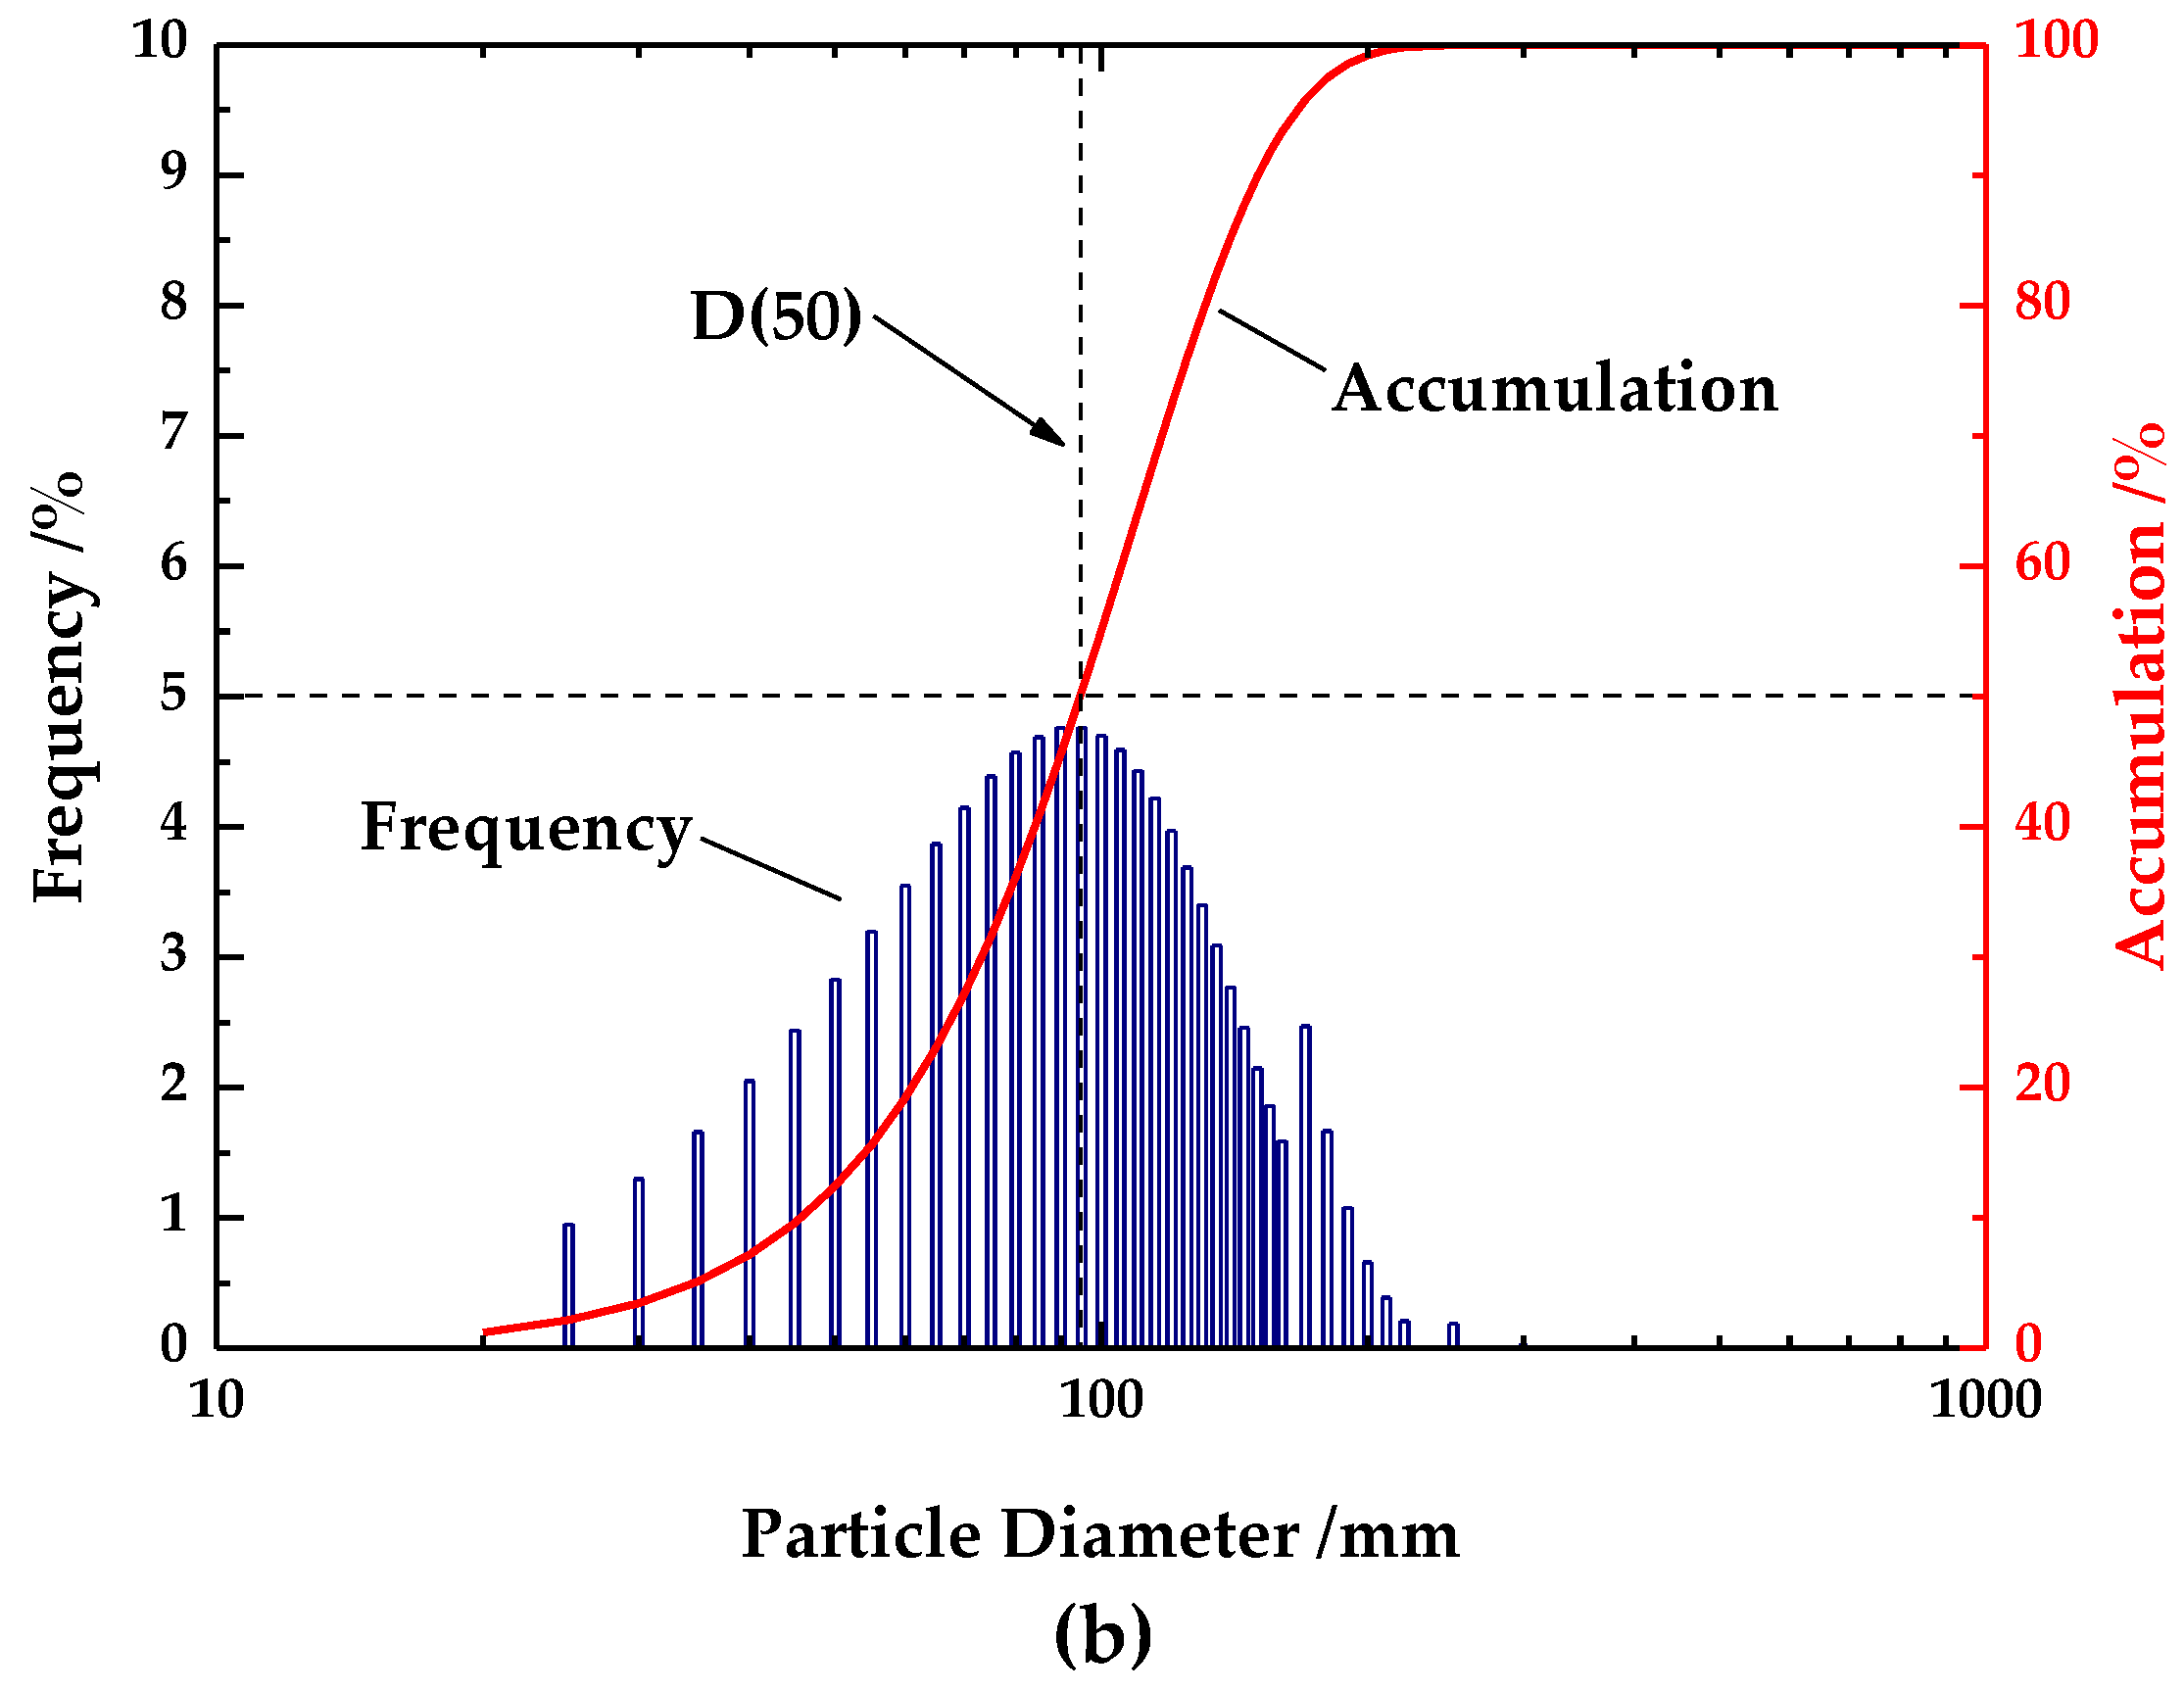
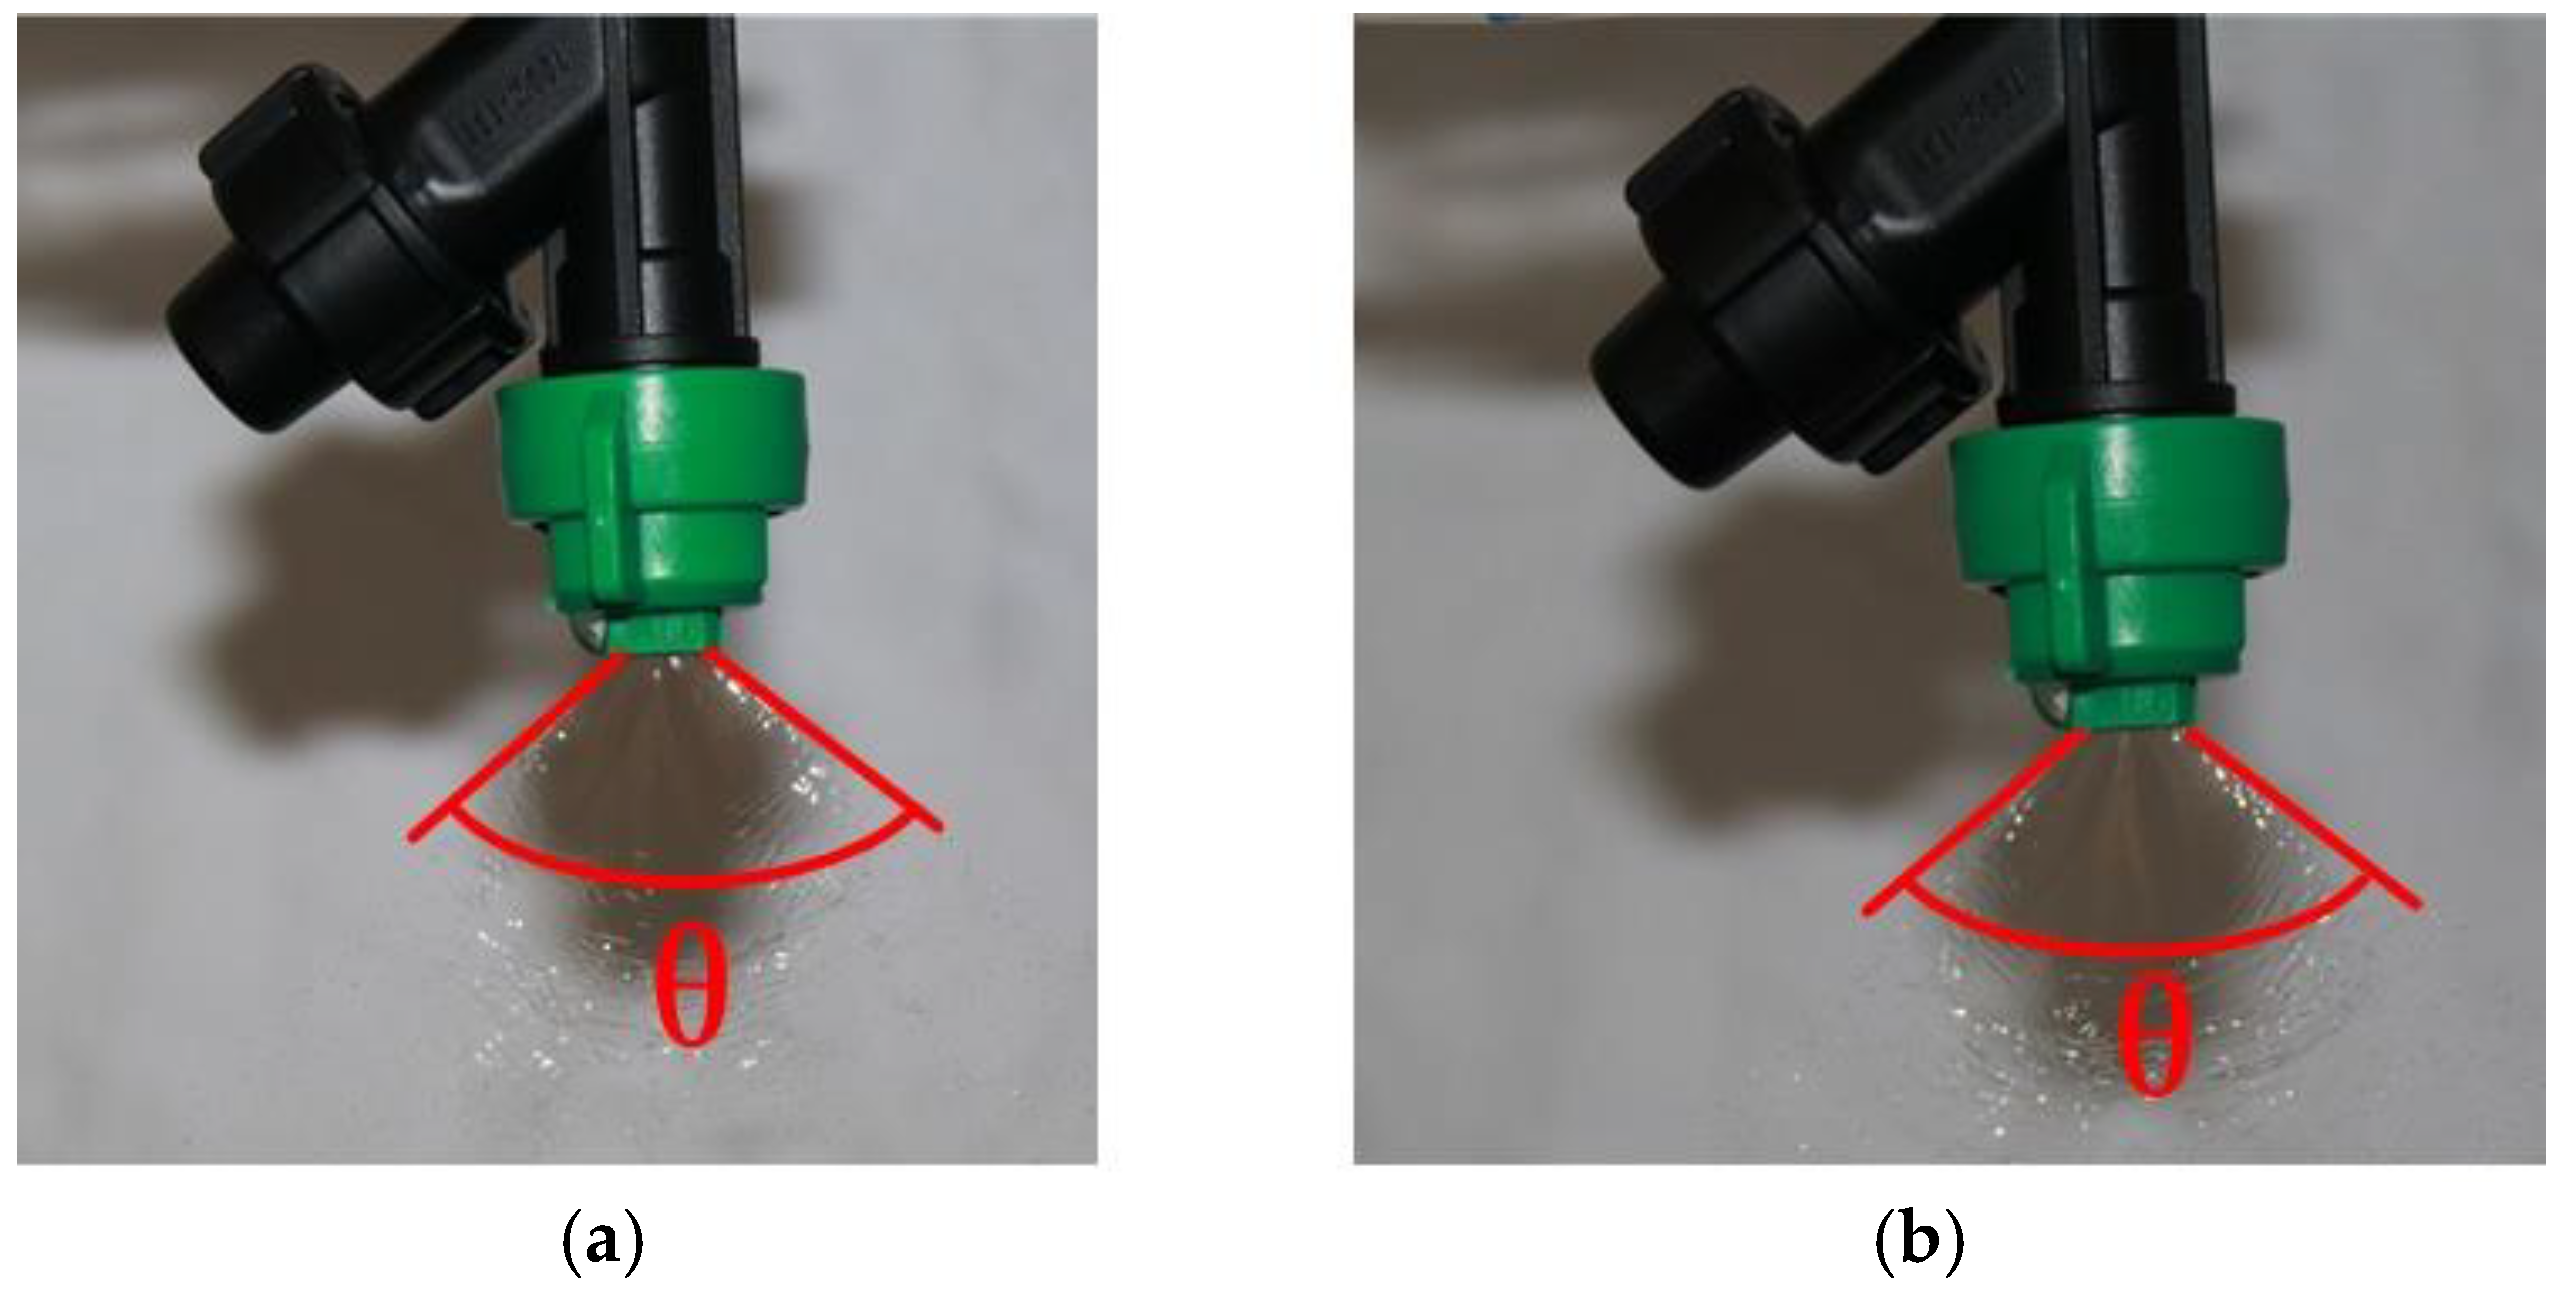
The spray droplet volume and spray angle are important parameters for evaluating atomization effect [25]. Since the particle size and spray angle of the pressure nozzle change with the change of the fluid pressure, a laser particle size analyzer (DP-02, Zhuhai Omega Instrument Co., Ltd.) was used to measure droplet volume. Additionally, a single-lens reflex camera (ILCE-5100, Sony Corporation of Japan) was used to photograph the spray angle. The average particle size was tested at different duty cycles, and the results are shown in Figure 13.
In Figure 13, frequency denotes the percentage of droplets with a certain size in the whole droplet group, and accumulation denotes the percentage of droplets arranged from small to large, to a certain size of droplets accumulating in the whole droplet group. The droplet size at 50% position is denoted as droplet volume diameter D (50). It can be seen from Figure 13 that the droplets produced by different nozzles are more uniform and the droplet spectrum is normal. The droplet size percentage is accumulated according to the order of droplet size from small to large. When the PWM duty ratio is 40% and 100%, the droplet volume diameter values are 99.81 and 96.26 μm, respectively.
The spray angles of PWM duty ratios between 40% and 100% are shown in Figure 14, and the particle size and spray angle of the other duty ratios are shown in Table 1. The experimental data in Table 1 demonstrate that the volume of the spray droplets varies between 94 and 100 μm, when the duty ratio is varied from 40% to 100%. Moreover, the volume of the volume gradually decreases as the duty ratio increases. The coefficient of variation is 5.52%, the spray angle varies between 97° and 105°, and the coefficient of variation is 2.77%. As the duty cycle increases, the flow rate of the system increases, and the pressure at the nozzle also increases, increasing atomization energy and promoting droplet breakage. The experimental results of droplet size show that different flow rates can be achieved by changing the duty cycle of PWM square wave signal to regulate the flow rate.

4.2. Analysis of Actual Flow and Theoretical Flow Error

A laboratory experiment was used to observe the real-time flow of the system conveniently. The flow information measured by the Hall flow sensor was displayed through the LCD screen in real time. The target flow rates under different duty cycles can be obtained by using the relationship between the duty cycle of the PWM square wave signal and nozzle flow rate. Table 2 is a comparison of the actual flow and the target flow of a single nozzle under different duty cycles.
The actual flow measurement data measured by the Hall flow sensor were fed back to the controller chip. The PID algorithm adjusts the system flow according to the error between the target flow and the actual flow. It can be seen from Table 2 that the system flow is regulated by the duty cycle of PWM square wave signal. The actual flow changes with the change of duty cycle and is stable near the target flow value. Additionally, the average deviation of flow regulation is 2.16%, which indicates that the system can adjust the flow well.

4.3. Experiments Outdoors

4.3.1. Experimental Scheme

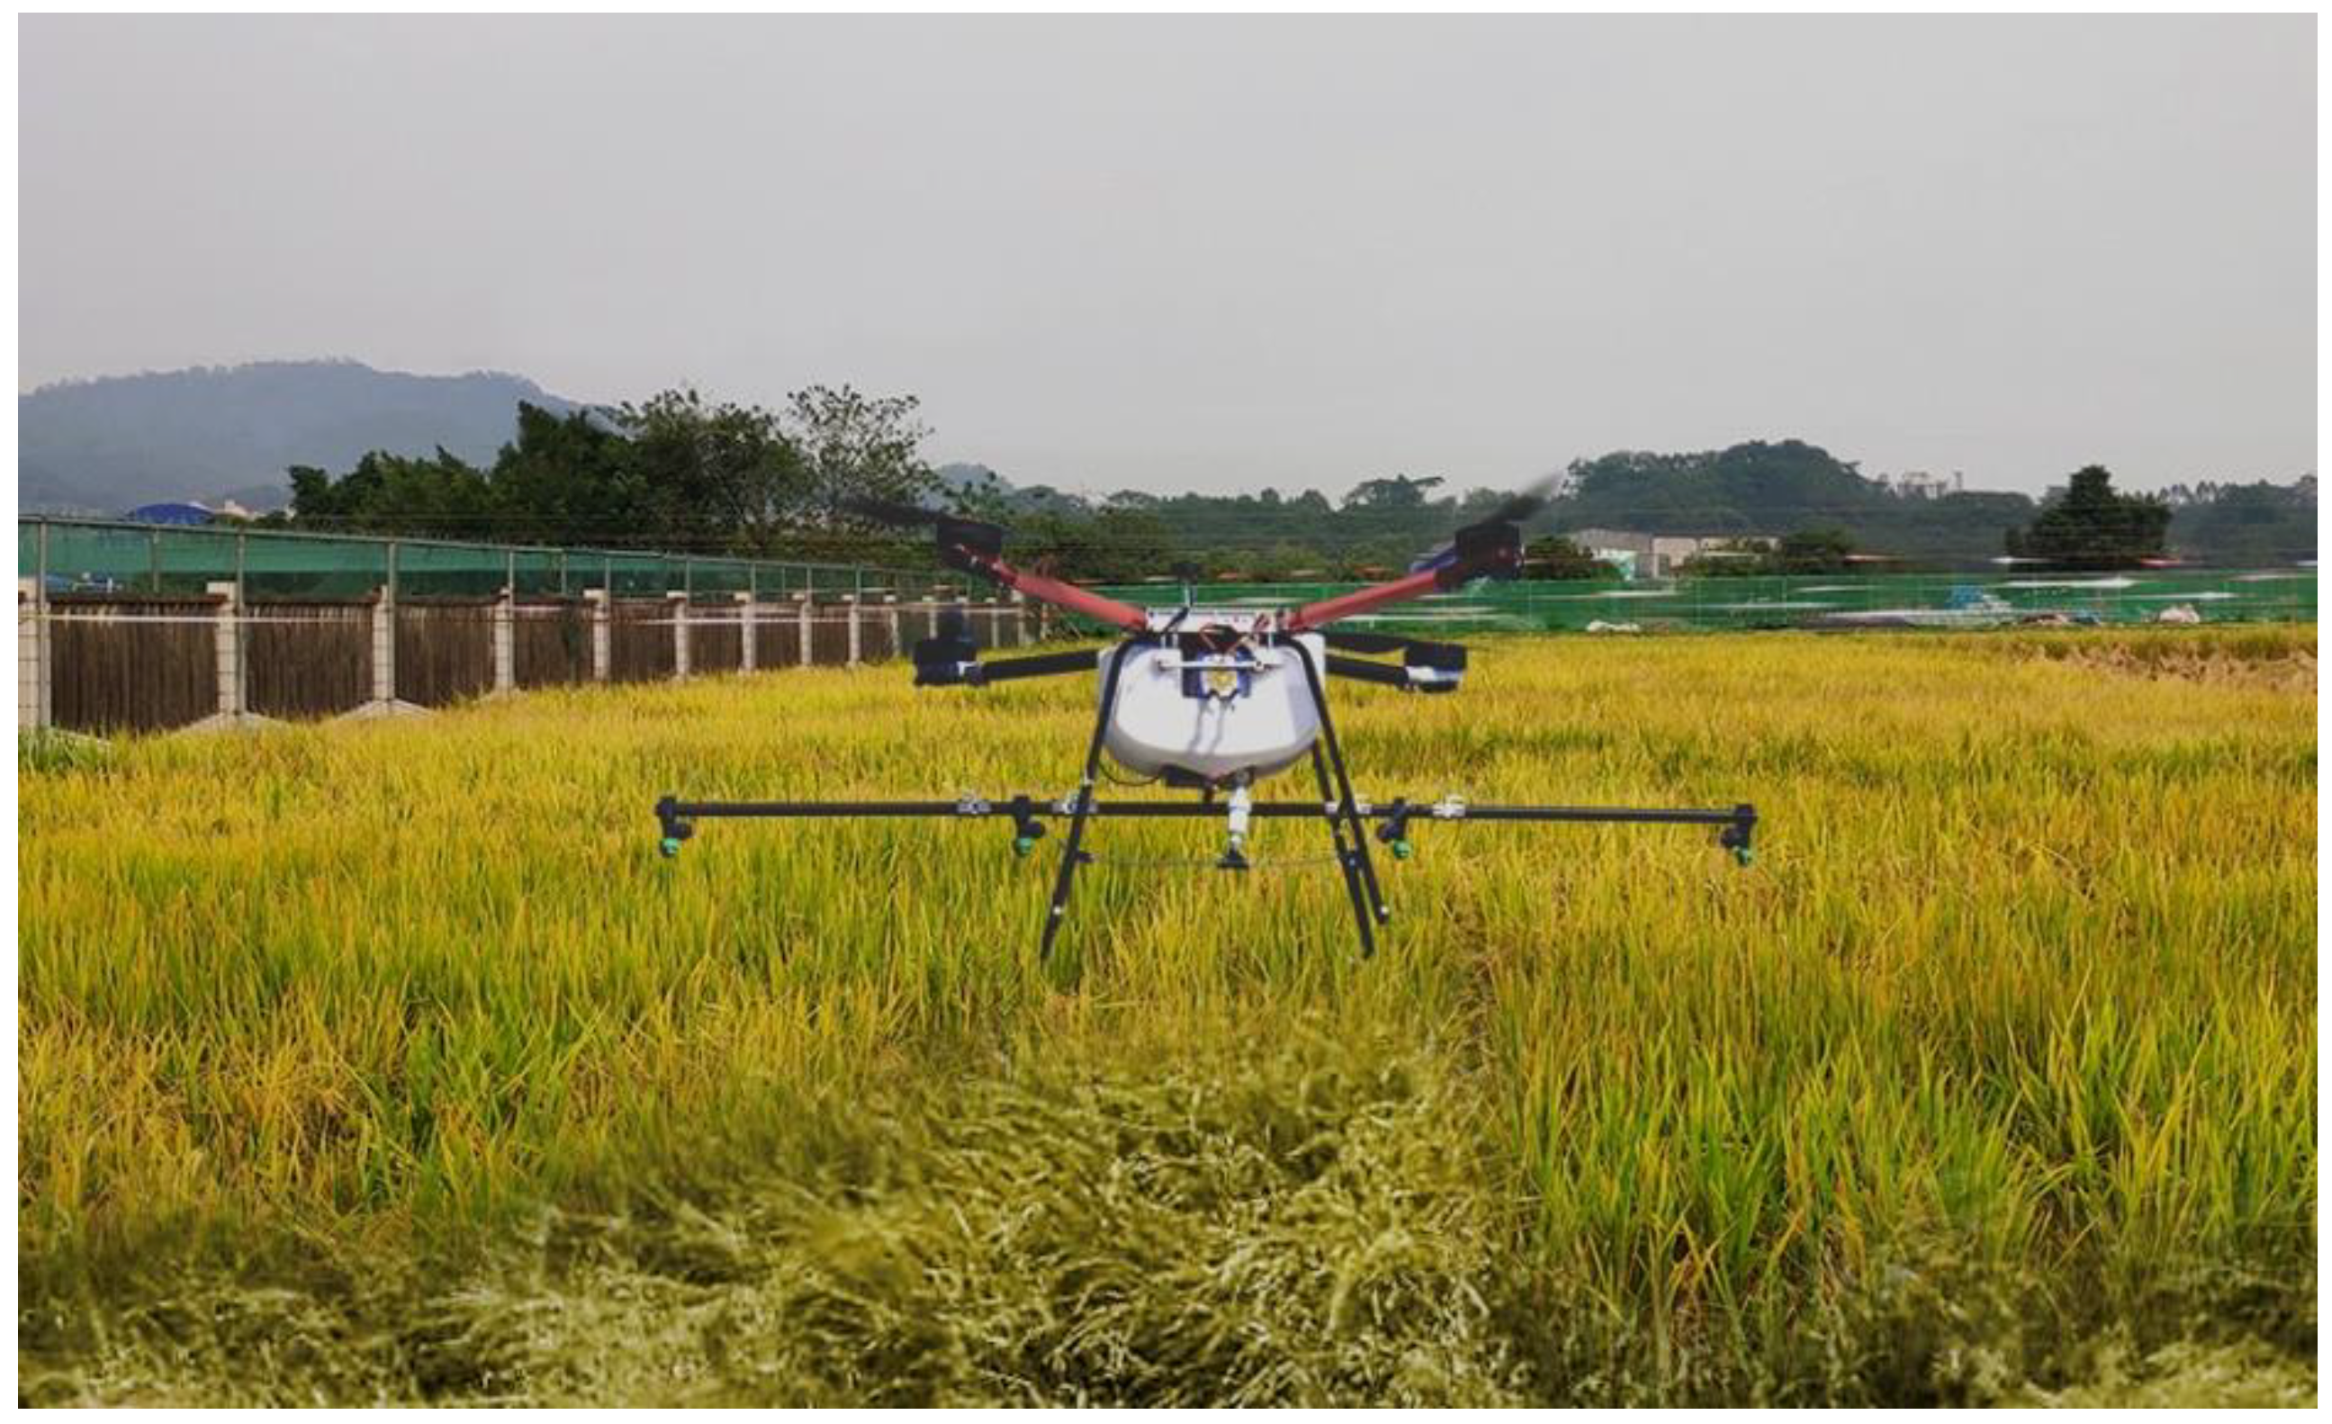
The stability and sensitivity of variable spray system were tested by outdoor spray deposition experiment, the experiment was carried out in a paddy field of the Zengcheng Research and Teaching Base (113°38′15″ E, 23°14′37″ N) of South China Agricultural University, Guangzhou. The experimental site is the same as the prescription map. The outdoor experiment site photo of the plant protection drone variable spray system is shown in Figure 15.
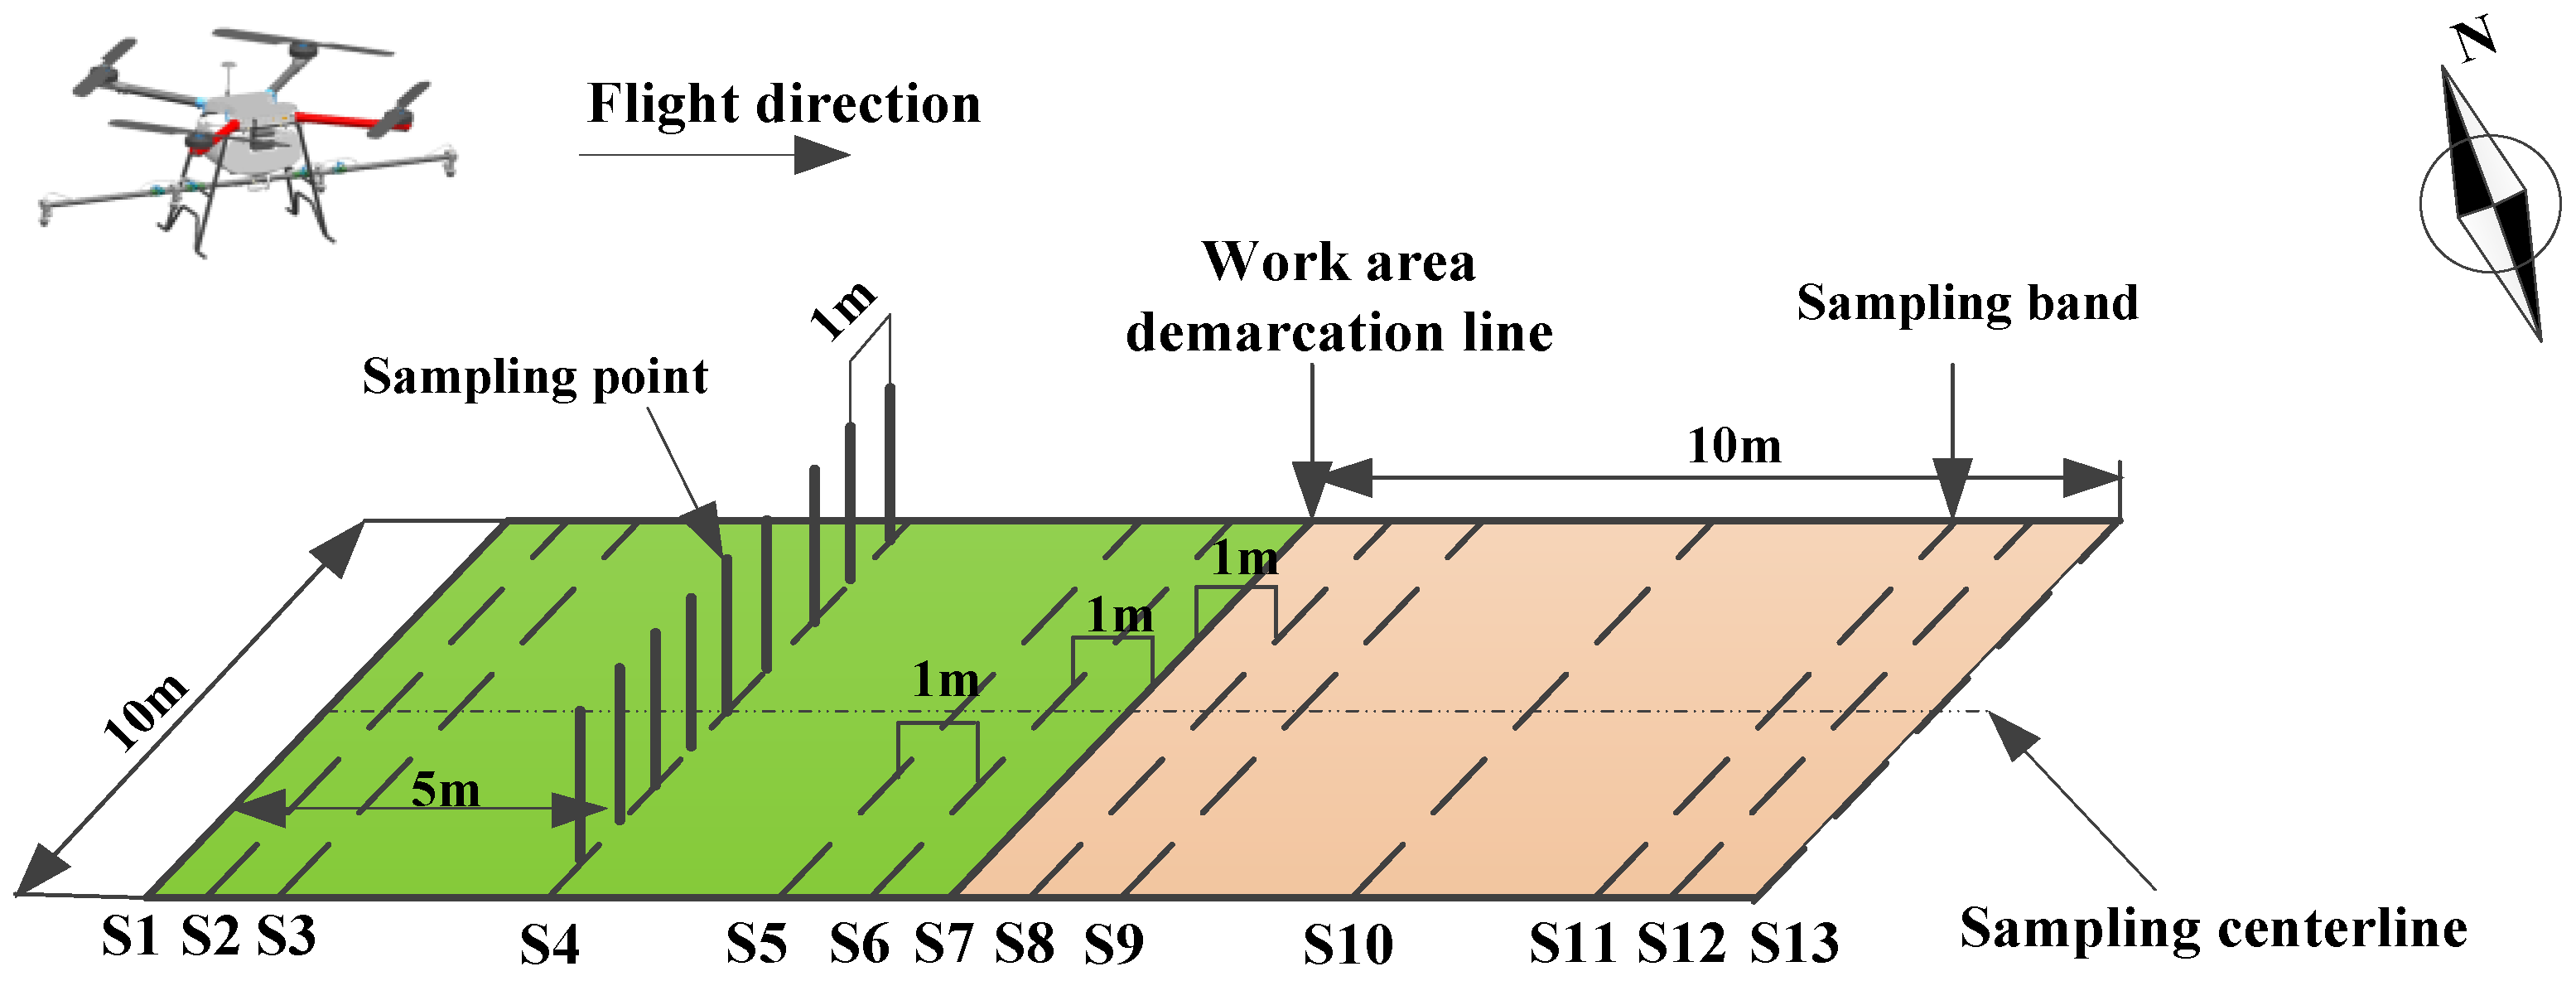
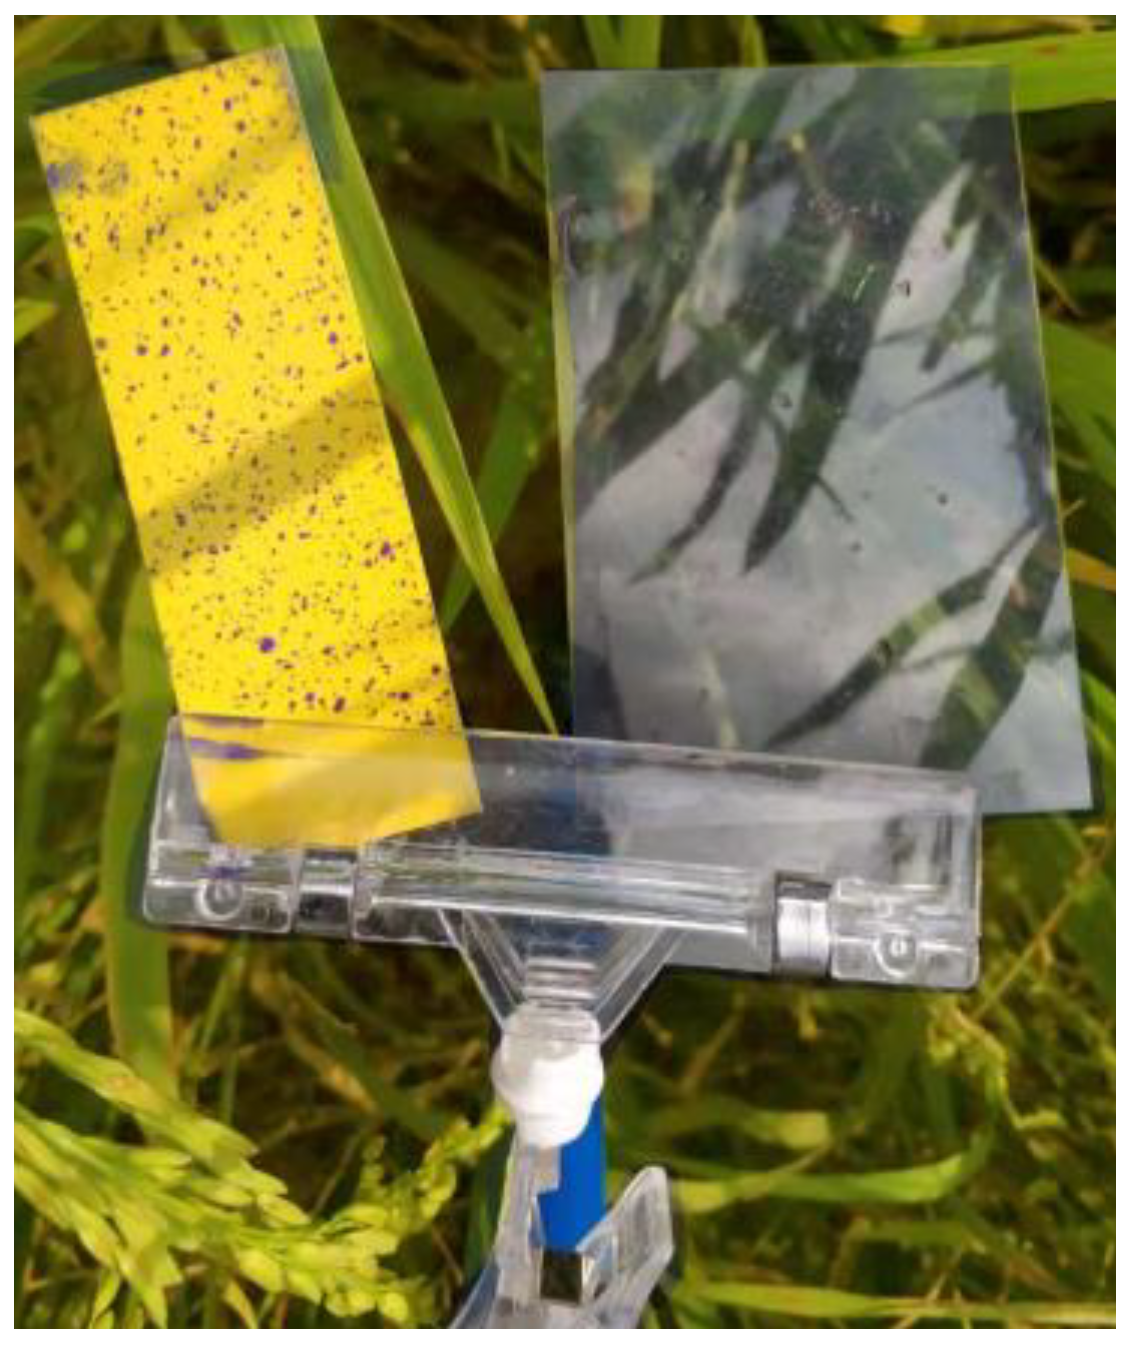
According to the prescription diagram, the prescription values of adjacent units are different. In order to explore the uniformity of droplet deposition in each unit and the droplet deposition at the boundary of adjacent units, the sampling bands such as S1, S2 were shown in Figure 16, in which the operational units each were set to 10 m × 10 m. Figure 16 shows only the layout of the sampling points in the adjacent operational units, and the other units were arranged in the same way. In UAV flying one sortie, the total number of sampling bands was 124. A sampling band was set up in the center of each operation unit, such as S4 and S10. In order to study the change of spray volume at the boundary of the operation unit, the sensitivity of the variable spray system was evaluated. The sampling bands were set on the boundary of the adjacent operation unit and to be 1 m and 2 m away from the boundary line on its both sides, as shown in Figure 16. S1, S7 and S13 were the sampling bands on the boundary line; S5, S6, S8 and S9 were the sampling bands on the left and right sides of the dividing line, respectively. The amount of droplet deposition, the sediment density and the sedimentation uniformity of aviation plant protection operations are important parameters reflecting the quality of spraying [26]. In order to study the law of droplet deposition between various regions, a Rhodamine B (soluble fluorescent tracer) solution with a concentration of 5 g/L was used instead of the pesticide solution, and a Mylar card with a size of 50 mm × 80 mm and water-sensitive paper with a size of 28 mm × 75 mm were used to collect the sprayed droplets to analyze the deposition density and deposition uniformity. Nine sampling points were evenly arranged at an interval of 1 m on each collection belt, and both the Mylar card and water-sensitive paper were fixed at a height of about 50 cm from each sampling point. The layout of Mylar card and water-sensitive paper is shown in Figure 17.
The experiment was conducted on 5 November 2018, and the mature rice was selected as the tested crop. A total of four sorties were tested, the flight speed of the plant protection drone was stable at 5 m/s and the flight altitude was 2 m. At the same time, a portable ultrasonic micro-automatic weather station (Hberw6-3, Shenzhen Hongyuan Technology Co, Ltd., China) was used to measure the environmental information, and the height of the weather station was set at 2 m above the ground. The test was carried out four times in total. The environment parameters are shown in Table 3.

4.3.2. Test Data Processing

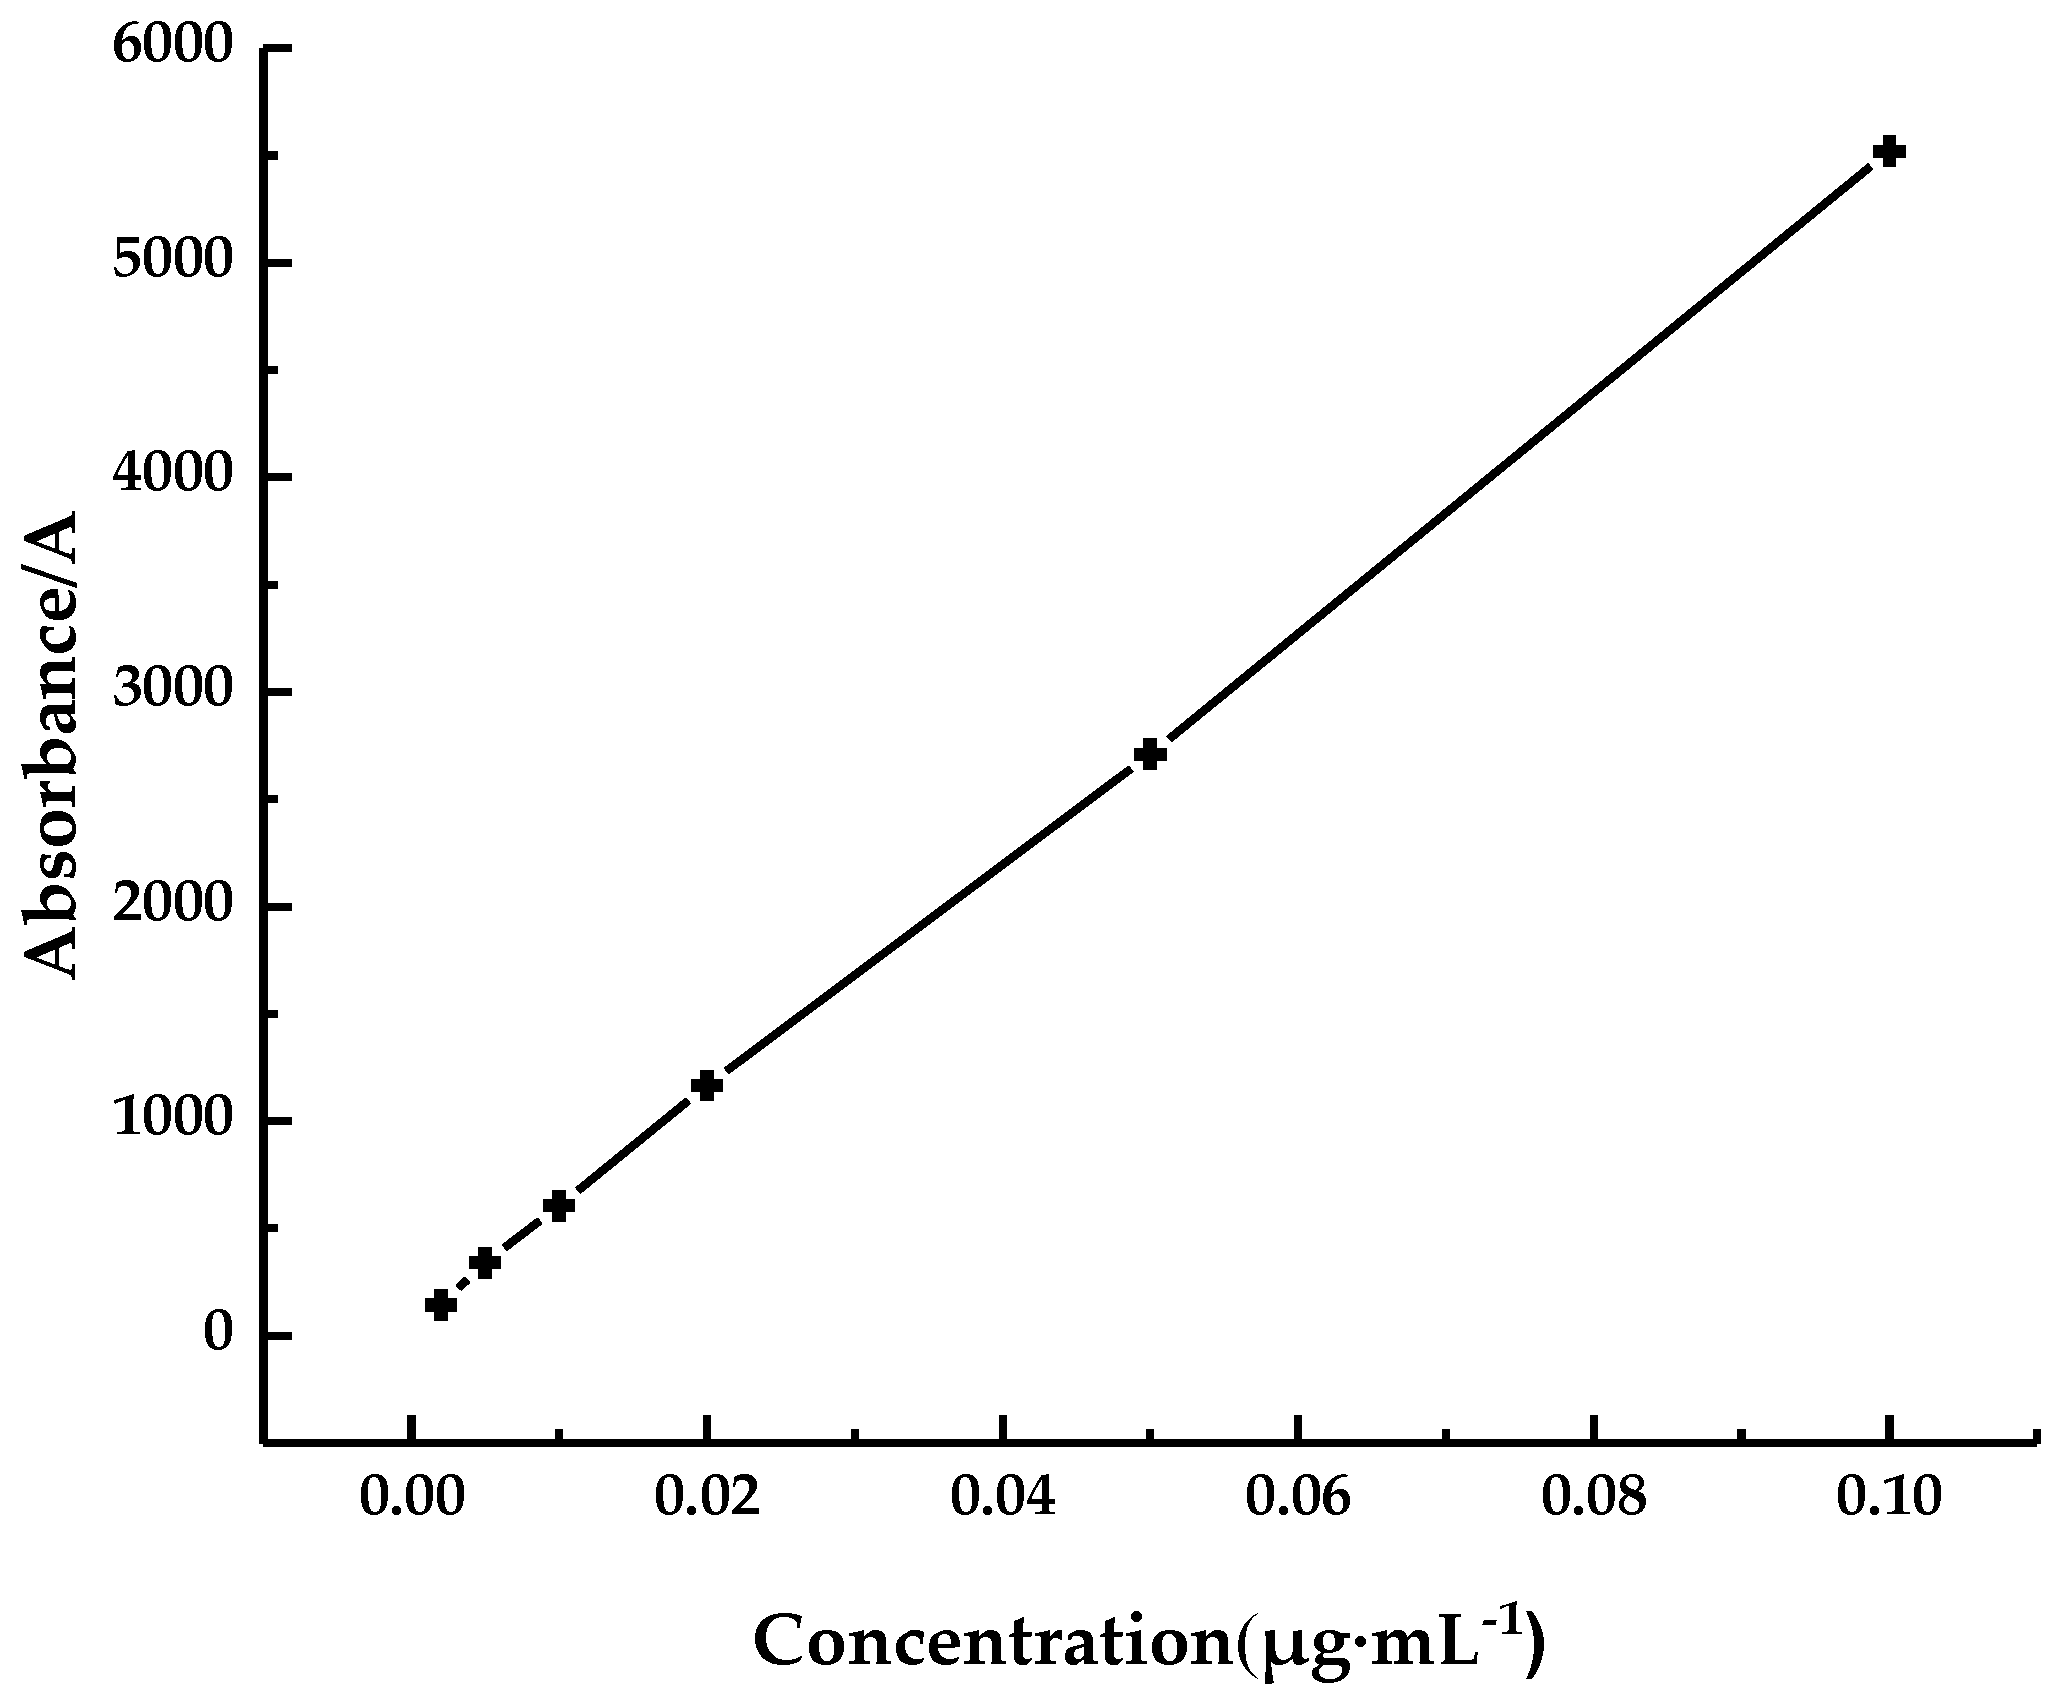
The amount of droplet deposition is a significant parameter reflecting the quality of droplet deposition per unit area [27]. The Mylar card that is a resin card collected by the test is eluted with 20 mL of distilled water, and six Rhodamine B solutions with different concentrations were set for calibration in the range of absorbance of the fluorescence spectrophotometer (F-380, Tianjin Gangdong Technology Development Co., Ltd., China). Concentrations of Rhodamine B solutions were 0.002 μg/mL, 0.005 μg/mL, 0.01 μg/mL, 0.02 μg/mL, 0.05 μg/mL, and 0.1 μg/mL. The specific method was as follows: three parts of each standard solution were prepared, and each repeated measurement was performed twice to monitor the influence of the cuvette on the measurement result. Therefore, the actual number of repeated measurements for each standard solution amount to six times, and the Rhodamine B solution concentration absorbance curve is shown in Figure 18.
By linear regression fitting, the coefficient of determination R2 is 0.9997. The standard curve gives the concentration of the sample solution, thereby calculating the deposition amount per unit area [28]. The calculation equation is as follows:
β d e p = ( ρ s a m p l ρ b l k ) F c a l V d i l ρ s p r a y A c o l
where βdep is the amount of droplet deposition in g·cm−2; ρsampl is the reading of the sample solution fluorescence meter; ρblk is the reading of the fluorescence meter of the eluent (distilled water for this test); Fcal is the calibration coefficient in g·L1; Vdil is the volume of the solution used to elute the collected sample in L; ρspray is the concentration of the fluorescent tracer in the spray solution in %; Acol is the area of the collected card in cm2.
The water-sensitive paper collected by the test was scanned and analyzed by DepositScan software (USDA-ARS Application Technology Research Unit, Wooster, OH, USA), and the droplet deposition rate and deposition density under different prescription values were obtained [29]. The coefficient of variation is usually used to represent the uniformity of droplet deposition between different collection points for the same collection [30]. The calculation equation is:
C V = S X ¯ × 100 %
S = i = 1 n ( X i X ¯ ) 2 / ( n 1 )
where S is the standard deviation of the sampled specimens in the same collection zone; Xi is the deposition amount of each collection point in μL·cm−2; X ¯ is the average value of the deposition amount of the sampling points of the same collection zone in μL·cm−2; and n is the group sampling with the number of collection points.

4.4. Analysis of Experiments Results

4.4.1. Droplet Deposition Density Analysis

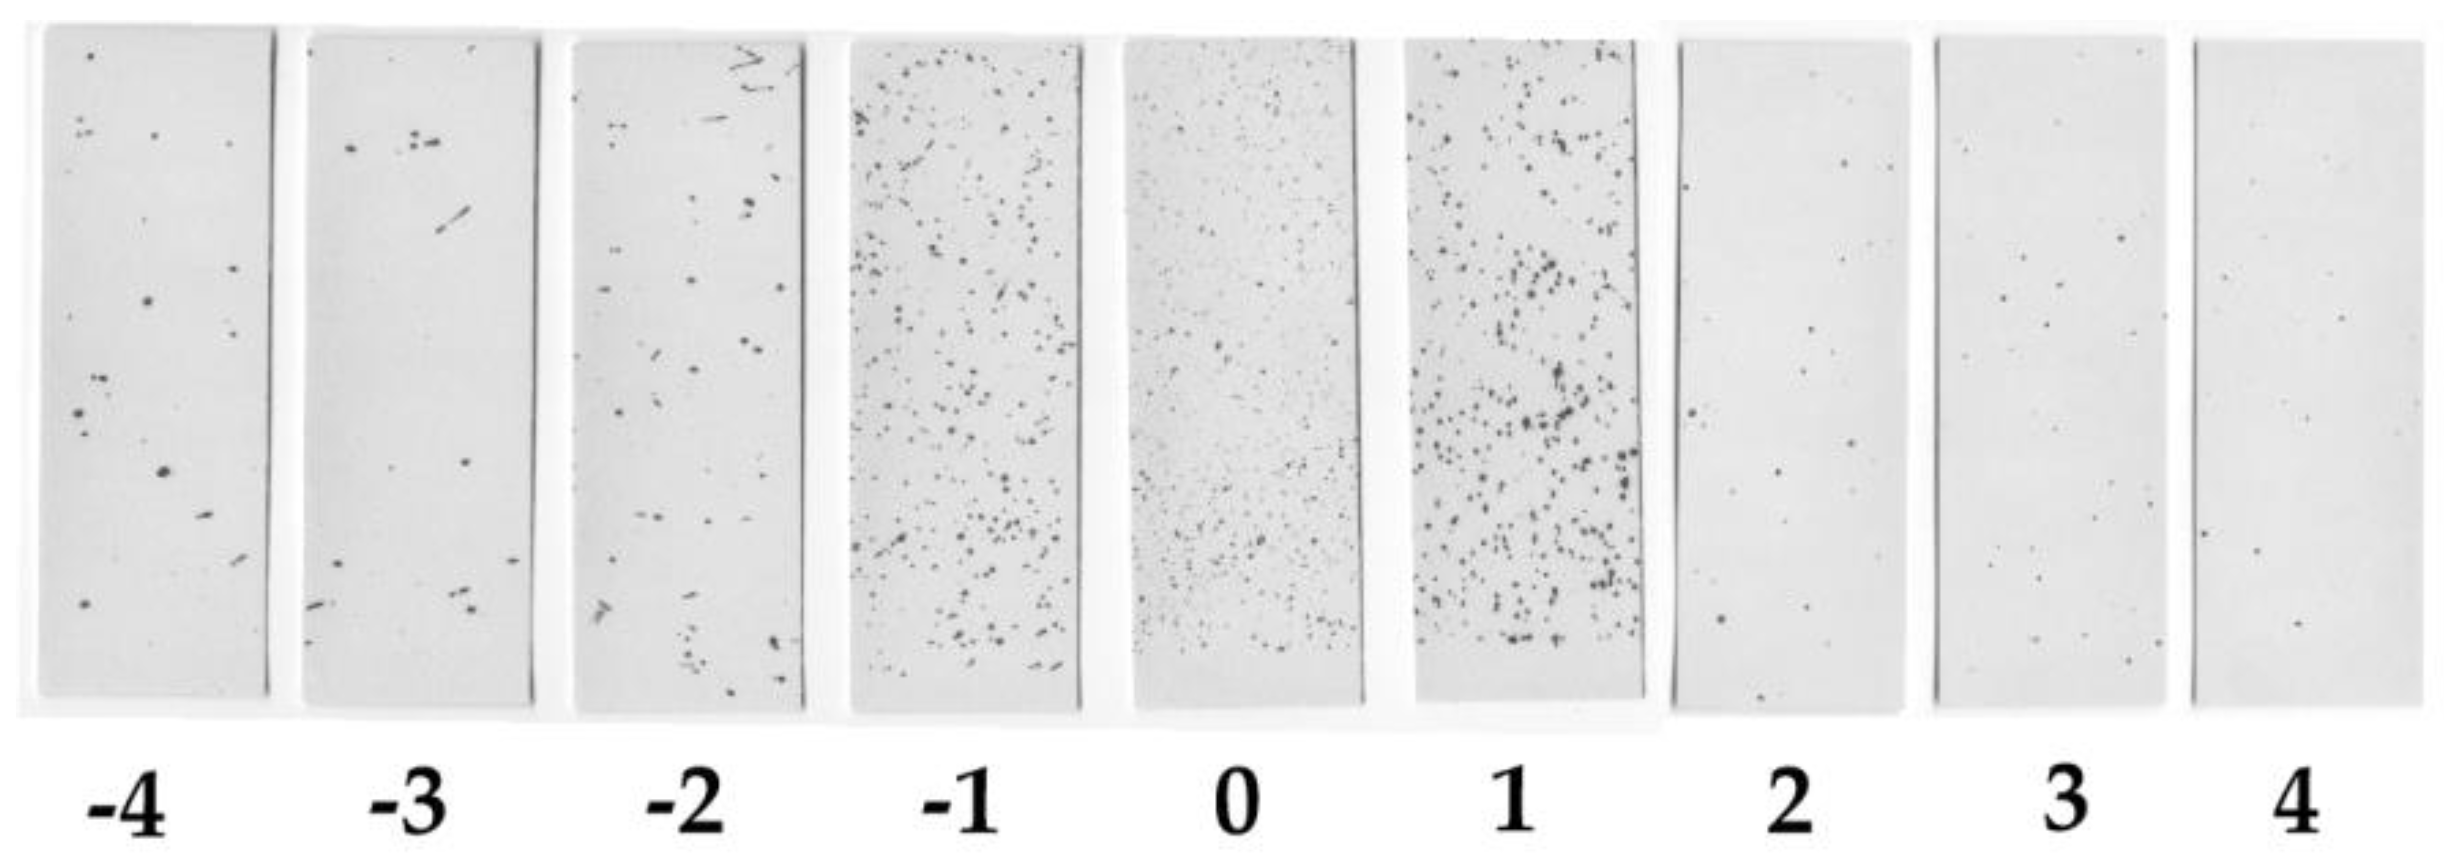
During the experiment, the number of droplets per square centimeter of the water-sensitive paper in each sampling point was collected. The distribution uniformity of the droplet coverage tester was calculated by Equation (7). The grayscale image the water-sensitive paper after scanning is shown in Figure 19. The central sampling band of 6 working orders in the next route of the one or two sorties was selected, as shown in Table 4. When the water droplet coverage density is less than 15 per cm2, it is regarded as an invalid sampling point.
According to the data in Table 4, when the prescription values are different, the distribution of droplet deposition density is more intense in the middle and less intense on both sides. Because of the small natural wind speed during the experiment, the droplet deposition does not have obvious migration, and the peak value of deposition concentration is gathered near the sampling center line. The prescription values of operational units 1–6 are 7.5 L/hm2, 15 L/hm2, 7.5 L/hm2, 37.5 L/hm2, 15 L/hm2, and 30 L/hm2, and the normalized ratio of prescription value is 1:2:1:5:2:4.
In the first sortie, the normalized ratio of effective droplet deposition density of these six operation units is 1:1.38:0.93:3.15:1.07:1.85. In the second sortie, the normalized ratio of their effective droplet deposition density is 1:1.59:1.15:1.99:1.04:2.21. The actual normalized ratio of fog droplet deposition density of these six operation units is smaller than its theoretical ratio. The main reason is that the droplet does not fall due to the drift of droplets in the process of operation. The data in the table show that the effective sampling point number is from −3 to 3. According to the Civil Aviation Industry Standards of the People’s Republic of China (MH/T1002.1-2016) with regard to the technical specifications for the quality of agricultural aviation ultra-low-capacity pesticide-spraying operations [31], it can be estimated that the actual spraying swath is about 5 m.

4.4.2. Droplet Deposition Analysis

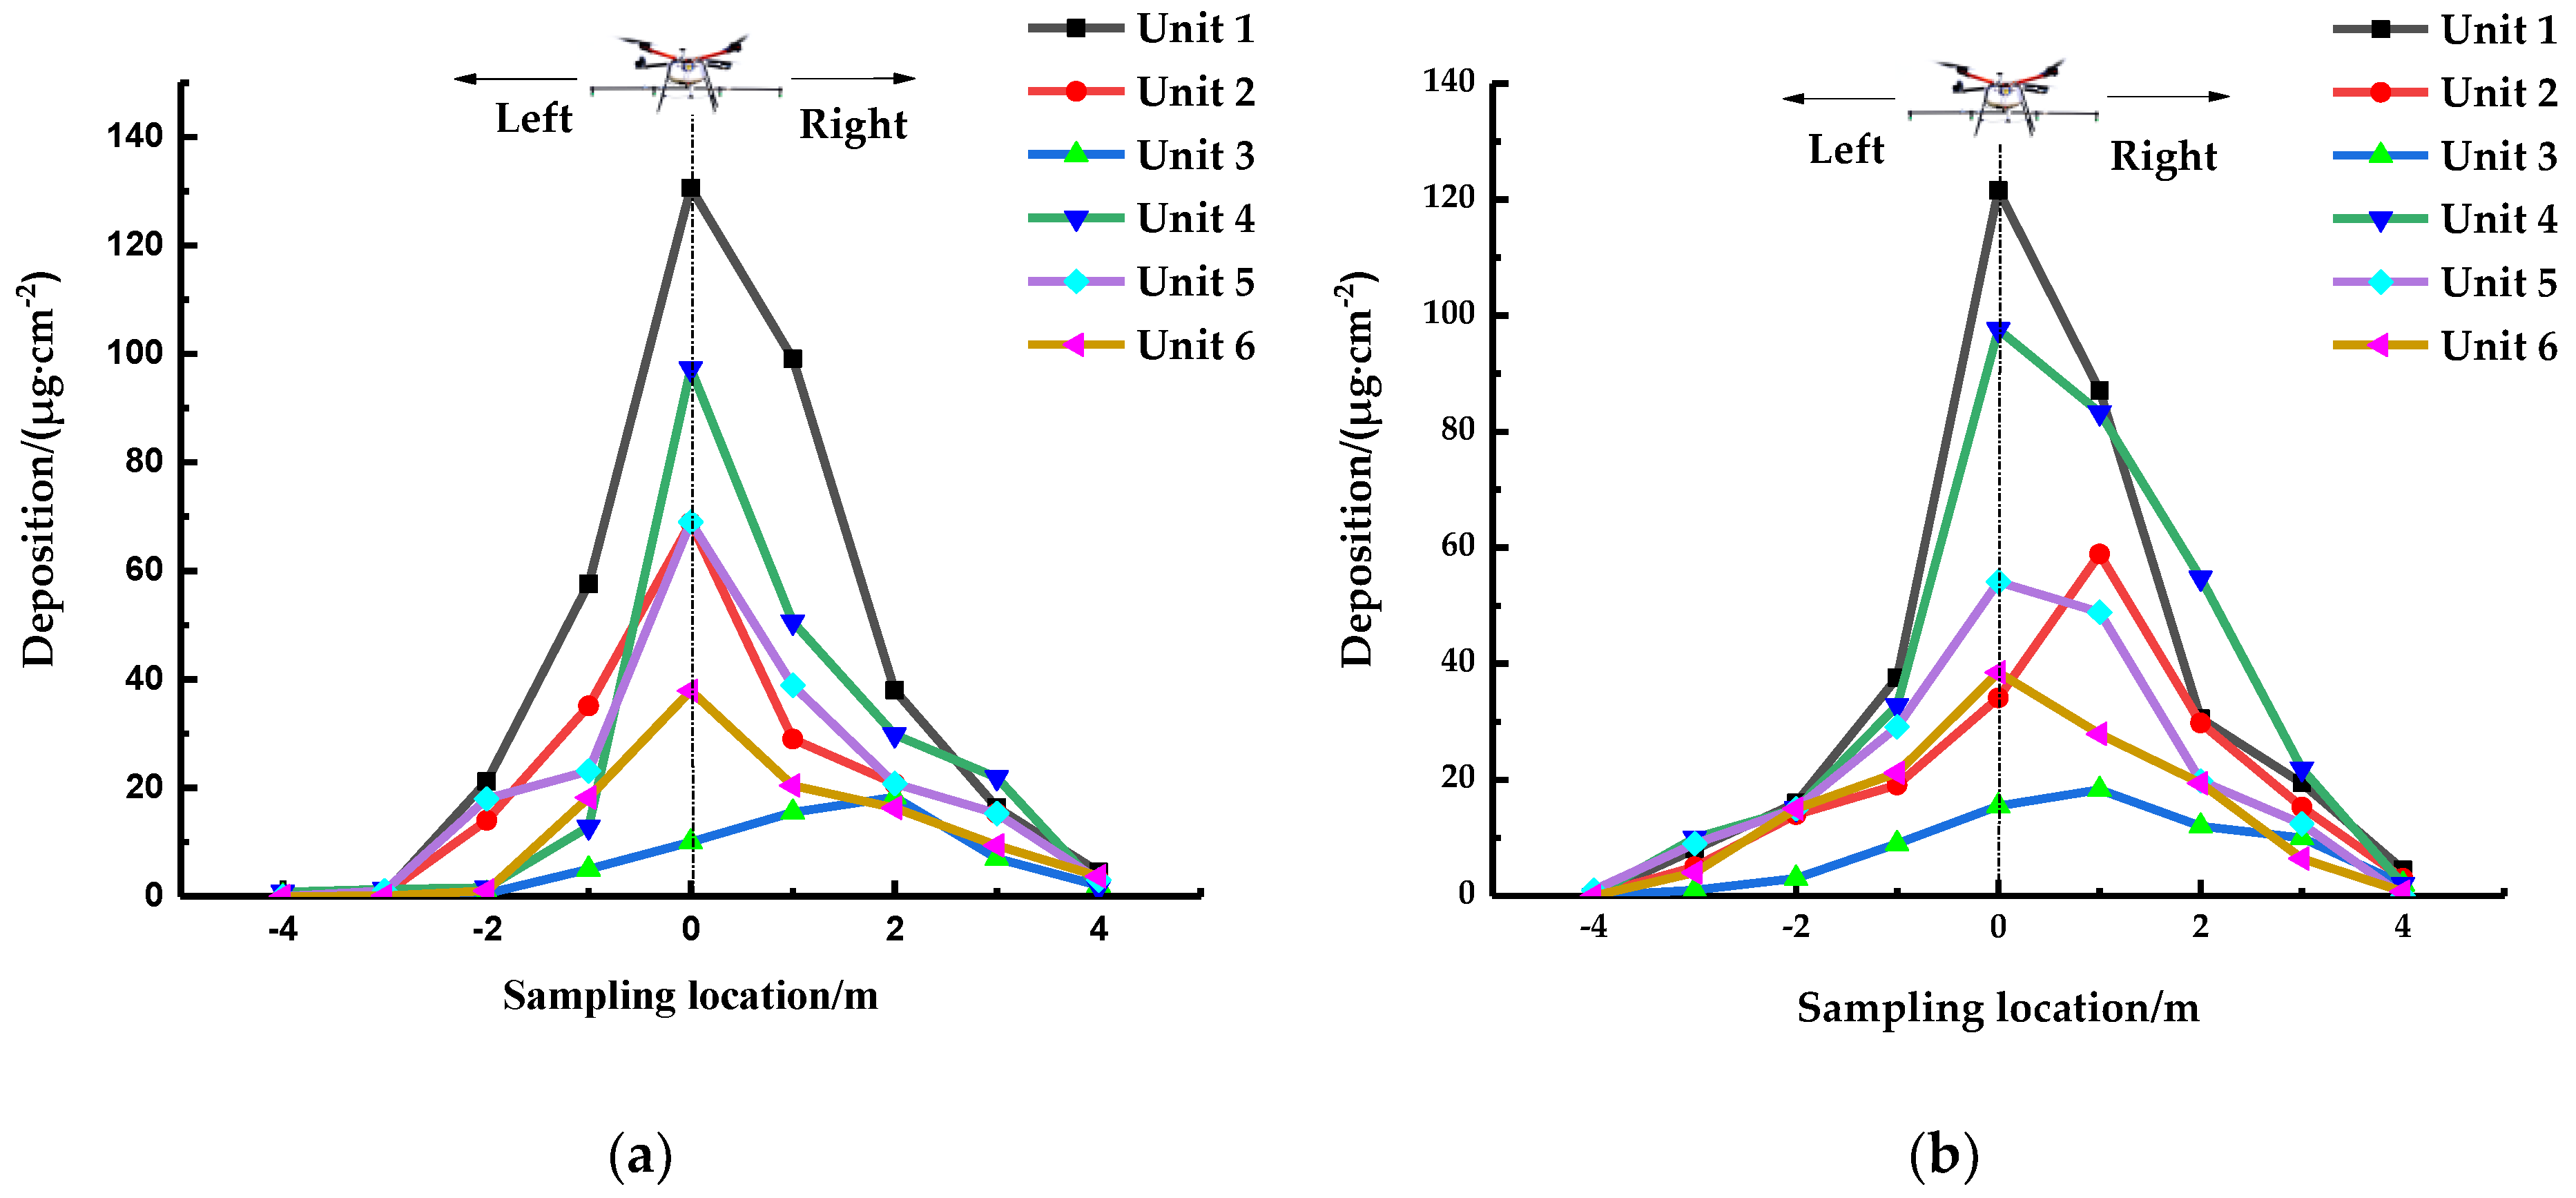
A total of four sorties were tested, with four routes under each sortie. The spraying prescription values of each unit were the same as those of the prescription map. The droplet depositions of four sorties were collected by the Mylar card. The average droplet deposition in various operational units was calculated by elution analysis of the Maylar card. The droplet deposition in the sampling zone at the center of six operational units on the third and fourth sorties was analyzed. The collection of droplet deposition data is shown in Figure 20.
The prescription values of the operational units 1–6 were set by the prescription map to be 37.5 L/hm2, 225 L/hm2, 7.5 L/hm2, 30 L/hm2, 22.5 L/hm2, and 15 L/hm2, respectively. It can be observed in Figure 20 that the distribution of droplet deposition in each area is basically the same. The amount of droplet deposition is related to the prescription value of each area. The peak value of spray deposition appears below the fuselage. The main reason is the drift of droplets on both sides of the fuselage due to the influence of the rotor wind field. The droplet distribution appears to be near the sampling center line. The droplets on each collection belt are mainly distributed at the sampling points of −2#, −1#, 0#, 1#, 2#, 3#. It can be estimated that the actual spraying swath is about 5 m. This is similar to the result of Table 4.
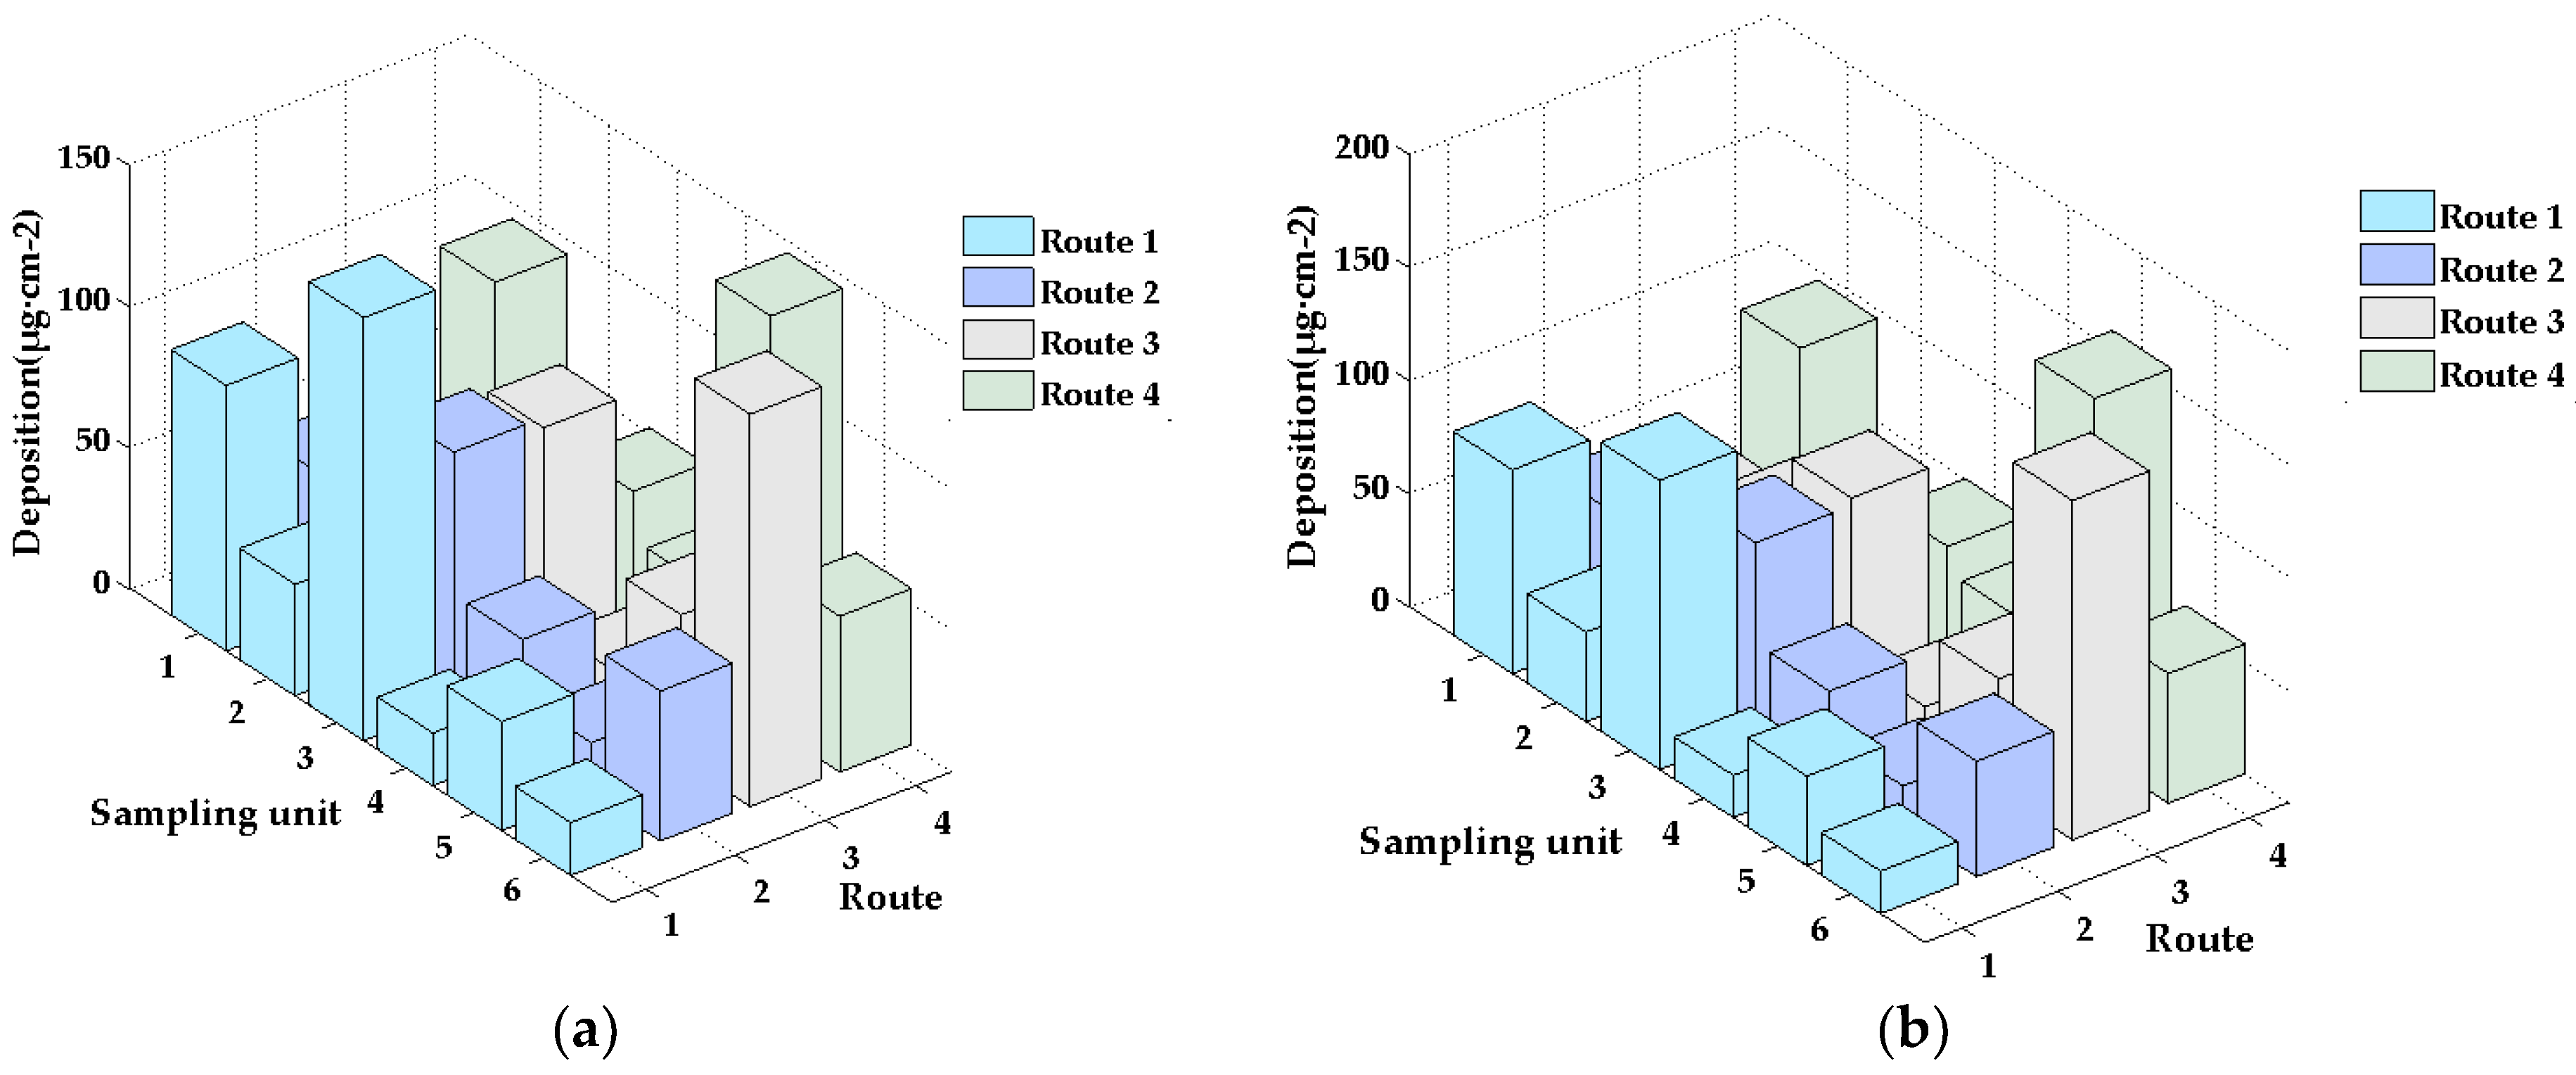
In order to visualize the droplet deposition changes in different operational units under four sorties, the average droplet deposition in each operation unit was calculated, which is shown in Figure 21.
The average deposition amounts of fog droplets in each operational unit of four sorties are basically the same. The variation trends of the deposition amount of fog droplets between different operational units on each route are the same, and the average deposition amounts of fog droplets in each operation unit are different when placed in different places. It can be observed that the variable spray system designed by the research group can accomplish variable spray operation according to the prescription value set in the prescription map.

4.4.3. Droplet Deposition at the Boundary of Operation Units

In order to verify the sensitivity of the designed variable spray system, the sampling bands are set up to collect droplet deposition. The sampling bands are located 1 m and 2 m away from the operation unit boundary line. The droplet deposition amount of the units 1–4 of the first sortie was selected for analysis. And the test data are shown in Table 5. In Table 5, S4, S10 and S16 are the acquisition bands at the demarcation line of the operation unit. S3, S5, S9, S11, S15 and S17 are the numbers of acquisition band numbers which are 1 m away from the demarcation line on both sides of the demarcation line. S2, S6, S8, S12, S14 and S18 are the numbers of acquisition bands which are about 2 m away from the demarcation line on both sides of the demarcation line. S7, S13 and S19 are the numbers of acquisition bands located in the central position of the operation unit respectively. The layout of the sampling zone from S2 to S19 is in accordance with the method shown in Figure 16.
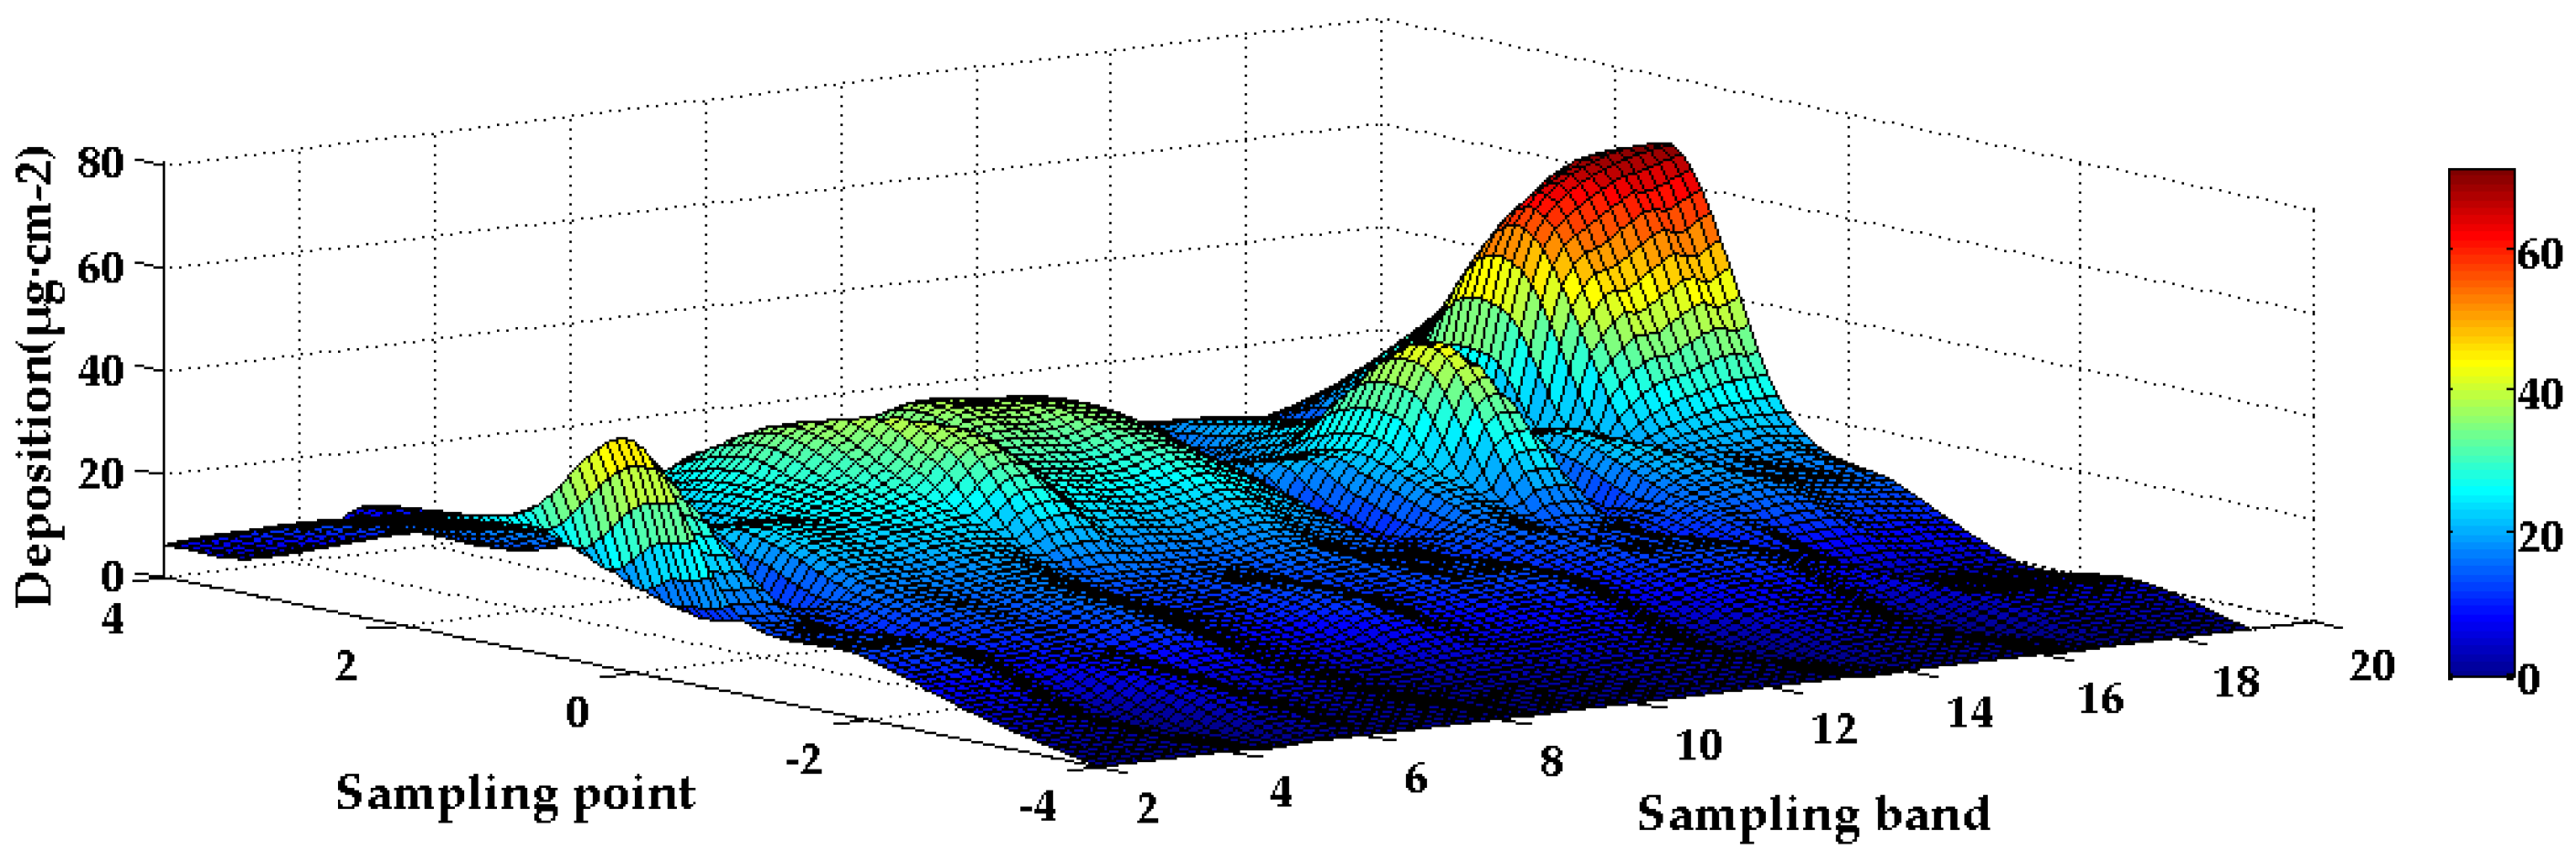
The diagram of droplet deposition in operation units 1–4 is shown in Figure 22.
It is known from Table 5 and Figure 22, when the UAV flies over the boundary band, the prescription interpretation system is interpreted to get the prescription value of the next operation unit and sent to the variable spray control system. The variable spray control system regulates the flow rate of the spray system according to the spraying prescription value. From Table 5, the droplet deposition at the boundary is similar to that of the working unit. The droplet deposition at the 1 m position behind the boundary is between the values at the center of the two working units. For example, the variation rates of the droplet deposition at S5, S11 and S17 are 63%, 29.95% and 217.67% respectively. On the other hand, the deposition of droplets on the acquisition belt, which are 2 m away from the demarcation line, is similar to that on the central line of the operation unit. Since the plant protection drone flies at 4 m/s during the test, the new prescription value is received. When the target value of the spray volume change value is about 2 m, the operation time of the system is 0.4s from receiving to square value to arriving at the target value of flow. Which reflects the sensitivity of the system. From Table 5 and Figure 22, it can be seen that the droplet depositions in the four operation units 1–4 vary with the prescription value. The normalized ratio of the droplet deposition in the center line of operation units 1–4 is 1:1.79:1.07:5.93, and the ratio of prescription value for these four operation units is 1:5:1:7. Due to the drift and adherence of droplets to fuselage, the actual deposition value is smaller than the prescription value, but the ratio is consistent, which reflects the effectiveness of variable spray system. The above analysis shows that the PWM-PID variable spray system designed based on the prescription can quickly adjust the flow according to the prescription map. The system has certain sensitivity and stability.

5. Conclusions

The variable spray system based on PWM-PID control can achieve rapid and accurate change of flow according to prescription information, effectively reducing herbicide use and enhance chemical effect.
(1)
Using serial communication technology to receive the prescription value information after the prescription translation, the PWM technology was used to adjust the rotation speed of the micro-diaphragm pump to realize the variable spray, and the spray effect of the spray system was tested. The results show that the variable spray system designed by the research group ensures that the atomization effect is stable under the duty cycle of different PWM square wave signals, and the coefficient of variation of the system flow rate with the duty cycle of the PWM square wave signal is 39.21%, which can satisfy various kinds of different spray requirements;
(2)
The PID algorithm was used to control the flow adjustment process to reduce the steady-state time of the system, so that the deviation between the actual flow and the target flow is stable at 2.16%, indicating that the system can adjust the flow well;
(3)
The outdoor sedimentation test shows that the variable spray system can quickly change the spray flow according to the prescription value of the working plot. Variable pulse spraying can be realized by PWM technology.
(4)
Based on the data of experimental deposition and deposition density, the variable spray system can be stabilized within 0.4 s from receiving the prescription value to adjusting the flow rate to a predetermined value, and the effective injection rate of actual operation is about 5 m.

Author Contributions

Conceptualization, S.W., Q.Z., J.D. and Y.L.; methodology, W.S., Q.Z. and J.S.; software, S.W., Q.Y., and J.S.; validation, Q.Z., X.Y. and J.S.; formal analysis, S.W. and Y.L.; investigation, W.S.; resources, J.Z. and Y.L.; data curation, Q.Z. and J.S.; writing of the original draft preparation, Q.Y.; writing of review and editing, S.W.; visualization, S.W. and J.Z.; supervision, S.W.; project administration, S.W.; funding acquisition, S.W. and J.Z.

Funding

This research was funded by the Science and Technology Program of Guangzhou, China (Grant No. 201707010047), Science and Technology Program of Guangdong, China (Grant No.: 2016A020210100, and 2017A020208046), National Key Technologies Research and Development Program (Grant No.: 2016YFD0200700), and National Natural Science Foundation of Guangdong, China (Grant No.: 2017A030310383).

Acknowledgments

Thanks to Yilong Zhan, et al. from the National Center for International Collaboration Research on Precision Agricultural Aviation Pesticides Spraying Technology for helping the authors to complete the outdoor experiment.

Conflicts of Interest

The authors declare no conflicts of interest.

References

  1. Guo, Y.W.; Yuan, H.Z.; He, X.K.; Shao, Z.R. Analysis on the development and prospect of agricultural aviation protection in China. Chin. J. Plant Prot. 2014, 10, 78–82. (In Chinese) [Google Scholar]
  2. Zhou, Z.Y.; Ming, R.; Zang, Y.; He, X.G.; Luo, X.W.; Lan, Y.B. Development status and countermeasures of agricultural aviation in China. Trans. Chin. Soc. Agric. Eng. 2017, 33, 1–13. (In Chinese) [Google Scholar]
  3. Song, Y.; Sun, H.; Li, M.; Zhang, Q. Technology Application of Smart Spray in Agriculture: A Review. Intell. Autom. Soft Comput. 2015, 21, 319–333. [Google Scholar] [CrossRef]
  4. Mogili, U.R.; Deepak, B.B.V.L. Review on application of drone systems in precision agriculture. Procedia Comput. Sci. 2018, 133, 502–509. [Google Scholar] [CrossRef]
  5. Xue, X.Y. Develop an unmanned aerial vehicle based automatic aerial spraying system. Comput. Electron. Agric. 2016, 128, 58–66. [Google Scholar] [CrossRef]
  6. He, X.K.; Bonds, J.; Herbst, A.; Langenakens, J. Recent development of unmanned aerial vehicle for plant protection in East Asia. Int. J. Agric. Biol. Eng. 2017, 10, 18–30. [Google Scholar]
  7. Chen, Z.G.; Chen, M.X.; Wei, X.H.; Li, J.Y.; Li, L. Variable prescription pesticide spraying system for farmland based on the Beidou Navigation Satellite system. J. Drain. Irrig. Mach. Eng. 2015, 33, 965–970. [Google Scholar]
  8. Perez-Ruiz, M.; Aguera, J.; Gil, A.; Slaughter, D.C. Optimization of agrochemical application in olive groves based on positioning sensor. Precis. Agric. 2011, 12, 564–575. [Google Scholar] [CrossRef]
  9. Qiu, B.J.; Li, K.; Shen, C.J.; Xu, X.C.; Mao, H.P. Experiment on response characteristics of variable-rate continuous spraying system. Trans. Chin. Soc. Agric. Mach. 2010, 41, 32–35. (In Chinese) [Google Scholar]
  10. Gonzalez, R.; Pawlowski, A.; Rodriguez, C.; Guzman, J.L.; Sanchez-Hermosilla, J. Design and implementation of an automatic pressure-control system for a mobile sprayer for greenhouse applications. Span. J. Agric. Res. 2012, 10, 939–949. [Google Scholar] [CrossRef] [Green Version]
  11. Shahemabadi, A.R.; Moayed, M.J. An algorithm for pulsed activation of solenoid valves for variable rate application of agricultural chemical. IEEE Int. Symp. Inf. Technol. 2008, 4, 1–3. [Google Scholar]
  12. Reyes, J.F.; Esquivel, W.; Cifuentes, D.; Ortega, R. Field testing of an automatic control system for variable rate fertilizer application. Comput. Electron. Agric. 2015, 113, 260–265. [Google Scholar] [CrossRef]
  13. Farooque, A.A.; Chang, Y.K.; Zaman, Q.U.; Groulx, D.; Schumann, A.W.; Esau, T.J. Performance evaluation of multiple ground based sensors mounted on a commercial wild blueberry harvester to sense plant height, fruit yield and topographic features in real-time. Comput. Electron. Agric. 2013, 91, 135–144. [Google Scholar] [CrossRef]
  14. Yalew, S.G.; Griensven, V.A.; Zaag, V.P. AgriSuit: A web-based GIS-MCDA framework for agricultural land suitability assessment. Comput. Electron. Agric. 2016, 128, 1–8. [Google Scholar] [CrossRef]
  15. Jiang, H.; Zhang, L.; Shi, W. Effects of Operating Parameters for Dynamic PWM Variable Spray System on Spray Distribution Uniformity. IFAC-PapersOnLine 2016, 49, 216–220. [Google Scholar] [CrossRef]
  16. Wang, D.S.; Zhang, J.X.; Li, W.; Xiong, B.; Zhang, S.L. Design and test of the dynamic variable spraying system of plant protection UAV. Trans. Chin. Soc. Agric. Mach. 2017, 48, 86–93. (In Chinese) [Google Scholar]
  17. Chen, S.D.; Lan, Y.B.; Li, J.Y.; Zhou, Z.Y.; Liu, A.M.; Mao, Y.D. Effect of wind field below unmanned helicopter on droplet deposition distribution of aerial spraying. Int. J. Agric. Biol. Eng. 2017, 10, 67–77. [Google Scholar]
  18. Gonzalez-de-Soto, M.; Emmi, L.; Perez-Ruiz, M.; Aguera, J.; Gonzalez-de-Santos, P. Autonomous systems for precise spraying–Evaluation of a robotised patch sprayer. Biosyst. Eng. 2016, 146, 165–182. [Google Scholar] [CrossRef]
  19. El Aissaoui, A. A Feasibility Study of Direct Injection Spraying Technology for Small Scale Farms: Modeling and Design of a Process Control System; Universite de Liege: Liege, Belgique, 2015. [Google Scholar]
  20. Yin, D.F.; Chen, S.R.; Pei, W.C.; Shen, B.G. Design of map-based indoor variable weed spraying system. Trans. Chin. Soc. Agric. Eng. 2011, 27, 131–135. (In Chinese) [Google Scholar]
  21. Llorens, J.; Gil, E.; Llop, J.; Escola, A. Ultrasonic and LIDAR sensors for electronic canopy characterization in vineyards: Advances to improve pesticide application methods. Sensors 2011, 11, 2177–2194. [Google Scholar] [CrossRef]
  22. Cai, X.; Walgenbach, M.; Doerpmond, M.; Schulze, L.P.; Sun, Y. Closed-Loop Control of Chemical Injection Rate for a Direct Nozzle Injection System. Sensors 2016, 16, 127. [Google Scholar] [CrossRef] [PubMed]
  23. Deng, W.; Zhao, C.; Chen, L.; Wang, X. Constant pressure control for variable-rate spray using closed-loop proportion integration differentiation regulation. J. Agric. Eng. 2016, 47, 148–156. [Google Scholar] [CrossRef]
  24. Qin, Y.; Sun, L.; Hua, Q.; Liu, P. A Fuzzy Adaptive PID Controller Design for Fuel Cell Power Plant. Sustainability 2018, 10, 2438. [Google Scholar] [CrossRef]
  25. Xue, X.Y.; Tu, K.; Qin, W.C.; Lan, Y.B.; Zhang, H.H. Drift and deposition of ultra-low altitude and low volume application in paddy field. Int. J. Agric. Biol. Eng. 2014, 7, 23–28. [Google Scholar]
  26. Salyani, M.; Fox, R.D. Performance of Image Analysis for Assessment of Simulated Spray Droplet Distribution. Trans. ASAE 1994, 37, 1083–1089. [Google Scholar] [CrossRef]
  27. Kesterson, M.A.; Luck, J.D.; Sama, M.P. Development and preliminary evaluation of a spray deposition sensing system for improving pesticide application. Sensors 2015, 15, 31965–31972. [Google Scholar] [CrossRef]
  28. Gil, E.; Llorens, J.; Llop, J.; Fabregas, X.; Gallart, M. Use of a terrestrial LIDAR sensor for drift detection in vineyard spraying. Sensors 2013, 13, 516–534. [Google Scholar] [CrossRef] [Green Version]
  29. Zhu, H.; Salyani, M.; Fox, R.D. A portable scanning system for evaluation of spray deposit distribution. Comput. Electron. Agric. 2011, 76, 38–43. [Google Scholar] [CrossRef]
  30. Yao, W.X.; Lan, Y.B.; Wang, J.; Wen, S.; Wang, G.B. Droplet drift characteristics of aerial spraying of AS350B3e helicopter. Trans. Chin. Soc. Agric. Eng. 2017, 33, 75–83. (In Chinese) [Google Scholar]
  31. Zhai, C.Y.; Wang, X.; Liu, D.Y.; Ma, W.; Mao, Y.J. Nozzle flow model of high pressure variable-rate spraying based on PWM technology. Adv. Mater. Res. 2011, 422, 208–217. [Google Scholar] [CrossRef]
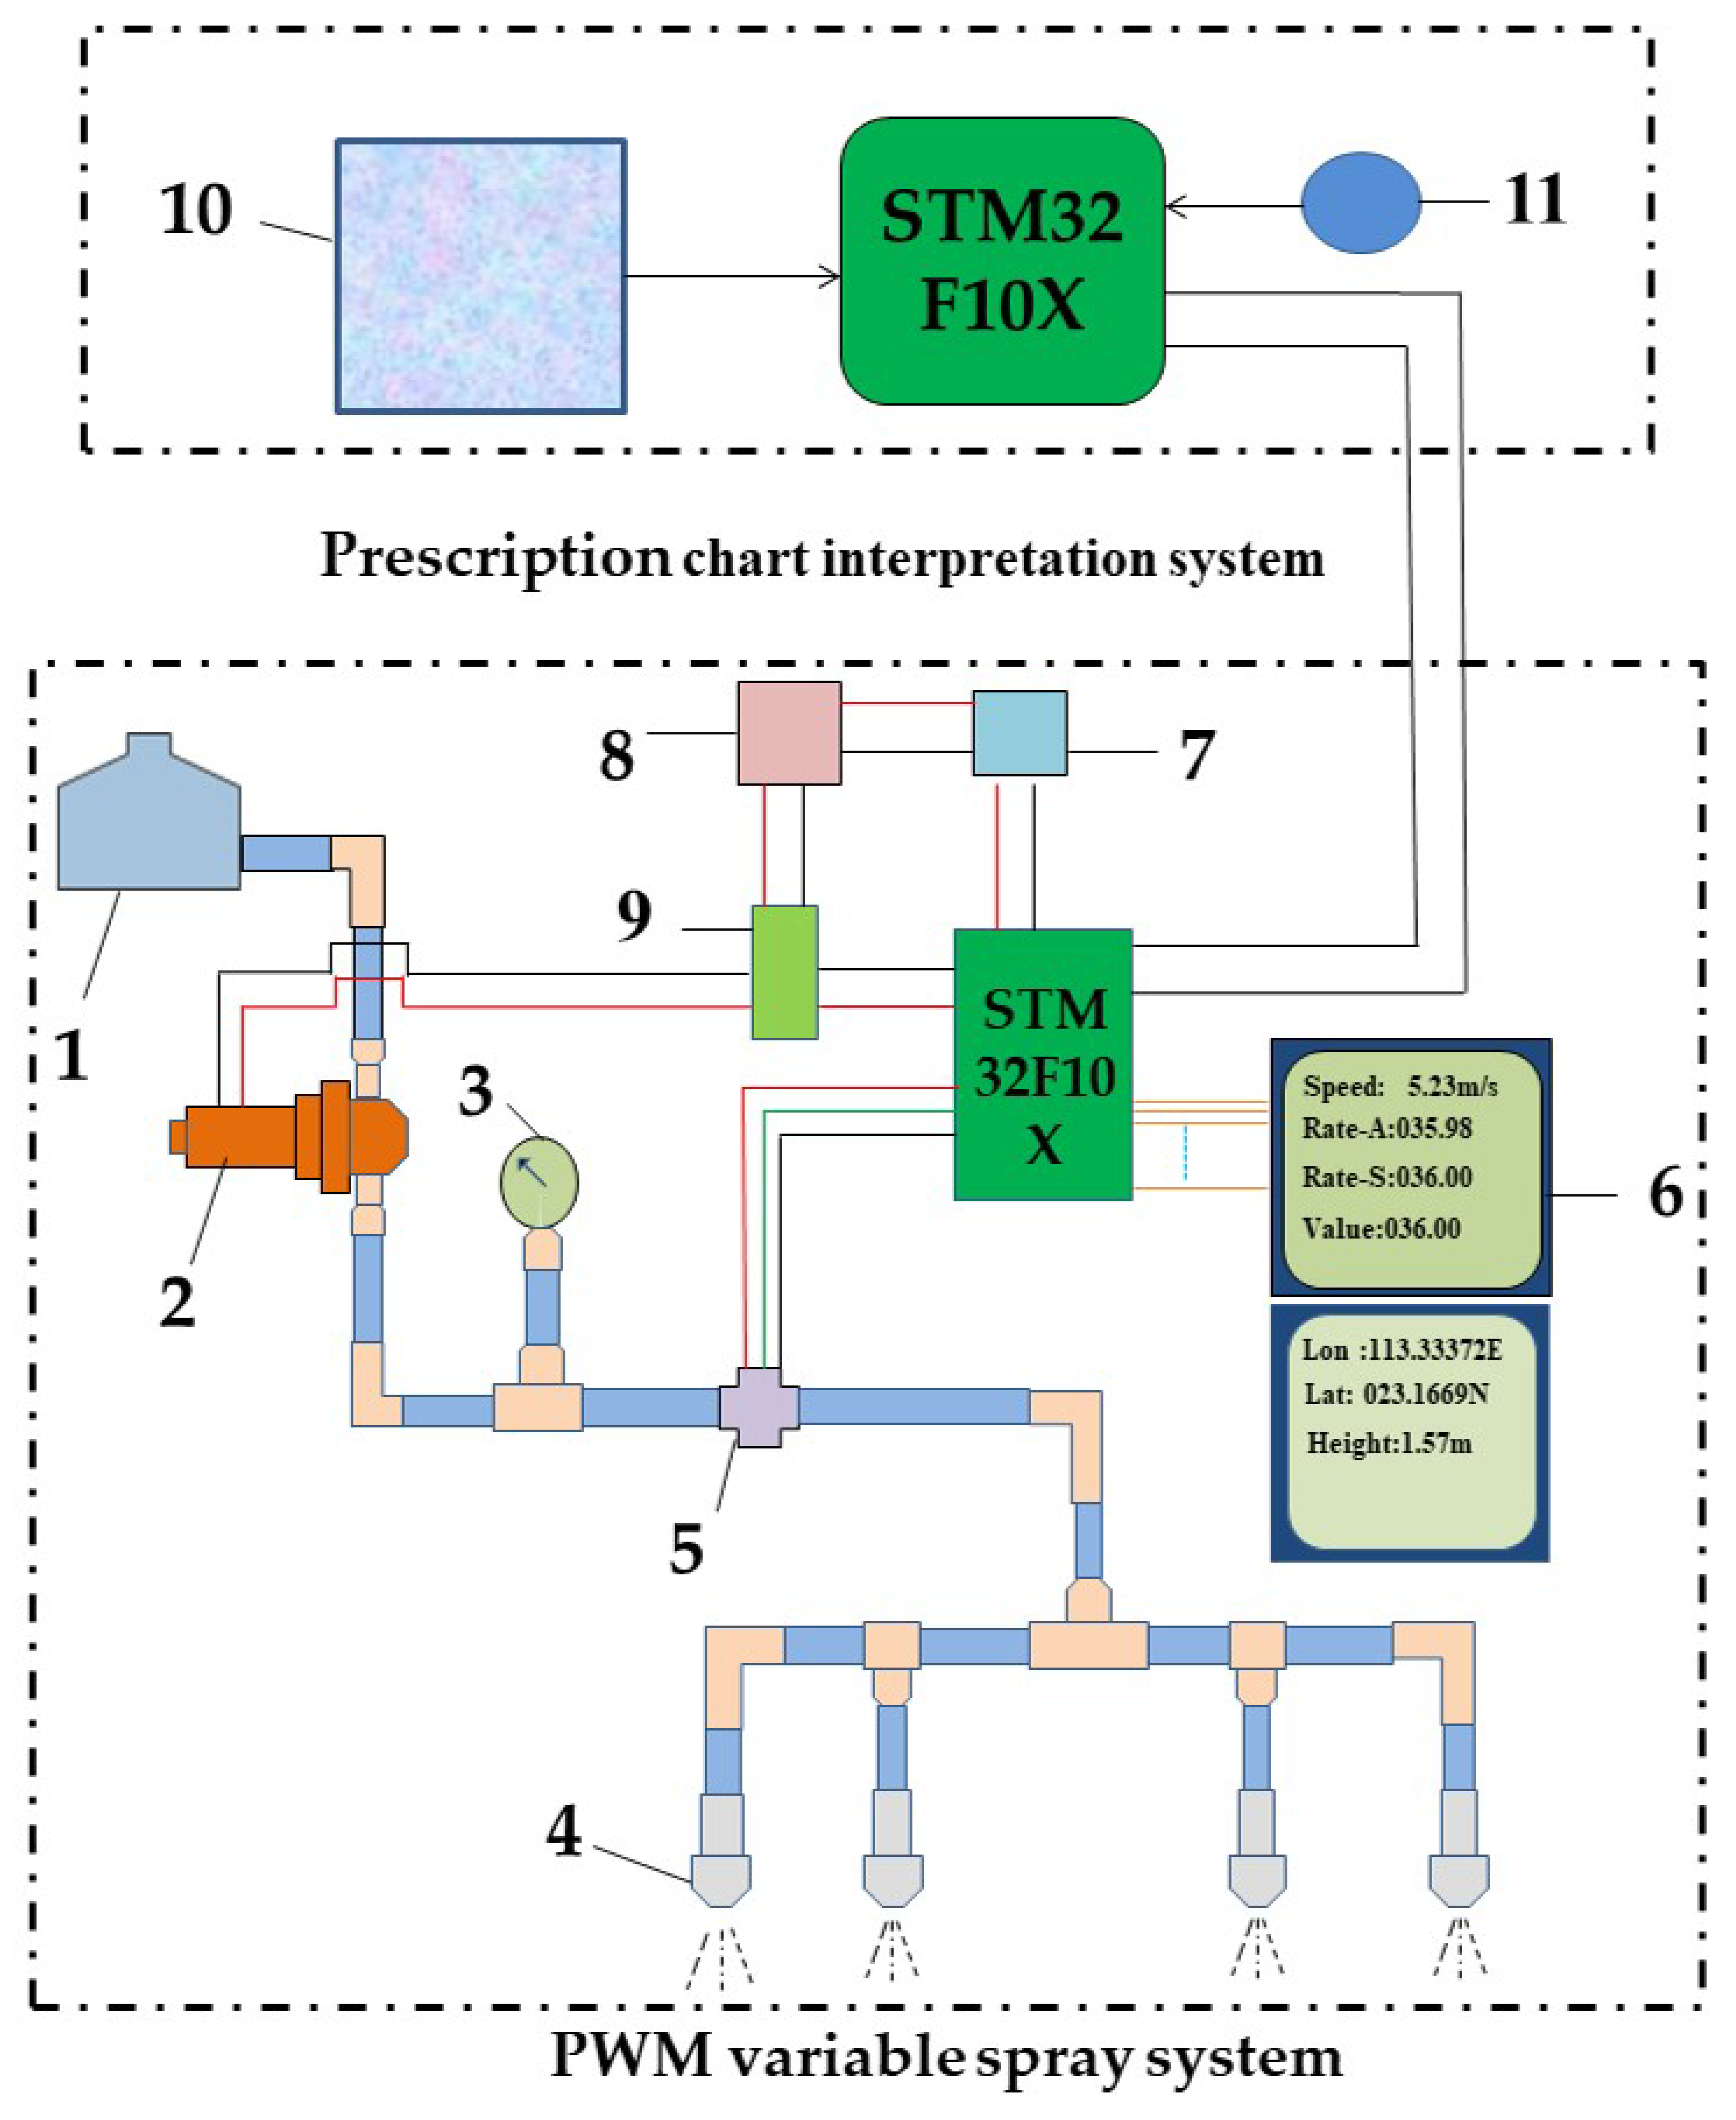
Figure 1. Schematic diagram of the structure of a prescription graphical interpretation of a variable spray system. PWM: pulse width modulation. Note: 1. Medicine box; 2. micro-diaphragm pump; 3. digital pressure gague; 4. pressure nozzle; 5. hall flow sensor; 6. liquid crystal display (LCD); 7. buck module; 8. 12 V direct-current (DC) power; 9. drive amplification module; 10. prescription figure; 11. GPS.
Applsci 08 02482 g001
Figure 2. Sketch map of target plot.
Applsci 08 02482 g002
Figure 3. Prescription value setting in each operation unit.
Applsci 08 02482 g003
Figure 4. Structure chart of prescription map.
Applsci 08 02482 g004
Figure 5. Schematic diagram of hardware representing a prescription graphic translation system.
Applsci 08 02482 g005
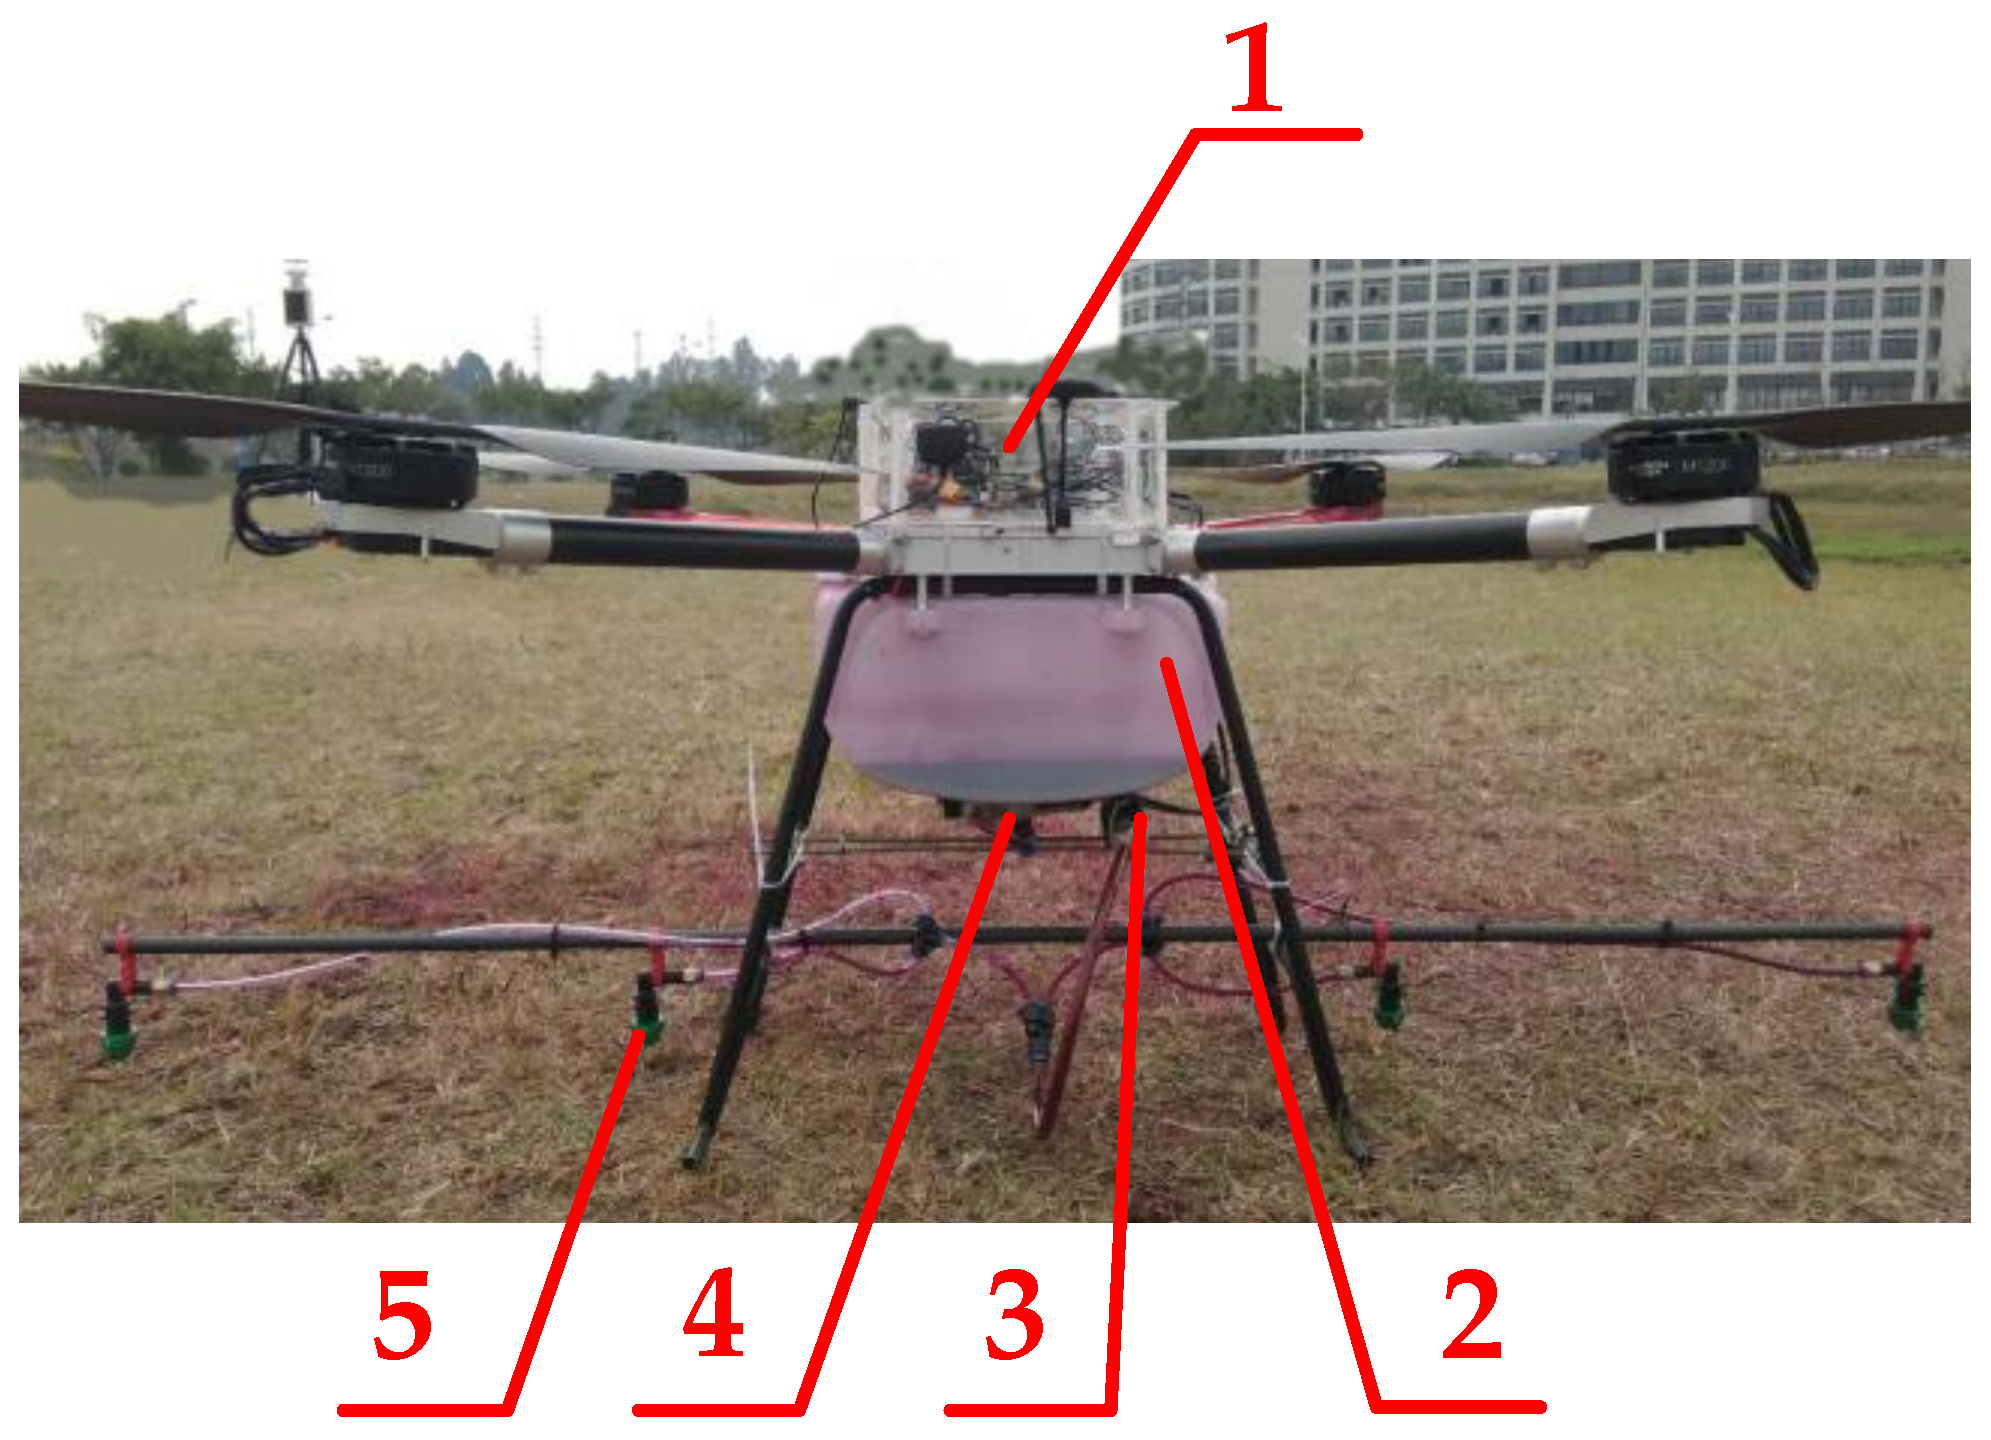
Figure 6. Physical diagram of the variable spraying system. Note: 1. Prescription map interpretation system and spray controller; 2. medicine case; 3. Hall flow sensor; 4. miniature diaphragm pump; 5. pressure nozzle.
Applsci 08 02482 g006
Figure 7. Schematic of hardware representing the variable spray controller.
Applsci 08 02482 g007
Figure 8. Velocity curve of the miniature diaphragm pump.
Applsci 08 02482 g008
Figure 9. Schematic diagram of nozzle installation. Note: H is the height of the GPS from the top of the crop in me; h is the height of the nozzle from the top of the crop in m; L is the installation distance of the adjacent nozzle in m; d is the spray nozzle of the corresponding height in m; M is the width of the overlap area of the adjacent nozzles in m; K is a certain time, with the distance of the drone flight in m; D is the effective spray width of the drone in m.
Applsci 08 02482 g009
Figure 10. Program flow chart.
Applsci 08 02482 g010
Figure 11. PID regulation simulation model.
Applsci 08 02482 g011
Figure 12. PID control and unregulated step response curve.
Applsci 08 02482 g012
Figure 13. Droplet spectra of different PWM square wave duty ratios: (a) droplet spectrum with a duty ratio of 40%; (b) droplet spectrum with a duty ratio of 100%.
Applsci 08 02482 g013aApplsci 08 02482 g013b
Figure 14. Spray angle of different PWM square wave duty ratios with a duty cycle of 40% (a) and a duty cycle of 100% (b). Note: θ is the spray angle.
Applsci 08 02482 g014
Figure 15. Spray test site.
Applsci 08 02482 g015
Figure 16. Inner sampling bands of adjacent operation units. Note: S1, S2, S3, S4, S5, S6, S7, S8, S9, S10, S11, S12, and S13 are the numbers of the collection bands.
Applsci 08 02482 g016
Figure 17. Layout of the Mylar card and water-sensitive paper.
Applsci 08 02482 g017
Figure 18. Rhodamine B solution standard concentration absorbance curve.
Applsci 08 02482 g018
Figure 19. Grayscale image of water-sensitive paper.
Applsci 08 02482 g019
Figure 20. Droplet deposition in center line of operational unit: (a) third sortie; (b) fourth sortie.
Applsci 08 02482 g020
Figure 21. Droplet depositions in various sorties: (a) first sortie; (b) second sortie; (c) third sortie; (d) fourth sortie.
Applsci 08 02482 g021aApplsci 08 02482 g021b
Figure 22. Droplet depositions in operation units.
Applsci 08 02482 g022
Table 1. Diameter of droplet volume and spray angle at different duty ratios of PWM square waves.
Duty Cycle (%)Volume Diameter (μm)Spray Angle (°)
4099.8198
4598.7299
5097.8597
5597.4699
6097.3298
6597.0799
7096.73100
7596.7798
8096.49101
8596.26102
9095.79104
9595.65105
10094.59105
Table 2. System flow deviation.
Duty Cycle (%)Target Flow Rate (L·min−1)Actual Flow Rate (L·min−1)Deviation (%)
400.15500.15082.71
450.17050.16821.35
500.18600.18051.34
550.20720.19505.89
600.23240.22901.46
650.29450.28941.73
700.35640.34872.16
750.37740.36832.41
800.41840.40972.08
850.45720.44931.73
900.49590.48502.20
950.51160.50641.02
1000.52680.51592.07
Table 3. Test environment parameter list.
SortiesTemperature (°C)Humidity (%)Wind Speed and Direction (m·s−1)
119.554.30.54/SW
220.154.20.78/SW
321.353.90.84/SW
422.653.70.47/SW
Table 4. Statistics of droplet coverage density.
SortieUnitSampling PointAverageCoefficient of Variation
−4−3−2−101234
First1616192944312314925.1438.07%
32.5%
237.77%
2217223781542210834.71
301519264734176023.43
413265712316911541231279.14
5191639732718702756.88%
72.48%
60142345137672416346.57
Second1012192441312016423.2959.47%
28.08%
73.83%
2916223793492914037.14
3015233655291613126.71
44213359143372012046.4347.9%
113.54%
51615236931187024.15
63142967115893215351.57
Table 5. Droplet deposition at the boundary of operational unit.
UnitPrescription Value (L·hm−2)Sampling BandDeposition (μg·cm−2)
17.5S222.58
S321.89
BoundaryS420.63
215S535.68
S639.43
S739.21
S840.28
S938.64
BoundaryS1039.46
37.5S1127.64
S1223.64
S1324.06
S1421.96
S1522.68
BoundaryS1623.07
437.5S1769.76
S18129.87
S19134.26