Investigating the Linkage between Economic Growth, Electricity Access, Energy Use, and Population Growth in Pakistan


Abstract
1. Introduction
2. Existing Literature
3. Materials and Methods
3.1. Data Source
3.2. Model Specification
4. Empirical Estimation Strategy
4.1. Unit Root Test for Stationarity
4.2. Cointegration with ARDL Model
5. Results and Discussions
5.1. Unit Root Tests Results
5.2. Cointegration Test
5.3. Long-Run Analysis Results
5.4. Short-Run Analysis Results
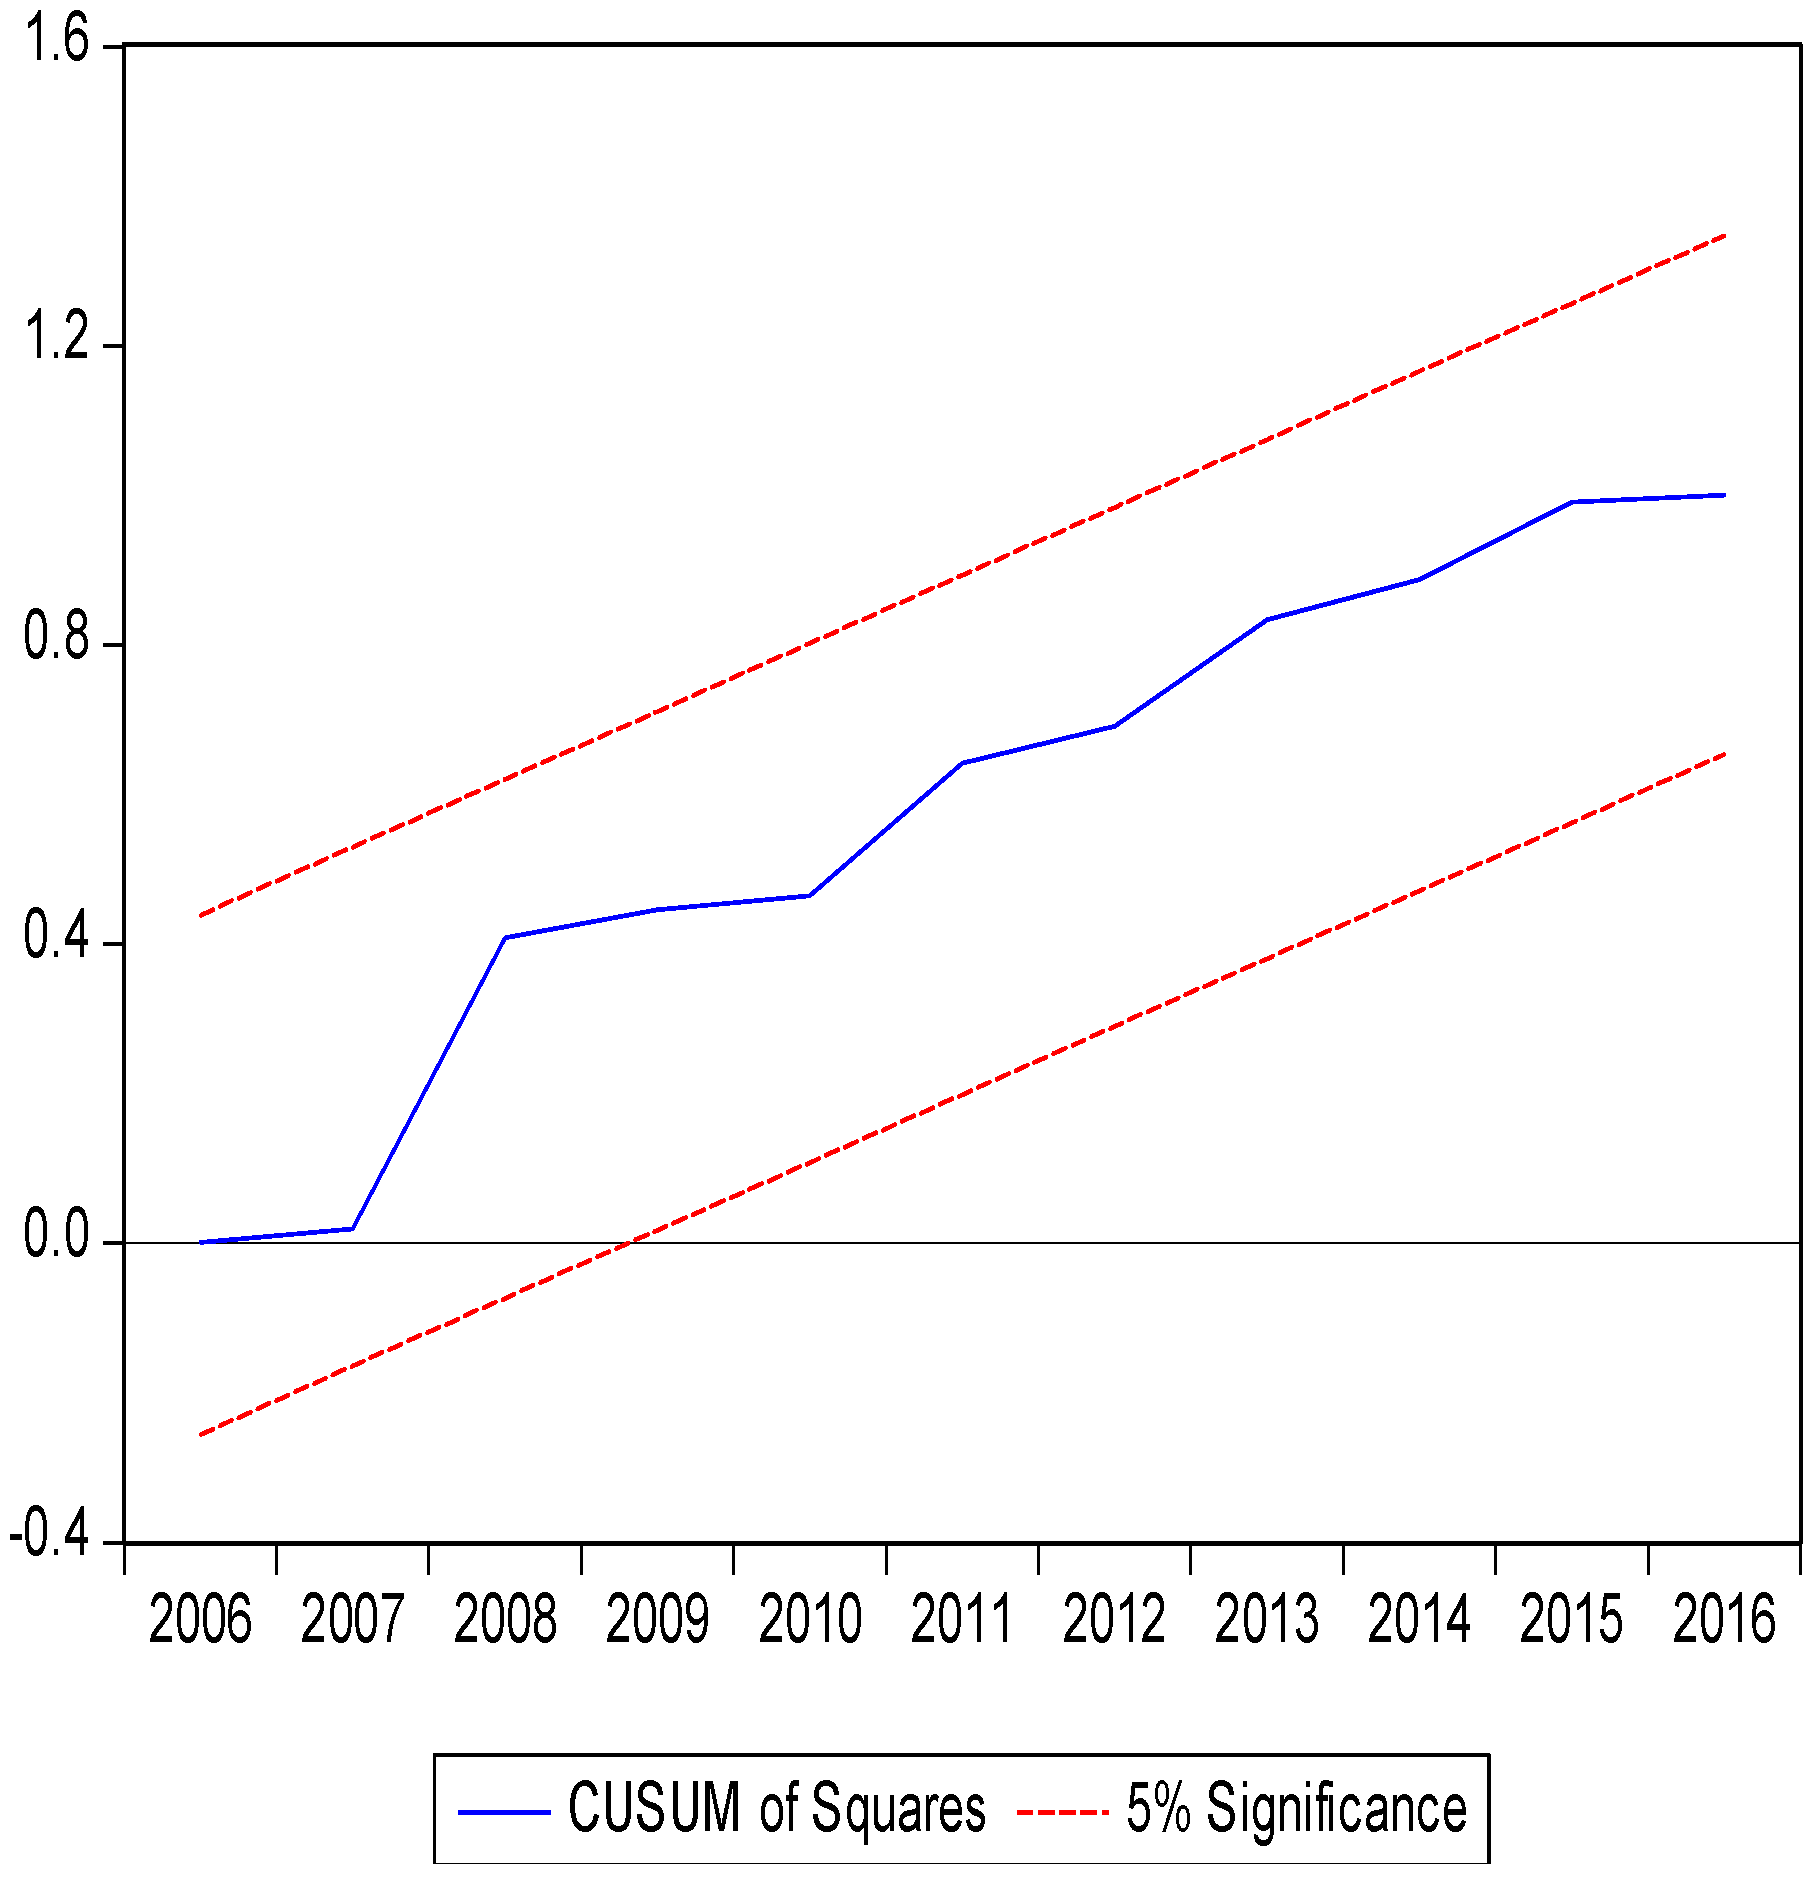
5.5. Structural Stability Test
6. Conclusions and Recommendation
Author Contributions
Funding
Acknowledgments
Conflicts of Interest
References
- Arrillaga, J.; Bradley, D.; Bodger, P.S. Power System Harmonics; John Wiley & Sons: Hoboken, NJ, USA, 1985. [Google Scholar]
- Dugan, R.C.; McGranaghan, M.F.; Beaty, H.W.; Santoso, S. Electrical Power Systems Quality; Mcgraw-Hill: New York, NY, USA, 1996; Volume 2. [Google Scholar]
- Arrillaga, J.; Smith, B.C.; Watson, N.R.; Wood, A.R. Power System Harmonic Analysis; John Wiley & Sons: New York, NY, USA, 1997. [Google Scholar]
- Caciotta, M.; Leccese, F.; Trifirò, T. From power quality to perceived power quality. In Proceedings of the IASTED International Conference on Energy and Power Systems, Chiang Mai, Thailand, 29–31 March 2006; pp. 94–102. [Google Scholar]
- Government of Pakistan. Pakistan Economic Survey 2013–2014; Ministry of Finance, Finance Division, Economic Adviser’s Wing: Islamabad, Pakistan, 2014.
- SESRIC (The Statistical, Economic and Social Research and Training Centre for Islamic Countries). 2014. Available online: http://www.sesric.org/publications-books.php?year=2014 (accessed on 27 September 2018).
- World Bank. Doing Business 2014: Understanding Regulations for Small and Medium-Size Enterprises; World Bank: Washington, DC, USA, 2014; Available online: http://www.doingbusiness.org/reports/global-reports/doing-business-2014 (accessed on 13 October 2018).
- De Abreu, J.P.G.; Emanuel, A.E. The need to limit subharmonics injection. In Proceedings of the Ninth International Conference on Harmonics and Quality of Power, Orlando, FL, USA, 1–4 October 2000; Volume 1, pp. 251–253. [Google Scholar]
- Fuchs, E.F. Power Qualityin Power Systems and Electric Machines; ECEN 5787, Course Notes; Department of Electrical and Computer Engineering, University of Colorado: Boulder, CO, USA, 2005. [Google Scholar]
- Leccese, F. Rome, a first example of Perceived Power Quality of electrical energy: The telecommunication point of view. In Proceedings of the 29th International Telecommunications Energy Conference, Rome, Italy, 30 September–4 October 2007; pp. 369–372. [Google Scholar]
- Rehman, A.; Jingdong, L.; Shahzad, B.; Chandio, A.A.; Hussain, I.; Nabi, G.; Iqbal, M.S. Economic perspectives of major field crops of Pakistan: An empirical study. Pac. Sci. Rev. B Humanit. Soc. Sci. 2015, 1, 145–158. [Google Scholar] [CrossRef]
- Government of Pakistan. Pakistan Economic Survey 2010–2011; Ministry of Finance, Finance Division, Economic Adviser’s Wing: Islamabad, Pakistan, 2011.
- Pakistan Energy Yea book 2012; Hydrocarbon Development Institute of Pakistan, Ministry of Petroleum and Natural Resources, Government of Pakistan: Islamabad, Pakistan, 2012.
- Sahir, M.H.; Qureshi, A.H. Assessment of new and renewable energy resources potential and identification of barriers to their significant utilization in Pakistan. Renew. Sustain. Energy Rev. 2008, 12, 290–298. [Google Scholar] [CrossRef]
- Government of Pakistan. Pakistan Economic Survey 2012–2013; Ministry of Finance, Finance Division, Economic Adviser’s Wing: Islamabad, Pakistan, 2013.
- KazmiZ. Pakistan’s Energy Security. 2014. Available online: http://tribune.com.pk/tory/655573/pakistans-energy-security (accessed on 13 September 2018).
- Santoyo-Castelazo, E.; Azapagic, A. Sustainability assessment of energy systems: Integrating environmental, economic and social aspects. J. Clean. Prod. 2014, 80, 119–138. [Google Scholar] [CrossRef]
- NEPRA (National Electric Power Regulatory Authority). State of Industry Report 2015. Available online: http://nepra.org.pk/industryreports.htm (accessed on 10 September 2018).
- Government of Pakistan. National Power Policy Pakistan; Islamabad, Pakistan; 2015. Available online: http://www.ppib.gov.pk/Power%20Policy%202015.pdf (accessed on 29 September 2018).
- Government of Pakistan. National Power Policy Pakistan; Islamabad, Pakistan; 2013. Available online: www.ppib.gov.pk/National%20Power%20Policy%202013.pdf (accessed on 29 September 2018).
- Maxim, A. Sustainability assessment of electricity generation technologies using weighted multi-criteria decision analysis. Energy Policy 2014, 65, 284–297. [Google Scholar] [CrossRef]
- Government of Pakistan. Pakistan Economic Survey 2014–2015; Ministry of Finance, Finance Division, Economic Adviser’s Wing: Islamabad, Pakistan, 2015.
- Valasai, G.D.; Uqaili, M.A.; Memon, H.R.; Samoo, S.R.; Mirjat, N.H.; Harijan, K. Overcoming electricity crisis in Pakistan: A review of sustainable electricity options. Renew. Sustain. Energy Rev. 2017, 72, 734–745. [Google Scholar] [CrossRef]
- Danish, M.; Naqvi, M.; Farooq, U.; Naqvi, S. Characterization of South Asian agricultural residues for potential utilization in future ‘energy mix’. Energy Procedia 2015, 75, 2974–2980. [Google Scholar] [CrossRef]
- Palit, D.; Bandyopadhyay, K.R. Rural electricity access in South Asia: Is grid extension the remedy? A critical review. Renew. Sustain. Energy Rev. 2016, 60, 1505–1515. [Google Scholar] [CrossRef]
- Rauf, O.; Wang, S.; Yuan, P.; Tan, J. An overview of energy status and development in Pakistan. Renew. Sustain. Energy Rev. 2015, 48, 892–931. [Google Scholar] [CrossRef]
- Naseem, I.; Khan, J. Impact of energy crisis on economic growth of Pakistan. Int. J. Afr. Asian Stud. 2015, 7, 33–43. [Google Scholar]
- Aziz, R.; Ahmad, M.B. Pakistan’s Power Crisis: Special Report. 2015. Available online: http://www.usip.org/sites/default/files/SR375-Pakistans-Power-Crisis-The-Way-Forward.pdf (accessed on 28 September 2018).
- Kessides, I.N. Chaos in power: Pakistan’s electricity crisis. Energy Policy 2013, 55, 271–285. [Google Scholar] [CrossRef]
- Raza, W.; Hammad, S.; Shams, U.; Maryam, A.; Mahmood, S.; Nadeem, R. Renewable energy resources current status and barriers in their adaptation for Pakistan. J. Bioprocess Chem. Eng. 2015, 3, 1–9. [Google Scholar]
- Nisar, J.; Razaq, R.; Farooq, M.; Iqbal, M.; Khan, R.A.; Sayed, M.; Shah, A.; ur Rahman, I. Enhanced biodiesel production from Jatropha oil using calcined waste animal bones as catalyst. Renew. Energy 2017, 101, 111–119. [Google Scholar] [CrossRef]
- Government of Pakistan, Ministry of Finance. 2016. Available online: http://www.finance.gov.pk/survey/chapters_13/14-Energy.pdf (accessed on 5 October 2018).
- Uddin, W.; Khan, B.; Shaukat, N.; Majid, M.; Mujtaba, G.; Mehmood, A.; Ali, S.M.; Younas, U.; Anwar, M.; Almeshal, A.M. Biogas potential for electric power generation in Pakistan: A survey. Renew. Sustain. Energy Rev. 2016, 54, 25–33. [Google Scholar] [CrossRef]
- Kantar, E.; Keskin, M. The relationships between electricity consumption and GDP in Asian countries, using hierarchical structure methods. Phys. A Stat. Mech. Appl. 2013, 392, 5678–5684. [Google Scholar] [CrossRef]
- Karanfil, F.; Li, Y. Electricity consumption and economic growth: Exploring panel-specific differences. Energy Policy 2015, 82, 264–277. [Google Scholar] [CrossRef]
- Guerrero, J.M.; Blaabjerg, F.; Zhelev, T.; Hemmes, K.; Monmasson, E.; Jemei, S.; Comech, M.P.; Granadino, R.; Frau, J.I. Distributed generation: Toward a new energy paradigm. IEEE Ind. Electron. Mag. 2010, 4, 52–64. [Google Scholar] [CrossRef]
- Ali, G.; Bashir, M.K.; Ali, H.; Bashir, M.H. Utilization of rice husk and poultry wastes for renewable energy potential in Pakistan: An economic perspective. Renew. Sustain. Energy Rev. 2016, 61, 25–29. [Google Scholar] [CrossRef]
- Khan, S.A.R.; Zaman, K.; Zhang, Y. The relationship between energy-resource depletion, climate change, health resources and the environmental Kuznets curve: Evidence from the panel of selected developed countries. Renew. Sustain. Energy Rev. 2016, 62, 468–477. [Google Scholar] [CrossRef]
- Arshad, M.; Bano, I.; Khan, N.; Shahzad, M.I.; Younus, M.; Abbas, M.; Iqbal, M. Electricity generation from biogas of poultry waste: An assessment of potential and feasibility in Pakistan. Renew. Sustain. Energy Rev. 2018, 81, 1241–1246. [Google Scholar] [CrossRef]
- Shahbaz, M.; Lean, H.H. The dynamics of electricity consumption and economic growth: A revisit study of their causality in Pakistan. Energy 2012, 39, 146–153. [Google Scholar] [CrossRef]
- Fuller, J.F.; Fuchs, E.F.; Roesler, D.J. Influence of harmonics on power distribution system protection. IEEE Trans. Power Deliv. 1988, 3, 549–557. [Google Scholar] [CrossRef]
- Kumar, A.; Holuszko, M.; Espinosa, D.C.R. E-waste: An overview on generation, collection, legislation and recycling practices. Resour. Conserv. Recycl. 2017, 122, 32–42. [Google Scholar] [CrossRef]
- Amri, F. The relationship amongst energy consumption (renewable and non-renewable), and GDP in Algeria. Renew. Sustain. Energy Rev. 2017, 76, 62–71. [Google Scholar] [CrossRef]
- Chang, Y.C.; Wang, N. Legal system for the development of marine renewable energy in China. Renew. Sustain. Energy Rev. 2017, 75, 192–196. [Google Scholar] [CrossRef]
- Kenfack, J.; Bossou, O.V.; Tchaptchet, E. How can we promote renewable energy and energy efficiency in Central Africa? A Cameroon case study. Renew. Sustain. Energy Rev. 2017, 75, 1217–1224. [Google Scholar] [CrossRef]
- Marques, A.C.; Fuinhas, J.A.; Neves, S.A. Ordinary and Special Regimes of electricity generation in Spain: How they interact with economic activity. Renew. Sustain. Energy Rev. 2018, 81, 1226–1240. [Google Scholar] [CrossRef]
- Kamran, M. Current status and future success of renewable energy in Pakistan. Renew. Sustain. Energy Rev. 2018, 82, 609–617. [Google Scholar] [CrossRef]
- Zameer, H.; Wang, Y. Energy production system optimization: Evidence from Pakistan. Renew. Sustain. Energy Rev. 2018, 82, 886–893. [Google Scholar] [CrossRef]
- Qazi, U.; Jahanzaib, M. An integrated sectoral framework for the development of sustainable power sector in Pakistan. Energy Rep. 2018, 4, 376–392. [Google Scholar] [CrossRef]
- Rehman, A.; Deyuan, Z. Pakistan’s energy scenario: A forecast of commercial energy consumption and supply from different sources through 2030. Energy Sustain. Soc. 2018, 8, 26. [Google Scholar] [CrossRef]
- Gondal, I.A.; Masood, S.A.; Khan, R. Green hydrogen production potential for developing a hydrogen economy in Pakistan. Int. J. Hydrogen Energy 2018, 43, 6011–6039. [Google Scholar] [CrossRef]
- Narayan, P.K.; Smyth, R. Electricity consumption, employment and real income in Australia evidence from multivariate Granger causality tests. Energy Policy 2005, 33, 1109–1116. [Google Scholar] [CrossRef]
- Narayan, P.K.; Smyth, R. The residential demand for electricity in Australia: An application of the bounds testing approach to cointegration. Energy Policy 2005, 33, 467–474. [Google Scholar] [CrossRef]
- Narayan, P.K.; Smyth, R.; Prasad, A. Electricity consumption in G7 countries: A panel cointegration analysis of residential demand elasticities. Energy Policy 2007, 35, 4485–4494. [Google Scholar] [CrossRef]
- Narayan, P.K.; Smyth, R. Multivariate Granger causality between electricity consumption, exports and GDP: Evidence from a panel of Middle Eastern countries. Energy Policy 2009, 37, 229–236. [Google Scholar] [CrossRef]
- Ozturk, I. A literature survey on energy–growth nexus. Energy Policy 2010, 38, 340–349. [Google Scholar] [CrossRef]
- Ozturk, I.; Acaravci, A. CO2 emissions, energy consumption and economic growth in Turkey. Renew. Sustain. Energy Rev. 2010, 14, 3220–3225. [Google Scholar] [CrossRef]
- Ozturk, I.; Aslan, A.; Kalyoncu, H. Energy consumption and economic growth relationship: Evidence from panel data for low and middle income countries. Energy Policy 2010, 38, 4422–4428. [Google Scholar] [CrossRef]
- Shahbaz, M.; Tang, C.F.; Shabbir, M.S. Electricity consumption and economic growth nexus in Portugal using cointegration and causality approaches. Energy Policy 2011, 39, 3529–3536. [Google Scholar] [CrossRef]
- Dergiades, T.; Tsoulfidis, L. Revisiting residential demand for electricity in Greece: New evidence from the ARDL approach to cointegration analysis. Empir. Econ. 2011, 41, 511–531. [Google Scholar] [CrossRef]
- Arrillaga, J.; Watson, N.R.; Chen, S. PowerSystemQualityAssessment; Wiley: New York, NY, USA, 2000. [Google Scholar]
- Leccese, F.; Cagnetti, M.; Di Pasquale, S.; Giarnetti, S.; Caciotta, M. A new power quality instrument based on raspberry-pi. Electronics 2016, 5, 64. [Google Scholar] [CrossRef]
- Fatai, B.O. Energy consumption and economic growth nexus: Panel co-integration and causality tests for Sub-Saharan Africa. J. Energy S. Afr. 2014, 25, 93–100. [Google Scholar]
- Dickey, D.A.; Fuller, W.A. Distribution of the estimators for autoregressive time series with a unit root. J. Am. Stat. Assoc. 1979, 74, 427–431. [Google Scholar] [CrossRef]
- Phillips, P.C.; Perron, P. Testing for a unit root in time series regression. Biometrika 1988, 75, 335–346. [Google Scholar] [CrossRef]
- Pesaran, M.H.; Shin, Y. An autoregressive distributed-lag modelling approach to cointegration analysis. Econ. Soc. Monogr. 1998, 31, 371–413. [Google Scholar]
- Pesaran, M.H.; Shin, Y.; Smith, R.J. Bounds testing approaches to the analysis of level relationships. J. Appl. Econ. 2001, 16, 289–326. [Google Scholar] [CrossRef]
- Narayan, P.K. Reformulating Critical Values for the Bounds F-Statistics Approach to Cointegration: An Application to the Tourism Demand Model for Fiji; Monash University: Clayton, Australia, 2004; pp. 1–40. [Google Scholar]
- Narayan, P.K. The Saving and Investment Nexus for China: Evidence from Cointegration Tests. Appl. Econ. 2005, 37, 1979–1990. [Google Scholar] [CrossRef]
- Dergiades, T.; Tsoulfidis, L. Estimating residential demand for electricity in the United States, 1965–2006. Energy Econ. 2008, 30, 2722–2730. [Google Scholar] [CrossRef]
- Johansen, S.; Juselius, K. Maximum likelihood estimation and inference on cointegration—With applications to the demand for money. Oxf. Bull. Econ. Stat. 1990, 52, 169–210. [Google Scholar] [CrossRef]
- WAPDA. Water and Power Development Authority. 2016. Available online: http://www.wapda.gov.pk (accessed on 17 August 2018).
- Rafique, M.M.; Rehman, S. National energy scenario of Pakistan—Current status, future alternatives, and institutional infrastructure: An overview. Renew. Sustain. Energy Rev. 2017, 69, 156–167. [Google Scholar] [CrossRef]


| Variables | Explanation | Data Sources |
|---|---|---|
| GDPPC | Gross Domestic Product Per Capita | WDI |
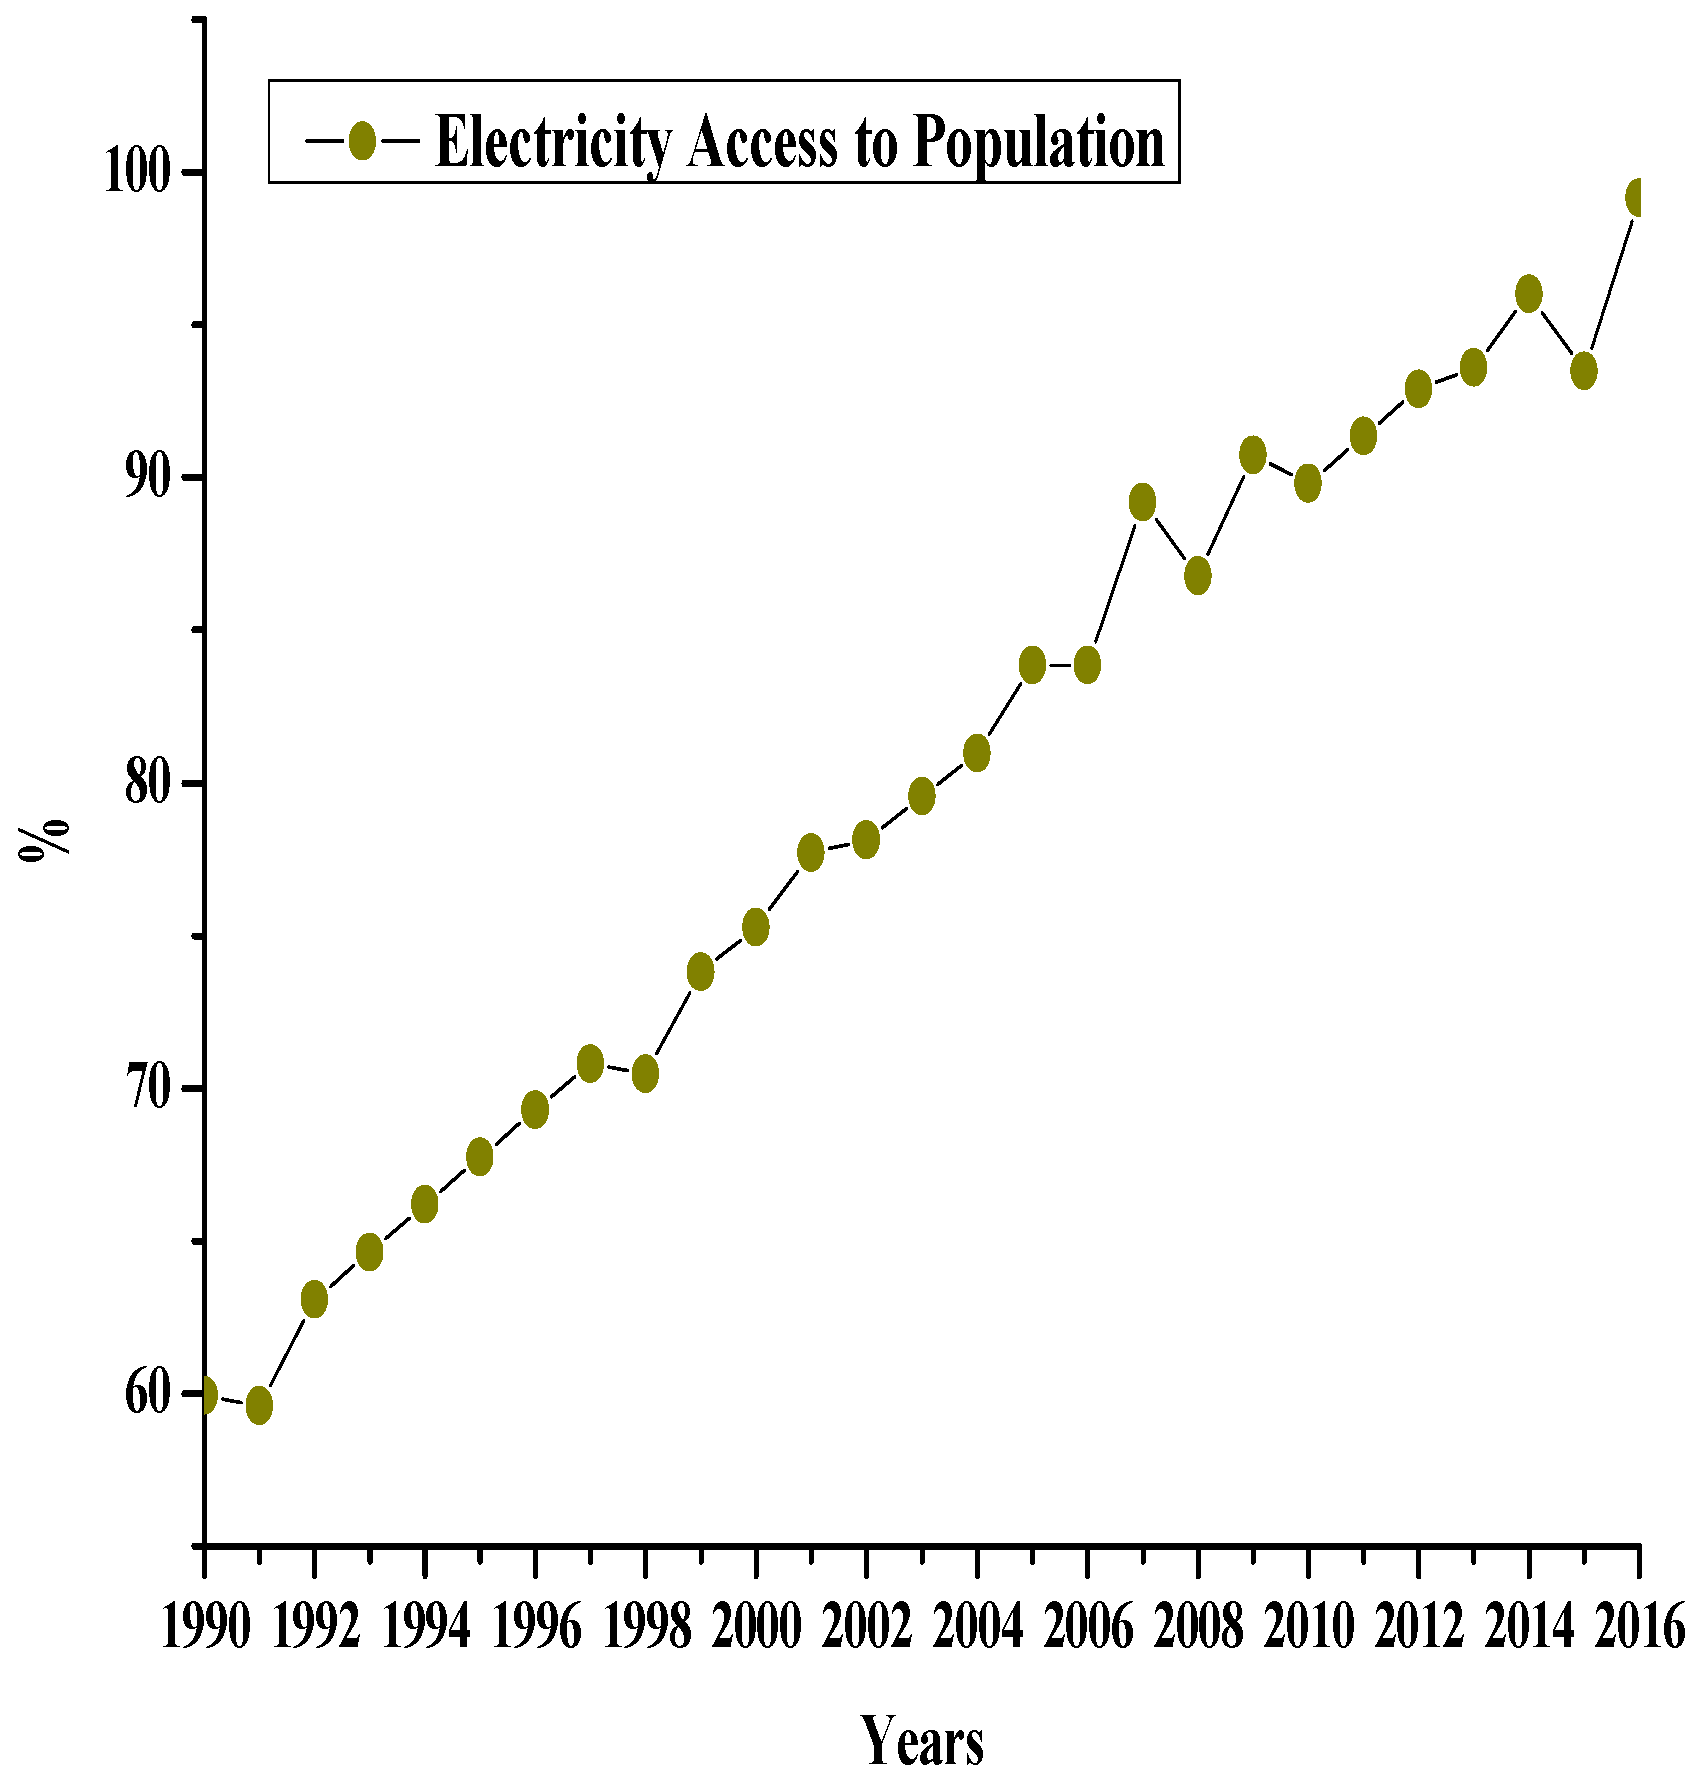
| EAP | Electricity Access to Population | WDI |
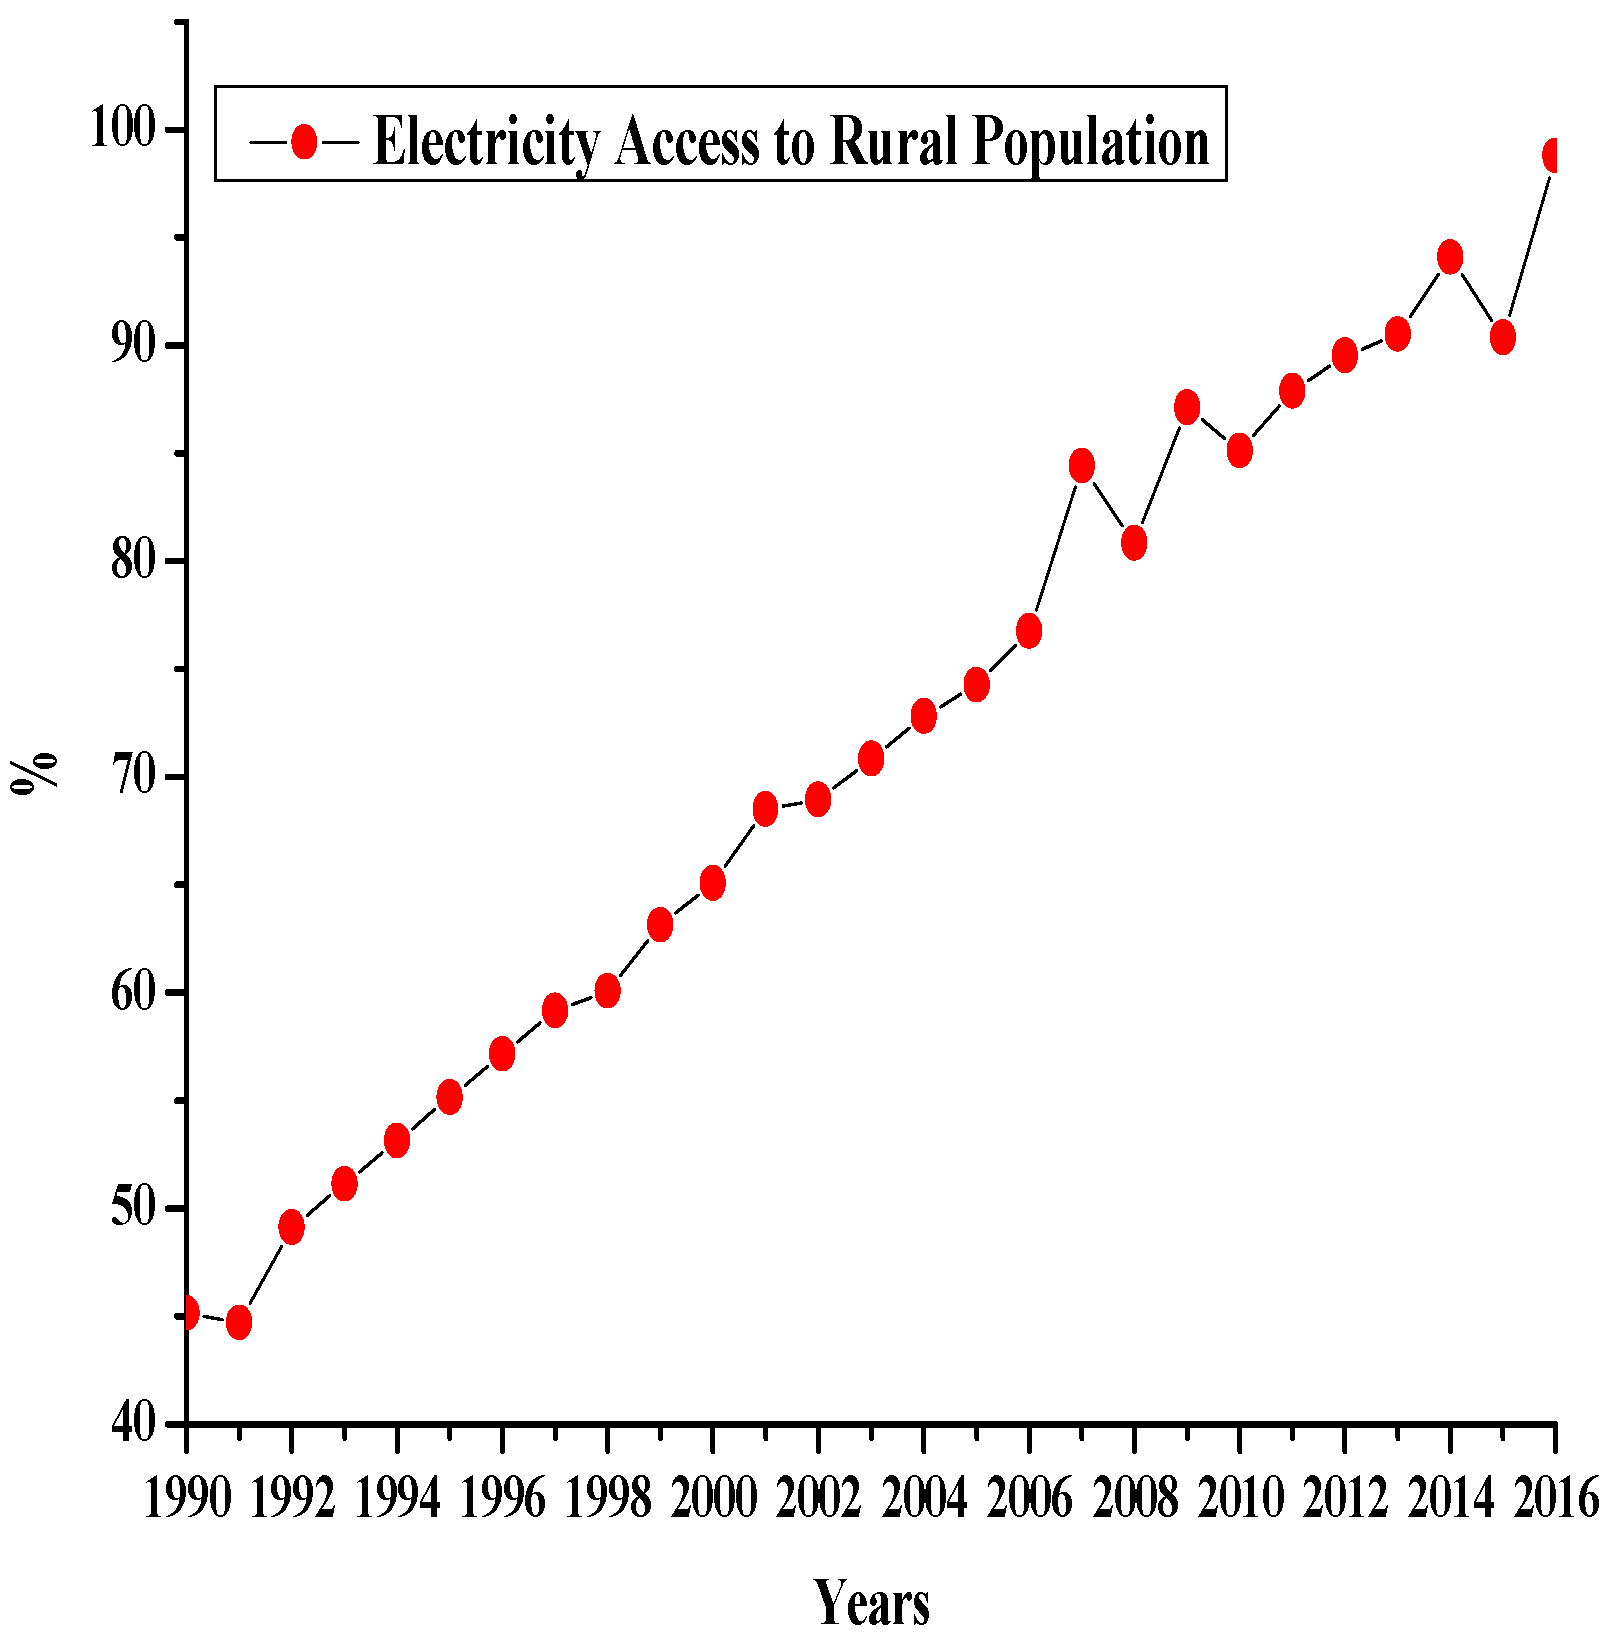
| EARP | Electricity Access to Rural Population | WDI |
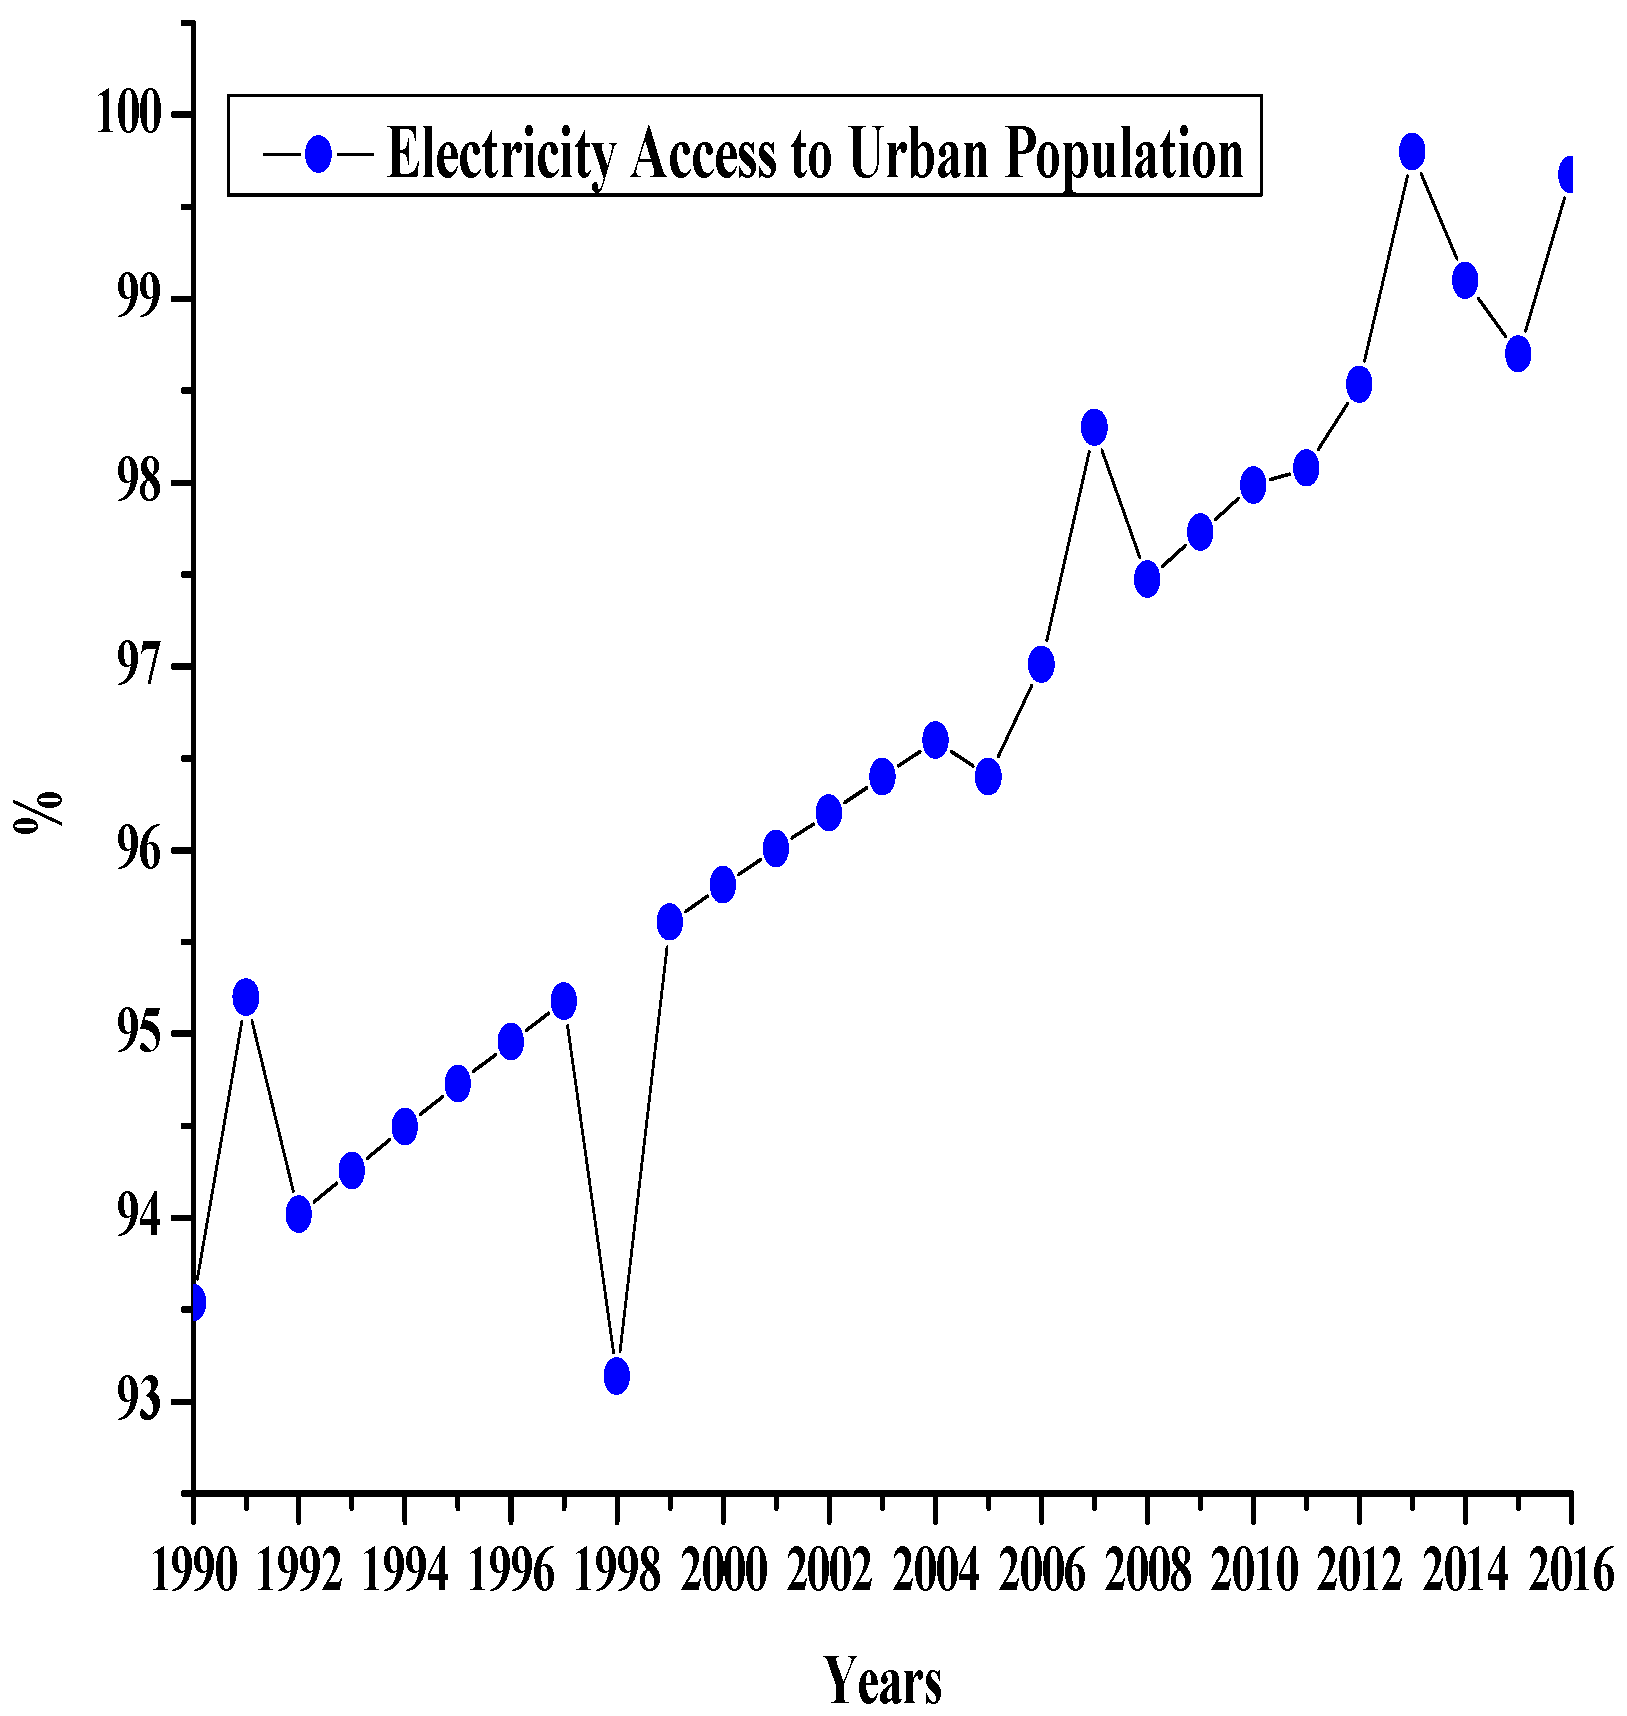
| EAUP | Electricity Access to Urban Population | WDI |
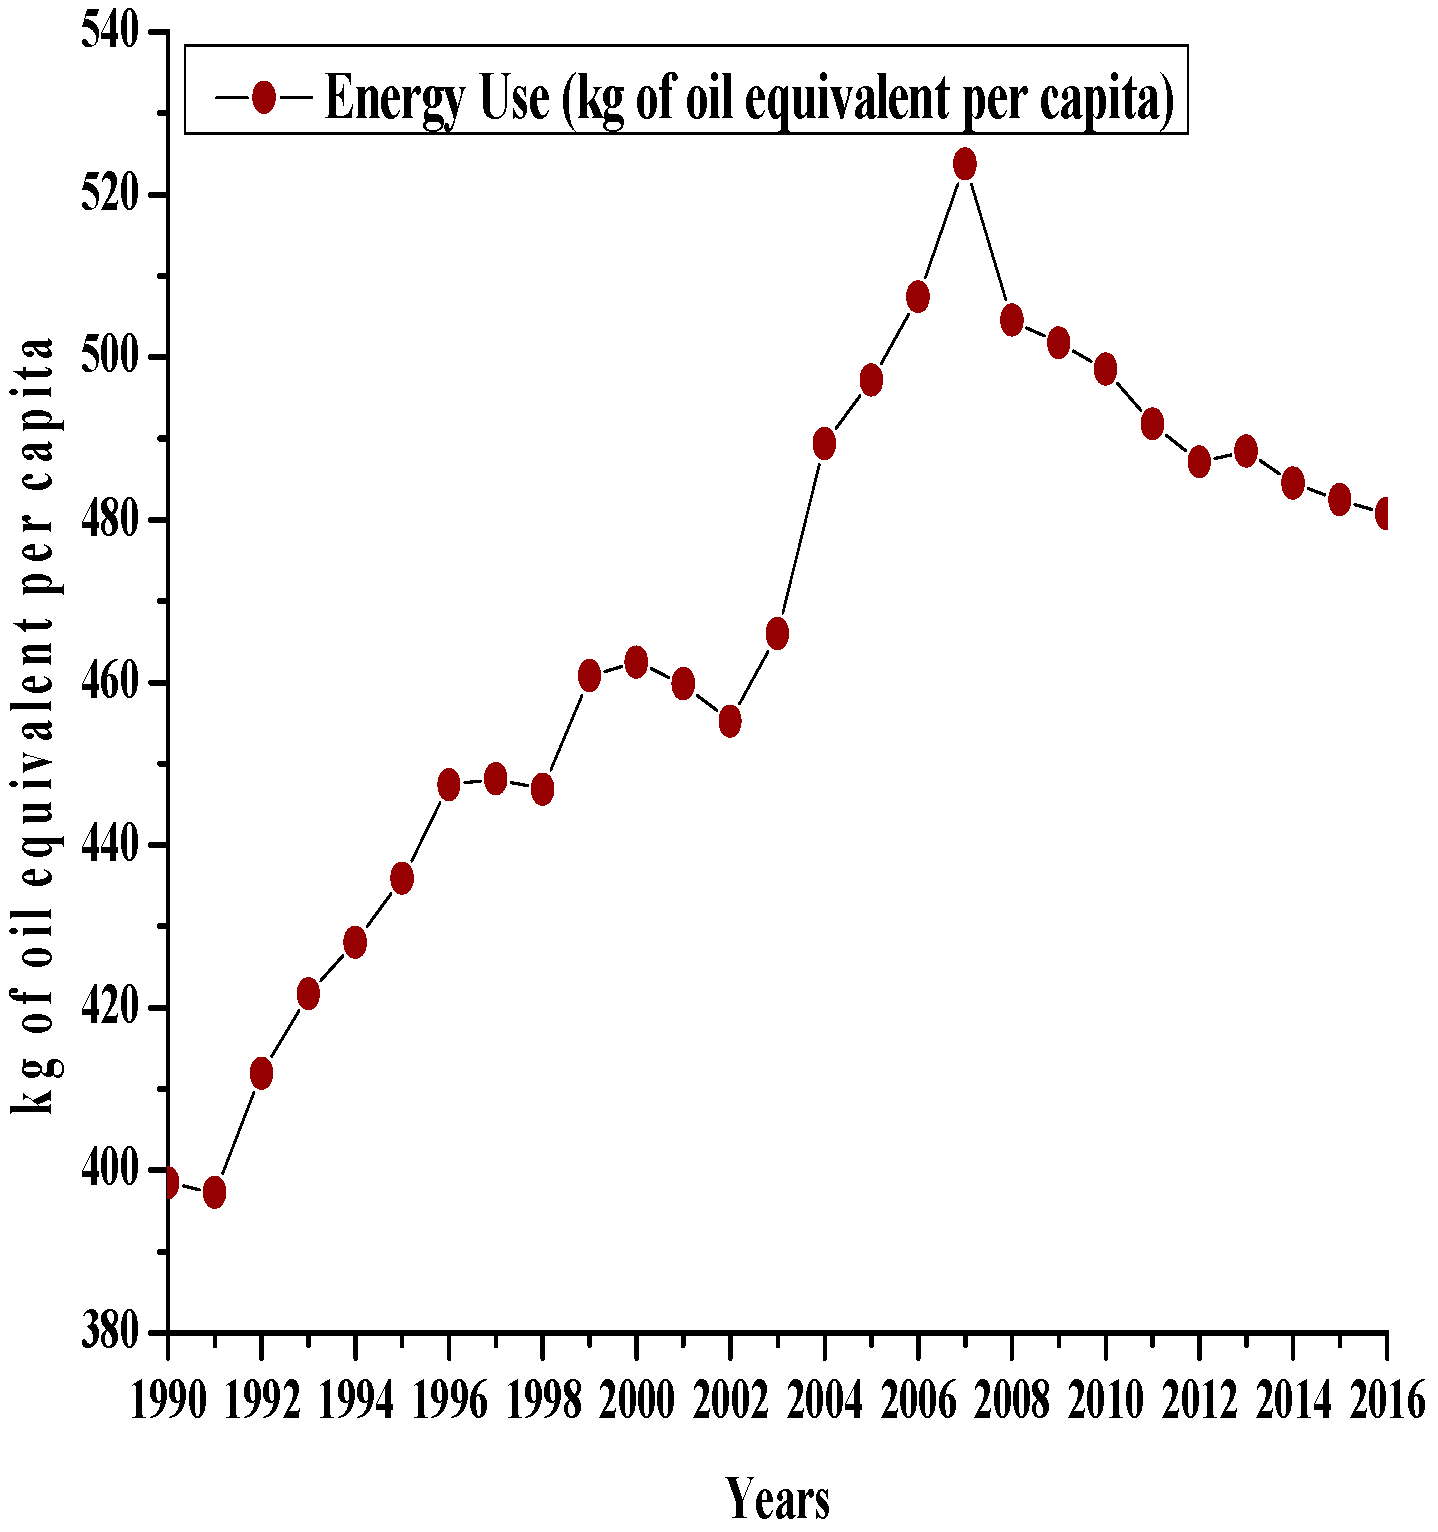
| EN | Energy Use | WDI |
| PG | Population Growth | WDI |
| RPG | Rural Population Growth | WDI |
| UPG | Urban Population Growth | WDI |
| Augmented Dickey–Fuller Unit Root Test | Phillips–Perron Unit Root Test | |||
|---|---|---|---|---|
| Variables | At Level | First Difference | At Level | First Difference |
| LnEAP | −1.272365 | −13.17405 * | −2.945287 | −16.37533 * |
| LnEARP | −1.664904 | −11.97595 * | −2.602248 | −13.37829 * |
| LnEAUP | −4.350711 | −5.926737 * | −4.972231 | −21.59359 * |
| LnEN | −0.673060 | −4.635827 * | −0.744445 | −4.634863 * |
| LnGDPPC | −1.575934 | −4.340708 * | −1.575934 | −4.318162 * |
| LnPG | −1.607271 | −3.544057 *** | −1.703555 | −3.745637 ** |
| LnRPG | −1.232135 | −4.406125 * | −1.851566 | −3.908624 ** |
| LnUPG | −2.216098 | −4.502952 * | −2.422004 | −4.281174 ** |
| ARDL Bounds Test for Cointegration Results | ||||
|---|---|---|---|---|
| F-Statistic | Significance Level | Lower Bound | Upper Bound | Decision |
| 5.355108 | 10% | 2.03 | 3.13 | Cointegrated |
| 5% | 2.32 | 3.5 | ||
| 1% | 2.96 | 4.26 | ||
| Trace Statistic | ||||
| Hypothesized No. of CE(s) | Eigenvalue | Trace Statistic | 0.05 Critical Value | Prob.** |
| None * | 0.993717 | 396.7264 | 143.6691 | 0.0000 |
| At most 1 * | 0.976870 | 269.9806 | 111.7805 | 0.0000 |
| At most 2 * | 0.944234 | 175.8151 | 83.93712 | 0.0000 |
| At most 3 * | 0.816141 | 103.6505 | 60.06141 | 0.0000 |
| At most 4 * | 0.738330 | 61.31087 | 40.17493 | 0.0001 |
| At most 5 * | 0.562836 | 27.79407 | 24.27596 | 0.0173 |
| At most 6 | 0.247014 | 7.107881 | 12.32090 | 0.3145 |
| At most 7 | 0.000607 | 0.015170 | 4.129906 | 0.9198 |
| Maximum Eigenvalue Statistic | ||||
| Hypothesized No. of CE(s) | Eigenvalue | Max-Eigen Statistic | 0.05 Critical Value | Prob.** |
| None * | 0.993717 | 126.7458 | 48.87720 | 0.0000 |
| At most 1 * | 0.976870 | 94.16546 | 42.77219 | 0.0000 |
| At most 2 * | 0.944234 | 72.16461 | 36.63019 | 0.0000 |
| At most 3 * | 0.816141 | 42.33964 | 30.43961 | 0.0011 |
| At most 4 * | 0.738330 | 33.51680 | 24.15921 | 0.0020 |
| At most 5 * | 0.562836 | 20.68619 | 17.79730 | 0.0179 |
| At most 6 | 0.247014 | 7.092710 | 11.22480 | 0.2415 |
| At most 7 | 0.000607 | 0.015170 | 4.129906 | 0.9198 |
| ARDL Cointegrating and Long-Run Form | ||||
|---|---|---|---|---|
| Cointegrating Form | ||||
| Variables | Coefficient | Std. Error | t-Statistic | Prob. |
| D(LNEAP) | −1.828790 | 1.992169 | −0.917989 | 0.3783 |
| D(LNEARP) | 1.179909 | 1.159803 | 1.017336 | 0.3308 |
| D(LNEAUP) | 0.184181 | 1.907163 | 0.096573 | 0.9248 |
| D(LNEN) | 1.549670 | 0.727377 | 2.130490 | 0.0565 |
| D(LNPG) | 6.825561 | 3.067669 | 2.224999 | 0.0479 |
| D(LNRPG) | −6.964634 | 3.127366 | −2.226997 | 0.0478 |
| D(LNUPG) | 10.114401 | 6.157831 | 1.642527 | 0.1287 |
| Coint. Equation(-1) | −1.031504 | 0.233261 | −4.422112 | 0.0010 |
| Long-Run Coefficients | ||||
| Variables | Coefficient | Std. Error | t-Statistic | Prob. |
| LNEAP | 1.310100 | 3.291778 | 0.397992 | 0.6983 |
| LNEARP | −0.891821 | 1.868824 | −0.477210 | 0.6426 |
| LNEAUP | 3.079896 | 2.910661 | 1.058143 | 0.3127 |
| LNEN | 2.288282 | 0.548249 | 4.173804 | 0.0016 |
| LNPG | 6.617094 | 2.840778 | 2.329324 | 0.0399 |
| LNRPG | −3.988076 | 1.257097 | −3.172450 | 0.0089 |
| LNUPG | 0.308340 | 2.151163 | 0.143336 | 0.8886 |
| C | −27.082991 | 11.476944 | −2.359774 | 0.0378 |
| Short-Run Analysis | ||||
|---|---|---|---|---|
| Variables | Coefficient | Std. Error | t-Statistic | Prob.* |
| LNGDPPC(-1) | −0.031504 | 0.233261 | −0.135061 | 0.8950 |
| LNEAP | −1.828790 | 1.992169 | −0.917989 | 0.3783 |
| LNEAP(-1) | 3.180164 | 2.076449 | 1.531540 | 0.1539 |
| LNEARP | 1.179909 | 1.159803 | 1.017336 | 0.3308 |
| LNEARP(-1) | −2.099826 | 1.266322 | −1.658209 | 0.1255 |
| LNEAUP | 0.184181 | 1.907163 | 0.096573 | 0.9248 |
| LNEAUP(-1) | 2.992745 | 1.832034 | 1.633564 | 0.1306 |
| LNEN | 1.549670 | 0.727377 | 2.130490 | 0.0565 |
| LNEN(-1) | 0.810703 | 0.732127 | 1.107325 | 0.2918 |
| LNPG | 6.825561 | 3.067669 | 2.224999 | 0.0479 |
| LNRPG | −6.964634 | 3.127366 | −2.226997 | 0.0478 |
| LNRPG(-1) | 2.850917 | 2.873768 | 0.992048 | 0.3425 |
| LNUPG | 10.11440 | 6.157831 | 1.642527 | 0.1287 |
| LNUPG(-1) | −9.796348 | 6.585777 | −1.487501 | 0.1650 |
| C | −27.93622 | 11.64342 | −2.399314 | 0.0353 |
| R-squared | 0.996705 | Mean dependent var. | 6.569321 | |
| Adjusted R-squared | 0.992510 | S.D. dependent var. | 0.448658 | |
| S.E. of regression | 0.038828 | Akaike info criterion | −3.365683 | |
| Sum squared resid. | 0.016584 | Schwarz criterion | −2.639858 | |
| Log likelihood | 58.75388 | Hannan-Quinn criter. | −3.156672 | |
| F-statistic | 237.6347 | Durbin-Watson stat | 2.575936 | |
| Prob(F-statistic) | 0.000000 | |||
| Diagnostic and Stability Tests | ||
|---|---|---|
| Test Statistics (LM Version) | F-Statistic | Prob. |
| Breusch–Godfrey Serial Correlation | 2.857881 | 0.1346 |
| Heteroscedasticity | 0.696466 | 0.5095 |
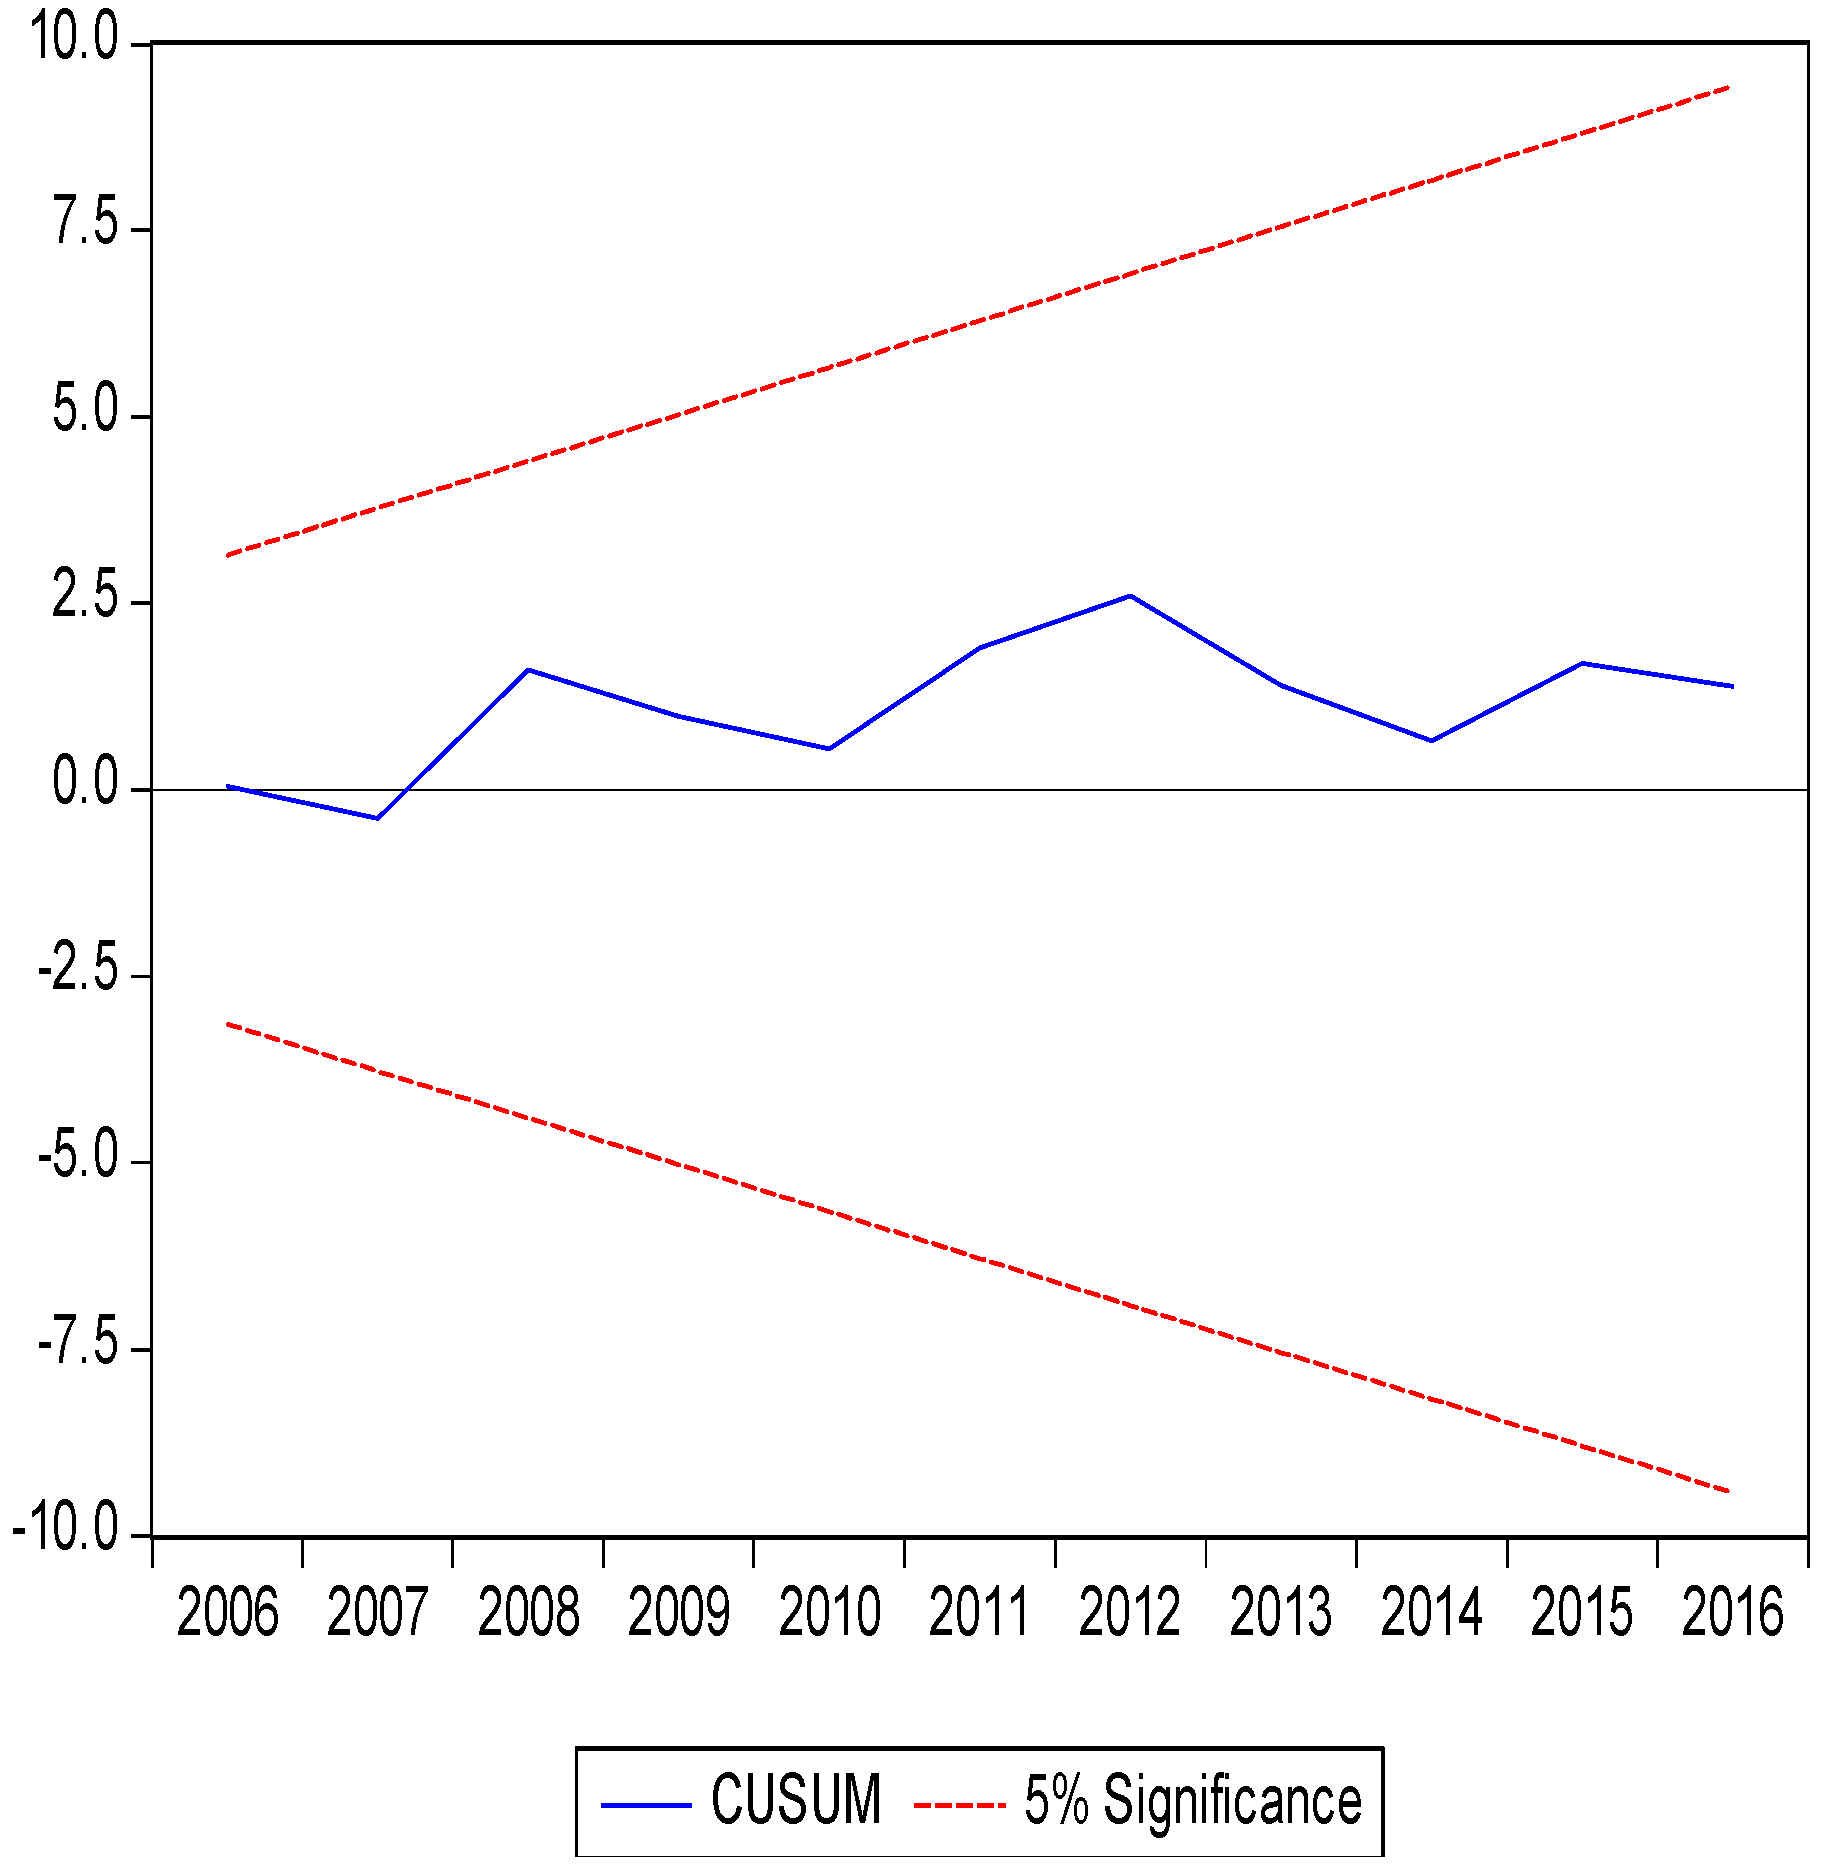
| CUSUM (Cumulative Sum) | Stable | |
| CUSUMSQ (Cumulative Sum of Square) | Stable | |
© 2018 by the authors. Licensee MDPI, Basel, Switzerland. This article is an open access article distributed under the terms and conditions of the Creative Commons Attribution (CC BY) license (http://creativecommons.org/licenses/by/4.0/).
Share and Cite
Rehman, A.; Deyuan, Z. Investigating the Linkage between Economic Growth, Electricity Access, Energy Use, and Population Growth in Pakistan. Appl. Sci. 2018, 8, 2442. https://doi.org/10.3390/app8122442
Rehman A, Deyuan Z. Investigating the Linkage between Economic Growth, Electricity Access, Energy Use, and Population Growth in Pakistan. Applied Sciences. 2018; 8(12):2442. https://doi.org/10.3390/app8122442
Chicago/Turabian StyleRehman, Abdul, and Zhang Deyuan. 2018. "Investigating the Linkage between Economic Growth, Electricity Access, Energy Use, and Population Growth in Pakistan" Applied Sciences 8, no. 12: 2442. https://doi.org/10.3390/app8122442
APA StyleRehman, A., & Deyuan, Z. (2018). Investigating the Linkage between Economic Growth, Electricity Access, Energy Use, and Population Growth in Pakistan. Applied Sciences, 8(12), 2442. https://doi.org/10.3390/app8122442