Computer-Aided Analysis of Gland-Like Subsurface Hyposcattering Structures in Barrett’s Esophagus Using Optical Coherence Tomography

 ,
, 
Abstract
Featured Application
Abstract
1. Introduction
2. Materials and Methods
2.1. Patient Population and VLE Data
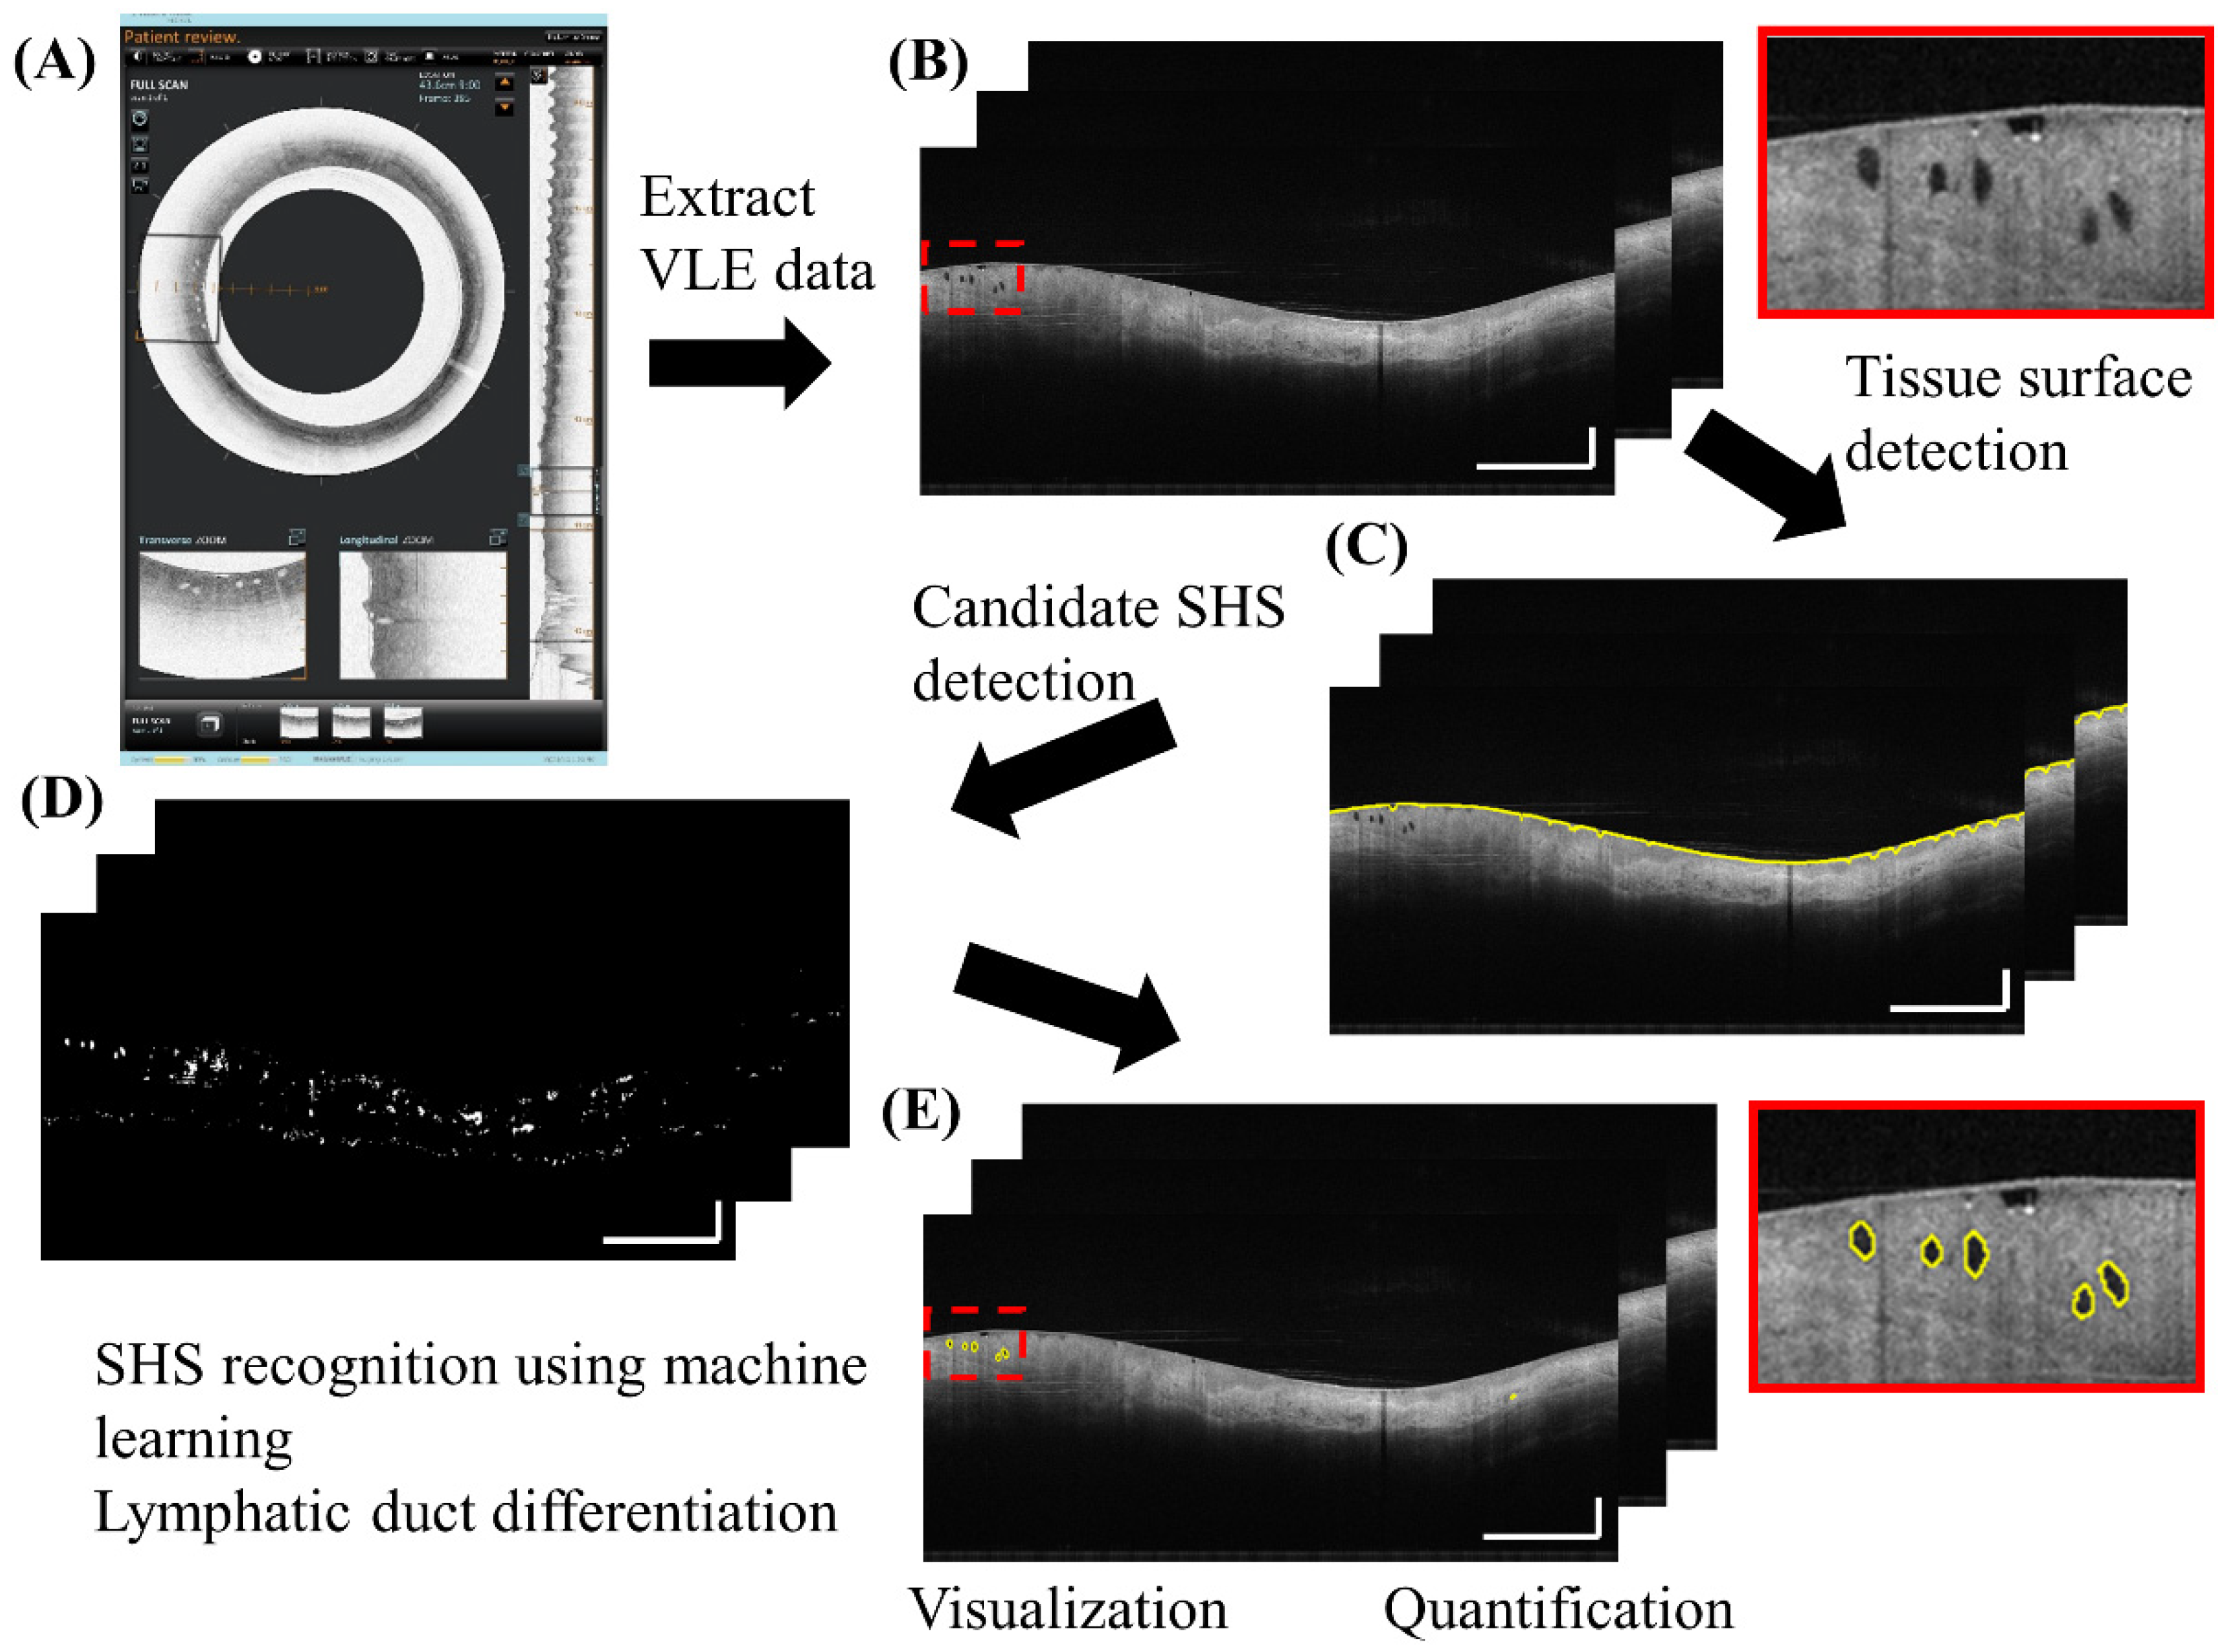
2.2. Fully Automated SHS Detection and Quantification
2.3. SHS Quantification
- The 2D number: quantified as mean/cross-section
- Volume: total gland volume within the region of interest
- The 3D number (Cluster): if the distance between adjacent 2D SHSs is within 2.5 mm circumferentially (this threshold is relatively large to account for motion artifacts) and within 3 images (0.15 mm) longitudinally, these SHSs were considered as one 3D cluster.
- 4.
- Size: area of each SHS in 2D cross-sectional images (C)
- 5.
- Perimeter: perimeter of each SHS in cross-sectional images (C)
- 6.
- Depth: distance from the centroid of each SHS to the tissue surface (P)
- 7.
- Intensity: intensity of SHS normalized by the mean intensity of the axial lines traversing the SHS to account for intensity fluctuations between different angles, images and pullbacks
- 8.
- Standard deviation (STD): characterizing the intensity heterogeneity (P)
- 9.
- Orientation: absolute angle between the major axis of the SHS and tissue surface (P) after flattening the image to the tissue surface (Figure 2B)
- 10.
- Eccentricity: ratio between the foci of a fitted ellipse to the major axis length with a range of 0–1 where 0 indicates a circle and 1 indicates a line (C) (Figure 2C)
- 11.
- Extent: ratio of SHS area to its bounding box (C), characterizing irregularity (Figure 2D)
- 12.
- Solidity: ratio of SHS area to its convex area (C), characterizing irregularity (Figure 2E)
2.4. Applications of the Automated SHS Quantification Algorithm
2.4.1. General Distribution and Characteristics of SHS in Patients with BE
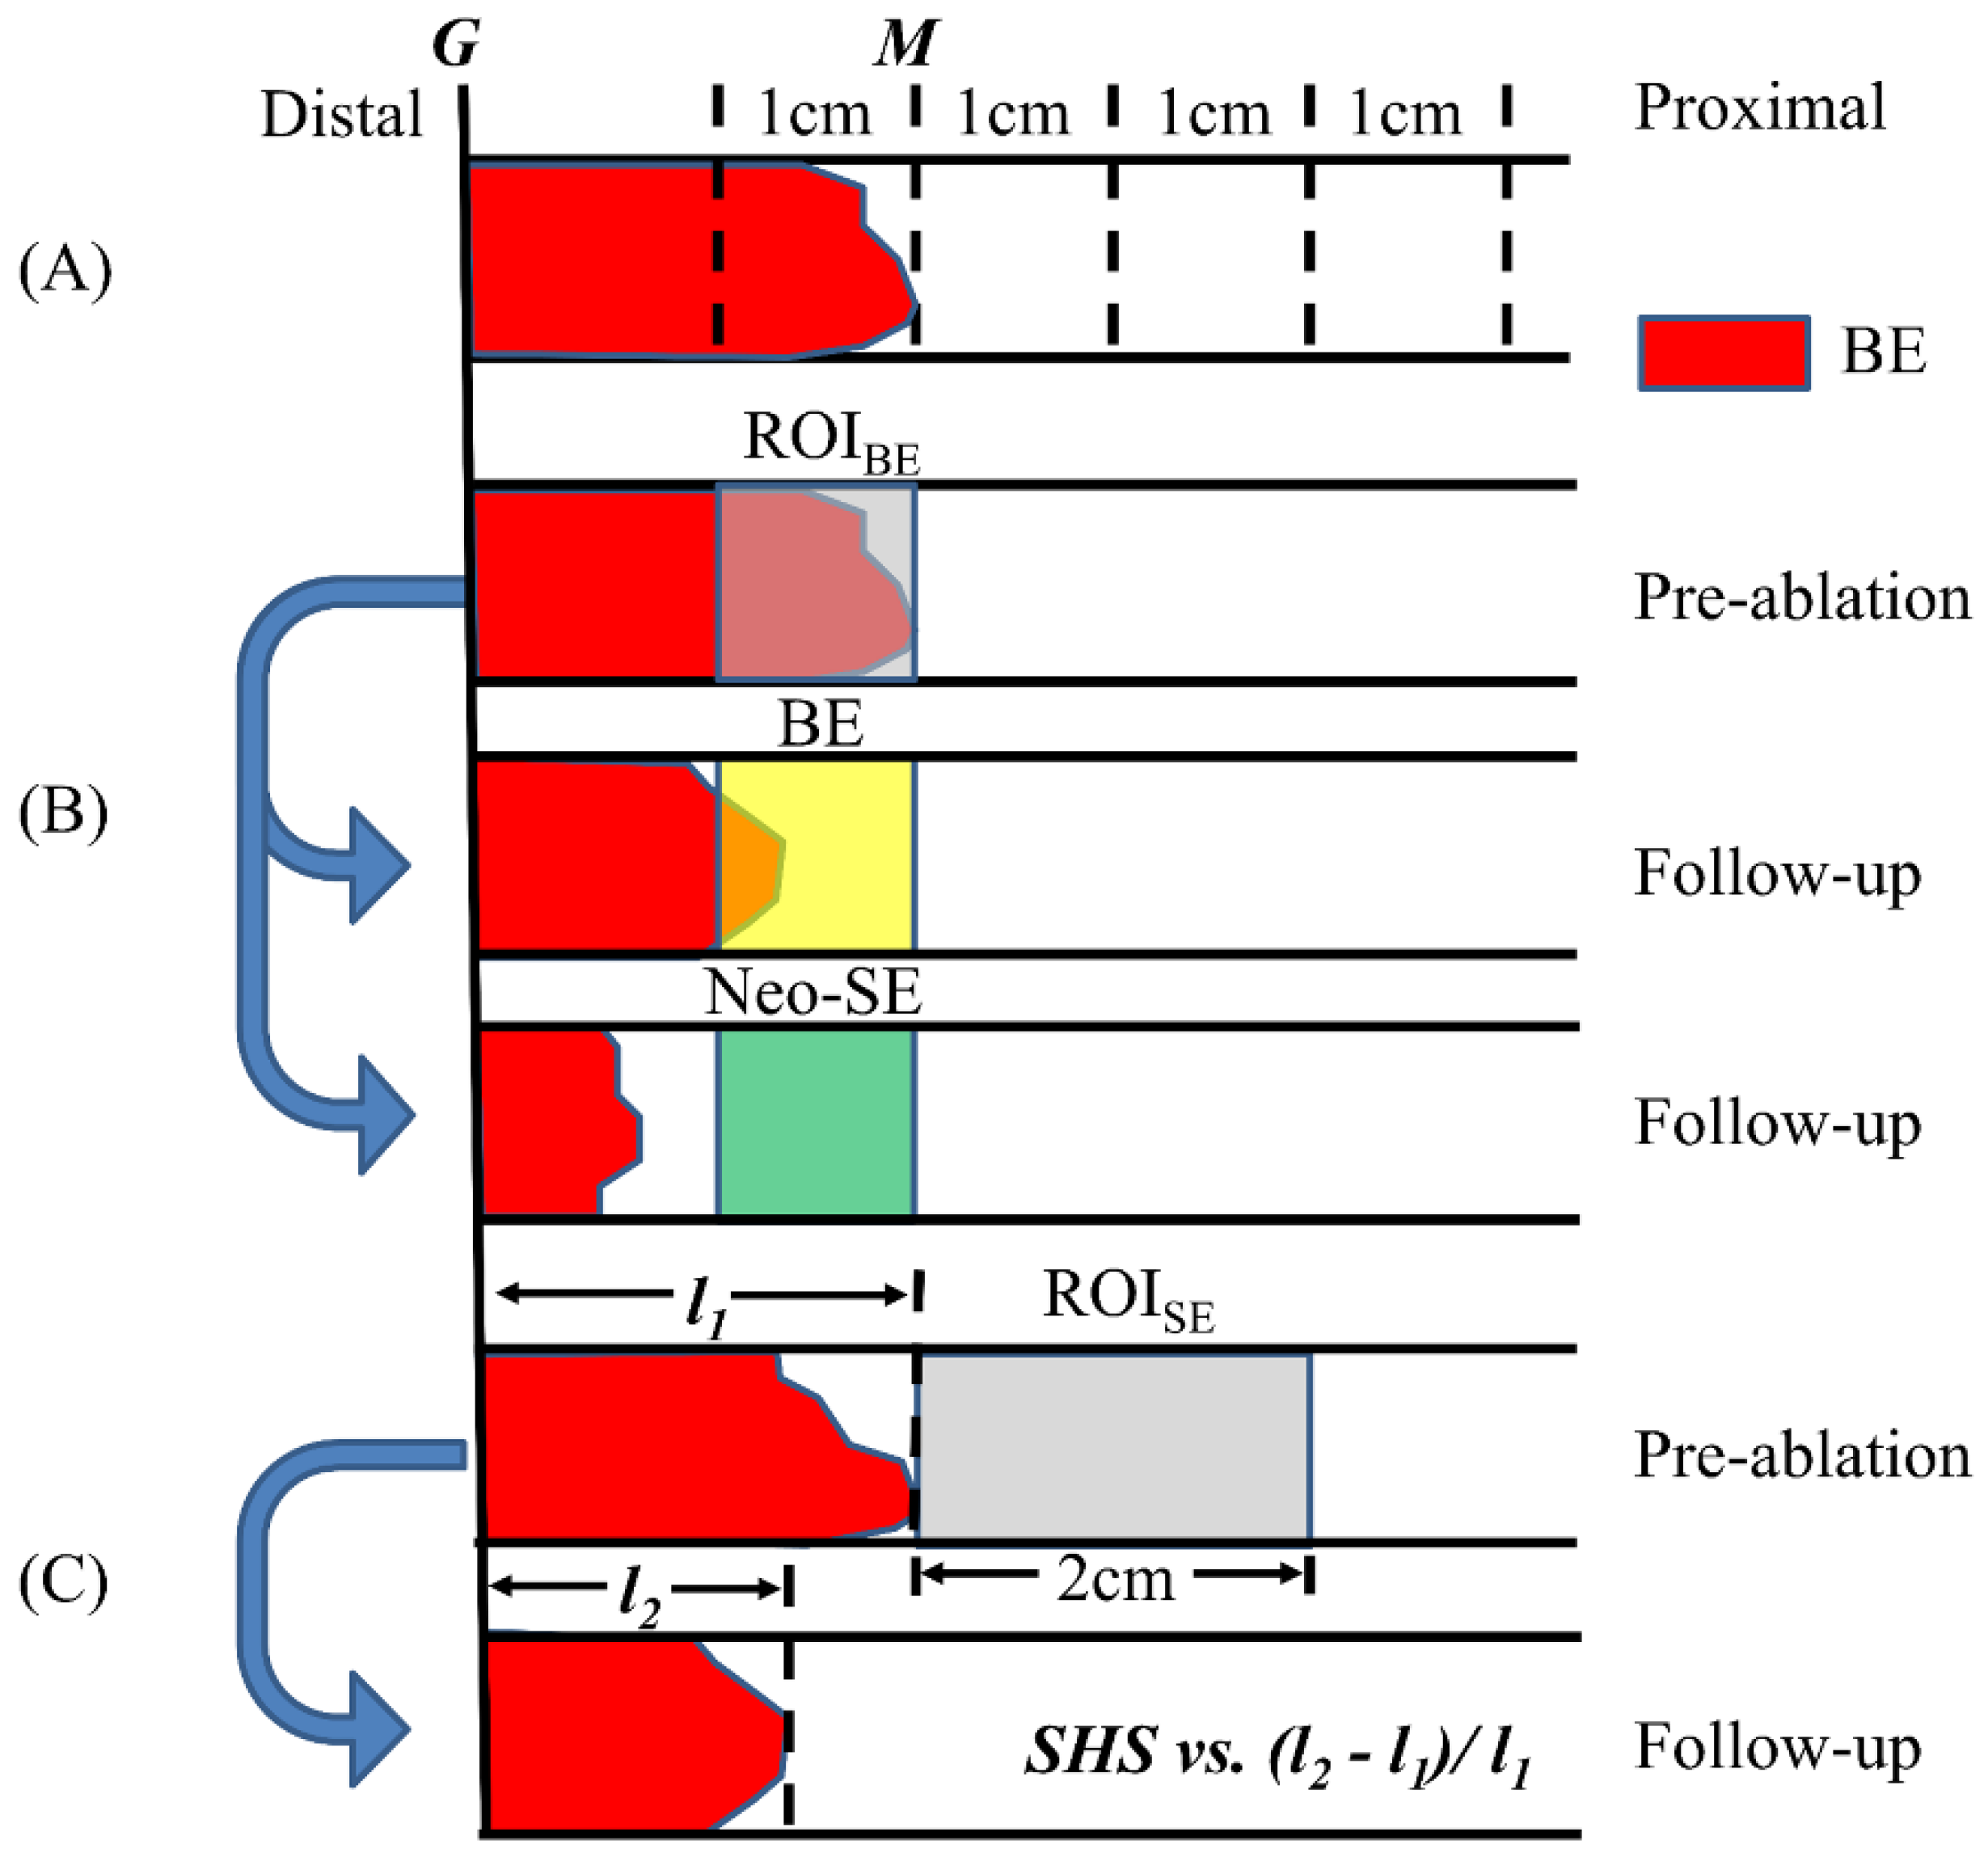
2.4.2. Pre-Ablation BE SHS and RFA Treatment Response
2.4.3. Pre-Ablation Subsquamous SHS Characteristics and RFA Treatment Response
2.5. Statistical Analysis
3. Results
3.1. Performance of the Algorithm
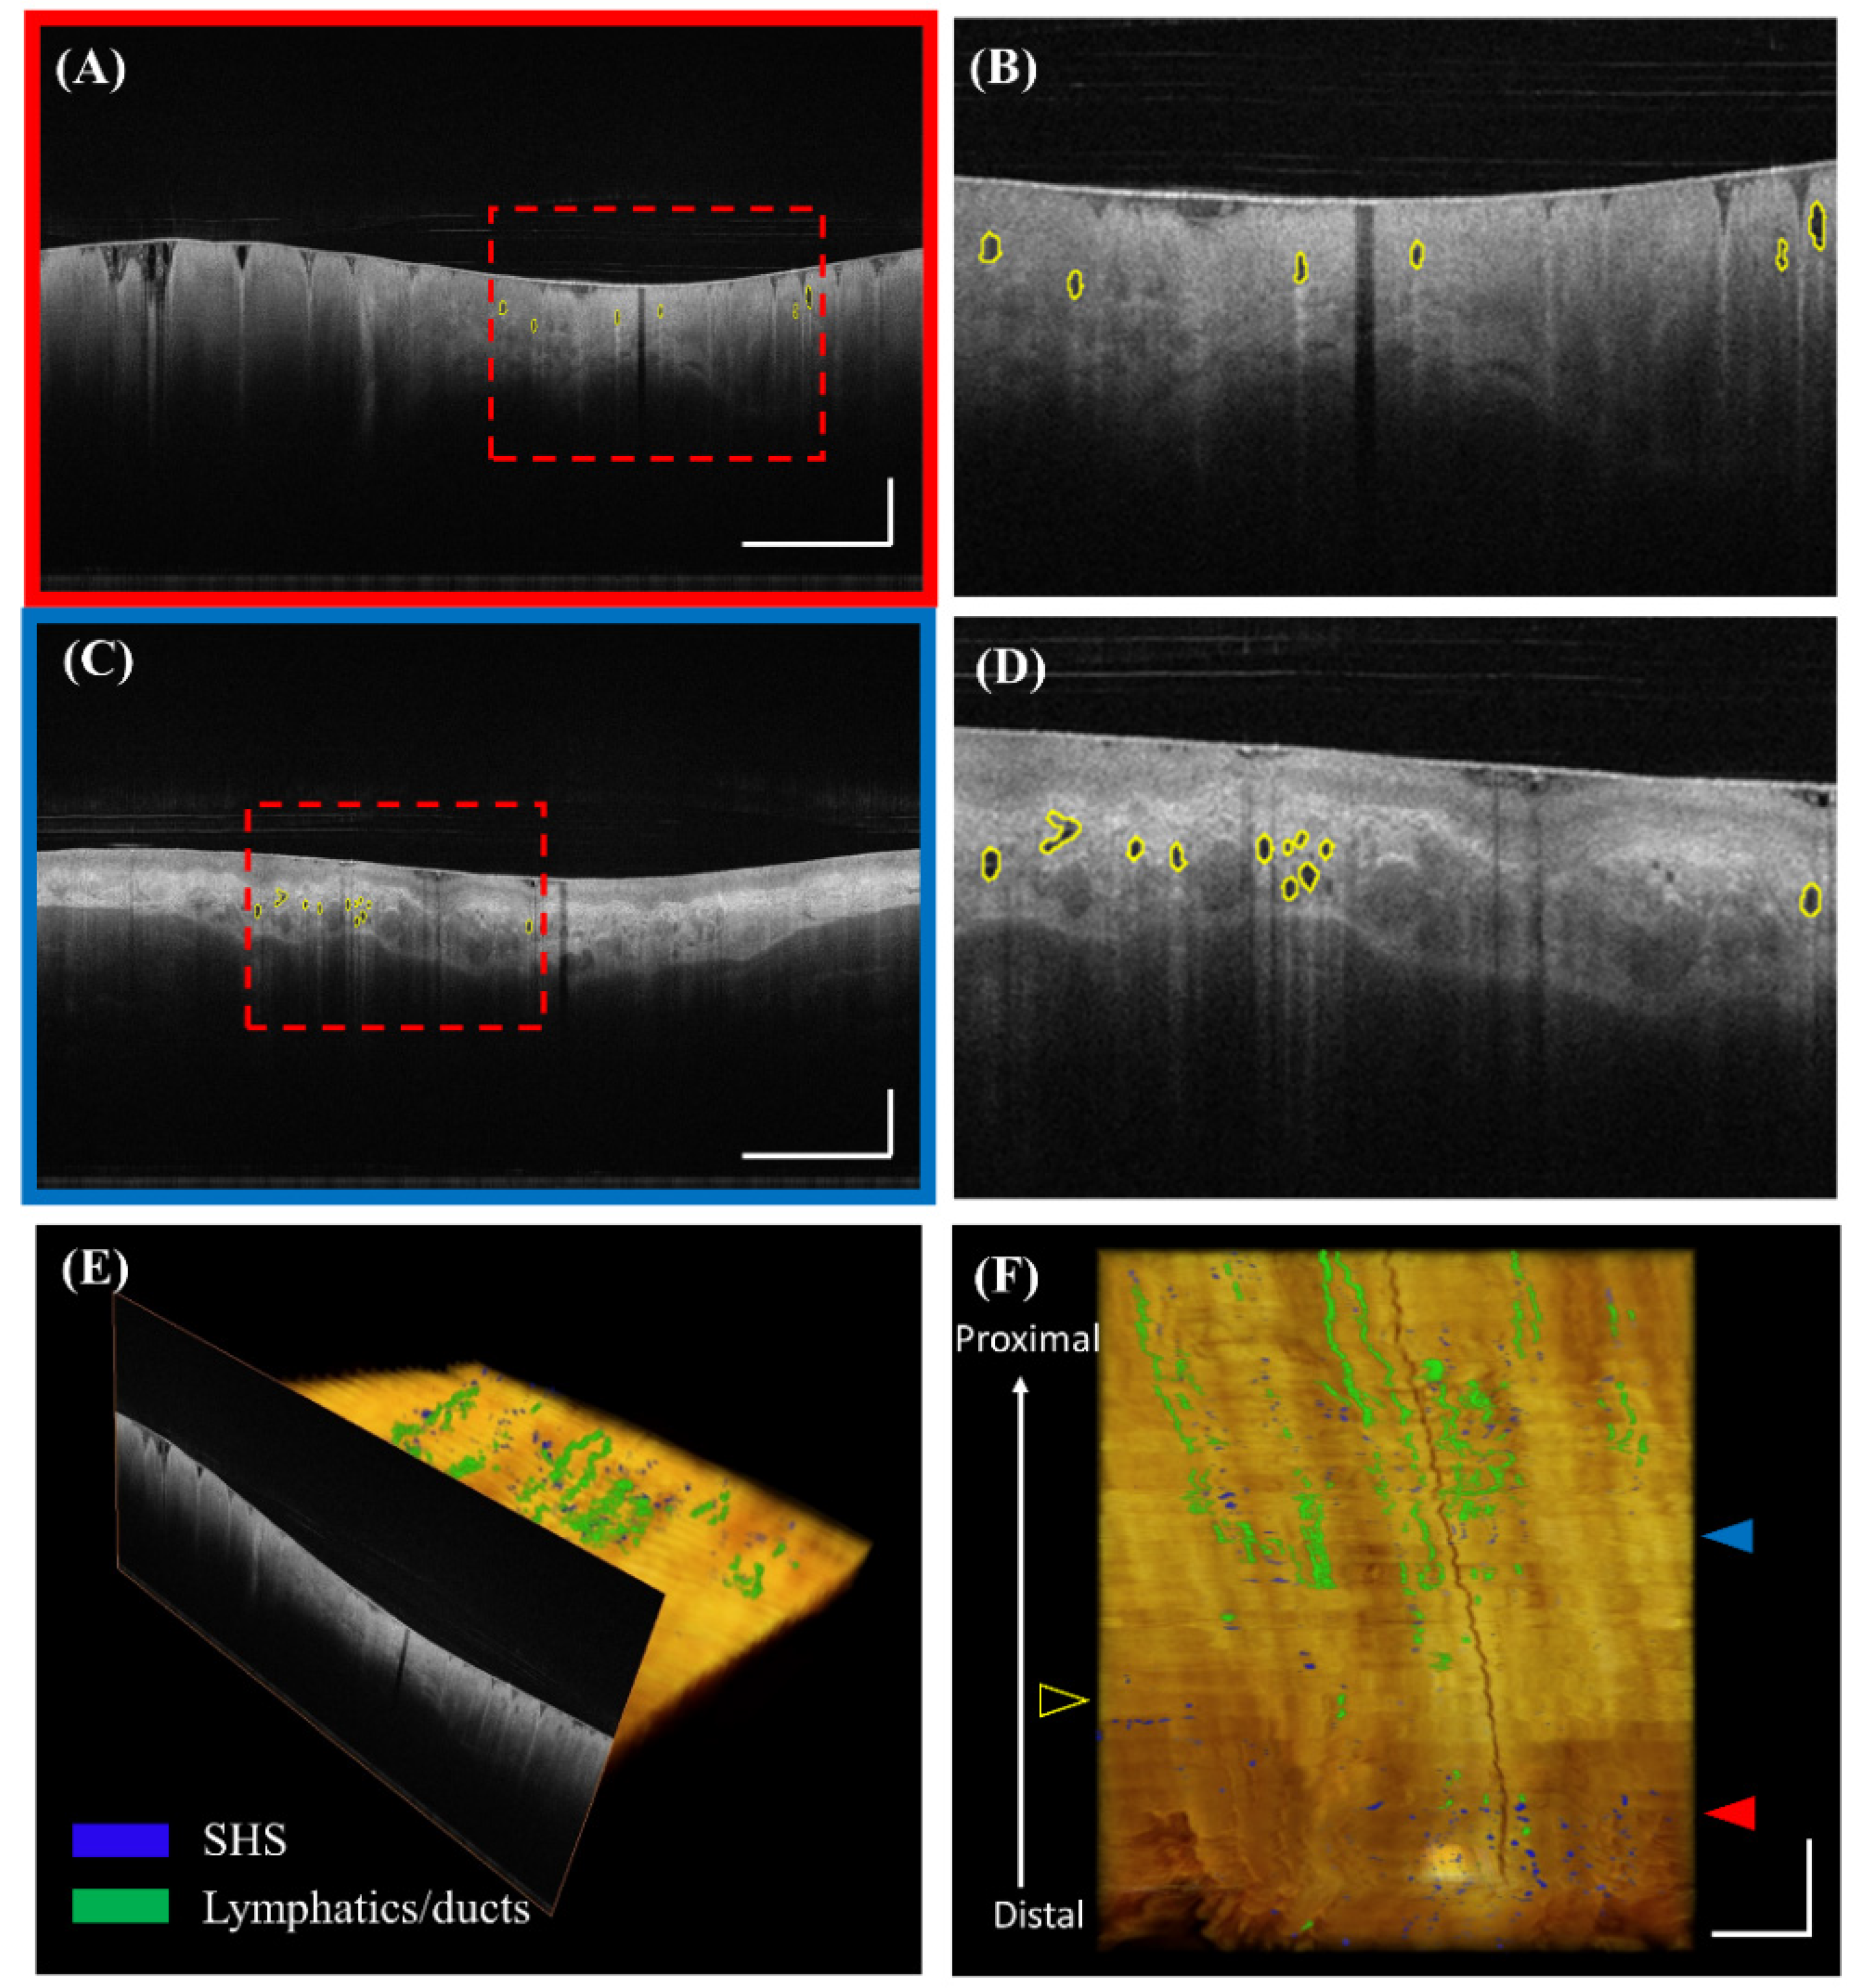
3.2. Visualization of SHS
3.3. Comparison of SHS Characteristics over the Longitudinal Segments in BE
3.4. SHS in the BE Region and RFA Treatment Response
3.5. SHS in the Squamous Region and RFA Treatment Response
4. Discussion
5. Conclusions
Supplementary Materials
Author Contributions
Funding
Conflicts of Interest
References
- Spechler, S.J.; Souza, R.F. Barrett’s esophagus. N. Engl. J. Med. 2014, 371, 836–845. [Google Scholar] [CrossRef] [PubMed]
- Sharma, P.; McQuaid, K.; Dent, J.; Fennerty, M.B.; Sampliner, R.; Spechler, S.; Cameron, A.; Corley, D.; Falk, G.; Goldblum, J.; et al. A critical review of the diagnosis and management of Barrett’s esophagus: The AGA Chicago Workshop. Gastroenterology 2004, 127, 310–330. [Google Scholar] [CrossRef] [PubMed]
- Shaheen, N.J.; Falk, G.W.; Iyer, P.G.; Gerson, L.B.; American College of Gastroenterology. ACG clinical guideline: Diagnosis and management of Barrett’s esophagus. Am. J. Gastroenterol. 2016, 111, 30–50. [Google Scholar] [CrossRef] [PubMed]
- Orman, E.S.; Li, N.; Shaheen, N.J. Efficacy and durability of radiofrequency ablation for Barrett’s Esophagus: Systematic review and meta-analysis. Clin. Gastroenterol. Hepatol. 2013, 11, 1245–1255. [Google Scholar] [CrossRef] [PubMed]
- Shaheen, N.J.; Sharma, P.; Overholt, B.F.; Wolfsen, H.C.; Sampliner, R.E.; Wang, K.K.; Galanko, J.A.; Bronner, M.P.; Goldblum, J.R.; Bennett, A.E.; et al. Radiofrequency Ablation in Barrett’s Esophagus with Dysplasia. N. Engl. J. Med. 2009, 360, 2277–2288. [Google Scholar] [CrossRef] [PubMed]
- Gupta, M.; Iyer, P.G.; Lutzke, L.; Gorospe, E.C.; Abrams, J.A.; Falk, G.W.; Ginsberg, G.G.; Rustgi, A.K.; Lightdale, C.J.; Wang, T.C.; et al. Recurrence of esophageal intestinal metaplasia after endoscopic mucosal resection and radiofrequency ablation of Barrett’s esophagus: Results from a US Multicenter Consortium. Gastroenterology 2013, 145, 79–86. [Google Scholar] [CrossRef] [PubMed]
- Tearney, G.J.; Brezinski, M.E.; Bouma, B.E.; Boppart, S.A.; Pitris, C.; Southern, J.F.; Fujimoto, J.G. In vivo endoscopic optical biopsy with optical coherence tomography. Science 1997, 276, 2037–2039. [Google Scholar] [CrossRef] [PubMed]
- Isenberg, G.; Sivak, M.V., Jr.; Chak, A.; Wong, R.C.; Willis, J.E.; Wolf, B.; Rowland, D.Y.; Das, A.; Rollins, A. Accuracy of endoscopic optical coherence tomography in the detection of dysplasia in Barrett’s esophagus: A prospective, double-blinded study. Gastrointest. Endosc. 2005, 62, 825–831. [Google Scholar] [CrossRef] [PubMed]
- Evans, J.A.; Poneros, J.M.; Bouma, B.E.; Bressner, J.; Halpern, E.F.; Shishkov, M.; Lauwers, G.Y.; Mino-Kenudson, M.; Nishioka, N.S.; Tearney, G.J. Optical Coherence Tomography to Identify Intramucosal Carcinoma and High-Grade Dysplasia in Barrett’s Esophagus. Clin. Gastroenterol. Hepatol. 2006, 4, 38–43. [Google Scholar] [CrossRef]
- Zhou, C.; Tsai, T.H.; Lee, H.C.; Kirtane, T.; Figueiredo, M.; Tao, Y.K.; Ahsen, O.O.; Adler, D.C.; Schmitt, J.M.; Huang, Q.; et al. Characterization of buried glands before and after radiofrequency ablation by using 3-dimensional optical coherence tomography (with videos). Gastrointest. Endosc. 2012, 76, 32–40. [Google Scholar] [CrossRef] [PubMed]
- Swager, A.F.; Boerwinkel, D.F.; de Bruin, D.M.; Faber, D.J.; van Leeuwen, T.G.; Weusten, B.L.; Meijer, S.L.; Bergman, J.J.; Curvers, W.L. Detection of buried Barrett’s glands after radiofrequency ablation with volumetric laser endomicroscopy. Gastrointest. Endosc. 2016, 83, 80–88. [Google Scholar] [CrossRef] [PubMed]
- Swager, A.F.; Tearney, G.J.; Leggett, C.L.; van Oijen, M.G.H.; Meijer, S.L.; Weusten, B.L.; Curvers, W.L.; Bergman, J.J. Identification of volumetric laser endomicroscopy features predictive for early neoplasia in Barrett’s esophagus using high-quality histological correlation. Gastrointest. Endosc. 2017, 85, 918–926. [Google Scholar] [CrossRef] [PubMed]
- Leggett, C.L.; Gorospe, E.C.; Chan, D.K.; Muppa, P.; Owens, V.; Smyrk, T.C.; Anderson, M.; Lutzke, L.S.; Tearney, G.; Wang, K.K. Comparative diagnostic performance of volumetric laser endomicroscopy and confocal laser endomicroscopy in the detection of dysplasia associated with Barrett’s esophagus. Gastrointest. Endosc. 2016, 83, 880–888. [Google Scholar] [CrossRef] [PubMed]
- Lee, H.C.; Ahsen, O.O.; Liang, K.; Figueiredo, M.; Giacomelli, M.G.; Potsaid, B.; Huang, Q.; Mashimo, H.; Fujimoto, J.G. Endoscopic optical coherence tomography angiography microvascular features associated with dysplasia in Barrett’s esophagus (with video). Gastrointest. Endosc. 2017, 86, 476–484. [Google Scholar] [CrossRef] [PubMed]
- Qi, X.; Sivak, M.V.; Isenberg, G.; Willis, J.E.; Rollins, A.M. Computer-aided diagnosis of dysplasia in Barrett’s esophagus using endoscopic optical coherence tomography. J. Biomed. Opt. 2006, 11, 044010. [Google Scholar] [CrossRef] [PubMed]
- Qi, X.; Pan, Y.; Sivak, M.V.; Isenberg, G.; Rollins, A.M. Image analysis for classification of dysplasia in Barrett’s esophagus using endoscopic optical coherence tomography. Biomed. Opt. Express 2010, 1, 825–847. [Google Scholar] [CrossRef] [PubMed]
- Ughi, G.J.; Gora, M.J.; Swager, A.F.; Soomro, A.; Grant, C.; Tiernan, A.; Rosenberg, M.; Sauk, J.S.; Nishioka, N.S.; Tearney, G.J. Automated segmentation and characterization of esophageal wall in vivo by tethered capsule optical coherence tomography endomicroscopy. Biomed. Opt. Express 2016, 7, 409–419. [Google Scholar] [CrossRef] [PubMed]
- Swager, A.F.; van der Sommen, F.; Klomp, S.R.; Zinger, S.; Meijer, S.L.; Schoon, E.J.; Bergman, J.J.; de With, P.H.; Curvers, W.L. Computer-aided detection of early Barrett’s neoplasia using volumetric laser endomicroscopy. Gastrointest. Endosc. 2017, 86, 839–846. [Google Scholar] [CrossRef] [PubMed]
- Wolfsen, H.C.; Sharma, P.; Wallace, M.B.; Leggett, C.; Tearney, G.; Wang, K.K. Safety and feasibility of volumetric laser endomicroscopy in patients with Barrett’s esophagus (with videos). Gastrointest. Endosc. 2015, 82, 631–640. [Google Scholar] [CrossRef] [PubMed]
- Li, K.; Wu, X.; Chen, D.Z.; Sonka, M. Optimal Surface Segmentation in Volumetric Images—A Graph-Theoretic Approach. IEEE. Trans. Pattern Anal. Mach. Intell. 2006, 28, 119–134. [Google Scholar] [PubMed]
- Chang, C.C.; Lin, C.J. LIBSVM: A library for support vector machines. ACM. Trans. Intell. Syst. Technol. 2011, 2, 27. [Google Scholar] [CrossRef]
- Evans, J.A.; Bouma, B.E.; Bressner, J.; Shishkov, M.; Lauwers, G.Y.; Mino-Kenudson, M.; Nishioka, N.S.; Tearney, G.J. Identifying intestinal metaplasia at the squamocolumnar junction by using optical coherence tomography. Gastrointest. Endosc. 2007, 65, 50–56. [Google Scholar] [CrossRef] [PubMed]
- Tsai, T.H.; Zhou, C.; Tao, Y.K.; Lee, H.C.; Ahsen, O.O.; Figueiredo, M.; Kirtane, T.; Adler, D.C.; Schmitt, J.M.; Huang, Q.; et al. Structural markers observed with endoscopic 3-dimensional optical coherence tomography correlating with Barrett’s esophagus radiofrequency ablation treatment response (with videos). Gastrointest. Endosc. 2012, 76, 1104–1112. [Google Scholar] [CrossRef] [PubMed]
- McDonald, S.A.; Graham, T.A.; Lavery, D.L.; Wright, N.A.; Jansen, M. The Barrett’s Gland in Phenotype Space. Cell Mol. Gastroenterol. Hepatol. 2015, 1, 41–54. [Google Scholar] [CrossRef] [PubMed]
- Yachimski, P.; Falk, G.W. Subsquamous intestinal metaplasia: Implications for endoscopic management of Barrett’s esophagus. Clin. Gastroenterol. Hepatol. 2012, 10, 220–224. [Google Scholar] [CrossRef] [PubMed]
- Mashimo, H. Subsquamous intestinal metaplasia after ablation of Barrett’s esophagus: Frequency and importance. Curr. Opin. Gastroenterol. 2013, 29, 454–459. [Google Scholar] [CrossRef] [PubMed]
- Tsai, T.H.; Ahsen, O.O.; Lee, H.C.; Liang, K.; Figueiredo, M.; Tao, Y.K.; Giacomelli, M.G.; Potsaid, B.M.; Jayaraman, V.; Huang, Q.; et al. Endoscopic Optical Coherence Angiography Enables 3-Dimensional Visualization of Subsurface Microvasculature. Gastroenterology 2014, 147, 1219–1221. [Google Scholar] [CrossRef] [PubMed]
- Lee, H.C.; Ahsen, O.O.; Liang, K.; Wang, Z.; Cleveland, C.; Booth, L.; Potsaid, B.; Jayaraman, V.; Cable, A.E.; Mashimo, H.; et al. Circumferential optical coherence tomography angiography imaging of the swine esophagus using a micromotor balloon catheter. Biomed. Opt. Express 2016, 7, 2927–2942. [Google Scholar] [CrossRef] [PubMed]
- Suter, M.J.; Gora, M.J.; Lauwers, G.Y.; Arnason, T.; Sauk, J.; Gallagher, K.A.; Kava, L.; Tan, K.M.; Soomro, A.R.; Gallagher, T.P.; et al. Esophageal-guided biopsy with volumetric laser endomicroscopy and laser cautery marking: A pilot clinical study. Gastrointest. Endosc. 2014, 79, 886–896. [Google Scholar] [CrossRef] [PubMed]
- Swager, A.; de Groof, A.J.; Meijer, S.L.; Weusten, B.L.; Curvers, W.L.; Bergman, J.J. Feasibility of laser marking in Barrett’s esophagus with volumetric laser endomicroscopy: First-in-man pilot study. Gastrointest. Endosc. 2017, 86, 464–472. [Google Scholar] [CrossRef] [PubMed]
- Kang, W.; Wang, H.; Wang, Z.; Jenkins, M.W.; Isenberg, G.A.; Chak, A.; Rollins, A.M. Motion artifacts associated with in vivo endoscopic OCT images of the esophagus. Opt. Express 2011, 19, 20722–20735. [Google Scholar] [CrossRef]
- Ahsen, O.O.; Lee, H.C.; Giacomelli, M.G.; Wang, Z.; Liang, K.; Tsai, T.H.; Potsaid, B.; Mashimo, H.; Fujimoto, J.G. Correction of rotational distortion for catheter-based en face OCT and OCT angiography. Opt. Lett. 2014, 39, 5973–5976. [Google Scholar] [CrossRef] [PubMed]
- Uribe-Patarroyo, N.; Bouma, B.E. Rotational distortion correction in endoscopic optical coherence tomography based on speckle decorrelation. Opt. Lett. 2015, 40, 5518–5521. [Google Scholar] [CrossRef]


| Age, mean ± STD | 69.4 ± 9.3 |
| Male, n (%) | 33 (94.3%) |
| Race, white, n (%) | 34 (97.1%) |
| BE length, cm, mean ± STD | 2.1 ± 2.0 |
| Treatment naïve patients, n (%) 1 | 8 (22.9%) |
| Number of prior RFA sessions, n, mean ± STD | 1.7 ± 2.0 |
| Highest pathology record of LGD, n (%) 2 | 18 (51.4%) |
| Highest pathology record of HGD/IMC, n (%) 2 | 14 (40%) |
| Metrics | Segment 1 | Segment 2 | Segment 3 | Segment 4 | p-Value (All) | p-Value (1 vs. 2) | p-Value (2 vs. 3) | p-Value (3 vs. 4) |
|---|---|---|---|---|---|---|---|---|
| 2D Number | 0.98 ± 0.71 | 1.05 ± 0.59 | 1.17 ± 0.64 | 1.14 ± 0.87 | 0.653 | - | - | - |
| Volume (mm3) | 2.25 ± 1.86 | 2.37 ± 1.84 | 2.32 ± 1.64 | 2.28 ± 1.91 | 0.994 | - | - | - |
| 3D Cluster | 8.51 ± 7.40 | 11.17 ± 7.73 | 12.44 ± 7.72 | 11.17 ± 9.66 | 0.221 | - | - | - |
| Size (mm2) | 0.22 ± 0.07 | 0.24 ± 0.14 | 0.19 ± 0.06 | 0.19 ± 0.07 | 0.115 | - | - | - |
| Depth (mm) | 0.83 ± 0.15 | 0.98 ± 0.20 | 0.95 ± 0.12 | 0.87 ± 0.25 | 0.003 ** | 0.006 ** | 0.936 | 0.234 |
| Intensity | 0.64 ± 0.11 | 0.65 ± 0.09 | 0.67 ± 0.08 | 0.65 ± 0.18 | 0.793 | - | - | - |
| STD | 0.08 ± 0.01 | 0.08 ± 0.01 | 0.08 ± 0.01 | 0.08 ± 0.02 | 0.913 | - | - | - |
| Orientation (degrees) | 10.0 ± 4.6 | 7.9 ± 4.7 | 6.4 ± 2.2 | 7.0 ± 4.5 | 0.002 ** | 0.144 | 0.399 | 0.898 |
| Eccentricity (0–1) | 0.82± 0.07 | 0.90 ± 0.03 | 0.90 ± 0.02 | 0.84 ± 0.21 | 0.006 ** | 0.029 * | 0.999 | 0.135 |
| Extent (0–1) | 0.58 ± 0.05 | 0.54 ± 0.04 | 0.54 ± 0.03 | 0.50 ± 0.13 | <0.001 *** | 0.057 | 1.000 | 0.172 |
| Perimeter (mm) | 2.02 ± 0.22 | 2.17 ± 0.40 | 2.04 ± 0.29 | 1.95 ± 0.54 | 0.110 | - | - | - |
| Solidity (0–1) | 0.90 ± 0.01 | 0.89 ± 0.01 | 0.89 ± 0.01 | 0.84 ± 0.21 | 0.080 | - | - | - |
| Cumulative Metrics | Neo-SE | BE | p-Value | Neo-SE | BE | p-Value |
|---|---|---|---|---|---|---|
| 2D number | 1.04 ± 0.74 | 0.75± 0.24 | 0.221 | - | - | - |
| 3D number | 8.31 ± 7.52 | 5.88 ± 2.80 | 0.860 | - | - | - |
| Volume (mm3) | 2.52 ± 2.20 | 1.61 ± 0.83 | 0.210 | - | - | - |
| Metrics on a per gland basis | Mean of all SHSs | Mean of cross-sectional extreme | ||||
| Size (mm2) | 0.22 ± 0.06 | 0.22 ± 0.10 | 0.336 | 0.28 ± 0.12 | 0.26 ± 0.15 | 0.374 |
| Depth (mm) | 0.83 ± 0.13 | 0.96 ± 0.14 | 0.041 * | 0.92 ± 0.13 | 1.03 ± 0.13 | 0.064 |
| Intensity | 0.63 ± 0.06 | 0.65 ± 0.11 | 0.598 | 0.69 ± 0.08 | 0.68 ± 0.12 | 0.750 |
| STD | 0.08 ± 0.01 | 0.08 ± 0.02 | 0.507 | 0.09 ± 0.01 | 0.09 ± 0.02 | 0.385 |
| Orientation (degrees) | 11.2 ± 4.0 | 8.9 ± 4.4 | 0.121 | 15.3 ± 7.8 | 10.9 ± 5.0 | 0.185 |
| Eccentricity (0–1) | 0.82 ± 0.07 | 0.86 ± 0.05 | 0.241 | 0.87 ± 0.06 | 0.87 ± 0.06 | 0.849 |
| Extent (0–1) | 0.60 ± 0.04 | 0.57 ± 0.03 | 0.087 | 0.56 ± 0.05 | 0.54 ± 0.04 | 0.363 |
| Perimeter (mm) | 2.02 ± 0.21 | 2.00 ± 0.25 | 0.087 | 2.27 ± 0.41 | 2.17 ± 0.34 | 0.363 |
| Solidity (0–1) | 0.90 ± 0.01 | 0.89 ± 0.01 | 0.053 | 0.89 ± 0.01 | 0.88 ± 0.01 | 0.238 |
| Cumulative Metrics | Age ≤ 70 (n = 10) | Age > 70 (n = 11) | Age ≤ 70 (n = 10) | Age > 70 (n = 11) | ||||
|---|---|---|---|---|---|---|---|---|
| R | p-value | R | p-value | R | p-value | R | p-value | |
| 2D number | −0.185 | 0.609 | 0.178 | 0.601 | - | - | - | - |
| 3D number | −0.180 | 0.605 | 0.243 | 0.471 | - | - | - | - |
| Volume (mm3) | −0.020 | 0.956 | 0.103 | 0.763 | - | - | - | - |
| Metrics on a per gland basis | Mean of all SHSs | Mean of cross-sectional extreme | ||||||
| Size (mm2) | −0.240 | 0.504 | −0.047 | 0.891 | −0.246 | 0.493 | 0.047 | 0.891 |
| Depth (mm) | 0.129 | 0.722 | 0.327 | 0.326 | 0.228 | 0.527 | 0.365 | 0.270 |
| Intensity | −0.326 | 0.358 | −0.065 | 0.848 | −0.062 | 0.866 | 0.122 | 0.722 |
| STD | 0.209 | 0.562 | −0.065 | 0.848 | 0.129 | 0.722 | 0.019 | 0.956 |
| Orientation (degrees) | 0.640 | 0.046 * | −0.365 | 0.270 | 0.825 | 0.003 ** | −0.327 | 0.326 |
| Eccentricity (0–1) | −0.884 | 0.001 ** | 0.355 | 0.284 | −0.850 | 0.002 ** | 0.355 | 0.284 |
| Extent (0–1) | 0.695 | 0.026 * | 0.467 | 0.147 | 0.695 | 0.026 * | −0.514 | 0.106 |
| Perimeter (mm) | −0.714 | 0.720 | 0.280 | 0.403 | −0.480 | 0.160 | 0.234 | 0.489 |
| Solidity (0–1) | 0.585 | 0.075 | 0.570 | 0.067 | 0.517 | 0.126 | −0.567 | 0.069 |
© 2018 by the authors. Licensee MDPI, Basel, Switzerland. This article is an open access article distributed under the terms and conditions of the Creative Commons Attribution (CC BY) license (http://creativecommons.org/licenses/by/4.0/).
Share and Cite
Wang, Z.; Lee, H.-C.; Ahsen, O.O.; Liang, K.; Figueiredo, M.; Huang, Q.; Fujimoto, J.G.; Mashimo, H. Computer-Aided Analysis of Gland-Like Subsurface Hyposcattering Structures in Barrett’s Esophagus Using Optical Coherence Tomography. Appl. Sci. 2018, 8, 2420. https://doi.org/10.3390/app8122420
Wang Z, Lee H-C, Ahsen OO, Liang K, Figueiredo M, Huang Q, Fujimoto JG, Mashimo H. Computer-Aided Analysis of Gland-Like Subsurface Hyposcattering Structures in Barrett’s Esophagus Using Optical Coherence Tomography. Applied Sciences. 2018; 8(12):2420. https://doi.org/10.3390/app8122420
Chicago/Turabian StyleWang, Zhao, Hsiang-Chieh Lee, Osman O. Ahsen, Kaicheng Liang, Marisa Figueiredo, Qin Huang, James G. Fujimoto, and Hiroshi Mashimo. 2018. "Computer-Aided Analysis of Gland-Like Subsurface Hyposcattering Structures in Barrett’s Esophagus Using Optical Coherence Tomography" Applied Sciences 8, no. 12: 2420. https://doi.org/10.3390/app8122420
APA StyleWang, Z., Lee, H.-C., Ahsen, O. O., Liang, K., Figueiredo, M., Huang, Q., Fujimoto, J. G., & Mashimo, H. (2018). Computer-Aided Analysis of Gland-Like Subsurface Hyposcattering Structures in Barrett’s Esophagus Using Optical Coherence Tomography. Applied Sciences, 8(12), 2420. https://doi.org/10.3390/app8122420