Article

Experimental Simulation of Lightning Current Discharge on Rocks

1
Department of Earth and Environmental Science, University of Pennsylvania, 240 S. 33rd Street, Philadelphia, PA 19104, USA
2
Now at Department of Geology and Environmental Sciences, James Madison University, Harrisonburg, VA 22807, USA
3
Department of Electrical and Computer Engineering, Center for Electric Power Engineering, Drexel University, 3141 Chestnut Street, Philadelphia, PA 19104, USA
*
Author to whom correspondence should be addressed.
Appl. Sci. 2018, 8(12), 2394; https://doi.org/10.3390/app8122394
Submission received: 6 October 2018 / Revised: 11 November 2018 / Accepted: 19 November 2018 / Published: 26 November 2018

Abstract

:
Lightning is a transient, high-current discharge occurring within a thundercloud, between clouds, or between a cloud and the ground. Cloud-to-ground (CG) lightning is the most studied because of its impact on human life. The aim of this study is to elucidate the effects of lightning in Earth materials by simulating the lightning current discharges in a laboratory setting. Technical applications of this work include the study or development of customized materials used to prevent accidents, limit damage, or reduce interruptions in electrical power system owing to lightning strikes, such as lightning arresters or high-voltage fuses. High-voltage electrical arcs were discharged through rock specimens, and power, energy, and duration of discharge were estimated to provide a better understanding of the origin of naturally occurring fulgurites (shock-impact glasses) and the lightning/rock interaction. X-ray powder diffraction showed that the samples used for the experiment represent basalt (samples A0, A1–A4) and granite (samples B1, B2). Optical microscopy provides direct evidence that materials can be physically altered due to the heat generated by an arcing event. Optical microscopy observations showed that arcs passed through the target rocks and mimicked the effect of lightning strikes hitting the surface of the rock, melting the target rock, and passing to ground. Fulgurite glass observed on basalt samples shows the impact origin lining the surface of millimeter-size craters and a slash-like coating, whereas in the granite sample, the fulgurite was not observed because the arc passed directly to the laboratory ground. Significant differences in the duration of the experimental electrical arcs that passed through dry and wet samples (A1 and A3; A2 and A4, respectively) were observed. This discrepancy can be ascribed to the variation of the electrical properties related to the distribution of the water layer on the rock sample and to the occurrence of magnetite grains, which may increase the local conductivity of the sample owing to its electromagnetic properties.

1. Introduction

Lightning is a transient, high-current discharge whose path is measured in kilometers [1]. Lightning is one of nature’s most spectacular sights, but unexpected and menacing at the same time. It can be extremely dangerous, presenting a major natural hazard in many different environments, from power utility companies to civil aviation, and more [2]. In recent years, with great interest in renewable energy, wind turbines have become extremely vulnerable to lightning damage [3]. Lightning impacts not only economical activities, but also daily life. Thousands of people are killed every year by lightning bolts, while tens of thousands are injured [4,5]. In the United States alone, damages due to lightning strikes amount to tens of millions of dollars annually [6].
Mason [7] showed that thunderstorm cells of 2 km radius would be able to produce a succession of lightning flashes at intervals of about 30 s and very intense lightning activity, with flashes at intervals of less than 10 s, would require storm cells exceeding 5 km in radius. Any cloud type can potentially cause lightning or some related form of electrical discharge, as can snowstorms, volcanoes, and dust storms [1]. Over half of flashes occur within the cloud and are called intra-cloud (IC) discharges. Cloud-to-ground (CG) lightning is the most studied because of their impact in human life [1]. Lightning strikes reach the ground on Earth as many as 8 million times per day or 100 times per second, according to the U.S. National Severe Storms Laboratory [8]. CG lightning strikes transfer about 109–1010 joules of energy. Most of the lightning energy is spent to produce thunder, hot air, light, and radio waves [9,10]. Lightning strikes reach a speed of 94,000 km/s [9,10,11,12,13]. The peak temperature of the lightning channel is 10,000–30,000 K, which is up to five times the temperature of the surface of the Sun (the temperature of the solar interior is 107 K) [14,15].
When CG lightning strikes an appropriate target material such as sand, soil, or rock, the current flows through the target, heating the material to temperatures that exceed its melting point, followed by rapid cooling that results in quenching to form a glass called fulgurite [16]. About 90% of lightning flashes occur over continental landmasses as opposed to the open ocean [10,17], with up to 10 fulgurites formed globally per second [16]. The lightning peak temperature on a target material is considerably higher than the melting point of silica (1600–2000 °C, depending on the moisture content [10,18]).
Our research on lightning–rock interactions is motivated by the desire to prevent accidents owing to lightning strikes and by the need to protect advanced ground-based and air-borne systems that use low voltage, solid-state electronics. As lightning strikes are natural phenomena, it is difficult to investigate the electrical and physical properties of lightning strikes. Rock fulgurites can be used to study the properties of the lightning strikes that created them, and in turn, help to elucidate information such as the energy distribution of CG lightning. However, the mechanism of natural rock fulgurite formation is not yet clarified. The purpose of this paper is to contribute to the study of rock fulgurite formation by: (i) simulating the lightning current discharges to generate rock fulgurites in basalt and granite specimens; (ii) measuring electrical arc properties that are relevant to rock fulgurite formation, including power, energy, and duration of discharge; and (iii) exploring the lightning–rock interaction and the origin of shock-impact glasses.

2. Materials and Methods

2.1. Target Rocks

Experiments were performed using four basalt samples (labeled sample A1–A4) from Pennsylvania (USA) and two granite samples (labeled samples B1, B2) from Spain. The samples’ dimensions were 15 × 15 cm (thickness = 1.1 cm). A testing sample (a basalt rock from India labelled A0) was used to verify that the measurement equipment was properly configured. In order to elucidate possible differences in the arc duration and electrical properties needed to form fulgurite glass, dry and wet experimental conditions were considered. In wet experimental conditions, 1 mL of water was used. The experiment was repeated several times to verify the consistency of data on each sample type.

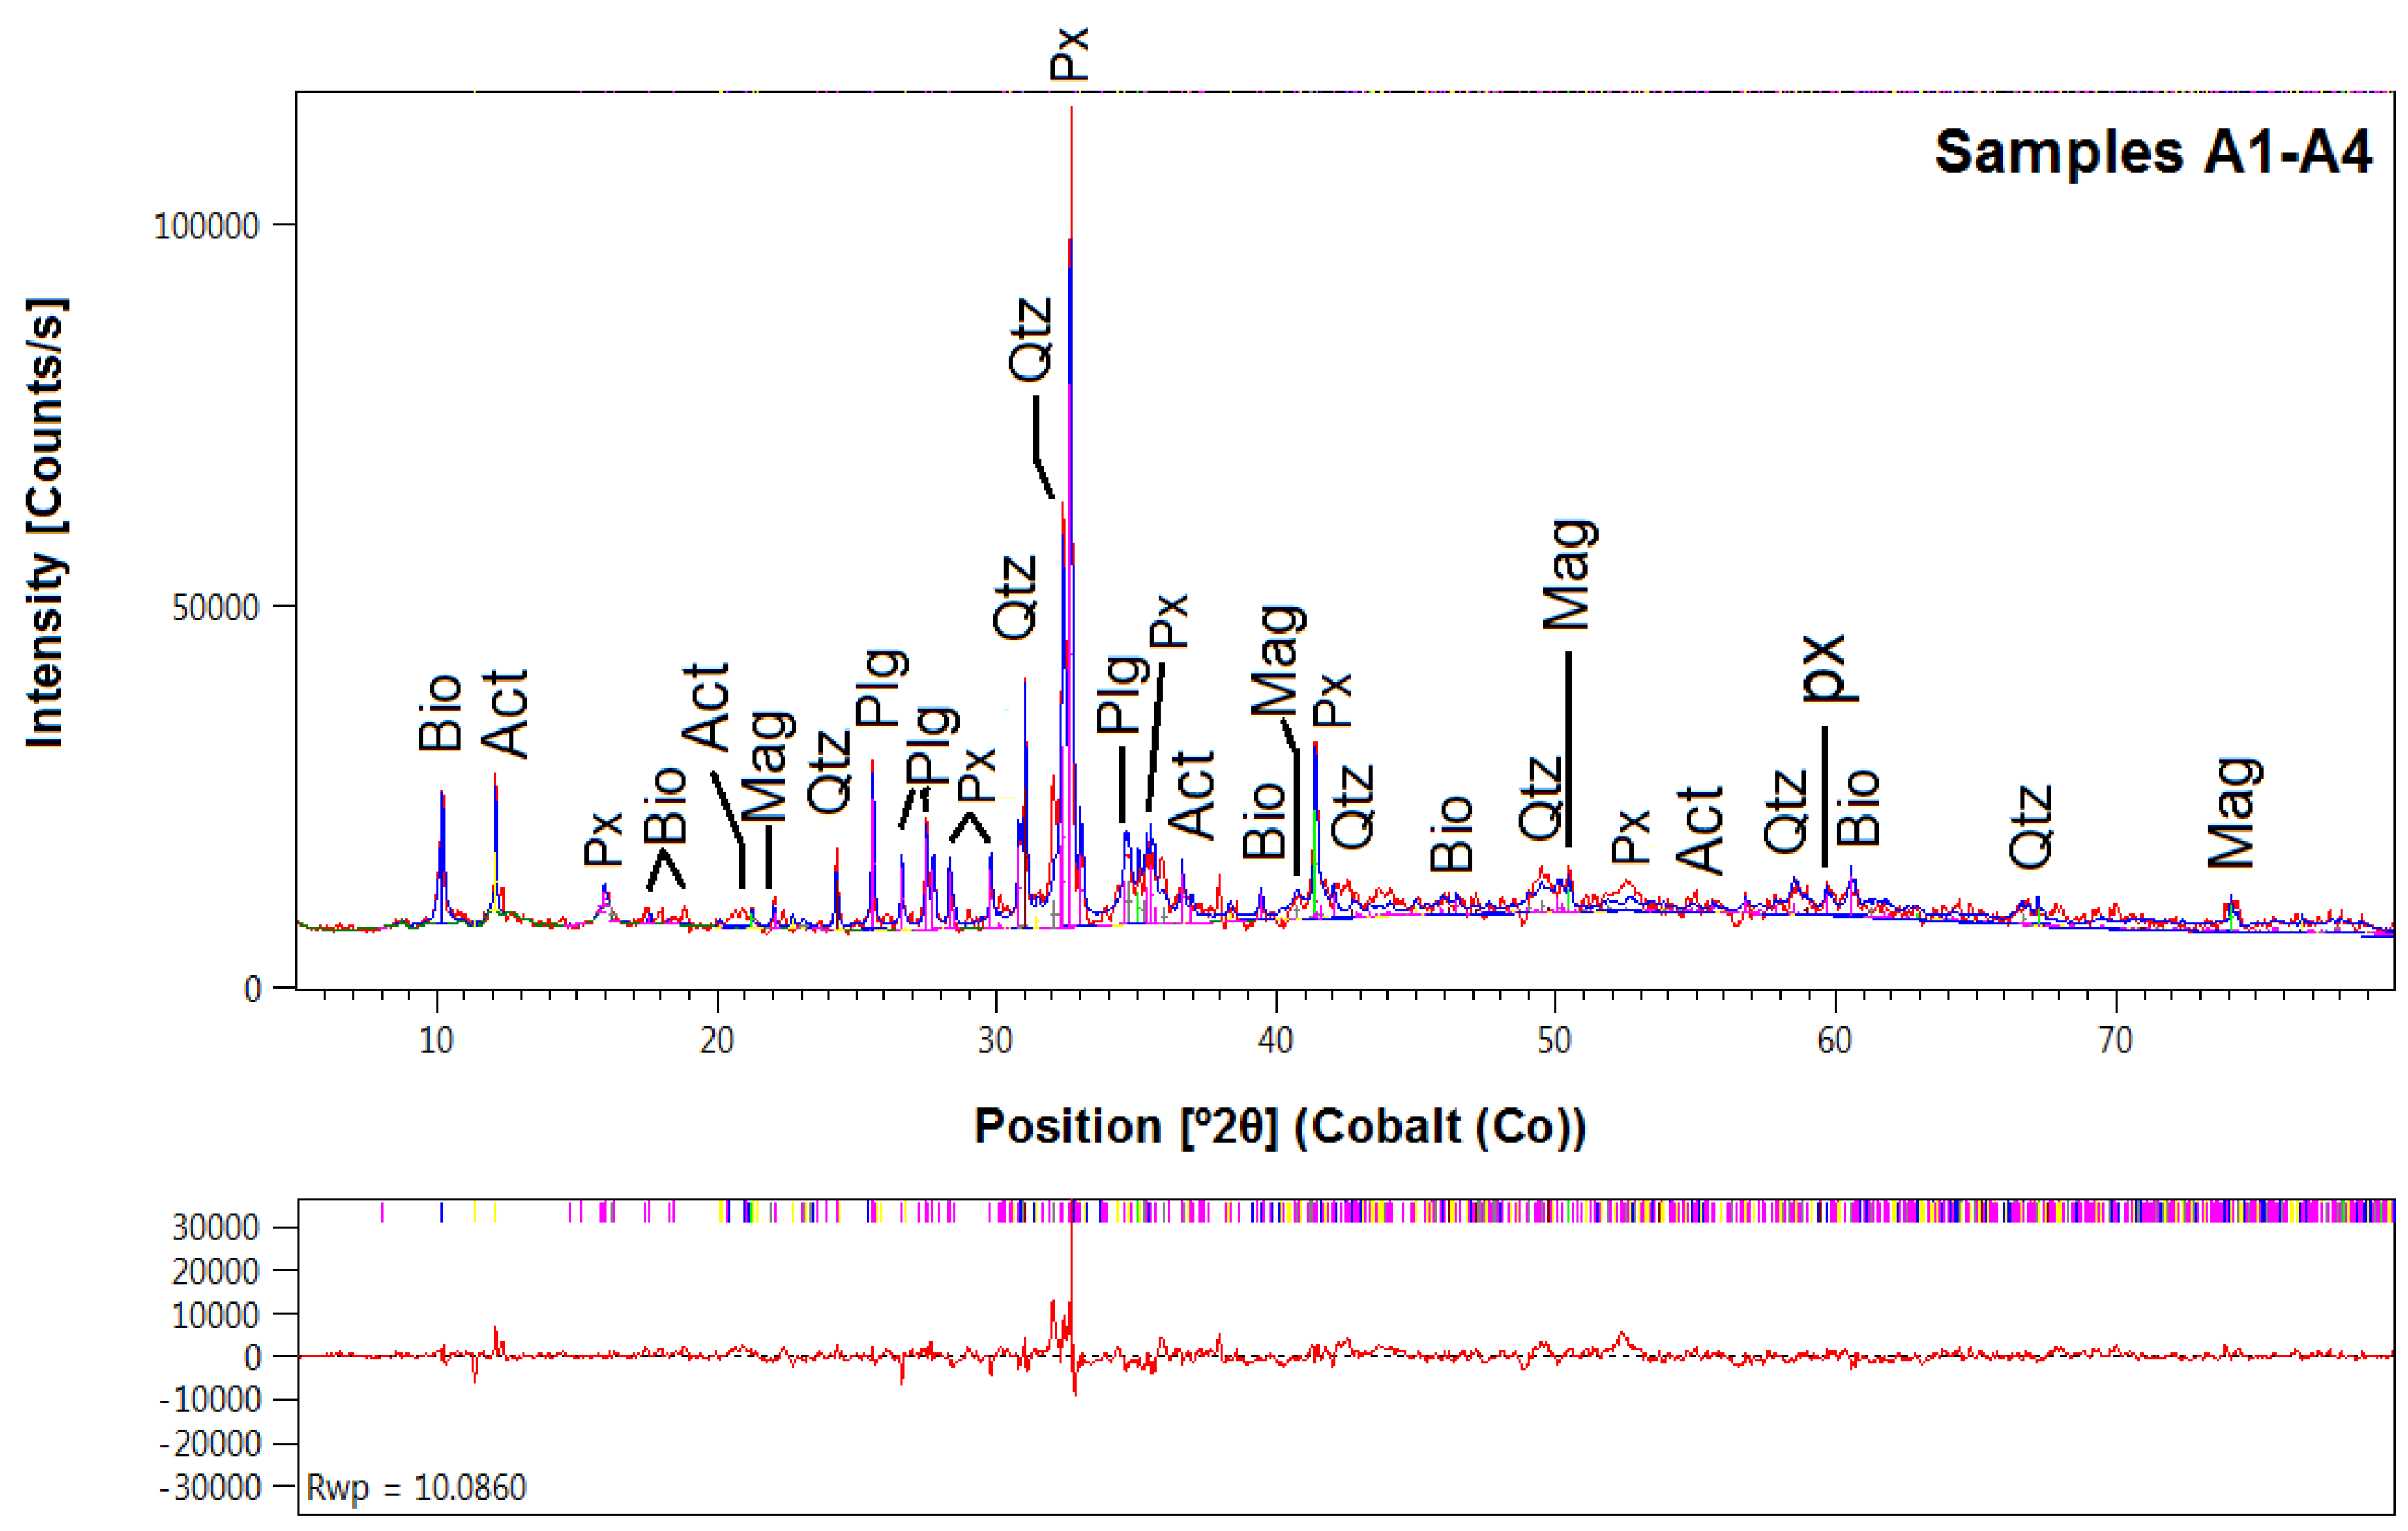
2.2. X-Ray Powder Diffraction

X-ray powder diffraction (XRPD) was used to identify the mineralogical composition of the samples used for the experiment. Fragments of each of the basalt and granite samples were finely powdered with an agate pestle and mortar before spinner mode analysis.
X-ray patterns were obtained using a PANalytical X’Pert diffractometer (PANalytical Westborough, MA, USA) equipped with an X’Celerator detector and CoKα radiation (40 kV/40 mA) operating in isothermal mode (25 °C) at the Department of Earth and Environmental Science of University of Pennsylvania. Data on all rock samples were collected with scan range between 5–70° 2θ, step size 0.02°, divergence slit of 0.125°, and anti-scatter slits of 0.5°. The fitted peak width for collected data was about 0.01° 2θ. A Co anode was chosen to avoid fluorescence encountered with Fe-bearing minerals and Cu radiation. The incident beam optical module PANalytical Bragg-BrentanoHD was used to improve peak/background ratio and increase intensity in spectral peaks. Quantitative mineralogical analyses and determination of the content of amorphous material with the external-standard method (the K-factor method after O’Connor and Raven [19]) were performed using PANalytical’s HighScore Plus version 4.6 software [20]. Pure crystalline Al2O3 (NIST SRM 676a) was chosen as an external standard and was analyzed under the same instrumental conditions as the samples.

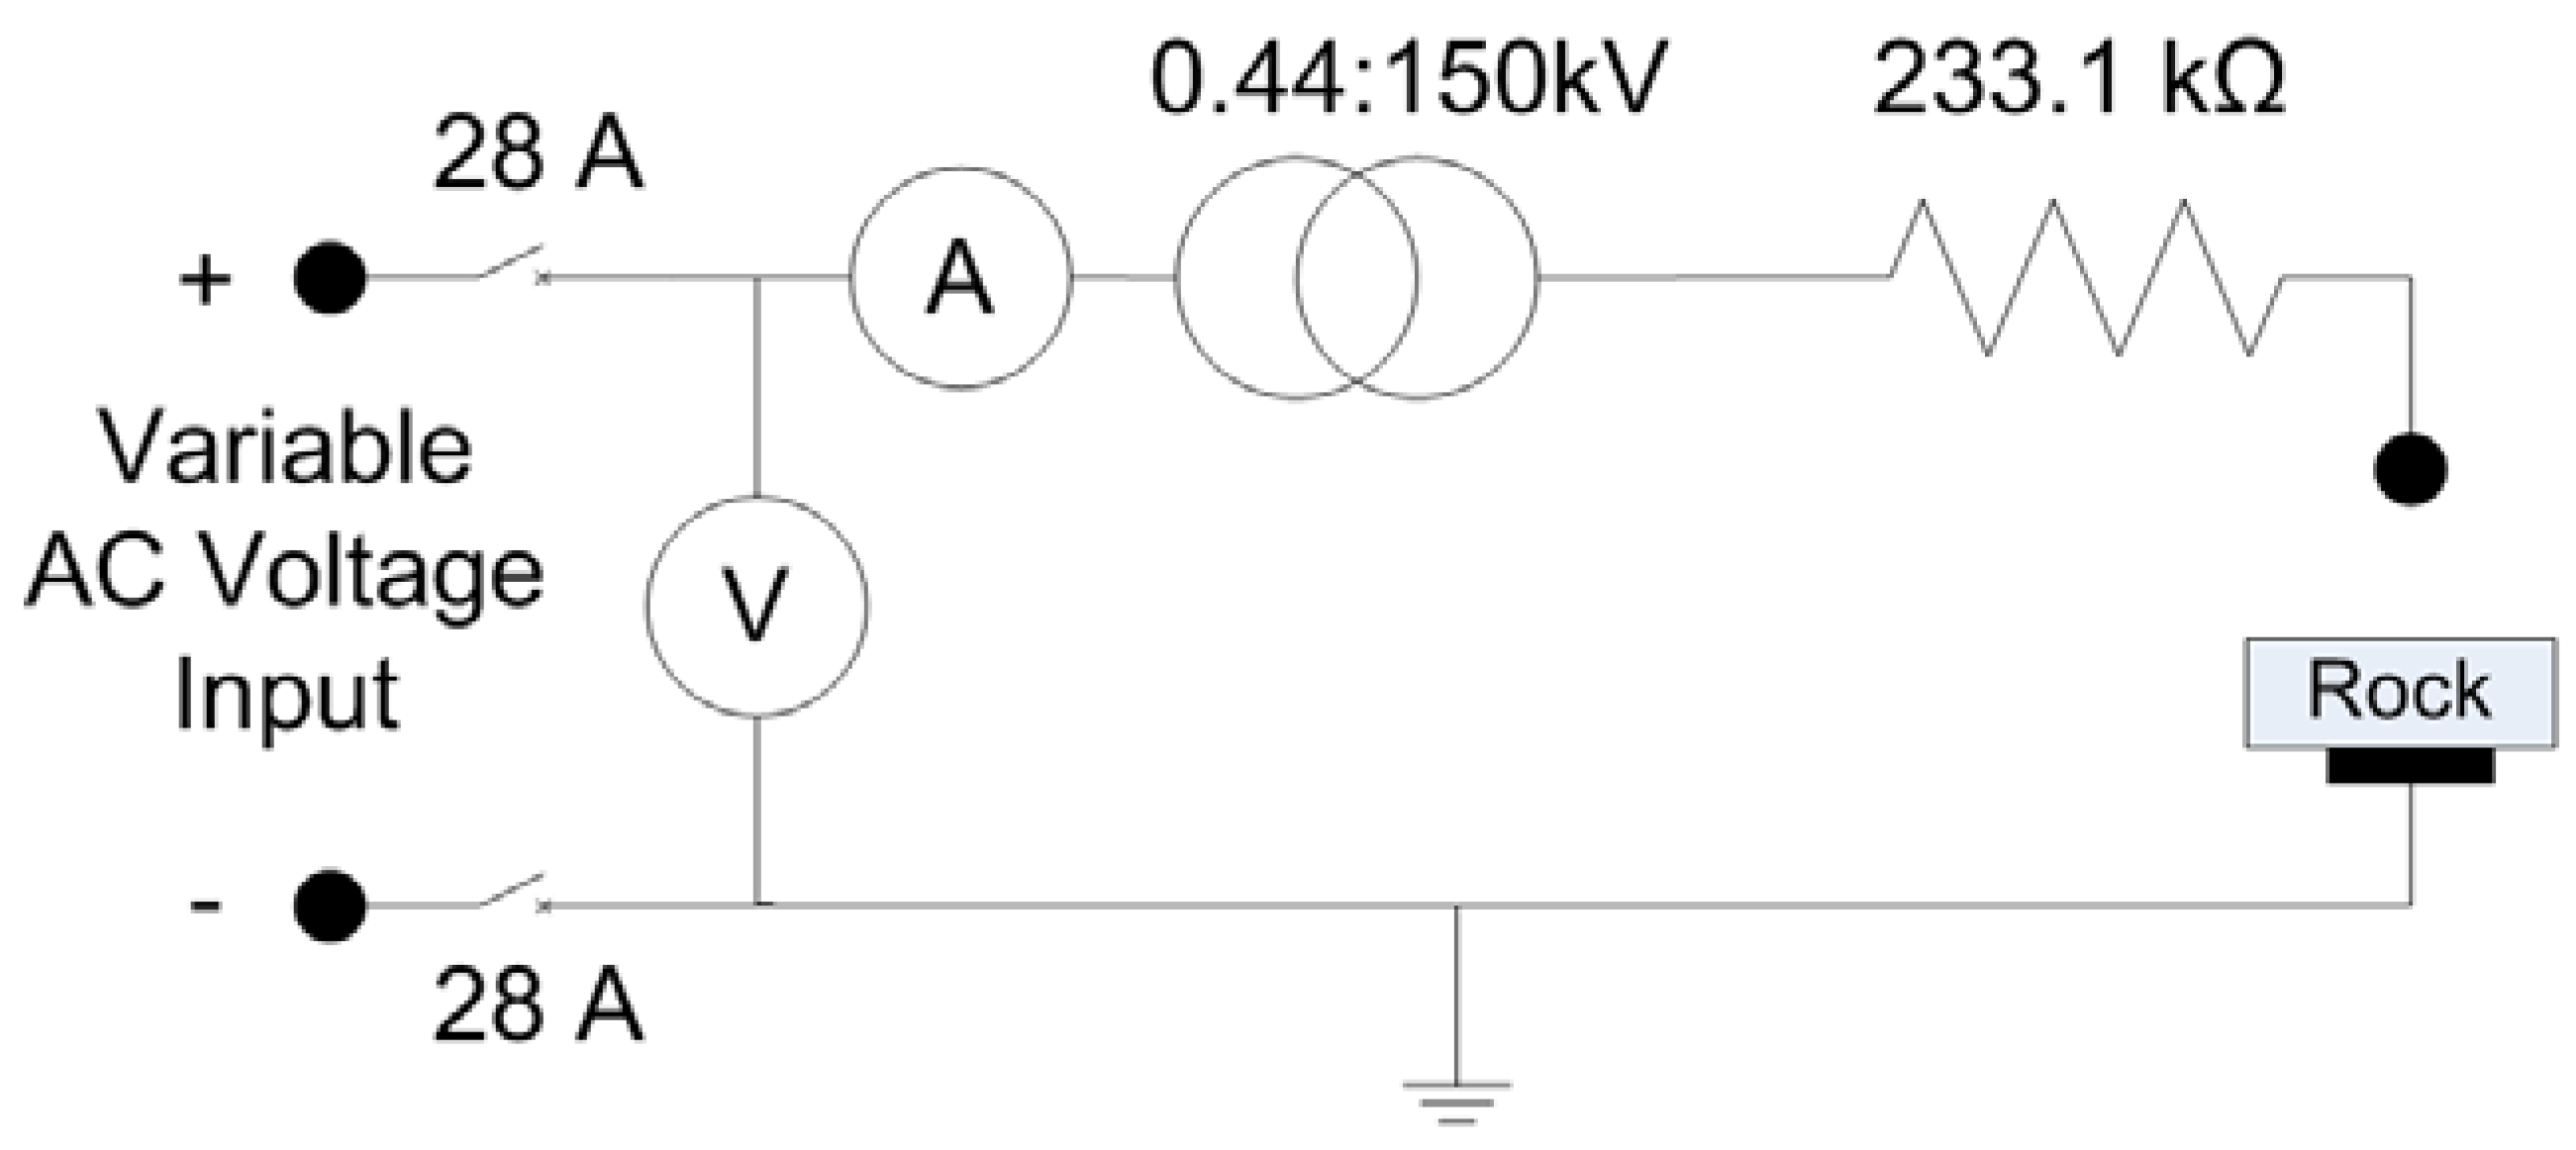
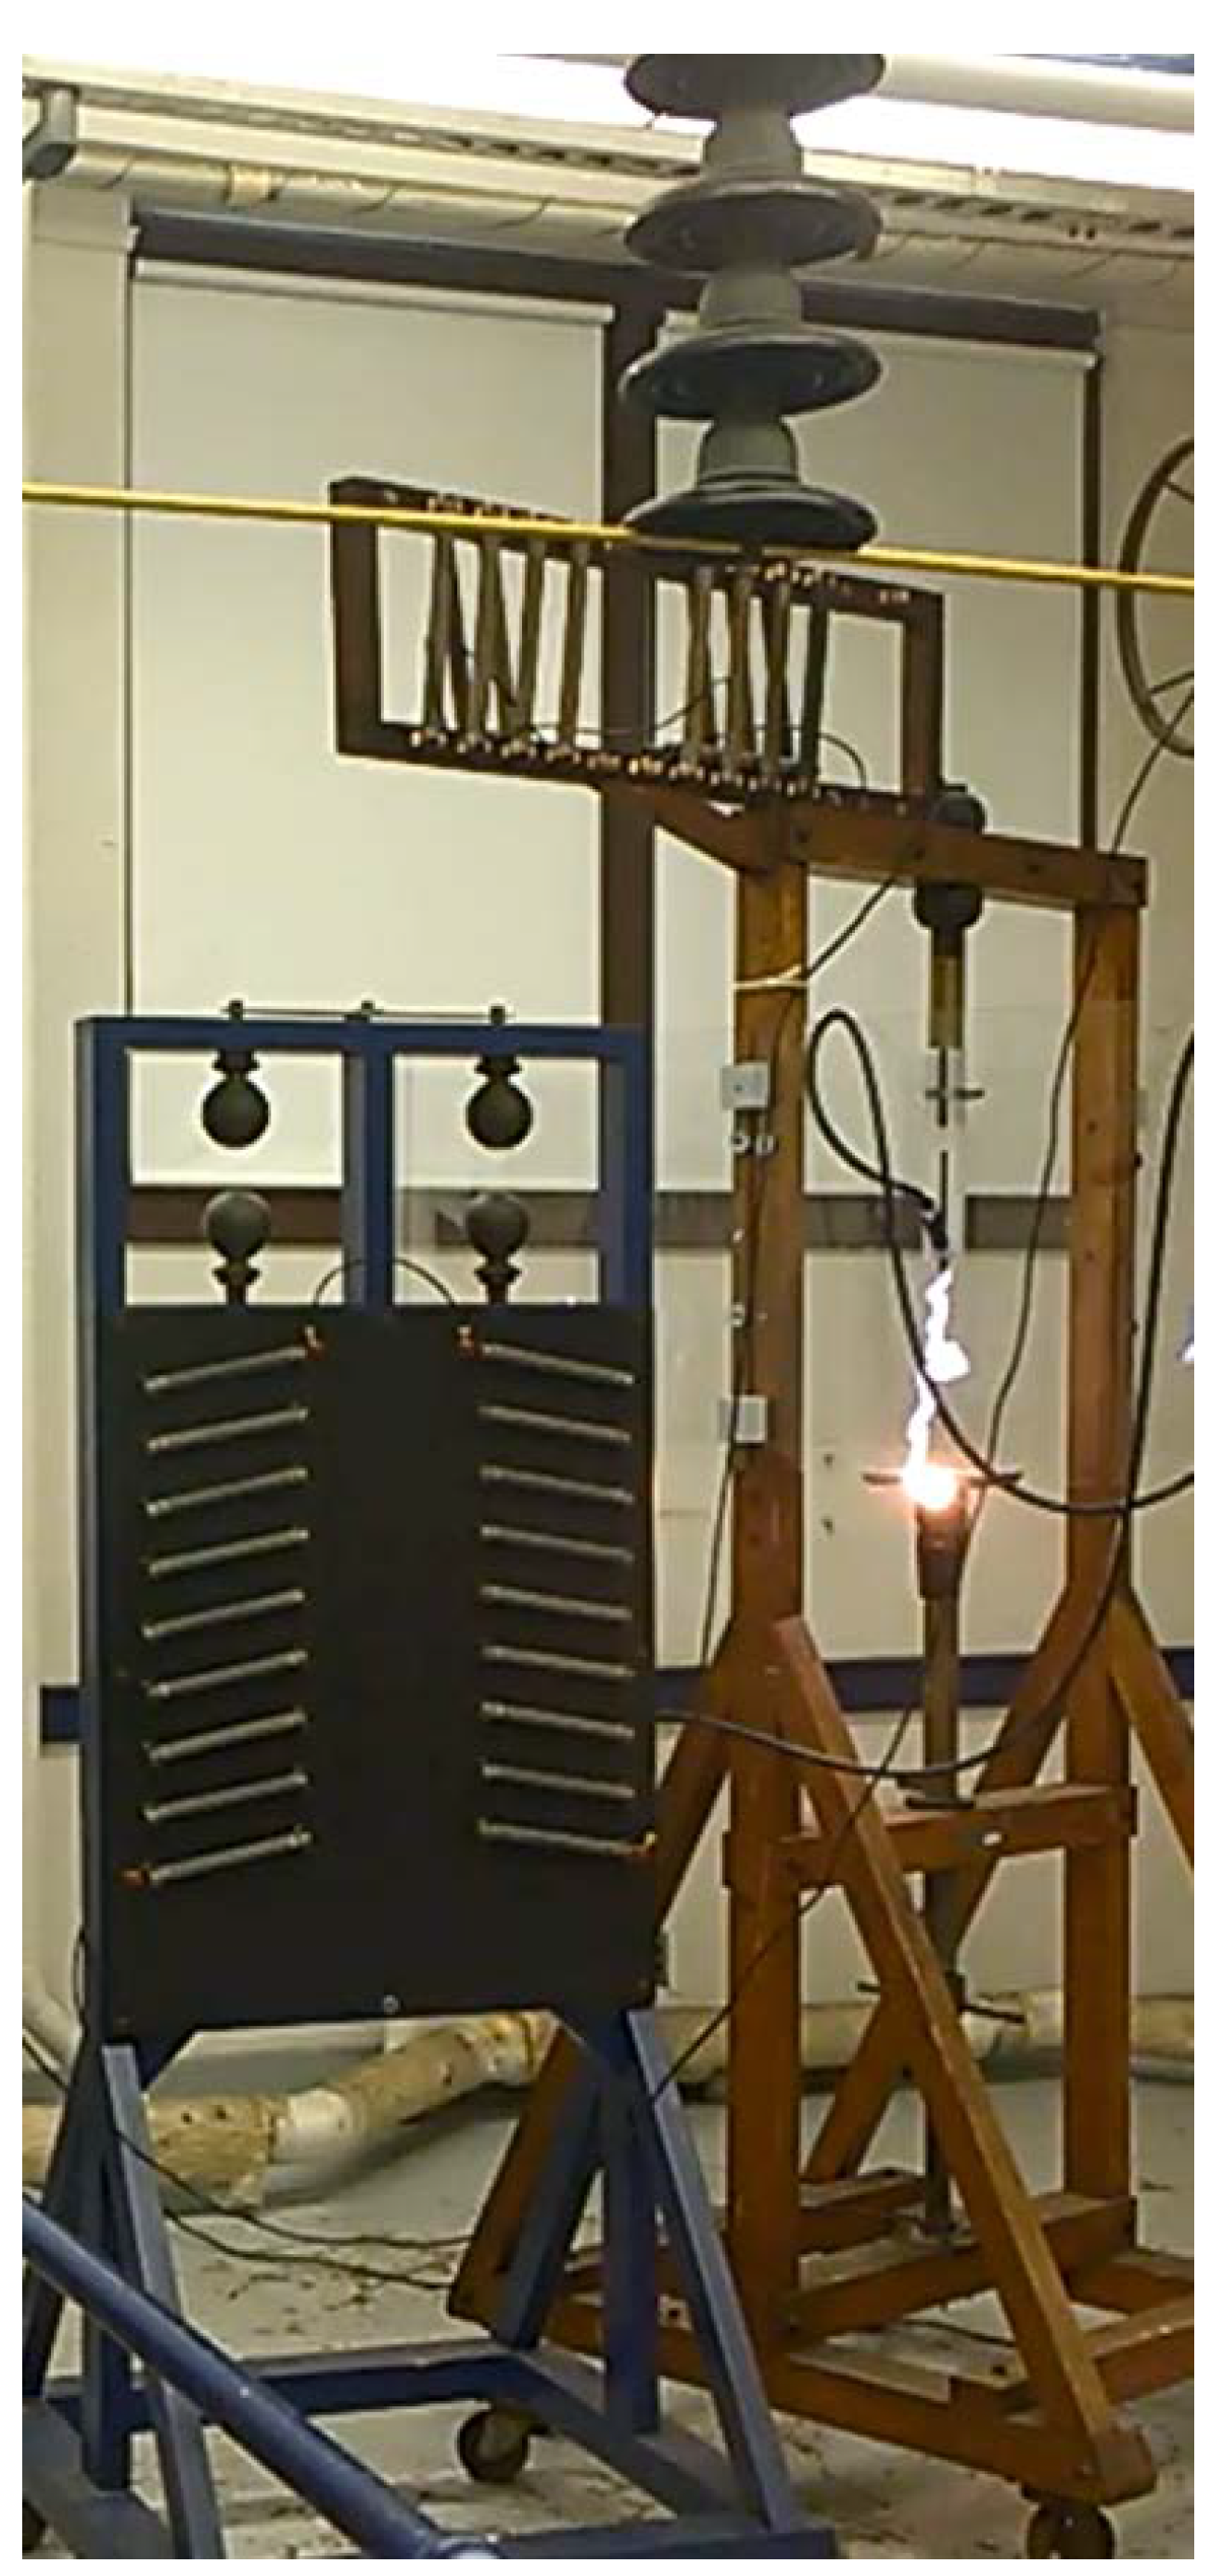
2.3. Experimental Hardware Setup

The experimental simulation of the lightning current discharges was conducted in the High Voltage Laboratory at Drexel University’s Center for Electric Power Engineering (CEPE). The controlled experimental environment described here allowed for non-destructive, repeatable testing. Data were collected using typical electronic lab equipment.
A high voltage alternating current (AC) power source was connected across a set of electrodes aligned on either side of the target rock specimen. Target rock specimens were placed on a conductive brass base below a tungsten welding tip (Figure 1).
The AC equipment used in this experiment was rated for up to 15 kVA and 150 kVRMS. A non-conducting vessel was designed for safety and to contain any fragments of the material that may be blown apart during the test. Figure 1 shows a circuit diagram of the electrical setup used in the experiments. The experiment was conducted at atmospheric temperature and pressure. Sample A0 was used to determine the fixed distance between the electrodes for all experiments. With sample A0 on the base electrode, the applied voltage was gradually increased using an autotransformer until an either (i) an arc passed through the sample (i.e., a “fault” occurred), or (ii) the upper voltage rating of 150 kV was reached. In the latter case, the laboratory was de-energized, and the distance between the electrodes was decreased (step length = 10 cm). The final distance between electrodes was fixed at 30 cm. Accounting for sample thicknesses, the vertical distance between the welding tip and the target specimens was fixed at 28.9 cm for samples A1–A4 and 26.5 cm for samples B1 and B2.
Voltage and current waveforms were sensed on the primary (low voltage) side of a 440:150,000-V single-phase transformer (assumed ideal with no losses) and referred to the secondary (high voltage) side of the transformer (Figure 2).
Measurement equipment included: (i) Tektronix DPO 3014 oscilloscope (Tektronix, Beaverton, Oregon, USA); (ii) Tektronix TCP 303 current probe; (iii) Tektronix TCPA 300 current amplifier; and (iv) Tektronix P5200A differential voltage probe.

2.4. Electrical Measurements and Calculations
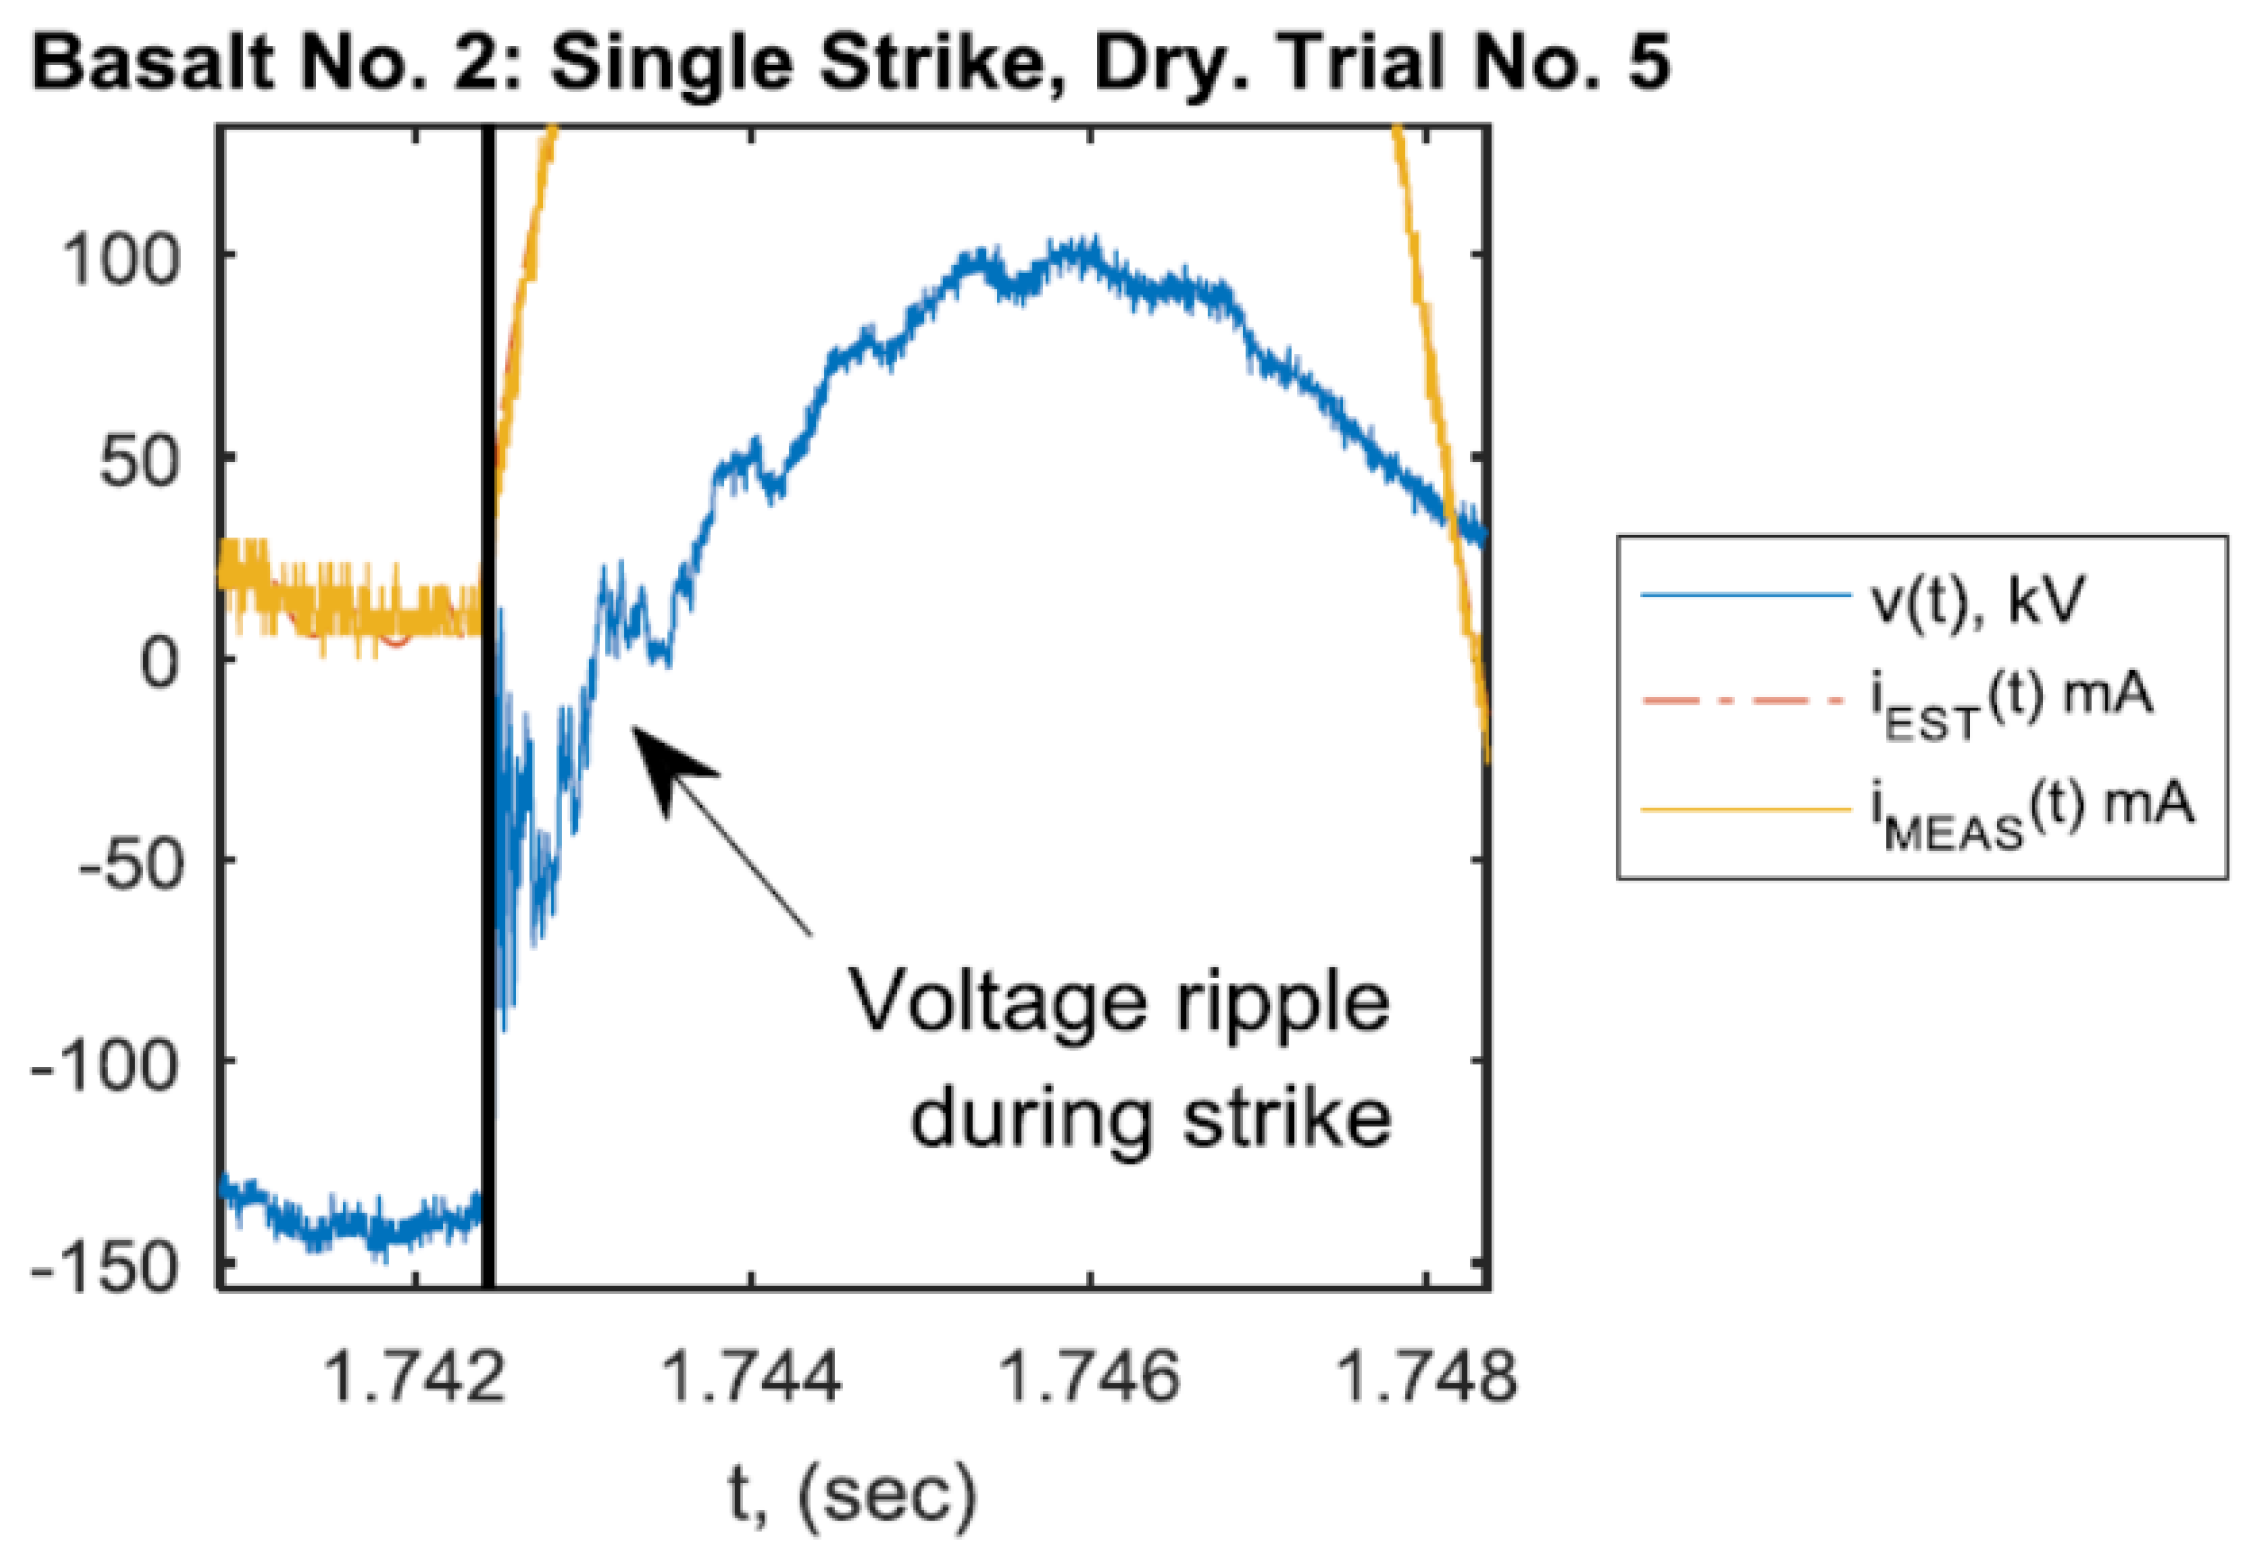
Voltage and current waveforms were measured on the primary (440 V) side with a sampling frequency of fs = 250 kHz. With the ideal transformer assumption, the measured current Ip as referred to the secondary (rock side) of the transformer is I R = I s = a 1 I p where a = 341 was the turns ratio of the transformer. The measured voltage V referred to the secondary side is V s = a   V p , and the voltage across the rock is V R = V s R I s where R = 233.1 kΩ was the series resistance placed to limit fault current.
Due to equipment limitations, some current measurements were clipped. Cubic spline interpolation was used to reconstruct the clipped portion of these signals (Figure 3).
From the voltage and current waveforms, power and energy estimates were performed as follows:
p R [ k ] = v R [ k ] i R [ k ]
e [ n ] = T s k = k 0 n p R [ k ]
where pR[k], vR[k], and iR[k] are the power, voltage, and current at the rock specimen on sample k, k0 is the estimated sample on which the strike occurs, T s = f s 1 is the sampling period, and e[n] is the total energy of the fault up to sample n.
To compute the total energy dissipation for a given arc discharge event, it was necessary to use the data to estimate the instants of fault onset and of fault extinction. Fault onset occurs when the magnitude of the voltage across the electrodes is large enough for an electrical discharge to occur through a path connecting the electrodes. The physical discharge path is three-dimensional and random (i.e., current may not flow in a straight line connecting the electrodes). Fault extinction occurs when the circuit breaker opens. The procedures for estimating fault onset and extinction times from the recorded current and voltage waveforms are explained next.

2.5. Fault Onset

When flashover occurs, there is a near-instantaneous change from an open circuit condition to a short-circuit condition. In terms of the measured quantities, this is when the voltage drops to zero. A discrete wavelet transformation was leveraged to find events of this type within the discretely sampled voltage waveforms. Wavelet decomposition is a signal analysis tool that can be used to localize events/disturbances in a signal in both time and frequency [21]. The Daubechies family of wavelets in particular [22] is commonly used in the analysis of electric power system disturbances (e.g., References [23,24,25]). Here, the Daubechies-4 (db-4) wavelet was used to detect fault onset.
Wavelet decomposition produces coefficients representing the strength of different frequency bands at different points in time within the signal. An arc discharge is a near-instantaneous event, thus the highest frequency components of the signal were of interest. Within each time-domain voltage signal, the data sample with the greatest high-frequency component (i.e., the sample associated with the largest first-level wavelet detail coefficients) was considered the sample of fault onset. This was verified by inspecting the portion of the voltage waveform around this sample to ensure that a short-circuit condition actually occurred at this time, and that the first-level detail coefficient strength could not be attributed to noise or truncation error.

2.6. Fault Extinction

Fault extinction occurs when the circuit breakers open and replace a short-circuit condition (large current) with an open-circuit condition (zero current). Once the breakers open, the voltage across the electrodes remains at zero. Therefore, the fault extinction event must be detected within the current waveforms.
Compared to the voltage waveforms, the current waveforms had a lower relative resolution and signal-to-noise ratio. As a result, the wavelet decomposition technique discussed above was less effective and more prone to error, thus an alternative method was used to detect fault extinction. A post-fault, open-circuit condition was considered to exist when the measured current amplitudes became indistinguishable from noise. For an event with an estimated fault onset sample k 0 , the procedure for identifying fault extinction was as follows:
  • Characterize the pre-fault (open-circuit) noise level in the current measurement using the standard deviation (assume noise is Gaussian with mean μ estimated from the data):
    σ = 1 k 0 1 k = 1 k 0 ( i R [ k ] μ ) 2
  • Find the post-onset sample for which all later data samples could be considered noise:
    k F = { k | k k F ,   | i R [ k ] | < 6 σ }
With a 6σ threshold and the assumption of Gaussian noise, less than two in one-million samples of noise in the current channel will fall outside of the threshold, on average. This threshold was selected through trial-and-error. Manual inspection of the waveforms showed that smaller thresholds resulted in the inclusion of a significant number of post-extinction samples. Theoretically, smaller thresholds yield higher false alarm probability, which is problematic because of the high sampling rate (250 kHz).

3. Results

3.1. Mineralogy of Target Rocks

Prior to the experiment, the testing sample A0, samples A1–A4, and samples B1–B2 were observed using optical microscopy. Samples A0–A4 showed a dark-colored, fine-grained texture, while samples B1 and B2 showed light-colored, coarse-grained texture.
X-ray powder diffraction (XRPD) was used to identify the mineralogical composition of the rock samples. Testing sample A0 was composed mainly of pyroxene, plagioclase, and magnetite, whereas the main constituents of samples A1–A4 were pyroxene, plagioclase, magnetite, and quartz (Figure 4).
Accessory and alteration minerals include micas, talc, and amphiboles in sample A0; and micas and amphiboles in samples A1–A4. The XRPD data on samples B1 and B2 revealed the presence of quartz, plagioclase, K-feldspar, and micas (Figure 5).
According to the XRPD results and optical microscopy observations, the testing sample A0 and samples A1–A4 represent a basalt rock type, whereas the samples B1 and B2 represent a granite rock type. All samples used for the experiments were homogeneous and isotropic. Quantitative mineralogical analyses and determination of the content of amorphous material were performed on the test sample A0, samples A1–A4, and samples B1 and B2. Results are shown in Table 1.
Pasek and Hurst [16] determined the energy at one bar of pressure required to promote the melting of quartz to form sand fulgurite. Following Pasek and Hurst [16], considering the density of basalt is 3 g/cm3 [26], the enthalpy of basalt at 1 bar is 9.145 J/mol [27], the molecular weight of basalt is 125 g/mol [28], and the internal diameter of fulgurite observed via optical microscopy is 0.08 cm (this work), the energy per unit length (E) required to vaporize basalt to make the fulgurite glass is 17.2383 J/cm3.

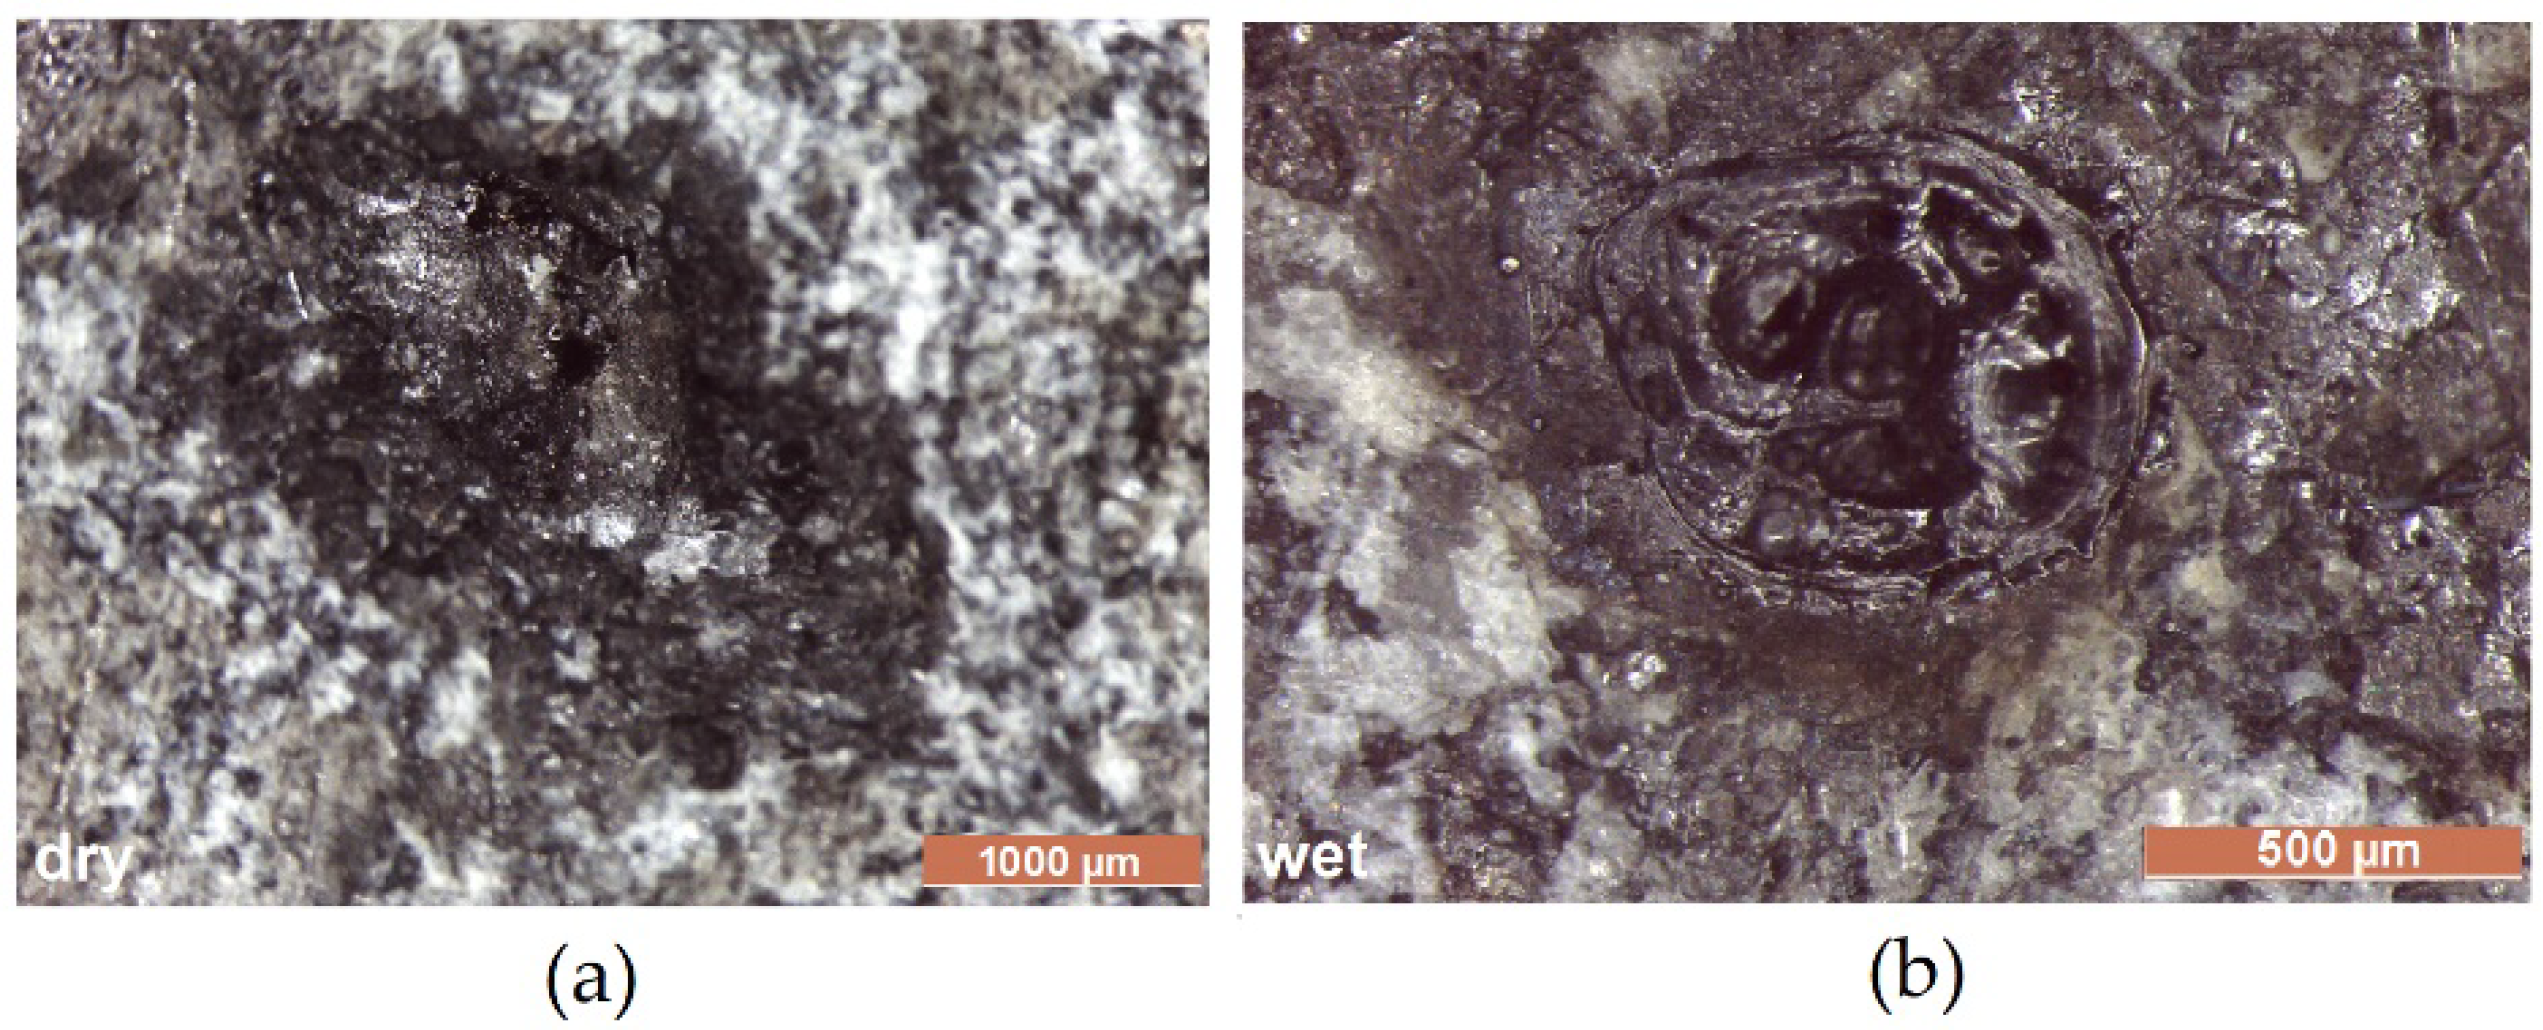
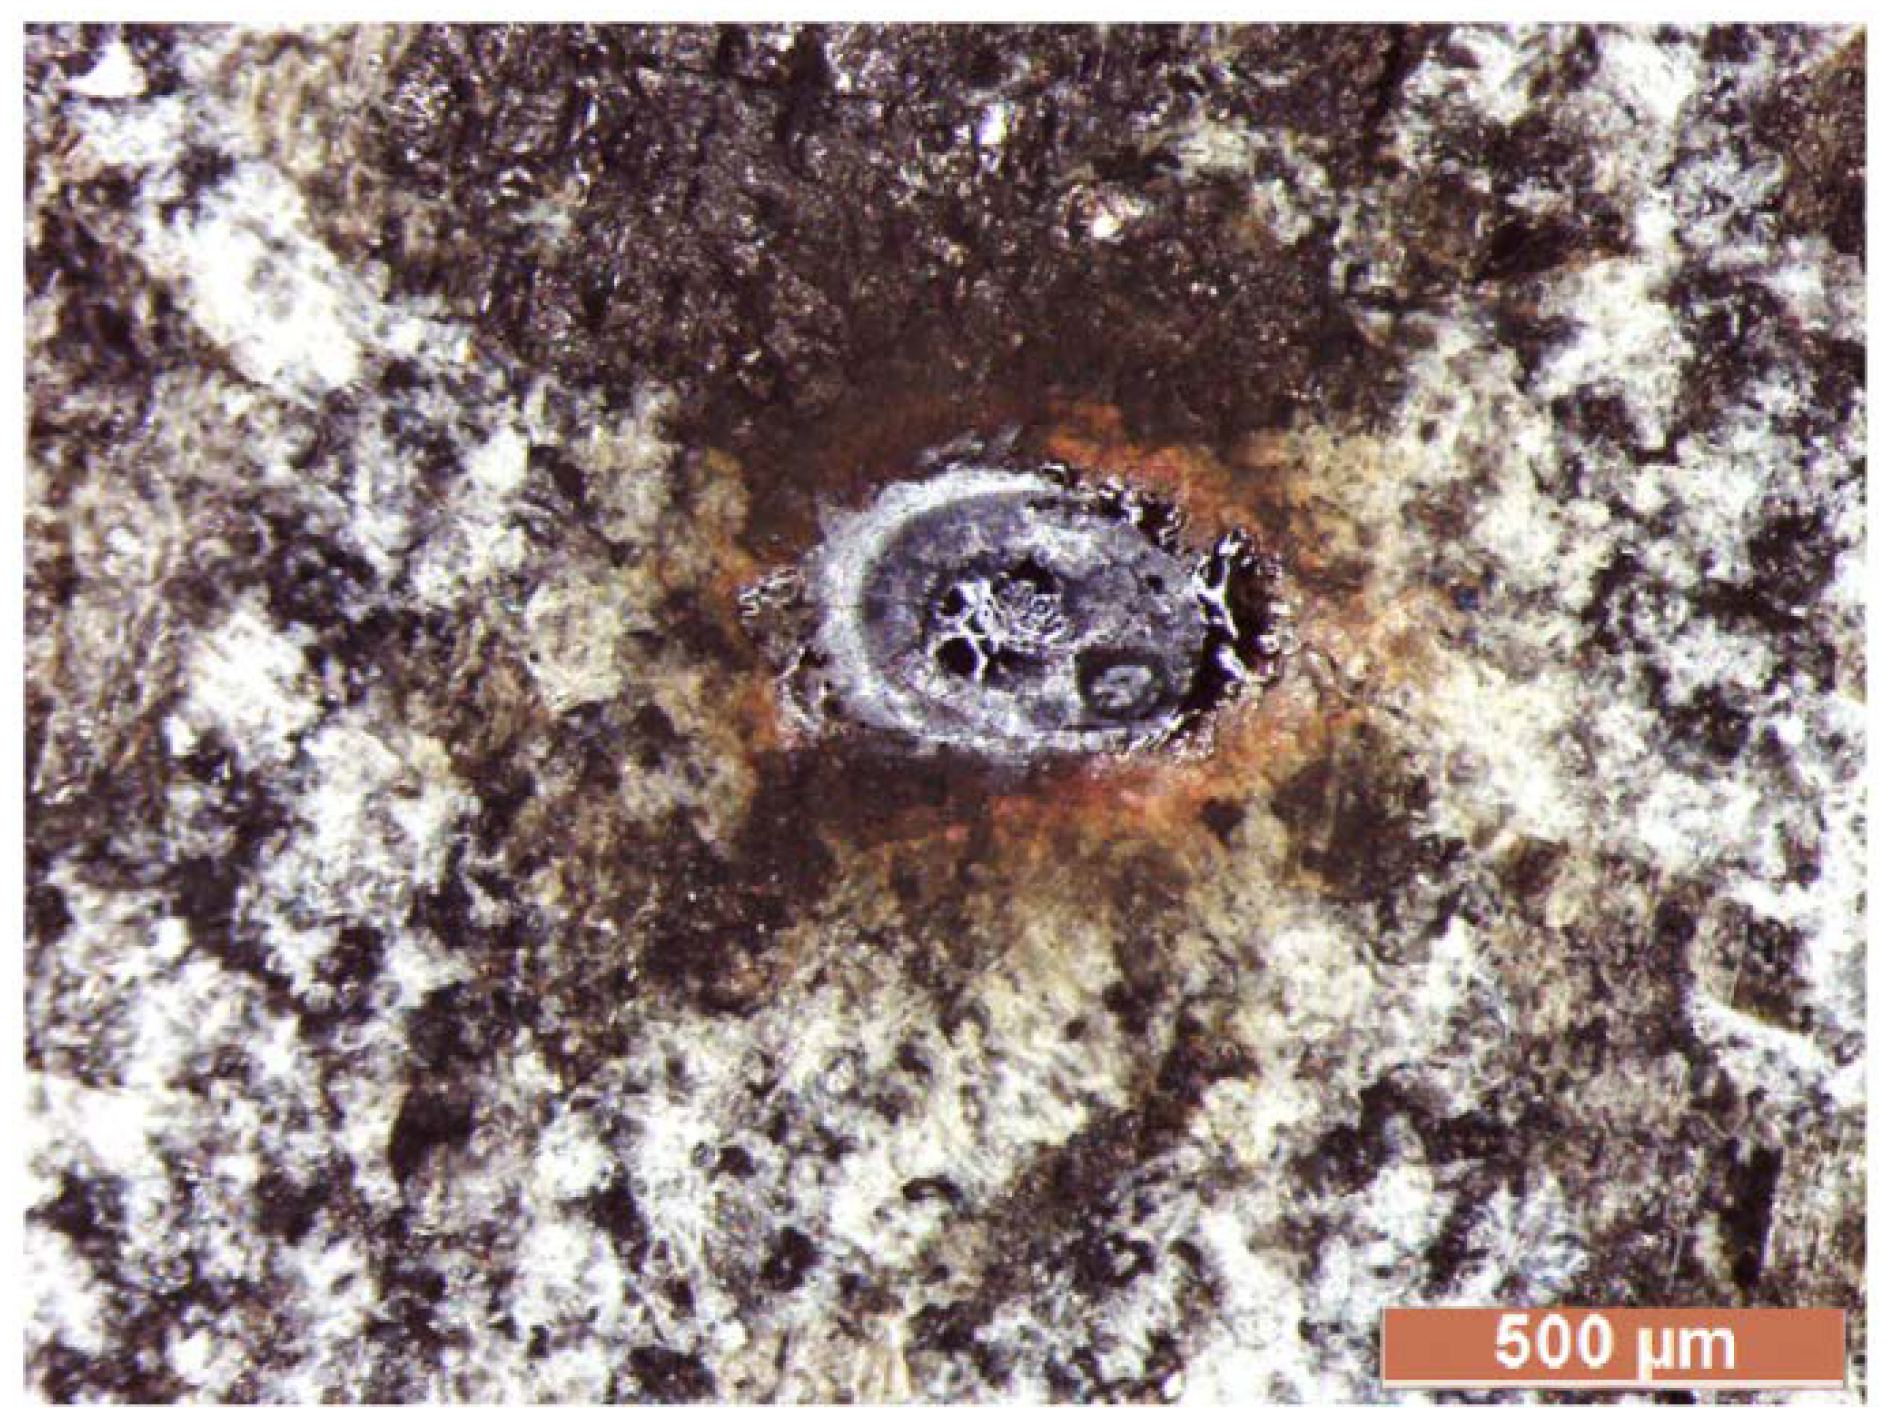
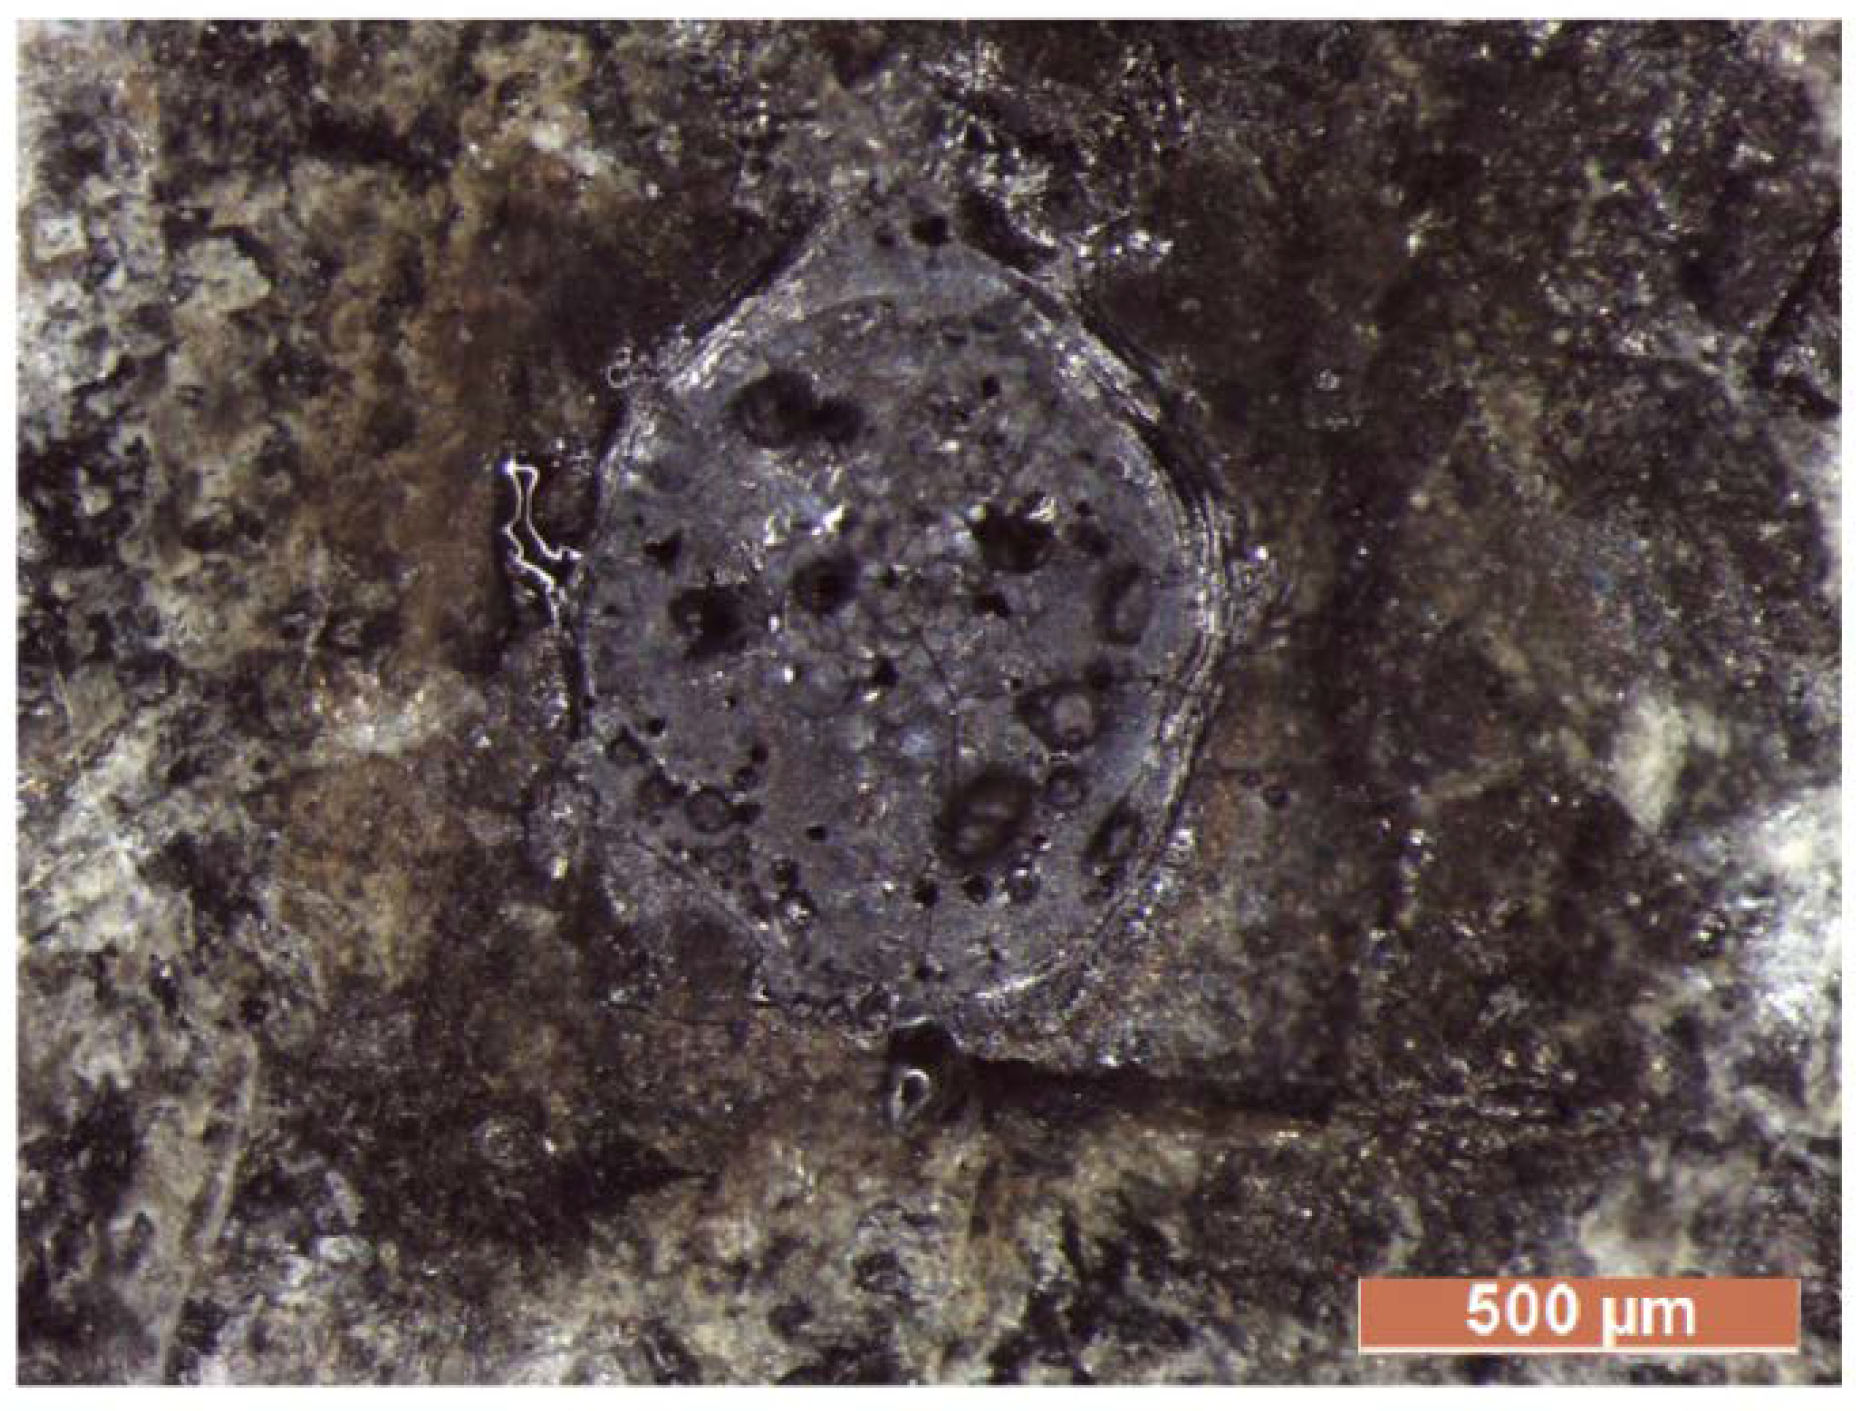
3.2. Arc Discharge Experiment Results

A photo camera provided approximately the instant (static) tridimensional spatial image of the spark discharge on the target material (Figure 6). Strikes were verified by macroscopically observing the surface of the samples after each lightning strike and labeling the arc entrance and exit location on the surface of samples.
Table 2 describes the specimens and the experimental electrical data obtained after each arc flash event. RMS voltage and current data, fault durations, peak and average power, and total energy dissipation data was recorded and calculated as described in the Materials and Methods section.

4. Discussion

4.1. Lightning Simulation

The initiation and growth of a conductive plasma channel (lightning leader) between a cloud and the ground (rock surface) represents the first step to form fulgurite. The leader arises in a region where the electric field is strong enough to ionize the air by electron impact. The air ionization length does not exceed several hundreds of volts per centimeter, which means that there is an intensive ionization occurring in its tip region, changing the neutral air to a highly conductive plasma [29]. This becomes possible because the lightning spark carries its own strong electric field induced by the space charge concentrated at the lightning tip and transported with it. In our experiment, the leader electric field is that of a tungsten needle (approximate diameter = 1 mm) connected with a wire to the secondary terminal of a 440/150,000 V transformer. The strong field region, in which the air molecules become ionized, will move down together with the arc flash.
Along the path from the needle to the rock surface, the lightning leader tip carries a high potential comparable with that of the needle at the spark start, the potential difference being equal to the voltage drop in the leader channel. A short circuit condition occurs when the spark goes to laboratory ground, resulting in large currents that heat the material surrounding the leader channel resulting in the formation of fulgurite glass. The current magnitude depends on the potential at the needle and the composition of the leader channel (i.e., the composition of the air and/or rock within the channel).

4.2. Fulgurite Glass Formation

For the first law of thermodynamics for closed systems, energy transferred across the boundary of a system in the form of heat always results from a difference in temperature between the system and its immediate surroundings and a change of internal energy of the system. Due to the mechanical imbalance between the high-temperature air around the lightning channel and the air surrounding the rock, the former expands, vaporizing the rock at its contact and producing a crater on the rock surface. These effects were observed via optical microscopy on testing sample A0 (Figure 7) and basalt samples A1–A4, which show millimeter-size craters surrounded by glass (Figure 8, Figure 9 and Figure 10).
An orange-brown spray rim was observed via optical microscopy around the crater of dry sample A2 (Figure 9) and it could be ascribed to the thermal decomposition of magnetite according to XRPD patterns on samples A1–A4. Octahedral sites in the magnetite atomic structure contain ferrous and ferric iron species. Different Tf and total fault energy values observed on sample A2 and A4 after multiple strikes (Table 2) could be related in part to the magnetite grains, which may increase the local conductivity of the sample owing to its electromagnetic properties. The electrons coordinated with iron species are thermally delocalized and migrate within the magnetite atomic structure [30].
The electrical conductivity of a rock at room temperature is determined by the amount of water present, the salinity of the water, and the manner in which the water is distributed through the rock [31,32]. Therefore, the faster process involving the electric impulse discharge and the total fault energy (E) values observed on wet sample A3 and A4 (Table 2) could be ascribed to the variation of the electrical properties for water-bearing rock and the distribution of the water layer on the rock sample.
The chemical interactions between the water and rock material at the pore surface can also be significant in the bubble formation [18,33]. Optical microscopy of the wet samples (A3, A4) showed the presence of bubbles in fulgurite glass (diameter of bubbles < 1 μm, Figure 10). These bubbles can be generated from the vaporization of water and incorporation of air during the fast cooling of melted rock on the wet sample surface. Elmi et al. [18] observed a diffuse porosity in the fulgurite glass of granite via environmental scanning electron microscopy (ESEM). These authors ascribed the formation of the voids and the change in the chemical composition of fulgurite compared to the bulk granitic rock to the vaporization of the wet rock during lightning strike. In samples B1 and B2, glass formation was not observed on the top of the rock because the arc passed directly to laboratory ground without evidence of melting on the surface of the granite. The felsic minerals composing the sample B1 and B2, and in particular, the large quantity of micas (micas = 7.5 wt% from XRPD quantitative analysis, Table 1), are known for their excellent electrical insulation properties [34], and can inhibit the lightning strike at the granite surface. However, fulgurite formation in granite has been previously observed, particularly in weathered samples [18]. Rock can weather via chemical decomposition or by physical disintegration. In the chemical decomposition of granite, quartz generally remains unchanged, biotite is transformed to chlorite and other clay minerals, and feldspars break down to a variety of clay minerals with plagioclase decomposing first [35]. Elmi et al. [18] observed a rock fulgurite on natural chemically weathered granite from Baveno (Italy). These authors ascribed the dark brown-black color of the fulgurite powder to the lightning-induced burning of organic matter (e.g., lichen, leaves, roots, etc.) growing on the surface of the rock before lightning strike. Moreover, Elmi et al. [18] observed intense alteration of the minerals composting the bulk granite. As chemical weathering was not observed in samples B1 or B2, it can be assumed that the intense alteration of granite-forming minerals and the organic matter coating can create a local positive electrostatic charge to which the lightning is attracted.

5. Conclusions

The randomness in time and space of lightning occurrences makes direct measurement of lightning difficult and consequently makes the studies on lightning processes generating rock fulgurite challenging. This paper reports the first attempt to measure the electrical conditions required to form a rock fulgurite. The data reported in this study provides a means of directly determining energy, voltage, current, and peak instantaneous power as parameters of an event mimicking the effect of the lightning current discharges hitting the surface of the rock and passing to ground.
The textural features and electrical properties of basalt (samples A1–A4) reported in this paper showed that the series of events occurred to produce a rock fulgurite can be summarized as follow: (i) ultrafast mechanical impact of the leader spark with the rock surface. Consequently, a crater appears and an increase of pressure occurs around the hole; (ii) the sudden rise of temperature generated by the lightning channel melting of the rock; and (iii) fast cooling and generation of the glass (fulgurite) in the rock. Further investigations on the microstructure and texture of these samples will be carried out in future experiments in order to investigate the physical properties and thermal effects resulting from electrical arc discharge through a target material.
The methods presented it this paper are accessible to a wide range of researchers studying the interaction of electrical discharges and rocks. In particular, methods for extracting fault onset and extinction times from time-series measurements taken with common electronic laboratory equipment have been described. These calculations enable power and energy estimations, which can be used to better understand how electric discharge properties relate to rock fulgurite properties in a quantifiable manner.
Technical applications related to lightning effects on materials may potentially benefit from the results reported in this paper. Recognizing the paths that lightning can take through a material and the reactions occurring after a lightning impact are essential for mitigating thermal damage from lightning strikes and understanding the nature of the lightning environment near and at the point of a direct strike. Moreover, understanding how target materials interact with electrical arcs can support the development and testing of materials used in hazard protection devices such as lightning arresters and high-voltage fuses.

Author Contributions

Conceptualization, C.E., N.S.C., and E.S.; Data curation, C.E., N.S.C., and K.M.; Investigation, C.E. and N.S.C.; Methodology, C.E., N.S.C., and E.S.; Supervision, C.E. and K.M.; Validation, C.E. and K.M.; Writing—original draft, C.E. and N.S.C.; Writing—review and editing, C.E., N.S.C., K.M., and E.S.

Funding

This research received no external funding.

Acknowledgments

Authors would like to thank Chika Nwankpa for his technical support and thoughtful advice in designing the experimental apparatus at Drexel University’s Center for Electric Power Engineering (CEPE). Three anonymous reviewers are acknowledged for their comments that greatly improved the manuscript.

Conflicts of Interest

The authors declare no conflict of interest.

References

  1. Uman, M.A.; Krider, E.P. Natural and Artificially Initiated Lightning. Science 1989, 246, 457–464. [Google Scholar] [CrossRef] [PubMed]
  2. Cooray, V. Lightning and Global Temperature Change. In Lightning Flash, 2nd ed.; Cooray, V., Ed.; Institution of Engineering and Technology: London, UK, 2014; pp. 861–878. [Google Scholar]
  3. Glushakow, B. Effective Lightning Protection for Wind Turbine Generators. IEEE Trans. Energy Convers. 2007, 22, 214–222. [Google Scholar] [CrossRef]
  4. Cooray, V.; Cooray, C.; Andrews, C.J. Lightning caused injuries in humans. J. Electrost. 2007, 65, 386–394. [Google Scholar] [CrossRef]
  5. Ritenour, A.E.; Morton, M.J.; McManus, J.G.; Barillo, D.J.; Cancio, L.C. Lightning injury: A review. Burns 2008, 34, 585–594. [Google Scholar] [CrossRef] [PubMed]
  6. Curran, E.B.; Holle, R.L.; López, R.E. Lightning Casualties and Damages in the United States from 1959 to 1994. J. Clim. 2000, 13, 3448–3464. [Google Scholar] [CrossRef]
  7. Mason, J. The Generation of Electric Charges and Fields in Thunderstorms. Proc. R. Soc. A Math. Phys. Eng. Sci. 1988, 415, 303–315. [Google Scholar] [CrossRef]
  8. US-NSSL. Available online: http://www.nssl.noaa.gov/research/lightning/ (accessed on 22 September 2018).
  9. Saikia, B.J.; Parthasarathy, G.; Sarmah, N.C.; Baruah, G.D. Fourier-transform infrared spectroscopic characterization of naturally occurring glassy fulgurites. Bull. Mater. Sci. 2008, 31, 155–158. [Google Scholar] [CrossRef]
  10. Rakov, V.A. Lightning makes glass. In Proceedings of the 29th Annual Conference of the Glass Art Society, Tampa, FL, USA, 29 April–2 May 1999; pp. 45–50. [Google Scholar]
  11. Martin Crespo, T.; Lozano Fernandez, R.P.; Gonzalez Laguna, R. The fulgurite of Torre de Moncorvo (Portugal): Description and analysis of the glass. Eur. J. Miner. 2009, 21, 783–794. [Google Scholar] [CrossRef]
  12. Rakov, V.A.; Uman, M.A. Lightning: Physics and Effects; Cambridge University Press: Cambridge, UK, 2006. [Google Scholar]
  13. Allibone, T.E.; Dring, D. Lightning and the Long Spark. The Significance of Leader-Stroke Velocity. Proc. R. Soc. A Math. Phys. Eng. Sci. 1977, 357, 15–35. [Google Scholar] [CrossRef]
  14. Uman, M.A. The peak temperature of lightning. J. Atmos. Terr. Phys. 1964, 26, 123–128. [Google Scholar] [CrossRef]
  15. Uman, M.A. Lightning; McGraw-Hill: New York, NY, USA, 1969. [Google Scholar]
  16. Pasek, M.A.; Hurst, M. A Fossilized Energy Distribution of Lightning. Nat. Sci. Rep. 2016, 6, 30586. [Google Scholar] [CrossRef] [PubMed] [Green Version]
  17. Lay, E.H.; Jacobson, A.R.; Holzworth, R.H.; Rodger, C.J.; Dowden, R.L. Local time variation in land/ocean lightning flash density as measured by the World Wide Lightning Location Network. J. Geophys. Res. 2007. [Google Scholar] [CrossRef]
  18. Elmi, C.; Chen, J.; Goldsby, D.; Gieré, R. Mineralogy and chemistry of lightning-struck rocks: A study of fulgurites from Mount Mottarone, Baveno (Italy). Am. Miner. 2017, 102, 1470–1481. [Google Scholar] [CrossRef]
  19. O’Connor, B.H.; Raven, M.D. Application of the Rietveld Refinement Procedure in Assaying Powdered Mixtures. Powder Diffr. 1988, 3, 2–6. [Google Scholar] [CrossRef]
  20. Degen, T.; Sadki, M.; Bron, E.; Konig, U.; Nenert, G. The HighScore suite. Powder Diffr. 2014, 29, S13–S18. [Google Scholar] [CrossRef] [Green Version]
  21. Vetterli, M.; Kovacevic, J. Wavelets and Subband Coding; Prentice-Hall, Inc.: Upper Saddle River, NJ, USA, 1995; p. 488. [Google Scholar]
  22. Daubechies, I. Ten Lectures on Wavelets; SIAM: Philadelphia, PA, USA, 1992; p. 357. [Google Scholar]
  23. Coleman, N.S.; Schegan, C.; Miu, K.N. A Study of Power Distribution System Fault Classification with Machine Learning Techniques. In Proceedings of the 2015 North American Power Symposium (NAPS), Charlotte, NC, USA, 4–6 October 2015. [Google Scholar]
  24. Santoso, S.; Grady, W.M.; Powers, E.J.; Lamoree, J.; Bhatt, S.C. Characterization of distribution power quality events with Fourier and wavelet transforms. IEEE Trans. Power Deliv. 2000, 15, 247–254. [Google Scholar] [CrossRef]
  25. Schegan, C.M. A Hardware/Software Platform for Fault Detection and Identification in Electric Power Distribution Systems for Testing Various Detection Schemes; Drexel University: Philadelphia, PA, USA, 2008. [Google Scholar]
  26. Stolper, E.; Walker, D. Melt Density and the Average Composition of Basalt. Contrib. Miner. Pet. 1980, 74, 7–12. [Google Scholar] [CrossRef]
  27. Ahrens, T.J.; O’Keefe, J.D. Shock melting and vaporization of lunar rocks and minerals. Moon 1972, 4, 214–249. [Google Scholar] [CrossRef]
  28. Navarre-Sitchler, A.; Brantley, S. Basalt weathering across scales. Earth Planet. Sci. Lett. 2007, 261, 321–334. [Google Scholar] [CrossRef]
  29. Bazelyan, E.M.; Raizer, Y.P. Introduction: Lightning, its destructive effects and protection. In Lightning Physics and Lightning Protection; Bazelyan, E.M., Raizer, Y.P., Eds.; CRC Press: Boca Raton, FL, USA, 2000; pp. 1–26. [Google Scholar]
  30. Cornell, R.M.; Schwertmann, U. The Iron Oxides: Structure, Properties, Reactions, Occurrences and Uses; Wiley: Hoboken, NJ, USA, 2006. [Google Scholar]
  31. Keller, G.V. Electrical properties of rocks and minerals. In Handbook of Physical Constants; Clark, S.P., Ed.; The Geological Society of America Memoir: Boulder, CO, USA, 1966; Volume 97, pp. 553–577. [Google Scholar]
  32. Telford, W.M.; Geldart, L.; Sheriff, R.E. Electrical Properties of Rocks and Minerals. In Applied Geophysics, 2nd ed.; Telford, W.M., Geldart, L., Sheriff, R.E., Eds.; Cambridge University Press: Cambridge, UK, 1990; pp. 283–292. [Google Scholar]
  33. Olhoeft, G.R. Electrical properties of granite with implications for the lower crust. J. Geophys. Res. Solid Earth 1981, 86, 931–936. [Google Scholar] [CrossRef]
  34. Stone, G.C.; Culbert, I.; Boulter, E.A.; Dhirani, H. Historical development of insulation materials and systems In Electrical Insulation for Rotating Machines: Design, Evaluation, Aging, Testing, and Repair, 2nd ed.; Stone, G.C., Culbert, I., Boulter, E.A., Dhirani, H., Eds.; Wiley: Hoboken, NJ, USA, 2014; pp. 83–110. [Google Scholar]
  35. Dearman, W.R.; Baynes, F.J.; Irfan, T.Y. Engineering grading of weathered granite. Eng. Geol. 1978, 12, 345–374. [Google Scholar] [CrossRef]
Figure 1. Circuit diagram for high voltage electrical arc discharge experiments. The 60 Hz AC voltage source magnitude was increased until an arc formed. This tripped the circuit breakers, which trip at 28 A (referred to the portion of the circuit show). The 0.44:150 kV transformer was assumed to be ideal. Measurements were taken on the primary side of the transformer.
Applsci 08 02394 g001
Figure 2. Close-up of voltage and current waveforms around fault onset, referred to the secondary (150 kV) side of the transformer, for sample A2, trial 5. The voltage ripple introduced non-60-Hz oscillations that were used to identify fault onset using a wavelet transformation.
Applsci 08 02394 g002
Figure 3. Example voltage and current waveforms for dry and let experiments: (a) data from sample A1 (dry), and (b) data from sample A3 (wet). The peaks of the current waveforms were reconstructed using cubic spline interpolation.
Applsci 08 02394 g003
Figure 4. X-ray diffraction pattern of samples A1–A4. Px = pyroxene; Plg = plagioclase; Qtz = quartz; Mag = magnetite; Bio = biotite; Act = actinolite. Observed spectra (red line), fitted spectra (blue solid line), difference plot (below spectra), and Bragg peak positions (tick marks above difference plot) are shown. The weighted R-factor, Rwp, was calculated using the observed and calculated intensities in the powder diffraction patterns.
Applsci 08 02394 g004
Figure 5. X-ray diffraction pattern of the samples B1–B2. Qtz = quartz; Plg = plagioclase; Ksp = K-feldspar; Bio = biotite. Observed spectra (red line), fitted spectra (blue solid line), difference plot (below spectra), and Bragg peak positions (tick marks above difference plot) are shown. The weighted R-factor, Rwp, was calculated using the observed and calculated intensities in the powder diffraction patterns.
Applsci 08 02394 g005
Figure 6. Static tridimensional spatial image of the spark discharge on sample A provided by a photo camera.
Applsci 08 02394 g006
Figure 7. Optical microscopy images of fulgurite on dry testing sample A0.
Applsci 08 02394 g007
Figure 8. Optical microscopy images of fulgurite on dry sample A1 (a) and wet sample A3 (b).
Applsci 08 02394 g008
Figure 9. Optical microscopy images of orange-brown rims around a crater of dry sample A2.
Applsci 08 02394 g009
Figure 10. Optical microscopy images of bubbles in fulgurite glass of wet sample A3. These bubbles can be generated from the vaporization of water and incorporation of air during the fast cooling of rock melt on the wet sample surface.
Applsci 08 02394 g010
Table 1. Mean mineralogical composition of the bulk rock samples. Standard deviation in parenthesis.
Weight %Samples A1–A4Samples B1–B2
Quartz10.2(3)54.6(2)
Plagioclase49.6(4)15.7(4)
K-feldspar 21.0(2)
Pyroxene18.5(4)
Biotite5.6(2)7.5(2)
Chlorite 1.2(4)
Actinolite6.3(5)
Magnetite3.6(2)
Amorphous6.2(4)
Table 2. Summary of the electrical data for each strike on sample A. Legend: TF = fault duration; VR = root mean square (RMS) voltage during the fault; IR = RMS current during the fault; P = mean fault power; p ^ = peak instantaneous power; E= total fault energy.
SpecimenStrike Number TF (ms)VR (kV)IR (A)P (kW) p ^ (kW)E (kJ)
Average A0 dry 96.8685.260.5342.25116.284.09
Sample A1 dry195.9785.130.5242.07124.654.04
Sample A2 dry1103.7482.820.5139.72107.284.12
288.0483.010.5240.18102.623.54
396.2685.570.5342.25129.274.07
488.6185.650.5342.52121.363.77
596.0384.930.5241.67123.314.00
6103.7879.680.5036.78117.003.82
Average A2 96.0883.610.5240.52116.813.89
Sample A3 wet187.0486.260.5343.08121.103.75
Sample A4 wet195.6783.210.5240.28122.783.85
296.2486.320.5343.02121.484.14
3102.4281.230.5138.38122.673.93
496.5685.220.5241.91121.364.05
Average A4 97.7284.000.5240.90122.073.99

