Article

Hydrogeochemical Modeling to Identify Potential Risks of Underground Hydrogen Storage in Depleted Gas Fields

TU Clausthal, Department of Hydrogeology, Institute of Disposal Research, Leibnizstrasse 10, 38678 Clausthal-Zellerfeld, Germany
*
Author to whom correspondence should be addressed.
Appl. Sci. 2018, 8(11), 2282; https://doi.org/10.3390/app8112282
Submission received: 23 October 2018 / Revised: 13 November 2018 / Accepted: 15 November 2018 / Published: 19 November 2018
(This article belongs to the Special Issue Clean Energy and Fuel (Hydrogen) Storage)

Abstract

:
Underground hydrogen storage is a potential way to balance seasonal fluctuations in energy production from renewable energies. The risks of hydrogen storage in depleted gas fields include the conversion of hydrogen to CH4(g) and H2S(g) due to microbial activity, gas–water–rock interactions in the reservoir and cap rock, which are connected with porosity changes, and the loss of aqueous hydrogen by diffusion through the cap rock brine. These risks lead to loss of hydrogen and thus to a loss of energy. A hydrogeochemical modeling approach is developed to analyze these risks and to understand the basic hydrogeochemical mechanisms of hydrogen storage over storage times at the reservoir scale. The one-dimensional diffusive mass transport model is based on equilibrium reactions for gas–water–rock interactions and kinetic reactions for sulfate reduction and methanogenesis. The modeling code is PHREEQC (pH-REdox-EQuilibrium written in the C programming language). The parameters that influence the hydrogen loss are identified. Crucial parameters are the amount of available electron acceptors, the storage time, and the kinetic rate constants. Hydrogen storage causes a slight decrease in porosity of the reservoir rock. Loss of aqueous hydrogen by diffusion is minimal. A wide range of conditions for optimized hydrogen storage in depleted gas fields is identified.

1. Introduction and Aims

Underground hydrogen storage (UHS) is used to store large amounts of hydrogen generated from renewable energy sources (such as wind and solar) to compensate for seasonal fluctuations in the supply and demand of energy [1,2]. Large amounts of hydrogen can be stored in depleted oil and gas fields, in salt caverns, and in aquifers [1,3]. Nevertheless, practical experience of underground hydrogen storage is still rare. In the US and UK, hydrogen is currently stored in salt caverns [3,4,5,6], but hydrogen storage in depleted oil and gas fields is still under research and discussion. Depleted oil and gas fields have a huge storage capacity, are well known from former exploration and production, and qualify therefore for hydrogen storage. However, the existing underground gas storages (UGS) are designed for the storage of natural gas, which does not contain hydrogen (or only very low amounts). Because the chemical and physical properties of hydrogen are different to those of methane (CH4)—the main component of natural gas—the effects of hydrogen on the reservoir rock, cap rock, and storage facilities must be analyzed before injecting hydrogen into these storages [2].
Compared to methane, hydrogen has a higher diffusivity in pure water. The diffusion coefficient for hydrogen is 5.13 × 10⁻⁹ m2 s−1 and for CH4 it is 1.85 × 10⁻⁹ m2 s−1, both in pure water at 25 °C. The data are given in the database phreeqc.dat, that is provided by the US Geological Survey. Generally, the diffusion process of an aqueous species is described by its diffusion coefficient in pure water (m2 s−1). However, in any porous system, where solids are available, the influence of porosity on the diffusion must be considered by scaling the diffusion coefficient with tortuosity [7], resulting in an effective diffusion coefficient (Equation (1)), where dm is the effective diffusion coefficient, dm is the diffusion coefficient in pure water, and τ is the tortuosity. The tortuosity is the ratio of the effective diffusion mass fluxes in a porous medium to ideal diffusion mass fluxes in solutions without a rock matrix.
d m = d m τ 2
Therefore, the effective diffusion coefficient for methane is 2.35−2.49 × 10⁻¹⁰ m2 s−1 in clayey host rocks at 21 °C [8]. The effective diffusion coefficient for hydrogen is 3.0 × 10⁻¹¹ m2 s−1 in clayey host rocks saturated with water at 25 °C [9]. However, there is a lack of data regarding effective diffusion coefficients of hydrogen at underground storage conditions with higher temperatures and pressures [10].
Compared to methane, hydrogen has a lower viscosity. The viscosity of hydrogen at the two-phase boundary at 17 MPa and 350 K is 1.01 × 10⁻⁵ kg m−1 s−1 [11] and methane fluid at 20 MPa and 350 K is 1.81 × 10⁻⁵ kg m−1 s−1 [12]. Furthermore, hydrogen has a lower density than methane. At normal conditions, the density of hydrogen is eight times smaller than that of methane and the difference increases by 20–30% under storage conditions [2]. The solubility of H2(g) in pure water is smaller than the solubility of CH4(g). At 25 °C and 1.0 atm, 7.9 × 10⁻⁴ mol kgw−1 H2(g) and 1.4 × 10⁻³ mol kgw−1 CH4(g) dissolve in pure water (data based on phreeqc.dat).
The properties of hydrogen—being different from those of methane—could lead to risks when storing hydrogen in depleted gas fields, which were constructed for storing methane (underground gas storage). Potential risks include (i) the conversion of hydrogen to CH4 and H2S due to microbial activity, (ii) chemical reaction of hydrogen with the minerals of the reservoir rock/cap rock and thus potential resulting porosity changes, and (iii) the loss of aqueous H2(aq) by diffusion through the cap rock.
The first risk (i) arises from microbial activities in the underground. The two processes relevant here are bacterial sulfate reduction (2) and methanogenesis (3), where hydrogen is microbially catalyzed by bacteria and is converted to H2S(aq) or CH4(aq). The activity of the different bacteria depends on the availability of the different electron acceptors such as sulfate or carbon dioxide [1]. Other possible microbial processes are acetogenesis and iron(III)-reduction, summarized by Hagemann et al. [13].
Bacterial sulfate reduction (BSR): SO42−(aq) + 5H2(aq) → H2S(aq) + 4H2O
Methanogenesis: CO2(aq) + 4H2(aq) → CH4(aq) + 2H2O
In aqueous anoxic environments, the sulfate-reducing bacteria (SRB) use sulfate as an electron acceptor to oxidize hydrogen and generate sulfide-S which could be available as aqueous S2−(aq), HS(aq), and H2S(aq) and as gaseous H2S(g) as well. The sulfate is derived from the aqueous dissolution of mineral phases like anhydrite (CaSO4(s)). The energy gained from sulfate reduction is used by the SRB for cell growth [14]. SRB prefer temperatures around 38 °C [15] and near-neutral pH conditions [14], but are active even at extreme habitat conditions such as at great depths and temperatures, ranging from 0 °C to 60–80 °C [16,17,18] and in some cases up to 110 °C [19]. SRB activity was observed, for example, in hydrocarbon reservoirs [18] and in the underground storage of town gas [20]. The risk arising from bacterial sulfate reduction lies in the produced H2S, which is corrosive towards the storage facilities, toxic if inhaled, and can pose a risk to the environment.
Typical environments for methanogenic bacteria are, for example, anoxic sediments and flooded soils [21]. However, the existence of methanogenic bacteria was also observed in town gas storages [22]. Methanogenic bacteria prefer temperatures of 30–40 °C for growth [10], but they also have been found at higher temperatures of 80 °C [23,24] and up to 97 °C [10,25]. With these bacteria, H2(aq) is the electron donor and CO2(aq) is the electron acceptor, which is reduced to form CH4(aq). The methanogenic bacteria obtain their energy for cell growth from this conversion [21,22]. The problem associated with methanogenesis lies in the loss of hydrogen and the related energy loss [2]. This phenomenon has already been observed in the underground storage of town gas. A well-known example is the Czech town gas storage at Lobodice, where the 54 vol. % injected H2(g) diminished to 37 vol. % H2(g). Concurrently, CH4(g) increased from 21.9 vol. % to 40.0 vol. % within a time span of 7 months [22].
Another risk of underground hydrogen storage (ii) is the reaction of H2(g/aq) with the minerals of the reservoir rock and the cap rock, which can lead to mineral dissolution and precipitation and resulting porosity changes as known from carbon capture and storage e.g., [26,27,28,29]. Changes in the porosity of the cap rock can either improve or deteriorate its sealing capacity. Furthermore, precipitation of minerals at the well equipment may cause scaling [2].
In depleted gas fields, the high diffusivity of hydrogen could be the reason for hydrogen loss (iii). The hydrogen is dissolved in the formation water of the cap rock and diffuses through the cap rock [2]. Reitenbach et al. [2] stated that a significant loss of hydrogen can be expected. The high diffusivity, low viscosity, and low density of hydrogen leads to a high mobility and therefore the potential loss due to leakage should be considered [1].
A natural analog for an unintended and unpredictable leakage of hydrogen can be found in hydrogen anomalies associated with faults. These so called natural hydrogen seeps have been described by Larin et al. [30], Sato et al. [31], Wakita et al. [32], Ware et al. [33], and Zgonnik et al. [34]. In these cases, faults act as “fluid conduits” [30]. An increased CH4 concentration is also observed within these anomalies because of the increased microbial activity stimulated by the increased amount of hydrogen [30]. If hydrogen reaches the surface, it could inhibit the growth of trees, underbrush, and grass [30].
There are experimental studies concerning kinetics of pyrite and pyrrhotite reduction by hydrogen at high temperatures [35], the reactivity of hydrogen in sandstones [36], and the petrographic and petrophysical variation in reservoir sandstones due to hydrogen storage [37]. However, modeling studies of hydrogen storage to predict “long-term” behaviors are still rare. Therefore, this study is performed to model the loss of hydrogen (and related energy loss) as a combination of (i) the conversion by bacteria, (ii) gas-water-rock interactions in the reservoir and cap rock, which are connected with porosity changes, and (iii) loss by aqueous diffusion along a gradient of decreasing pressure and temperature conditions.
These processes are retraced by a one-dimensional reactive mass transport model to simulate gas–water–rock interactions resulting from hydrogen storage in depleted gas fields. The aim of this study is to investigate the basic mechanisms of BSR and methanogenesis in an integrated way over storage times at the reservoir scale and to describe qualitatively and quantitatively which reservoir rock and cap rock minerals dissolve or precipitate because of hydrogen storage as well as the related porosity changes. Furthermore, the parameters that influence the loss of hydrogen are determined.
Therefore, a model is presented, in which the hydrogeochemical mechanisms of underground hydrogen storage are simulated in a reference scenario (Section 3.1, Section 3.2 and Section 3.3). In further scenarios, single parameters will be changed in the model to show their effects on the modeling results and to identify the parameters that are most sensitive for underground hydrogen storage (Section 3.4).

2. Methodology

2.1. Modeling Tools

The modeling program for the one-dimensional reactive mass transport (1DRMT) model is PHREEQC version 3 (PHREEQC = pH-REdox-EQuilibrium written in the C programming language), provided by the US Geological Survey [38]. PHREEQC has capabilities to simulate (i) speciation and saturation-index calculations, (ii) batch-reaction and 1D transport calculations, and (iii) inverse modeling [38]. The used database is phreeqc.dat extended by dawsonite, nahcolite, CH4(g), H2S(g), N2(g), which are taken from llnl.dat. The 1DRMT model considers equilibrium reactions for gas–water–rock interactions, and kinetic reactions for sulfate reduction and methanogenesis. The equilibrium calculations are based on the mass action law including all species used in this study (Al, Ba, C, Ca, Cl, Fe, K, Mg, N, Na, S, Si) and their corresponding equilibrium constants. The equilibrium phases, mass action equations, and equilibrium constants used in the model are summarized in Table 1. For detailed information about PHREEQC, see Parkhurst and Appelo [38].

2.2. Model Setup

Gaseous hydrogen (H2(g)) is injected into the reservoir rock where residual gas from the previous natural gas reservoir is still available and the reservoir brine is in equilibrium with these gases and the reservoir rock. When H2(g) is injected, the available brine is saturated with H2. With ongoing injection of H2(g), the initial reservoir brine is displaced and H2(g) builds up a plume. The only available water in the reservoir rock is then the irreducible water. On contact with the cap rock, H2(g) dissolves into the cap rock brine and diffuses through the cap rock brine. These processes are retraced with a hydrogeochemical, 1D reactive mass transport modeling approach, which is of semi-generic nature. The conditions assumed in the model are based on conditions of a depleted gas field with a temperature of 40 °C and a reservoir pressure of 40 atm. The model is divided into a column of 1488 cells, with a cell height of 1.0 m each (in the z-direction). The cap rock is assumed to have a height of 182 m (cells 1–182), the reservoir rock consists of 667 m (cells 183–850), and the underlying rock of 637 m (cells 851–1488; Figure 1). For the sake of simplicity, a constant partial pressure in the H2(g) plume is assumed and the partial pressure is set to be equal to the hydrostatic pressure. Even during production, an amount of hydrogen remains in the reservoir.
The mineralogical compositions of the cap rock, the reservoir rock, and the underlying rock are based on data of the Röt Formation [39,40], Buntsandstein Formation [41], and Zechstein Formation [42,43] and are summarized in Table 2. The reactive amount of each mineral phase is calculated in moles per kg of pore water (mol kgw−1) with the consideration of the specific density of each mineral phase (g cm−3). Dawsonite, mackinawite, elemental sulfur, albite (and pyrite) are considered as potential secondary phases, which may form at saturation. The clay minerals are considered as follows: illite is defined as a primary mineral phase, and the cation exchange capacity of chlorite, illite, montmorillonite, and kaolinite are estimated based on the data given by Appelo and Postma [44]. An initial small amount of CO2 (pCO2 = partial pressure of CO2 = 1.0 atm) is assumed to be available in the cap rock, reservoir rock, and underlying rock from burial. The possible outgassing of CH4(g), N2(g), CO2(g), H2S(g), and H2(g) is assumed in all cells.
The reservoir rock (cells 183–850) has an initial porosity of 10% (n = 0.1), 2.5% (n = 0.025) of the pore space is filled with irreducible water, which is equal to 1 L H2O, and 7.5% (n = 0.075) of the pore space is filled with gas. The total volume is 40 L (1 L/0.025) and therefore, 3 L are filled with gas (40 L × 0.075). The porosity is filled with 3 L gas and 1 L H2O, so 36 L are occupied by solids in each cell of the reservoir rock. The gas consists of 10% residual gas (that was not extracted during natural gas production) and 90% stored hydrogen gas. The composition of the residual gas in the reservoir rock is based on data from Bischoff and Gocht [45] with pCH4(g) = 3.56 atm, pN2(g) = 0.4 atm, and pCO2(g) = 0.04 atm. The stored hydrogen gas is composed of 96% H2(g) (pH2(g) = 34.56 atm) and 4% CO2(g) (pCO2(g) = 1.44 atm), these values are modified from data presented by Panfilov [5]. For modeling purposes, the stored hydrogen gas is additionally induced as a tracer gas with the same chemical properties as H2(g). It is used instead of H2(g) because H2(g/aq) is induced and used as the reactant in the calculation kinetics. The amount of tracer gas corresponds to 4.3 mol L−1 of gas in each cell of the reservoir. The summed volume of all gases in the reservoir rock is 3 L per cell and represents the stored gas volume at 40 atm under the assumed reservoir conditions. The sum of the partial pressure of all available gases (including tracer gas) is equivalent to the total pressure (40 atm) in the reservoir so that the generated gases (H2S(g), CH4(g)) are released as gas bubbles.
The cap rock (cells 1–182) is defined by an initial porosity of 5.0% (n = 0.05), with 1 L irreducible water and 19 L solid. The underlying rock (cells 851–1488) is defined by an initial porosity of 10% (n = 0.1), divided into 2.5% (n = 0.025) irreducible water, which is equal to 1 L H2O, and 7.5% (n = 0.075) gas. The porosity is filled with 3 L gas and 1 L H2O, so 36 L are occupied by solids in each cell of the underlying rock. The assumed natural gas composition in the underlying rock is pCH4(g) = 81.1 atm, pN2(g) = 4.3 atm, pH2S(g) = 10.7 atm, and pCO2(g) = 10.7 atm [45].
The initial brine compositions of the cap rock, reservoir rock, and underlying rock are pre-calculated in a separate transport model to simulate the million-years-long interaction of the different brines with each other. The cap rock brine is composed of a 0.5 M Na+/Cl-dominated solution equilibrated with the mineral phases of the cap rock under cap rock pressure and temperature conditions. The temperature and pressure conditions change along the diffusive pathway of the aqueous species through the cap rock, starting with 40 °C and 40 atm at the reservoir depth (data from Pudlo et al. [46]). A gradient of decreasing temperature and pressure conditions according to the geothermal gradient (33.3 °C km−1 depth) and a pressure gradient of 100 atm km−1 depth under hydrostatic conditions is assumed. Therefore, each cell is defined by a specific temperature and pressure condition (e.g., cell 182: 39.967 °C and 39.9 atm; cell 181: 39.934 °C and 39.8 atm; and so on). The initial reservoir rock brine composition is a 0.5 M Na+/Cl-dominated solution, which is in equilibrium with the reservoir rock and the initial gas composition at 40 atm and 40 °C. The underlying rock is dominated by a 6.7 M Na+/Cl-dominated solution equilibrated with the underlying rock and gas composition under underlying rock pressure and temperature conditions (106.7 atm and 60 °C). To simulate the million-years-long interaction, molecular diffusion of all aqueous species through the cap rock brine, reservoir rock brine, and underlying rock brine is simulated over one million years. The brine compositions are summarized in Table 3.
The high Na+ and Cl concentrations and high ionic strength in the brines require the use of the Pitzer database. However, the Pitzer database does not include Al3+, which is important when modeling hydrogen storage in depleted gas fields. Therefore, the database phreeqc.dat is used. The validation that PHREEQC using phreeqc.dat simulates correct results with high Na+ and Cl concentrations and high ionic strength is shown by Hemme and van Berk [47]. Furthermore, Parkhurst and Appelo [48] stated that models are reliable at higher ionic strength if the system is sodium chloride dominated.
Molecular diffusion of all aqueous species is the only mass transport accounted for by the model. Multicomponent diffusion is calculated where each “solute can be given its own diffusion coefficient, allowing it to diffuse at its own rate, but with the constraint that overall charge balance is maintained” [38,49,50]. Fluid flow is not considered in the model due to the lack of total hydraulic head differences in depleted gas reservoirs. A homogeneous distribution of the relevant parameters in the reservoir and cap rock such as mineralogical composition is assumed. Furthermore, no fractures or natural faults are considered. Because of the lack of data, the storage time of hydrogen in depleted oil and gas fields is based on the equipment lifetime of 30 years [51], but is varied in an additional scenario (Section 3.4.1).
The oxidation of hydrogen by SO42 and/or CO2 in the model is kinetically controlled. The reaction kinetics describe the time-dependent changes of reaction products and educts of a chemical reaction. To calculate the irreversible reactions, catalyzed by microorganisms like sulfate-reducing bacteria and methanogenic bacteria, the Monod equation (Equation (4)) is used. Bacterial concentrations are kept constant in the model with the aim to model the “worst-case” scenario.
ψ growth = ψ max growth ( c s α + c s )
where ψ max growth is the maximum specific growth rate (mol L−1 s−1), cs is the concentration of the limiting substrates (mol L−1), and α is the half-velocity constant. The maximum specific growth rate that is assumed in the model is 2.30 × 10⁻⁹ mol kgw−1 s−1 for methanogenesis (at 37 °C) [22] and 9.26 × 10⁻⁸ mol kgw−1 s−1 for BSR (at 30 °C) [52]. For bacterial sulfate reduction, the limiting substrate is sulfate and for methanogenesis it is carbon dioxide.
Panfilov [5] defined a new model to describe the substrate-limited growth models (Equation (5)), where te is the “individual time of eating” (s) and nmax is the maximum population size (m−3). Due to the lack of data regarding the characteristic time of eating and the maximum population size, the Panfilov model is not considered.
ψ growth = 1 t e n 1 + n 2 n max 2 ( c s α + c s )
The lower boundary of the column (in the underlying rock) and the upper boundary of the column (in the cap rock) are defined as diffusive flux. To check the numerical accuracy of the results, discretization studies for one scenario are performed, in which the number of shifts and the number of cells are refined. The model calculation for one scenario is rerun and results are compared [38].

3. Results and Discussion

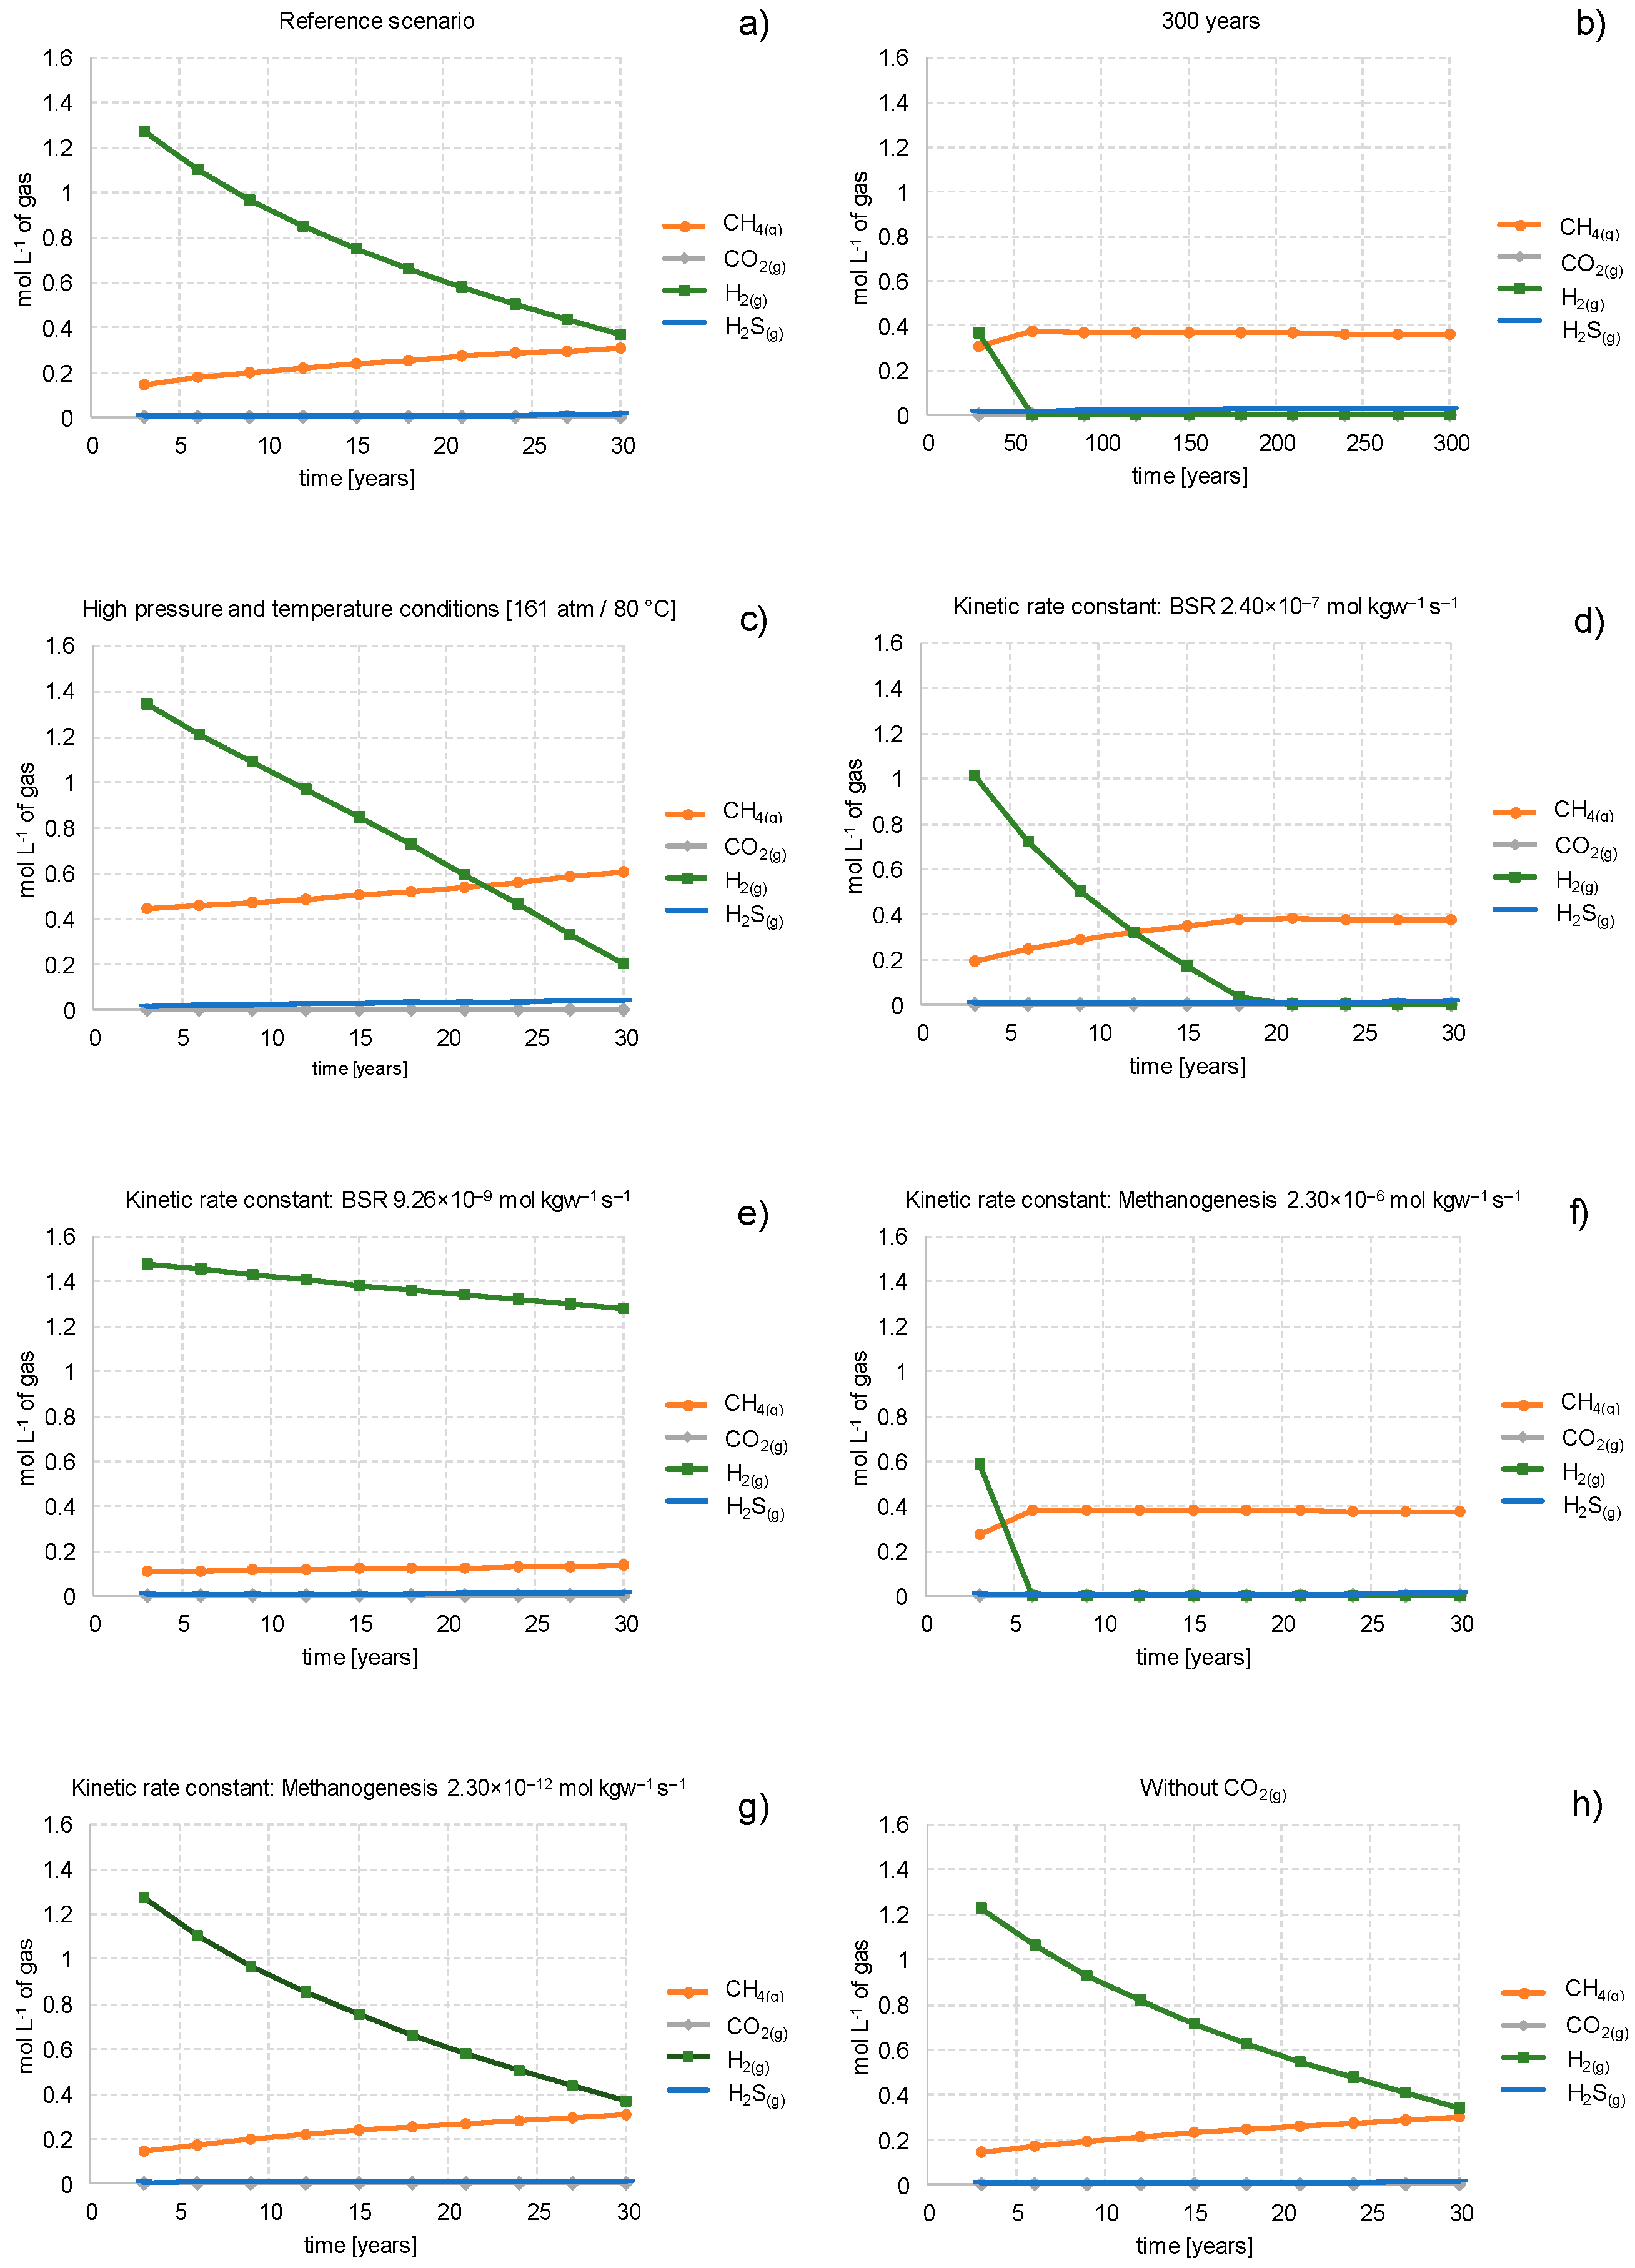
3.1. Loss of H2(g/aq) by Bacterial Conversion to CH4(g) and H2S(g)

The modeling results of the reference scenario (defined in Section 2.2; input file S1) show that the maximum amount of bacterial-converted H2(g/aq) to CH4(g) and H2S(g) depends on the amount of available (and reactive) electron acceptors, carbon dioxide and sulfate, and on the amount of available H2(g/aq). Figure 1 shows selected reactions and processes that are coupled to bacterial sulfate reduction and methanogenesis.
When CO2 and SO42− are fully consumed, methanogenesis and BSR will not proceed. The stored gas is composed of 96% hydrogen and 4% carbon dioxide (residual gas is still available). Therefore, CO2 is available as electron acceptor for the methanogenesis and CH4(g) is generated. After less than 3 years of storage, the injected CO2(g) is completely consumed, but an ongoing supply of CO2 is provided by the dissolution of carbonate-bearing minerals (such as calcite, for example). Consequently, the amount of generated CH4(g) is limited by the assumed storage time of 30 years and the time-dependent kinetics of methanogenesis.
The available sulfate for BSR in the reservoir rock results from anhydrite dissolution. If anhydrite is still present in a depleted natural gas reservoir, it is not reactive (e.g., it is coated by other minerals). Otherwise, the sulfate would have been catalyzed by bacterial sulfate reduction, with methane—the main component of natural gas—as electron donor. The same applies to hydrogen storage in depleted natural gas reservoirs. However, the creation of new fractures and natural faults or the dissolution of carbonate cements (pore-filling cements) leads to contact of reactive anhydrite with the stored hydrogen. To simulate this “worst-case” scenario, a small amount of reactive anhydrite is assumed in this model. The dissolution of anhydrite provides SO42−(aq) for H2S(g) generation and Ca2+(aq) for calcite precipitation. Additionally, the dissolution of anhydrite creates porosity, which in turn can be superseded by the precipitation of other minerals (see Section 3.2). The reactive anhydrite is in solution equilibrium with the brine. The consumption of sulfate(aq) by BSR is accompanied by ongoing anhydrite dissolution and more sulfate becomes available for BSR until the reactive anhydrite is completely dissolved.
As a product of BSR and methanogenesis, small amounts of water (0.007 kg) are formed (Equations (2) and (3)). This increases the water content in the reservoir rock (1.0 kg initial water + 0.007 kg generated water = 1.007 kg total water mass per cell after 30 years). The water will probably be suppressed by the gas along the reservoir/cap rock boundary. However, the small increase in the mass of water could increase the anhydrite dissolution, resulting in a higher amount of sulfate ions that are available for BSR. Additional sulfate is delivered by diffusion from the cap rock and the underlying rock, where the dissolution of anhydrite acts as a sulfate source. The amount of generated H2S(g) depends on the storage time, the amount of available and reactive anhydrite, the diffusion, and the time-dependent kinetic rate constant. However, the last three mentioned factors depend on pressure and/or temperature.
Two hotspot regions with higher amounts of generated H2S(g) (related to a higher loss of hydrogen) are identified: the contact area of the reservoir rock and the cap rock and the contact area of the reservoir rock and the underlying rock. These are the regions where additional sulfate is delivered into the reservoir rock by diffusion. However, the highest CH4(g) concentrations can be found at the contact area of the reservoir rock and the underlying rock, where additional CO2 is delivered by diffusion of the gas in the underlying rock into the reservoir rock.
The 1DRMT modeling results show an average loss of 3.3 mol H2(g/aq) after 30 years in each cell of the reservoir rock (cells 183–850). Over the same period, on average, 0.2 mol L−1 of gas CH4(g) and 0.005 mol L−1 of gas H2S(g) are generated and 0.06 mol L−1 of gas CO2(g) is consumed, which corresponds to the total amount of CO2(g) that was available as injected and residual gas. The changes in gas composition in the reservoir rock in cell 183, located at the contact with the cap rock, with ongoing time are shown in Figure 2a. The mass of lost H2(g/aq) that is not converted to CH4(g) or H2S(g) is bound in aqueous species (OH, CH4, HCO3, Al(OH)4, CaOH+, CaHCO3+, MgOH+, MgHCO3+, H2, NH4+, NH3, H2S, HS, H4SiO4, and H3SiO4) or in mineral phases (see Section 3.2).
The competition between methanogenic microorganisms and sulfate-reducing bacteria is widely discussed in the literature [53,54,55,56] and is not the object of this study. However, in PHREEQC, BSR occurs prior to methanogenesis. This reaction order of H2(g/aq) with SO42−(aq) (BSR) and CO2(aq) (methanogenesis) is tested in a separate batch model. It includes H2O(aq), CO2(aq), and SO42−(aq) (in equal amounts) and a sufficient amount of hydrogen. H2(g/aq) reacts primarily with SO42−(aq) to form S2−(aq) until the total amount of the initial SO42−(aq) is consumed. This is followed by the reaction of H2(g/aq) with CO2(aq) to CH4(aq). Thereby, the equilibrium constant (log K) is the crucial value. In a separate model, the log K value for SO42− (33.65; (6)) is reduced to below the log K value of CO2 (16.861; (7); data from phreeqc.dat). In this case, the methanogenesis takes place before BSR.
SO42−(aq) + 9H+(aq) + 8e = HS(aq) + 4H2O
CO32−(aq) + 2H+(aq) = CO2(aq) + H2O

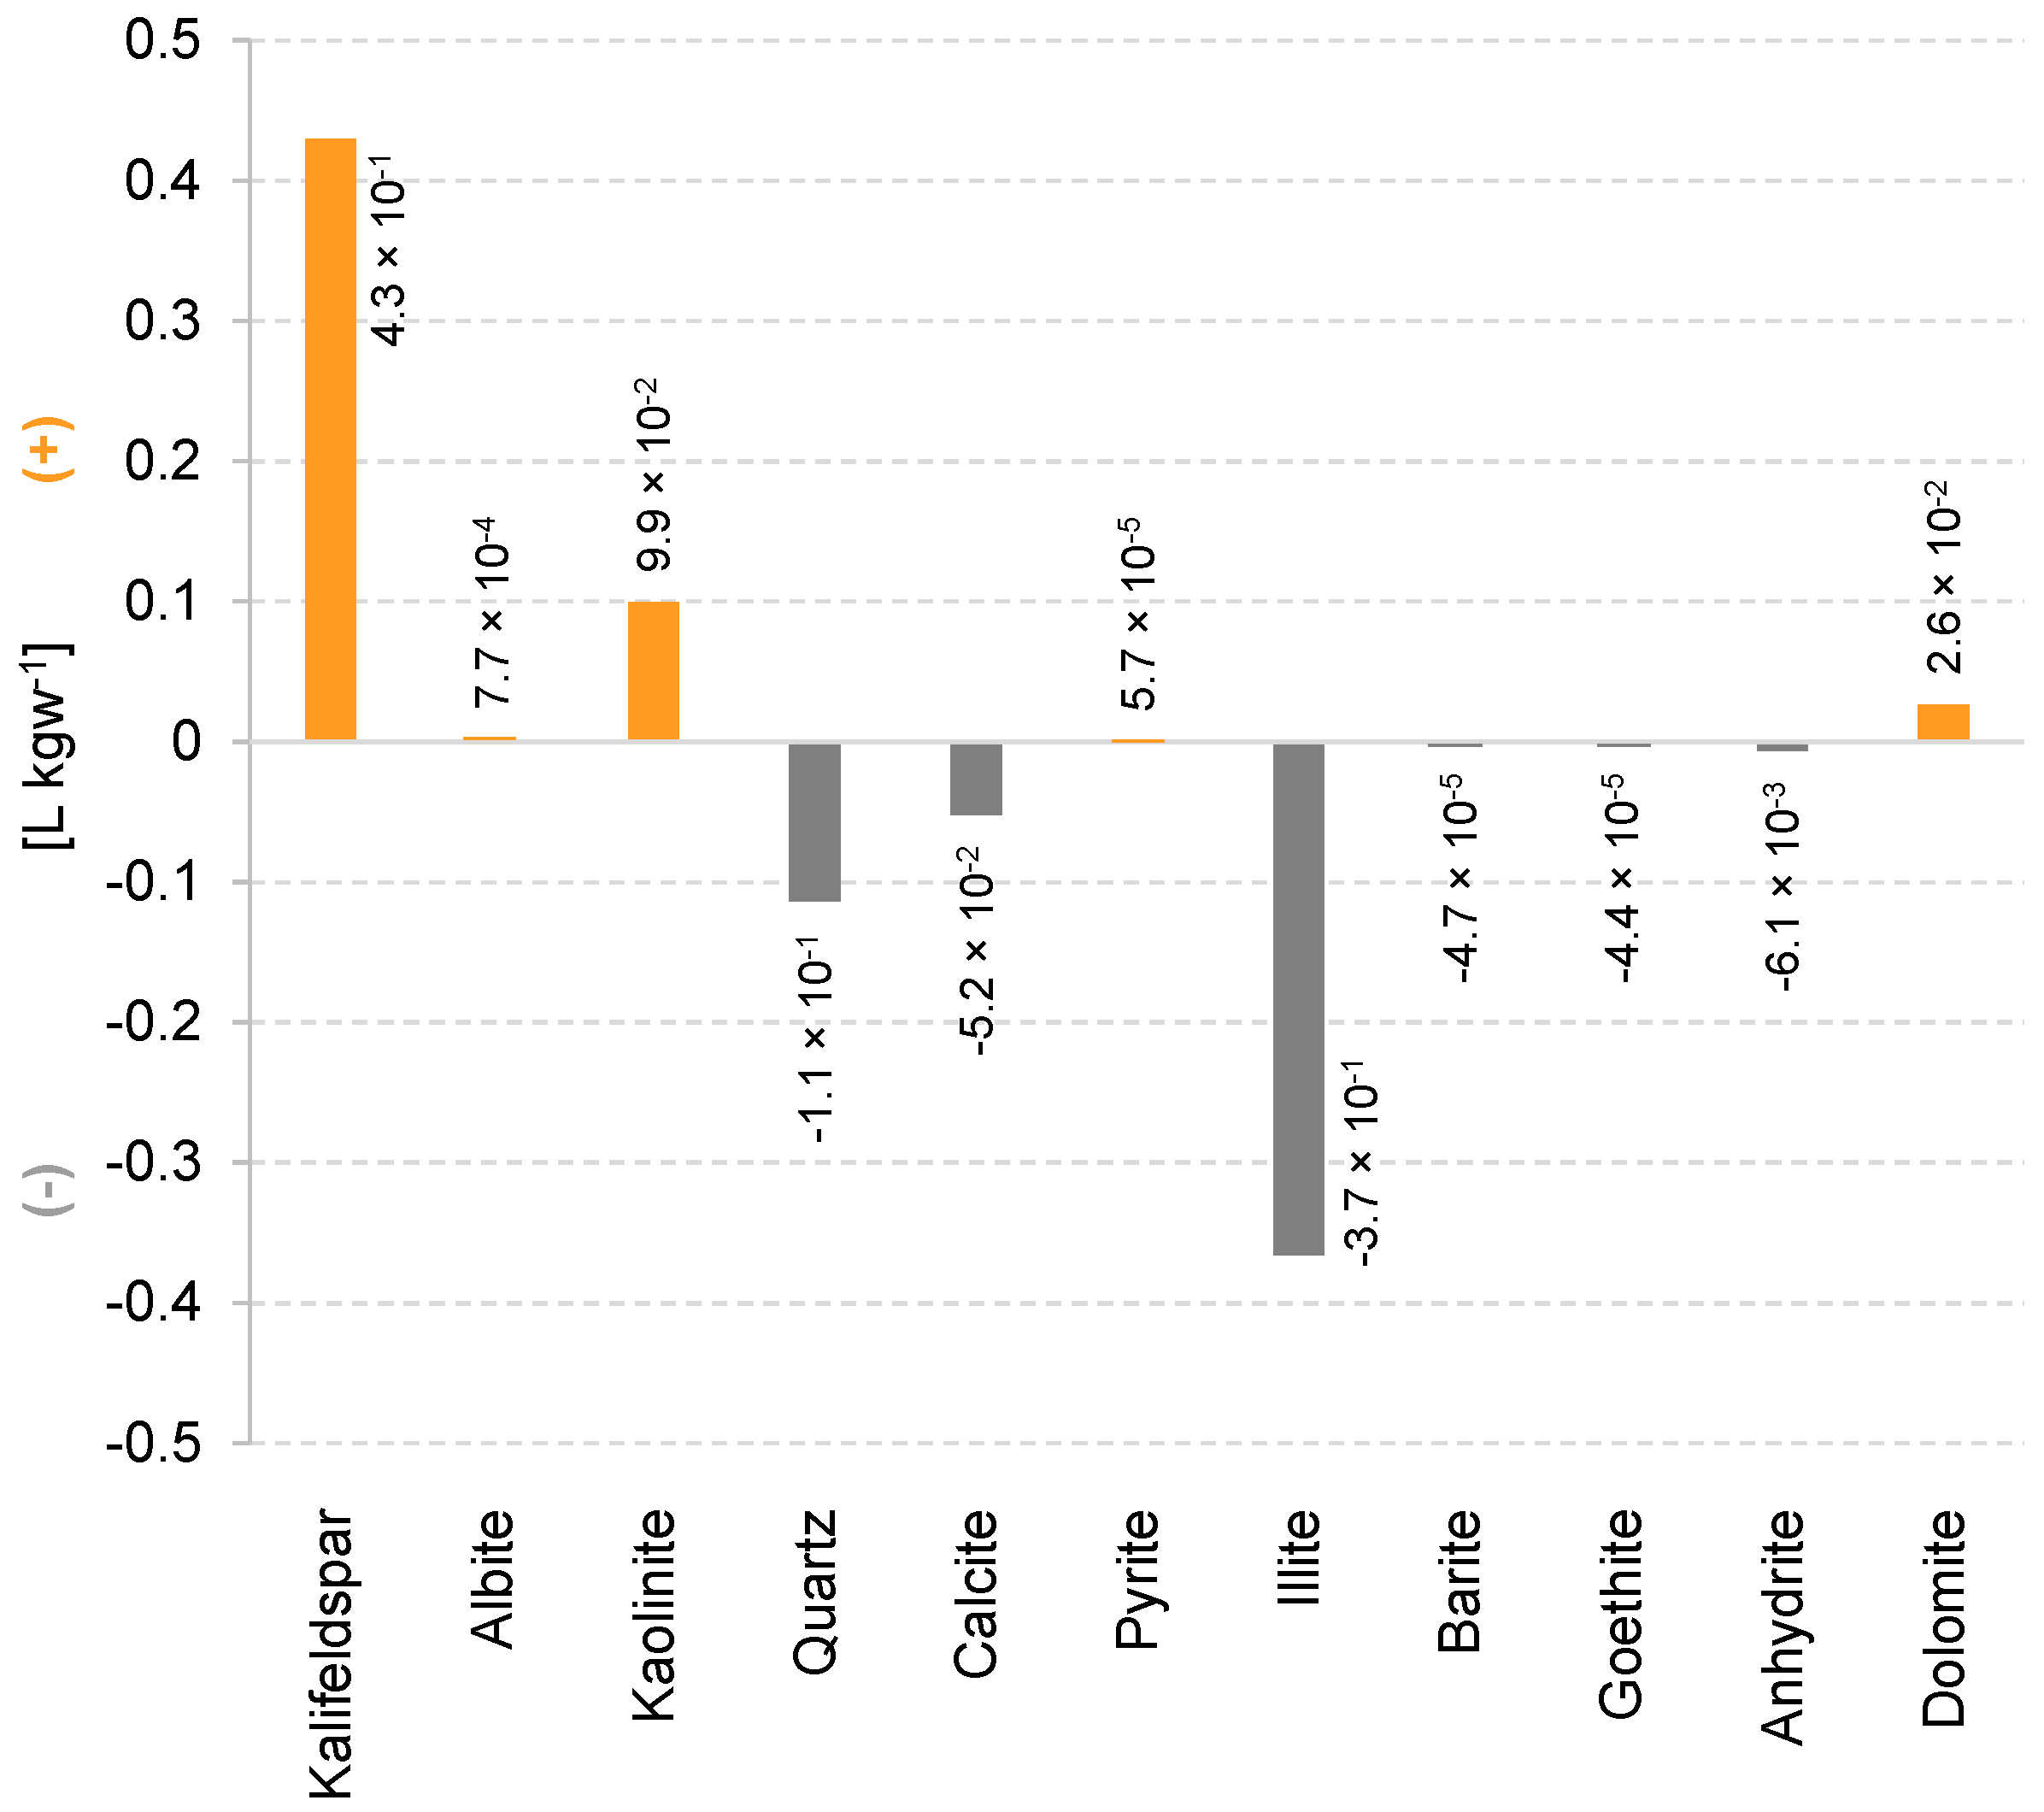
3.2. Hydrogeochemical Effects of Hydrogen Storage on Reservoir Rock and Cap Rock

Storage of hydrogen in depleted gas fields can lead to dissolution and precipitation of minerals, which in turn could change the porosity of the reservoir rock and cap rock. An increase in the cap rock porosity would decrease the sealing capacity and increase the risk of pathways for the stored hydrogen to reach, for example, overlying aquifers. On the contrary, a decrease of the cap rock porosity would increase its sealing capacity.
Truche et al. [57] argued that the influence of hydrogen on sulfur-bearing minerals like framboidal pyrite is high but the effect on other minerals available in claystones like clay minerals, quartz and calcite is minor at “low temperatures”. By contrast, Reitenbach et al. [2] stated that the addition of hydrogen causes abiotic reactions of hydrogen with minerals of the reservoir and cap rocks which leads to dissolution of sulfate and carbonate-bearing minerals, clay minerals of the chlorite group and feldspars and to precipitation of iron-sulfide bearing minerals, illite, and pyrrhotite. However, both studies agree that pyrite is a potential oxidant for hydrogen and is reduced to pyrrhotite (FeS1 + x) [2,57]. The 1DRMT modeling results of the reference scenario of this study show that at 40 °C and 40 atm the storage of hydrogen induces K-feldspar, kaolinite, and dolomite precipitation in the reservoir rock. Quartz, calcite, and illite are dissolved. The reactive amounts of barite, goethite, and anhydrite are completely consumed during the storage time of 30 years. After the complete consumption of reactive anhydrite, the only sulfate source comes from the cap rock and the underlying rock by diffusion and consequently this limits the loss of hydrogen by bacterial sulfate reduction. High concentrations of S(−II)(aq) species in the reservoir brine can be observed from the modeling results. The assumed reactive amount of goethite is completely consumed in less than 3 years. The goethite dissolution buffers the effect of H2S(g) generation because the amount of Fe(+II), which has been reduced from Fe(+III), reacts with the aqueous sulfide to form pyrite (a potential secondary phase in the model) so that aqueous sulfide is no longer available for H2S(g) generation. The modeling results show also that the higher pH conditions (pH increases from initial 6.4 to 8.2–8.7) and the high sodium concentrations in the brine induce weak albitization in the hotspot areas (the contact area of the reservoir rock and the cap rock and the contact area of the reservoir rock and the underlying rock). Except for pyrite and albite, the other potential secondary phases, dawsonite, mackinawite, nahcolite, and sulfur, are not formed under reservoir conditions. Elemental sulfur does not form, even if mackinawite and pyrite are not considered as potential secondary phases. Small amounts of calcite are precipitated because the dissolution of anhydrite contributes Ca2+(aq) into the reservoir brine. However, at the same time, calcite is dissolved and delivers CO2 for methanogenesis so that the total amount of calcite decreases. The volume changes of the mineral phases are shown in Figure 3. The changes in porosity are calculated from the PHREEQC modeling results. The porosity in the reservoir rock decreases from initially 10% to 9.79–9.95%. This means that the available pore space for hydrogen storage decreases over 30 years such that (i) the same amount of hydrogen is moved to greater distances from the bore hole or (ii) less hydrogen can be stored in future injection phases (max. 0.2%).
The mineralogical changes in the cap rock, induced by diffusion of aqueous H2(aq) from the reservoir rock, are minimal and cause no changes to the initial porosity. The reasons for that are the short storage time of 30 years and the slow diffusion process. Furthermore, the hydrogen reacts with the mineralogical assemblage of the reservoir rock and brine and it is converted by BSR and methanogenesis.
The used modeling program, PHREEQC, has no capabilities to simulate gas transport between the different cells (multiphase flow). To overcome this limitation, a separate transport model provides an initial amount of H2(g) in the cap rock for the kinetic calculation to simulate the influence of H2(g) on the cap rock properties in the case of a gas loss from the reservoir rock by, for example, new fractures or natural faults. The initial amount corresponds to the maximum available amount of H2(g) that could be available per cell in the cap rock and represents a worst-case scenario. Modeling results indicate an increase in pH from 6.4 to 7.8 in the cap rock brine after 30 years of storage. The intense contact of hydrogen with the cap rock results in a total loss in porosity, which increases the sealing capacity of the cap rock. This decrease in porosity is caused mainly by albitization, whereas the dissolution of halite, quartz, illite, and anhydrite counteracts a stronger porosity decrease. Precipitation of dolomite is negligible. The potential secondary phase pyrite is precipitated whereas dawsonite, mackinawite, and sulfur are not formed.

3.3. Loss of Aqueous H2(aq) by Diffusion through the Cap Rock

By assuming specific diffusion coefficients for the different aqueous species, the diffusion of hydrogen and related products is modeled. A non-reactive tracer, with the same diffusion coefficient as hydrogen of 5.13 × 10⁻⁹ m2 s−1, shows that significant amounts of hydrogen (greater than 4.0 × 10⁻⁷ mol kgw−1) were calculated only for distances less than 4 m through the cap rock (in the z-direction) over 30 years, assuming an initial cap rock porosity of 5%, no faults, and non-reactive hydrogen (Figure 4a). However, hydrogen reacts with the mineralogical assemblage of the reservoir rock and brine and is converted by BSR and methanogenesis. The loss of aqueous hydrogen by diffusion is minor. Dissolved hydrogen and corresponding aqueous species concentrations (OH, CH4, HCO3, Al(OH)4, CaOH+, CaHCO3+, MgOH+, MgHCO3+, H2, NH4+, NH3, H2S, HS, H4SiO4, and H3SiO4) in the cap rock brine show no significant changes. The most significant difference has been calculated for the NH4+ concentration, which rises to around 4 × 10⁻⁴ mol kgw−1 in the first meter of the cap rock (cell 182). Therefore, the effect of hydrogen storage on the cap rock is only visible in the first meter of the cap rock, which is in contact with the reservoir rock (cell 182), after 30 years. Even though each aqueous species migrates with a different rate along its concentration gradient, as described by Buzek et al. [58], the difference in migration is too small to see deviations in the model over the modeled time of 30 years. The loss of the non-reactive hydrogen tracer by diffusion into the cap rock is 25% and represents the maximal loss of aqueous hydrogen by diffusion over 30 years.
In summary (Section 3.1, Section 3.2 and Section 3.3), the loss of hydrogen gas by bacterial conversion, gas–water–rock interactions, and aqueous diffusion is 76% over 30 years.

3.4. Influencing Factors

To identify the controlling factors of hydrogen loss and the parameters that affect the modeling results, simulation of generic model scenarios was performed.

3.4.1. Storage Time

Because of the lack of data, the storage time has been chosen based on the equipment lifetime of 30 years [51]. To show the influence of longer storage times on the system environment, in this scenario a longer storage time of 300 years is modeled. With increasing storage time, the dissolved hydrogen has more time to diffuse into higher regions of the cap rock. After 300 years, the non-reactive tracer diffuses 10 m through the cap rock (Figure 4b), whereas the reactive hydrogen affects just the first 5 m of the cap rock.
When considering longer storage times, it becomes clear that the mass of generated water is increased to 1.03 kg (1 kg + 0.3 kg = 1.03 kg water in total) in the reservoir rock because the water-producing processes, BSR and methanogenesis (Equations (2) and (3)), are time-dependent. In the reservoir rock, the pH is increased to 8.7. The porosity loss from 10% to 9.19–9.99% is greater than that after 30 years of storage. The reason for the greater decrease is the intensified dissolution of quartz and illite. Calcite is completely consumed in the hotspot areas, the contact areas of the cap rock to the reservoir rock and of the underlying rock to the reservoir rock. In all other cells, calcite is still available, but it is only partly dissolved. On the other hand, the albitization process is intensified in the hotspot areas and more kaolinite is formed. The reactive amounts of anhydrite and goethite are completely consumed. The only sulfate source for BSR is delivered by diffusion from the underlying rock and the cap rock into the reservoir rock. The mineralogical changes in the cap rock are minimal and show that even after 300 years of hydrogen storage, the effects of diffusion of aqueous hydrogen are small.
When the storage time is increased to 300 years (under the assumption that no new gas mixture of H2(g) and CO2(g) is injected), the total amount of newly generated CH4(g) is increased to an average of 0.25 mol L−1 of gas and the H2S(g) concentration is increased to an average of 0.006 mol L−1 of gas (Figure 2b). After 300 years, the total amount of stored H2(g) is consumed.
In the case of storage cycles, including gas injection, storage, and production phases, the newly injected hydrogen gas is again accompanied by a new amount of CO2(g), which is available as an electron acceptor for methanogenic bacteria. This aspect is modeled in a separate transport model. The total loss of hydrogen by conversion to CH4(g) is higher if the storage cycle has a higher frequency, because CO2(g) is co-injected and is available for methanogenesis. With a total storage time of 30 years and a dwelling time of 6 months, a maximum of 60 injections of “fresh gas” (composed of H2(g) and CO2(g)) can be stored in the reservoir. This leads to a total generation of 6.72 mol L−1 of gas CH4(g) after 30 years. However, the loss of hydrogen after 6 months, the shorter storage period, is of course smaller (0.112 mol L−1 of gas in 6 months) than after 30 years of storage. Consequently, a shorter storage period leads to a lower amount of generated CH4(g) (and a lower loss of hydrogen) because methanogenesis is a time-dependent process. However, over the total time, the loss of hydrogen sums to a higher amount. This holds true only for methanogenesis. For bacterial sulfate reduction, the amount of generated H2S(g) depends not only on the amount of available sulfate but also on the time-dependent kinetic rate constant.
To summarize, it is clear that longer storage times increase the risk of loss of hydrogen. On the other hand, the reactive anhydrite and calcite will be consumed after a few years of storage and safer storage conditions arise because BSR and methanogenesis will be limited by the amount of sulfate and carbon dioxide delivered by diffusion (and diffusion is a slow process). In this case, the hotspot areas gain in importance. However, assuming shorter storage periods of 6 months, the CH4(g) concentration in the stored gas will be lower than after a storage time of 30 years, but the total loss of hydrogen sums to higher amounts regarding shorter storage periods (60 injections in 30 years).

3.4.2. Pressure and Temperature Conditions in Gas Reservoirs

Each depleted gas field has specific pressure and temperature conditions. To analyze the influence of pressure and temperature on the modeling results of hydrogen storage, the pressure and temperature conditions are varied.
The higher pressure and temperature conditions chosen are 161 atm and 80 °C. At even higher temperature conditions, the sulfate-reducing bacteria and methanogenic bacteria are mostly no longer active. The maximum temperature for SRB and methanogenic bacteria is 80 °C [19,24]. At higher pressure and temperature conditions, thermochemical sulfate reduction, as known from deeply buried hydrocarbon reservoirs, must be considered.
At 161 atm and 80 °C (at invariable kinetic rate constants for BSR and methanogenesis), the amount of consumed H2(g/aq) is slightly lower (75%) than that in the reference scenario (76%; modeled at 40 atm and 40 °C). The increased pressure results in a decreased gas volume and in higher gas concentrations. The H2S(g) concentration is increased to an average of 0.009 mol L−1 of gas and the CH4(g) concentration is increased to an average 0.54 mol L−1 of gas after 30 years (Figure 2c).
The porosity loss (from initial 10% to 9.52–9.86%) in the reservoir rock is, on average, higher than in the reference scenario. This can be explained by the stronger albitization at this higher pressure and temperature conditions and the pyrite formation increases as well. On the other hand, the dissolution of quartz, calcite, and illite is higher. However, the amount of precipitated minerals is higher than the amount of dissolved minerals and this causes the decrease in porosity. The pH in the reservoir rock brine is 7.5–8.4, which is lower than in the reference scenario. In addition, the amount of the aqueous sulfide sulfur (S(–II)) in the reservoir brine is decreased at these conditions. The mass of generated water is, despite BSR and methanogenesis, decreased from 1 kg to 0.96 kg. A reason for this could be the stronger albitization process, binding the water.
The changed pressure and temperature conditions affect the equilibrium constants of the mass action laws of gases, minerals, and aqueous species. Here, a modeling limitation is achieved because the phreeqc.dat database does not contain pressure dependencies for the equilibrium constants for all mineral phases that are used in the model. The pressure dependency of the following mineral phases in the model are included: calcite, dolomite, anhydrite, barite, quartz, and halite.
As in the reference scenario, the temperature and pressure conditions change along the diffusive pathway of the aqueous species through the cap rock according to the geothermal gradient of 33.3 °C km−1 depth and 100 atm km−1 depth under hydrostatic conditions, starting with 80 °C and 161 atm at the reservoir depth. Each cell is defined by a specific temperature and pressure condition. The influence of these changing pressure and temperature conditions on the cap rock is minor. The concentration of aqueous sulfate sulfur S(+VI) is higher and aqueous sulfide sulfur (S(–II)) is lower than in the reference scenario. Different from the reference scenario, albitization occurs at these higher pressure and temperature conditions even in the cap rock, and dawsonite precipitation and halite dissolution are slightly increased.
To summarize, at higher pressure and temperature conditions (while the kinetic rate constants are not changed), the concentration of CH4(g) and H2S(g) is increased due to a lower gas volume. Furthermore, the loss in porosity in the reservoir rock is increased. However, the kinetic rate constant is pressure- and temperature-dependent; therefore, this influence is tested in a further scenario (Section 3.4.3).

3.4.3. Kinetic Rate Constant

Special consideration is given to the influence of the kinetic rate constants of bacterial sulfate reduction and methanogenesis on the loss of hydrogen during storage. Therefore, the rate constants are varied. As a reminder, the initial kinetic rate constant in the reference scenario for BSR is 9.26 × 10⁻⁸ mol kgw−1 s−1 and 2.30 × 10⁻⁹ mol kgw−1 s−1 for methanogenesis.
By increasing the kinetic rate constant for BSR slightly to 2.40 × 10⁻⁷ mol kgw−1 s−1, based on data from Herrera et al. [52], the total amount of stored hydrogen is lost in less than 20 years. The amount of generated H2S(g) does not change because the reactive amount of anhydrite in the reservoir rock is completely consumed and the only sulfate source comes from the cap rock and underlying rock by diffusion and diffusion is a slow process. By increasing the storage time to 300 years (with a kinetic rate constant of 2.40 × 10⁻⁷ mol kgw−1 s−1 for BSR), the effect of diffusion is recognizable and the H2S(g) generation increases in the hotspot areas. The amount of generated CH4(g) increases from 0.2 mol L−1 of gas to an average of 0.25 mol L−1 of gas in each cell of the reservoir rock after 30 years (Figure 2d). The reason for this could be that methanogenesis starts as soon as all the sulfate for BSR is consumed. Because sulfate is consumed faster, due to the increased kinetic rate constant, the timeframe in which the methanogenesis can take place is expanded. On decreasing the kinetic rate constant for BSR to 9.26 × 10⁻⁹ mol kgw−1 s−1, the amount of generated H2S(g) does not change because the reactive amount of anhydrite in the reservoir rock is completely consumed. Less H2(g/aq) is consumed (14% loss) and a smaller amount of CH4(g) (on average 0.013 mol L−1 of gas) is generated (Figure 2e).
At a higher kinetic rate constant for methanogenesis of 2.30 × 10⁻⁶ mol kgw−1 s−1, the total amount of stored hydrogen is lost in less than 6 years (Figure 2f). CH4(g) production increases to an average of 0.25 mol L−1 of gas and the mass of water rises to 1.03 kg per cell in the reservoir rock after 30 years of storage. The amount of CO2(g) from the injected gas mixture and the residual gas is completely consumed in less than 3 years of storage and is not the limiting factor for methanogenesis. If no CO2(g) is available anymore from the injected gas mixture and residual gas, the dissolution of carbonate-bearing minerals begins and delivers CO2 for methanogenesis. With a smaller kinetic rate constant for methanogenesis of 2.30 × 10⁻¹² mol kgw−1 s−1, the loss of H2(g/aq) is slightly lower (75.7%). Less CH4(g) is generated (but the differences are in the third decimal place, only from 0.192 mol L−1 of gas in the reference scenario to 0.191 mol L−1 of gas) and the H2S(g) generation is constant (Figure 2g). The produced mass of water and the pH conditions show no changes compared to the reference scenario.
It can be concluded that the kinetic rate constants are important factors controlling the loss of hydrogen storage. Knowledge of the kinetic rate constants for BSR and methanogenesis at elevated temperature and pressure are required. Nevertheless, the maximal amount of generated H2S(g) is, if all reactive sulfate-bearing minerals (e.g., anhydrite) are consumed, limited by diffusion. On the other hand, the maximal amount of generated CH4(g) depends on the kinetic rate constant and the storage time.

3.4.4. Stored Gas Composition

In the “POWER-to-GAS-to-POWER” concept for the storage and usage of hydrogen, the hydrogen is stored purely in underground storage systems [13]. As a consequence of pure H2(g) injection and storage (no CO2(g) is co-injected), the amount of generated CH4(g) decreases to an average of 0.32 mol L−1 of gas after 30 years. H2S(g) generation is constant with an average of 0.005 mol L−1 of gas after 30 years (Figure 2h). The loss of stored H2(g/aq) is slightly increased to 77% after 30 years of storage.
An alternative CO2 source for methanogenesis is the residual gas that was not removed during natural gas production. Only if the residual gas is consumed or not reactive, does carbonate-bearing mineral dissolution increase and delivers CO2 for methanogenesis, which is even more pronounced at a longer storage time of 300 years. Finally, the amount of available and reactive carbonate-bearing minerals (here calcite and dolomite) limits the process of methanogenesis if no CO2(g) is stored with H2(g/aq). On the other hand, a separate test model shows that a higher amount of co-injected CO2(g) (14.8 atm; 10 times higher than in the reference scenario) increases the amount of generated CH4(g) to an average of 1.0 mol L−1 of gas. If the amount of available CO2(g) would be infinitely large, the time-dependent kinetic rate constant and the storage time limit the loss of hydrogen by conversion to CH4(g).
Without CO2(g) co-injection, the porosity in the reservoir rock decreases from 10% to 9.82–9.98%. This loss in porosity is slightly smaller than in the reference scenario in which 4% CO2(g) is co-injected. The changes in mineral dissolution and precipitation are minor in comparison to the reference scenario. The amounts of precipitated kaolinite, K-feldspar, and dolomite are slightly smaller than in the reference scenario and less calcite and illite are dissolved. No changes in the pH are observable. The smaller amount of precipitated K-feldspar and kaolinite leads to a smaller amount of bound water in these minerals. Consequently, the mass of water increases to 1.025 kg in the reservoir rock and is higher than the increase in the reference scenario (1.007 kg). The changes in the mineralogical composition of the cap rock are minor.

4. Conclusions

The simulation results show that the underground storage of hydrogen in depleted gas fields entails the risk of hydrogen loss (and related energy loss) by bacterial conversion to CH4(g) and H2S(g) and gas–water–rock interactions, which in turn lead to changes in the porosity of the reservoir rock. The modeling results of the one-dimensional reactive mass transport model identify the factors that control the loss of hydrogen:
  • The loss of hydrogen by bacterial conversion to CH4(g) via methanogenesis is limited mainly by the amount of co-injected CO2(g), the reaction kinetics, and the connected maximal storage time of 30 years. Less co-injected CO2(g) will reduce H2(g) loss but cannot inhibit the conversion to CH4(g) if further CO2 sources are available in the form of residual gas and carbonate-bearing minerals. The generation of CH4(g) by methanogenesis where CO2 is only delivered by the dissolution of carbonate-bearing minerals is slower because the dissolution process limits the conversion to CH4(g).
  • The loss of hydrogen by bacterial conversion to H2S(g) via bacterial sulfate reduction is limited mainly by the amount of available sulfate in the reservoir. After complete consumption of reactive anhydrite, the only sulfate source comes from the cap rock and the underlying rock by diffusion and consequently limits the loss of hydrogen by bacterial sulfate reduction because the process of diffusion is slow.
  • The mass of generated water, as a product of BSR and methanogenesis, increases the pressure in the system and diffusion can be intensified.
  • The mineralogical changes in the reservoir rock result in a small decrease in porosity. As a consequence, the available pore space for hydrogen storage decreases over 30 years such that (i) the same amount of hydrogen is moved to greater distances from the bore hole or (ii) less hydrogen can be stored in future injection phases.
  • The loss of aqueous hydrogen by diffusion and related effects on the cap rock mineralogy is negligibly small, with a storage time of 30 years, because hydrogen storage causes gas–water–rock interactions in the reservoir rock and brine and is converted by BSR and methanogenesis to a greater extent. Furthermore, the process of diffusion is slow.
  • A longer storage period increases the loss of the stored hydrogen. Shorter storage periods lead to less hydrogen loss for each period, but over the total time the summed loss of hydrogen is higher because new CO2(g) is available for methanogenesis after each gas injection.
  • At higher pressure and temperature conditions, the concentrations of CH4(g) and H2S(g) increase due to a lower gas volume. Furthermore, the loss in porosity in the reservoir rock increases as well.
  • Knowledge of kinetic rate constants for bacterial sulfate reduction and methanogenesis at elevated levels of pressure and temperature are required as accurately as possible.
It is recommended to choose depleted gas fields for hydrogen storage where the residual gas has low CO2(g) concentrations. The mineralogical composition of the reservoir rocks should contain low amounts of sulfate- and carbonate-bearing minerals but high amounts of reactive iron-bearing minerals. Reservoirs with low pressure and temperature conditions are recommended as well as storage gas compositions with low amounts of CO2(g). From the modeling results, it seems reasonable to implement a multicomponent transport model and to conduct a joint variation of several parameters as a next step.

Supplementary Materials

The following are available online at https://www.mdpi.com/2076-3417/8/11/2282/s1, Input file S1 for the transport model to calculate the reference scenario (for PHREEQC Version 3.1.4-8929; ready to copy, paste, and run).

Author Contributions

Conceptual model, C.H.; modeling, C.H. and W.v.B.; validation of results: C.H. and W.v.B.; analysis of results, C.H. and W.v.B.; writing—original draft preparation: C.H.; writing—review and editing: C.H. and W.v.B.; visualization: C.H.; supervision: W.v.B.

Funding

This research received no external funding.

Acknowledgments

We thank Leo Fuhrmann for technical assistance. We would like to thank three anonymous reviewers for their constructive reviews.

Conflicts of Interest

The authors declare no conflict of interest.

References

  1. Ebigbo, A.; Golfier, F.; Quintard, M. A coupled, pore-scale model for methanogenic microbial activity in underground hydrogen storage. Adv. Water Resour. 2013, 61, 74–85. [Google Scholar] [CrossRef] [Green Version]
  2. Reitenbach, V.; Ganzer, L.; Albrecht, D.; Hagemann, B. Influence of added hydrogen on underground gas storage: A review of key issues. Environ. Earth Sci. 2015, 73, 6927–6937. [Google Scholar] [CrossRef]
  3. Stone, H.B.J.; Veldhuis, I.; Richardson, R.N. Underground hydrogen storage in the UK. Geol. Soc. Lond. Spec. Publ. 2009, 313, 217–226. [Google Scholar] [CrossRef]
  4. Henkel, S.; Pudlo, D.; Gaupp, R. Research sites of the H2STORE project and the relevance of lithological variations for hydrogen storage at depths. Energy Procedia 2013, 40, 25–33. [Google Scholar] [CrossRef]
  5. Panfilov, M. Underground storage of hydrogen: In situ self-organisation and methane generation. Transp. Porous Med. 2010, 85, 841–865. [Google Scholar] [CrossRef]
  6. Crotogino, F.; Donadei, S.; Bünger, U.; Landinger, H. Large-Scale Hydrogen Underground Storage for Securing Future Energy Supplies. In 18th World Hydrogen Energy Conference 2010—WHEC 2010 Proceedings; Stolten, D., Grube, T., Eds.; Forschungszentrum IEF-3: Jülich, Germany, 2010. [Google Scholar]
  7. Shen, L.; Chen, Z. Critical review of the impact of tortuosity on diffusion. Chem. Eng. Sci. 2007, 62, 3748–3755. [Google Scholar] [CrossRef]
  8. Jacops, E.; Volckaert, G.; Maes, N.; Weetjens, E.; Govaerts, J. Determination of gas diffusion coefficients in saturated porous media: He and CH4 diffusion in Boom Clay. Appl. Clay Sci. 2013, 83, 217–223. [Google Scholar] [CrossRef]
  9. Krooss, B. Evaluation of Database on Gas Migration through Clayey Host Rocks; Belgian National Agency for Radioactive Waste and Enriched Fissile Material (ONDRAF-NIRAS); RWTH Aachen: Aachen, Germany, 2008. [Google Scholar]
  10. Panfilov, M. Underground and pipeline hydrogen storage. In Compendium of Hydrogen Energy: Volume 2: Hydrogen Storage, Distribution and Infrastructure; Gupta, R.B., Basile, A., Veziroğlu, T.N., Eds.; Elsevier: Cambridge, UK; Waltham, MA, USA; Kidlington, UK, 2016; pp. 91–115. [Google Scholar]
  11. McCarty, R.D.; Hord, J.; Roder, H.M. Selected Properties of Hydrogen (Engineering Design Data); National Bureau of Standards Monograph 168—US Department of Commerce: Boulder, CO, USA, 1981.
  12. Friend, D.G.; Ely, J.F.; Ingham, H. Thermophysical properties of methane. J. Phys. Chem. Ref. Data 1989, 18, 583–638. [Google Scholar] [CrossRef]
  13. Hagemann, B.; Rasoulzadeh, M.; Panfilov, M.; Ganzer, L.; Reitenbach, V. Hydrogenization of underground storage of natural gas. Comput. Geosci. 2016, 20, 595–606. [Google Scholar] [CrossRef]
  14. Cord-Ruwisch, R.; Kleinitz, W.; Widdel, F. Sulfate-reducing bacteria and their activities in oil production. J. Pet. Technol. 1987, 39, 97–106. [Google Scholar] [CrossRef]
  15. Bernardez, L.A.; de Andrade Lima, L.R.; de Jesus, E.B.; Ramos, C.L.S.; Almeida, P.F. A kinetic study on bacterial sulfate reduction. Bioprocess. Biosyst. Eng. 2013, 36, 1861–1869. [Google Scholar] [CrossRef] [PubMed]
  16. Postgate, J.R. The Sulphate-Reducing Bacteria, 2nd ed.; Cambridge University Press: Cambridge, UK, 1984. [Google Scholar]
  17. Ehrlich, H.L. Geomicrobiology, 2nd ed.; Dekker: New York, NY, USA, 1990. [Google Scholar]
  18. Machel, H.G. Bacterial and thermochemical sulfate reduction in diagenetic settings—Old and new insights. Sediment. Geol. 2001, 140, 143–175. [Google Scholar] [CrossRef]
  19. Jorgensen, B.B.; Isaksen, M.F.; Jannasch, H.W. Bacterial sulfate reduction above 100 °C in deep-sea hydrothermal vent sediments. Science 1992, 258, 1756–1757. [Google Scholar] [CrossRef] [PubMed]
  20. Postgate, J.R. The Sulphate-Reducing Bacteria; Cambridge University Press: Cambridge, UK, 1979. [Google Scholar]
  21. Whitman, W.B.; Bowen, T.L.; Boone, D.R. The methanogenic bacteria. In The Prokaryotes; Dworkin, M., Falkow, S., Rosenberg, E., Schleifer, K.-H., Stackebrandt, E., Eds.; Springer: New York, NY, USA, 2006; pp. 165–207. [Google Scholar]
  22. Šmigáň, P.; Greksák, M.; Kozánková, J.; Buzek, F.; Onderka, V.; Wolf, I. Methanogenic bacteria as a key factor involved in changes of town gas stored in an underground reservoir. FEMS Microbiol. Lett. 1990, 73, 221–224. [Google Scholar] [CrossRef]
  23. Davydova-Charakhch’yan, I.A.; Kuznetsova, V.G.; Mityushina, L.L.; Belyaev, S.S. Methane-forming bacilli from oil fields of Tataria and western Siberia. Microbiology 1992, 61, 202. [Google Scholar]
  24. Magot, M.; Ollivier, B.; Patel, B.K.C. Microbiology of petroleum reservoirs. Antonie Leeuwenhoek 2000, 77, 103–116. [Google Scholar] [CrossRef] [PubMed]
  25. Gusev, M.V.; Mineeva, L.A. Microbiology; Moscow Lomonosov University: Moscow, Russia, 1992. [Google Scholar]
  26. Bildstein, O.; Kervévan, C.; Lagneau, V.; Delaplace, P.; Crédoz, A.; Audigane, P.; Perfetti, E.; Jacquemet, N.; Jullien, M. Integrative modeling of caprock integrity in the context of CO2 storage: Evolution of transport and geochemical properties and impact on performance and safety assessment. Oil Gas Sci. Technol. Rev. IFP 2010, 65, 485–502. [Google Scholar] [CrossRef] [Green Version]
  27. Gaus, I.; Azaroual, M.; Czernichowski-Lauriol, I. Reactive transport modelling of the impact of CO2 injection on the clayey cap rock at Sleipner (North Sea). Chem. Geol. 2005, 217, 319–337. [Google Scholar] [CrossRef]
  28. Hemme, C.; van Berk, W. Change in cap rock porosity triggered by pressure and temperature dependent CO2–water–rock interactions in CO2 storage systems. Petroleum 2017, 3, 96–108. [Google Scholar] [CrossRef]
  29. Mohd Amin, S.; Weiss, D.J.; Blunt, M.J. Reactive transport modelling of geologic CO2 sequestration in saline aquifers: The influence of pure CO2 and of mixtures of CO2 with CH4 on the sealing capacity of cap rock at 37 °C and 100bar. Chem. Geol. 2014, 367, 39–50. [Google Scholar] [CrossRef]
  30. Larin, N.; Zgonnik, V.; Rodina, S.; Deville, E.; Prinzhofer, A.; Larin, V.N. Natural molecular hydrogen seepage associated with surficial, rounded depressions on the European Craton in Russia. Nat. Resour. Res. 2015, 24, 369–383. [Google Scholar] [CrossRef]
  31. Sato, M.; Sutton, A.J.; McGee, K.A.; Russell-Robinson, S. Monitoring of hydrogen along the San Andreas and Calaveras faults in central California in 1980–1984. J. Geophys. Res. Solid Earth 1986, 91, 12315–12326. [Google Scholar] [CrossRef]
  32. Wakita, H.; Nakamura, Y.; Kita, I.; Fujii, N.; Notsu, K. Hydrogen release: New indicator of fault activity. Science 1980, 210, 188–190. [Google Scholar] [CrossRef] [PubMed]
  33. Ware, R.H.; Roecken, C.; Wyss, M. The detection and interpretation of hydrogen in fault gases. Pure Appl. Geophys. 1985, 122, 392–402. [Google Scholar] [CrossRef]
  34. Zgonnik, V.; Beaumont, V.; Deville, E.; Larin, N.; Pillot, D.; Farrell, K.M. Evidence for natural molecular hydrogen seepage associated with Carolina bays (surficial, ovoid depressions on the Atlantic Coastal Plain, Province of the USA). Prog. Earth Planet. Sci. 2015, 2, 31. [Google Scholar] [CrossRef]
  35. Truche, L.; Berger, G.; Destrigneville, C.; Guillaume, D.; Giffaut, E. Kinetics of pyrite to pyrrhotite reduction by hydrogen in calcite buffered solutions between 90 and 180 °C: Implications for nuclear waste disposal. Geochim. Cosmochim. Acta 2010, 74, 2894–2914. [Google Scholar] [CrossRef]
  36. Yekta, A.E.; Pichavant, M.; Audigane, P. Evaluation of geochemical reactivity of hydrogen in sandstone: Application to geological storage. Appl. Geochem. 2018, 95, 182–194. [Google Scholar] [CrossRef]
  37. Flesch, S.; Pudlo, D.; Albrecht, D.; Jacob, A.; Enzmann, F. Hydrogen underground storage—Petrographic and petrophysical variations in reservoir sandstones from laboratory experiments under simulated reservoir conditions. Int. J. Hydrog. Energy 2018, 43, 20822–20835. [Google Scholar] [CrossRef]
  38. Parkhurst, D.L.; Appelo, C.A.J. Description of Input for Phreeqc Version 3—A Computer Program for Speciation, Batch-Reaction, One-Dimensional Transport, and Inverse Geochemical Calculations; U.S. Geological Survey: Denver, CO, USA, 2013.
  39. Dersch-Hansmann, M.; Hug-Diegel, N.; Wonik, T. Ein vollständiges Röt-Profil (Oberer Buntsandstein) in Nordhessen—Lithostratigraphie, Sedimentfazies, Geochemie und Geophysik der Kernborhung Fürstenwald. Geol. Jahrb. Hessen 2010, 136, 65–107. [Google Scholar]
  40. Feist-Burkhardt, S.; Götz, A.E.; Szulc, J.; Borkhataria, R.; Geluk, M.; Haas, J.; Hormung, J.; Jordan, P.; Kempf, O.; Michalik, J. Triassic. In The Geology of Central Europe; McCann, T., Ed.; Geological Society: London, UK, 2008. [Google Scholar]
  41. Soyk, D. Diagenesis and Reservoir Quality of the Lower and Middle Buntsandstein (Lower Triassic), SW Germany. Ph.D. Thesis, Ruprecht-Karls-Universität Heidelberg, University of Heidelberg, Heidelberg, Germany, 2015. [Google Scholar]
  42. Biehl, B.C.; Reuning, L.; Schoenherr, J.; Lewin, A.; Leupold, M.; Kukla, P.A. Do CO2-charged fluids contribute to secondary porosity creation in deeply buried carbonates? Mar. Pet. Geol. 2016, 76, 176–186. [Google Scholar] [CrossRef]
  43. Schreiber, B.C.; Bąbel, M. Evaporites through Space and Time; Geological Society: London, UK, 2007; Volume 285. [Google Scholar]
  44. Appelo, C.A.J.; Postma, D. Geochemistry, Groundwater and Pollution, 4th ed.; Balkema: Rotterdam, The Netherlands, 1999. [Google Scholar]
  45. Bischoff, G.; Gocht, W. Energietaschenbuch, 2nd ed.; Vieweg+Teubner Verlag: Wiesbaden, Germany, 1984. [Google Scholar]
  46. Pudlo, D.; Ganzer, L.; Henkel, S.; Kühn, M.; Liebscher, A.; De Lucia, M.; Panfilov, M.; Pilz, P.; Reitenbach, V.; Albrecht, D.; et al. The H2STORE Project: Hydrogen Underground Storage—A Feasible Way in Storing Electrical Power in Geological Media? In Underground Storage of CO2 and Energy; Hou, M.Z., Xie, H., Yoon, J.S., Eds.; Springer: Berlin/Heidelberg, Germany, 2013; pp. 395–412. [Google Scholar]
  47. Hemme, C.; van Berk, W. Potential risk of H2S generation and release in salt cavern gas storage. J. Nat. Gas Sci. Eng. 2017, 47, 114–123. [Google Scholar] [CrossRef]
  48. Parkhurst, D.L.; Appelo, C.A.J. Users Guide to Phreeqc (Version 2)—A Computer Program for Speciation, Batch-Reaction, One-Dimensional Transport and Inverse Geochemical Calculations; U.S. Geological Survey: Denver, CO, USA, 1999.
  49. Appelo, C.A.J.; Wersin, P. Multicomponent Diffusion Modeling in Clay Systems with Application to the Diffusion of Tritium, Iodide, and Sodium in Opalinus Clay. Environ. Sci. Technol. 2007, 41, 5002–5007. [Google Scholar] [CrossRef] [PubMed]
  50. Vinograd, J.R.; McBain, J.W. Diffusion of electrolytes and of the ions in their mixtures. J. Am. Chem. Soc. 1941, 63, 2008–2015. [Google Scholar] [CrossRef]
  51. Lord, A.S.; Kobos, P.H.; Borns, D.J. Geologic storage of hydrogen: Scaling up to meet city transportation demands. Int. J. Hydrog. Energy 2014, 39, 15570–15582. [Google Scholar] [CrossRef]
  52. Herrera, L.; Hernández, J.; Bravo, L.; Romo, L.; Vera, L. Biological process for sulfate and metals abatement from mine effluents. Environ. Toxicol. Water Qual. 1997, 12, 101–107. [Google Scholar] [CrossRef]
  53. Adler, M.; Eckert, W.; Sivan, O. Quantifying rates of methanogenesis and methanotrophy in Lake Kinneret sediments (Israel) using pore-water profiles. Limnol. Oceanogr. 2011, 56, 1525–1535. [Google Scholar] [CrossRef] [Green Version]
  54. Robinson, J.A.; Tiedje, J.M. Competition between sulfate-reducing and methanogenic bacteria for H2 under resting and growing conditions. Arch. Microbiol. 1984, 137, 26–32. [Google Scholar] [CrossRef]
  55. Kalyuzhnyi, S.V.; Fedorovich, V.V. Mathematical modelling of competition between sulphate reduction and methanogenesis in anaerobic reactors. Bioresour. Technol. 1998, 65, 227–242. [Google Scholar] [CrossRef]
  56. Timmers, P.H.A.; Gieteling, J.; Widjaja-Greefkes, H.C.A.; Plugge, C.M.; Stams, A.J.M.; Lens, P.N.L.; Meulepas, R.J.W. Growth of anaerobic methane-oxidizing archaea and sulfate-reducing bacteria in a high-pressure membrane capsule bioreactor. Appl. Environ. Microbiol. 2015, 81, 1286–1296. [Google Scholar] [CrossRef] [PubMed]
  57. Truche, L.; Jodin-Caumon, M.-C.; Lerouge, C.; Berger, G.; Mosser-Ruck, R.; Giffaut, E.; Michau, N. Sulphide mineral reactions in clay-rich rock induced by high hydrogen pressure. Application to disturbed or natural settings up to 250 degrees C and 30 bar. Chem. Geol. 2013, 351, 217–228. [Google Scholar] [CrossRef]
  58. Buzek, F.; Onderka, V.; Vanĉura, P.; Wolf, I. Carbon isotope study of methane production in a town gas storage reservoir. Fuel 1994, 73, 747–752. [Google Scholar] [CrossRef]
Figure 1. Selected reactions and processes associated with bacterial sulfate reduction and methanogenesis (purple). Single arrow = kinetic-controlled reactions; double arrow = equilibrium reactions; blue triangles = time-dependent diffusive transport of aqueous components; bold = injected gas for storage.
Applsci 08 02282 g001
Figure 2. Changes in gas composition in the reservoir rock with ongoing time in (a) reference scenario and influenced by (b) increased storage time of 300 years, (c) higher pressure and temperature conditions, (d) higher kinetic rate constant for BSR of 2.40 × 10⁻⁷ mol kgw−1 s−1, (e) lower kinetic rate constant for BSR of 9.26 × 10⁻⁹ mol kgw−1 s−1, (f) higher kinetic rate constant for methanogenesis of 2.30 × 10⁻⁶ mol kgw−1 s−1, (g) lower kinetic rate constant for methanogenesis of 2.30 × 10⁻¹² mol kgw−1 s−1, (h) varied stored gas composition (without CO2(g)).
Applsci 08 02282 g002
Figure 3. Volume changes of mineral phases (L kgw−1) in the reservoir rock after 30 years of hydrogen storage (reference scenario).
Applsci 08 02282 g003
Figure 4. Diffusion of a non-reactive hydrogen tracer through the cap rock over (a) 30 years and (b) 300 years.
Applsci 08 02282 g004
Table 1. Equilibrium phases, mass action equations, and equilibrium constants used in the model. Data from phreeqc.dat, except for dawsonite, nahcolite, CH4(g), H2S(g), N2(g), which are from llnl.dat [38].
Equilibrium PhaseEquilibrium Reactionlog K at 25 °C, 1 bar
K-feldsparKAlSi3O8 + 8H2O = K+ + Al(OH)4 + 3H4SiO4−20.573
AlbiteNaAlSi3O8 + 8H2O = Na+ + Al(OH)4 + 3H4SiO4−18.002
KaoliniteAl2Si2O5(OH)4 + 6H+ = H2O + 2H4SiO4 + 2Al3+7.435
QuartzSiO2 + 2H2O = H4SiO43.98
CalciteCaCO3 = CO32− + Ca2+8.48
PyriteFeS2 + 2H+ + 2e = Fe2+ + 2HS−18.479
IlliteK0.6Mg0.25Al2.3Si3.5O10(OH)2 + 11.2H2O = 0.6K+ + 0.25Mg2+ + 2.3Al(OH)4− + 3.5H4SiO4 + 1.2H+−40.267
DawsoniteNaAlCO3(OH)2 + 3H+ = Al3+ + HCO3 + Na+ + 2H2O4.35
MackinawiteFeS + H+ = Fe2+ + HS−4.648
DolomiteCaMg(CO3)2 = Ca2+ + Mg2+ + 2CO32−−17.09
NahcoliteNaHCO3 = HCO3 + Na+−0.11
AnhydriteCaSO4 = Ca2+ + SO42−−4.39
HaliteNaCl = Cl + Na+1.570
GypsumCaSO4·2H2O = Ca2+ + SO42− + 2H2O−4.58
Sulfur aS + 2H+ + 2e = H2S4.882
BariteBaSO4 = Ba2+ + SO42−−9.97
GoethiteFeOOH + 3H+ = Fe3+ + 2H2O−1.0
H2(g)H2 = H2−3.1050
CO2(g)CO2 = CO2−1.468
CH4(g)CH4 = CH4−2.8502
H2S(g)H2S = H+ + HS−7.9759
N2(g)N2 = N2−3.1864
a Sulfur = elemental sulfur.
Table 2. Mineralogical composition of the reservoir rock, cap rock, and underlying rock. Dawsonite, nahcolite, mackinawite, sulfur, albite (and pyrite) are potential secondary phases.
Primary MineralsWeight Percent (wt. %)Amount (mol kgw−1)
Cap rock
Halite5.076.74
Quartz50.0746.42
Illite20.046.73
Dolomite5.024.32
Anhydrite15.0131.77
Reservoir rock
K-feldspar30.0103.90
Kaolinite1.03.73
Quartz55.0882.43
Calcite0.54.82
Dolomite0.50.03
Anhydrite0.50.132 a
Illite11.528.88
Barite0.50.0009
Goethite0.50.002
Underlying rock
Halite50.0758.46
Quartz8.0118.04
Calcite6.053.14
Dolomite10.00.03
Pyrite1.07.39
Anhydrite25.066.11
a Reactive amount of anhydrite.
Table 3. Composition of the initial irreducible water in the reservoir rock, the cap rock brine, and the underlying rock brine.
ParameterCap Rock BrineIrreducible Water in the Reservoir RockUnderlying Rock Brine
pH6.46.45.9
Temperature (°C)37.040.060.0
ElementsConcentration (mol kgw−1)Concentration (mol kgw−1)Concentration (mol kgw−1)
Al1.31 × 10−72.209 × 10−81.776 × 10−8
Ba5.85 × 10−73.922 × 10−72.206 × 10−5
Ctot a3.11 × 10−21.762 × 10−27.405 × 10−3
Ca3.63 × 10−21.186 × 10−21.562 × 10−2
Cl1.271.1235.396
Fe5.69 × 10−26.572 × 10−24.263 × 10−11
K5.28 × 10−16.151 × 10−14.604 × 10−1
Mg8.73 × 10−42.579 × 10−31.142 × 10−2
N5.61 × 10−26.485 × 10−25.081 × 10−2
Na1.271.1235.396
Stot b1.011.1437.540 × 10−1
Si8.73 × 10−59.878 × 10−51.509 × 10−4
a Summed concentration of aqueous CH4 and C(+IV) species; b Summed concentration of aqueous S(+VI) and S(−II) species.

