Real-Time HIFU Treatment Monitoring Using Pulse Inversion Ultrasonic Imaging


Abstract
1. Introduction
2. Materials and Methods
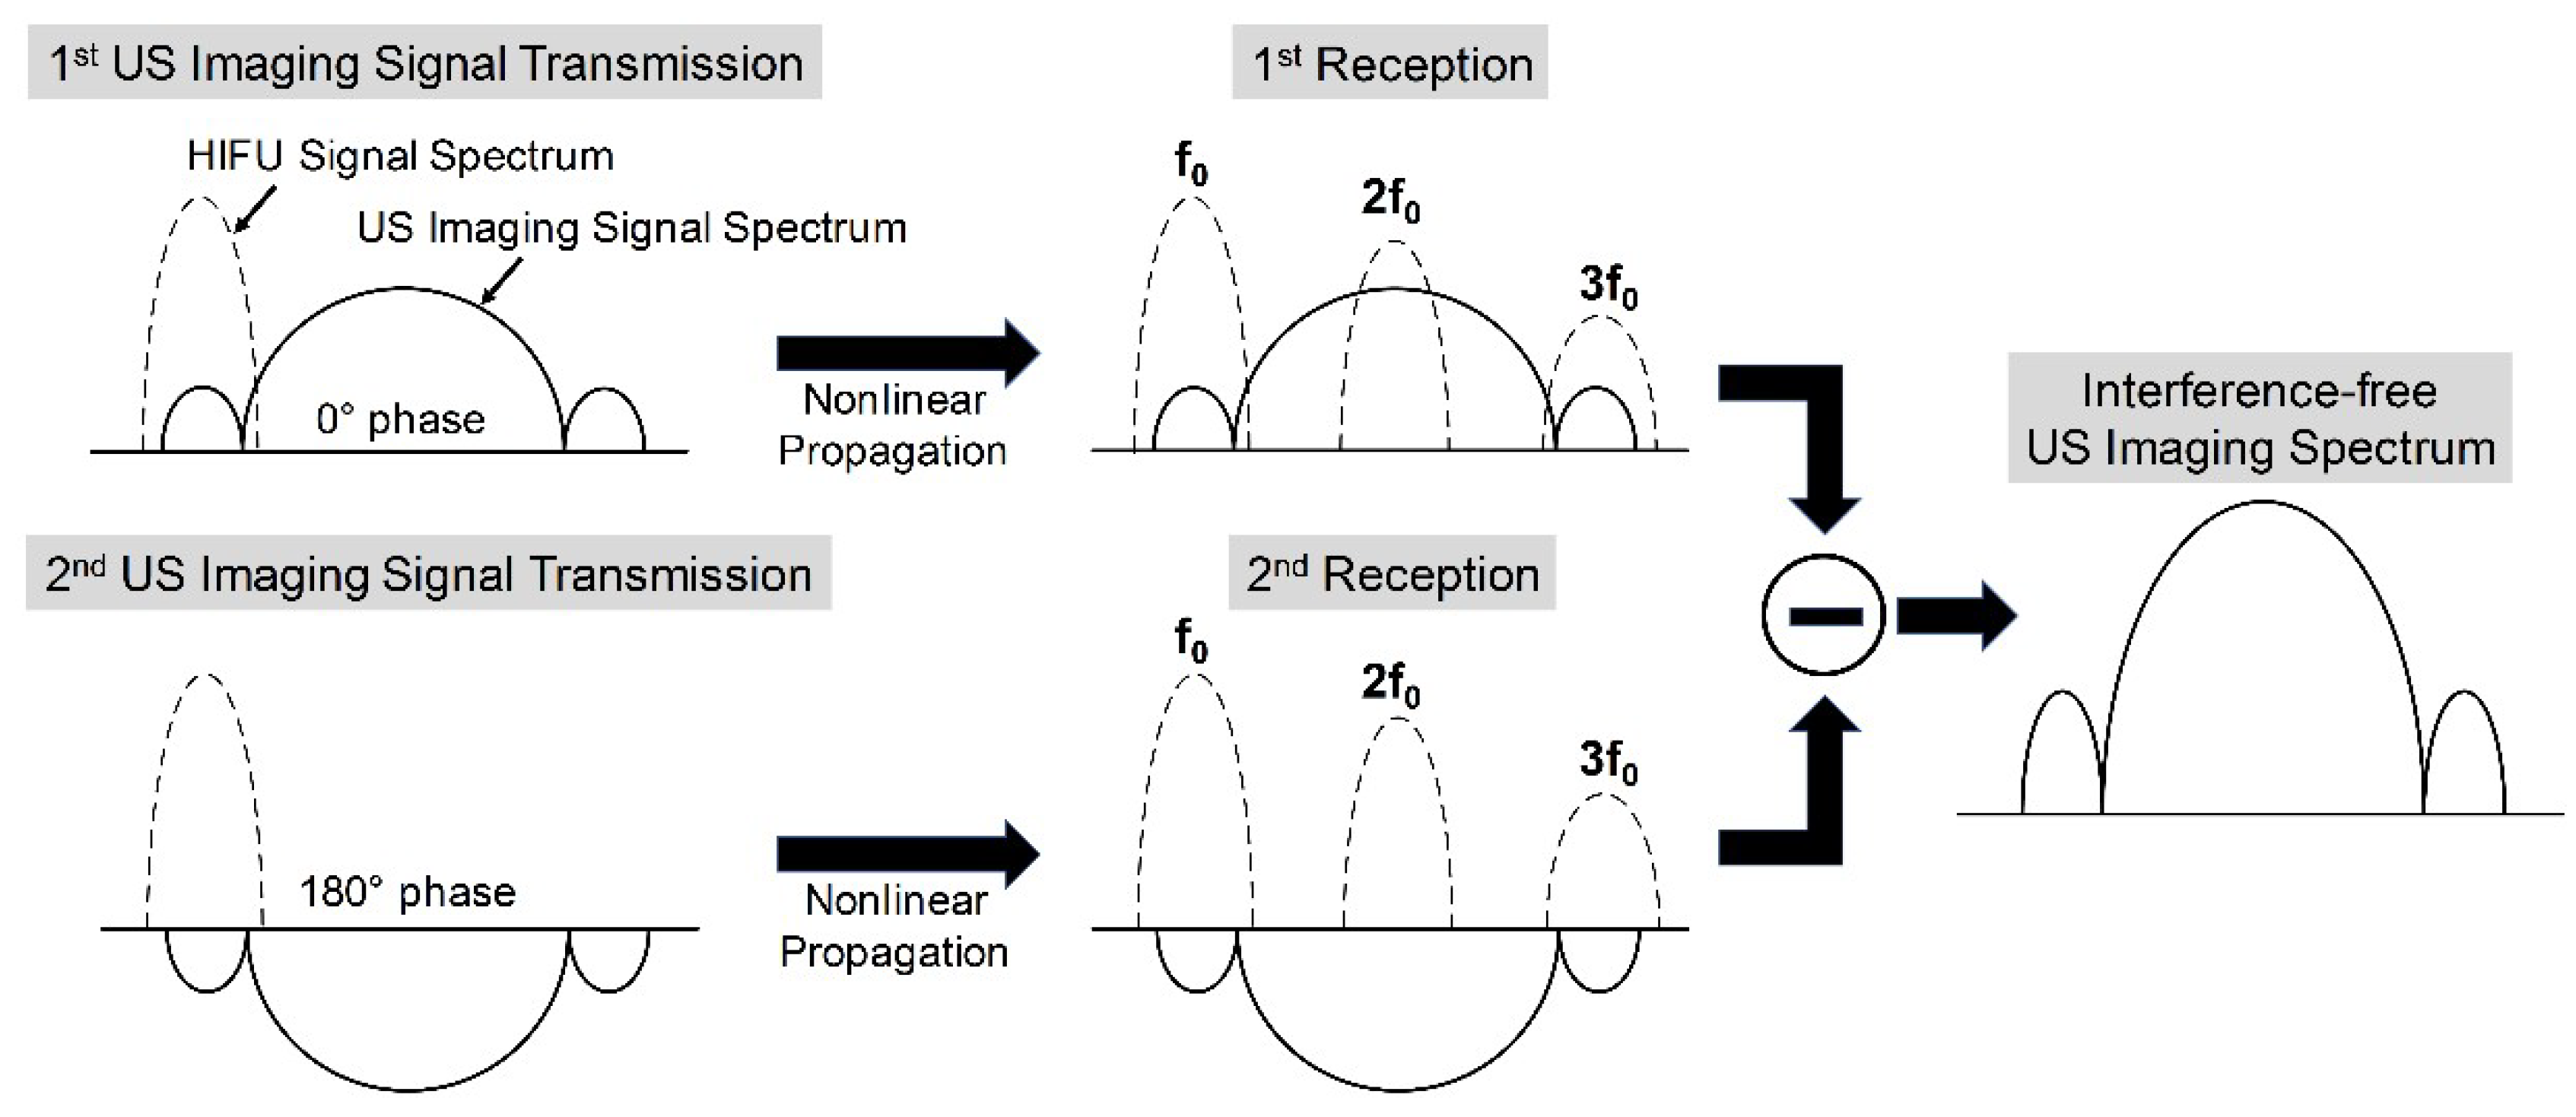
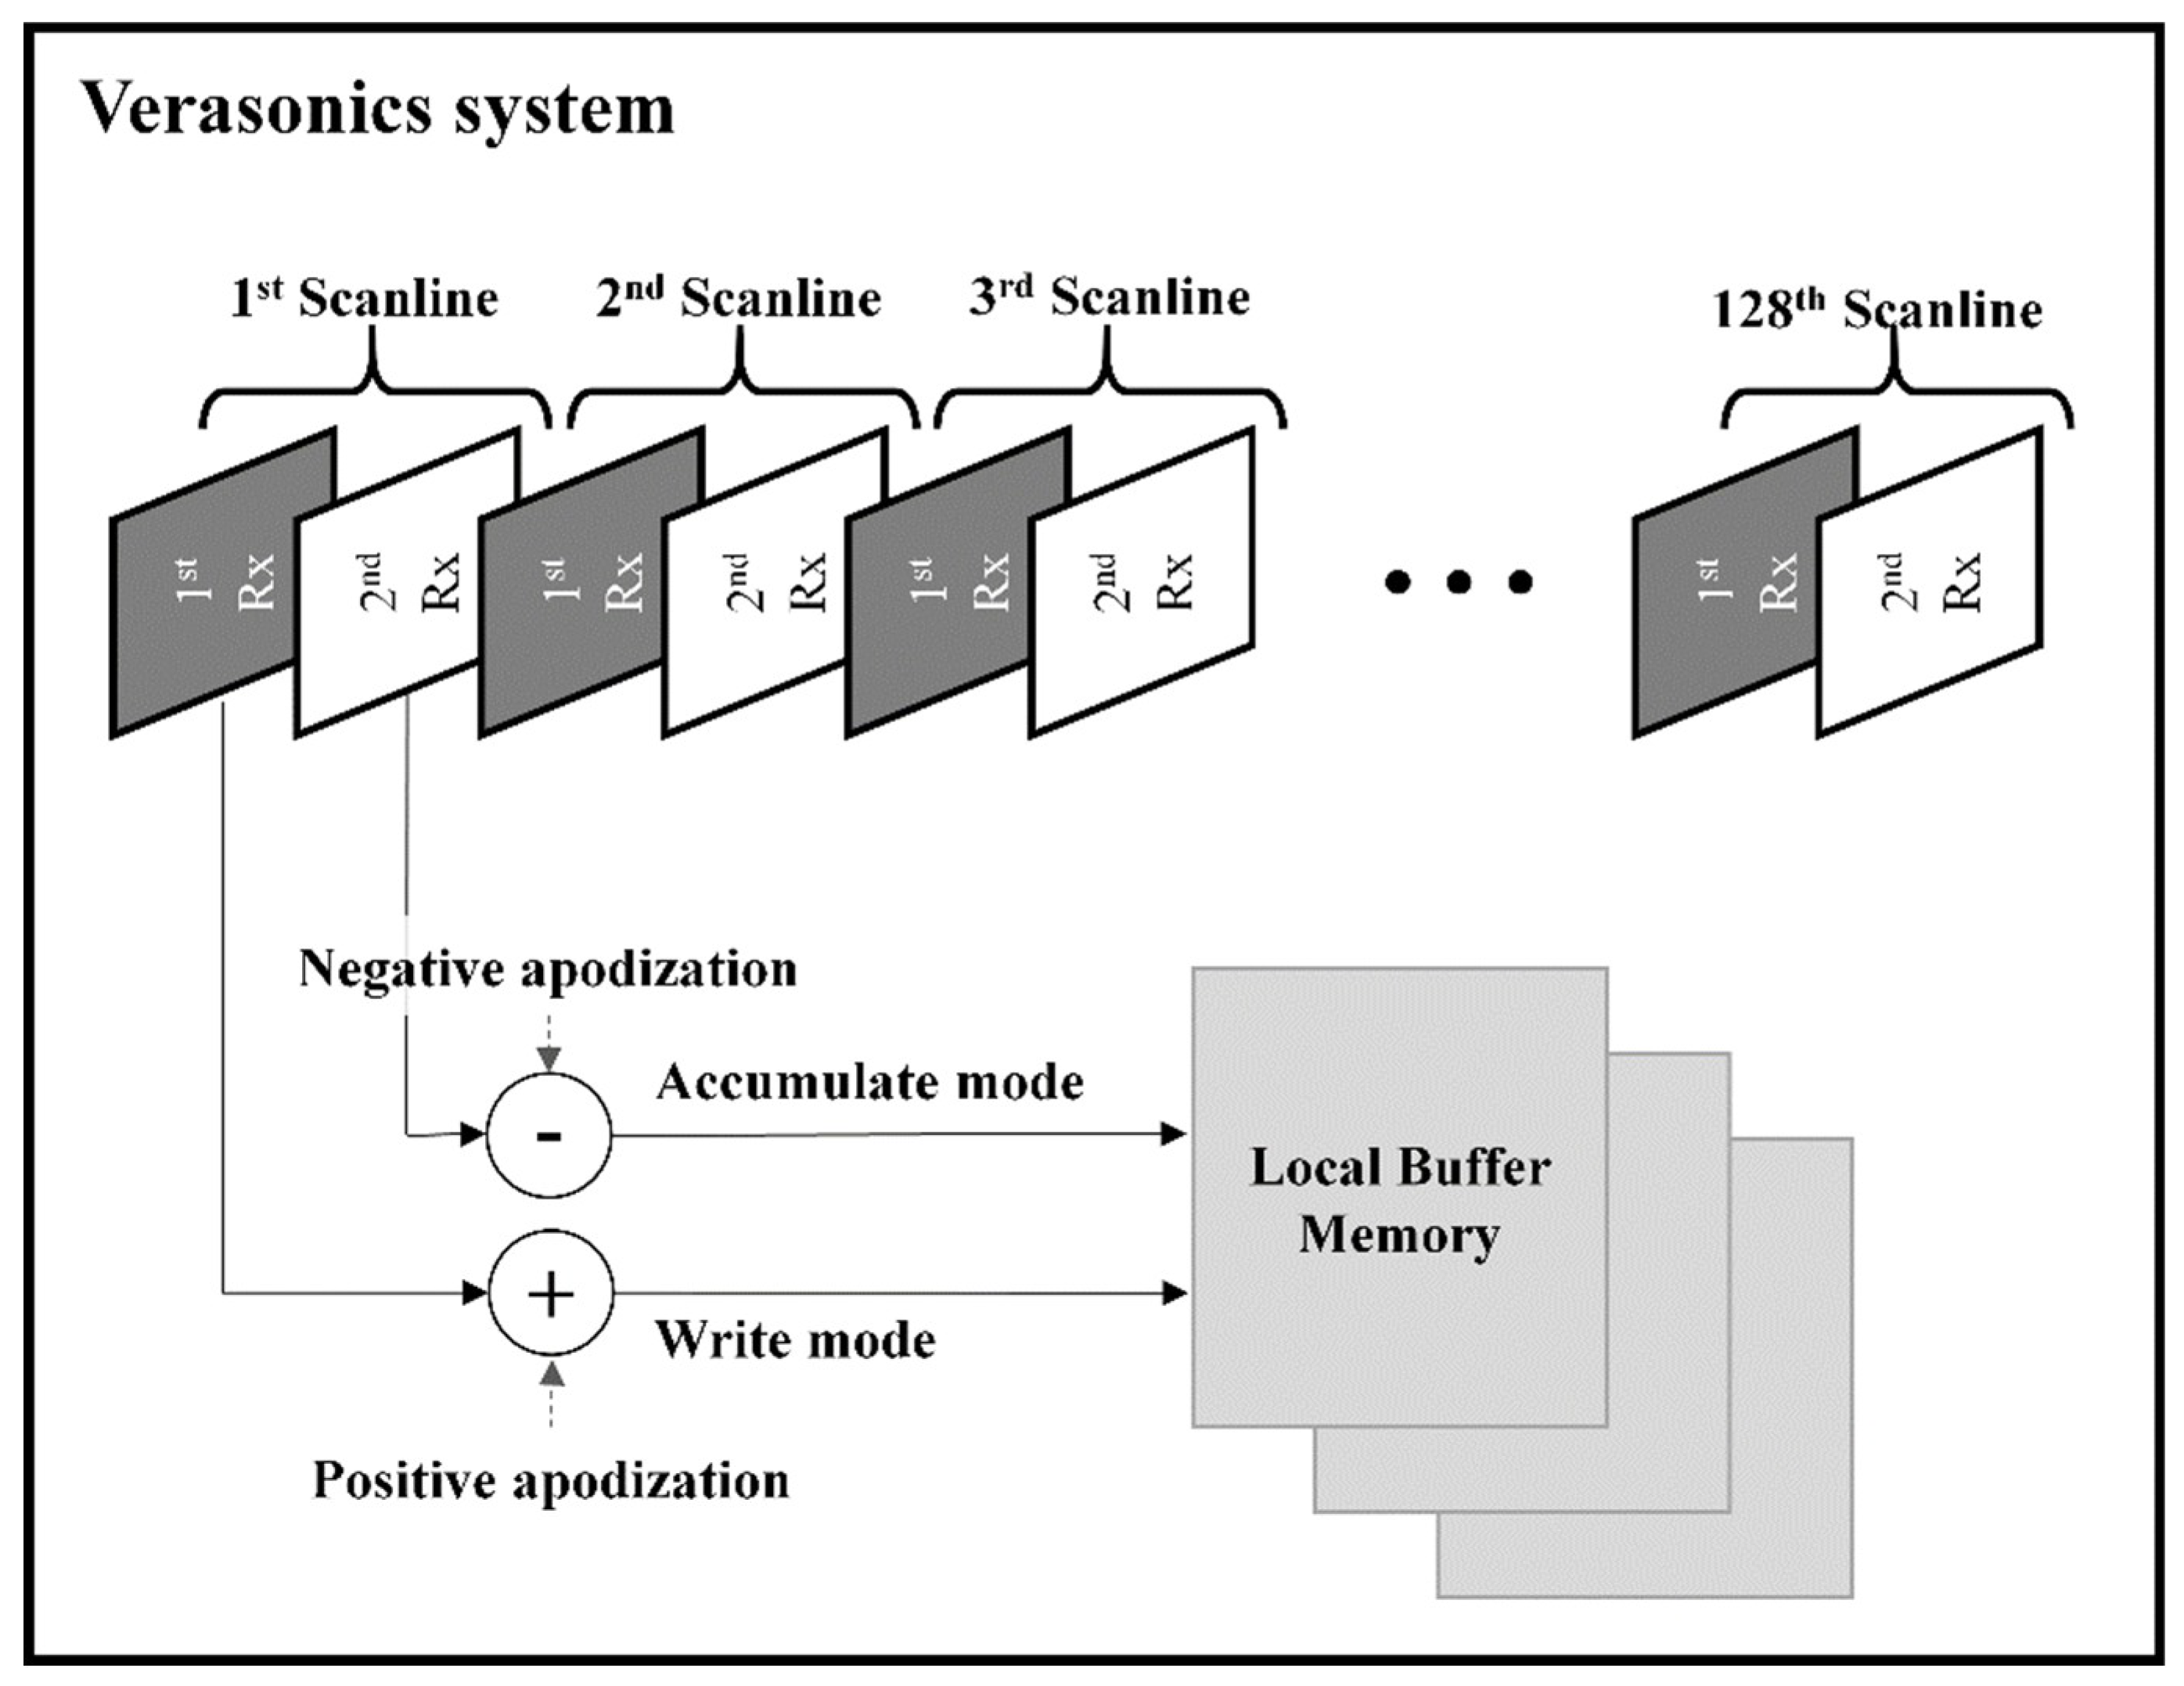
2.1. Proposed High-Intensity Focused Ultrasound (HIFU) Interference Elimination and Its Implementation
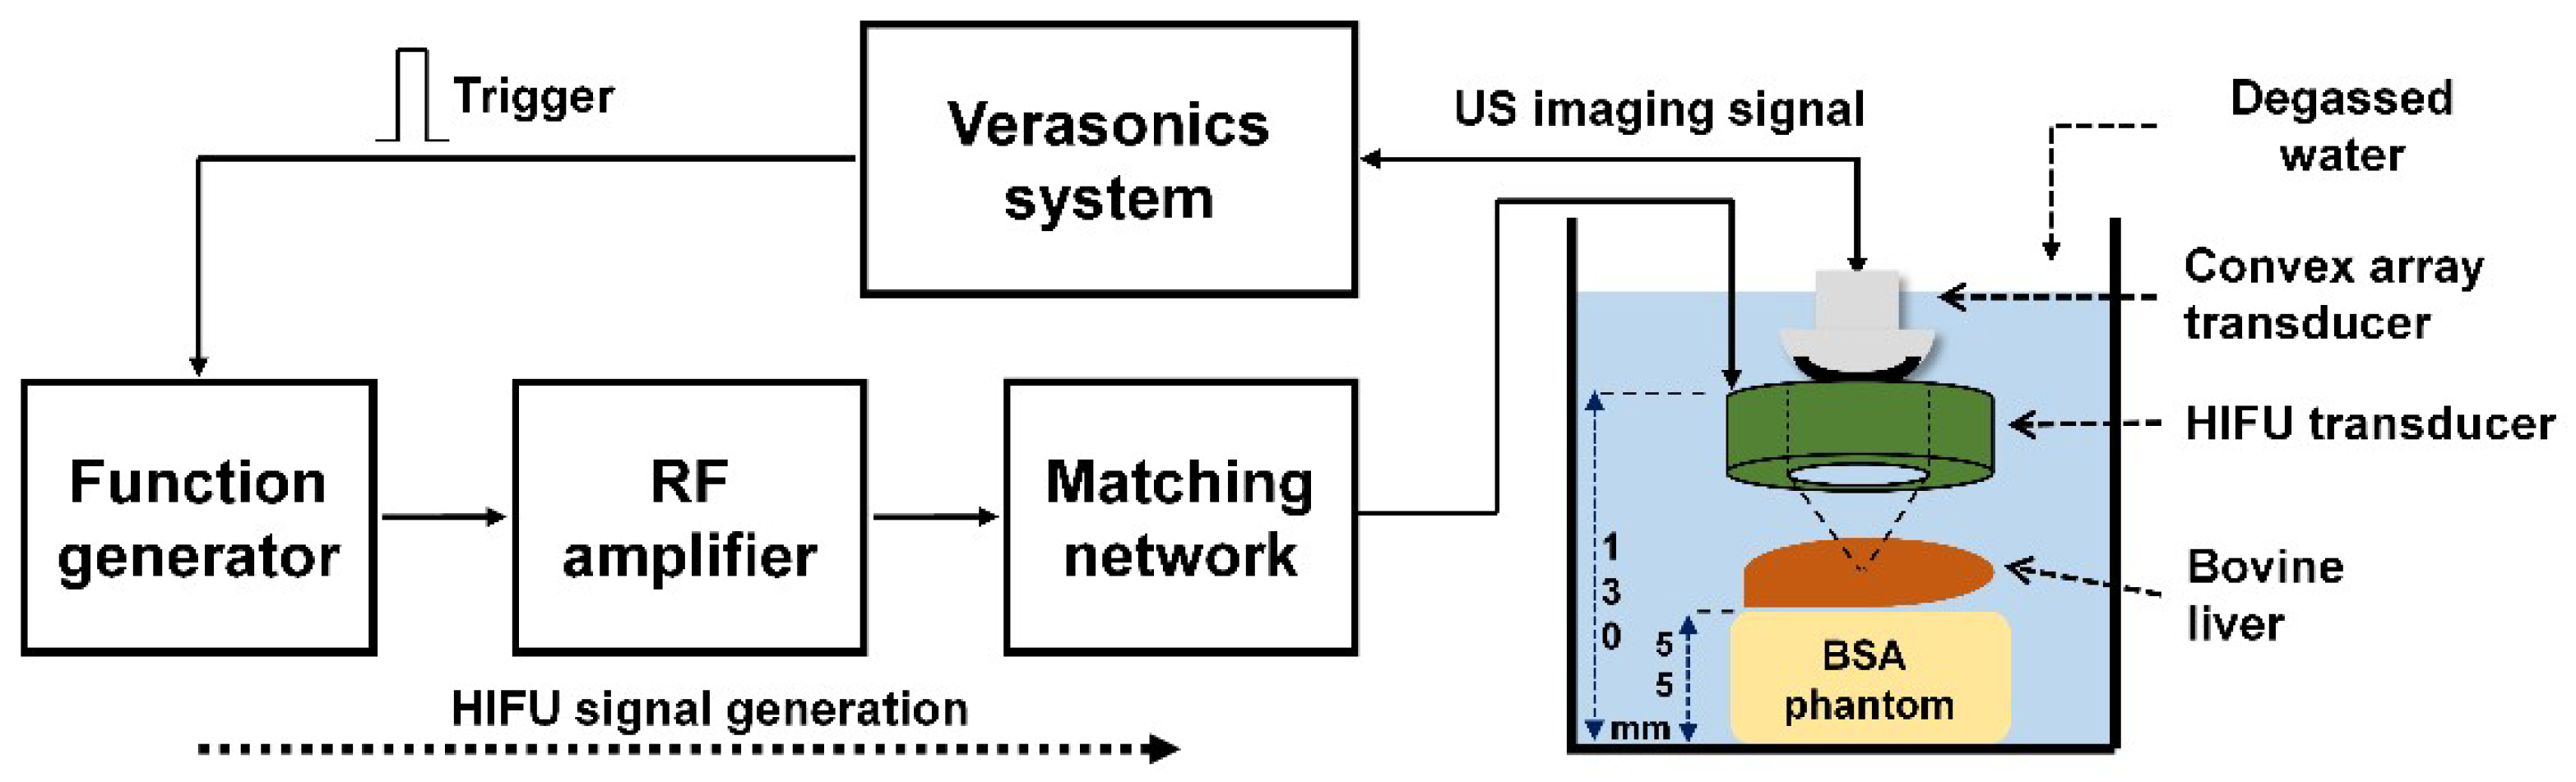
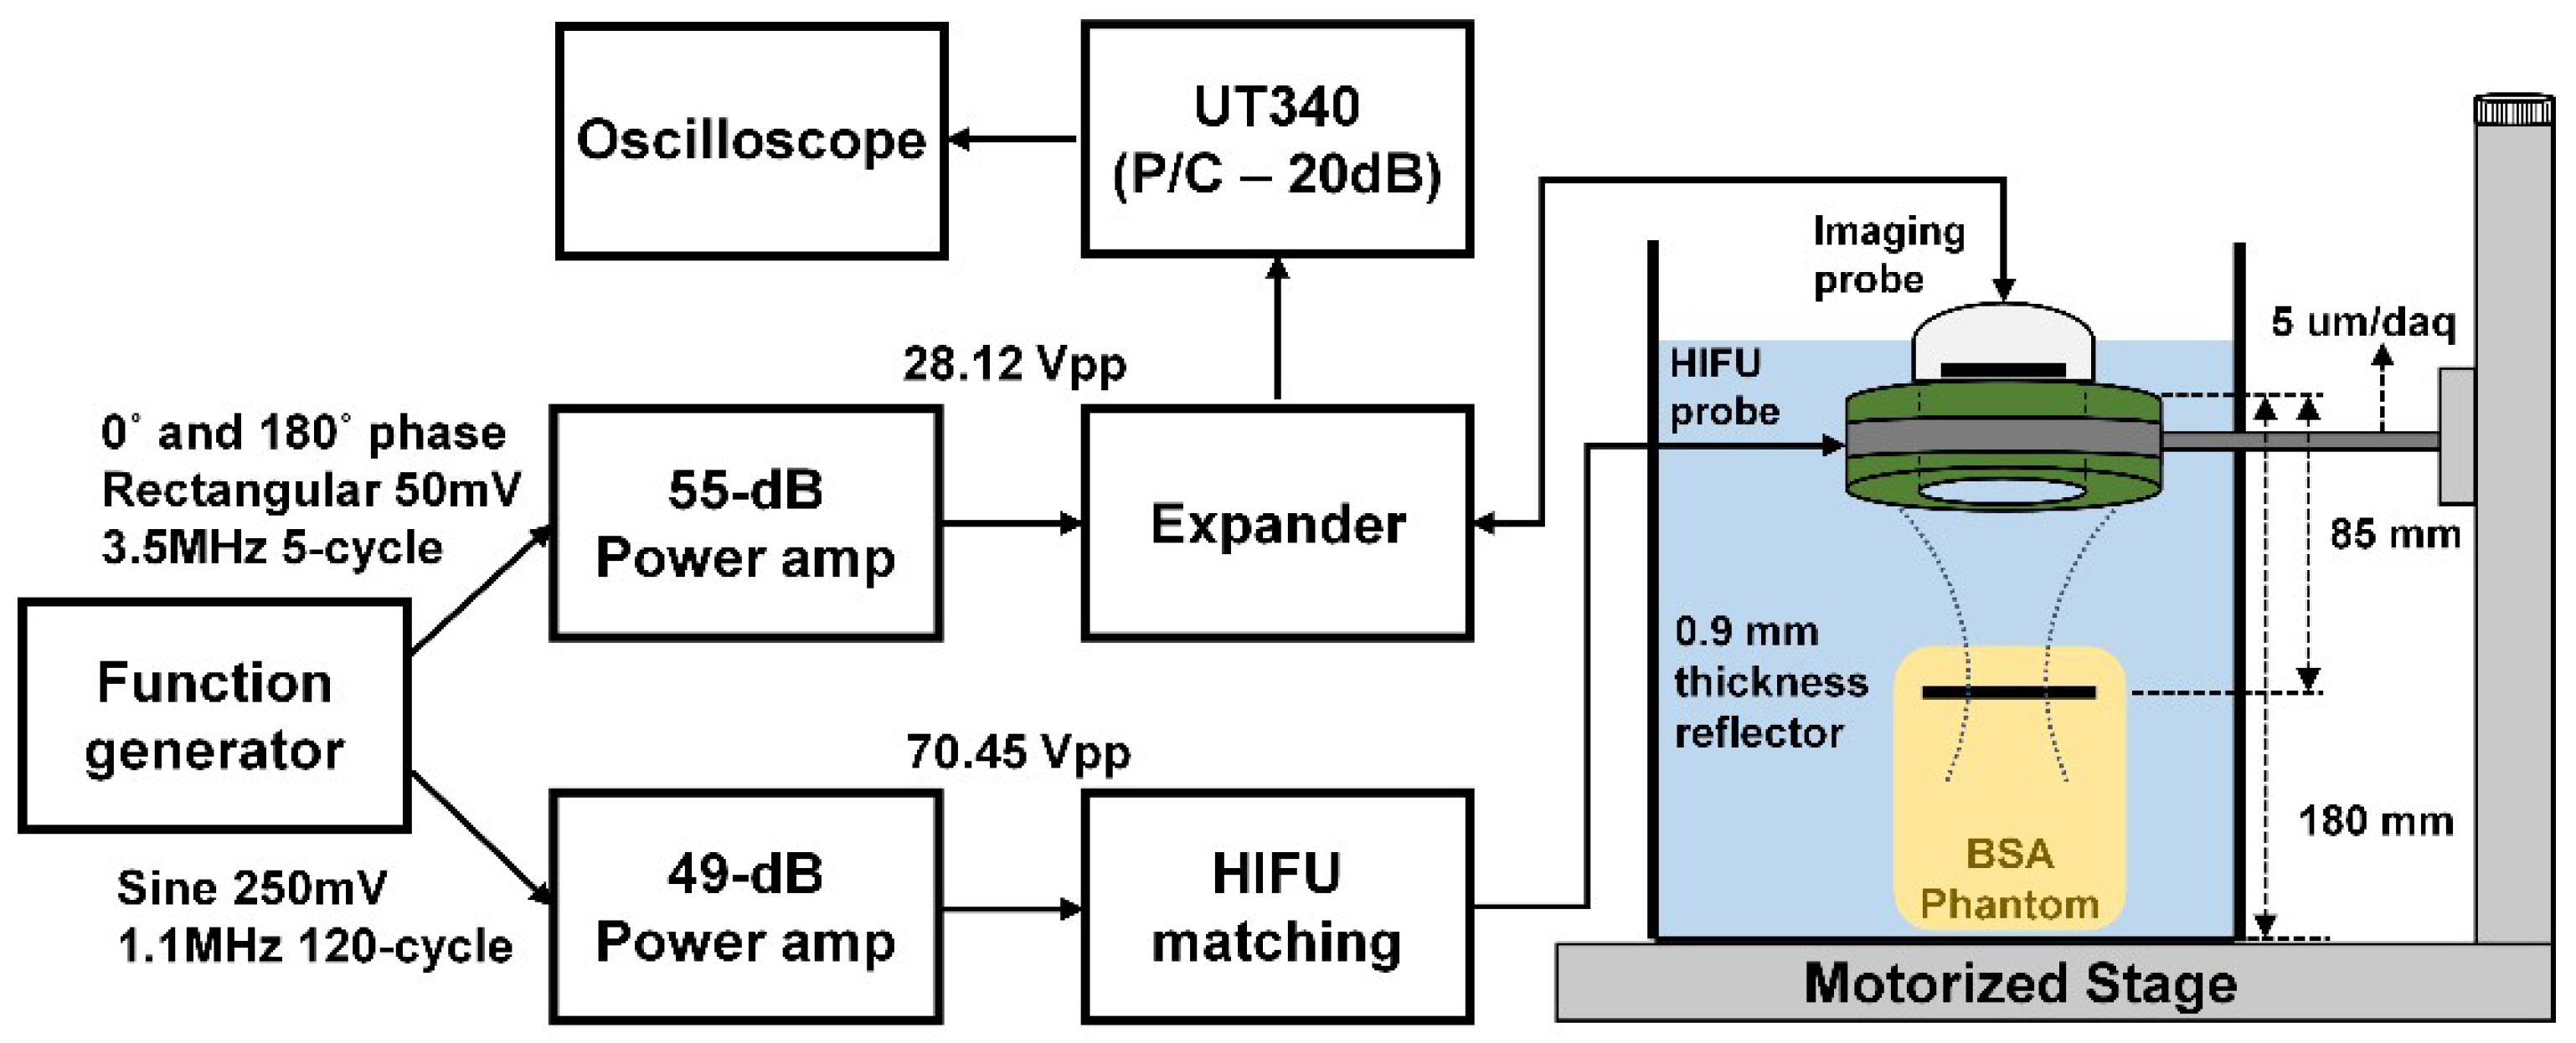
2.2. Experimental Arrangement
3. Results
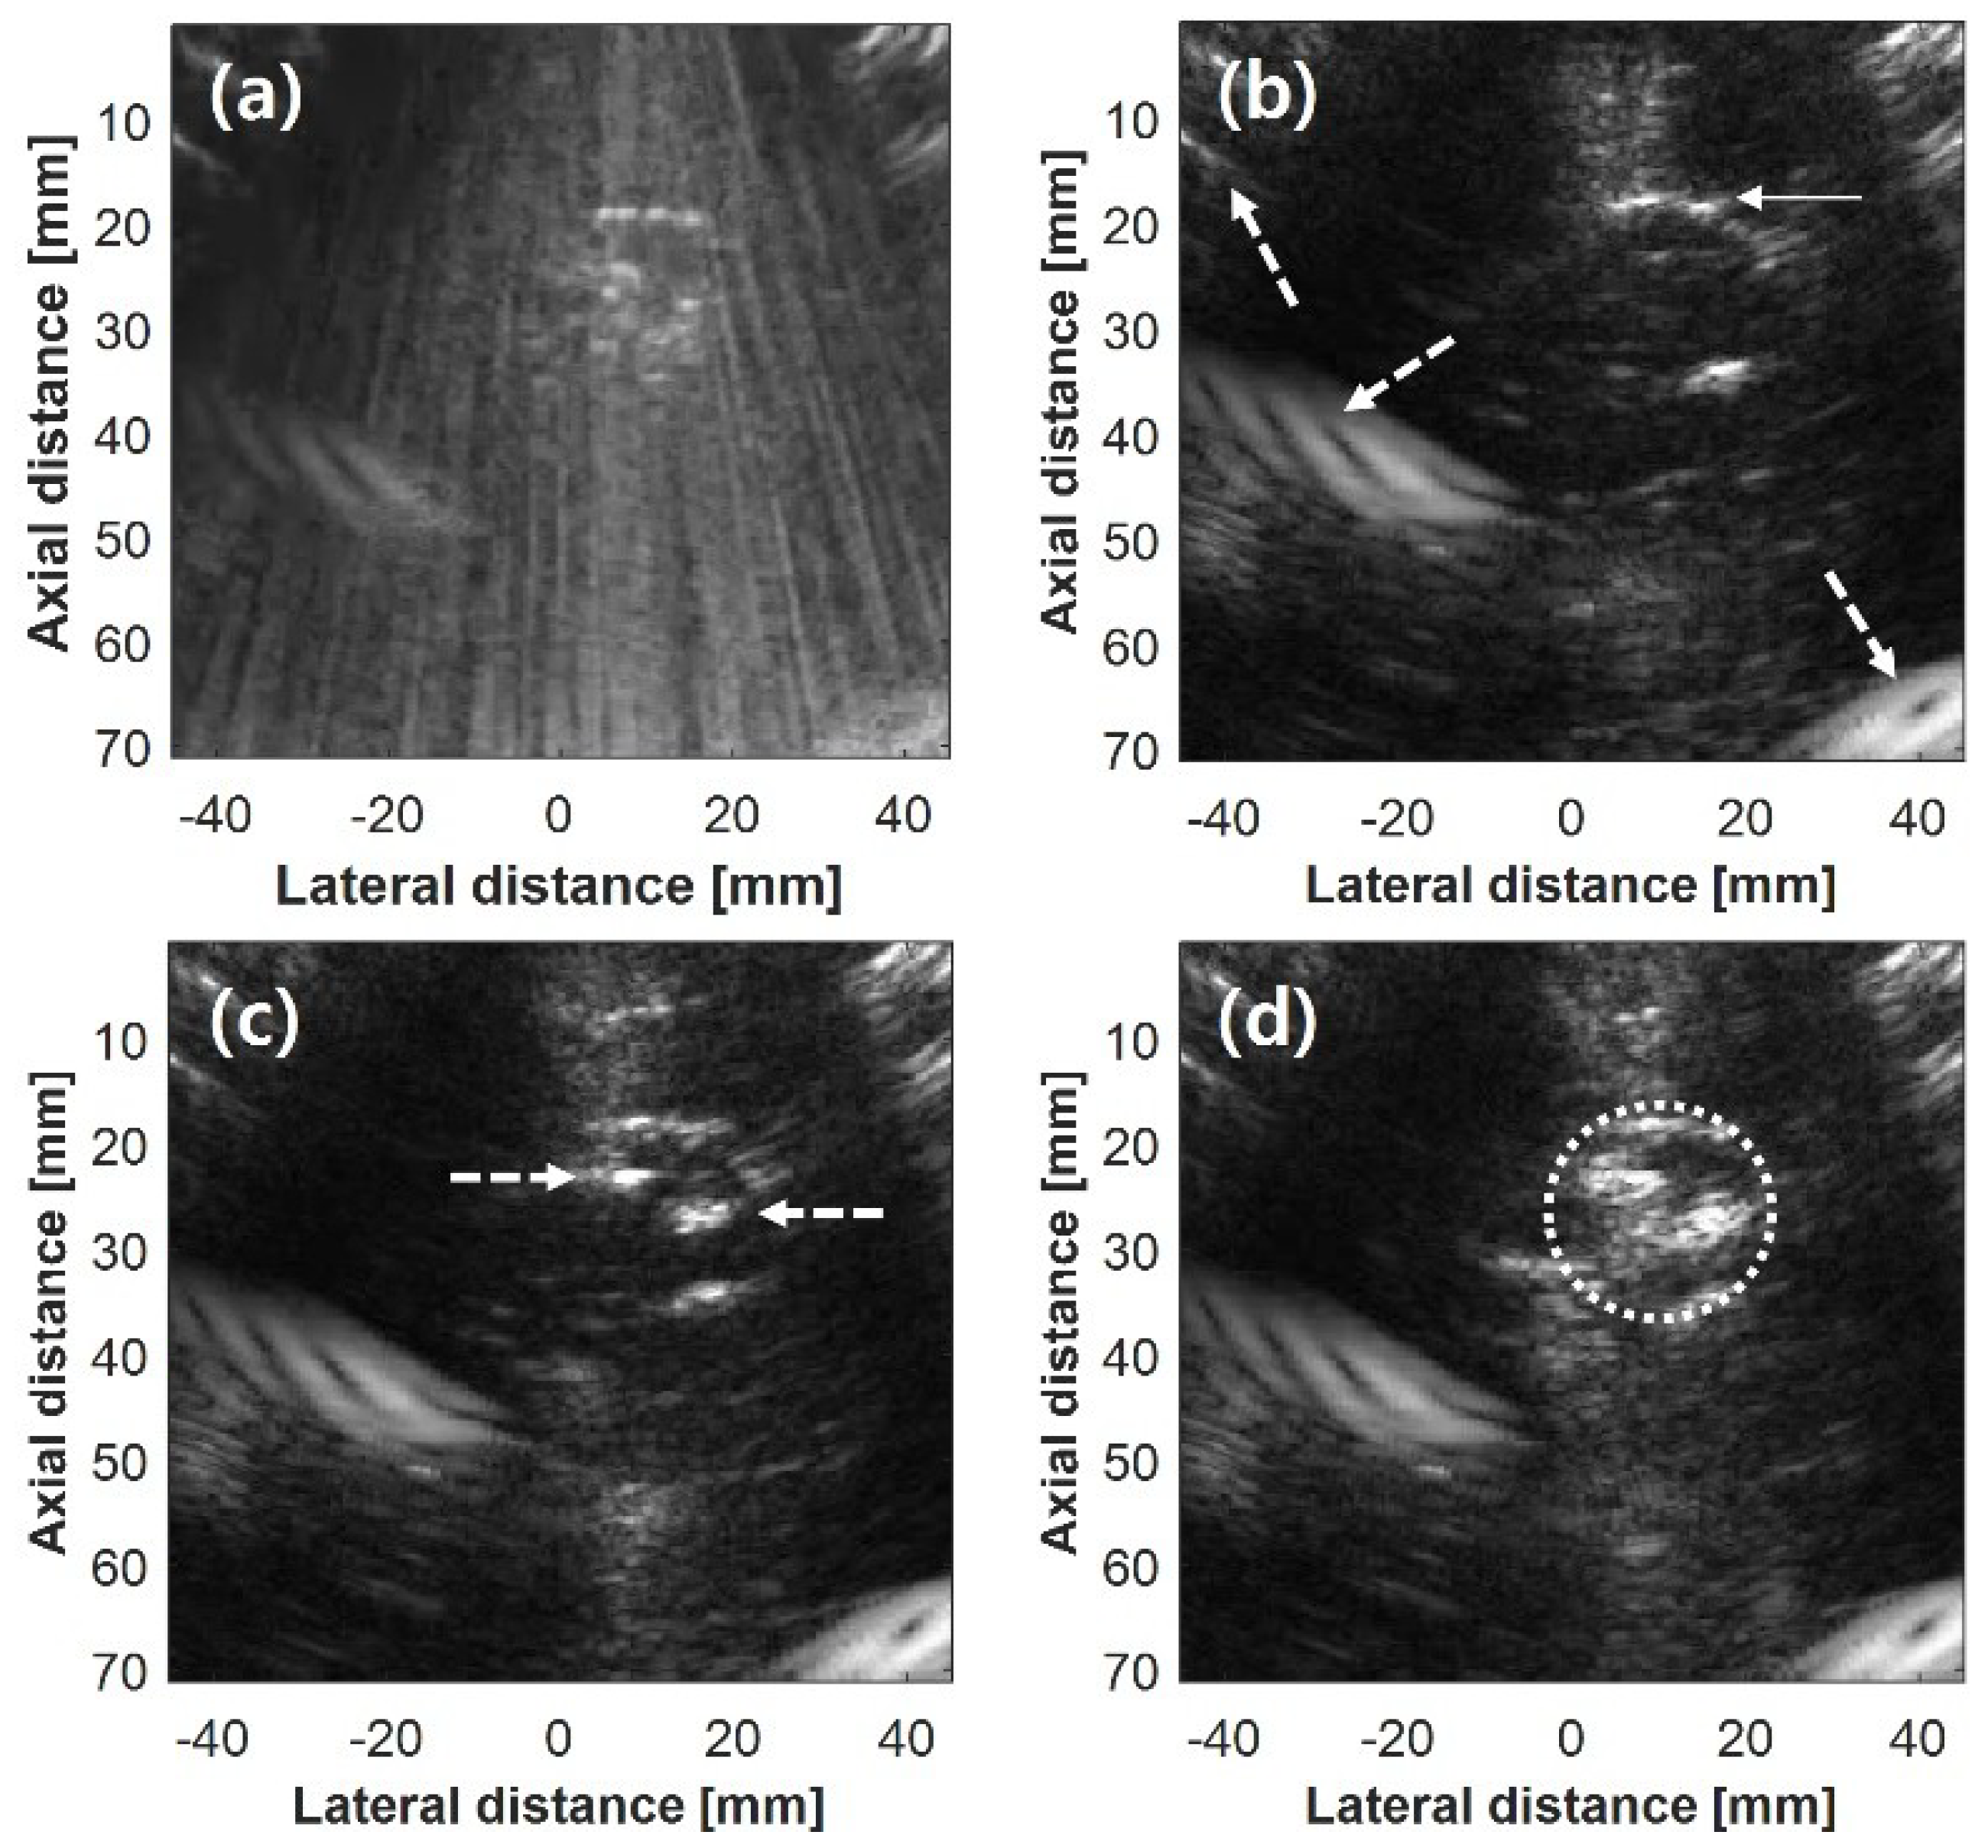
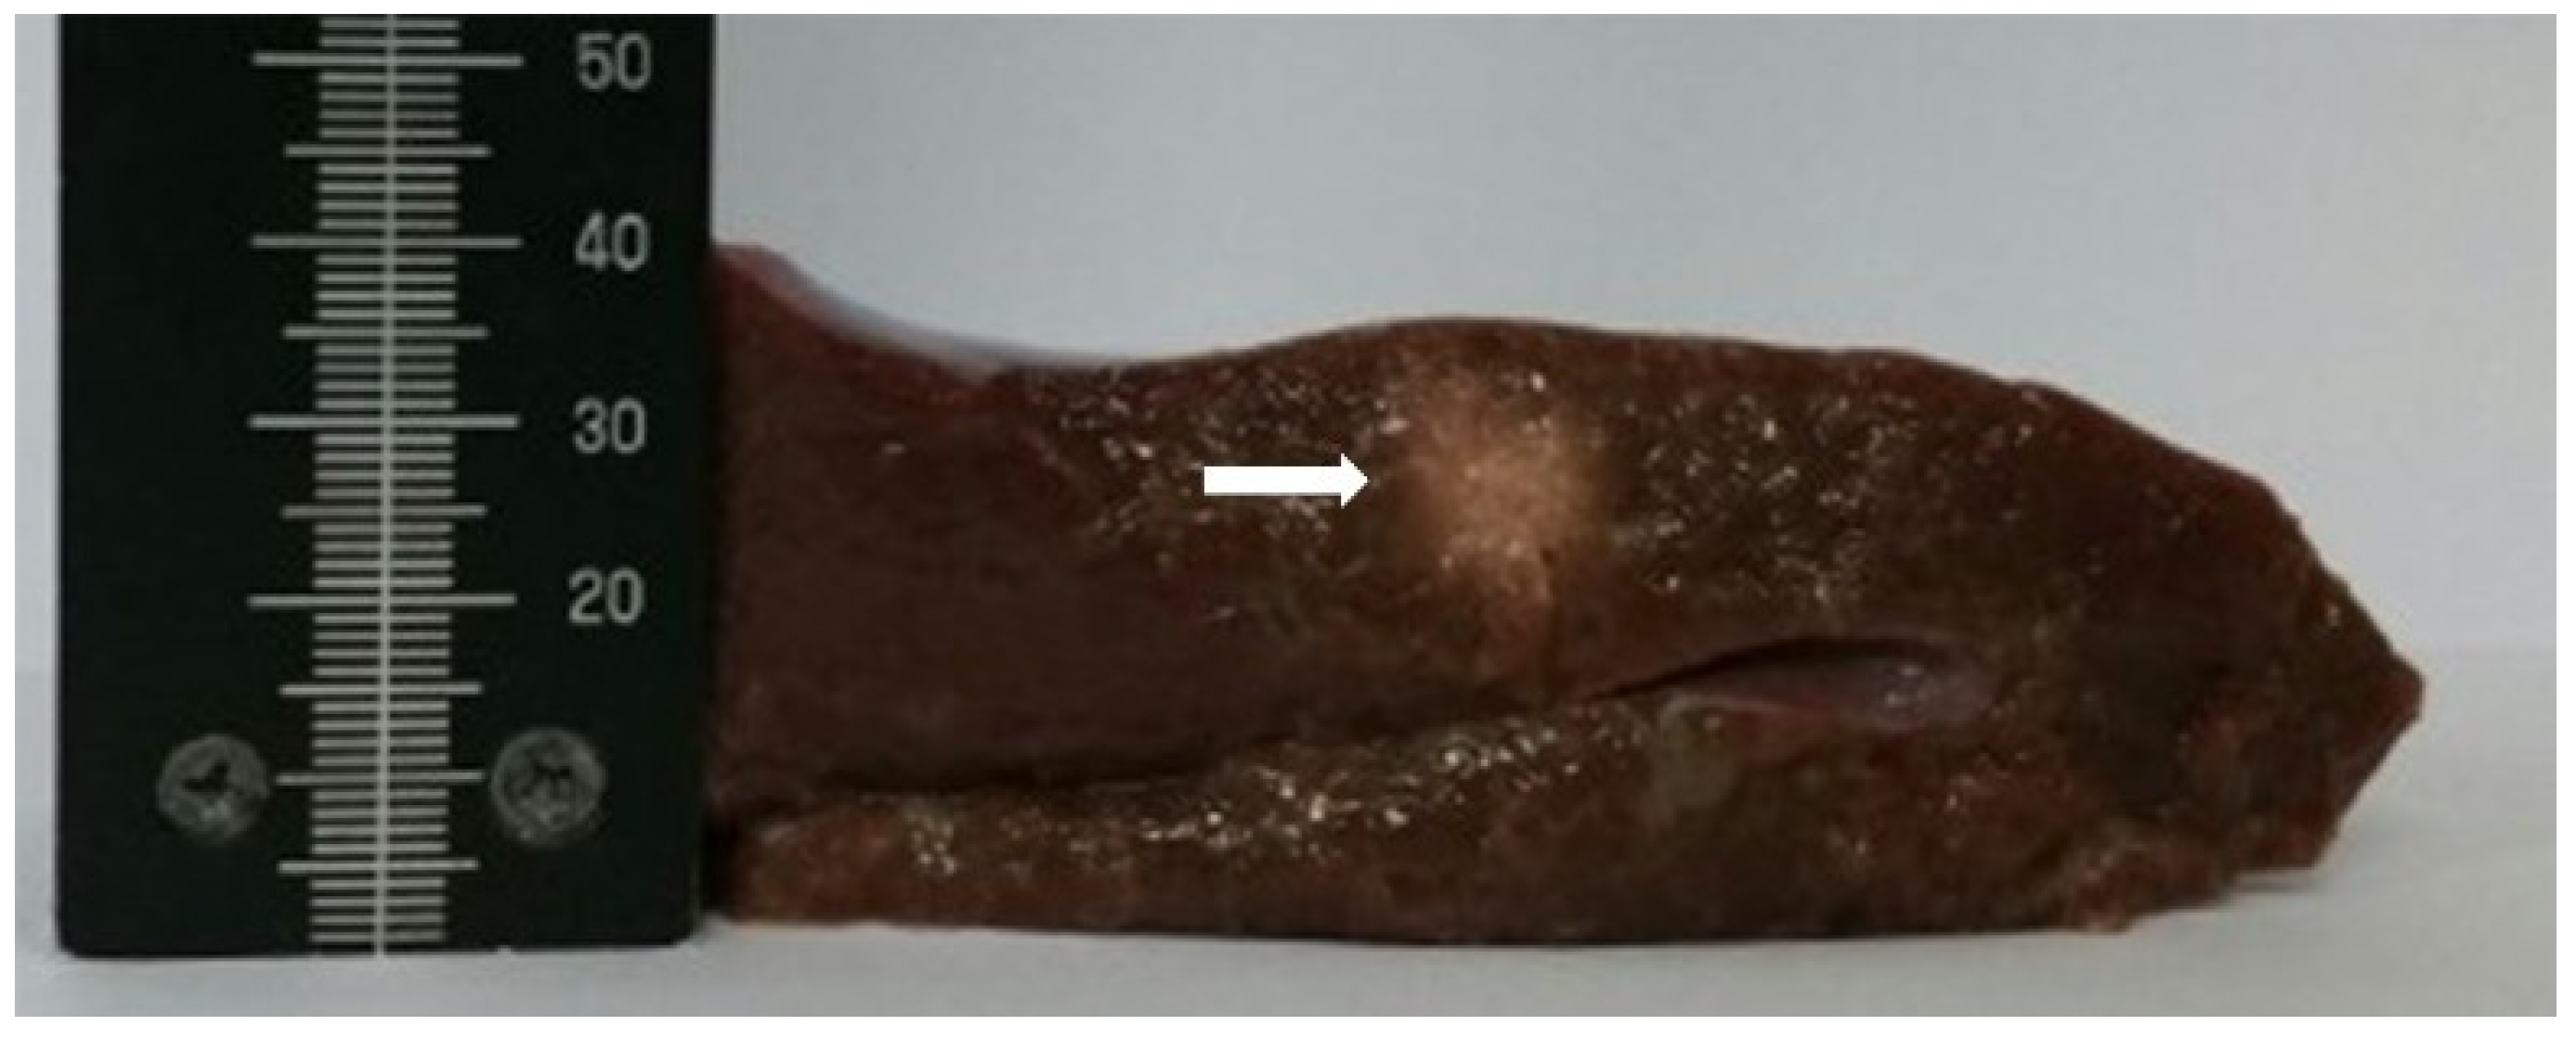
3.1. Real-Time HIFU Treatment Monitoring
3.2. Effect of Target Motion on the Performance of the Proposed Method
4. Discussion
5. Conclusions
Supplementary Materials
Author Contributions
Funding
Conflicts of Interest
References
- Leinenga, G.; Götz, J. Scanning ultrasound removes amyloid-β and restores memory in an Alzheimer’s disease mouse model. Sci. Transl. Med. 2015, 7, 278ra33. [Google Scholar] [CrossRef] [PubMed]
- Meng, Y.; Volpini, M.; Black, S.; Lozano, A.M.; Hynynen, K.; Lipsman, N. Focused ultrasound as a novel strategy for Alzheimer’s disease therapeutics. Ann. Neurol. 2017, 81, 611–617. [Google Scholar] [CrossRef] [PubMed]
- MacGregor, J.L.; Tanzi, E.L. Microfocused ultrasound for skin tightening. Semin. Cutan. Med. Surg. 2013, 32, 18–25. [Google Scholar] [PubMed]
- Jang, J.; Chang, J.H. Design and fabrication of double-focused ultrasound transducers to achieve tight focusing. Sensors 2016, 16, 1248. [Google Scholar] [CrossRef] [PubMed]
- Solovchuk, M.A.; Hwang, S.C.; Chang, H.; Thiriet, M.; Sheu, T.W.H. Temperature elevation by HIFU in ex vivo porcine muscle: MRI measurement and simulation study. Med. Phys. 2014, 41, 052903. [Google Scholar] [CrossRef] [PubMed]
- Liu, D.; Ebbini, E.S. Real-time 2-D temperature imaging using ultrasound. IEEE Trans. Biomed. Eng. 2010, 57, 12–16. [Google Scholar] [PubMed]
- Vaezy, S.; Shi, X.; Martin, R.W.; Chi, E.; Nelson, P.I.; Bailey, M.R.; Crum, L.A. Real-time visualization of high-intensity focused ultrasound treatment using ultrasound imaging. Ultrasound Med. Biol. 2001, 27, 33–42. [Google Scholar] [CrossRef]
- Wu, C.C.; Chen, C.N.; Ho, M.C.; Chen, W.S.; Lee, P.H. Using the acoustic interference pattern to locate the focus of a high-intensity focused ultrasound (HIFU) transducer. Ultrasound Med. Biol. 2008, 34, 137–146. [Google Scholar] [CrossRef] [PubMed]
- Kuroda, K. MR techniques for guiding high-intensity focused ultrasound (HIFU) treatments. J. Magn. Reson. Imaging 2018, 47, 316–331. [Google Scholar] [CrossRef] [PubMed]
- Tanter, M.; Pernot, M.; Aubry, J.F.; Montaldo, G.; Marquet, F.; Fink, M. Compensating for bone interfaces and respiratory motion in high-intensity focused ultrasound. Int. J. Hyperther. 2007, 23, 141–151. [Google Scholar] [CrossRef]
- Nandlall, S.D.; Jackson, E.; Coussios, C.C. Real-time passive acoustic monitoring of HIFU-induced tissue damage. Ultrasound Med. Biol. 2011, 37, 922–934. [Google Scholar] [CrossRef] [PubMed]
- Owen, N.R.; Bailey, M.R.; Hossack, J.; Crum, L.A. A method to synchronize high-intensity, focused ultrasound with an arbitrary ultrasound imager. IEEE Trans. Ultrason. Ferroelectr. Freq. Control 2006, 53, 645–650. [Google Scholar] [CrossRef] [PubMed]
- Pichardo, S.; Gelet, A.; Curiel, L.; Chesnais, S.; Chapelon, J.Y. New integrated imaging high intensity focused ultrasound probe for transrectal prostate cancer treatment. Ultrasound Med. Biol. 2008, 34, 1105–1116. [Google Scholar] [CrossRef] [PubMed]
- Jeong, J.S.; Chang, J.H.; Shung, K.K. Ultrasound transducer and system for real-time simultaneous therapy and diagnosis for noninvasive surgery of prostate tissue. IEEE Trans. Ultrason. Ferroelectr. Freq. Control 2009, 56, 1913–1922. [Google Scholar] [CrossRef] [PubMed]
- Jeong, J.S.; Chang, J.H.; Shung, K.K. Pulse compression technique for simultaneous HIFU surgery and ultrasonic imaging: A preliminary study. Ultrasonics 2012, 52, 730–739. [Google Scholar] [CrossRef] [PubMed]
- Song, J.H.; Yoo, Y.; Song, T.K.; Chang, J.H. Real-time monitoring of HIFU treatment using pulse inversion. Phys. Med. Biol. 2013, 58, 5333–5350. [Google Scholar] [CrossRef] [PubMed]
- Song, J.H.; Chang, J.H. An effective pulse sequence for simultaneous HIFU insonation and monitoring. IEEE Trans. Ultrason. Ferroelectr. Freq. Control 2014, 61, 1580–1587. [Google Scholar] [CrossRef] [PubMed]
- Ma, Q.; Ma, Y.; Gong, X.; Zhang, D. Improvement of tissue harmonic imaging using the pulse-inversion technique. Ultrasound Med. Biol. 2005, 31, 889–894. [Google Scholar] [CrossRef] [PubMed]
- Shen, C.C.; Chou, Y.H.; Li, P.C. Pulse inversion techniques in ultrasonic nonlinear imaging. J. Med. Ultrasound 2005, 13, 3–17. [Google Scholar] [CrossRef]
- Kim, H.; Kang, J.; Chang, J.H. Thermal therapeutic method for selective treatment of deep-lying tissue by combining laser and high-intensity focused ultrasound energy. Opt. Lett. 2014, 39, 2806–2809. [Google Scholar] [CrossRef] [PubMed]
- Chang, J.H.; Sun, L.; Yen, J.T.; Shung, K.K. Low-cost, high-speed back-end processing system for high-frequency ultrasound B-mode imaging. IEEE Trans. Ultrason. Ferroelectr. Freq. Control 2009, 56, 1490–1497. [Google Scholar] [CrossRef] [PubMed]
- Kim, H.; Chang, J.H. Increased light penetration due to ultrasound-induced air bubbles in optical scattering media. Sci. Rep. 2017, 7, 16105. [Google Scholar] [CrossRef] [PubMed]
- Shishitani, T.; Yoshizawa, S.; Umemura, S.I. Acoustic impedance evaluation of high-intensity-focused-ultrasound exposed chicken breast muscle using ultrasonic microscopy. Jpn. J. Appl. Phys. 2010, 49, 07HF04. [Google Scholar] [CrossRef]
- Kim, H.; Jo, G.; Chang, J.H. Ultrasound-assisted photothermal therapy and real-time treatment monitoring. Biomed. Opt. Express 2018, 9, 4472–4480. [Google Scholar] [CrossRef]
- Abbass, M.A.; Killin, J.K.; Mahalingam, N.; Hooi, F.M.; Barthe, P.G.; Mast, T.D. Real-time spatiotemporal control of high-intensity focused ultrasound thermal ablation using echo decorrelation imaging in ex vivo bovine liver. Ultrasound Med. Biol. 2018, 44, 199–213. [Google Scholar] [CrossRef] [PubMed]
- Abbass, M.A.; Garbo, A.J.; Mahalingam, N.; Killin, J.K.; Mast, T.D. Optimized echo decorrelation imaging feedback for bulk ultrasound ablation control. IEEE Trans. Ultrason. Ferroelectr. Freq. Control 2018, 65, 1743–1755. [Google Scholar] [CrossRef] [PubMed]
- Shen, C.C.; Li, P.C. Motion artifacts of pulse inversion-based tissue harmonic imaging. IEEE Trans. Ultrason. Ferroelectr. Freq. Control 2002, 49, 1203–1211. [Google Scholar] [CrossRef] [PubMed]
- Kim, K.S.; Hwang, J.S.; Jeong, J.S.; Song, T.K. An efficient motion estimation and compensation method for ultrasound synthetic aperture imaging. Ultrason. Imaging 2002, 24, 81–99. [Google Scholar] [CrossRef] [PubMed]
- Davies, S.C.; Hill, A.L.; Holmes, R.B.; Halliwell, M.; Jackson, P.C. Ultrasound quantitation of respiratory organ motion in the upper abdomen. Br. J. Radiol. 1994, 67, 1096–1102. [Google Scholar] [CrossRef] [PubMed]


| Condition | Moving Distance (μm) | Magnitude (dB) | |||
|---|---|---|---|---|---|
| 1.1 MHz | 2.2 MHz | 3.3 MHz | 4.4 MHz | ||
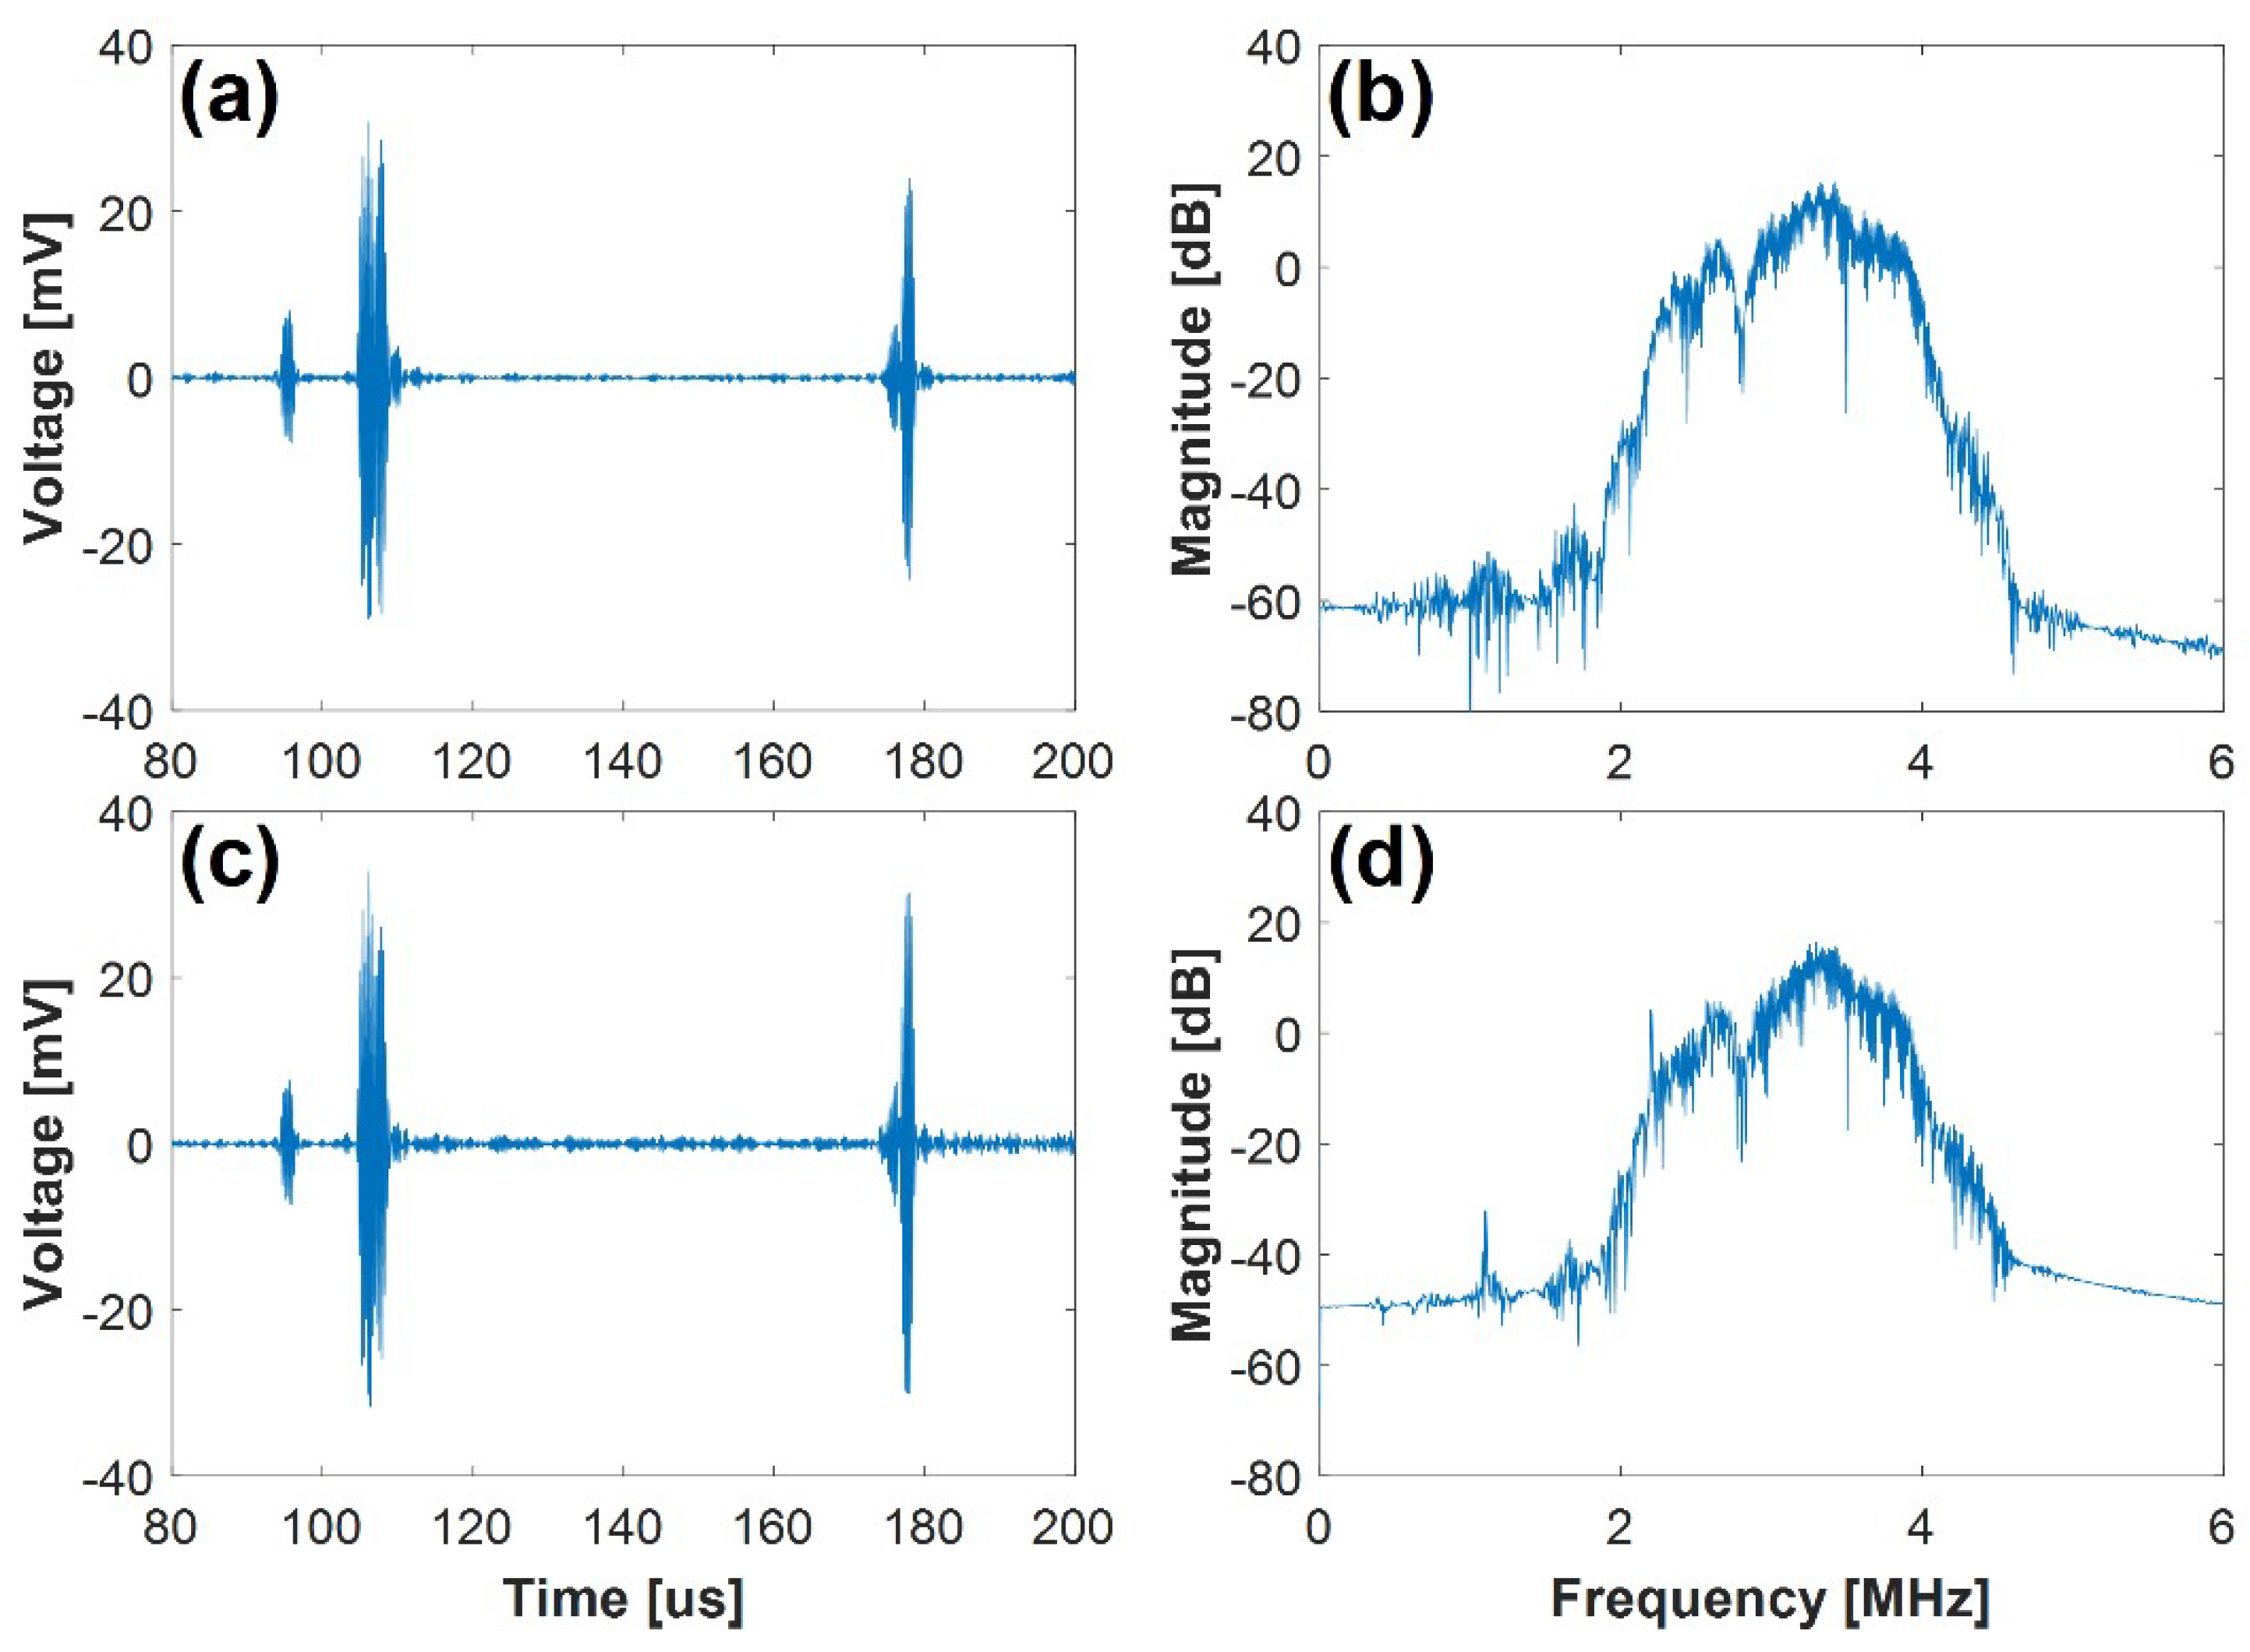
| Ultrasound Only | - | −54.32 | −13.92 | 15.25 | −40.84 |
| Ultrasound + HIFU | 0 | −32.10 | 4.06 | 16.37 | −26.78 |
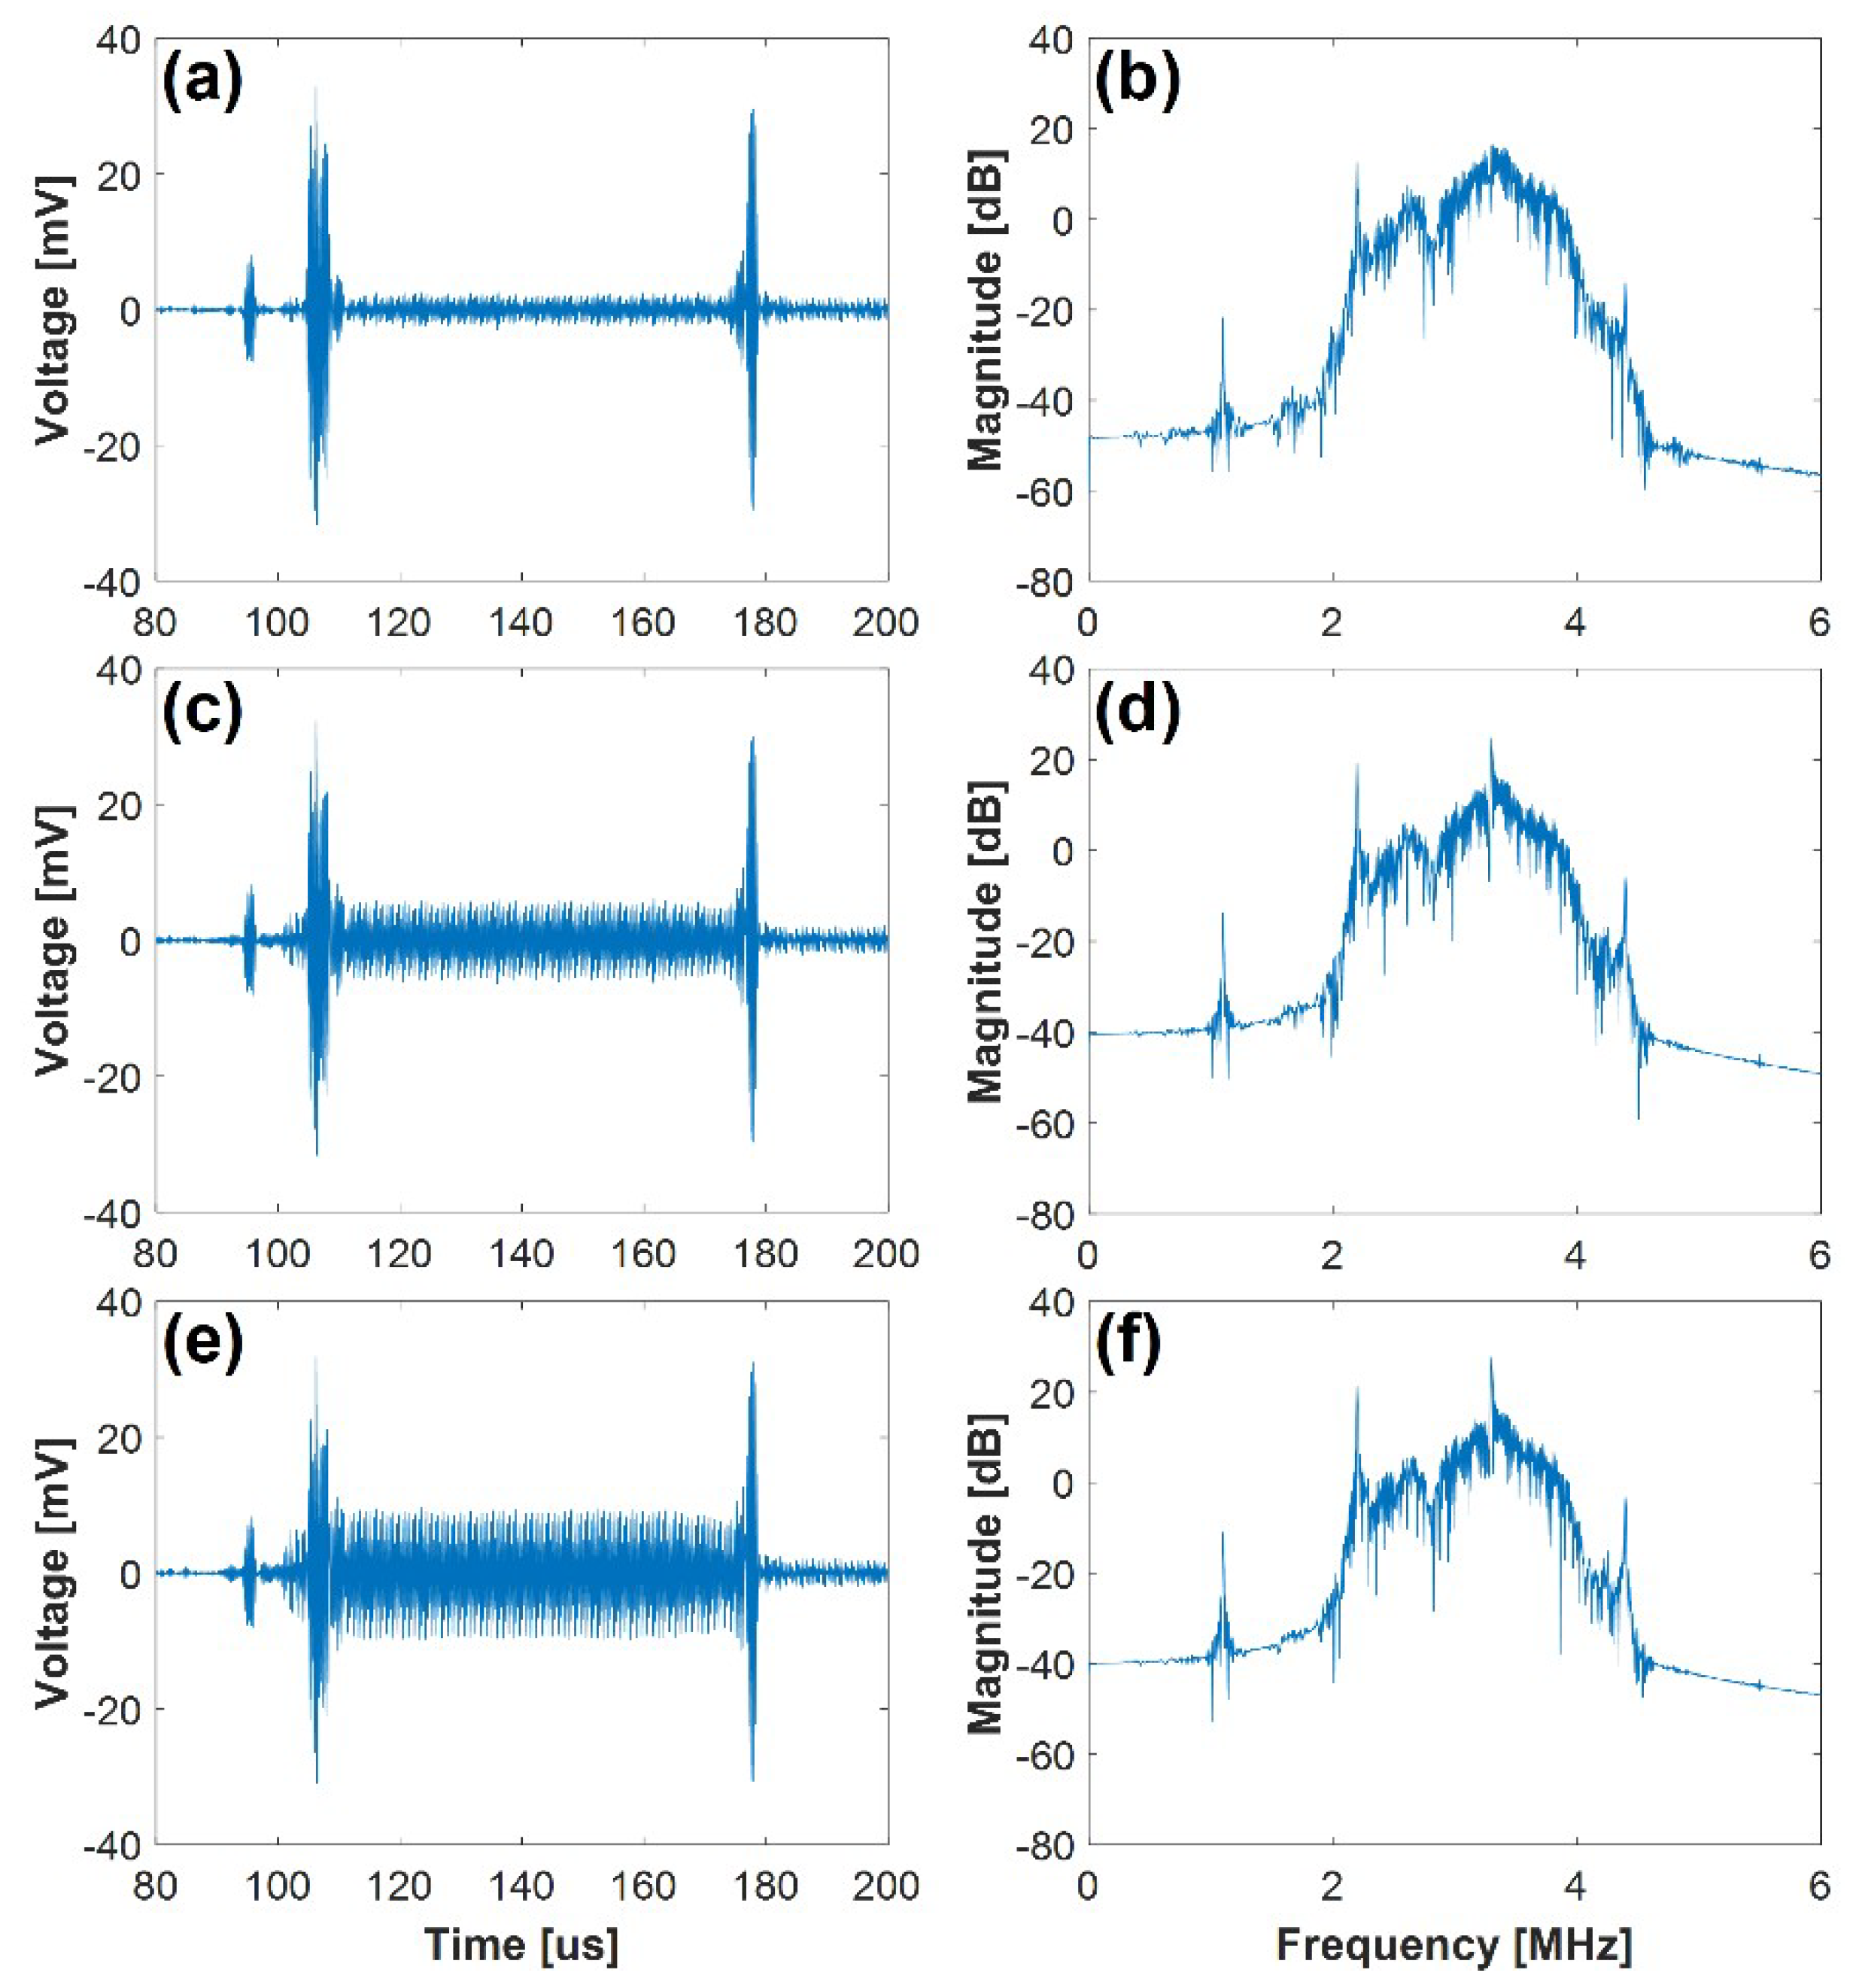
| 10 (0.071λ) | −21.80 | 12.64 | 16.29 | −14.23 | |
| 30 (0.214λ) | −13.79 | 19.24 | 24.72 | −5.93 | |
| 50 (0.357λ) | −11.08 | 21.34 | 27.73 | −3.26 | |
| 100 (0.714λ) | −4.84 | 26.12 | 34.17 | 2.86 | |
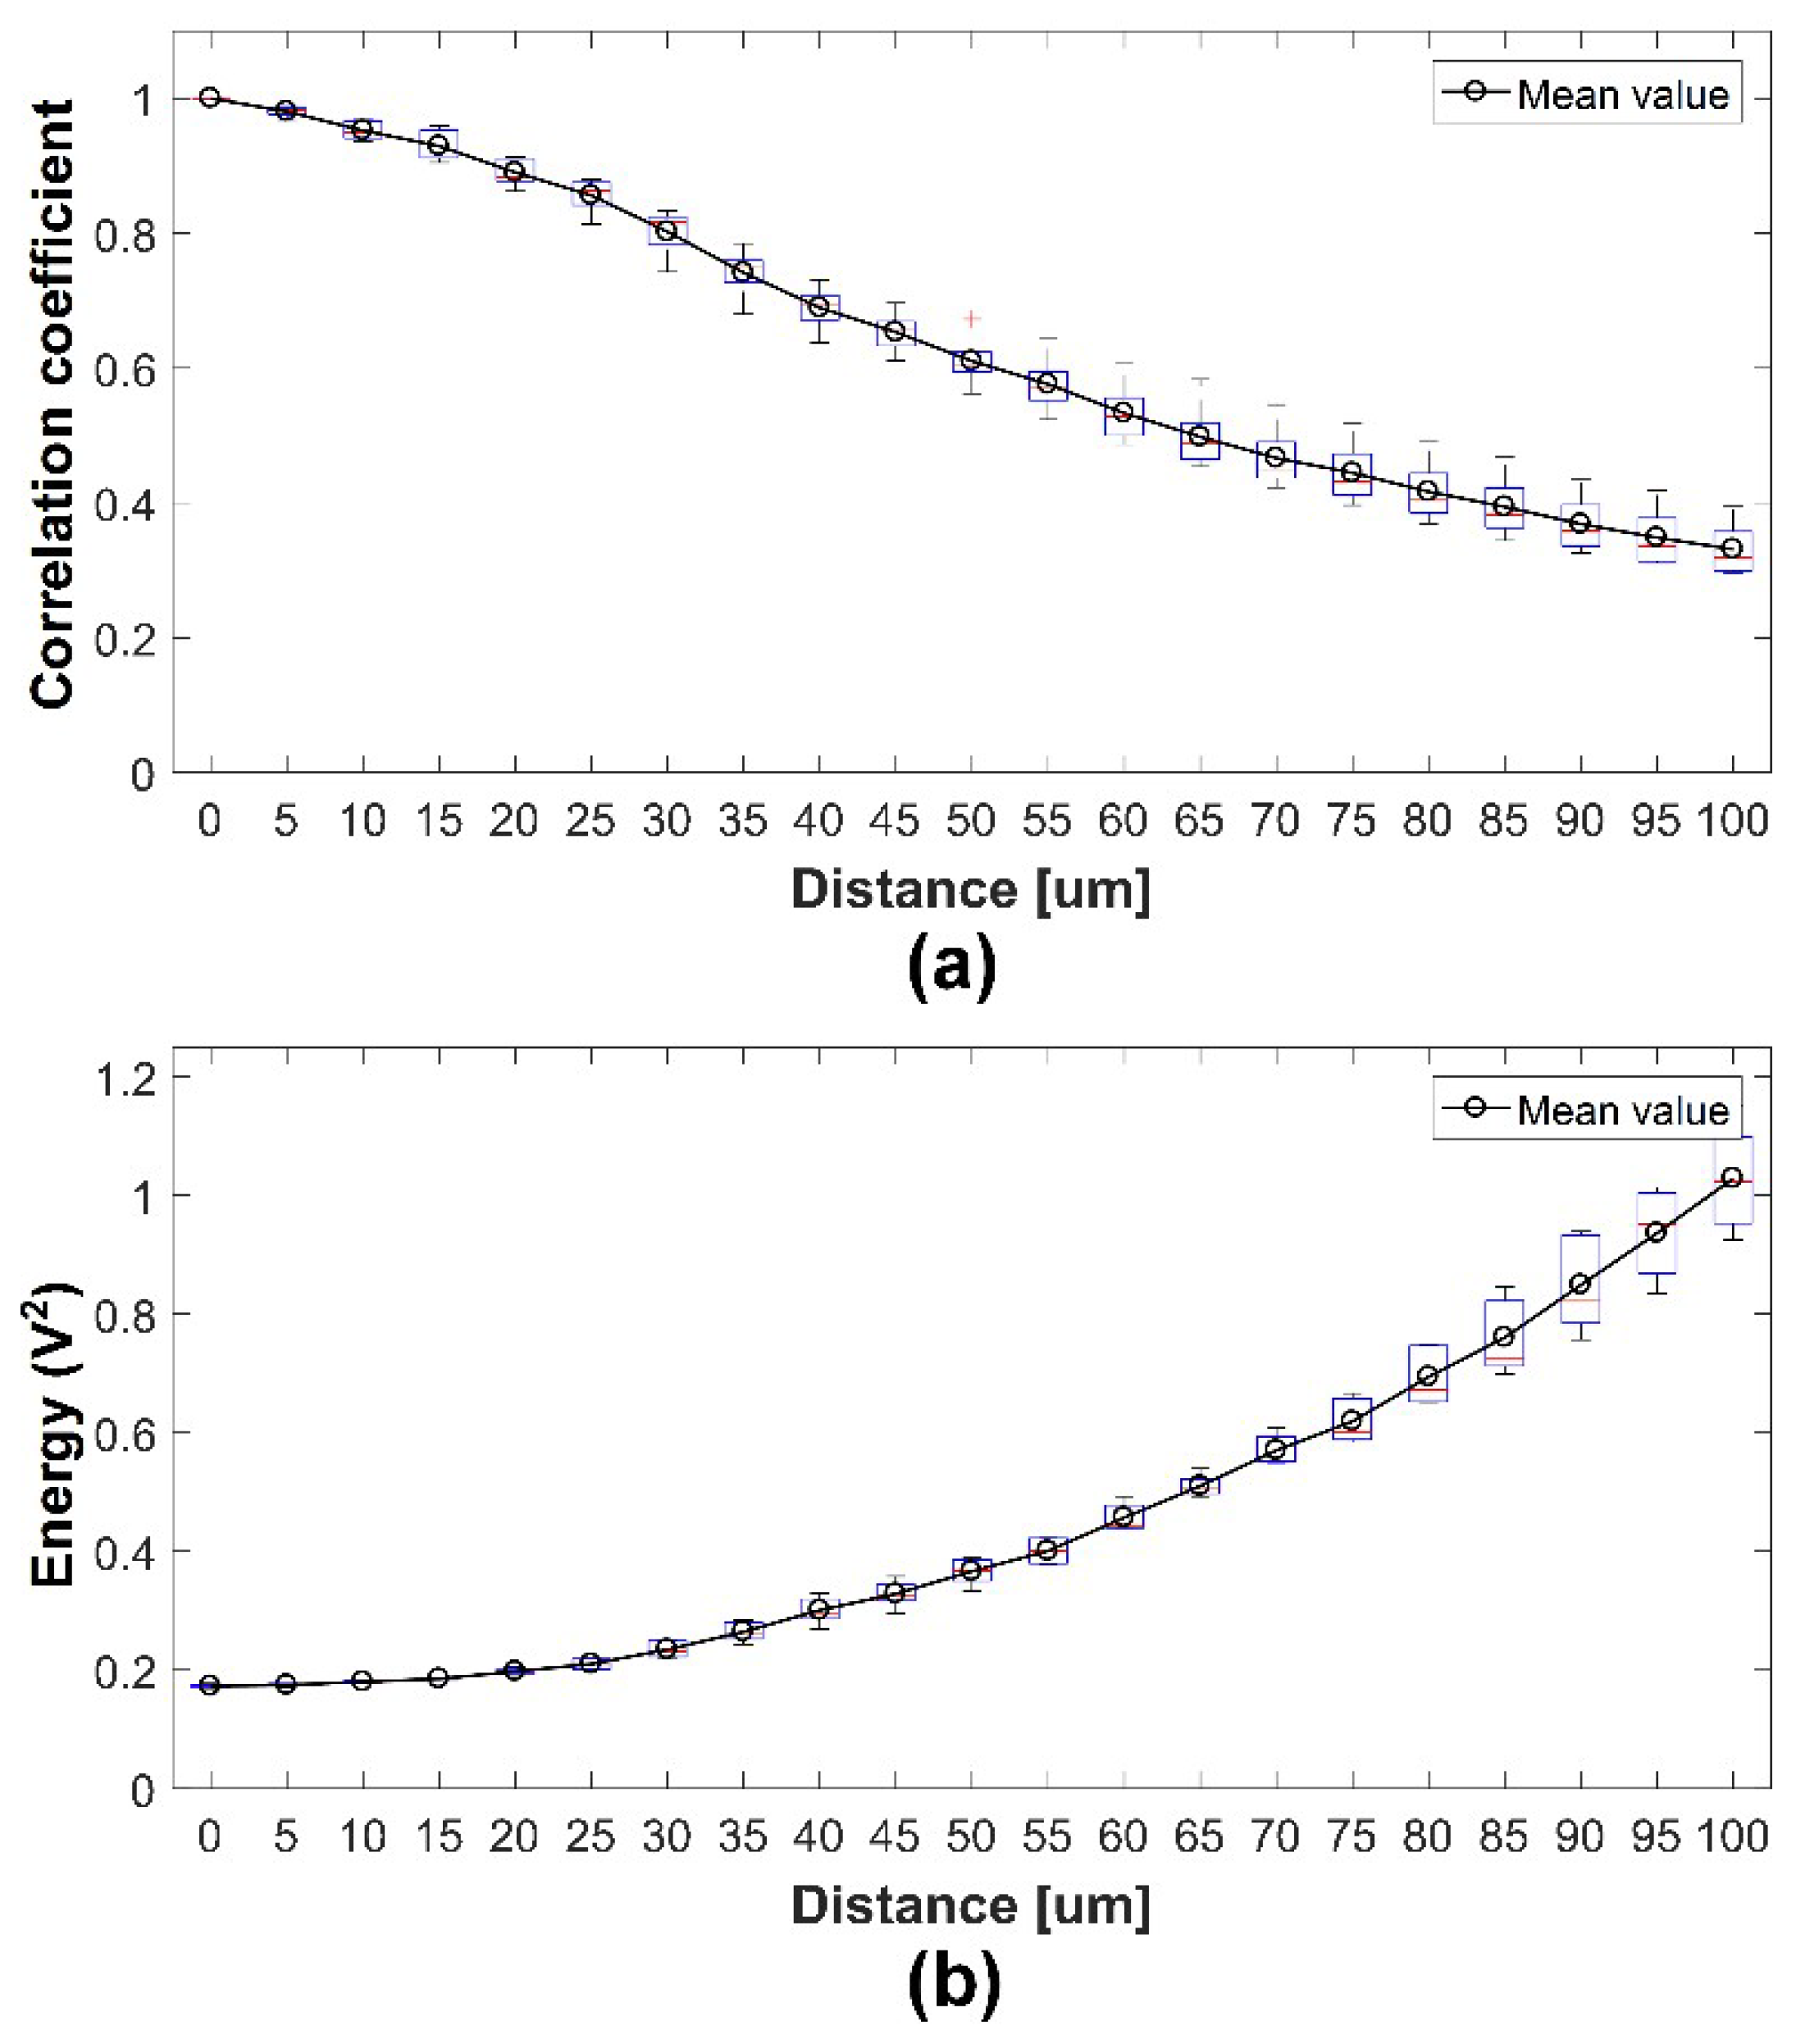
| Moving Distance (μm) | |||||
|---|---|---|---|---|---|
| 0 | 10 (0.071λ) | 30 (0.214λ) | 50 (0.357λ) | 100 (0.714λ) | |
| Correlation | 1.000 ± 0.005 | 0.952 ± 0.014 | 0.802 ± 0.046 | 0.643 ± 0.035 | 0.331 ± 0.034 |
| Energy | 0.173 ± 0.003 | 0.180 ± 0.003 | 0.234 ± 0.015 | 0.366 ± 0.023 | 1.029 ± 0.091 |
© 2018 by the authors. Licensee MDPI, Basel, Switzerland. This article is an open access article distributed under the terms and conditions of the Creative Commons Attribution (CC BY) license (http://creativecommons.org/licenses/by/4.0/).
Share and Cite
Shin, E.-J.; Kang, B.; Chang, J.H. Real-Time HIFU Treatment Monitoring Using Pulse Inversion Ultrasonic Imaging. Appl. Sci. 2018, 8, 2219. https://doi.org/10.3390/app8112219
Shin E-J, Kang B, Chang JH. Real-Time HIFU Treatment Monitoring Using Pulse Inversion Ultrasonic Imaging. Applied Sciences. 2018; 8(11):2219. https://doi.org/10.3390/app8112219
Chicago/Turabian StyleShin, Eui-Ji, Byungwoo Kang, and Jin Ho Chang. 2018. "Real-Time HIFU Treatment Monitoring Using Pulse Inversion Ultrasonic Imaging" Applied Sciences 8, no. 11: 2219. https://doi.org/10.3390/app8112219
APA StyleShin, E.-J., Kang, B., & Chang, J. H. (2018). Real-Time HIFU Treatment Monitoring Using Pulse Inversion Ultrasonic Imaging. Applied Sciences, 8(11), 2219. https://doi.org/10.3390/app8112219