1. Introduction
In industrial applications, highly stressed components are easily damaged by cyclic loads if there is no surface hardening [
1]. Utilizing the peening process, the residual tensile stress of manufactured workpiece can be removed and the surface hardness can be increased [
2], leading to the extension of the working life of the workpiece. Peening processes can be mainly divided into two types: shot peening and shotless peening. Shot peening has been widely used in industrial applications [
3] due to inexpensiveness and easy operation. However, after shot peening the high surface roughness and the surface deterioration are generated. To avoid these disadvantages, shotless peening processes, such as laser shock peening [
4], water cavitation jet peening [
5] are developed. The shotless peening processes require skilled operators and complicated equipment. To achieve good surface properties after peening treatment with simple equipment, traditional ultrasonic cavitation peening process has been developed and reported in recent decades.
In 1987, Takahashi et al. [
6] first attempted to develop an ultrasonic device for metal working and surface treatment. Each piece was exposed to ultrasonic cavitation with the standoff distance (gap width between sonotrode and specimen) of 0.3 mm and at a resonance frequency of 15 kHz. As a result, both the hardness and the erosion resistance were improved. At the same time, the fatigue limit increased by about 11%. Mathias et al. [
7] found that the plastic deformation of the material is mainly introduced by shock waves. They also found that the generation of residual stress caused by ultrasonic cavitation is not significantly different from the changes caused by flow cavitation. The effect of water temperature on residual stress was studied with the temperature interval of 15 °C. The results show that when the temperature is less than 65 °C, the values of residual stress are more or less identical [
8]. Kim et al. [
9] studied the effects of temperature and vibration amplitude on the damage behaviour in seawater using ultrasonic cavitation as well. They presented that the higher temperatures were associated with higher corrosion. Toh [
10] tried to address the burrs and induce residual stress after machining utilizing ultrasonic cavitation peening. It was found that sonication at 40 kHz has the most significant influence on reducing the formation of burr height. However, the best surface qualities are time dependent and the time has to be determined experimentally for every workpiece [
11]. To investigate effects of the fatigue properties, a stainless-steel sheet with the thickness of 0.1 mm was treated by ultrasonic cavitation peening [
12]. During this peening process, the fatigue limit increased by about 10% while the surface roughness slightly decreased as a result of the peening. Later, they used a piezoelectric force sensor to study the effect within the standoff distance range of 0.5–4 mm [
13]. It was found that the impact force caused by the collapses of cavitation bubbles was independent of the vibration amplitude and the sonotrode with the concave of 4 mm radii generated the largest impact. A block type horn designed to peen stainless steel workpiece surface was developed by Nakagawa et al. [
14]. The area of the compressive residual stress on the stainless steel workpiece is larger but the stress distribution was not homogenous. Gao et al. [
15] found that with the vibration amplitude of approximately 20 µm the hardness of stainless steel and nickel alloy surfaces increases by ~18% and ~20%, respectively. Bai et al. [
16,
17] found that when the standoff distance is smaller than 1 mm, the influence of cavitation bubbles on transducer is less than that at other standoff distances and there is an optimal standoff distance corresponding to the input power. The improvements of the surface hardness of stainless steel and aluminium alloy by ultrasonic cavitation peening were investigated as well [
18]. They utilized the surface plastic deformation method to estimate the optimal process time. It was found that the optimal process time is before the end of the incubation period. Jung et al. [
19] explored the improvement of the properties of deep notches by ultrasonic cavitation peening both theoretically and experimentally. Most cavitation bubbles near the notch tip during the process were observed. The improvement of residual stress near the notch tip was obtained as well. Therefore, it is indicated that the converging geometry of the notch shape is advantageous for ultrasonic cavitation peening.
In the above mentioned studies, traditional ultrasonic cavitation peening makes use of the advantage of the incubation period during the cavitation erosion process [
20], which results in small mass loss and much plastic deformation. This surface enhancement process is considered as an environmentally friendly technology since no polluted water is produced except the recycled metal oxide powder [
21]. Additionally, this method is inexpensive to perform and is completed in only one step. Therefore, it has not only the positive aspects of ultrasonic technology [
22,
23] but also has the advantage of cavitation to metal surfaces.
However, during the traditional ultrasonic cavitation peening process the workpieces have to be placed in a water container and immersed in water. Meanwhile, a temperature control is necessary since the dynamics of cavitation bubbles are greatly influenced by the fluid temperature. In order to overcome these disadvantages, a novel ultrasonic cavitation peening approach is developed and described in this paper. This approach has potential applications in highly stressed components, for example, axles of trains, gears, shafts of cars, aircrafts, and so forth. To evaluate treatment effectiveness of the novel process, a piezoelectric sensor is used to measure the impact loads introduced by the collapses of cavitation bubbles. The topographies of treated specimens are observed by a microscope. The roughness and hardness after treatment are measured as well.
2. Working Theory
During ultrasonic cavitation peening, shock wave and micro-jet are generated on the treated surfaces due to the collapse of bubbles. Generally, small standoff distance is beneficial for the treatment process as a result of less attenuation. When the standoff distance is very small, the water stays in the small gap and surrounds the tip of the sonotrode due to surface tension of the water. If the sonotrode vibrates up and down, a great many cavitation bubbles are generated in the gap. Based on this theory, the workpieces no longer need to be put in a water container during the novel ultrasonic cavitation peening process. To compensate for the water loss during cavitation, a water jet is utilized to provide the necessary water. With the constant supply of the water, the small gap will be full of water and the tip end of the sonotrode is surrounded by a water film even when the sonotrode works for a long treatment time. Since the water jet is only utilized for assist, slow velocity and low pressure of the water jet is required during the novel ultrasonic cavitation peening process. Here, tap water can be used directly, which means that no additional equipment is required to generate the water jet. During the novel ultrasonic cavitation peening process, many cavitation bubbles are excited in the small gap by the vibration of the sonotrode. After the collapses of the bubbles, micro jets and shock waves are produced, which leads to the generation of impact loads on the specimen surfaces. Due to the impact loads, plastic deformation occurs on the treated surfaces. Consequently, hardness and compressive residual stress are significantly enhanced as desired.
To the best of our knowledge, this is the first time that ultrasonic cavitation assisted by water jet has been utilized to treat workpiece surfaces. This novel process has two main advantages: there are no limitations on workpiece size and geometry since the sonotrode can treat any surface that it can reach; a temperature control is not necessarily due to the continuous supply of water. The temperature should be kept nearly the same temperature as that of the injected water. Since the speed of the injected water is very slow, the tap water can be used directly.
In order for the ultrasonic cavitation bubbles to be confirmed visually, photos of the small gaps were recorded during the process. The gaps can be considered as the working areas which are marked in red frames. As shown in
Figure 1a, when the sonotrode does not vibrate, the small gap is full of tap water and very bright. When the sonotrode vibrates up and down, the working area is very dark due the reflection and refraction of light, which is shown in
Figure 1b. This is because that there are thousands of cavitation bubbles as the barriers of light propagation in the gap. Moreover,
Figure 1c,d show the cases of no vibration loading and under vibration loading assisted by water jet, respectively. It can be seen clearly that the working area without vibration loading is much brighter than that under vibration loading. Therefore, it can be deduced that a great many cavitation bubbles are generated in the gap under vibration loading.
3. Experiments
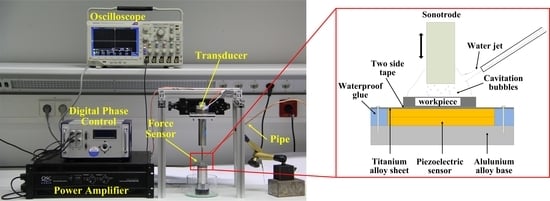
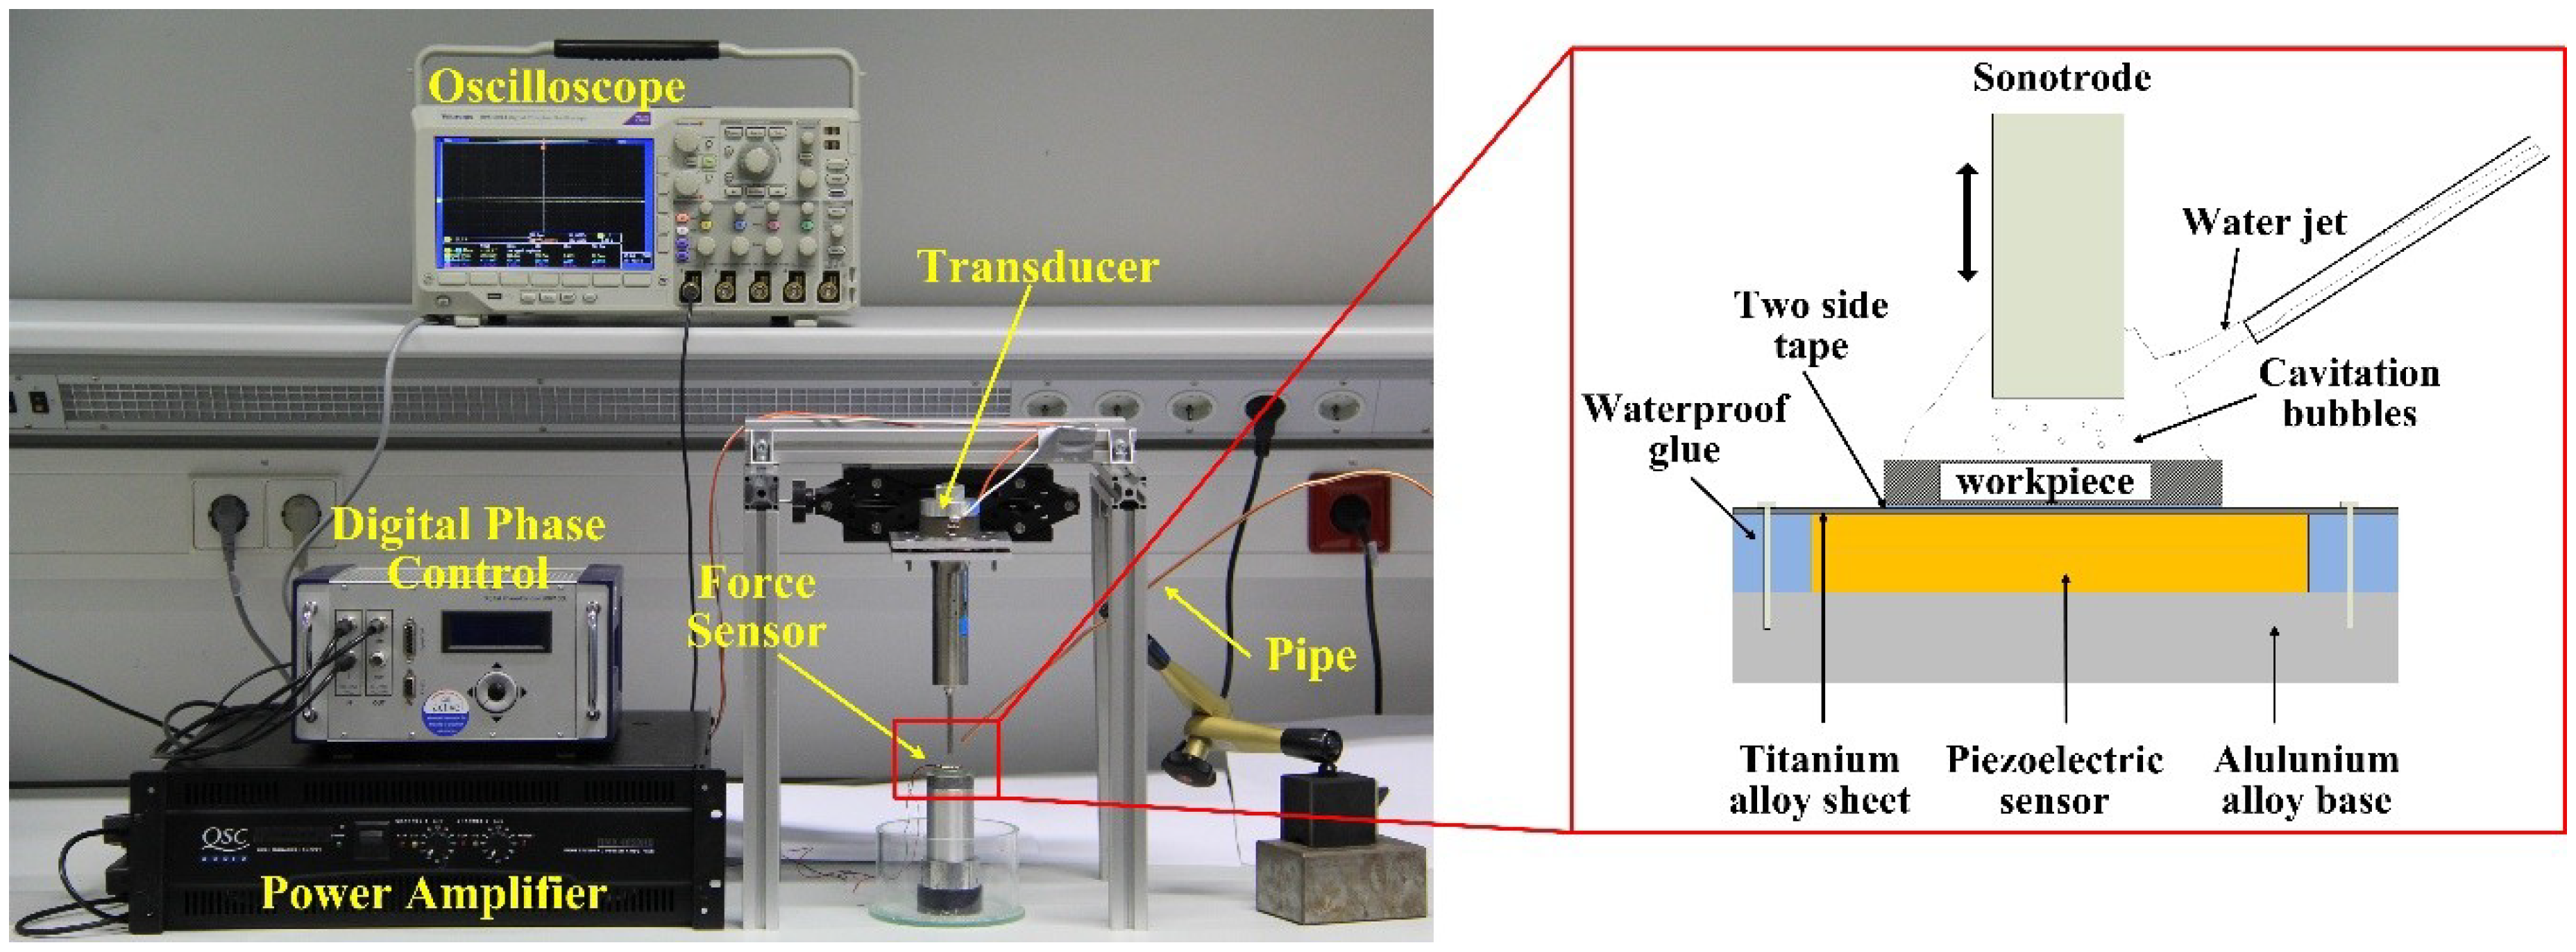
Figure 2 shows the schematic illustration of the equipment during this novel ultrasonic cavitation peening approach. A classic sandwich transducer with different excitation amplitudes and a resonance frequency of approximately 23 kHz was used as vibration source. The transducer was designed to vibrate at its second longitudinal resonance frequency. The mechanical amplitude is amplified by a stepped ultrasonic horn with a diameter at the tip end of 5 mm. The amplitude was controlled by a digital phase control system which keeps vibration amplitude constant, even if a changing load is applied to the transducer [
17,
24]. There is a correlation (120 µm/A) between the vibration amplitude of the ultrasonic horn is proportional to the transducer’s driving current [
25].
The water jet is only required to make the gap full of water. Thus, the slowest velocity of the water jet is required. According to pre-tests, the water flow rate of 75 mL/min for the experiments is minimum and used in the experiments. The pipe with an inner diameter of 3 mm stayed at 45 degrees from the horizontal plane. The 45 degrees is arbitrarily chosen, since the angle between the pipe and the horizontal plane is available from 15 degrees to 75 degrees with the water jet velocity of 75 mL/min according to pre-tests. When the ultrasonic horn vibrates up and down, cavitation bubbles are generated on the surface of the specimen to which a piezoelectric force sensor is attached. The output signals by the force sensor during ultrasonic cavitation peening was recorded for 20 s with an oscilloscope. The sensor was made of two piezoelectric disks with the diameter of 12 mm. The square specimen plate (10 mm × 10 mm) was fixed over the sensor with two side tape. The specimens were made of aluminium alloy 5005 and the surfaces were polished with the roughness of 0.1 µm. Aluminium alloy 5005 is erosion-resistant and is prone to plastic deformation. Therefore, it is a better choice to evaluate the effectiveness of ultrasonic cavitation peening. Three specimens were treated under the same process condition. The duration of the process time for each specimen was 60 s.
After the treatments, the volume loss and microhardness generated with different standoff distances (from 0.1 mm to 1 mm with the interval of 0.1 mm) and different driving currents (0.166 A, 0.208 A, 0.250 A) were measured. The change of the standoff distance was measured by a linear variable differential transformer. The specimens were dried by absorbent paper after treatment. Since the specimen surfaces are polished under the same condition, the topographies of the specimen surfaces were nearly the same. Thus the volume loss of the specimen was only measured after treatment using a Alicona microscope which can also measure the surface roughness. The magnifications of the microscope lenses that were used in the measurements were five times and fifty times, respectively.
A Vikers tester designed at Institute of Dynamics and Vibration Research was used to measure the surface microhardness. The hardness tester consists of a force sensor (HBM PW4M C3), a Vikers indenter of the load (SIANTEC SV1032M) and an eddy-current displacement sensor (Lion precision ECL101 with probe U 5). The microhardness along the diameter of the treated pattern was measured after treatment. Ten measurement points were distributed evenly along a measurement path.
4. Results and Discussion
4.1. Impact Force Caused by Cavitation Bubbles
The effect of different standoff distances and different vibration amplitudes on impact force is investigated in the following section, as the impact force caused by the collapse of cavitation bubble is an evaluation factor for this novel ultrasonic cavitation peening approach. When the cavitation bubbles occur in the small gap, the workpiece surface is impacted by the impulse of cavitation collapse. Thus, the voltage signal by the force sensor can be recorded to obtain the load peaks which are presumably due to the impulse. The load peaks are corresponded to the impact amplitude. More violent cavitation collapses mean higher load peaks. In
Figure 3 the frequency distribution of load peak are compared at different vibration amplitudes (20 µm, 25 µm, 30 µm) and standoff distances (0.2 mm, 0.6 mm, 1.0 mm). The horizontal axis gives the amplitude in volts whereas the vertical axis gives the number of the voltage peaks. The higher vibration amplitude leads to higher impact loads and the counts of larger impact load are much less than that of small impact loads. Since the standoff distances are less than 1 mm, the affected areas of the specimens by the cavitation bubbles are slightly different. This phenomenon can be observed through the treated specimen. The large impacts have much more influence on the treated surface, as with smaller impacts it is difficult to generate the plastic deformation which is beneficial for the treated surfaces. Thus, we mainly focus on the effects of large impact in the following measurements. The vibration amplitude of sonotrode becomes larger, which results in the increase of sound pressure. Thus, the cavitation bubbles generated in the gap are larger at larger vibration amplitude than that at smaller vibration amplitude. At the same time, the impacts caused by cavitation bubbles become larger.
It can also be seen that the variations of the standoff distance are very sensitive to the distribution of the peaks. In
Figure 3, at the vibration amplitude of 20 µm, the impact loads at the standoff distance of 0.6 mm is the highest while that at the standoff distance of 0.1 mm is the lowest. The highest value of peak height reaches to about 1.8 V while the lowest value is about 0.5 V. It can be deduced that the impact loads increase to a peak with the increase of standoff distance and then decrease again. There is the same tendency at the vibration amplitudes of 25 µm and 30 µm. This is because the highest impact load occurs at the standoff distance which equals the maximum diameter of the cavitation bubble. At the same vibration amplitude, the dynamics of cavitation bubbles are limited by the smaller gap. However, with increase the standoff distance, the bubble size near the treated surface becomes smaller due to the attenuation.
4.2. Surface Properties after Treatment
The capability of the impacts during the novel ultrasonic cavitation can also be evaluated from the volume loss of the treated workpiece. The volume loss can be obtained utilizing the top cover mode of the microscope. The volume loss is caused by the multi-impact from the shock waves or micro-jets. During ultrasonic cavitation peening, much plastic deformation and small mass loss are generated. The plastic deformation and the mass loss compose volume loss. Therefore, the volume loss can reflect the cavitation intensity.
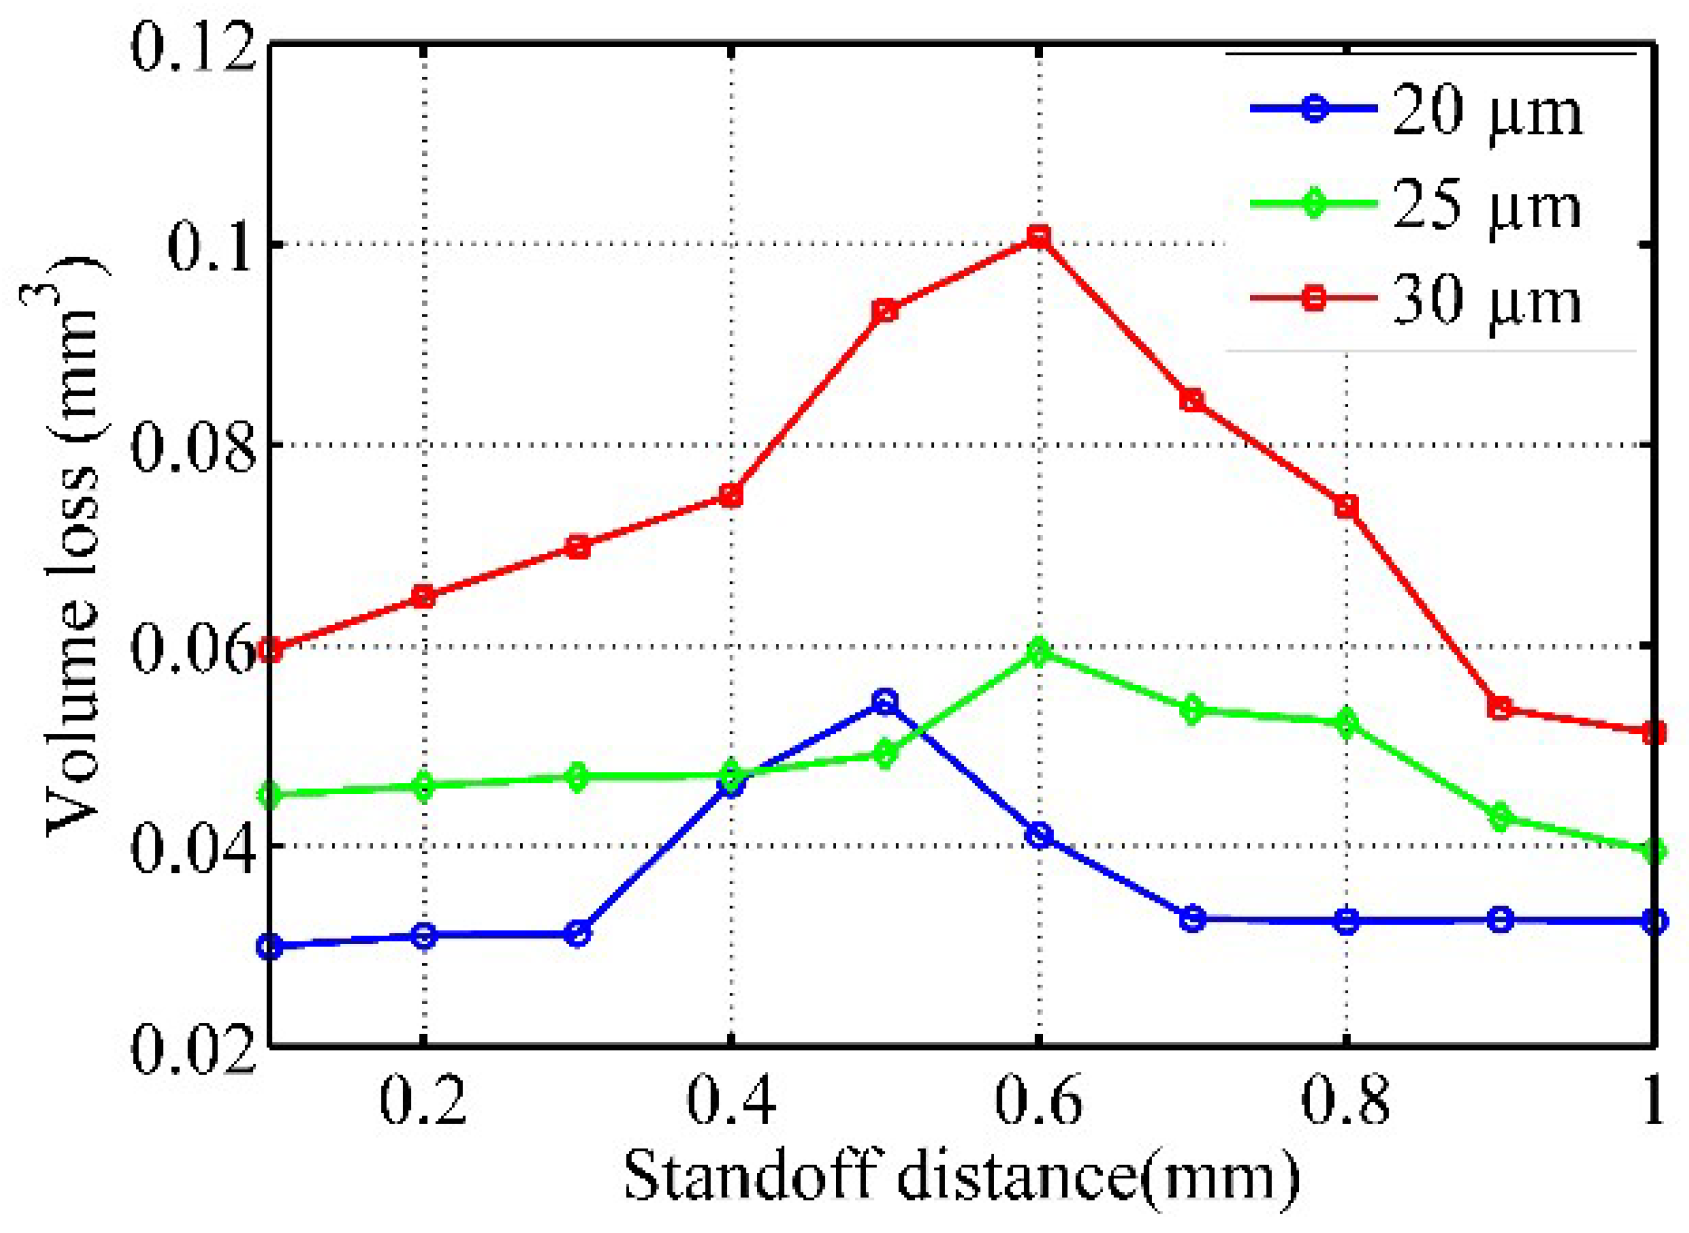
Figure 4 shows the volume loss by increasing the standoff distance at different vibration amplitudes. It can be seen that most volume loss occurs at standoff distances of 0.5 mm and 0.6 mm, respectively. Most volume loss increases with increasing the vibration amplitude, since a larger vibration amplitude leads to higher cavitation intensity. As a result, the volume loss is larger with a larger vibration amplitude. The difference of volume loss between the cases at vibration amplitude of 20 µm and 25 µm is about 0.01 mm
3 whereas between the cases at vibration amplitude of 25 µm and 30 µm is about 0.04 mm
3. Even as the vibration amplitude increases with a fixed interval, the volume loss increases much more. This is because the energy caused by cavitation bubbles increases in the order of three with the increase in the bubble size. Apart from the standoff distance with the most volume change, the volume loss at other standoff distance decrease when the vibration amplitude decreases.
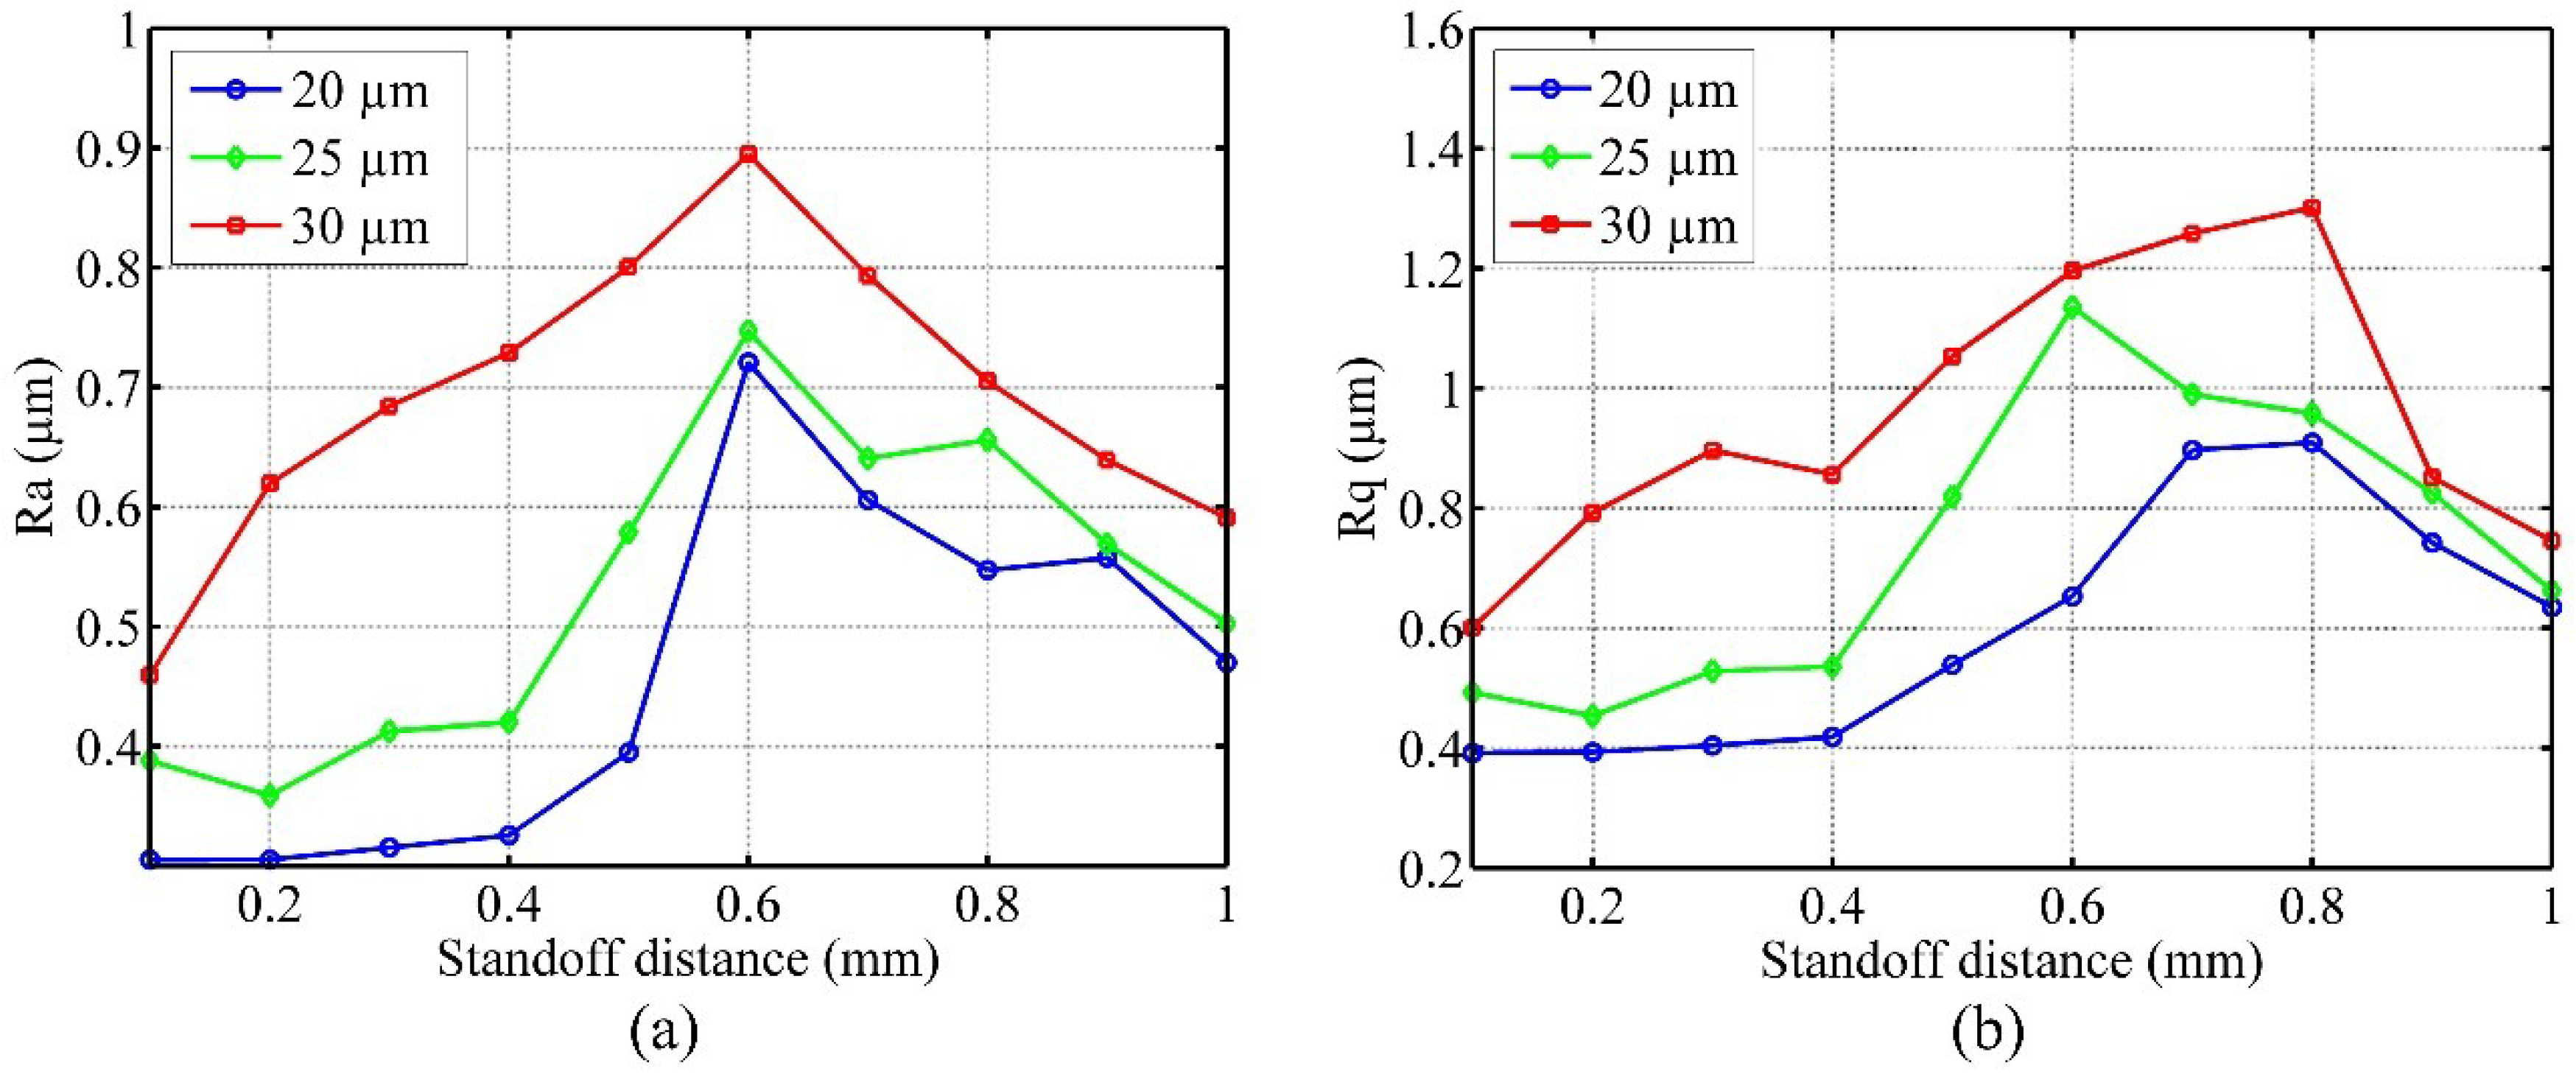
The surface roughness is one of the important characteristics for the evaluation of the surface properties of the specimen after ultrasonic cavitation peening.
Figure 5a,b show the surface parameter R
a and R
q after ultrasonic cavitation peening at different vibration amplitudes and standoff distances, respectively. The measurement path is along the diameter of the circular area. The values of the roughness parameters shown in
Figure 5 are average values from four measurements for each specimen. It can be seen that the roughness parameter of R
a increases with increasing standoff distance up to 0.6 mm and then decreases again. R
a also increases with increasing vibration amplitude. The maximum value of R
a is less than 0.9 µm. The roughness parameter of R
q almost keep the similar tendency as the parameter of R
a. Therefore, it can be deduced that a low impact load will cause low roughness.
Microhardness can be utilized to evaluate the surface properties as well. When an impact is generated on metal grain, the grain is plastically deformed, which results in the dislocation movement and multiplication. The effect causes an increase in hardness of the grain. With the intersection of dislocations, jogs are produced and pin the dislocations. In general, it is supposed that the hardness in the plastic deformation area is greater than that in the original surface due to dislocations. During microhardness measurements, the imprinted quadrangular shape produced by the indenter is not clear enough to measure. Therefore, the load-displacement method were used.
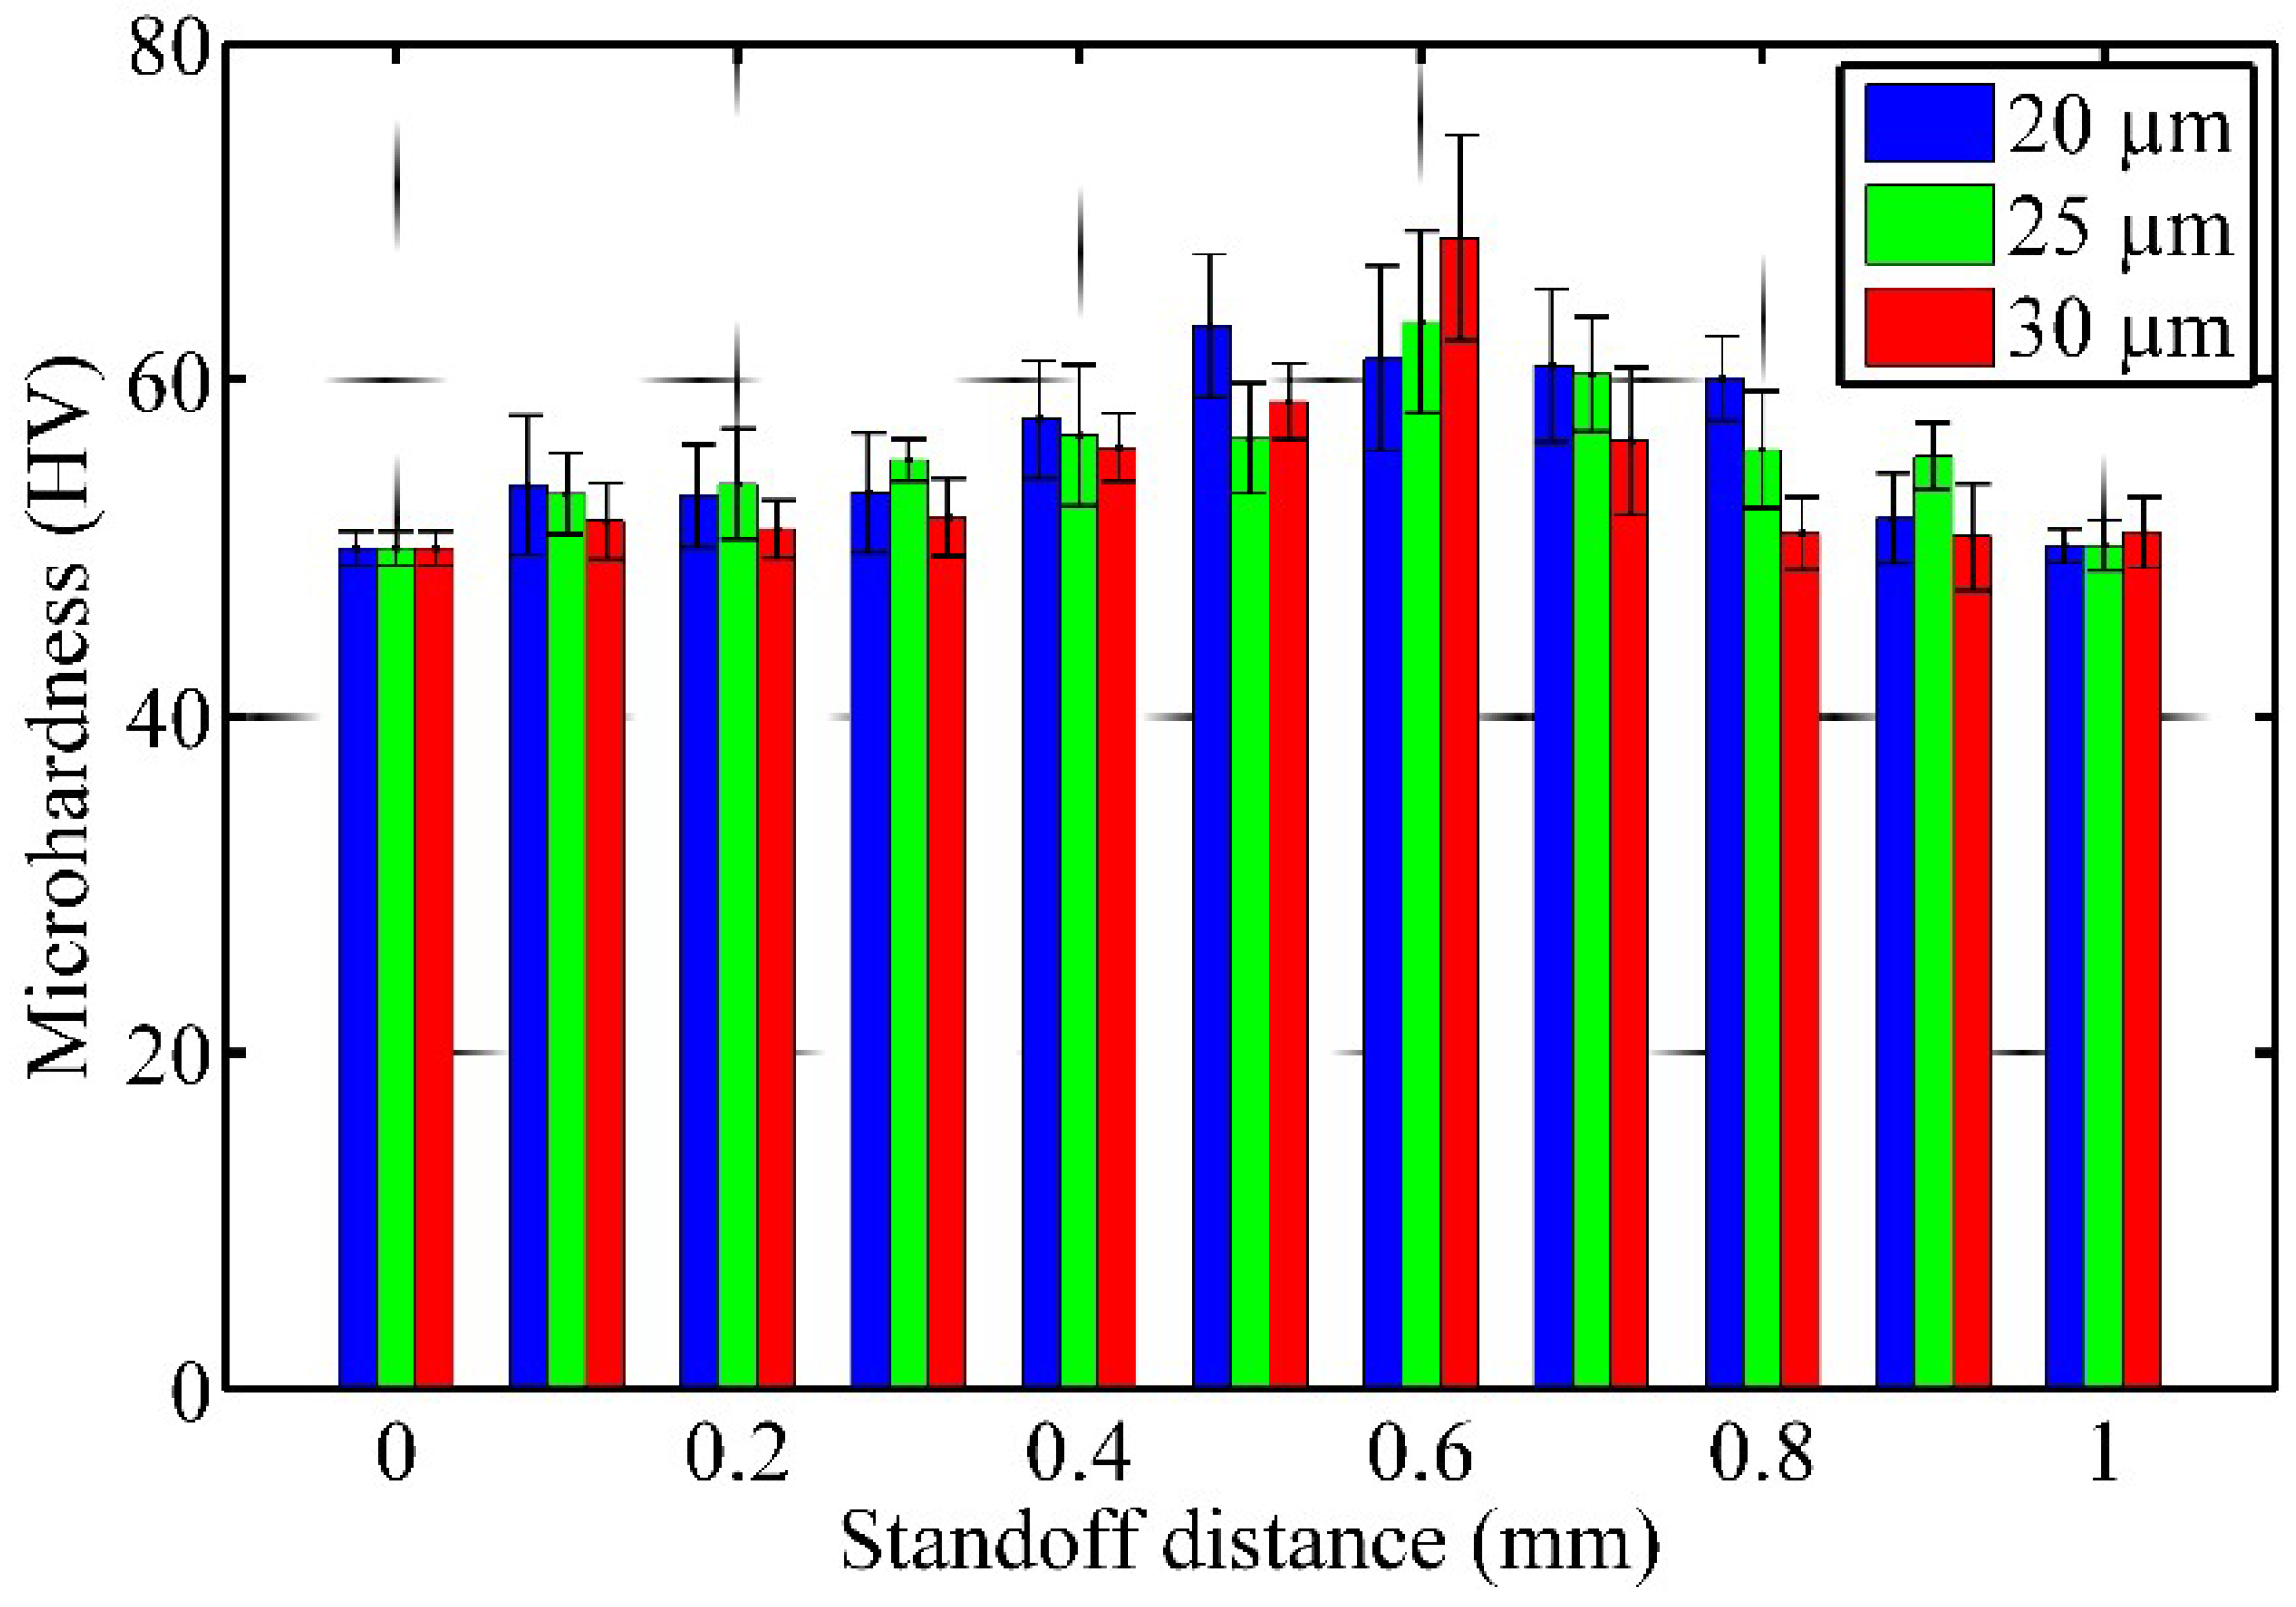
The original microhardness of the untreated specimen surface was measured as approximately HV 50. The variation of surface microhardness with error bar after different treatment conditions is shown in
Figure 6. The maximum microhardness for the vibration amplitude of 20 µm occurs at a standoff distance of 0.6 mm, whereas the maximum hardness at the vibration amplitude of 30 µm occurs at a standoff distance of 0.5 mm. This slight difference is caused by the variations of the impact. At larger vibration amplitude more violent cavitation will be generated, which leads to more plastic deformation. As a result, the microhardness obviously increases. At the vibration amplitude of 30 µm, the microhardness can be as high as HV 68, which means the enhancement of the microhardness is 36%.
4.3. Microstructure of the Specimen Surface
In order to observe the variations of surface profile, the microstructures of the specimen surfaces are captured at the vibration amplitude of 30 µm, since the changes of the surface profile are easy to recognize at this vibration amplitude. The captured area is 150 µm by 150 µm.
Figure 7a shows a polished specimen surface without any treatment.
Figure 7b–d show the microstructures at the standoff distance of 0.1 mm, 0.6 mm and 1.0 mm, respectively. It can be seen that the surface without treatment is very smooth and without any large pits. In the case of the standoff distance of 0.1 mm, there are many small pits being generated on the surface. It is difficult to form bubble clouds in this small gap, which leads to a uniform distribution of the impacts caused by cavitation bubble collapse. By increasing standoff distance to 0.6 mm, strong cavitation increases in the small gap. The specimen surface profile changes severely and large pits are formed due to the violent impacts. When the standoff distance increases to 1.0 mm, the change of surface profile does not change more than that at the standoff distance of 0.6 mm. It is because that the impact on the treated surface is highly non-uniform. According to the contrast, it is deduced that no mass loss were produced. There are also no obvious cracks but some scratches due to polish.
Compared to the traditional ultrasonic cavitation peening [
18], the volume loss, hardness and roughness keep similar after treatment under the same investigation conditions. Therefore, this novel peening process not only takes the advantages of water jet assist but also has the similar treatment effects as the traditional ultrasonic cavitation peening process. Although there is no residual stress measurement, the plastic deformation and the increase of surface hardness indicate that the effectiveness of this novel peening process can still be evaluated.
5. Conclusions
With this novel ultrasonic cavitation peening approach, it is not necessary to immerse the workpiece in water. With the assistance of a water jet, it is possible just to fill the working gap with water, which wets the gap due to the surface tension. This is the first time to use this novel method to peen workpiece utilizing ultrasonic cavitation. Without the limitation of the small gap, this novel ultrasonic cavitation peening can be used more widely. In order to estimate the efficiency of this novel approach, four parameters were evaluated: testing of impact load, volume loss, surface roughness and microhardness. The microstructures of the surfaces before and after treatment were also observed. For vibration amplitudes from 20 µm to 30 µm, the maximum impact loads detected by a piezoelectric sensor occur at a standoff distance of 0.5–0.6 mm. For this range of standoff distance, the volume loss, the surface roughness and the microhardness are higher than that at other standoff distances. By increasing the vibration amplitude, the impact loads increase correspondingly, which leads to a larger volume loss, higher surface roughness and microhardness. Additionally, under these experimental conditions the parameter of surface roughness Ra is smaller than 1 µm which is less than for other traditional peening methods. The hardness can increase by as much as 36%. From the microstructures of the treated surface, it can be seen that there are no obvious cracks being generated. Therefore, as a potential surface enhancement technology, this novel ultrasonic cavitation peening approach can be used to replace the traditional ultrasonic cavitation peening method, since there is no limitation on the geometry and size of the workpiece. Furthermore, tap water can be used directly and a temperature control is no longer necessary, which simplifies the process.


