Article

Experimental Verification of the Dynamic Model of Turbine Blades Coupled by a Sealing Strip

Politecnico di Torino, Corso Duca degli Abruzzi 24, 10129 Torino, Italy
*
Author to whom correspondence should be addressed.
Appl. Sci. 2018, 8(11), 2174; https://doi.org/10.3390/app8112174
Submission received: 5 October 2018 / Revised: 27 October 2018 / Accepted: 30 October 2018 / Published: 6 November 2018
(This article belongs to the Special Issue Radial Turbomachinery Aerodynamics)

Abstract

:
This paper presents the experimental-numerical comparison of a bladed system with flexible strip dampers. The experimental results constitute, to the authors’ knowledge, the first published experimental evidence on strip dampers. They explore the in-phase and out-of-phase mode of vibration of two blades coupled by a strip damper. The great influence the mode of vibration has on the strip behaviour and consequent effect on the blades’ response is highlighted, analyzed and successfully simulated numerically. Experiments are made possible by a purposely developed loading system based on compressed air. This non-contact system enables the experimenter to apply a realistic value of contact pressure on the strip without adding spurious stiffness to the system or modifying the contact conditions. The availability of experimental data obtained by imposing realistic contact conditions constitutes a true added value. It is here shown how the full stick linear FRFs (Frequency Response Functions), typically used to predict the response in case of limited excitation on blades coupled by rigid dampers, do not offer significant results in the case of flexible strip dampers.

Graphical Abstract

1. Introduction

One of the key points in the structural design of a turbine bladed disk is to avoid that the excitation frequencies of the aerodynamic forces are in the same range of the natural frequencies of the bladed disk. However, this is not always possible because of the wide range of aerodynamic frequencies and the wide range of possible resonance frequencies.
Once the geometry of blades and disk have been defined, a possible solution to shift the natural frequencies and to introduce damping, is to insert friction contact surfaces between the different elements of the bladed disk. These friction contact surfaces can be between elements which are integral parts of the blades [1,2,3,4,5,6,7,8,9] such as shrouds or interlocked tip platforms, or, as an alternative, they can come from the contact with external devices such as underplatform dampers (UPDs) [10,11,12,13,14,15,16,17,18]. The UPDs are metal masses inserted between the blades, pushed against the blade platforms by the centrifugal force. They are extensively used in turbine designs, especially as “solid dampers” in several shapes, cylindrical, curved flat, wedge damper, etc. For this reason, in the past 15 years, the design of these solid underplatform dampers have been extensively investigated [19,20,21,22,23,24,25,26,27].
More recently, the technical literature has shown interest in the design of a new kind of underplatform damper, which is not solid but “flexible”, namely strip damper or seal damper [28,29,30]. Strip (or seal) dampers are thin flexible metallic strips mounted on turbine bladed disks with the main purpose of cooling–air sealing. As the solid dampers, they are held in place against the blade platforms by the centrifugal force. In addition to the sealing function, they can also be used to modify the stiffness and the damping of the system. Strip dampers can significantly modify the dynamic response of the turbine system. Firstly, the seal stiffens the structure and, as a result, the resonance frequencies of the bladed disk will increase. Furthermore, when relative motion takes place between seal and blade platforms, the friction forces dissipate vibrational energy and consequently the dynamic response of the system is damped.
For all these reasons, a sound and robust turbine dynamic design should consider the seal influence on the response in terms of its frequency shift and damping contribution.
Unlike other kinds of under-platform dampers, the peculiarity of seal dampers is to be flexible and very light. Their flexibility implies that they cannot be considered as a rigid body with only inertia properties, a common assumption in underplatform dampers modelling. Their low mass implies that they are not subjected to the same high centrifugal force as standard prismatic under-platform dampers.
In a previous paper [29], the authors investigate the peculiar features that a sound dynamic model should have in order to effectively represent seal dampers and their friction contact with the blades’ platforms. The simplifications typically adopted with rigid dampers are highlighted and abandoned. The authors analyze the choices of the model key parameters and explore the consequences of each choice on the predictions offered by the numerical simulation tool.
In the present paper, the authors provide the experimental verification of the numerical model described in detail in [29]. The experiments are carried out by means of a test rig with two blades coupled with a seal damper in controlled laboratory conditions. The fundamental novelty of the rig is the strip loading system, which simulates the uniform pressure distribution provided by the centrifugal force in real operating conditions. This loading system, which provides load on the strip without any contact with the strip, was designed and calibrated in [30] and here used to load the strip between two dummy blades.
The paper presents the experimental forced response of blades with strip dampers. The blades are tested in two limit vibration modes: “in-phase” (that is, with engine order EO = 0, corresponding to a 0° inter-blade phase angle ϕ ) and “out of phase” (that is, with engine order EO corresponding to ϕ = 180°) [31,32].
The experimental results are checked for repeatability and then analyzed. A state-of-the-art numerical tool is used to simulate the test rig set-up. The numerical results compare well with the experimental observations and give an insight on the strip-platform interaction. In detail, the relative platform kinematics, which is markedly different depending on the engine order excitation, influences the strip behaviour and, in turn, its effect on the blades’ response. The numerical results’ sensitivity to changes in the contact parameters used to simulate the friction interfaces are discussed in detail.

2. The Test Rig

The test rig, shown in Figure 1, has particular technical specifications that make it unique in this kind of measurements. The test rig was purposely designed and machined in order to create in the lab loading conditions as close as possible to the real ones, but with the possibility of having all the important parameters under control. The first prototype of the main components of the test rig are described in detail in [30]. Starting from the previous prototypes, the test rig was assembled with the technical features listed below.
  • The test rig is non-rotating; this allows for accurate control on the excitation force amplitude and phase and accurate measurement of the blades’ response.
  • The centrifugal force acting on the strip is simulated by a loading system based on compressed air, so as to avoid contact with the strip. This system is here preferred to a classic contact loading device, as the latter may induce deformation of the strip itself and introduce a spurious system in the blades-strip system.
  • Each of the two dummy blades is machined in one-piece. This solution avoids additional interfaces with friction beyond the strip-platforms contact interfaces.
  • A clamping hydraulic machine holds the prismatic bases of the blade with a 200 bar pressure so that the blades become one with the big inertial mass of the rig.
  • The blades’ platforms in contact with the strip are equipped with a replaceable contact pad (glued to the platform). In this way, different typical blade materials can then be tested independently from the blades.
  • Each blade is connected to a shaker, so that both blades can be excited at the same time with a different phase, as in a real engine. The two-blades system at hand can be excited to vibrate along the in-phase (IP) and out-of phase (OOP) modes.
  • Each blade is excited with a step-sine force with constant amplitude. A precise control of the force is requested since the system is not linear.

2.1. Compressed Air System

The most innovative component of the test rig is the loading system, used to simulate the centrifugal force on the strip. This loading system, based on compressed air, depicted in Figure 2, satisfies the two main technical requirements:
  • loads the strip without any contact, mimicking the effect the centrifugal force has on the strip in real working conditions, e.g., no strip deformations due to point-loading;
  • produces a uniform pressure between the strip and the platform, with a value of pressure of 0.3 MPa, which is a realistic value of pressure in turbines with strips.
A prototype of this loading system has been tested and calibrated as explained in detail in [30]. A pressure regulator controls the pressure, measured by a manometer at the entrance of the air box shown in Figure 2a,b. The compressed air passes through the cover holes of the air box pressing the strip against the blades’ platforms. The strip in contact with the blades platforms is visible in Figure 2b. A 1.5 mm gap guarantees that, once the system is on, the lower part of the strip does not touch any portion of the air box. The presence of this gap is a source of pressure loss. For this reason, it was necessary to calibrate the system in order to know which was the effective pressure between strip and platform at a given input pressure. The calibration procedure explained in detail in [30] proved that for an entrance pressure of 0.75 MPa (maximum value available from the compressed air net) the average pressure value at the contact strip-platform was 0.28 MPa.
The pressure was measured by Prescale Fujifilm LLLW film (Fujifilm Corporation, Tokyo, Japan) between the strip and a support simulating the platforms. The pressure shows minor deviations across the contact patch (≈77% of the area has a local pressure value in the (0.25–0.31) MPa range). This value was considered acceptable considering that a realistic value of the pressure due to centrifugal force between strip and platforms is 0.36 MPa.

2.2. Excitation System

The exciting force is generated by two electromagnetic shakers, each one connected to one blade. Each shaker is hung by means of springs. Each shaker is connected to its blade by a stinger equipped with a force transducer which measures the excitation force. The amplitude of the excitation force on each blade is kept constant during the test by a closed loop control system. The two blades are excited in the range of the first bending mode.

3. The Experimental Results

The forced response of the two blades is measured though accelerometers at the tip of each blade. The frequency range of interest is that of the first bending mode.
The forced response of the blades is first detected without the strip. The purpose is to record a reference that will serve to quantify the influence of the strip on the system in terms of natural frequencies and damping. In a second set of tests, the compressed air system is turned on and the forced response of the blades-strip system is measured at different levels of the excitation force amplitude.

3.1. Blades without Strip

The stepped sine tests are carried out by controlling amplitude and phase of the excitation. Two consecutive tests are carried out by exciting the blades first in phase (IP) and then in out of phase (OOP). The four frequency response functions (FRFs) are depicted in Figure 3a. The black curves refer to blade 1 and the red curves to blade 2. For each blade, FRF IP and FRF OOP are the FRFs detected with the excitation respectively in “in phase” (IP) and “out of phase” (OOP). It can be seen that the FRFs of blade 2 and the FRFs of blade 1 are not overlapped, as blade 1 is not perfectly equal to blade 2. It is also observed that the two blades are very well isolated from one another since, in the frequency response of one blade, the contribution of the resonance of the other blade is practically negligible. This result indicates that the clamping constraint on the blades’ base offered by the hydraulic machine is appropriate.
For each blade, the peak detected in IP and the peak detected in OOP are at the same frequency. Hence, as expected for two uncoupled blades, the natural frequency of the IP and OOP modes is the same.
One concern in using the compressed air to load the strip against the blades was that the flux coming from the strip loading system could somehow influence the dynamics of the blades by introducing stiffness and, above all, damping. A rigid strip is then held ≈1 mm above the air box cover (not in contact with the blades) and the compressed air system turned on. In this way, a compressed air flux is introduced in the system without pushing the strip in contact with the blades. The FRFs of the system were recorded in this condition and then compared to those obtained without the compressed air flux. The comparison for IP excitation is depicted in Figure 3b. It can be seen that the FRFs without and with air overlap. It can therefore be concluded that the compressed air flux does not influence the blades’ dynamics in terms of natural frequency. A minimum effect can be noticed on the peaks’ amplitude: the amplitude is slightly lower when the compressed air is turned on. This effect is so small that the damping introduced by the compressed air on the blades can be considered negligible, especially if compared to the effect of the strip (see Section 3.2).

3.2. Blades with Strips

The strip is introduced in the slot on the cover of the air box and the compressed air system is turned on at the maximum pressure (0.75 MPa pressure at the inlet). The IP and OOP FRFs are then detected on the blades. In Figure 4a, the FRFs obtained with IP excitation are depicted. This time the two FRFs ( FRF IP 1 and FRF IP 2 plotted in solid lines) are perfectly overlapped. In fact, the blades are no longer two separate entities: with the strip in the middle, they constitute a single dynamic system. The peak corresponds to a mode where the blades vibrate coupled by the strip together in “in phase” (IP mode). The FRFs obtained in case of OOP excitation are shown in Figure 4b. As for the IP case, the FRFs of the two blades with strip are perfectly overlapped. In this case the influence of the strip is more evident: it can be observed that the frequency of the OOP peak with a strip is higher than the corresponding OOP peaks without the strip. The close observation of Figure 4a,b yields the following highlights.
  • The FRFs of the system with strip are lower in amplitude than the FRFs without strip since globally the strip introduces stiffness and damping in the dynamic system.
  • IP motion: since the blades are no longer two separate entities, the two separate peaks (one for each blade) typical of the free condition have been substituted with one peak in the middle of the two. The IP peak (with strip) (Figure 4a) is in the same frequency range of the resonance peak of the free blades (i.e., without strip). The physical explanation of this can be found by observing the relative displacement of the blade platforms during IP blade vibration. As shown in Figure 5, this displacement is mainly vertical and consequently the strip constitutes a quite weak constraint (it may even detach from the platforms during part of the period of vibration). This is further analyzed in Section 5. The result is that the strip influence on the IP mode is quite weak both in terms of damping and stiffening, i.e., the amplitude and position of the peak does not change significantly.
  • OOP motion: the OOP peak (Figure 4b) is at higher frequency than the corresponding peak in free (i.e., no strip) condition. Furthermore, the peak appears considerably reduced in amplitude. The explanation can be found again by observing the relative displacement of the blade platforms. As further commented in Section 5.2, the OOP mode sees a purely horizontal relative displacement between platforms. This platform kinematics maximizes the strip damping and stiffening capability.
Repeatability tests have been performed by repeating each test after having switched off the compressed air so that the strip has returned to its initial position on the air box cover. Each time the air is switched on, the strip is repositioned against the blade platforms. The position of the strip with respect to the platforms may potentially differ from one test to the other. The FRFs detected for three repeatability tests performed at F E = 0.1 N are shown in Figure 6 for blade 1, respectively, for IP excitation (Figure 6a) and for OOP excitation (Figure 6b). It can be observed that the IP curves are quite repeatable since, as commented before, the strip is less effective. The OOP curves look more noisy since they have lower amplitude and, for this reason, the differences are more evident. The moderate differences in the OOP peaks are justified by the fact that a different position of the strip may lead to different extension of the strip-platform contact areas and, as a consequence, a different constraint and sliding contact area.
Considering that the strip position could have an influence on the results, the following tests are performed avoiding to switch on and off the compressed air system. At a constant pressure on the strip, the forced response of the system is measured at different excitation levels. The system is tested in IP and OOP conditions. Each set of tests is composed of three frequency sweeps performed at three levels of excitation force amplitude: | F E | = 0.2 N, | F E | = 0.15 N, | F E | = 0.1 N. The | F E | = 0.2 N test is performed first, in order to try and minimize changes in position during the application of the different excitation levels. Only at the end of the three frequency sweeps (one test set) is the compressed air system switched off. Six different set of tests are performed to account for repeatability.
The IP and OOP measured forced responses for blade 1 (results on blade 2 are very similar) are depicted respectively in Figure 7a,b. Different colors correspond to different excitation levels. The IP FRFs are highly repeatable. This is an experimental confirmation of what was proven numerically in [29]: the strip does not influence this mode. On the contrary, the OOP curves show the typical trend in presence of friction damping. By increasing the excitation force levels:
  • sliding in the contact interface increases, thus producing a progressively less stiff system with lowering OOP peaks’ frequency;
  • the peaks appear increasingly more rounded since, due to the increasing relative displacement between strip and platform, more damping is introduced in the system.

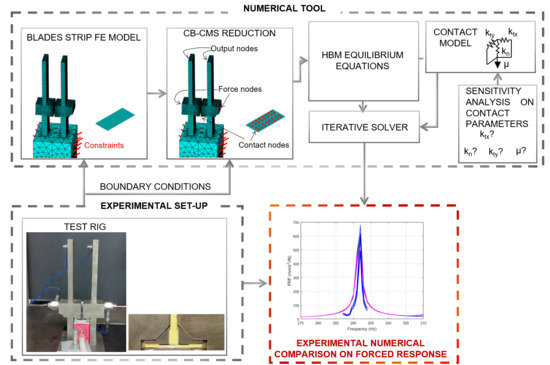
4. The Numerical Model

Figure 8 shows a mind map of this paper intentions. The experimental set-up described in Section 2 is replicated using a state-of-the art numerical tool first described in [29]. The ultimate purpose is that of gaining a deeper understanding of the strip working conditions through the ensuing experimental-numerical comparison.
This section explores the “building blocks” of the numerical tool, necessary to perform the nonlinear simulation.
  • Finite Element Models: the blades and the strip are modeled using FE (Finite Elements). In the present case, Ansys Mechanical APDL 16.1 is chosen. No contact is imposed between blades and strip at this stage, therefore the two blades and the strip are handled into two separate files. Nevertheless, the two separate models should have the same reference system and a coincident regular mesh on the contact surfaces.
  • Boundary Conditions: the nodes on the base of the blades are constrained (zero displacement along all DOFs) to reproduce the clamping imposed by the hydraulic machine.
  • CB-CMS reduction: The size of the two models is reduced by performing a Craig–Bampton Component Mode Synthesis (CB-CMS) reduction [33,34]. This reduction technique requires the selection of master (i.e., physical) and slave (i.e., modal) degrees of freedom. The physical DOFs include:
    • two nodes, one for each blade, to apply the shaker excitation force. The nodes are chosen on the outer part of the blade platforms, to replicate the experimental set-up;
    • two nodes at the tip of the two blades, in the same position where the accelerometers are placed. These nodes are used to record the blades’ response;
    • a total of 200 contact nodes (50 for each of the four contact interfaces on blades and strip). As pointed out in [29], whenever a flexible structure is involved, ensuring an adequate representation of the contact requires a high number of contact nodes.
  • Nonlinear simulation. The two reduced models are imported in a Matlab environment (R2016a version, Mathworks, Natick, MA, USA) where a state-of-the-art code is used to compute the nonlinear forced response of the system. A few highlights of the code, closely analyzed in [29] can be found below.
    • The multi-Harmonic Balance method is used to solve the nonlinear equilibrium equations in the frequency domain:
      ( ω 2 M + i ω C + K ) · x = F e + F n l ,
      where the mass and stiffness matrices M and K of the blade strip system come from the CB-CMS reduction. The structural damping of the two bodies, i.e., matrix C is assumed to be modal. The value of modal damping ζ is tuned using the Free curves (i.e., no strip) and here set at 0.0002. The vector F e contains the two shaker forces, whose amplitude F E and phase is set equal to those investigated in Section 3.2. The vector F n l contains the nonlinear contact forces.
    • At this stage blades and strip should be regarded as a unique system. The node-to-node contact between blades platforms and strip is ensured by a state of the art contact model implementing a normal and a tangential contact spring per node (see also Figure 8). The model is capable of simulating the three fundamental contact states: stick (the nodes are connected by the two springs), slip (the normal spring is still present while the tangential direction moves freely) and lift-off (no contact). The contact parameters’ values influence the result as further commented on in Section 5.2.
    • The Jacobian Alert Algorithm, first presented in [35], ensures a fast yet accurate calculation.

5. Numerical Results

Before delving in the analysis of the nonlinear calculation results, the authors analyzed the linear limit cases typically produced in the case of solid dampers.
The “free” (no strip) curve is shown using a black solid line in Figure 9a. Since the two blades are modeled as perfectly equal in the FE, the peak frequency of blade 1 matches that of blade 2 and falls between those recorded in Figure 3. As stated in the previous section, the amplitude of the numerical free curve has been tuned to match that of the measured ones.

5.1. A Warning on the Inadequacy of the Full-Stick Linear Prediction

The other linear FRFs produced whenever studying solid dampers are the full stick curves. In full stick, the strip is linked to the blades using the contact springs (see Figure 9b). In the case of solid dampers, these curves are representative of low excitation levels, i.e., the ratio between the excitation force on the blade and the centrifugal force on the damper is so low that the platforms’ relative displacement is not sufficient to cause the damper to slip. These curves are often used in the damper design procedure as they can be easily computed using linear analysis and they serve as limit curves: they signal the maximum frequency shift produced by the damper.
The IP and OOP full stick curves for the system at hand are shown in Figure 9a. These curves are quite different from those found experimentally (both in terms of amplitude and peak frequency), even at the lowest excitation level | F E | = 0.1 N. The full stick assumption is incompatible with the testing conditions because the excitation level, here defined as the ratio between | F E | and the centrifugal load on the damper is too high. In detail, the mass of a strip damper, and consequently the resulting contact pressure (i.e., 0.3 MPa), is more than one order of magnitude lower than those found on a solid damper. Therefore, even if the | F E | is set at the lowest possible value compatible with the shaker and control system capabilities, the excitation level on the system is too high to be compatible with the full stick condition.
It can therefore be concluded that the full stick assumption (depicted in Figure 9b) is not easily observable and therefore not a relevant indication in the case of strip dampers, as the high | F E | /centrifugal load ratio causes the strip to partially detach in case of IP vibration and to slide in case of OOP vibration, as shown in Figure 5.
The designer should therefore refer directly to the nonlinear calculation summarized in Section 5.2.

5.2. Experimental Numerical Comparison

As stated in Section 5, the results of the numerical simulation may be influenced by the value of contact parameters given as input to the simulation. Different factors can influence contact parameters: temperature [36], surface finishing and therefore the manufacturing process [37,38], and contact pressure [39]. Several studies can be found in the literature to estimate, either numerically [40,41] or experimentally [42,43], contact parameters for solid components under high contact pressure. At present, there are no direct experimental data available on the strip-platform contact. The authors have therefore referred to data coming from direct experiments on the flat-on-flat interface of asymmetric solid dampers, which, in laboratory conditions, were subjected to a contact pressure in the [0.3–0.4] MPa range [44]. An uncertainty band was then applied on all parameters to reflect the uncertainty on the experimental data itself and in light of the fact that the data wasn’t derived directly from a strip damper. The final ranges are:
  • normal contact stiffness k n = [84–252] N/ μ m,
  • tangential contact stiffness k t x = k t y = [56–168] N/ μ m,
  • friction coefficient [0.3–0.5].
The contact stiffness values refer to one [5 × 30] mm strip-platform contact patch and is divided uniformly among the 50 contact nodes present on each patch. These values are fed to the numerical tool described in Section 5. It should be noted that contact pressure does influence the contact parameter values. In fact, higher values of contact parameters and, most importantly, a high k n / k t ratio, are recorded on solid dampers loaded in the [1–2] MPa range as in [39].
The results for the IP and OOP modes are shown in Figure 10a,b respectively. For each experimental condition (mode of vibration and | F E | value), eight different numerical calculations have been performed with contact parameters chosen at the extreme of the uncertainty bands mentioned above. This allows for sampling the complete contact parameters space in a classic Design of Experiments framework. The outer envelope of the eight resulting curves is represented as a colored band in Figure 10.
As shown in Section 3.2, the strip does not influence the IP mode as it tends to detach from the platforms for a large portion of the period of vibration. This hypothesis is confirmed by the numerical simulation, i.e., contact forces go to zero for a significant portion of the period of vibration). The excitation force | F E | does not modify this behaviour, both in the measured and in the simulated cases. Furthermore, the contact parameters have a very limited influence on the resulting curve, as shown by the very thin band in Figure 10a; only the friction coefficient value slightly changes the amplitude of the peak as the strip tends to slide when in contact with the platforms.
The OOP mode is instead largely influenced by the strip. The low amplitude and rounded shape of the peak encountered experimentally suggested the presence of slip between strip and platforms. This hypothesis is confirmed by the numerical simulation. The choice of contact parameters appears adequate and the width of the uncertainty band is reasonably limited given the large amount of slip caused by the high excitation level (i.e., low centrifugal load).

6. Conclusions

This paper recounts the first, to the authors’ knowledge, experimental work on strip dampers. A state-of-the-art numerical model first presented in [29] is used to simulate the test rig set-up.
The experimental-numerical comparison offers a greater insight into the strip working conditions and its influence on the blades’ dynamics. The most relevant conclusions are detailed below:
  • The blades-strip system response varies significantly depending on the mode of vibration (IP or OOP). If the blades are vibrating “in-phase” (IP), the strip does not stiffen nor damp the blades vibration. If the blades are vibrating “out-of-phase” (OOP), the strip significantly damps and stiffens the blades’ response.
  • The experimental observation highlighted at point 2 is confirmed by the numerical predictions and can be easily explained by analyzing the platform kinematics.
  • The contact pressure on the strip produced by the centrifugal load is here set at a realistic 0.3 MPa. This value is one order of magnitude lower than contact pressures typically encountered with solid dampers (whose mass may be more than 10 times higher than that of the strip). This causes the strip to slide and detach quite easily even for low values of excitation force on the blades | F E | .
  • A direct consequence of point 3 is that the full stick linear limit curves typically used in the analysis and design of solid dampers are here not significant as they would largely overestimate the frequency shift produced by the strip. This is observed numerically and proven experimentally and constitutes one of the main findings of this paper.
  • The contact parameters used in the simulation come from experimental data on solid dampers (subjected to a contact pressure similar to the strip’s). The sensitivity of the response to variation of contact parameters is moderate in the case of OOP vibration and close to null in case of IP vibration (the case in which the strip’s influence is weak).

Author Contributions

C.G. and T.M.B. together designed the test plan and performed the experiments. C.G. performed the numerical simulations and wrote the manuscript. T.M.B. acquired the necessary funding, contributed to final review and manuscript corrections.

Funding

This research was funded by Politecnico di Torino Research Funding “RBA—Finanziamento di Ateneo alla ricerca”.

Conflicts of Interest

The authors declare no conflict of interest.

References

  1. Yang, B.D.; Chen, J.J.; Menq, C.H. Prediction of resonant response of shrouded blades with three-dimensional shroud constraint. J. Eng. Gas Turbines Power 1999, 121, 523–529. [Google Scholar] [CrossRef]
  2. Shi, Y.; Hong, J.; Shan, Y.; Zhu, Z. Forced response analysis of shrouded blades by an alternating frequency/time domain method. In Proceedings of the ASME Turbo Expo 2006: Power for Land, Sea, and Air, Volume 5: Marine; Microturbines and Small Turbomachinery; Oil and Gas Applications; Structures and Dynamics, Parts A and B, Barcelona, Spain, 8–11 May 2006. [Google Scholar]
  3. Szwedowicz, J.; Visser, R.; Sextro, W.; Masserey, P.A. On nonlinear forced vibration of shrouded turbine blades. J. Turbomach. 2008, 130, 011002. [Google Scholar] [CrossRef]
  4. Siewert, C.; Panning, L.; Wallaschek, J.; Richter, C. Multiharmonic forced response analysis of a turbine blading coupled by nonlinear contact forces. J. Eng. Gas Turbines Power 2010, 132, 082501. [Google Scholar] [CrossRef]
  5. Zucca, S.; Firrone, C.M.; Gola, M.M. Numerical assessment of friction damping at turbine blade root joints by simultaneous calculation of the static and dynamic contact loads. Nonlinear Dyn. 2011, 67, 1943–1955. [Google Scholar] [CrossRef]
  6. Gu, W.; Xu, Z.; Liu, Y. A method to predict the non-linear vibratory response of bladed disc system with shrouded dampers. Proc. Inst. Mech. Eng. Part C J. Mech. Eng. Sci. 2011, 226, 1620–1632. [Google Scholar] [CrossRef]
  7. Mitra, M.; Zucca, S.; Epureanu, B. Adaptive microslip projection for reduction of frictional and contact nonlinearities in shrouded blisks. J. Comput. Nonlinear Dyn. 2016, 11, 041016. [Google Scholar] [CrossRef]
  8. Pourkiaee, S.M.; Zucca, S. A reduced order model for nonlinear dynamics of mistuned bladed disks with shroud friction contacts. In Proceedings of the ASME Turbo Expo 2018: Turbomachinery Technical Conference and Exposition, Volume 7C: Structures and Dynamics, Oslo, Norway, 11–15 June 2018. [Google Scholar]
  9. Hartung, A.; Hackenberg, H.P.; Krack, M.; Gross, J.; Heinze, T.; von Scheidt, L.P. Rig and engine validation of the non-linear forced response analysis performed by the tool OrAgl. J. Eng. Gas Turbines Power 2018, 141, 021019. [Google Scholar] [CrossRef]
  10. Panning, L.; Sextro, W.; Popp, K. Optimization of interblade friction damper design. In Proceedings of the ASME Turbo Expo 2000: Power for Land, Sea, and Air, Volume 4: Manufacturing Materials and Metallurgy; Ceramics; Structures and Dynamics; Controls, Diagnostics and Instrumentation; Education, Munich, Germany, 8–11 May 2000. [Google Scholar]
  11. Panning, L.; Sextro, W.; Popp, K. Spatial dynamics of tuned and mistuned bladed disks with cylindrical and wedge-shaped friction dampers. Int. J. Rotat. Mach. 2003, 9, 219–228. [Google Scholar] [CrossRef]
  12. Petrov, E.P.; Ewins, D.J. Advanced modeling of underplatform friction dampers for analysis of bladed disk vibration. J. Turbomach. 2007, 129, 143–150. [Google Scholar] [CrossRef]
  13. Berruti, T.; Firrone, C.; Pizzolante, M.; Gola, M. Fatigue damage prevention on turbine blades: Study of underplatform damper shape. Key Eng. Mater. 2007, 347, 159–164. [Google Scholar] [CrossRef]
  14. Berruti, T. A test rig for the investigation of the dynamic response of a bladed disk with underplatform dampers. Mech. Res. Commun. 2010, 37, 581–583. [Google Scholar] [CrossRef]
  15. Sever, I.; Petrov, E.; Ewins, D. Experimental and numerical investigation of rotating bladed disk forced response using underplatform friction dampers. ASME J. Eng. Gas Turbines Power 2008, 130, 042503. [Google Scholar] [CrossRef]
  16. Firrone, C.M.; Berruti, T.M.; Gola, M.M. On force control of an engine order-type excitation applied to a bladed disk with underplatform dampers. J. Vib. Acoust. 2013, 135, 041103. [Google Scholar] [CrossRef]
  17. Botto, D.; Gastadi, C.; Gola, M.M.; Umer, M. An experimental investigation of the dynamics of a blade with two under-platform dampers. J. Eng. Gas Turbines Power 2017, 140, 032504. [Google Scholar] [CrossRef]
  18. Pesaresi, L.; Salles, L.; Jones, A.; Green, J.; Schwingshackl, C. Modelling the nonlinear behaviour of an underplatform damper test rig for turbine applications. Mech. Syst. Signal Process. 2017, 85, 662–679. [Google Scholar] [CrossRef] [Green Version]
  19. Šanliturk, K.; Ewins, D.; Stanbridge, A. Underplatform dampers for turbine blades: Theoretical modelling, analysis and comparison with experimental data. J. Eng. Gas Turbine Power 2001, 123, 919–929. [Google Scholar] [CrossRef]
  20. Panning, L.; Popp, K.; Sextro, W.; Götting, F.; Kayser, A.; Wolter, I. Asymmetrical underplatform dampers in gas turbine bladings: Theory and application. In Proceedings of the ASME Turbo Expo 2004: Power for Land, Sea, and Air Volume 6: Turbo Expo 2004, Vienna, Austria, 14–17 June 2004. [Google Scholar]
  21. Zucca, S.; Borrajo, J.; Gola, M. Forced response of bladed disks in cyclic symmetry with underplatform dampers. In Proceedings of the ASME Turbo Expo 2006: Power for Land, Sea, and Air, Volume 5: Marine; Microturbines and Small Turbomachinery; Oil and Gas Applications; Structures and Dynamics, Parts A and B, Barcelona, Spain, 8–11 May 2006. [Google Scholar]
  22. Koh, K.H.; Griffin, J.H. Dynamic behavior of spherical friction dampers and its implication to damper contact stiffness. J. Eng. Gas Turbines Power 2007, 129, 511–521. [Google Scholar] [CrossRef]
  23. Berruti, T.; Firrone, C.; Gola, M. A test rig for noncontact traveling wave excitation of a bladed disk with underplatform dampers. J. Eng. Gas Turbines Power 2011, 133, 1–7. [Google Scholar] [CrossRef]
  24. Gastaldi, C.; Berruti, T.M.; Gola, M.M. Best practices for underplatform damper designers. Proc. Inst. Mech. Eng. Part C J. Mech. Eng. Sci. 2018, 232, 1221–1235. [Google Scholar] [CrossRef]
  25. Botto, D.; Umer, M. A novel test rig to investigate under-platform damper dynamics. Mech. Syst. Signal Process. 2018, 100, 344–359. [Google Scholar] [CrossRef]
  26. Hüls, M.; von Scheidt, L.P.; Wallaschek, J. Influence of geometric design parameters onto vibratory response and HCF safety for turbine blades with friction damper. In Proceedings of the ASME Turbo Expo 2018: Turbomachinery Technical Conference and Exposition, Volume 7C: Structures and Dynamics, Oslo, Norway, 11–15 June 2018. [Google Scholar]
  27. Gastaldi, C.; Gola, M.M. Criteria for best performance of pre-optimized solid dampers. In Proceedings of the ASME Turbo Expo 2018: Turbomachinery Technical Conference and Exposition, Volume 7C: Structures and Dynamics, Oslo, Norway, 11–15 June 2018. [Google Scholar]
  28. Afzal, M.; Arteaga, I.L.; Kari, L. An analytical calculation of the Jacobian matrix for 3D friction contact model applied to turbine blade shroud contact. Comput. Struct. 2016, 177, 204–217. [Google Scholar] [CrossRef] [Green Version]
  29. Gastaldi, C.; Fantetti, A.; Berruti, T. Forced response prediction of turbine blades with flexible dampers: The impact of engineering modelling choices. Appl. Sci. 2017, 8, 34. [Google Scholar] [CrossRef]
  30. Fantetti, A.; Gastaldi, C.; Berruti, T. Modeling and testing friction flexible dampers: Challenges and peculiarities. Exp. Tech. 2018, 42, 407–419. [Google Scholar] [CrossRef]
  31. Battiato, G.; Firrone, C.; Berruti, T. Forced response of rotating bladed disks: Blade Tip-Timing measurements. Mech. Syst. Signal Process. 2017, 85, 912–926. [Google Scholar] [CrossRef]
  32. Rigosi, G.; Battiato, G.; Berruti, T.M. Synchronous vibration parameters identification by tip timing measurements. Mech. Res. Commun. 2017, 79, 7–14. [Google Scholar] [CrossRef]
  33. Craig, R.R.; Bampton, M.C.C. Coupling of substructures for dynamic analyses. AIAA J. 1968, 6, 1313–1319. [Google Scholar]
  34. Battiato, G.; Firrone, C.; Berruti, T.; Epureanu, B. Reduced order modeling for multi-stage coupling of cyclic symmetric structures. In Proceedings of the ISMA 2016—International Conference on Noise and Vibration Engineering and USD2016—International Conference on Uncertainty in Structural Dynamics, Leuven, Belgium, 17–19 September 2016. [Google Scholar]
  35. Gastaldi, C.; Berruti, T.M. A method to solve the efficiency-accuracy trade-off of multi-harmonic balance calculation of structures with friction contacts. Int. J. Non-Linear Mech. 2017, 92, 25–40. [Google Scholar] [CrossRef]
  36. Botto, D.; Lavella, M.; Gola, M.M. Measurement of contact parameters of flat on flat contact surfaces at high temperature. In Proceedings of the ASME Turbo Expo 2012: Turbine Technical Conference and Exposition, Volume 7: Structures and Dynamics, Parts A and B, Copenhagen, Denmark, 11–15 June 2012. [Google Scholar]
  37. Artetxe, E.; González, H.; Calleja, A.; Valdivielso, A.F.; Polvorosa, R.; Lamikiz, A.; Lacalle, L.N.L.D. Optimised methodology for aircraft engine IBRs five-axis machining process. Int. J. Mechatron. Manuf. Syst. 2016, 9, 385. [Google Scholar] [CrossRef]
  38. González, H.; Calleja, A.; Pereira, O.; Ortega, N.; de Lacalle, L.L.; Barton, M. Super abrasive machining of integral rotary components using grinding flank tools. Metals 2018, 8, 24. [Google Scholar] [CrossRef]
  39. Gastaldi, C.; Gola, M.M. Testing, simulating and understanding under-platform damper dynamics. In Proceedings of the VII European Congress on Computational Methods in Applied Sciences and Engineering (ECCOMAS 2016), Crete, Greece, 5–10 June 2016. [Google Scholar]
  40. Allara, M. A model for the characterization of friction contacts in turbine blades. J. Sound Vib. 2009, 320, 527–544. [Google Scholar] [CrossRef]
  41. Botto, D.; Lavella, M. A numerical method to solve the normal and tangential contact problem of elastic bodies. Wear 2015, 330–331, 629–635. [Google Scholar] [CrossRef]
  42. Schwingshackl, C.; Petrov, E.; Ewins, D. Measured and estimated friction interface parameters in a nonlinear dynamic analysis. Mech. Syst. Signal Process. 2012, 28, 574–584. [Google Scholar] [CrossRef]
  43. Lavella, M.; Botto, D.; Gola, M.M. Test rig for wear and contact parameters extraction for flat-on-flat contact surfaces. In Proceedings of the ASME/STLE 2011 Joint Tribology Conference, Los Angeles, CA, USA, 24–26 October 2011. [Google Scholar]
  44. Gola, M.; Gastaldi, C. Understanding complexities in underplatform damper mechanics. In Proceedings of the ASME Turbo Expo 2014: Turbine Technical Conference and Exposition, Volume 7A: Structures and Dynamics, Düsseldorf, Germany, 16–20 June 2014. [Google Scholar]
Figure 1. (a) test rig functional scheme; (b) photograph of the test rig.
Applsci 08 02174 g001
Figure 2. (a) scheme of the blades with the compressed air loading system; (b) close up on the strip loaded by the compressed air.
Applsci 08 02174 g002
Figure 3. (a) The four frequency response functions (FRFs) of the blades without strip and with the compressed air system switched off; (b) IP (in phase) FRFs of the blades without a strip in the case of compressed air turned on or off.
Applsci 08 02174 g003
Figure 4. (a) IP FRF of the two blades, blades with strip F E = 0.1 N and without. (b) OOP (out of phase) FRF of the two blades, blades with strip F E = 0.1 N and without.
Applsci 08 02174 g004
Figure 5. IP and OOP blades’ mode shape of vibration and corresponding strip behaviour.
Applsci 08 02174 g005
Figure 6. (a) IP FRFs of blade 1 for three different tests at F E = 0.1 N; (b) OOP FRFs of blade 1 for three different tests at F E = 0.1 N.
Applsci 08 02174 g006
Figure 7. (a) IP and (b) OOP FRFs for different excitation levels, tests repeated after having switched off and on the compressed air system.
Applsci 08 02174 g007
Figure 8. Functional scheme of the numerical simulation and its links to the experimental activity.
Applsci 08 02174 g008
Figure 9. (a) Free (i.e., no strip) numerical FRF compared to IP and OOP numerical full stick FRFs (b) Graphical representation of IP and OOP numerical full stick bending modes of vibration of blades-strip system.
Applsci 08 02174 g009
Figure 10. (a) IP and (b) OOP FRFs for different excitation levels, experimental numerical comparison for different values of | F E | .
Applsci 08 02174 g010

