Featured Application
The presented damage identification method has potential to be applied
to a wide range of offshore structures supported by jacket foundations.
Abstract
This paper presents a damage identification method for offshore jacket platforms using partially measured modal results and based on artificial intelligence neural networks. Damage identification indices are first proposed combining information of six modal results and natural frequencies. Then, finite element models are established, and damages in structural members are assumed by reducing the structural elastic modulus. From the finite element analysis for a training sample, both the damage identification indices and the damages are obtained, and neural networks are trained. These trained networks are further tested and used for damage prediction of structural members. The calculation results show that the proposed method is quite accurate. As the considered measurement points of the jacket platform are near the waterline, the prediction errors keep below 8% when the damaged members are close to the waterline, but may rise to 16.5% when the damaged members are located in deeper waters.
1. Introduction
It is of great importance to utilize ocean space and marine renewable energy, as land-based resources are increasingly depleted [1]. Offshore steel jacket platforms play an important role in oil and gas exploration, drilling operations, and transportation in ocean environments [2]. The jacket platform is a type of bottom-fixed offshore structure with many advantages. A jacket platform is often composed of slender tubular members, making the structure less exposed to ocean wave loads and relatively robust in adverse environments [3]. However, some natural phenomena such as earthquakes, wind, and currents can arise in the working environments [3,4,5,6]. A few catastrophic accidents of offshore jacket platforms occurred in the past years. For example, in 1964, hurricane Hilda, with wave height of 13 m and wind gusts up to 89 m/s, destroyed 13 platforms. The next year, hurricane Betsy destroyed three platforms and damaged many others [7]. The degradation of materials due to fatigue and corrosion may cause serious damage to the structural elements during their useful life [8], and the damage probability increases under adverse environments. Therefore, effective damage identification methods are desired by the industry [9], and research has been carried out in this area. Kenley et al. [10] presented a method of damage identification for jacket platforms using the frequency variation approach. Rotiman et al. [11] noted that the change of modal response amplitude can reflect the structural damage. Besides the damage identification method based on dynamic results, the damage identification methods based on model updating are focused on by many researchers. For example, Li et al. [12] presented a method for model updating using the cross-modal method and the Guyan scheme method. Weber et al. [13] studied a consistent regularization of nonlinear model updating for damage identification which can avoid unrealistic results due to inherent measurement errors. Link et al. [14] studied the performance of the two different model updating techniques to localize and quantify the damage. Reynders et al. [15] solved the identification problem with the OMAX approach. Xia et al. [16] proposed a substructure approach to extract the substructure dynamic flexibility matrices from the measured modal properties of the global structure and updated directly using the traditional model updating method. Fang et al. [17] improved the model updating method using response surfaces and performed damage identification. Xu et al. [18] proposed a probability-based damage detection procedure using model updating. Simoen et al. [19] performed damage assessment using model updating with uncertainty. Waeytens et al. [20] improved the updating method using the Bayesian approach. Altunışık et al. [21] proposed an automated model updating method considering multiple crack effects. Pedram et al. [22] introduced the power spectral density to model updating of damage identification. Nozari et al. [23] studied the effects of variability in ambient vibration measurements on model updating and performed damage identification. Lu et al. [24] proposed a sensitivity-based finite element model updating approach to identify the local damages in the axially functionally graded beams. Behmanesh et al. [25] proposed a process to mitigate the effects of modeling errors during model updating. Pérez et al. [7] proposed a methodology for damage identification using the damage submatrices method. In addition, Haeri et al. [26] presented a new approach for structural health monitoring of offshore jacket platforms using inverse vibration technique. Generally, damage detection is a type of inverse problem, and one needs to determine structural parameters based on given structural responses. Because artificial neural networks (ANNs) have a strong ability to solve inverse problems that cannot be described in terms of explicit mathematical formulae, they have been used to solve many different kinds of problems. Mangalathu et al. did a lot of research based on machine learning and found that ANNs can solve those problems effectively and efficiently [27,28,29,30]. Guo et al. [31] used back-propagation network to investigate the model updating of a suspended dome and proposed a method to increase the prediction precision of backpropagation (BP) network. Mangalathu et al. [32] proposed a multiparameter fragility methodology, which uses an artificial neural network to generate bridge-specific fragility curves without grouping the bridge classes. Wang et al. [33] constructed an ANN to improve the computational efficiency for the calculation of structural failure. We can also apply ANNs to solving damage identification problems. Adams et al. [34] first performed damage detection through inputting vibration test data into the back propagation (BP) neural networks in the 1970s. Then, Tsou et al. [35] input the absolute eigenvalues of a spring proton system into the BP neural networks and verified the validity of neural networks in solving damage detection. Sahin [36] input frequency change and curvature mode into neural networks and identified the damage position in a cantilever beam. Lee [37] studied sensitivity of the difference of the model components before and after the structural damage to the model parameter errors using the BP neural networks. Diao et al. [38] regarded the frequency square as a damage index to identify the element damage using neural networks. Pathirage et al. [39] proposed a structural damage identification method based on the auto encoder framework, which can support deep neural networks. Tan et al. [40] presented a vibration-based technique using only the first vibration mode for predicting damage and its location using ANNs. Ye et al. [41] used ANNs with a large amount of training data (damage cases) to establish a mutuality between the quantity of training data and the accuracy of damage location. Padil et al. [42] proposed to use nonprobabilistic ANNs to address the problem of uncertainty in vibration damage detection. ANNs were also used in others research areas [43,44,45,46].
Although existing damage identification methods can be applied to identify structural damage, the primary study objectives are often onshore civil structures including bridges and architectures, and the structural overall modal results are used as damage indices. For offshore structures that are partially submerged, the modal results are often obtained from a limited number of sensor measurements, and it is difficult to get the overall modal results in practice. Thus, to predict structural damage given partial modal results in the form of sporadic sensor measurements is desirable. To this end, this paper presents a method that can facilitate the damage identification of offshore steel platforms.
The layout of the paper is as follows. Section 2 presents the proposed damage identification index and the ANN method for damage identification. Section 3 introduces the general damage identification process applicable to offshore structures. Section 4 shows the case study of a jacket platform with damages, and performs damage identification using the proposed method. Finally, Section 5 concludes the paper.
2. Damage Identification Approach
2.1. Damage Identification Index
Practically, structural modal results can be available from measurements or tests. Thus, modal results are usually regarded as the structural damage indices for damage identification [47]. The equation for modal analysis can be described as follows:
where and are the structural overall stiffness matrix and mass matrix, respectively. and represent the ith order structural frequency and the corresponding normal mode, respectively.
When times both sides of Equation (1), we can get the following expression due to the orthogonality of mode shape:
Suppose the difference in the structural stiffness between the intact structure and the damaged structure is , and the corresponding structural square frequency and mode will change by and , respectively. The equation can be reformulated as:
According to Equation (3), the structural damage will result in a change in the structural square frequencies and normal modes. Thus, both the frequencies and the modes can be considered in damage indices.
Ignore the higher order quantity, and Equation (3) can be simplified as:
The square frequency of the damaged structure and the intact structure are defined as and , respectively. The relative difference of the square frequency between the intact structure and the damaged structure can be described as follows:
where is the relative difference of the ith order square frequency between the intact and the damaged structures; it is almost proportional to the difference in the structural stiffness between the intact and damaged structures. Thus, it will be regarded as a damage index in the following. In addition, according to Equation (3), we know that structural damage will result in modal changes. So the modal differences between the intact and damaged structures can also be utilized in damage indices. The modal difference can be calculated as follows:
where and are the ith order modes for the damaged structure and the intact structure, respectively.
It is easier to identify structural damage in high-order modes than in low-order modes [48], but in practice, it is often difficult to obtain high-order modal results precisely, and measurement errors may lead to large output errors after calculation. Thus, this study assumes that the lowest six orders of the modal results in the x-, y-, and z-directions are available for more convincing calculation results. For marine structures, sensors can be placed at specified nodal locations below the waterline and provide measurements. These measurements are incomplete and can only provide part of the modal results which are called partial modal results in the following. The partial modal results are still difficult to handle directly because of the large quantity of data. If sensors are distributed at nodal positions of the submerged marine structure, and each sensor can collect orders of the modal results in three directions, then there are damage indices which are too heavy for damage identification purposes. To reduce the total number of damage indices and to simplify the form of the artificial neural network, this study suggests using the sum of the first modal results in the x-, y-, and z-directions at each measurement point as one single damage index as follows:
where , , and are the ith order modes for the ith measurement point in the x-, y-, and z-directions, respectively.
2.2. Damage Identification Method
ANNs have an excellent ability to learn and describe highly nonlinear and strongly coupled relationships between multiple-input and multiple-output parameters [49,50]. The basic structure of a neuron is shown in Figure 1.
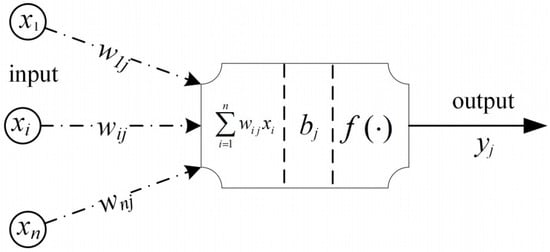
Figure 1.
Schematic of the basic structure of a neuron. Figure 1 is reproduced from reference [50].
In Figure 1, is the nth input signal, is the connection weight, is the threshold value of the ith neuron, and is the output signal of the ith neuron. The neuron output signal is calculated by the activation function, as follows:
For a damage identification process, the input signals can be damage indices, and the output signals can be damages in structural elements. In this study, we set the damages as the difference of the elastic modulus between the damaged and intact structural elements. The output signal can be described as follows:
where and are the elastic modulus of the ith damaged element and intact element, respectively. We consider a popular activation function f for BP networks, the sigmoidal function, in this work:
Here, c is selected as 1.
The BP neural network is a multilayer feed-forward network, whose basic structural network scheme is shown in Figure 2.
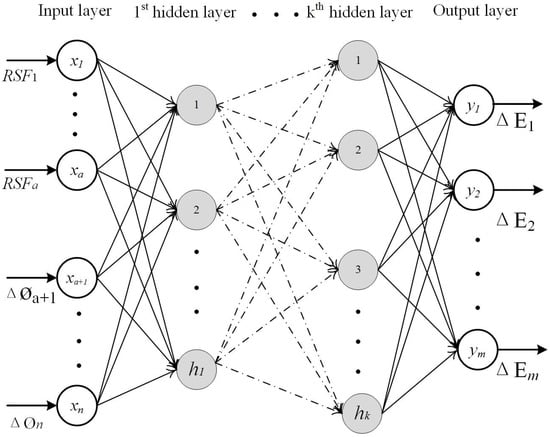
Figure 2.
Structure of the BP (backpropagation) network.
The number of input and output neurons (n, m) and the hidden layer (k) are first determined based on the engineering problem of interest. In our case, the total number of damaged elements and the total number of damage indices are known. The total number of units in the ith hidden layer (hi) is determined by the following function:
Then, the connection weights () and thresholds () are initialized to values between −1 and +1 randomly.
Training networks is a process of repeatedly updating the and based on the difference between the network outputs and the desired outputs until the output error is within a certain range.
The most interesting characteristic of ANNs is the capability to familiarize themselves with problems by training and, after sufficient training, to be able to solve unknown problems of the same class. Thus, we can utilize the trained network to identify the structural damage according to the measurement results.
3. Damage Identification Process
A general damage identification procedure is proposed in this paper. As shown in Figure 3, the procedure includes four main steps including finite element modeling, production of training samples, training of neuron networks, and prediction of structural damage. In the first step, detailed finite element models of offshore structures should be established for individual projects. The sample number and the prediction precision ε also need to be specified in this step. In the second step, the training samples are produced using the updated damaged model. As mentioned in Section 2.1 and Section 2.2, the difference of the elastic modulus between intact and damaged elements may be used as a damage indicator (ΔE), and the relative difference of the square frequency () and the modal difference (ΔØ) can be used as damage indices. To reduce the total number of damage indices, this paper proposes to use the combined damage index ([RSF, ΔØ]) and the damage values of elements (ΔE) as the training data for the BP networks. The training data are obtained from modal analysis of the finite element model. In the third step, neural networks are established using the training data, and then the networks are trained using the training samples. Note that the trained BP networks must be validated using a test sample. Steps 2 and 3 involve iterations. If the prediction precision is less than the given value ε, the process will switch to the second step to enlarge the training sample numbers . In the fourth step, prediction of damage is performed using the modal values from sensor measurements.
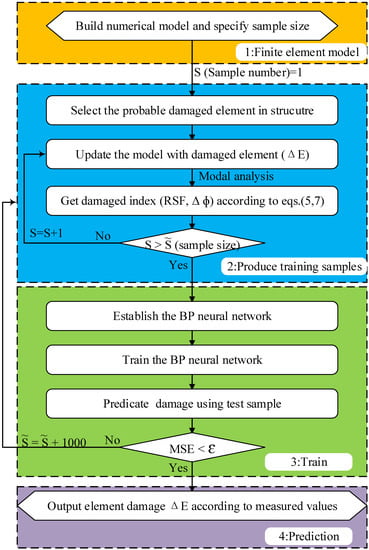
Figure 3.
Analysis flowchart; (MSE: Mean Squared Error).
4. Case Study: Damage Identification of a Jacket Platform
4.1. Finite Element Modeling
The paper selects a representative jacket platform as shown in Figure 4. The jacket structure is composed of four main tubes connected by horizontal and diagonal members. There are two platforms upon the mean water level, and their sizes are both 30 × 20 m in plane view. The vertical dimension between the waterline and the top deck is 15 m. The overall height of the structure is 65 m. Detailed dimensions are shown in Figure 4. During the finite element calculations, the ANSYS software was used. Deck beams are square steel tubes, and all the other members of the platform are circular steel tubes. The section parameters and finite element types of the structural members are listed in Table 1. During the damage identification, 12 sensors are used to measure the local structural deformation. The sensors are located at important nodal positions close to the water surface; see Figure 4.
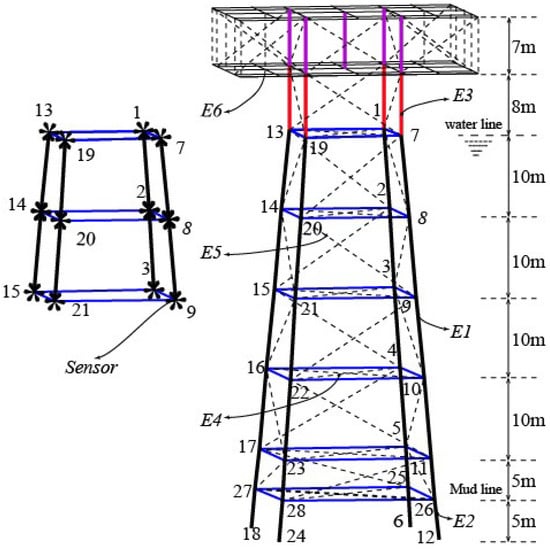
Figure 4.
An offshore jacket platform.

Table 1.
Parameters of the structural model.
4.2. Damage Scenario
Supposing that the mass of the structural components is unchanged, damage of the components is simulated by reducing their elastic modulus. The damage value for each damage component is a random value between 0.0% and 50.0% (i.e., = 0.5~1 as shown in Equation (9)).
Four main tubes support the entire platform structure. These main tubes are the most important components for a jacket structure. The main pipes near the mean water level are vulnerable to damage because they always suffer serious corrosion together with complex external loading. Therefore, this paper selects eight members of the platform near the sea level as the damage components which are named as E1,2, E2,3, E7,8, E13,14, E19,20, E8,9, E14,15, E20,21. Here, Ei,j refers to the component between the ith node and the jth node. In this paper, the finite element code ANSYS is used to analyze the structural natural frequencies and modal shapes. Generally, for marine structures, the effect of the hydrodynamic added mass on the natural frequencies of the global mode shapes is limited, especially for the lowest modal shapes [51]. Since the focus of this paper is on a new approach for damage identification, we do not consider the effect of hydrodynamic added mass in the analysis for simplicity. During calculation, 12 nodes corresponding to the sensor locations are selected as the test points. As shown in Figure 4, the test nodes are No. 1, 2, 3, 7, 8, 9, 13, 14, 15, 19, 20, 21. After calculation, the first 6 natural frequencies and the corresponding displacement modal values at the 12 nodes in the x-, y-, and z-directions are determined for the damaged structure. Then, the frequency indices (i = 1~6) and the modal indices (l = 1~12) are combined according to Equations (5) and (6), and 20,000 sets of training sample data are obtained. Selected sample data are shown in Table 2.

Table 2.
Selected training sample data.
4.3. Damage Identification Using Different Training Samples
The structure of the BP neural network is constructed in the form of 18 × 17 × 8 according to Equation (11), and the training samples are used to train the network. The Levenberg–Marquardt algorithm is selected as the training function. The maximum number of training is 500 times and the training accuracy is set as . The minimum gradient is . The learning rate is 0.01 and the momentum factor is 0.9.
To study the influence of the training sample size on the accuracy of prediction, this paper selects random training samples from the 20,000 groups of sample data. The training sample size is increased from 1000 to 20,000 at an interval of 1000, and 20 groups of training samples are used to train the networks. In this work, four groups of test samples listed in Table 3 are generated randomly using the trained networks. The accuracy of the predicted value is analyzed using the mean squared errors (MSE) which calculates the summed errors between the predicted and original values of the test sample. If N data are divided into r groups, and the sample variance of group i is , then the formula of MSE can be written as follows:
where MSE is the sum of the squared errors, and (N − r) is the degrees of freedom.

Table 3.
Test samples.
Figure 5 shows the variation of the MSE with the sample size of the training data. As shown, MSE changes between 0.0005 and 0.0015. Generally, the prediction error tends to decrease with the increase of the sample size, and the prediction accuracy gets quite stable when the sample size reaches 17,000. From this sensitivity study, it is revealed that a sample number of 7000 yields minimum error, and the corresponding MSE value is 0.000542.
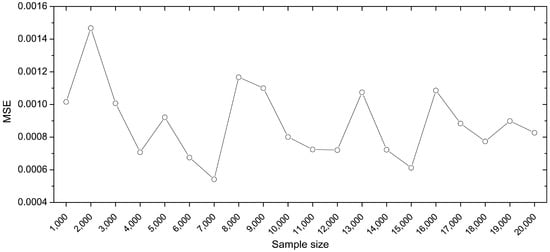
Figure 5.
Relation between the training sample size and the prediction accuracy.
4.4. Effect of Damage Identification for Damaged Elements at Different Locations
Figure 3 shows that most structural components of the jacket platform are located below the sea level. Practically speaking, it is more demanding to install underwater sensors at deeper locations. Assuming that the 12 sensor positions are kept fixed, we can study the accuracy of the damage identification method considering different locations of the damaged components. One can intuitively expect that the prediction accuracy would be better when the damaged components are closer to the sensor positions.
In reality, damage can occur to any structural components randomly. However, the components near the water level are relatively more vulnerable to damage because of higher exposure to corrosion and wave impact. Still, for the sake of simplicity, we divide the whole underwater structure into four areas from top to bottom: A, B, C, and D. In each area, eight elements are assumed to be damaged, and the corresponding element numbers are summarized in Table 4. Note that existing sensors are all located in area A. It is interesting to test the prediction accuracy when damaged elements are located in areas B, C, and D.

Table 4.
Divided areas and the corresponding damaged elements.
We use the damaged values listed in Table 2 for the damaged elements in the four areas and use the training sample size of 7000, which has minimum MSE. Then we employ the proposed damage identification method to predict the structural damage for each assumed group of damaged elements. To compare the prediction accuracy, test samples with the same damaged values as those in Table 3 are considered. For each test sample D1, D2, D3, and D4 and for each damaged element in the assumed damaged area, the relative error is calculated as the percentage difference between the predicted damage by the BP networks and the actual damage. The relative error is deemed an important indicator of the prediction accuracy.
Figure 6 shows the variation of the prediction errors of the damage identification method when the damaged areas vary. In general, the trained BP neural networks can effectively identify the damage of components using the combination indices proposed. As expected, the prediction accuracy of the damage identification scheme reduces with the increase of distance between the damaged components and the measurement points. When the damaged components are located in area A and overlapping with the measurement points, the identification accuracy is high, with an MSE of 0.0005891 and a relative error of less than 8% among the test samples. When the damaged components are located in area D and far away from the measurement points, the damage identification accuracy reduces, with an MSE of 0.00162 and a relative error of less than 13% among the test samples. Note that the largest relative error of 16.85% is observed for element E4,5 in sample No.4 when damage is located in area C. Still, this level of relative error can be beneficial to the decision-making of maintenance activities, because the sensor positions are close to the water line and easy to handle. The damage level varies across the four test samples, and for one structural member, there exists certain variability in the prediction. For example, for element E17,18 in area D, the relative error remains below 5% for sample No. 1 to 3, but exceeds 10% for sample No. 4. Such a variability indicates further room for improvement of the damage identification method.
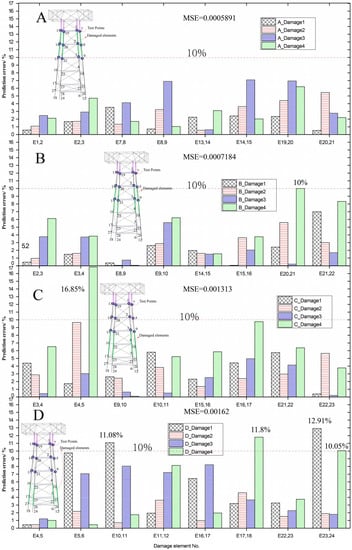
Figure 6.
Relative errors of the predicted damage for varying damaged elements.
To demonstrate the effectiveness of the proposed combination damage index (Equation (7)), this paper compares the prediction accuracy of the combination against three other classical damage indices (, , ).
Selected results for Area A are presented in Figure 7. As indicated, the prediction errors are generally minimum using the combination indices proposed, with the maximum prediction error of 7% and the average error of 2.83%. When the damage indices are just measurement points in the x-direction (), the damage identification accuracy reduces and the maximum identification error is close to 9% among the test samples and the average prediction error is close to 3.2%. When the damage indices are just measurement points in the y-direction (), the damage identification accuracy has an MSE of 0.0016 and a maximal relative error of more than 17% among the test samples. When the damage indices are just measurement points in the z-direction (), the damage identification has an MSE of 0.001 and a maximum relative error of more than 9% among the test samples. Thus, it is a good choice to use the sum of the first modal results in the x-, y-, and z-directions at each measurement point as one single damage index during the damage identification process.
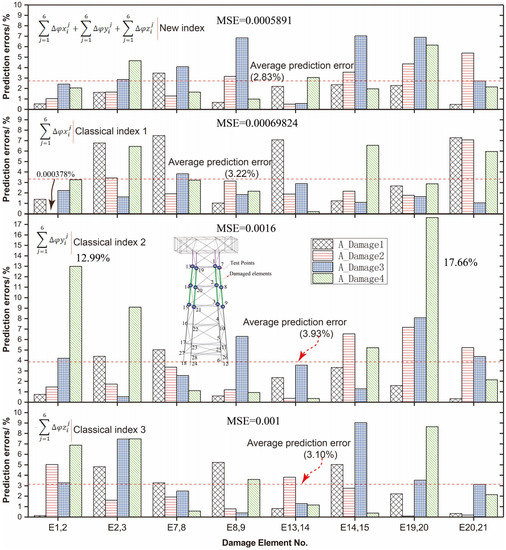
Figure 7.
Comparison of the prediction accuracy of the new damage index against classical indices for area A.
5. Conclusion
In this paper, a damage identification procedure applicable to offshore jacket platforms is presented. The following conclusions are drawn:
- (1)
- A neural-network-based method for quantitative identification of structural damage is proposed. Through the case study of an offshore jacket platform, it is proven that this method can effectively identify the structural damages of different components.
- (2)
- New damage indices are proposed combining the squared frequency and the sum of the first β partial modal results. These new damage indices use the lowest six modal results of the structure as inputs, and such combination indices can reduce the difficulty of handling large quantities of measurement data typical of engineering structures.
- (3)
- The size of training samples is important during training of the artificial neural networks, and the sample size should be increased until the prediction accuracy is satisfactory. Generally, the mean squared error of the test samples tends to decrease with the increase of the training sample size.
- (4)
- When the damaged components are located in an area close to the measurement points and sensor positions, the accuracy of the damage identification method is high. When the damaged components are farther away from the measurement points, the identification prediction error tends to increase and may exceed 16%. Four test samples with different damages are considered, and there are certain variabilities in the prediction.
6. Future Work
In this paper, it is assumed that there are eight damage elements in the structure. When the number of damaged components is increased, finding an accurate identification method and sensitive diagnostic indicators can be interesting research areas. Redistribution of the measurement points, increase of the order of the modal results, design of new damage identification indices, and improved structure of the neural networks may lead to better performance of the proposed damage identification method. In future, either approach can be pursued further, and trials and errors should be involved.
Author Contributions
Conceptualization, J.G. (Jiamin Guo); Funding acquisition, J.G. (Jiamin Guo); Investigation, J.W.; Methodology, J.G. (Jiamin Guo) and Z.J.; Project administration, J.G. (Jiamin Guo); Resources, J.G. (Junhua Guo); Software, J.W.; Supervision, J.G. (Jiamin Guo); Writing—original draft, J.W.; Writing—review & editing, Jiang, Z.Y.
Funding
The study was supported by the National Natural Science Foundation of China (No. 51108259), Chinese Postdoctoral Science Foundation (No. 2016M601960), Natural Science Foundation of Shanghai (No. 17ZR1412600), and State Key Laboratory of Ocean Engineering (Shanghai Jiao Tong University) (No. 1709).
Conflicts of Interest
The authors declare no conflict of interest. The funders had no role in the design of the study; in the collection, analyses, or interpretation of data; in the writing of the manuscript, or in the decision to publish the results.
References
- Zhang, B.; Liu, Y.; Ma, H.; Tang, G. Discrete feedforward and feedback optimal tracking control for offshore steel jacket platforms. Ocean Eng. 2014, 91, 371–378. [Google Scholar] [CrossRef]
- Mohamed, A.R. Structural control of a steel jacket platform. Struct. Eng. Mech. 1996, 4, 125–138. [Google Scholar]
- Park, M.S.; Koo, W.K.; Kawano, K. Dynamic response analysis of an offshore platform due to seismic motions. Eng. Struct. 2011, 33, 1607–1616. [Google Scholar] [CrossRef]
- Kazemy, A. Robust mixed H∞/passive vibration control of offshore steel jacket platforms with structured uncertainty. Ocean Eng. 2017, 139, 95–102. [Google Scholar] [CrossRef]
- Wang, S.; Li, H.; Han, J. Damage detection of an offshore jacket structure from partial modal information: numerical study. In Proceedings of the Seventh ISOPE Pacific/Asia Offshore Mechanics Symposium, Dalian, China, 17–21 September 2006; International Society of Offshore and Polar Engineers: Mountain View, CA, USA, 2006. [Google Scholar]
- Yang, Y.; Ying, X.; Guo, B.; He, Z. Collapse safety reserve of jacket offshore platforms subjected to rare intense earthquakes. Ocean Eng. 2017, 131, 36–47. [Google Scholar] [CrossRef]
- Pérez, J.E.R.; Rodríguez, R.; Vázquez-Hernández, A.O. Damage detection in offshore jacket platforms with limited modal information using the Damage Submatrices Method. Mar. Struct. 2017, 55, 78–103. [Google Scholar] [CrossRef]
- El-Reedy, M.A. Offshore Structures: Design, Construction and Maintenance; Gulf Professional Publishing: Houston, TX, USA, 2012. [Google Scholar]
- Asgarian, B.; Aghaeidoost, V.; Shokrgozar, H.R. Damage detection of jacket type offshore platforms using rate of signal energy using wavelet packet transform. Mar. Struct. 2016, 5, 1–21. [Google Scholar] [CrossRef]
- Kenley, R.M.; Dodds, C.J. West Sole WE Platform: Detection of Damage by Structural Response Measurements. In Proceedings of the Offshore Technology Conference 1980, Houston, TX, USA, 5–8 May 1980. [Google Scholar]
- Roitman, N.; Viero, P.F. Identification of offshore platforms structural damage using modal analysis techniques. Mech. Syst. Signal Process. 1992, 6, 287–295. [Google Scholar] [CrossRef]
- Li, H.; Wang, J.; Hu, S.J. Using incomplete modal data for damage detection in offshore structures. Ocean Eng. 2008, 35, 1793–1799. [Google Scholar] [CrossRef]
- Weber, B.; Paultre, P.; Proulx, J. Consistent regularization of nonlinear model updating for damage identification. Mech. Syst. Signal Process. 2009, 23, 1965–1985. [Google Scholar] [CrossRef]
- Link, M.; Weiland, M. Damage identification by multi-model updating in the modal and in the time domain. Mech. Syst. Signal Process. 2009, 23, 1734–1746. [Google Scholar] [CrossRef]
- Reynders, E.; Teughels, A.; Roeck, G.D. Finite element model updating and structural damage identification using OMAX data. Mech. Syst. Signal Process. 2010, 24, 1306–1323. [Google Scholar] [CrossRef]
- Xia, Y.; Weng, S.; Xu, Y. A substructuring method for model updating and damage identification. Procedia Eng. 2011, 14, 3095–3103. [Google Scholar] [CrossRef]
- Fang, S.; Perera, R. Damage identification by response surface based model updating using D.-optimal design. Mech. Syst. Signal Process. 2011, 25, 717–733. [Google Scholar] [CrossRef]
- Xu, Y.; Qian, Y.; Chen, J.; Song, G. Probability-based damage detection using model updating with efficient uncertainty propagation. Mech. Syst. Signal Process. 2015, 60–61, 958–970. [Google Scholar] [CrossRef]
- Simoen, E.; Roeck, G.D.; Lombaert, G. Dealing with uncertainty in model updating for damage assessment: A. review. Mech. Syst. Signal Process. 2015, 56–57, 123–149. [Google Scholar] [CrossRef]
- Waeytens, J.; Rosić, B.; Charbonnel, P.E.; Merliot, E.; Siegert, D.; Chapeleau, X.; Vidal, R.; Corvec, V.L.; Cottineau, L.M. Model updating techniques for damage detection in concrete beam using optical fiber strain measurement device. Eng. Struct. 2016, 129, 2–10. [Google Scholar] [CrossRef]
- Altunışık, A.C.; Okur, F.Y.; Kahya, V. Automated model updating of multiple cracked cantilever beams for damage detection. J. Constr. Steel Res. 2017, 138, 499–512. [Google Scholar] [CrossRef]
- Pedram, M.; Esfandiari, A.; Khedmati, M.R. Damage detection by a FE model updating method using power spectral density: Numerical and experimental investigation. J. Sound Vib. 2017, 397, 51–76. [Google Scholar] [CrossRef]
- Nozari, A.; Behmanesh, I.; Yousefianmoghadam, S.; Moaveni, B.; Stavridis, A. Effects of variability in ambient vibration data on model updating and damage identification of a 10-story building. Eng. Struct. 2017, 151, 540–553. [Google Scholar] [CrossRef]
- Lu, Z.R.; Lin, X.X.; Chen, Y.M.; Huang, M. Hybrid sensitivity matrix for damage identification in axially functionally graded beams. Appl. Math. Model. 2017, 41, 604–617. [Google Scholar] [CrossRef]
- Behmanesh, I.; Moaveni, B.; Papadimitriou, C. Probabilistic damage identification of a designed 9-story building using modal data in the presence of modeling errors. Eng. Struct. 2017, 131, 542–552. [Google Scholar] [CrossRef]
- Haeri, M.H.; Lotfi, A.; Dolatshahi, K.M.; Golafshani, A.A. Inverse vibration technique for structural health monitoring of offshore jacket platforms. Appl. Ocean Res. 2017, 62, 181–198. [Google Scholar] [CrossRef]
- Mangalathu, S.; Jeon, J.S.; DesRoches, R.; Padgett, J. Application of Bayesian Methods to Probabilistic Seismic Demand Analyses of Concrete Box-Girder Bridges. In Proceedings of the Geotechnical and Structural Engineering Congress 2016, Phoenix, AZ, USA, 14–17 February 2016; American Society of Civil Engineers: Reston, VA, USA, 2016; pp. 1367–1379. [Google Scholar]
- Mangalathu, S.; Jeon, J.S. Classification of failure mode and prediction of shear strength for reinforced concrete beam-column joints using machine learning techniques. Eng. Struct. 2018, 160, 85–94. [Google Scholar] [CrossRef]
- Ni, P.; Mangalathu, S. Fragility analysis of gray iron pipelines subjected to tunneling induced ground settlement. Tunn. Undergr. Space Technol. 2018, 76, 133–144. [Google Scholar] [CrossRef]
- Krishnan, N.M.A.; Mangalathu, S.; Smedskjaer, M.M.; Tandia, A.; Burton, H.; Bauchy, M. Predicting the dissolution kinetics of silicate glasses using machine learning. J. Non-Cryst. Solids 2018, 487, 37–45. [Google Scholar] [CrossRef]
- Guo, J.M.; Zhao, X.X.; Guo, J.H.; Yuan, X.F.; Dong, S.L.; Xiong, Z.X. Model updating of suspended-dome using artificial neural networks. Adv. Struct. Eng. 2017, 20, 1727–1743. [Google Scholar] [CrossRef]
- Mangalathu, S.; Heo, G.; Jeon, J.-S. Artificial neural network based multi-dimensional fragility development of skewed concrete bridge classes. Eng. Struct. 2018, 162, 166–176. [Google Scholar] [CrossRef]
- Wang, Z.; Pedroni, N.; Zentner, I.; Zio, E. Seismic fragility analysis with artificial neural networks: Application to nuclear power plant equipment. Eng. Struct. 2018, 162, 213–225. [Google Scholar] [CrossRef]
- Admas, R.D.; Walton, D.; Flitcroft, J.E.; Short, D. Vibration testing as a nondestructive test tool for composite materials. Conf. Compos. Reliab. 1975, 159–175. [Google Scholar] [CrossRef]
- Tsou, P.; Shen, M. Structural damage detection and identification using neural networks. AIAA J. 1994, 32, 176–183. [Google Scholar] [CrossRef]
- Sahin, M.; Shenoi, R.A. Quantification and Localization of Damage in Beam-like Structures by using Artificial Neural Networks with Experimental. Eng. Struct. 2003, 25, 1785–1802. [Google Scholar] [CrossRef]
- Lee, J.J.; Lee, J.W.; Yi, J.H. Neural Networks-based Damage Detection for Bridges Considering Errors in Baseline Finite Element Models. J. Sound Vib. 2005, 280, 555–578. [Google Scholar] [CrossRef]
- Diao, Y.; Li, H. Study on damage diagnosis of offshore platform by artificial neural networks. Shock Vib. 2006, 25, 98–103. [Google Scholar]
- Pathirage, C.S.N.; Li, J.; Li, L.; Hao, H.; Liu, W.; Ni, P. Structural damage identification based on autoencoder neural networks and deep learning. Eng. Struct. 2018, 172, 13–28. [Google Scholar] [CrossRef]
- Tan, Z.X.; Thambiratnam, D.P.; Chan, T.H.T.; Razak, H.A. Detecting damage in steel beams using modal strain energy based damage index and Artificial Neural Network. Eng. Fail. Anal. 2017, 79, 253–262. [Google Scholar] [CrossRef]
- Ye, L.; Su, Z.; Yang, C.; He, Z.; Wang, X. Hierarchical development of training database for artificial neural network-based damage identification. Compos. Struct. 2006, 76, 224–233. [Google Scholar] [CrossRef]
- Padil, K.H.; Bakhary, N.; Hao, H. The use of a non-probabilistic artificial neural network to consider uncertainties in vibration-based-damage detection. Mech. Syst. Signal Process. 2017, 83, 194–209. [Google Scholar] [CrossRef]
- Koç, A.A.; Yeniay, Ö. A comparative study of artificial neural networks and logistic regression for classification of marketing campaign results. Math. Comput. Appl. 2013, 18, 392–398. [Google Scholar] [CrossRef]
- Payán-Serrano, O.; Bojórquez, E.; Bojórquez, J.; Chávez, R.; Reyes-Salazar, A.; Barraza, M.; López-Barraza, A.; Rodríguez-Lozoya, H.; Corona, E. Prediction of maximum story drift of mdof structures under simulated wind loads using artificial neural networks. Appl. Sci. 2017, 7, 563. [Google Scholar] [CrossRef]
- Shah, S.A.R.; Brijs, T.; Ahmad, N.; Pirdavani, A.; Shen, Y.; Basheer, M.A. Road safety risk evaluation using gis-based data envelopment analysis—artificial neural networks approach. Appl. Sci. 2017, 7, 886. [Google Scholar] [CrossRef]
- Saleem, W.; Zain-ul-abdein, M.; Ijaz, H.; Salmeen Bin Mahfouz, A.; Ahmed, A.; Asad, M.; Mabrouki, T. Computational analysis and artificial neural network optimization of dry turning parameters—AA2024-T351. Appl. Sci. 2017, 7, 642. [Google Scholar] [CrossRef]
- Palacz, M.; Krawczuk, M. Vibration parameters for damage detection in structures. J. Sound Vib. 2002, 249, 999–1010. [Google Scholar] [CrossRef]
- Radzienski, M.; Krawczuk, M.; Palacz, M. Improvement of damage detection methods based on experimental modal parameters. Mech. Syst. Signal Process. 2011, 25, 2169–2190. [Google Scholar] [CrossRef]
- Kriesel, D. Neural Networks. 2005. Available online: http://www.dkriesel.com/_media/science/neuronalenetze-en-zeta2-2col-dkrieselcom.pdf (accessed on 20 September 2018).
- Guo, J.M.; Yuan, X.F.; Xiong, Z.X.; Dong, S.L. Force finding of suspended-domes using back propagation (bp) algorithm. Adv. Steel Constr. 2016, 12, 17–31. [Google Scholar]
- Moll, H.G.; Vorpahl, F.; Busmann, H.G. Dynamics of Support Structures for Offshore Wind Turbines in Fully-coupled Simulations—Influence of Water Added Mass on Jacket Mode Shapes, Natural Frequencies and Loads. In Proceedings of the European Wind Energy Conference and Exhibition, Warsaw, Poland, 20–23 April 2010; Curran: Red Hook, NY, USA, 2010. [Google Scholar]
© 2018 by the authors. Licensee MDPI, Basel, Switzerland. This article is an open access article distributed under the terms and conditions of the Creative Commons Attribution (CC BY) license (http://creativecommons.org/licenses/by/4.0/).