Article

Experimental Study of Condensation Heat Transfer and Pressure Drop inside a Small Diameter Microfin and Smooth Tube at Low Mass Flux Condition

1
Graduate School of Science and Engineering, Saga University, 1 Honjomachi, Saga 840-8502, Japan
2
Department of Mechanical Engineering, Saga University, 1 Honjomachi, Saga 840-8502, Japan
3
International Institute for Carbon-Neutral Energy Research, Kyushu University, Fukuoka 819-0395, Japan
*
Author to whom correspondence should be addressed.
Appl. Sci. 2018, 8(11), 2146; https://doi.org/10.3390/app8112146
Submission received: 22 October 2018 / Revised: 31 October 2018 / Accepted: 31 October 2018 / Published: 2 November 2018
(This article belongs to the Special Issue Sciences in Heat Pump and Refrigeration)

Abstract

:
This study was made to investigate the condensation local heat transfer and adiabatic pressure drop of R134a inside a 2.5 mm outside diameter smooth and microfin tube at low mass flux condition. Data were measured for mass fluxes from 50 to 300 kg m−2s−1, vapor qualities from 0 to 1 and saturation temperatures from 20 to 30 °C. The effects of mass flux, vapor quality, saturation temperature, microfin and diameter of test tube were analyzed. The pressure drop of the microfin tube was about 1.5 times higher than that of the smooth tube at mass flux 50 kg m−2s−1. The heat transfer coefficient of the microfin tube was about 2–5 times higher than that of the smooth tube at mass flux 100 kg m−2s−1. Experimental results were also compared with typical correlations. For the microfin tube, however, all the existing correlations do not adequately predict the present data. Poor predictions may be attributed to the lack of the small diameter microfin tube with low mass flux data in their database. Hence, it is essential to develop a condensation and pressure drop correlation for the small diameter microfin tube at low mass flux condition.

1. Introduction

The demand for air-conditioner and refrigerator is increasing in both developed and emerging countries along with the development of life standard. Therefore, the energy demand of the world is increasing and expected to be higher in the near future; however, already because of using a huge amount of energy, the earth’s climate has changed. Manufacturers are now using the environment friendly latest technology advancement in the air-conditioning and refrigeration field to improve the system performance. Recently, small diameter (do < 7 mm) microfin and smooth tube use in RAC industry can improve the system performance. Moreover, small diameter microfin tubes also provide many other advantages such as reduction of refrigerant charge, less weight, effectiveness, compactness, environment friendly, etc. In microfin tubes, as they consist of fins, the effects of surface tension and shear stress on the heat transfer regime are also changed, which causes the heat transfer coefficients and pressure drops in small diameter microfin tubes to perform differently from those in conventional smooth tubes. Additionally, to keep the pressure drop minimum of small diameter tubes, low mass flux operation of the refrigerant is necessary. Thus, there is a need to investigate the condensation heat transfer and adiabatic pressure drop inside the small diameter tube at low mass flux condition.
Some studies have been done to analyze the condensation heat transfer and pressure drop characteristics of refrigerants inside small diameter microfin tubes, for example, tubes with outer diameters of 7.52 mm [1], 7.0 mm [2,3], 6.0 mm [4], 5.0 mm [5], 4.0 mm [6,7], 3.5 mm [8] and 3.0 mm [9]. In recent years, some researchers who have analyzed different aspects related to condensation inside smooth and microfin tubes are Zhuang et al. [10], Fronk and Garimella [11], Dorao and Fernandino [12], Xiao and Hrnjak [13], Ghim and Lee [14], Meyer and Ewim [15] and Shah [16]. However, some investigations on the condensation heat transfer characteristics and frictional pressure drop in microfin and smooth tube are not in good agreement. Therefore, it is necessary to carry out more experiments in microfin tubes. In this study, the condensation heat transfer and frictional pressure drop characteristics of R134a in small diameter smooth and microfin tube were investigated and the experimental data compared with some related studies.

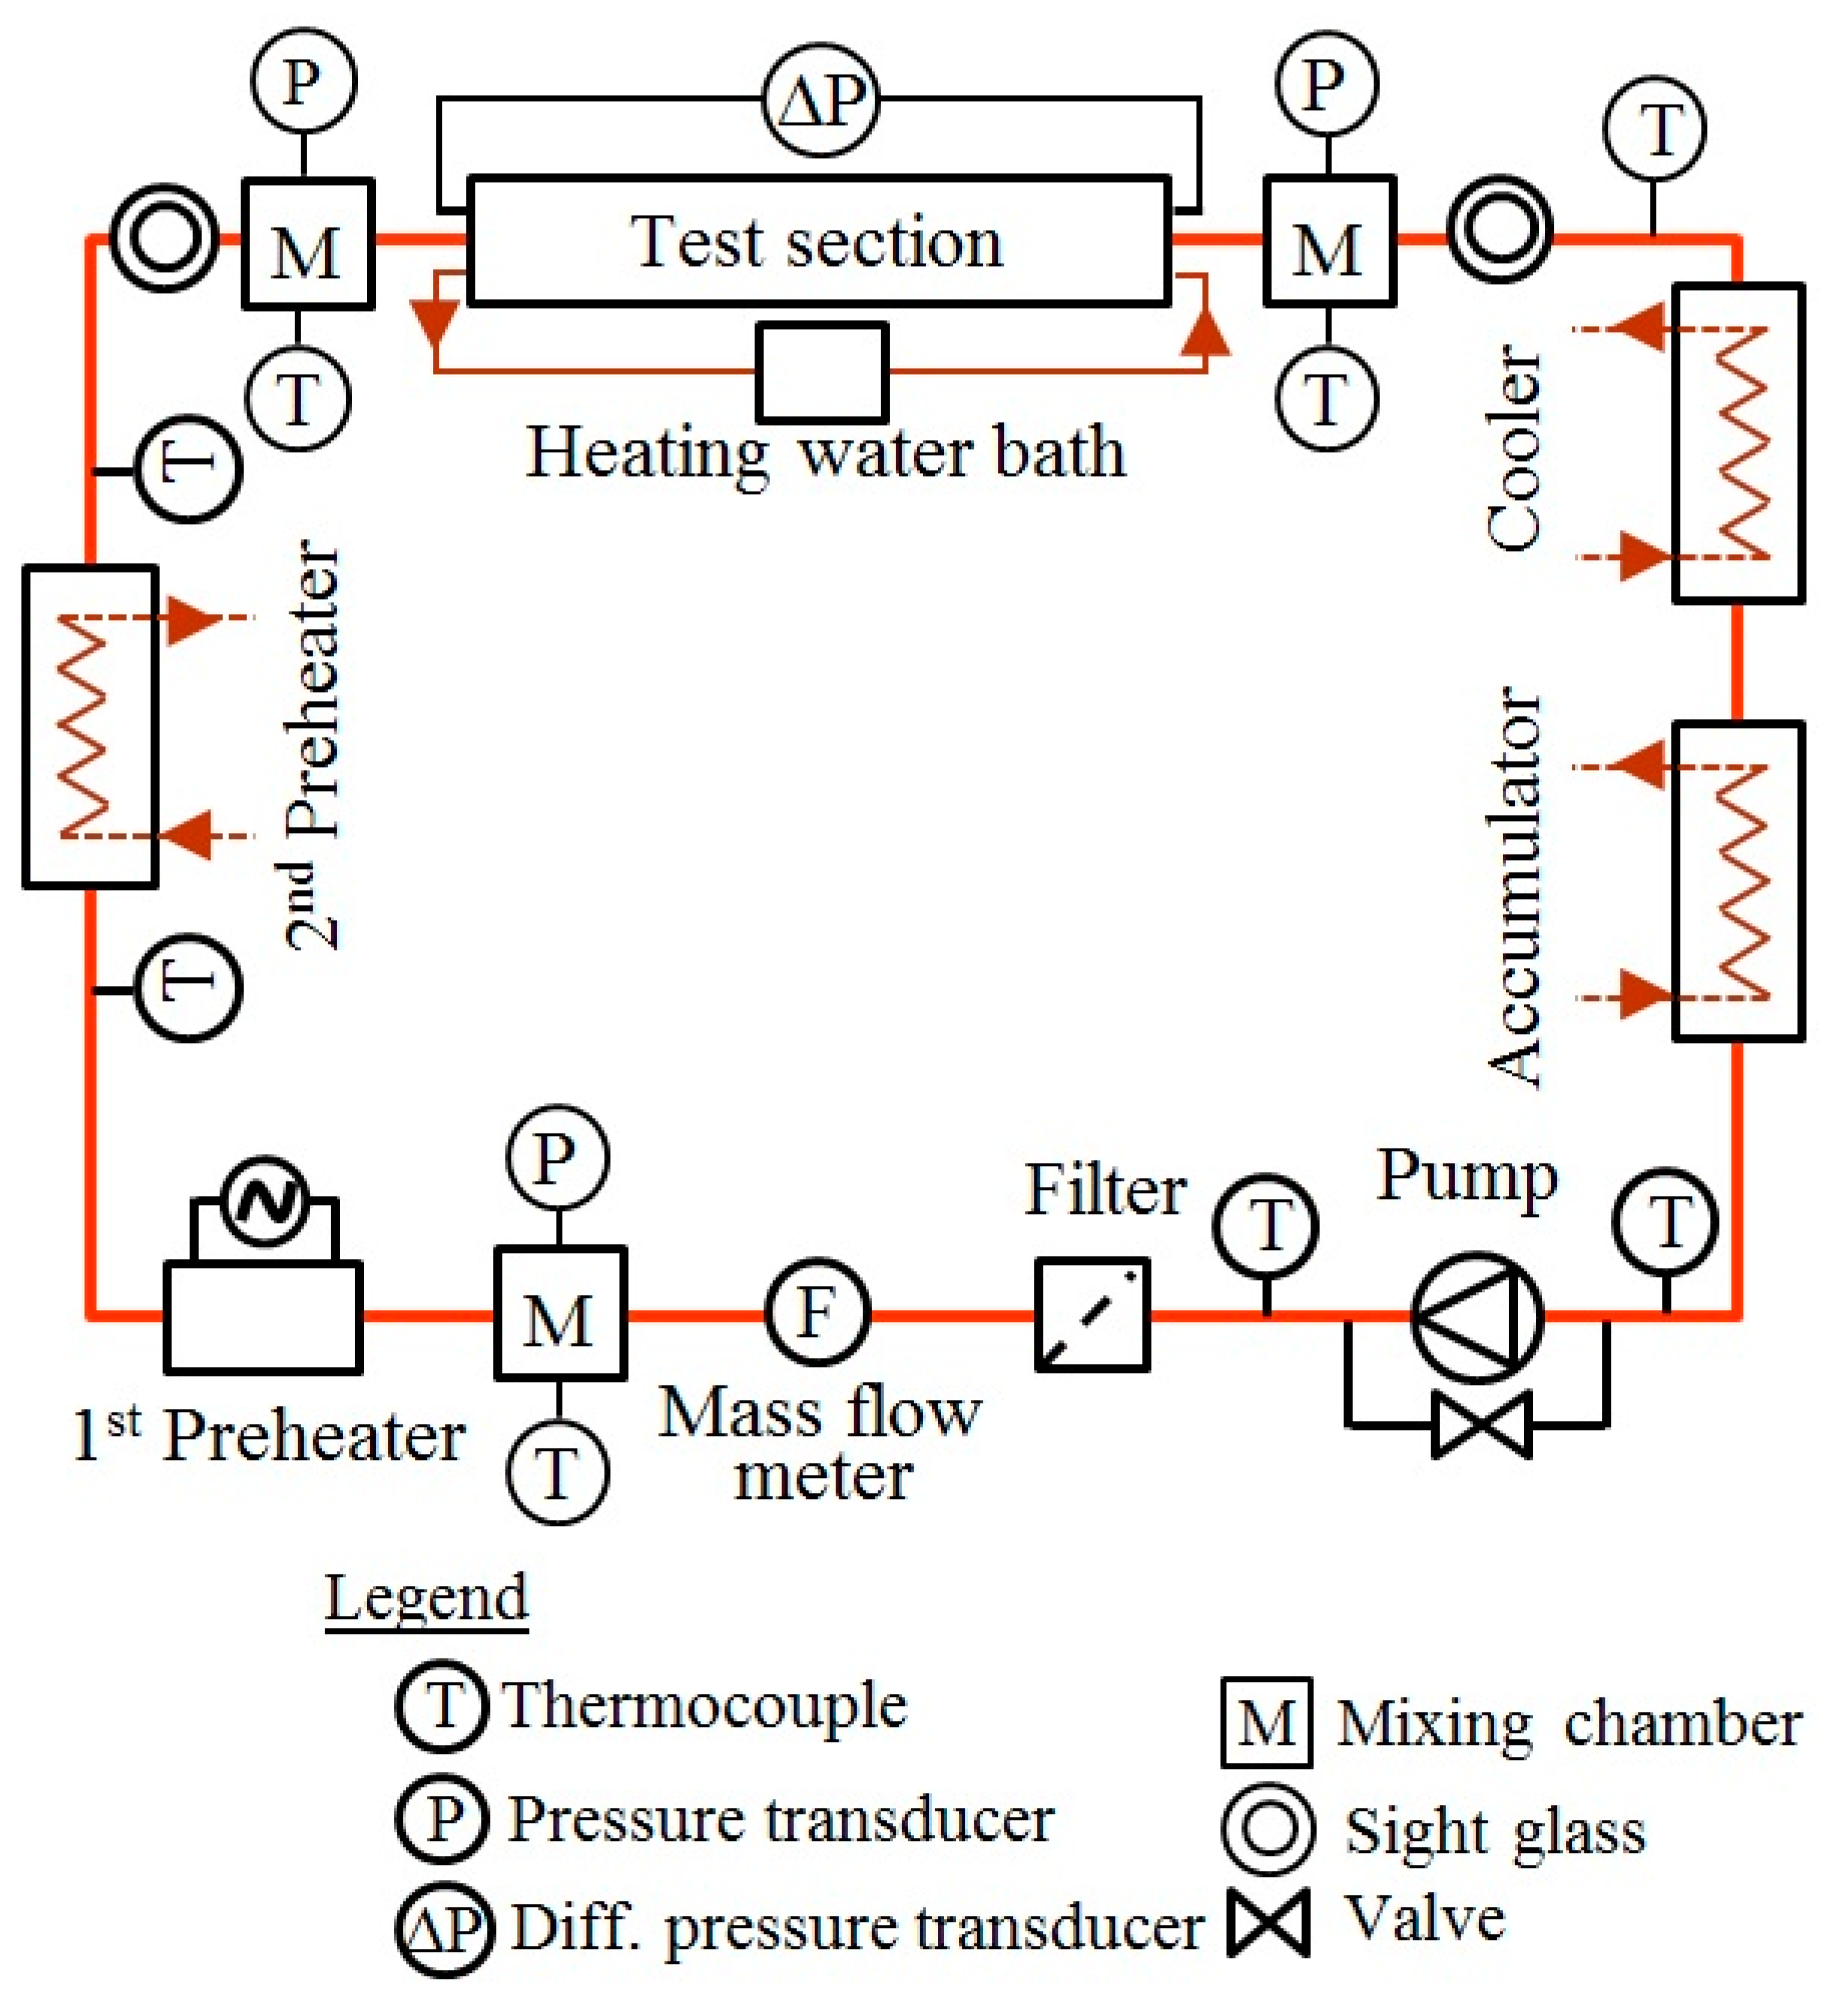
2. Experimental Apparatus and Procedure

A detailed schematic diagram of the experimental apparatus including its different components is presented in Figure 1. The experimental apparatus comprises of a Coriolis mass flow meter, three mixing chambers, two pre-heaters, test sections, a cooler, an accumulator, cooling/heating water loop and data logger. The liquid refrigerant is kept in the refrigerant tank. Then, the refrigerant is pumped by a gear pump. After that, it flows through the filter, mixing chamber, pre-heaters, sight glass, test section, cooler and accumulator. To continue the cycle, the refrigerant is again circulated from the cooler after being collected in an accumulator and returned to the pump. However, to get the desire vapor quality in the test section inlet, the refrigerant quality is controlled and superheated by the first and second preheaters, respectively. The heated/superheated refrigerant passes into the test section and experimental data are obtained in the different vapor quality ranges. To exchange the heat between refrigerant and water, the test section consists of a tube-in-tube heat exchanger. After exchanging heat, refrigerant leaves the test section, flows through the cooler, and is completely subcooled by brine. Brine is reserved at a fixed temperature in the heat source unit. The accumulator is used to control the system pressure of the experimental apparatus. The Coriolis mass flow meter measures the mass flow of refrigerant. Three mixing chambers are fitted in the different locations to measure the bulk temperature of the refrigerant. Two sight glasses at the inlet and outlet of the test section are fitted to observe the refrigerant’s quality. The absolute pressure transducer is fitted to measure the pressure of refrigerant. K-type and T-type thermocouples are fitted at different locations to measure the temperature of refrigerant and tube wall, respectively. All signals from the measuring devices are collected by a data logger. Moreover, the total experimental apparatus is well insulated so it is not affected by outside temperature.
Figure 2 shows details of the test section, which consists of a horizontally installed copper tube, two headers, three water channels and three sub-sections. The total test section length is 852 mm, each sub-section length is 248 mm and effective cooling/heating length is 744 mm. The refrigerant flows inside the test tube, while the counter-current water flows through the water loop, as shown in Figure 2. A differential pressure transducer is fitted in the test section header to measure the pressure difference. Thermocouples are inserted at various locations to measure the temperature (Figure 2). Devices such as thermocouple calibration were measured over the applicable range. The K-type and T-type thermocouples measurement uncertainty was estimated as ±0.03°K. The absolute and differential pressure transducer measurement uncertainty was estimated as ±0.1 KPa. The Coriolis mass flow meter measurement uncertainty was estimated as ±0.15%.
The test tube is made of copper. Two types (smooth and microfin) of test tube were used in this study and both tubes have outside diameters of 2.5 mm, as shown in Figure 3. The tube dimensions are listed in Table 1. Refrigerant mass flux varied from 50 to 300 kg m−2s−1 and the saturation temperature varied from 20 to 30 °C. The usual refrigerant thermophysical properties of R134a used in the experiment are shown in Table 2.

3. Data Reduction

The local condensation heat transfer coefficient, α, is calculated by Equation (1).
α   =   Q c π d e q L ( T R T w i )
where Qc is the heat transfer amount of cooling water side, in each sub-section. L is the effective heat transfer length of the test section, and deq is the equivalent diameter of the test microfin tubes. When the smooth tube deq was used in the experiment, it was defined by the inner diameter di. TR is the refrigerant temperature and it was estimated from the measured refrigerant pressure. Twi is the inner wall temperature and it was calculated by the one-dimensional equation of heat conduction.
T w i   =   T w o + Q c ln ( d o d e q ) / ( 2 π λ c L )
where Two is test tube outside wall surface temperature, do is the outside diameter of the test tube, and λc is the thermal conductivity of the copper test tube.
The total two-phase adiabatic pressure drop ∆PT is expressed as the sum of frictional pressure drop ∆PF, pressure drop due to the abrupt contraction ∆Pc and expansion ∆Pe at the inlet and outlet of the test section, respectively.
P T = P F + P C + P e
The pressure drop because of the abrupt contraction and expansion were estimated by Equations (4) and (5), respectively, according to the Collier and Thome method [18].
P c = G 2 v l 2 [ ( 1 C c 1 ) 2 + ( 1 1 β 2 ) ] [ 1 + ( v v v l ) x a ]
P e = G 2 β ( 1 β ) v l [ ( 1 x a ) 2 ( 1 ξ ) + ( v v v l ) x a 2 ξ ]
where β is area ratio and the coefficient of contraction Cc is a function of β. The void function, ξ, is calculated by Smith’s separated flow model [19]. The pressure drop because of the abrupt contraction and expansion was less than 2% of the total pressure drop. The vapor quality at the inlet of the test section is calculated as Equation (6).
h o = h i n + ( Q G )
x = h o h h h
where ho and hin are the outlet and inlet enthalpies of refrigerant. The inlet enthalpy of refrigerant just before the first preheater is estimated with refrigerant’s bulk temperature and pressure. Q is the amount of heat which is supplied by the electricity into the preheaters in direct heating method. G is the mass flux of refrigerant. h′ and h″ are the saturated liquid and vapor enthalpies, respectively. The vapor quality x does not change enough along the test tube because no further heat is added to the refrigerant flowing in the test section.
The uncertainty of the condensation heat transfer coefficient and adiabatic pressure drop were calculated following the method by JCGM 100 [20]. The uncertainty analysis of the condensation heat transfer coefficient and frictional pressure drop can be carried out based on the basic equation of condensation heat transfer and frictional pressure drop as mentioned in Equations (1) and (3), respectively.
U ( α ) = ( α q ) 2 u 2 ( q ) + ( α T ) 2 u 2 ( T )
U ( P F ) = ( P F P T ) 2 u 2 ( P T ) + ( P F P c ) 2 u 2 ( P c ) + ( P F P e ) 2 u 2 ( P e )
The uncertainties of the condensation heat transfer coefficient ranges from 6.1% to 20.5% and frictional pressure drop maximum uncertainty is 16.4%. The heat balance of the all test run were within ±10%, which was calculated as Equation (10).
H B = Q R Q c
The experiment repeatability was examined by repeated experiment at the same experimental conditions. Figure 4 shows the comparisons of the heat transfer coefficients and pressure drops obtained in two days in microfin tube. The mean deviations of the heat transfer coefficients and pressure drops were within about 8% and 9%, respectively, showing good experiment repeatability.

4. Experimental Results and Discussion

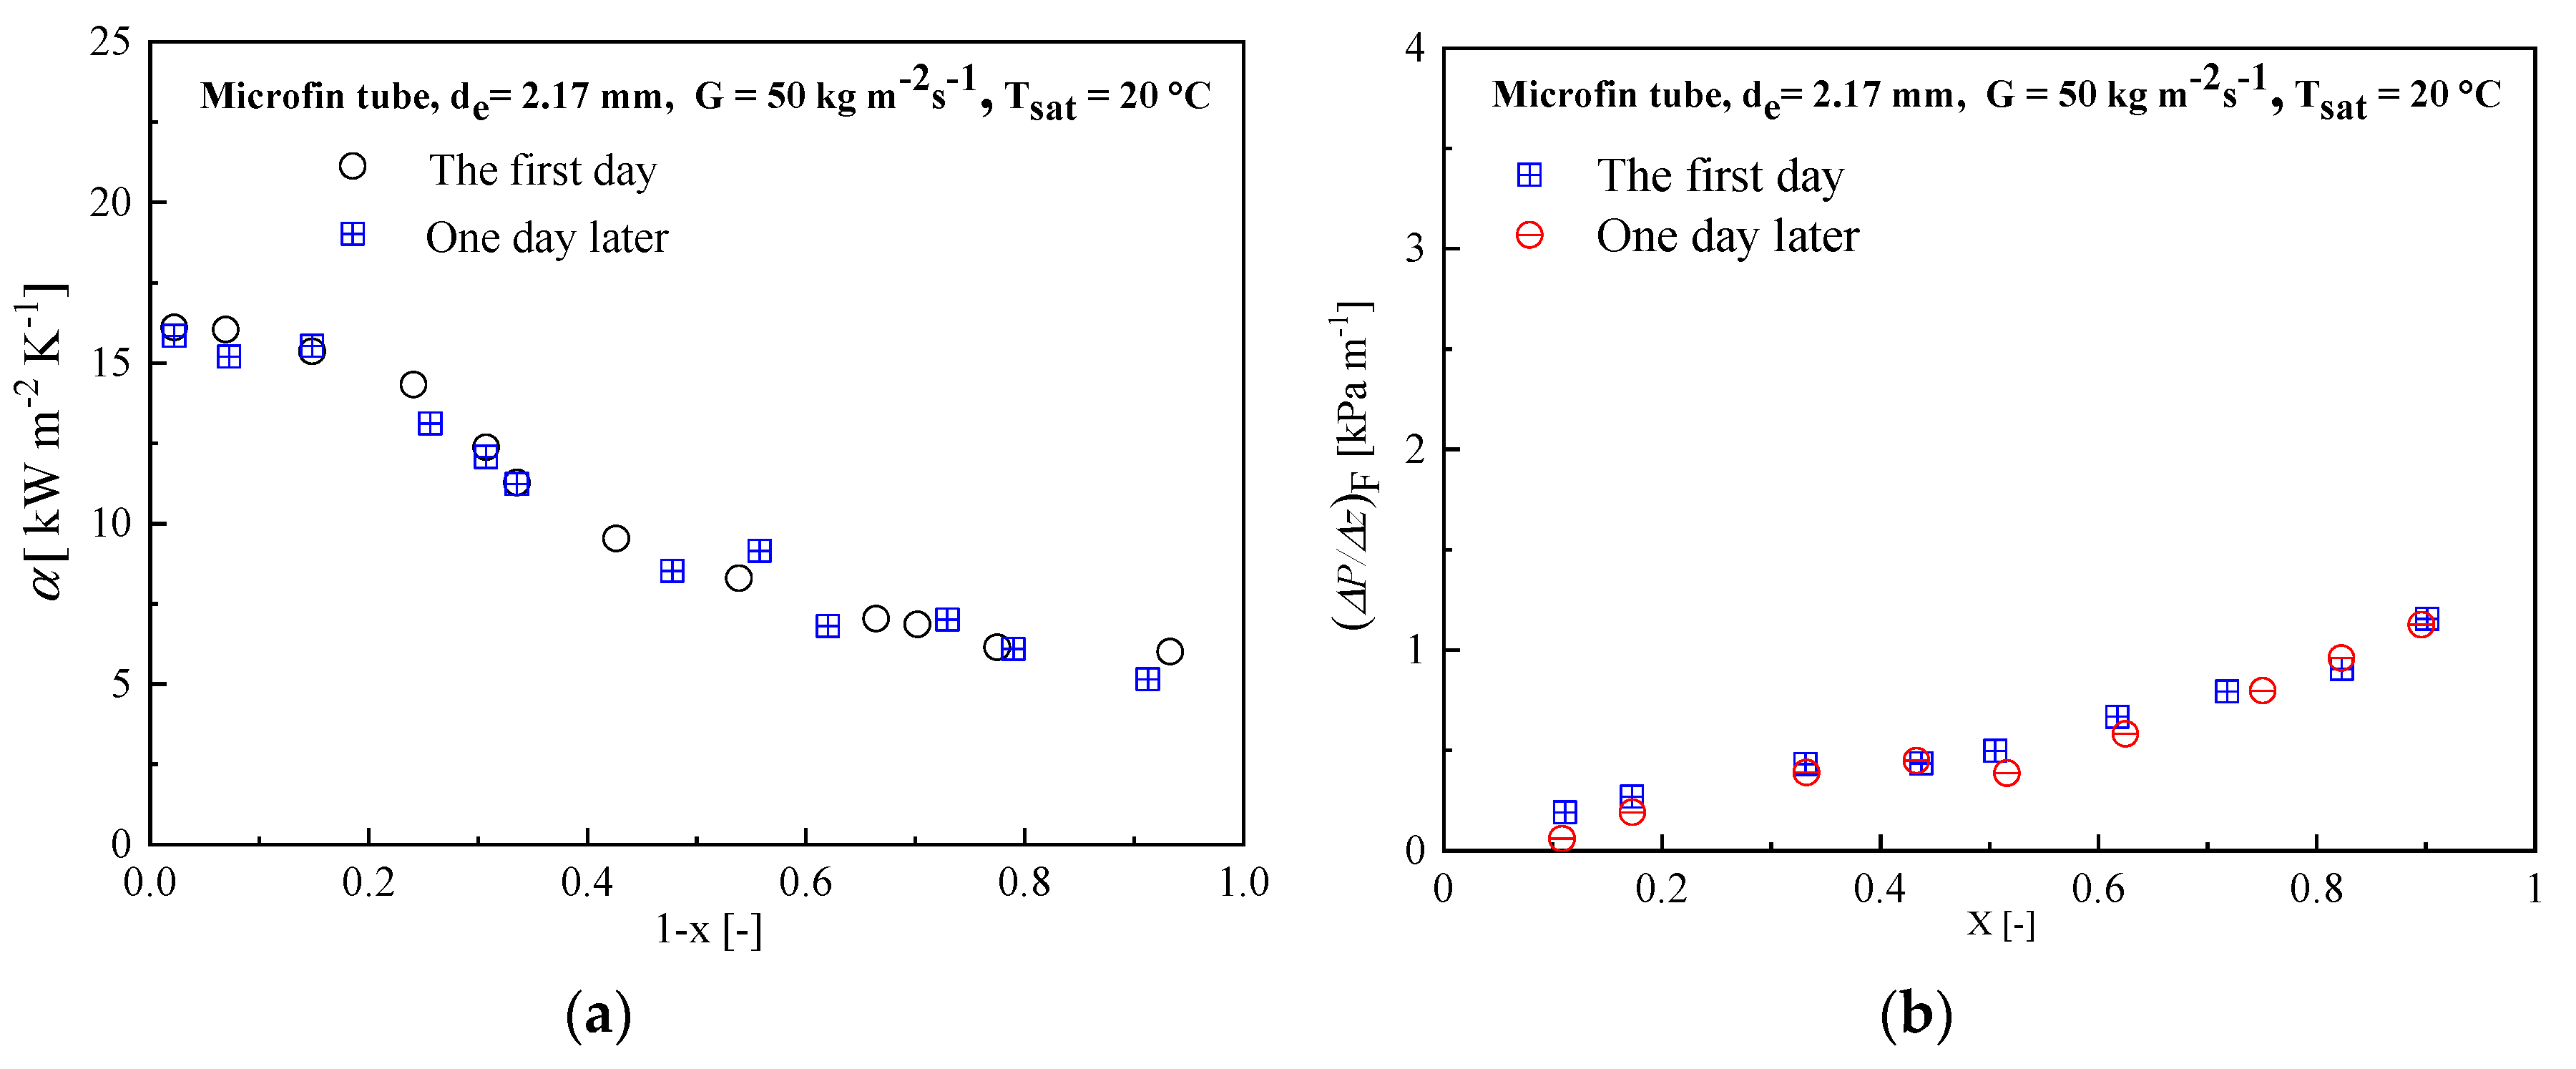
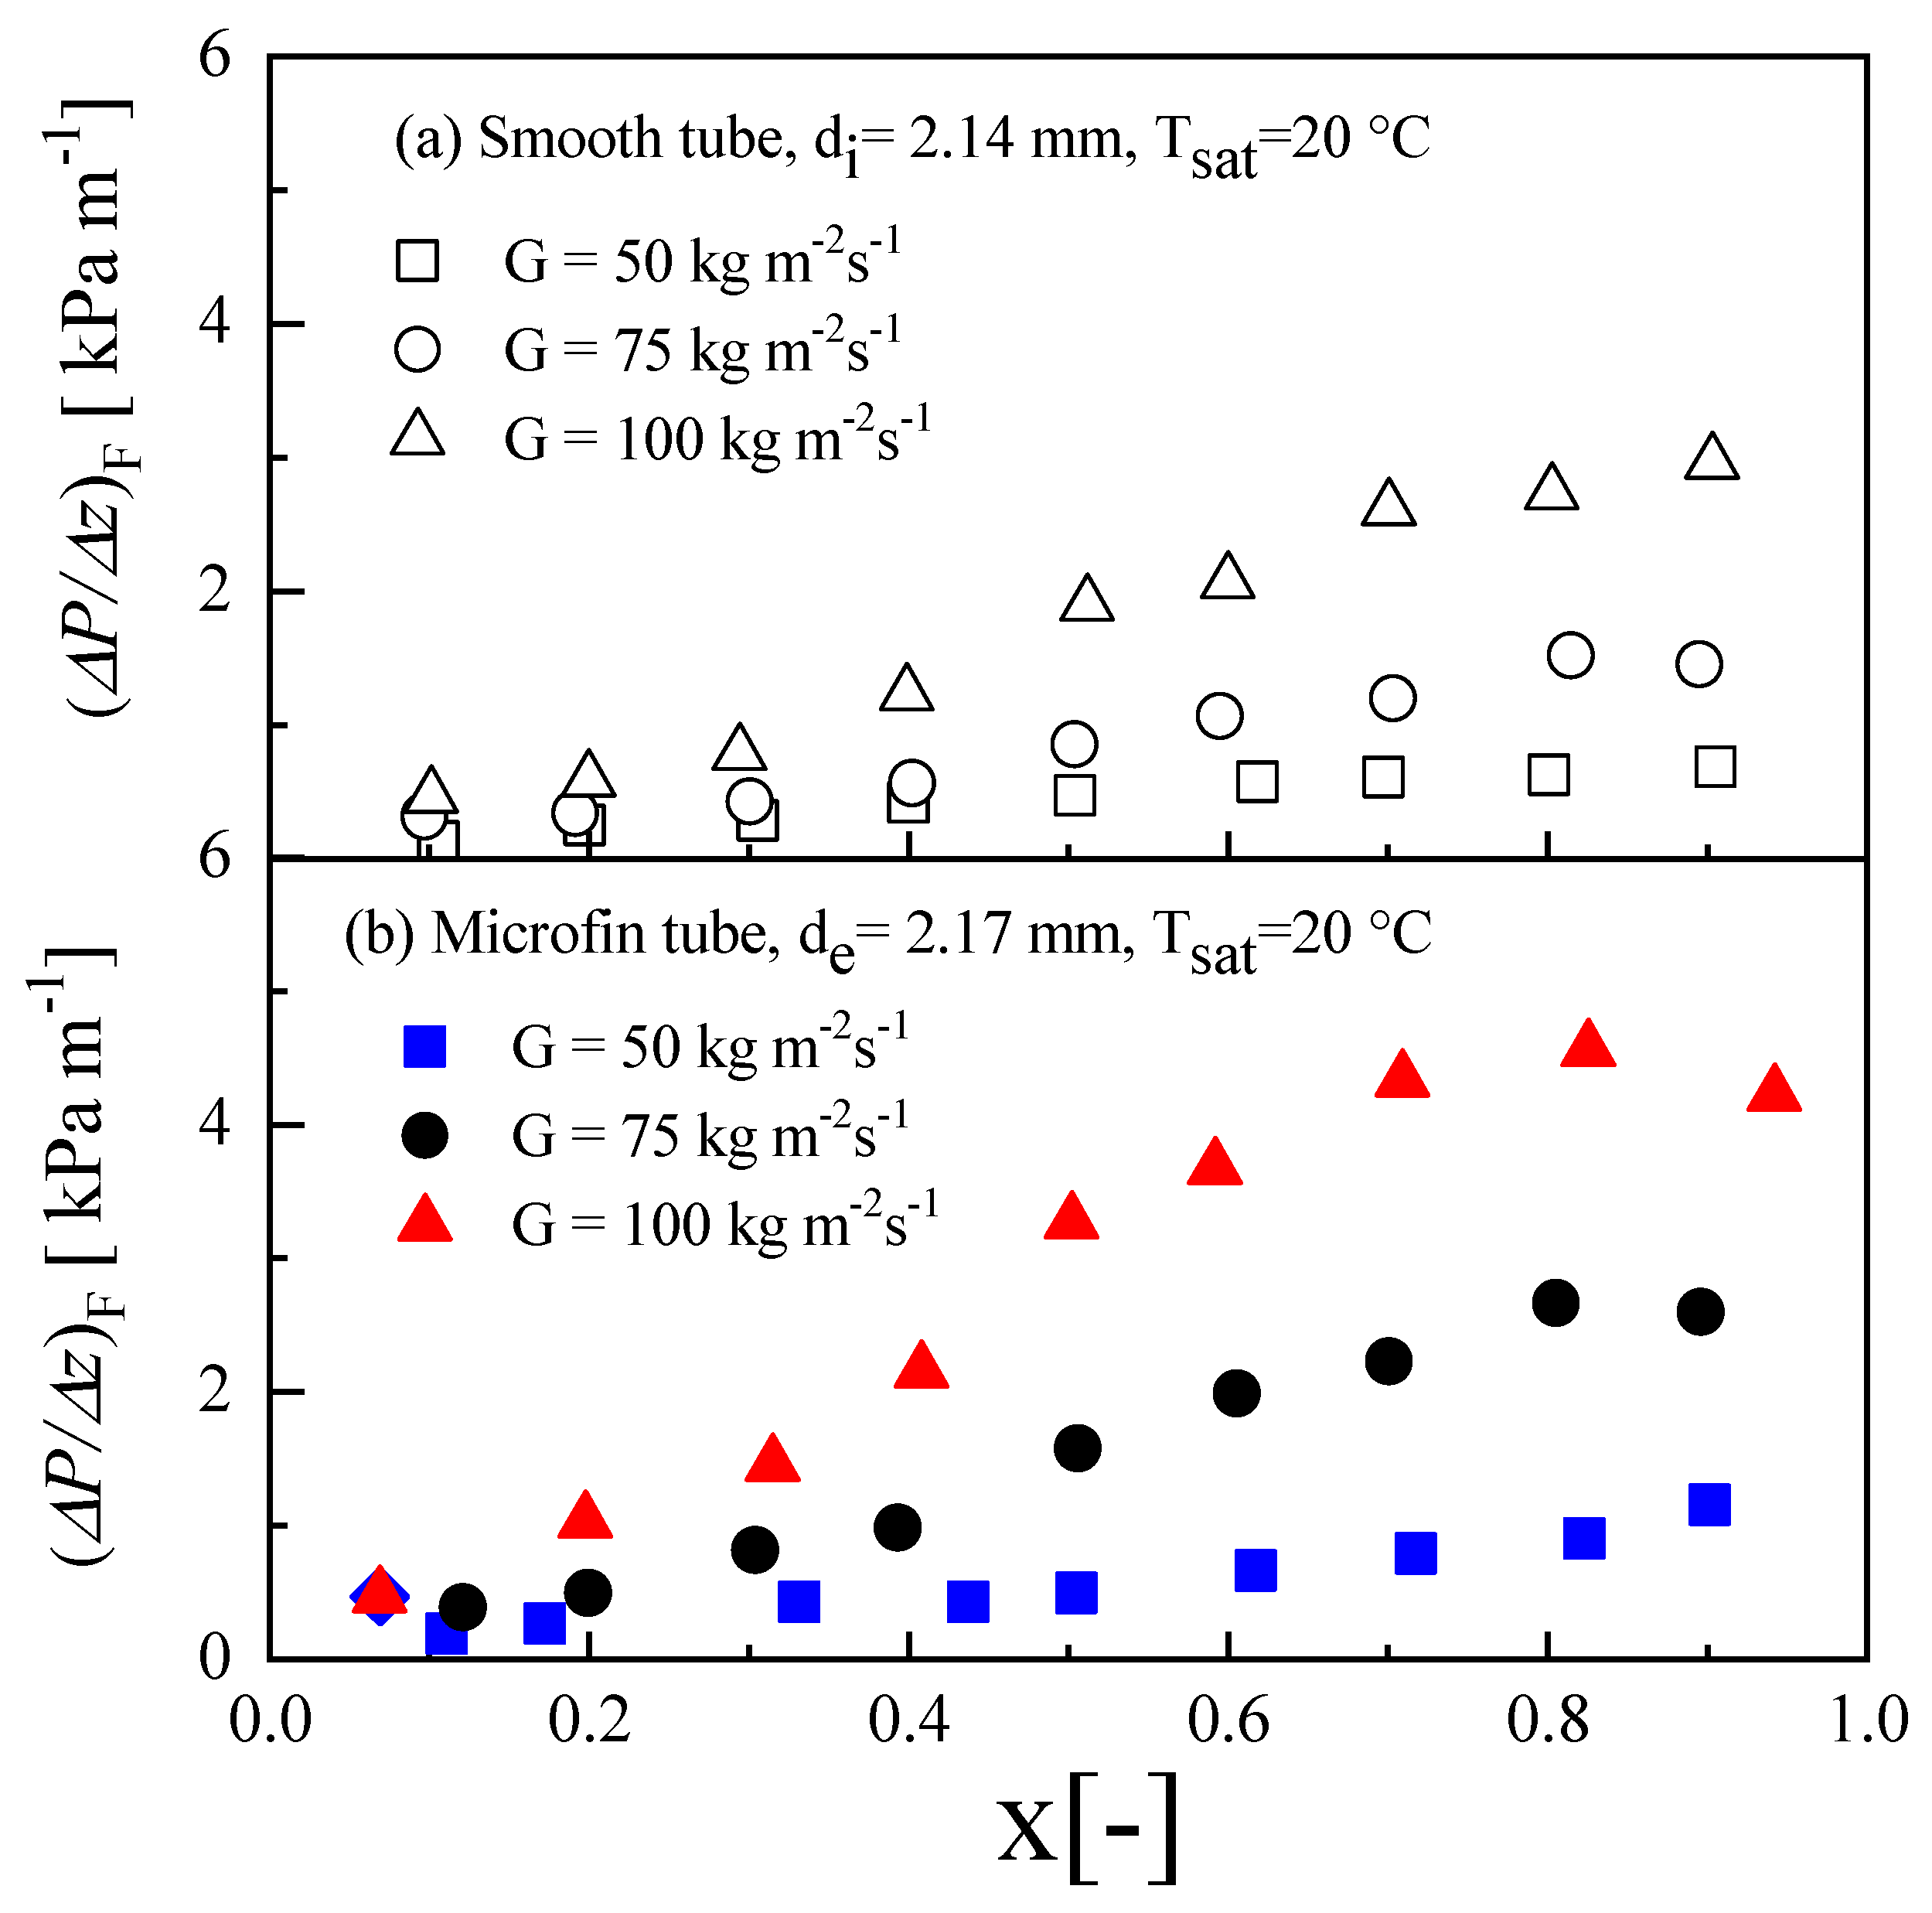
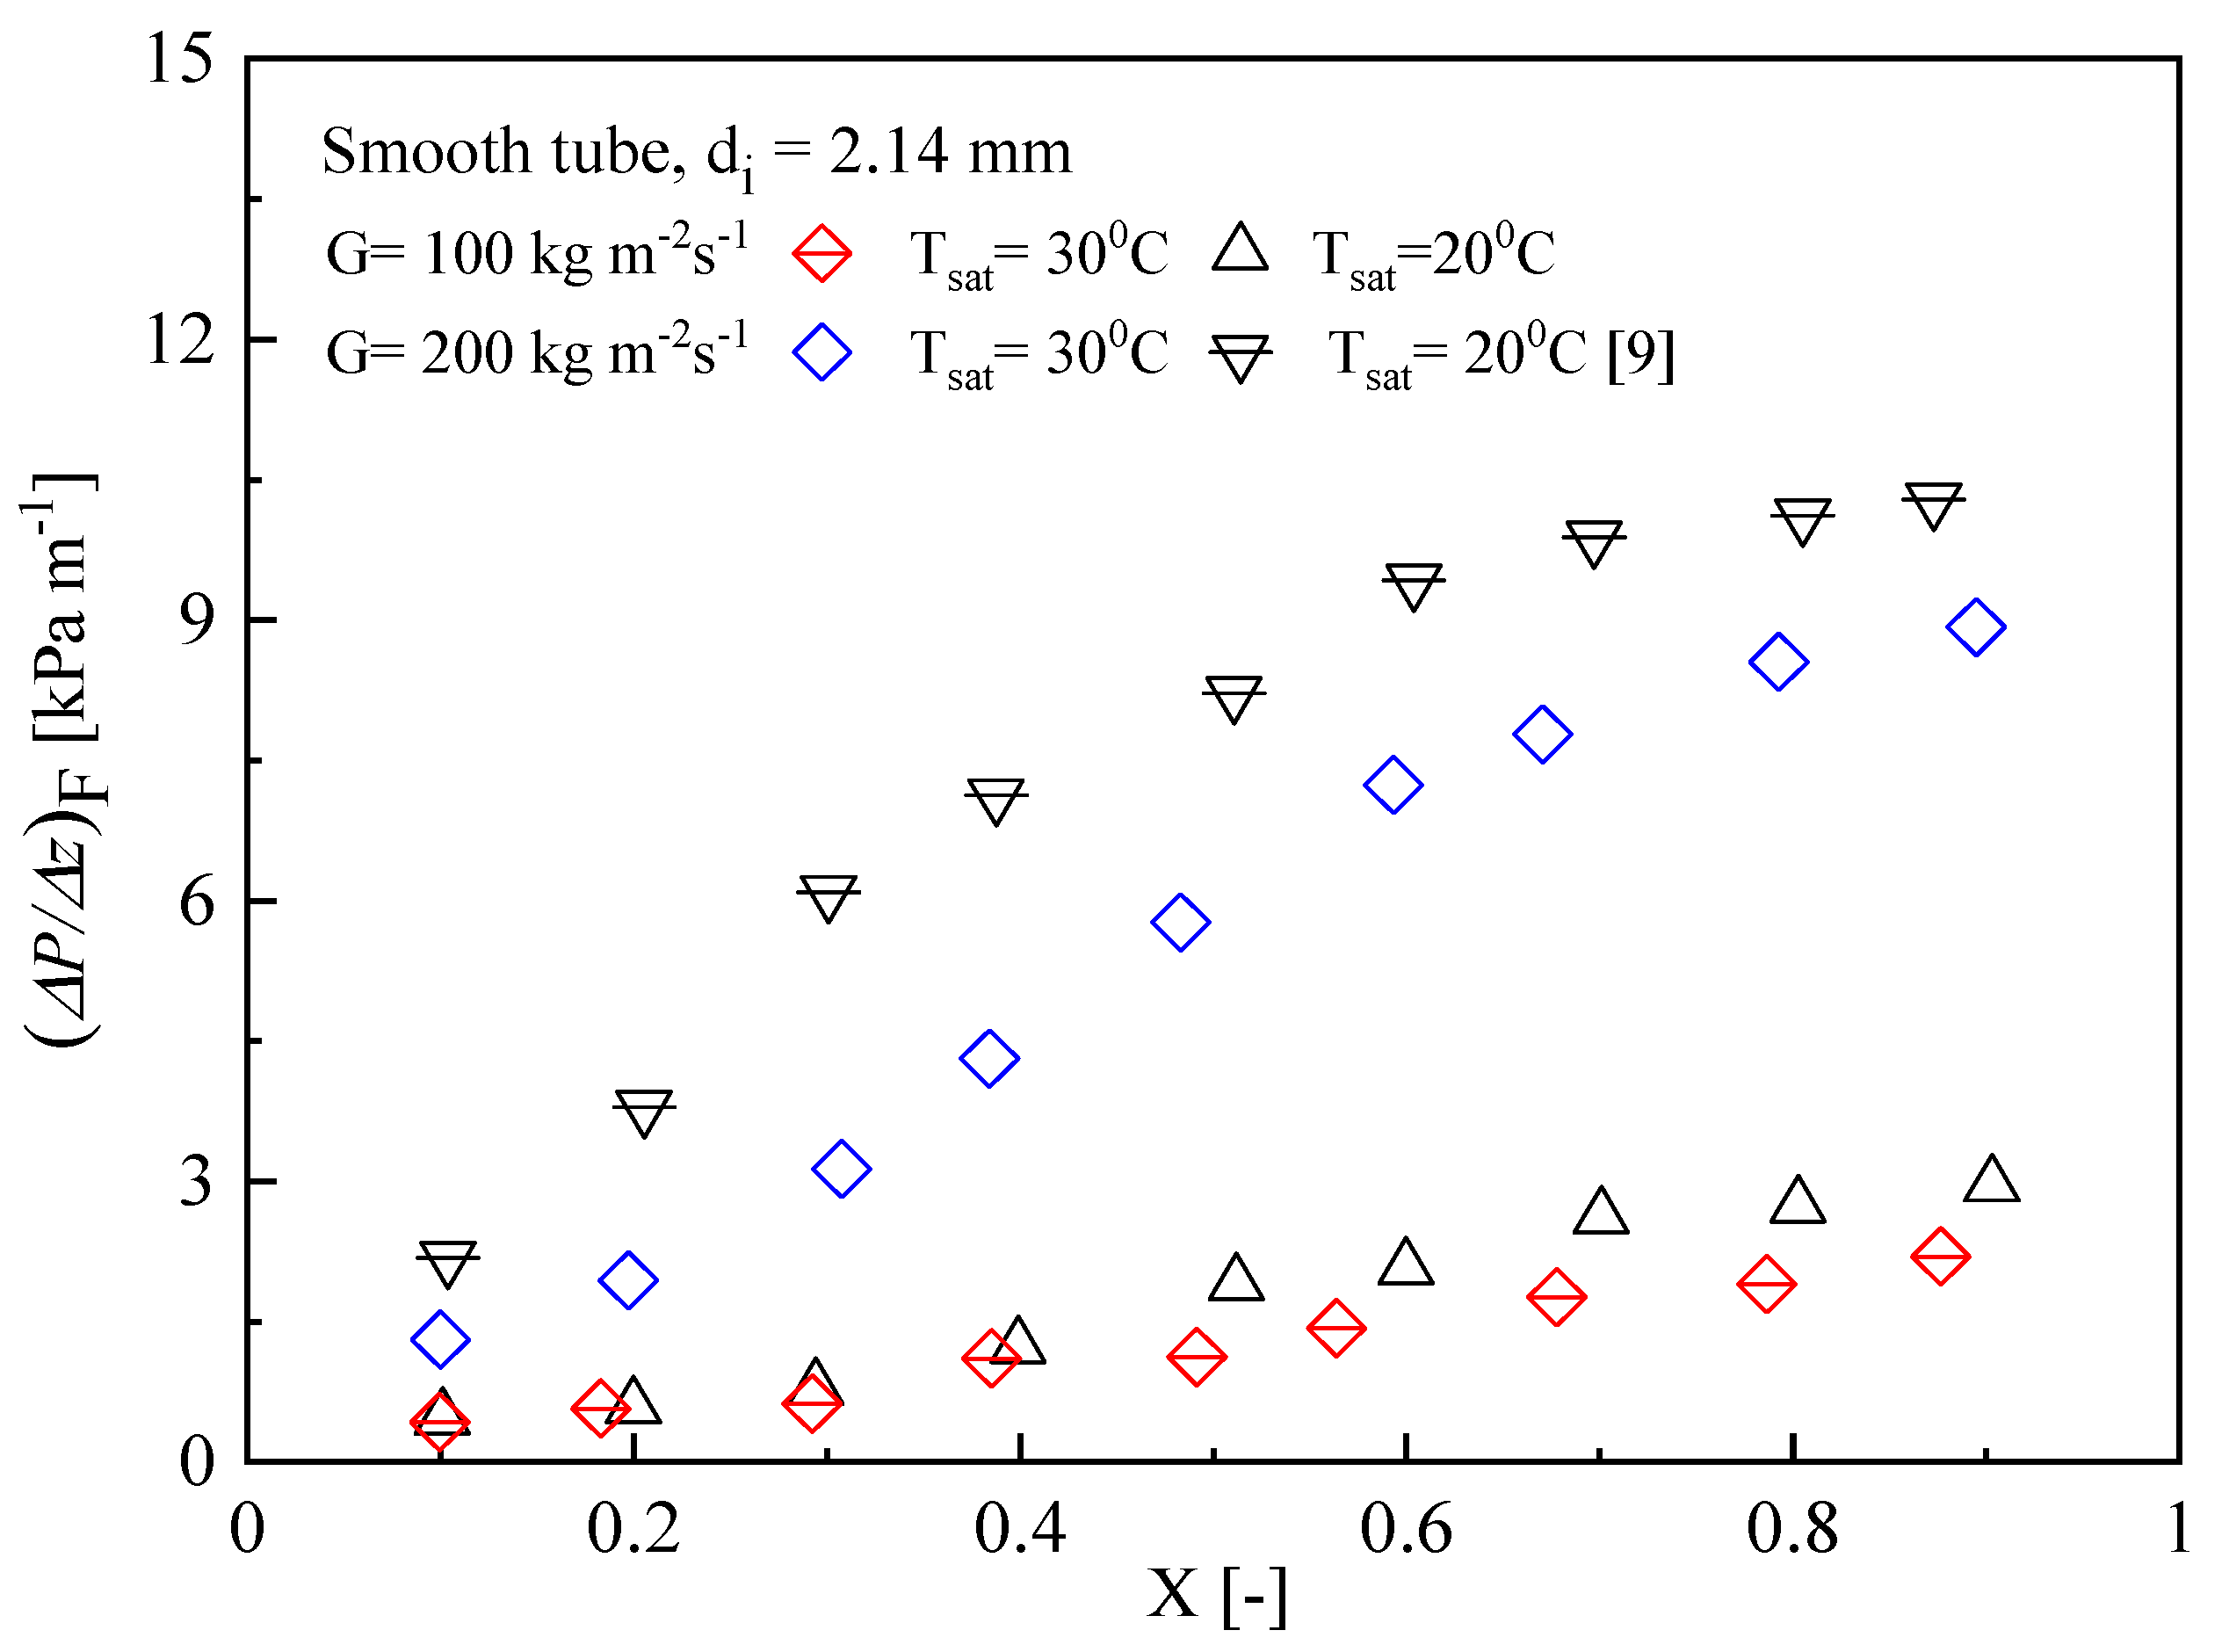
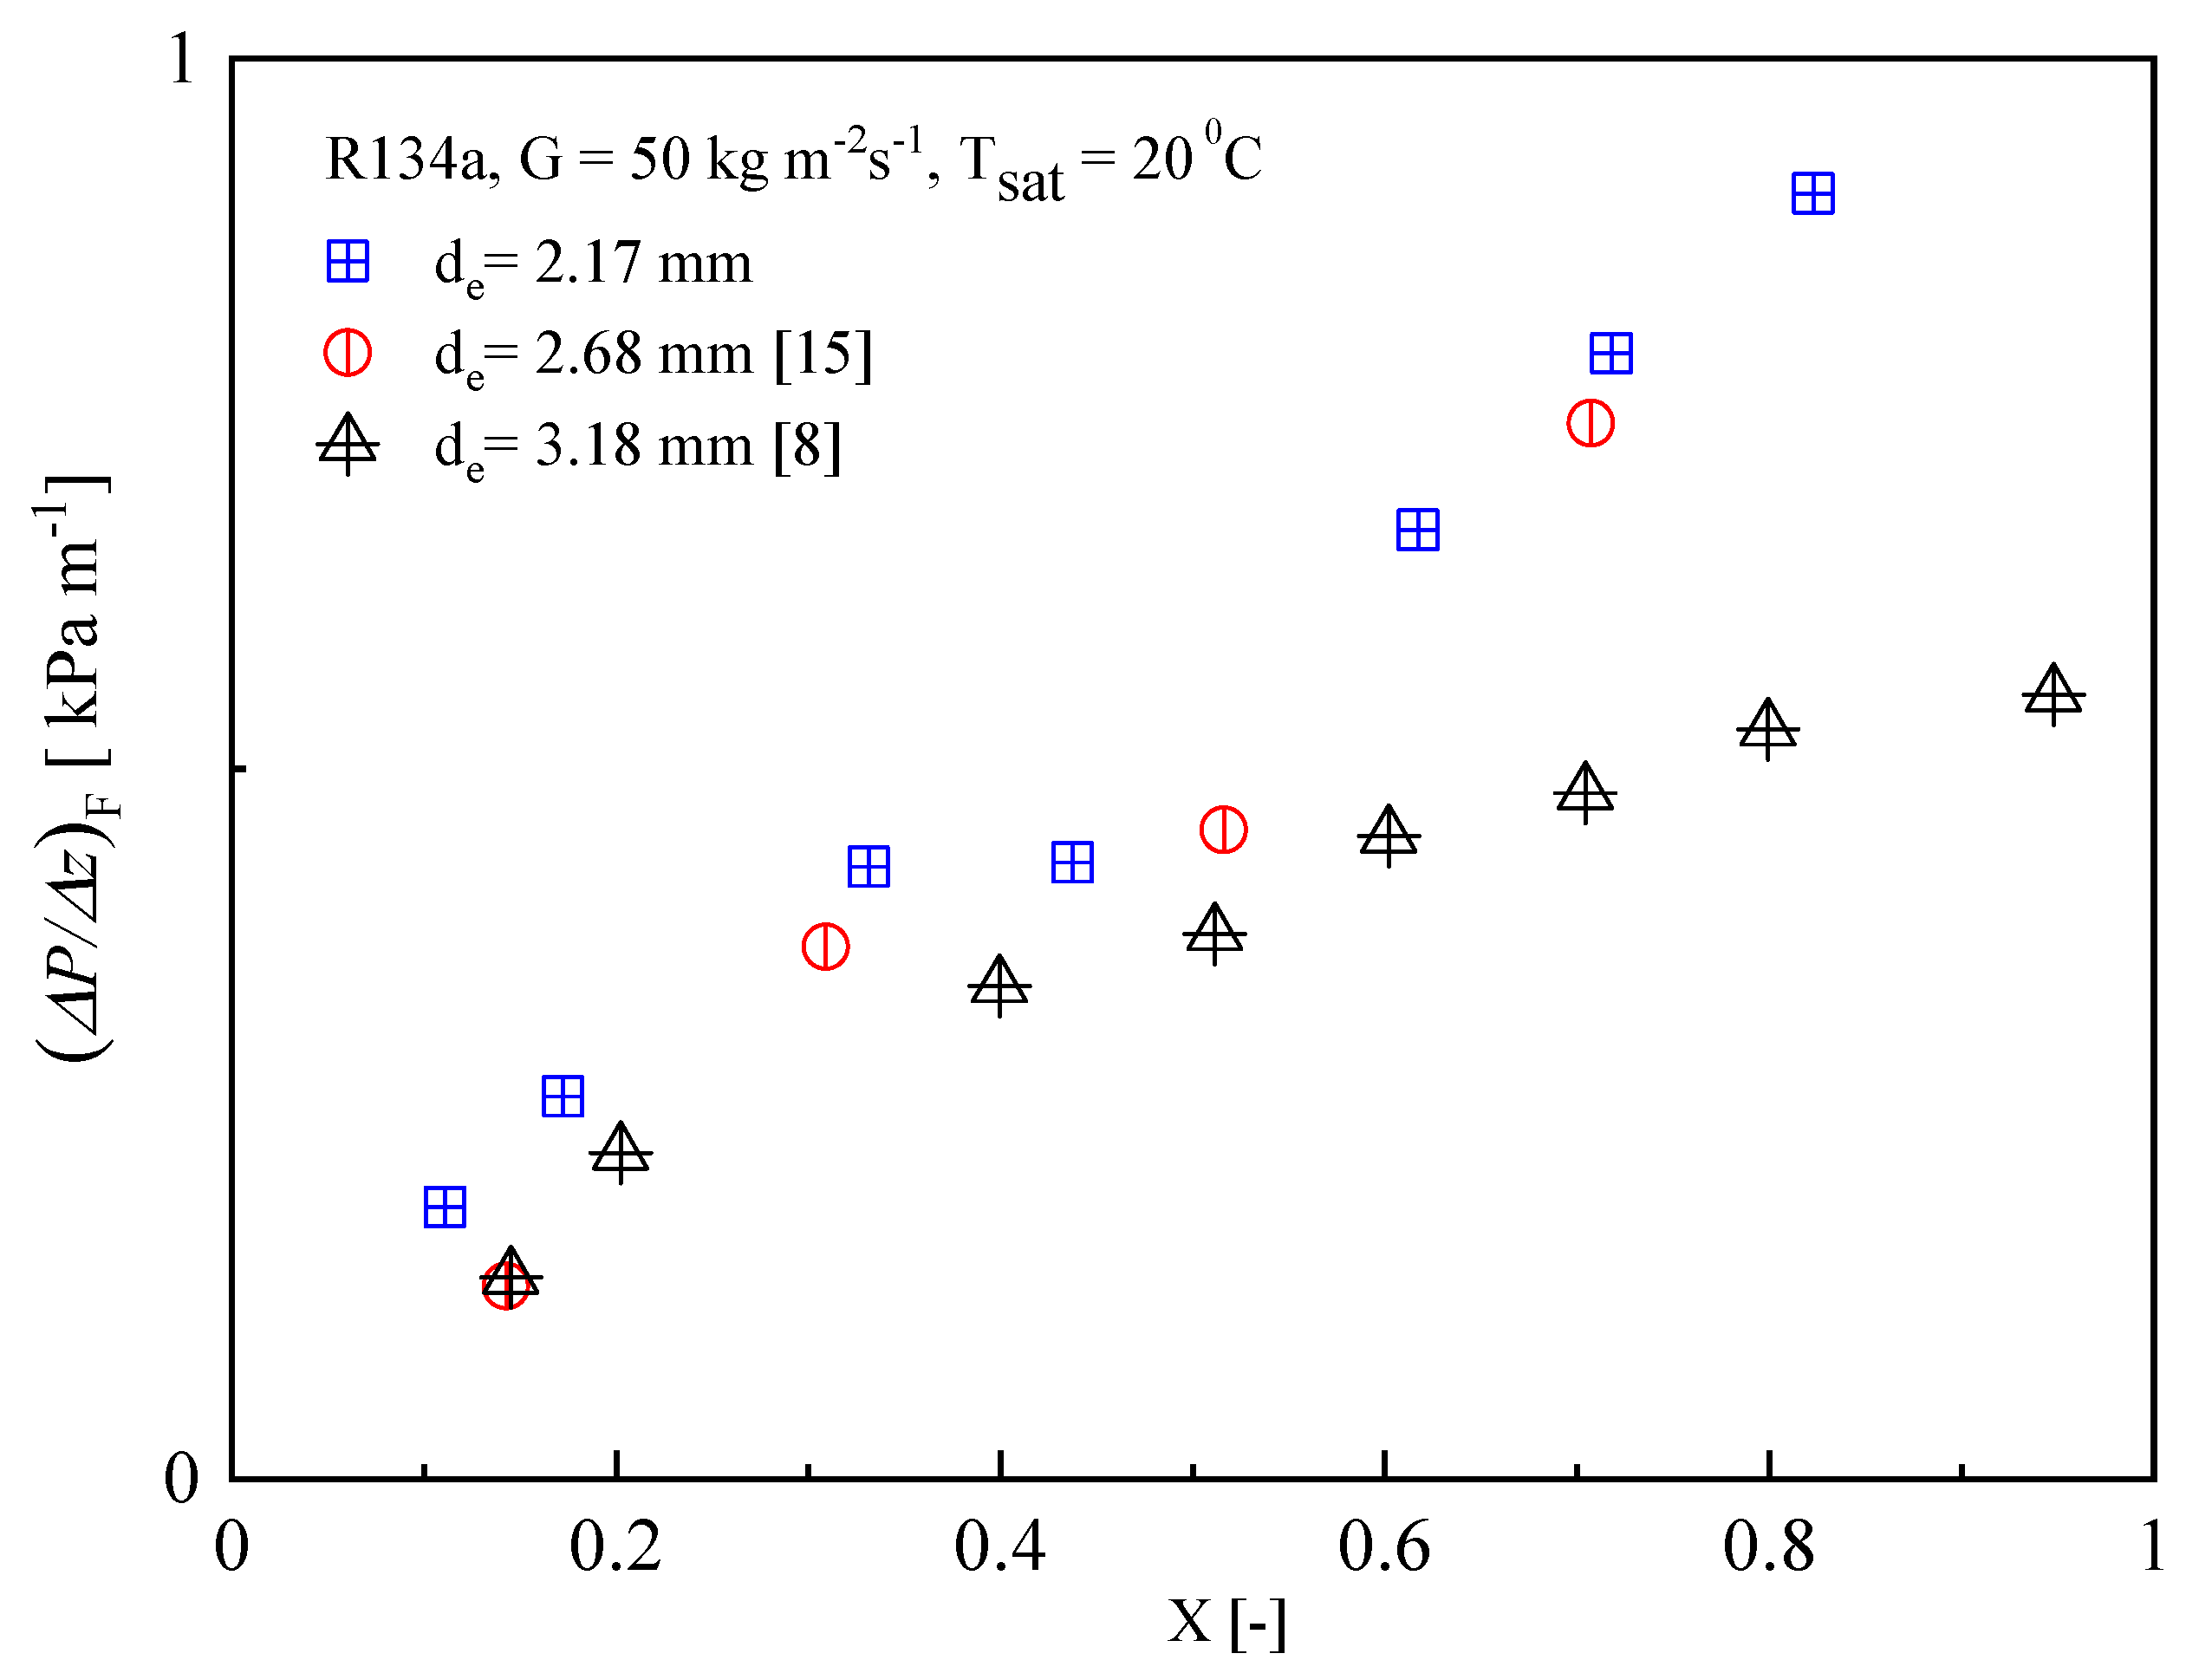
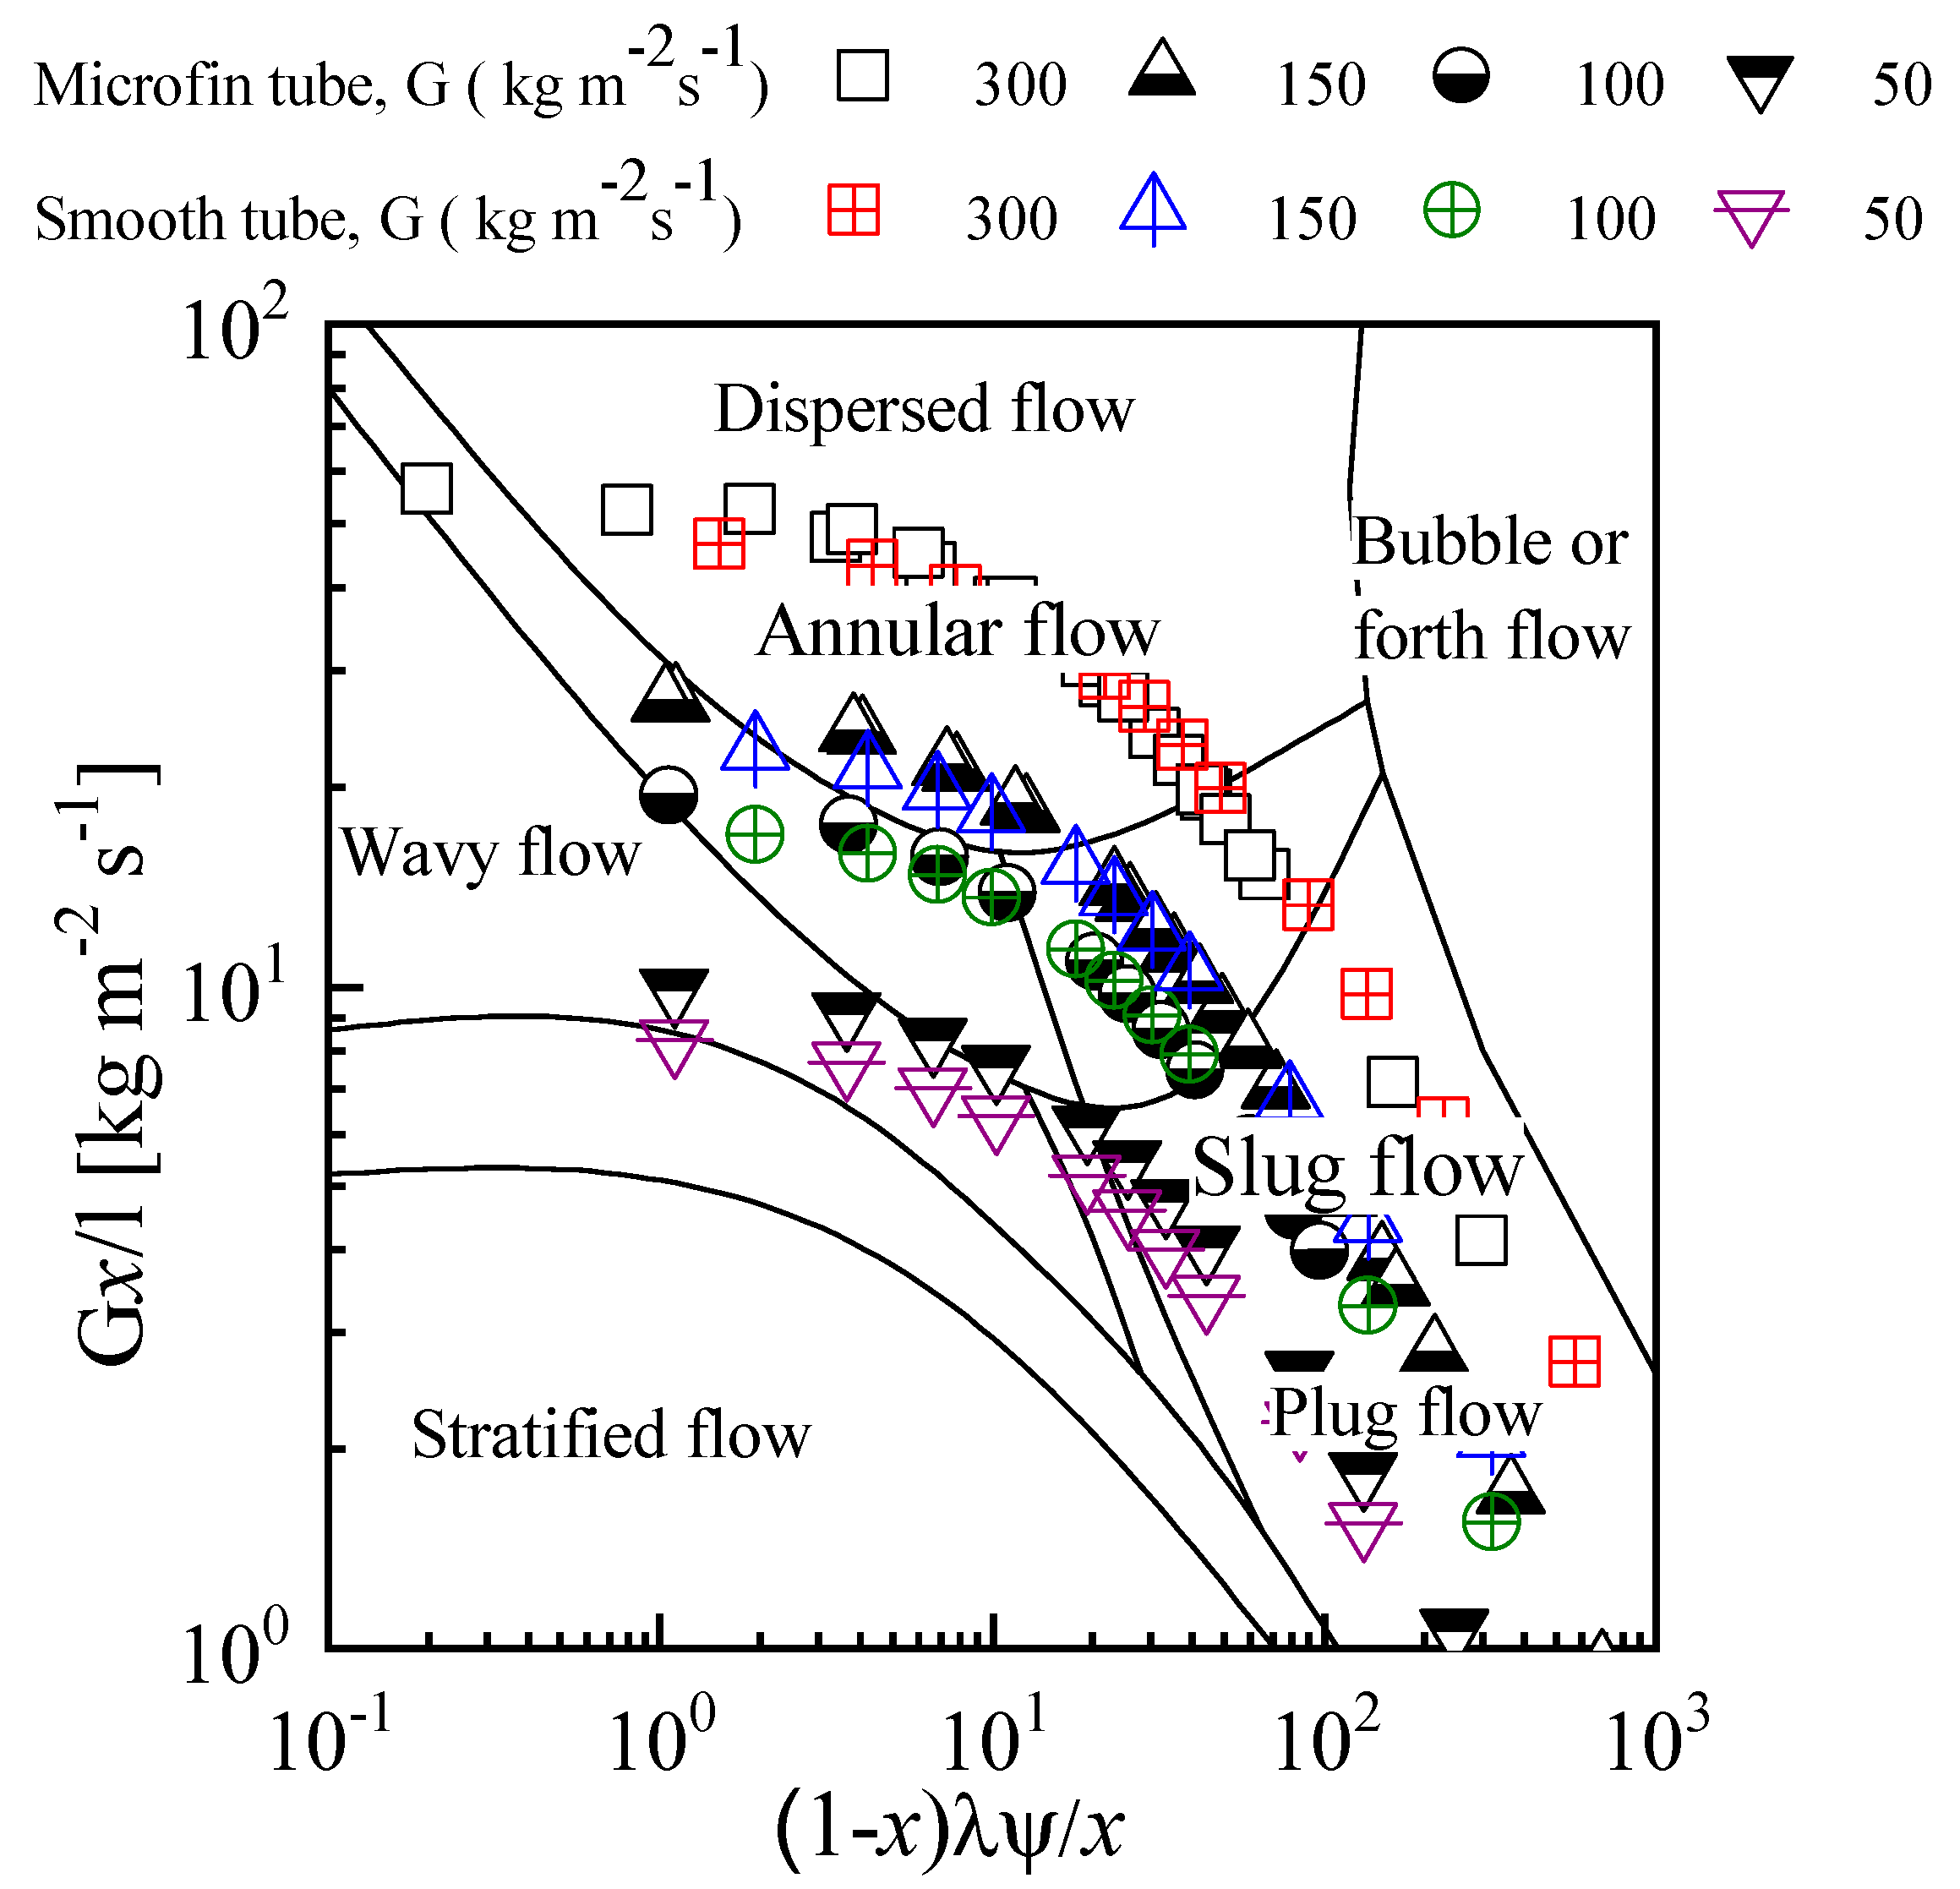
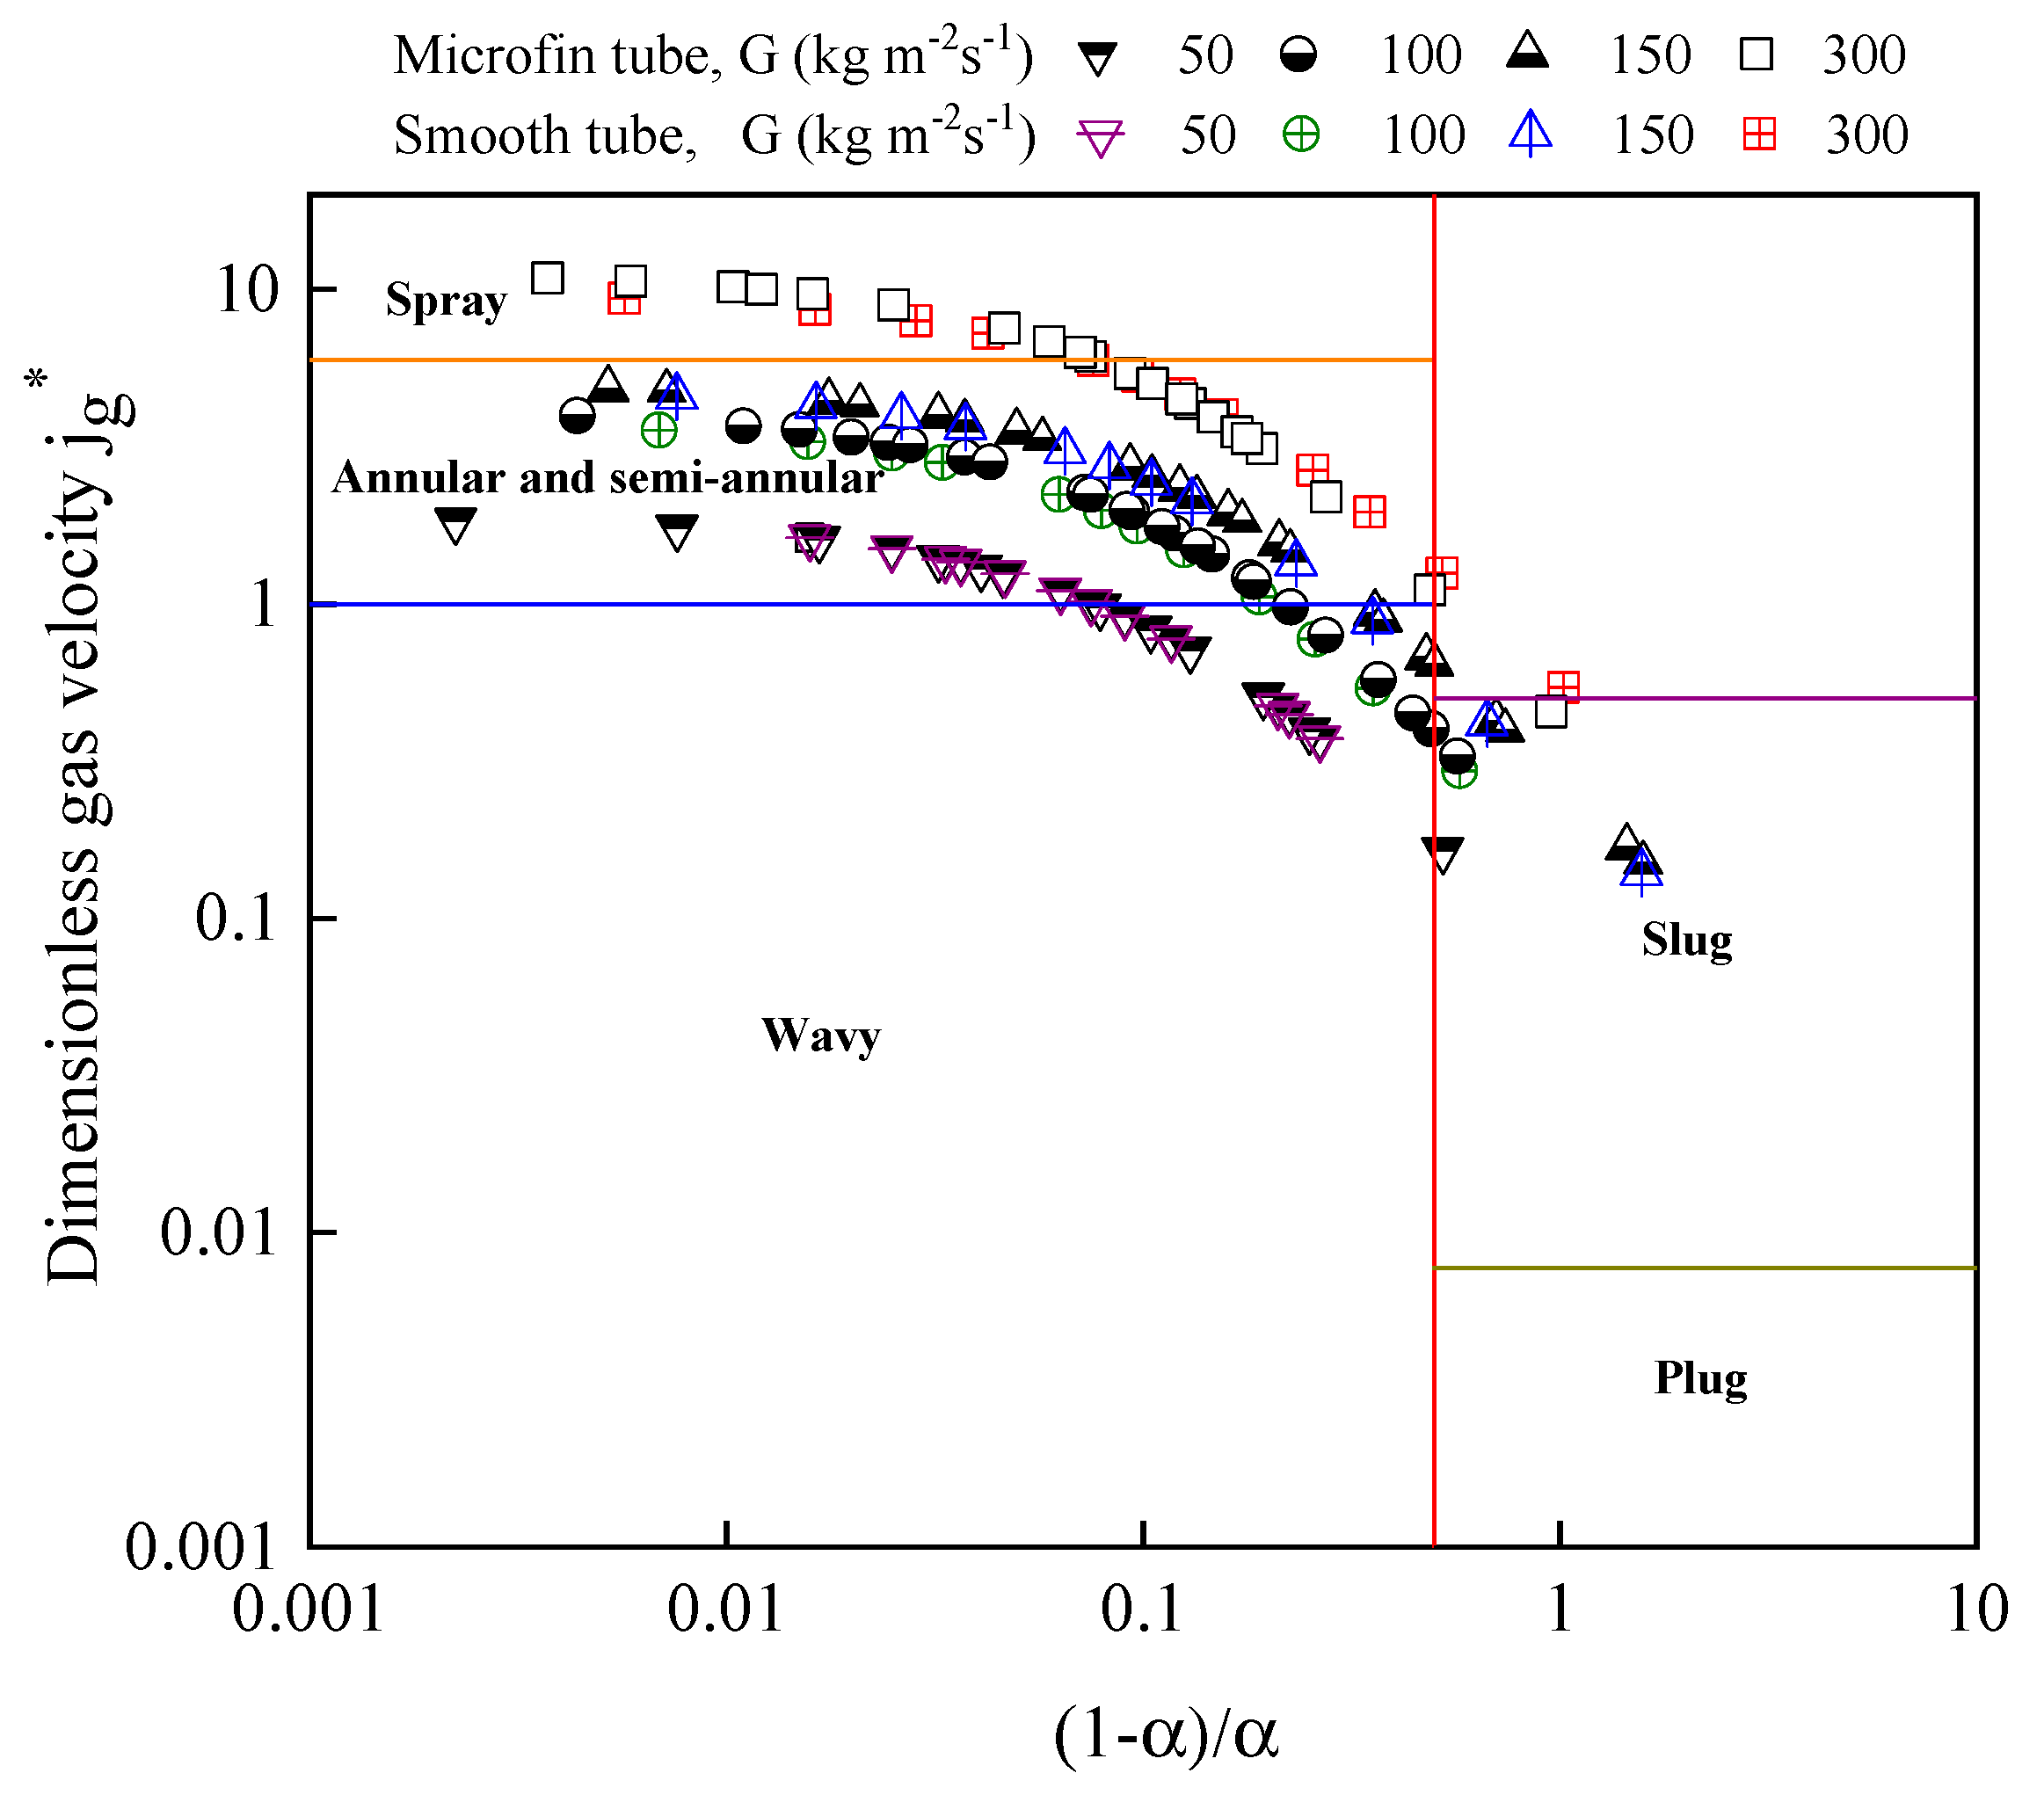
4.1. Frictional Pressure Drop Results and Discussion

The adiabatic pressure drop of R134a at saturation temperatures of 20 and 30 °C, mass fluxes ranging from 50 to 200 kg m−2s−1 and vapor qualities from 0 to 1 were investigated. The effects of mass flux, vapor quality, saturation temperature and tube diameter of the frictional pressure drop were analyzed.
Figure 5a,b shows the effects of mass flux and vapor quality on the frictional pressure drop, in smooth and microfin tubes for mass fluxes of 50, 75 and 100 kg m−2s−1 at a saturation temperature of 20 °C. As shown in Figure 5a,b, the frictional pressure drop increased as the mass flux increased. For a given mass flux, the pressure drop increased slightly at the low vapor quality (x < 0.3) region for both tubes. However, the rate of pressure drop increase was not same for the two tubes with the same experimental conditions: when mass flux increased from 50 to 100 kg m−2s−1 for smooth tube, pressure drop increased about 2.3–4.5 times, while, for microfin tube, pressure drop increased about 2.4–6 times. The frictional pressure drop of microfin tube was approximately 1.5 times higher than that of smooth tube at G = 50 kg m−2s−1. Therefore, the frictional pressure drop increased with fin due to the flow loss increase and turbulence generated by the fins. The range of pressure drop penalty factor was 1.01–2.11.
Figure 6 shows the effect of the saturation temperature on the frictional pressure drop at saturation temperatures of and 30 °C for mass fluxes of 100 and 200 kg m−2s−1. According to the experimental results, when saturation temperature increased, the pressure drop decreased significantly because the saturation temperature changed the refrigerant properties, such as viscosity and density. Table 2 shows that, at 20 °C, the liquid/gas density (ρlv) and viscosity (µlv) ratio are 44.34 and 18.09, respectively, while, at 30 °C, they are 31.79 and 15.41, respectively. Similar experimental results were also observed by Rahman et al. [9] and Revellin and Thome [21].
Experimental data were collected for R134a with different diameter test tubes. Figure 7 shows the frictional pressure drop of R134a in microfin tube of 2.17 mm (this work), 2.68 mm [22] and 3.18 mm [8] at the mass flux and saturation temperature of 50 kg m−2s−1 and 20 °C, respectively. The results for different tubes show that the frictional pressure drop of microfin tube (de = 3.18 mm) was lower than that of other microfin tubes. The second lowest was that of microfin tube (de = 2.68 mm), and the highest was that of microfin tube (de = 2.17 mm). The frictional pressure drop of de = 2.17 mm tube was on average approximately 1.2 times higher than that of the de = 3.18 mm tube. Thus, decreasing the tube diameter could increase the pressure drop. Similar experimental trends were also observed by Yan and Lin [23] and Cavalini et al. [24].

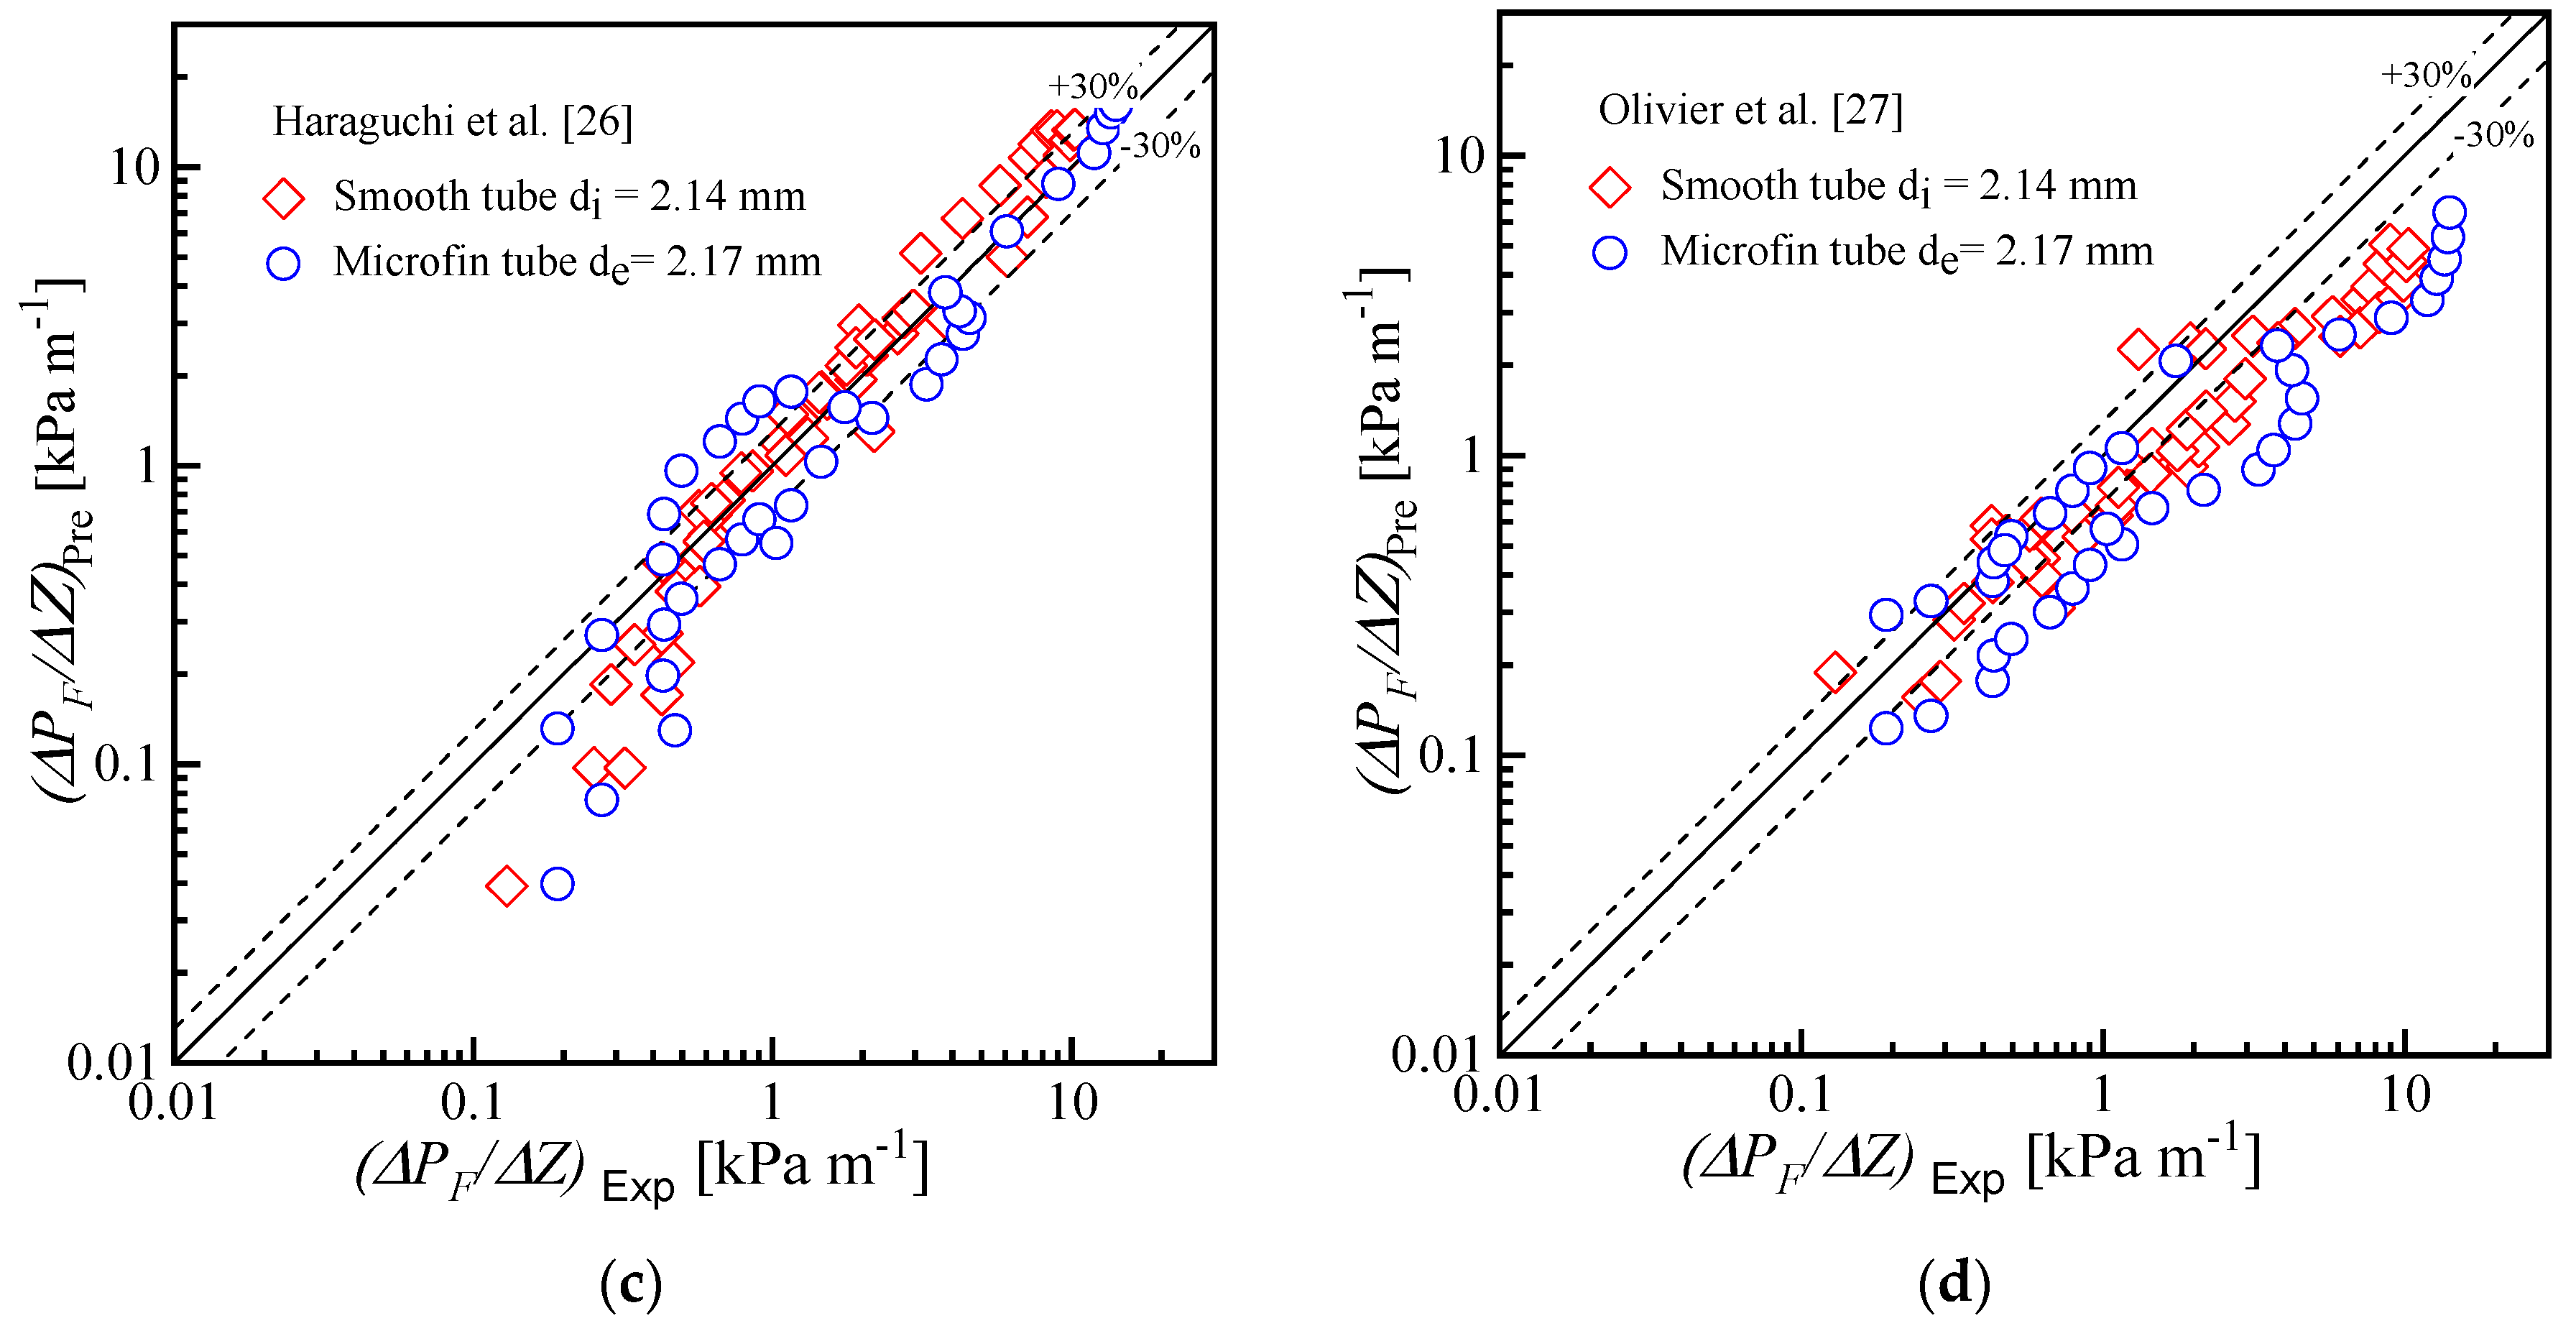
Comparison with the Pressure Drop Correlations

To validate the experimental procedure, the experimental frictional pressure drop data of the microfin and smooth tube were compared with the four pressure drop correlations proposed by Miyara et al. [2], Muller and Heck [25], Haraguchi et al. [26] and Olivier et al. [27], as shown in Figure 8. The compared frictional pressure drop correlations are listed in Table 3. The average deviation (AD) and mean deviation (MD) are listed in Table 4 and calculated by Equations (11) and (12), respectively. All correlations were well predicted for smooth tube data, but the microfin tube data were not predicted well.
A D   =   1 n i   =   1 n ( P F , P r e P F , E x p P F , E x p ) × 100
M D   =   1 n i   =   1 n | P F , P r e P F , E x p P F , E x p | × 100

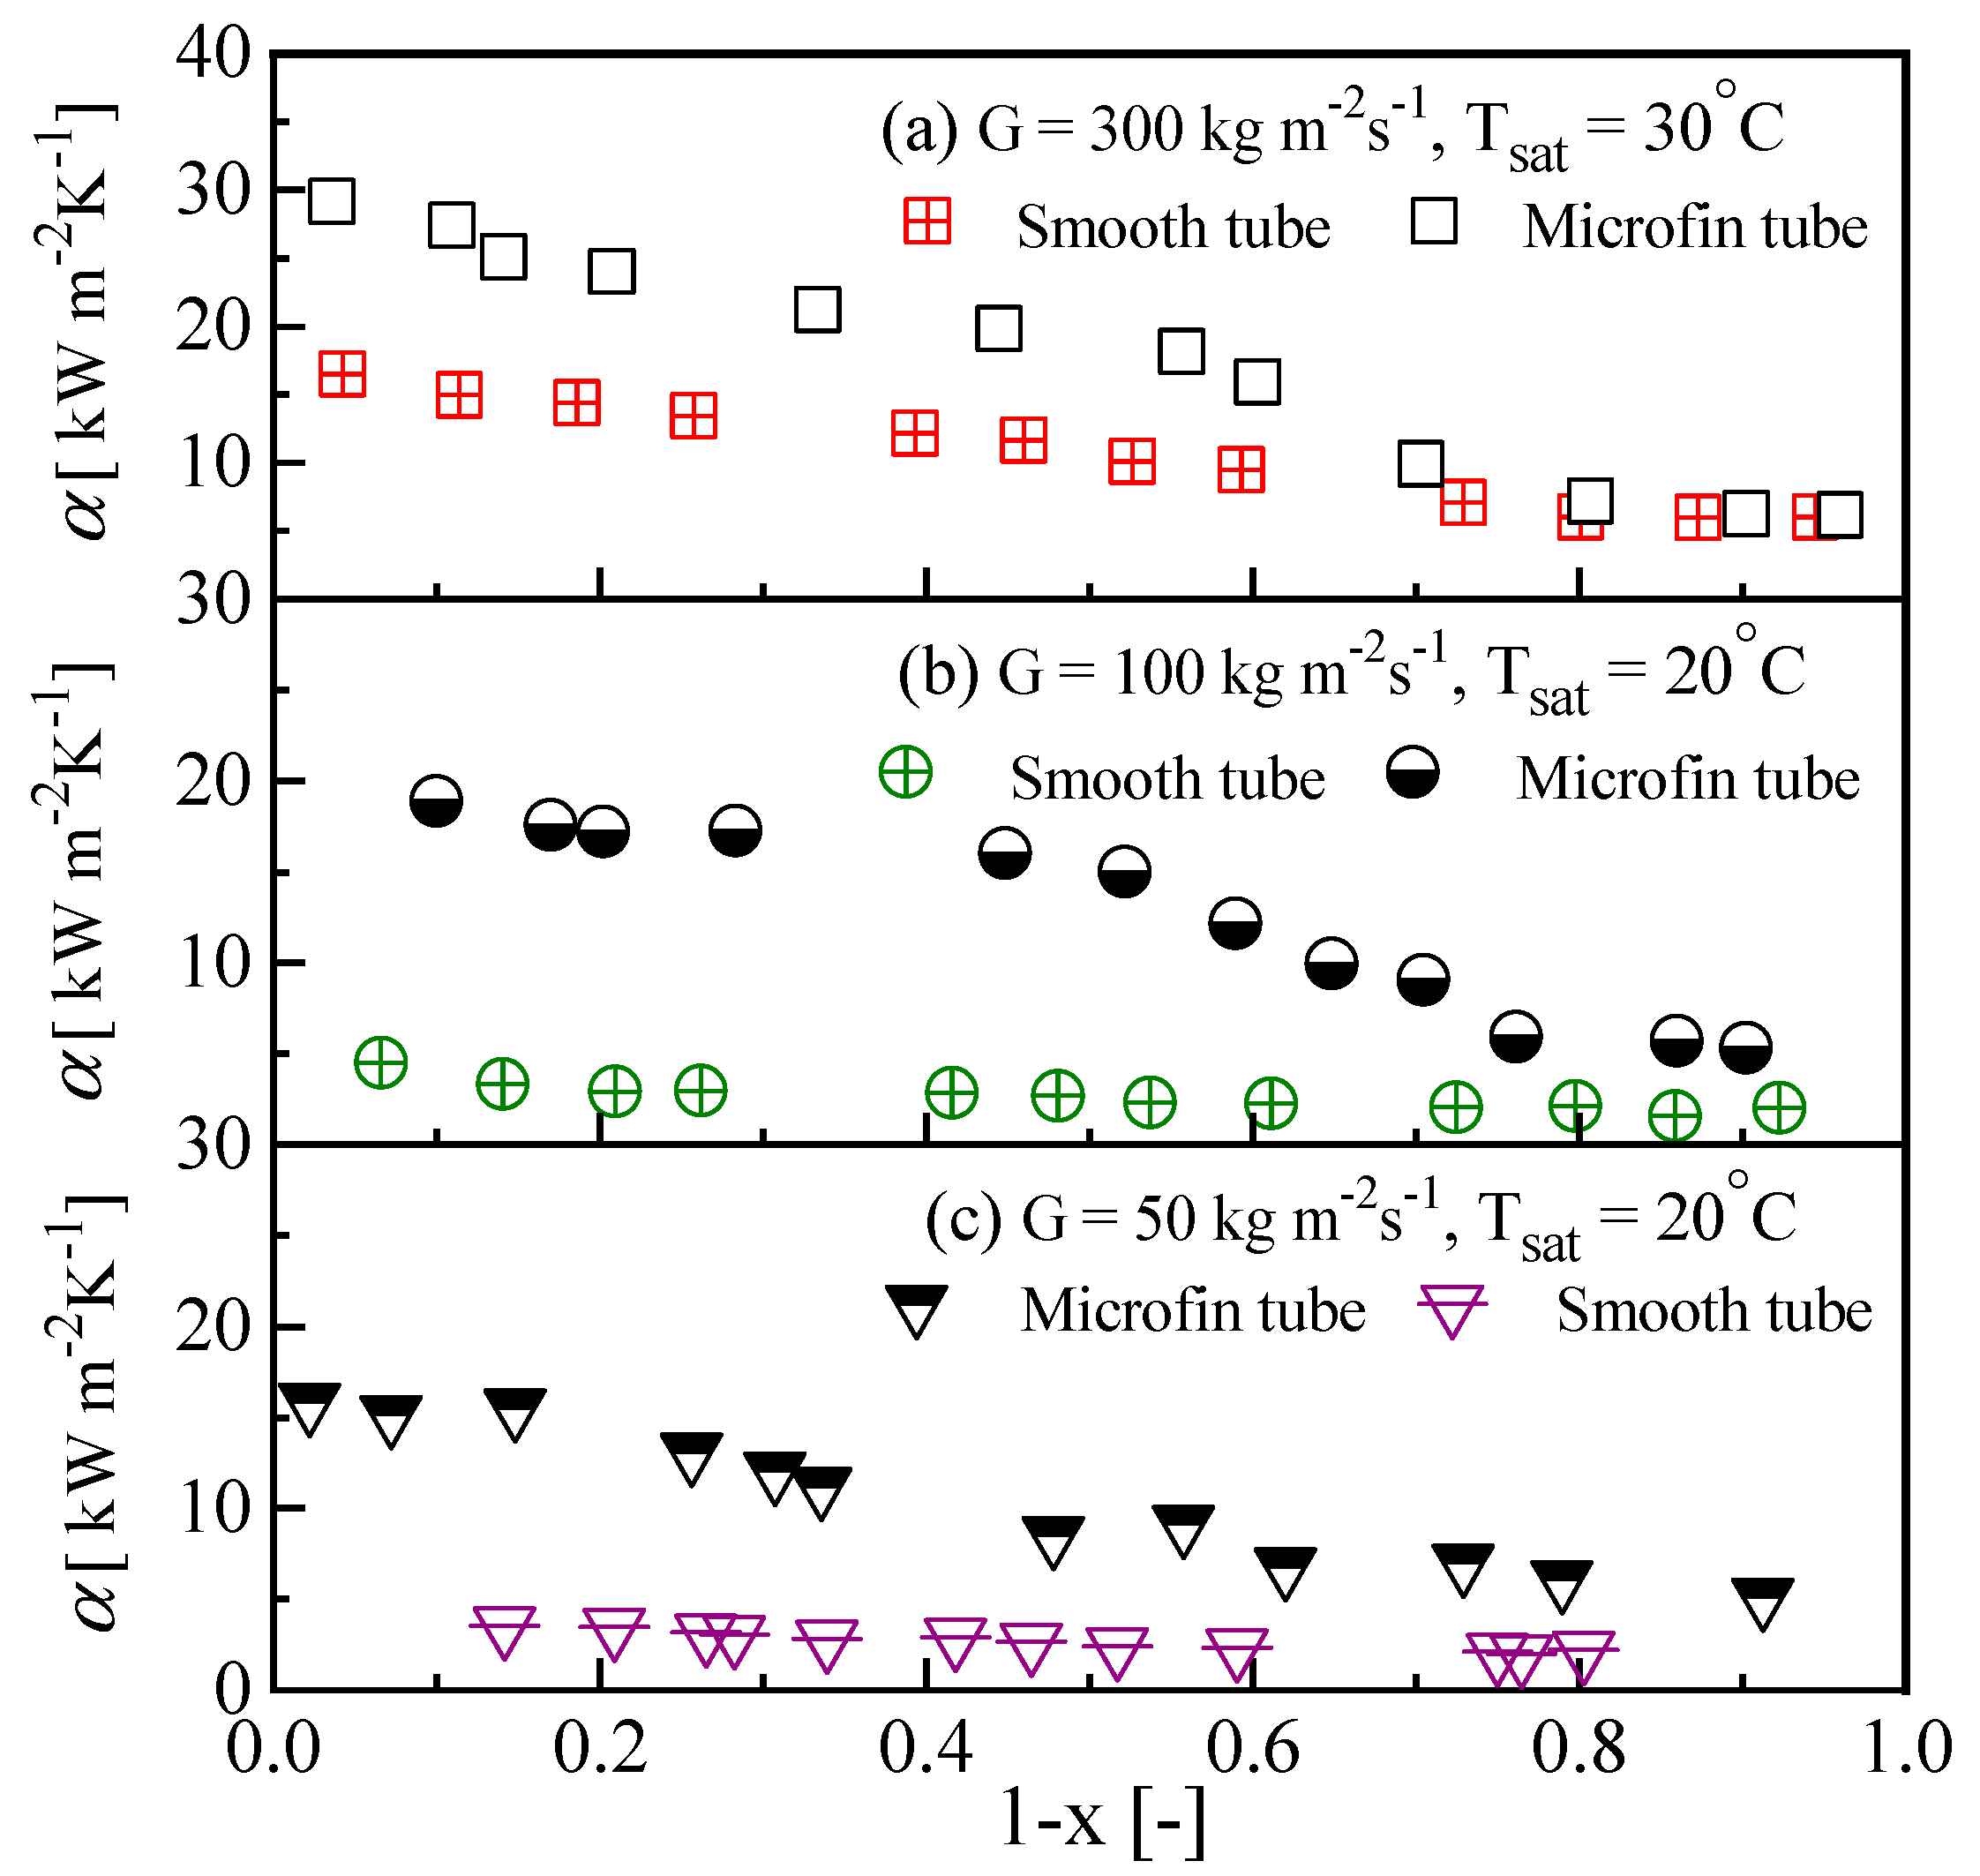
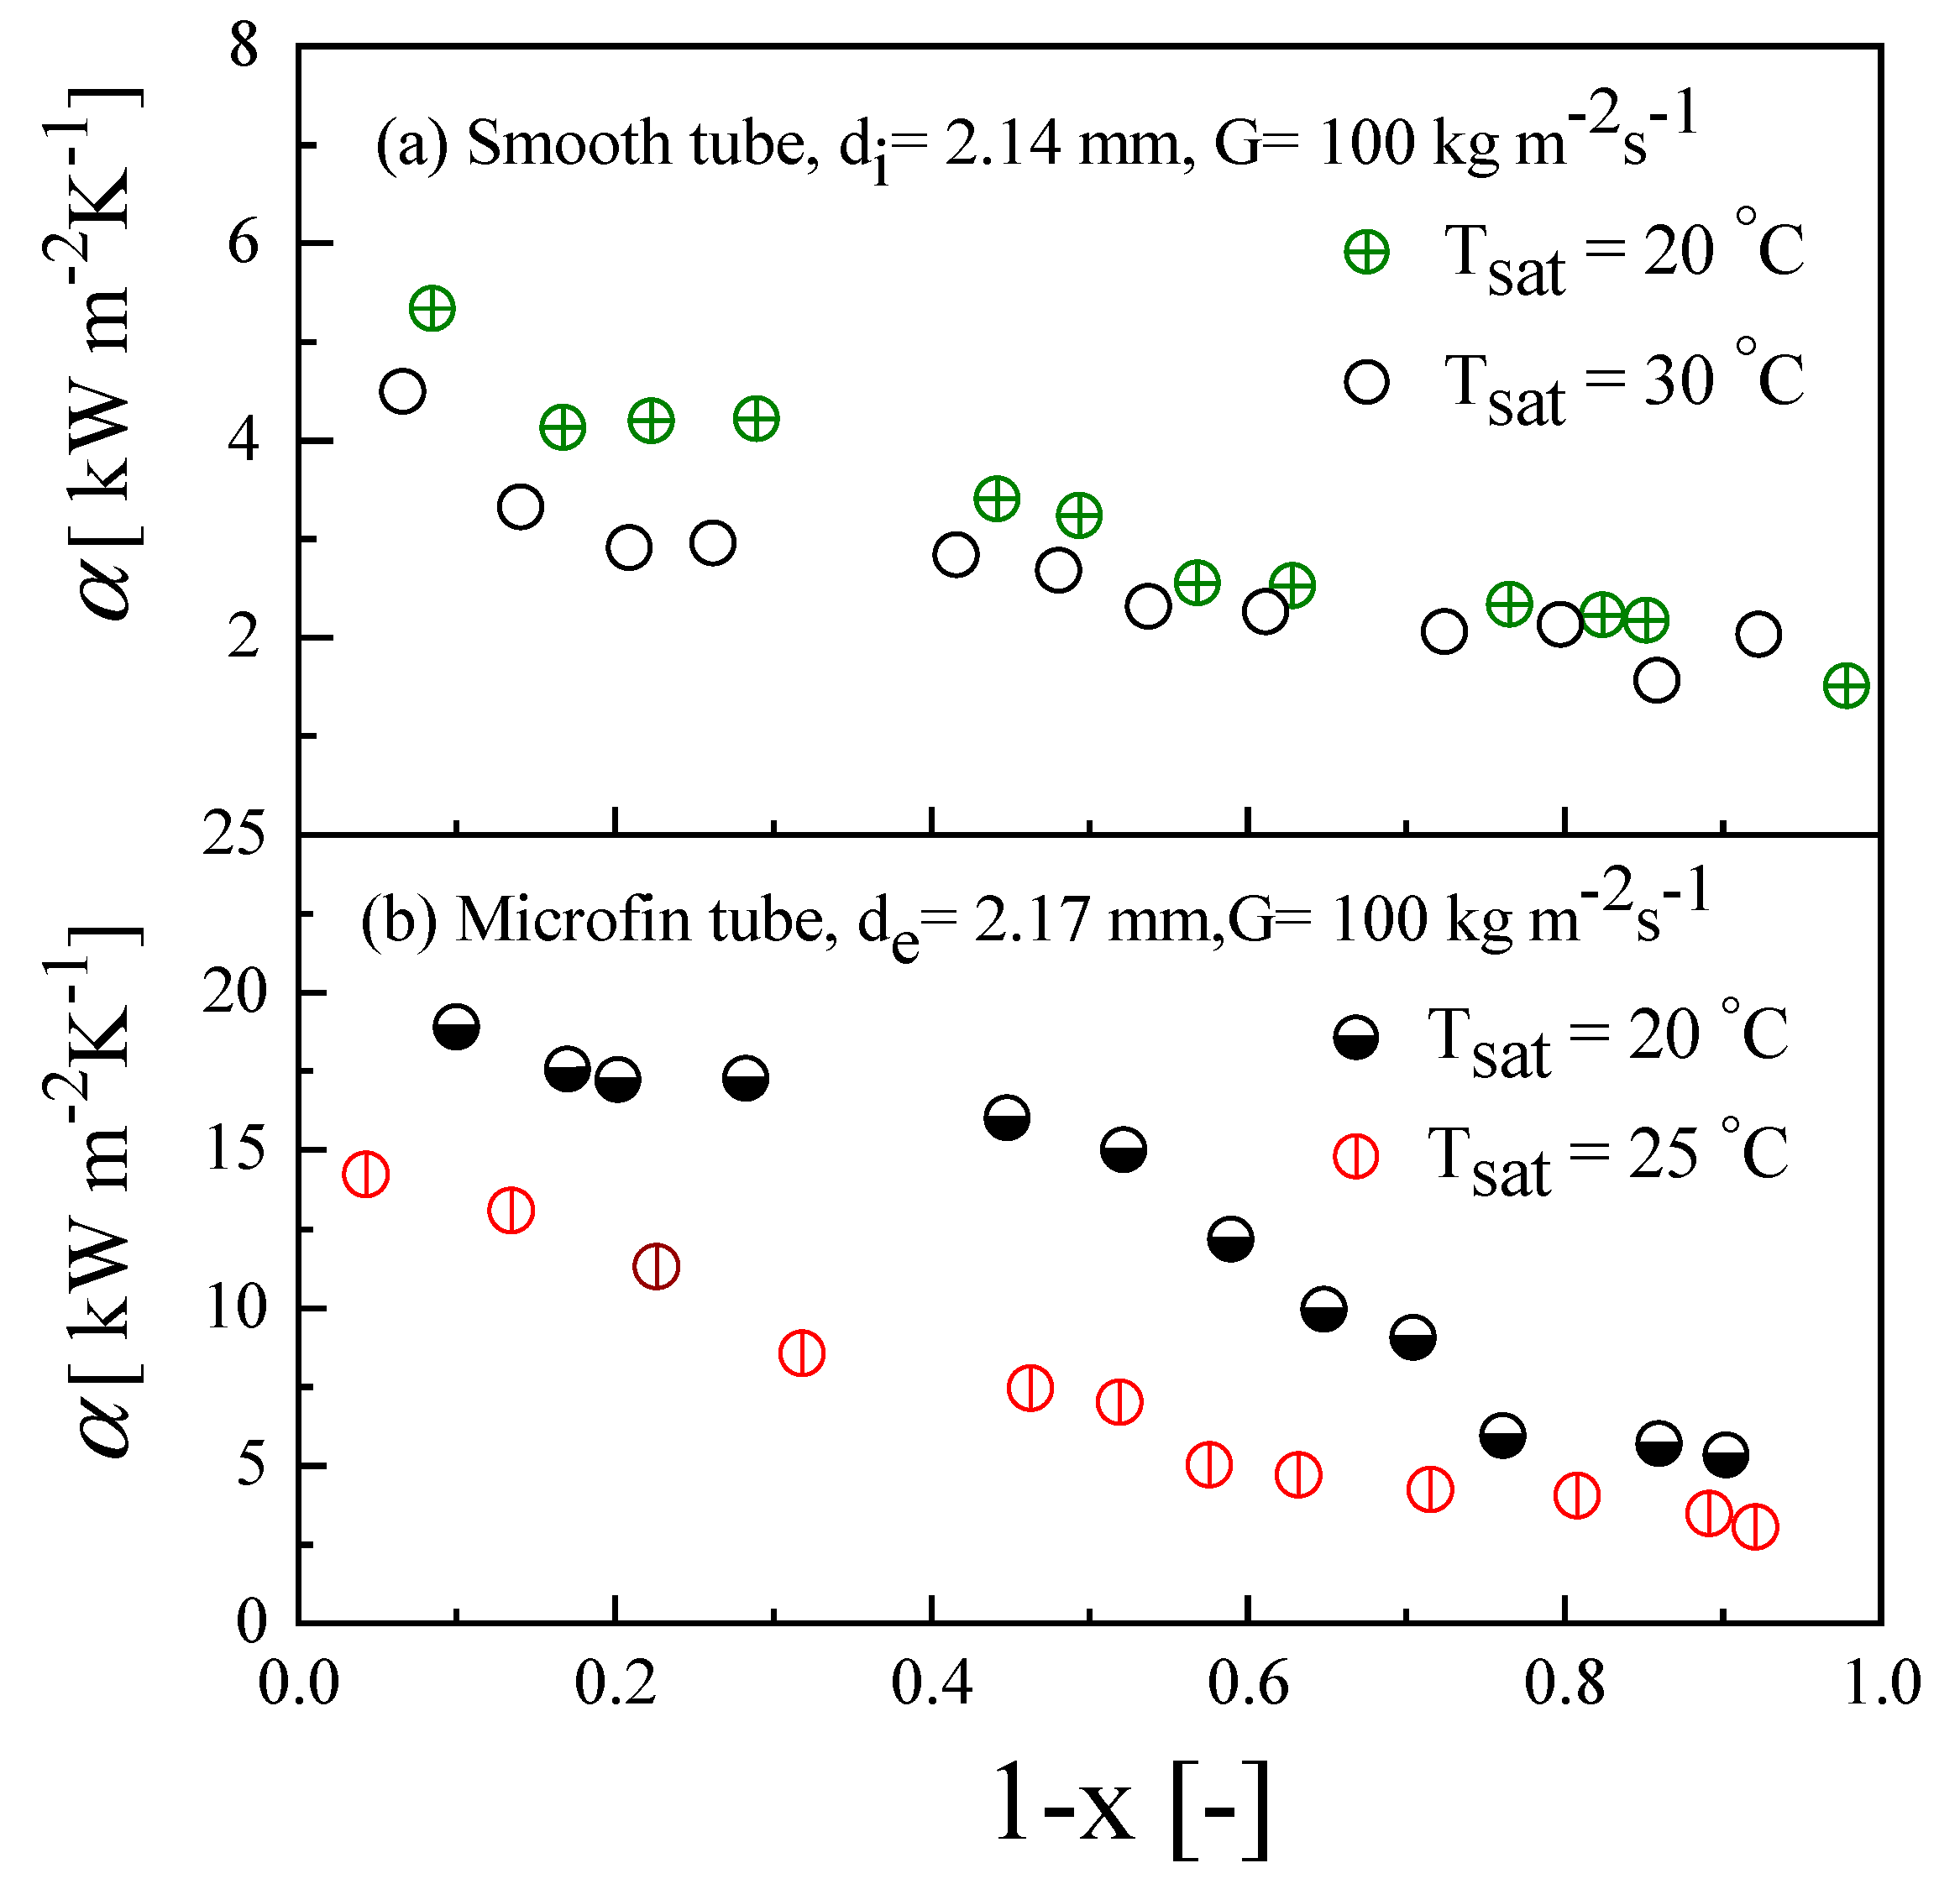
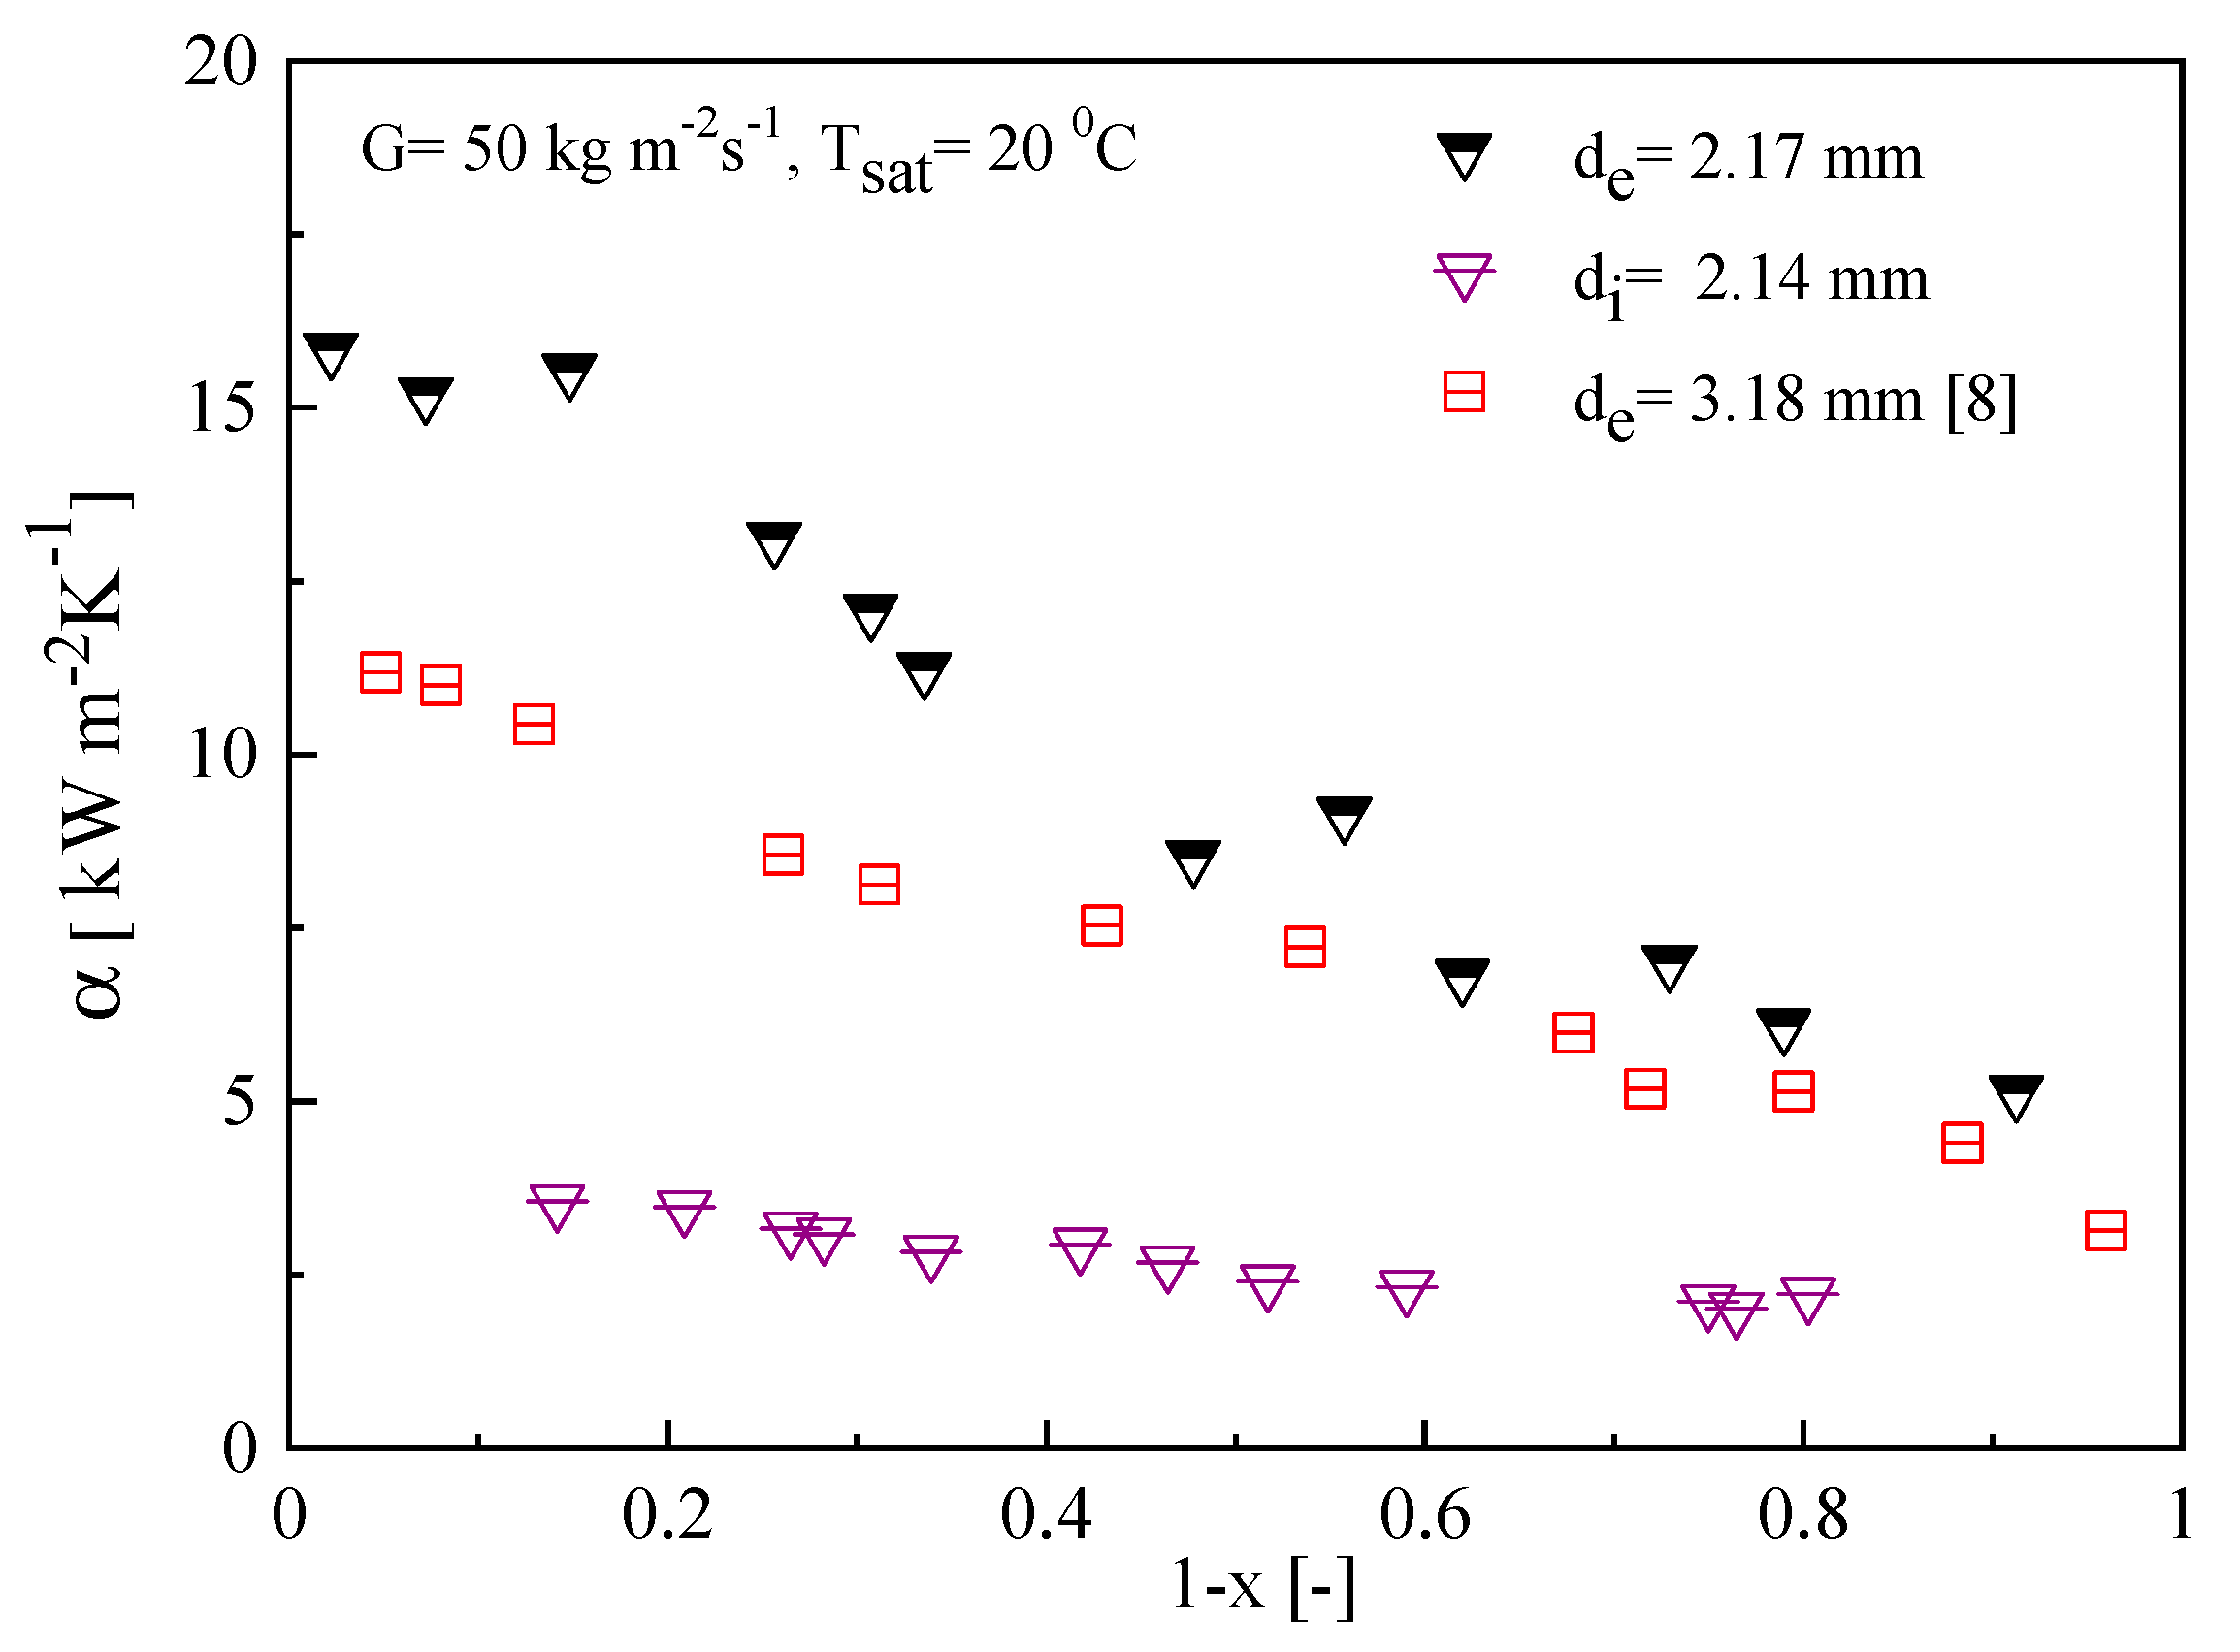
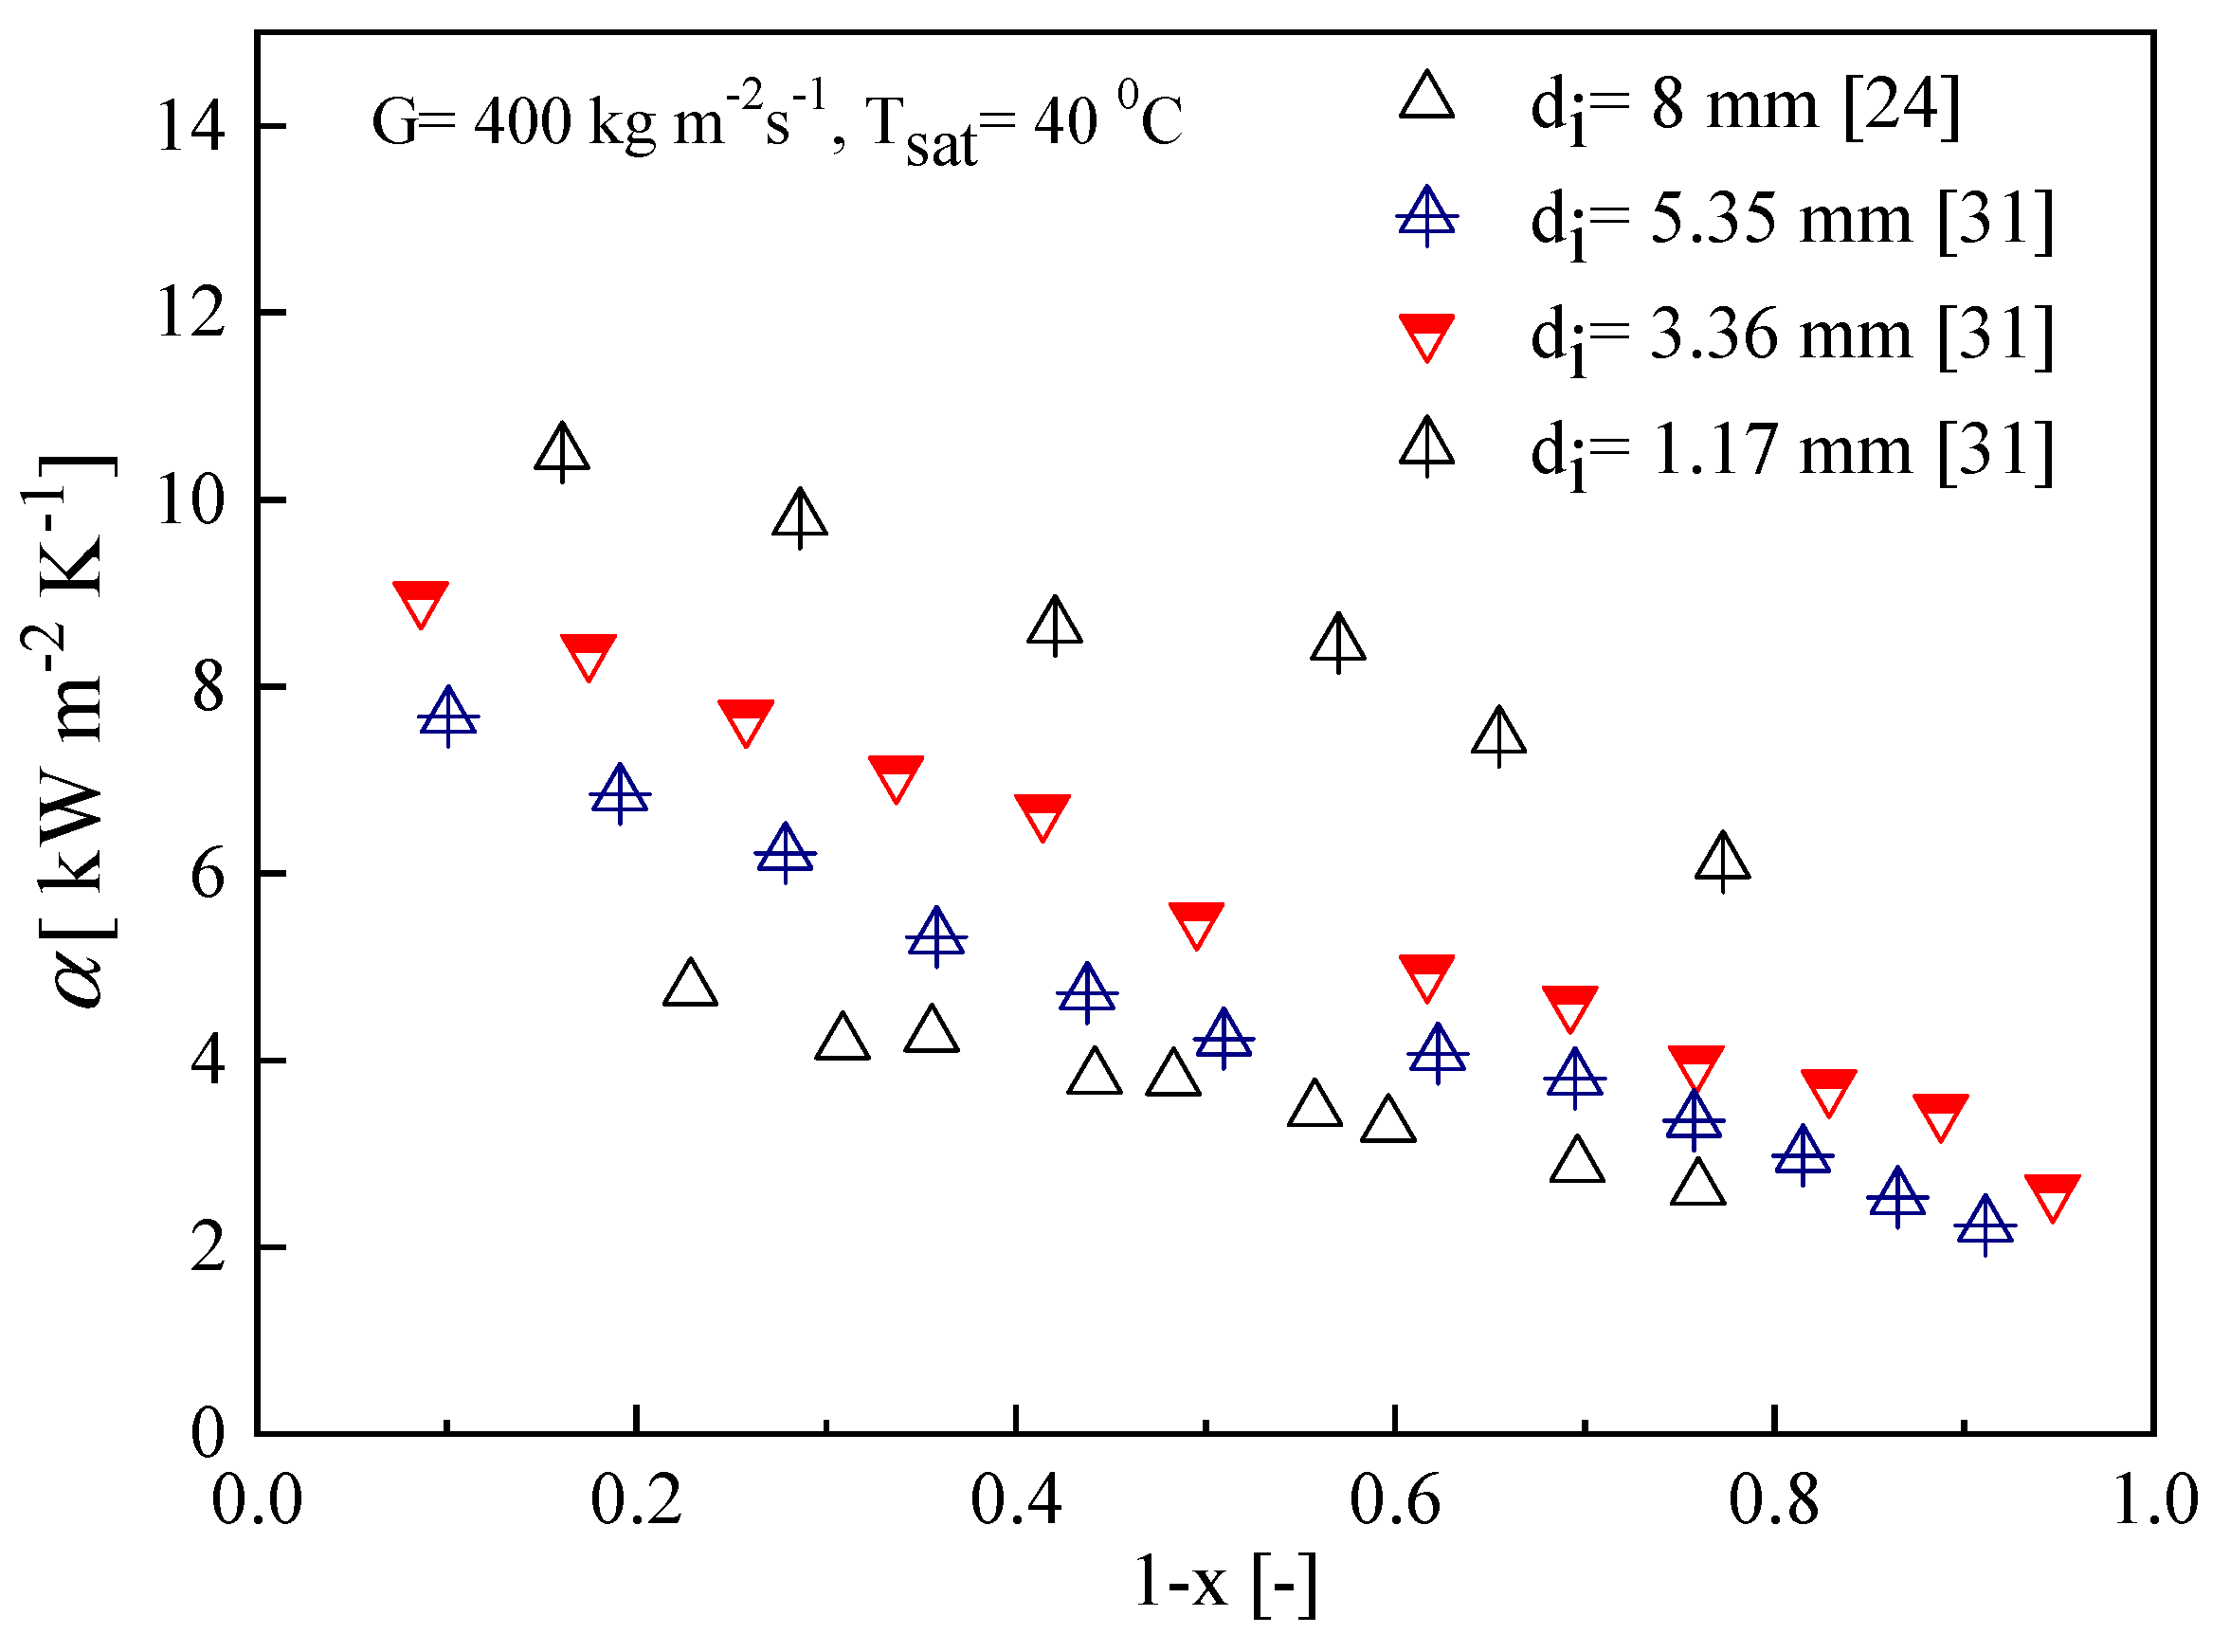
4.2. Condensation Heat Transfer Coefficient Results and Discussion

The condensation heat transfer coefficient of R134a at saturation temperatures of 20, 25 and 30 °C, mass fluxes ranging from 50 to 300 kg m−2s−1 and vapor qualities from 0 to 1 were investigated. The effects of mass flux, vapor quality, saturation temperature and tube diameter on condensation heat transfer were analyzed. It was expected that the refrigerant’s flow pattern would influence the mechanism of heat transfer during condensation process. Therefore, to categorize the condensation flow pattern inside the test tube, the present experimental data were predicted by two widely used flow pattern maps proposed by Scott [28] and Tandon et al. [29].
Figure 9 shows the experimental data plotted on the Scott [28] flow pattern map. In this flow pattern map, at a low mass flux of 50 kg m−2s−1 for both tubes, wavy flow occurred in the entire range of quality. At mass fluxes of 100–300 kg m−2s−1, many flow regimes occurred as the quality changed, and maximum of the data fall in annular flow and annular wavy regime. Moreover, few data obtained at the low vapor quality (x < 0.3) points fall into the slug and plug flow region. In the Tandon flow pattern map shown in Figure 10, most of the experimental data fall in the annular and semi-annular flow region, although very few data obtained at the low vapor quality (x < 0.2) fall in the slug flow region.
Figure 11 shows the effect of mass flux and vapor quality on condensation heat transfer coefficient by varying three mass fluxes. The figure also shows the heat transfer coefficient comparison of smooth and microfin tubes. For both tubes, the heat transfer coefficient increased significantly with an increase in mass flux, especially when the mass flux was larger than 50 kg m−2s−1. At mass flux 300 kg m−2s−1, the heat transfer coefficient was higher than at the two other mass fluxes because, at this mass flux, the data fall in annular flow region (shear dominated flow region), as shown in Figure 9 and Figure 10. Moreover, in shear dominated flow regime, the local heat transfer was primarily affected by the mass flux and vapor quality [30]. However, the heat transfer coefficient was higher at the beginning of condensation for all mass fluxes and decreased as vapor shear stress decreased. A comparison of the results, for microfin and smooth tube, shows that the heat transfer coefficient of microfin tube was higher than that of smooth tube, for all mass flux conditions because the microfin provides additional heat transfer area and thin condensate film. The heat transfer coefficient of the microfin tube was about 2–5 times higher than that of the smooth tube at 100 kg m−2s−1.
Saturation temperature has an effect on condensation heat transfer coefficient. Experimental studies were conducted by changing the saturation temperature at a fixed mass flux of 100 kg m−2s−1. Figure 12a shows the effect of saturation temperature on the heat transfer coefficient at saturation temperatures of 20 and 30 °C for the smooth tube. Figure 12b shows the effect of saturation temperature on the heat transfer coefficient at saturation temperatures of 20 and 25 °C for microfin tube. According to the experimental results, when saturation temperature increased, the heat transfer coefficient decreased. Basically, when saturation temperature increases, system pressure also increases, thus the vapor velocity decreases due to the increase in vapor density. Moreover, the saturation temperature changes the thermophysical properties of refrigerant, as shown in Table 2.
Figure 13 and Figure 14 show the effect of tube diameter on condensation heat transfer coefficient. Experimental data were collected for R134a with different test tube diameters. Figure 13 shows heat transfer coefficient of R134a in one smooth (di = 2.14 mm) and two microfin (de = 2.17 and 3.18 mm) tubes at mass flux and saturation temperature of 50 kg m−2s−1 and 20 °C, respectively. In Figure 13 and Figure 14, the decrease of tube diameter can help to increase the heat transfer coefficient and comparing the results for the two microfin tubes shows that the heat transfer coefficient of de = 3.18 mm tube was about 1.1–1.6 times lower than de = 2.17 mm tube. Actually, when the tube diameter decreased, the effect of shear stress and surface tension enhanced, resulting in the easy occurrence of annular flow regime. Similar experimental trends were also observed by Cavalini et al. [24] and Son and Lee [31], as shown in Figure 14.

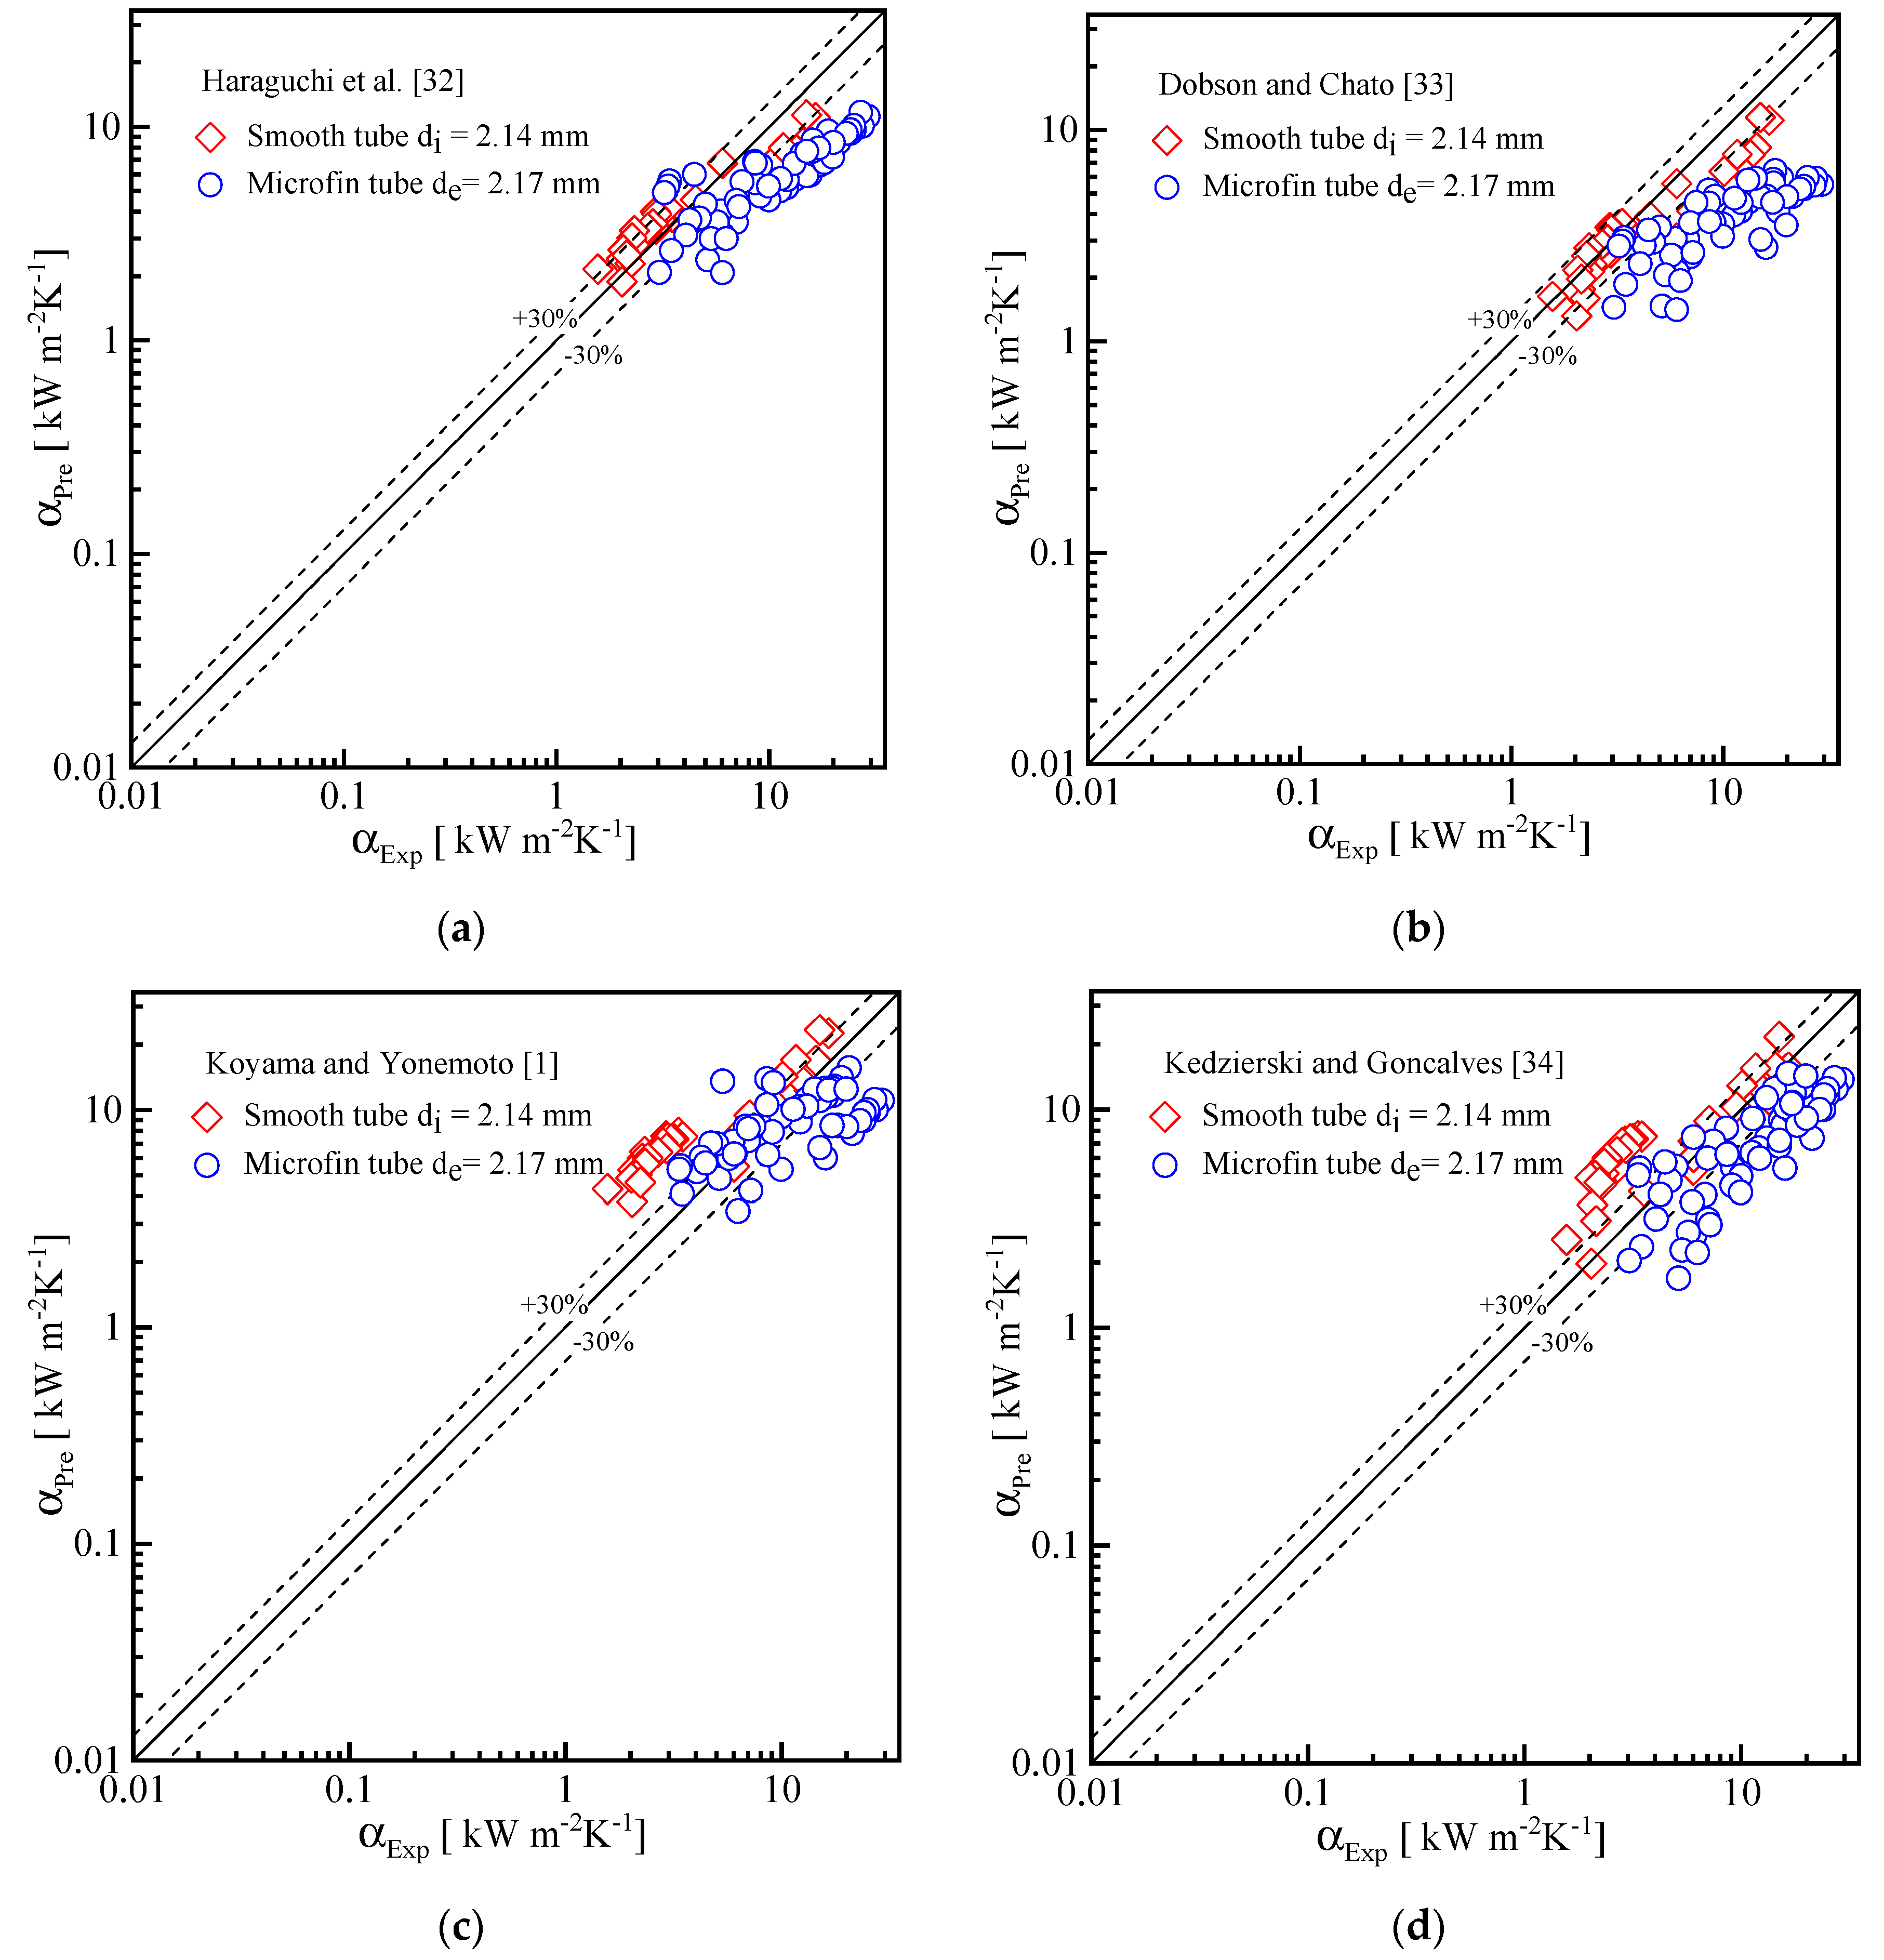
Comparison with the Condensation Heat Transfer Correlations

To validate the experimental procedure, the experimental condensation heat transfer data of the microfin and smooth tube were compared with the four typical condensation heat transfer correlations proposed by Haraguchi et al. [32], Dobson and Chato [33], Koyama and Yonemoto [1] and Kedzierski and Goncalves [34], as shown in Figure 15. The compared condensation heat transfer correlations are listed in Table 5. The average deviation (AD) and mean deviation (MD) are listed in Table 6 and calculated by Equations (13) and (14), respectively.
A D = 1 n i   =   1 n ( α P r e α E x p α E x p ) × 100
M D = 1 n i   =   1 n | α P r e α E x p α E x p | × 100

5. Conclusions

Experiments were carried out to investigate the adiabatic pressure drop and condensation heat transfer coefficient of R134a in a horizontal smooth and microfin tube with outer diameter of 2.5 mm. The experimental results for pressure drop, flow pattern and heat transfer were analyzed and compared with correlations. Some conclusions about this study are as follows.
The frictional pressure drop as well as condensation heat transfer coefficient increased with mass flux and vapor quality. The increase rate of pressure drop was higher in microfin tube compared to the smooth tube with the same experimental condition. The frictional pressure drop was higher in microfin tube for all mass fluxes and was about 1.5 times greater than that of smooth tube at mass flux 50 kg m−2s−1. Pressure drop penalty factor range was 1.01–2.11.
Condensation flow patterns were predicted by two widely used flow pattern maps and annular, semi-annular, wavy, and slug and plug flow patterns were observed inside the tube. With the increase of mass flux, the zone of annular flow regime increased in the flow pattern map. Heat transfer coefficient was higher in microfin tube for all mass fluxes and was about 2–5 times greater than that of smooth tube at mass flux of 100 kg m−2s−1. Decrease of tube diameter could increase heat transfer coefficient.
Four well-known pressure drop and condensation heat transfer correlations were used to predict the present experimental data. The pressure drop prediction correlations in ascending mean deviation order are: Muller and Heck, Haraguchi et al., Miyara et al., and Olivier et al. The heat transfer prediction correlations in ascending mean deviation order are: Dobson and Chato, Kedzierski and Goncalves, Koyama and Yonemoto, and Haraguchi et al.

Author Contributions

Investigation, M.K.B., and K.N.; Formal analysis, Data curation and Writing—original draft, M.K.B.; Supervision, K.K. and A.M.; and Project administration, A.M.

Funding

This research was funded by the Japan Copper Development Association.

Acknowledgments

The authors would like to thank the Japan Copper Development Association for their financial support.

Conflicts of Interest

The authors declare no conflict of interest.

Nomenclature

ADaverage deviation, dimensionless
BoBond number, dimensionless
Cccoefficient of contraction, dimensionless
ddiameter [m]
Gmass flux [kg m−2s−1]
GaGalileo number, dimensionless
hheat transfer coefficient [W m−2 K−1]
h”saturated vapor enthalpy [kJ kg−1]
HBheat balance, dimensionless
klliquid thermal conductivity [W m−2 K−1]
Lheat transfer length [m]
MDmean deviation, dimensionless
nnumber of fin, dimensionless
NuNusselt number, dimensionless
Ppressure [Pa]
Phphase change number, dimensionless
PrPrandtl number, dimensionless
P pressure drop [Pa]
Qheat exchange amount [W]
ReReynolds number, dimensionless
Ttemperature [°C]
T temperature difference between refrigerant and inner wall
vspecific volume [m3 kg−1]
xquality, dimensionless
XttLockhart-Martinelli parameter, dimensionless

Greek Symbol

αheat transfer coefficient [W m−2 K−1]
βarea ratio, dimensionless
ξvoid fraction, dimensionless
δwall thickness [mm]
γapex angle [°]
θhelix angle [°]
λcthermal conductivity [W m−2 K−1]
ρdensity [kg m−3]
µviscosity [Pa s−1]
σsurface tension [N m−1]
Φtwo-phase multiplier, dimensionless

Subscripts

aadiabatic
ccoolant
eequivalent
Expexperimental
Ffrictional
FCforced convection
GCgravity control convection condensation
hhydraulic
iinner
lliquid
loliquid only
NCnatural convection
oouter
Preprediction
Rrefrigerant
Satsaturation
vvapor
vovapor only
tptwo-phase
wiinner wall
woouter wall

References

  1. Koyama, S.; Yonemoto, R. Experimental study on condensation of pure refrigerants in horizontal microfin tube-proposal of correlations for heat transfer coefficient and frictional pressure drop. In Proceedings of the International Refrigeration and Air Conditioning Conference, West Lafayette, IN, USA, 17–20 July 2006; pp. 1–8. [Google Scholar]
  2. Miyara, A.; Nonaka, K.; Taniguchi, M. Condensation heat transfer and flow pattern inside a herringbone-type micro-type tube. Int. J. Refrig. 2000, 23, 141–152. [Google Scholar] [CrossRef]
  3. Kim, N.H. Condensation heat transfer and pressure drop of R-410A in a 7.0 mm O.D microfin tube at low mass fluxes. Heat Mass Transf. 2016, 52, 2833–2847. [Google Scholar] [CrossRef]
  4. Kondou, C.; Mishima, F.; Liu, J.; Koyama, S. Condensation and evaporation of R134a, R1234ze(E) and R1234ze(Z) flow in horizontal microfin tubes at higher temperatures. In Proceedings of the International Refrigeration and Air Conditioning Conference, West Lafayette, IN, USA, 14–17 July 2014; pp. 1–8. [Google Scholar]
  5. Wu, Z.; Sunden, B.; Wang, L.; Li, W. Convective condensation inside horizontal smooth and microfin tubes. J. Heat Transf. 2014, 136, 051504. [Google Scholar] [CrossRef]
  6. Diani, A.; Cavallini, A.; Rossetto, L. R1234yf condensation inside a 3.4 mm ID horizontal microfin tube. Int. J. Refrig. 2017, 75, 178–189. [Google Scholar] [CrossRef]
  7. Hirose, M.; Ichinose, J.; Inoue, N. Development of the general correlation for condensation heat transfer and pressure drop inside horizontal 4 mm small-diameter smooth and microfin tubes. Int. J. Refrig. 2018, 90, 238–248. [Google Scholar] [CrossRef]
  8. Bashar, M.K.; Nakamura, K.; Kariya, K.; Miyara, A. Condensation heat transfer and pressure drop characteristics inside small diameter microfin tubes. In Proceedings of the Japan Society of Refrigeration and Air Conditioning Annual Conference, Koriyama, Japan, 4–7 September 2018; pp. 1–6. [Google Scholar]
  9. Rahman, M.M.; Kariya, K.; Miyara, A. Experimental investigation of condensation heat transfer and adiabatic pressure drop characteristics inside 2.13 mm ID microfin and smooth tube. Int. J. Air-Cond. Refrig. 2017, 25, 1750027. [Google Scholar] [CrossRef]
  10. Zhuang, X.R.; Chen, G.F.; Guo, H.; Song, Q.L.; Tang, Q.X.; Yang, Z.Q.; Zou, X.; Gong, M.Q. Experimental investigation on flow condensation of zeotropic mixture of methane/ethane in a horizontal smooth tube. Int. J. Refrig. 2018, 85, 120–134. [Google Scholar] [CrossRef]
  11. Fronk, B.M.; Garimella, S. Condensation of ammonia and high-temperature-glide ammonia/water zeotropic mixtures in minichannels—Part I: Measurements. Int. J. Heat Mass Transf. 2016, 101, 1343–1356. [Google Scholar] [CrossRef]
  12. Dorao, C.A.; Fernandino, M. Simple and general correlation for heat transfer during flow condensation inside plain pipes. Int. J. Heat Mass Transf. 2018, 122, 290–305. [Google Scholar] [CrossRef]
  13. Xiao, J.; Hrnjak, P. Heat transfer and pressure drop of condensation from superheated vapor to subcooled liquid. Int. J. Heat Mass Transf. 2016, 103, 1327–1334. [Google Scholar] [CrossRef]
  14. Ghim, G.; Lee, J. Condensation heat transfer of low GWP ORC working fluids in a horizontal smooth tube. Int. J. Heat Mass Transf. 2017, 104, 718–728. [Google Scholar] [CrossRef]
  15. Meyer, J.P.; Ewim, D.R.E. Heat transfer coefficients during the condensation of low mass fluxes in smooth horizontal tubes. Int. J. Multiph. Flow. 2018, 99, 485–499. [Google Scholar] [CrossRef]
  16. Shah, M.M. Improved correlation for heat transfer during condensation in conventional and mini/micro channels. Int. J. Refrig. 2018. [Google Scholar] [CrossRef]
  17. Lemmon, E.W.; Huber, M.L.; McLinden, M.O. Reference Fluid Thermodynamic and Transport Properties-REFPROP [9.1]; NIST Standard Reference Database; NIST: Gaithersburg, MD, USA, 2013. [Google Scholar]
  18. Collier, J.G.; Thome, J.R. Convective Boiling and Condensation, 3rd ed.; Oxford University Press: Oxford, UK, 1994. [Google Scholar]
  19. Smith, S.L. Void fractions in two-phase flow: A correlation based upon an equal velocity head model. Proc. Inst. Mech. Eng. 1969, 184, 647–664. [Google Scholar] [CrossRef]
  20. JCGM 100. Evaluation of Measurement Data-Guide to the Expression of Uncertainty in Measurement; JCGM: Sèvres, France, 2008. [Google Scholar]
  21. Revellin, R.; Thome, J.R. Adiabatic two-phase frictional pressure drops in microchannels. Exp. Therm. Fluid Sci. 2008, 31, 673–685. [Google Scholar] [CrossRef]
  22. Ichinose, Y.; Kudo, Y.; Bashar, M.K.; Kariya, K.; Miyara, A. Boiling and condensation heat transfer and pressure drop of grooved small copper tube. In Proceedings of the Japan Society of Mechanical Engineering, Saga, Japan, 19–22 September 2017; pp. 13–14. [Google Scholar]
  23. Yan, Y.Y.; Lin, T.F. Condensation heat transfer and pressure drop of refrigerant R-134a in a small pipe. Int. J. Heat Mass Transf. 1999, 42, 697–708. [Google Scholar] [CrossRef]
  24. Cavallini, A.; Censi, G.; Del Col, D.; Doretti, L.; Longo, G.A.; Rossetto, L. Experimental investigation on condensation heat transfer and pressure drop of new HFC refrigerants (R134a, R125, R32, R410A, R236ea) in a horizontal smooth tube. Int. J. Refrig. 2001, 24, 73–87. [Google Scholar] [CrossRef]
  25. Steinhagen, M.H.; Heck, K.A. Simple frictional pressure drop correlation for two-phase flow in pipes. Chem. Eng. Process. 1986, 20, 297–308. [Google Scholar] [CrossRef]
  26. Haraguchi, H.; Koyama, S.; Fujii, T. Condensation of refrigerants HCFC 22, HFC 134a and HCFC 123 in a horizontal smooth tube (1st report, proposals of empirical expression for the local frictional pressure drop). JSME Int. J. 1994, 60, 2111–2116. [Google Scholar]
  27. Olivier, J.A.; Liebenberg, L.; Kedzierski, M.A.; Meyer, J.P. Pressure drop during condensation inside horizontal smooth, helical microfin, and herringbone microfin tubes. J. Heat Transf. 2004, 126, 687–696. [Google Scholar] [CrossRef]
  28. Scott, D.S. Properties of co-current gas-liquid flow. Adv. Chem. Eng. 1964, 4, 199–276. [Google Scholar]
  29. Tandon, T.N.; Varma, H.K.; Gupta, G.P. A new flow regimes map for condensation inside horizontal tubes. Int. J. Heat Transf. 1982, 104, 763–768. [Google Scholar] [CrossRef]
  30. Wang, L.; Dang, C.; Hihara, E. Experimental study on condensation heat transfer and pressure drop of low GWP refrigerant HFO1234yf in a horizontal tube. Int. J. Refrig. 2012, 35, 1418–1429. [Google Scholar] [CrossRef]
  31. Son, C.H.; Lee, H.S. Condensation heat transfer characteristics of R-22, R-134a and R-410A in small diameter tubes. Heat Mass Transf. 2009, 45, 1153–1166. [Google Scholar] [CrossRef]
  32. Haraguchi, H.; Koyama, S.; Fujii, T. Condensation of refrigerants HCFC 22, HFC 134a and HCFC 123 in a horizontal smooth tube (2nd report, proposals of empirical expressions for the local heat transfer coefficient). JSME Int. J. 1994, 60, 245–252. [Google Scholar]
  33. Dobson, M.K.; Chato, J.C. Condensation in smooth horizontal tubes. J. Heat Transf. 1998, 120, 192–213. [Google Scholar] [CrossRef]
  34. Kedzierski, M.A.; Goncalves, J.M. Horizontal convective condensation of alternative refrigerants within a microfin tube. J. Enhanced Heat Transf. 1999, 6, 161–178. [Google Scholar] [CrossRef]
Figure 1. Schematic diagram of the experimental apparatus.
Applsci 08 02146 g001
Figure 2. Details of the test section.
Applsci 08 02146 g002
Figure 3. Photography and schematic view of the test tube: (a) smooth tube; (b) microfin tube; and (c) schematic view of the microfin tube.
Applsci 08 02146 g003
Figure 4. Repeatability of experiment: (a) heat transfer; and (b) pressure drop.
Applsci 08 02146 g004
Figure 5. Effects of mass flux and vapor quality on frictional pressure drop: (a) smooth tube; and (b) microfin tube.
Applsci 08 02146 g005
Figure 6. Effect of saturation temperature on frictional pressure drop.
Applsci 08 02146 g006
Figure 7. Effect of tube diameter on frictional pressure drop.
Applsci 08 02146 g007
Figure 8. Comparison between the experimental and predicted frictional pressure drop using correlations by: (a) Miyara et al. [2]; (b) Muller and Heck [25]; (c) Haraguchi et al. [26]; and (d) Olivier et al. [27].
Applsci 08 02146 g008aApplsci 08 02146 g008b
Figure 9. Flow pattern prediction by Scott flow pattern map [28].
Applsci 08 02146 g009
Figure 10. Flow pattern prediction by Tandon flow pattern map [29].
Applsci 08 02146 g010
Figure 11. Effect of mass flux and vapor quality on condensation heat transfer coefficient at: (a) G = 300 kg m−2s−1; (b) G = 100 kg m−2s−1; and (c) G = 50 kg m−2s−1.
Applsci 08 02146 g011
Figure 12. Effect of saturation temperature on condensation heat transfer coefficient: (a) smooth tube; and (b) microfin tube.
Applsci 08 02146 g012
Figure 13. Effect of tube diameter on condensation heat transfer coefficient.
Applsci 08 02146 g013
Figure 14. Average condensation heat transfer coefficient of different tube, inner diameter of 8 mm [24], 5.35 mm [31], 3.36 mm [31] and 1.17 mm [31] at mass flux 400 kg m−2s−1.
Applsci 08 02146 g014
Figure 15. Comparison between the experimental and predicted condensation heat transfer coefficients using correlations: (a) Haraguchi et al. [32]; (b) Dobson and Chato [33]; (c) Koyama and Yonemoto [1]; and (d) Kedzierski and Goncalves [34].
Applsci 08 02146 g015
Table 1. Specifications of the test tubes.
Parameter [Unit]Smooth TubeMicrofin Tube
Outside diameter do [mm]2.52.5
Inner diameter di [mm]2.14-
Equivalent diameter de [mm]-2.17
Wall thickness δ [mm]0.180.15
Fin height h [mm]-0.10
Apex angle γ [°]-31
Helix angle θ [°] 10
Number of fin n [-]-25
Table 2. Thermophysical properties of R134a [17].
Tsat
[°C]
ρl
[kg m−3]
ρv
[kg m−3]
ρ l ρ v µl
[µPa-s]
µv
[µPa-s]
μ l μ v σ
[mN m−1]
201225.9027.6544.34207.7511.4818.098.71
251207.3032.2037.50195.2511.6816.718.05
301188.0037.3731.79183.4711.9015.417.40
Table 3. Pressure drop correlations.
Author(s)CorrelationExperimental Condition
Miyara et al. [2] ( Δ P Δ z ) F = ϕ v 2 ( Δ P Δ z ) v , ( Δ P Δ z ) v = 0.092 G 2 x 2 d h ρ v ( G x d h / μ v ) 0.2
ϕ v = 1.1 + 1.3 X t t 0.35 [ G { g d h ρ v ( ρ l ρ v ) } 0.5 ] 0.35
do = 7 mm, smooth, helical and herringbone microfin tube.
Fluid: R410A, R22
G: 100–400 kg m−2s−1.
Muller and Heck [25] ( Δ P Δ z ) F = E ( 1 x ) 1 / 3 + ( Δ P Δ z ) v o x 3 E = ( Δ P Δ z ) l o + 2 [ ( Δ P Δ z ) v o ( Δ P Δ z ) l o ] x d = 4–392 mm
Fluid: air–water, air–oil, hydrocarbon, R11, R12, R22
G: 50–2490 kg m−2s−1.
Haraguchi et al. [26] ( Δ P Δ z ) F = ϕ v 2 ( Δ P Δ z ) v
( Δ P Δ z ) v = 0.092 G 2 x 2 ρ v d i ( G x d i / μ v ) 0.2
ϕ v = 1 + 0.5 [ G { g d h ρ v ( ρ l ρ v ) } 0.5 ] 0.75 X t t 0.35
di = 8.4 mm, smooth tube.
Fluid: R134a, R123, R22
G: 99.8–402 kg m−2s−1.
Olivier et al. [27] ( Δ P Δ z ) F = ϕ l 2 ( Δ P Δ z ) l o , ( Δ P Δ z ) l o = 2 f l o [ G ( 1 x ) ] 2 d h ρ l ϕ l 2 = 1.376 + 7.242 X t t 1.655 f l o = 0.046 R e l 0.2 ( d h d e ) ( 1 e n t π d h 2 cos β ) 0.5 ( sec β ) 0.75 do = 9.51–9.55 mm,
circular smooth, helical and herringbone tube.
Fluid: R22, R407C, R134a
G: 400–800 kg m−2s−1.
Table 4. Deviations of frictional pressure drop. AD: average deviation; MD: mean deviation.
CorrelationSmooth TubeMicrofin TubeAll Data
AD (%)MD (%)AD (%)MD (%)AD (%)MD (%)
Miyara et al. [2]−26.2926.33−32.8344.79−30.8835.24
Muller and Heck [18]11.6422.937.5040.887.0530.03
Haraguchi et al. [19]5.9827.33−7.7636.800.4831.06
Olivier et al. [20]−26.7233.29−41.9546.75−34.1140.89
Table 5. Condensation heat transfer correlations.
Author(s)CorrelationExperimental Condition
Haraguchi et al. [32] h t p = N u k l d h , N u = N u F C 2 + N u G C 2
N u F C = 0.0152 R e l 0.77 ( 1 + 0.6 P r l 0.8 ) ϕ v X t t
N u G C = 0.725 H ( ξ ) ( G a l P r l P h ) 0.25
d = 8 mm, smooth tube.
Fluid: R134a, R22, R123
G: 90–400 kg m−2s−1.
Dobson and Chato [33] h t p = 0.023 R e l 0.8 P r l 0.4 ( 1 + 2.22 X t t 0.89 ) k l d h d = 3.14–7.04 mm, smooth tube.
Fluid: R134a, R12, R22, mixture (R32/R125), G: 25–800 kg m−2s−1.
Koyama and Yonemoto [1] h t p = N u k l d i , N u = ( N u F C 2 + N u N C 2
N u F C = 2.12 f v ( ρ l ρ v ) 0.1 ( x 1 x ) ϕ v R e l 0.5 P r l 0.5
N u N C = 1.98 H ( ξ ) η A 0.5 B o 0.1 ( G a P r l P h l ) 0.25
do = 7.52 mm, microfin tube.
Fluid: R134a, R123, R22
G: 200–500 kg m−2s−1.
Kedzierski and Goncalves [34] h t p = N u k l d h
N u = 4.94 Ω R e l 0.235 P r l 0.308 S v 2.708 x
d = 3.14–7.04 mm, microfin tube.
Fluid: R134a, R124, R32, R410A, mixture (R32/R125)
G: 57–552 kg m−2s−1.
Table 6. Deviations of condensation heat transfer coefficient.
CorrelationSmooth TubeMicrofin TubeAll Data
AD (%)MD (%)AD (%)MD (%)AD (%)MD (%)
Haraguchi et al. [32]2.1531.10−40.7498.14−24.4873.56
Dobson and Chato [33]−15.3620.69−60.1660.16−43.3645.36
Koyama and Yonemoto [1]99.5799.68−12.4735.8727.9759.19
Kedzierski and Goncalves [34]75.4877.62−34.4240.106.0653.92

