1. Introduction
Quantitative phase imaging is particularly useful for the investigation of biological thin tissue sections, which are generally transparent and hence do not show high amplitude contrast in a conventional optical microscope. It is therefore not easy to visualize such cells unless a staining is applied, which is time-consuming and may harm or even kill the cell and hence change their natural behavior. For translucent samples, the scattered light (which contains all the structural information about the object) is 90° out of phase to the unscattered light. When the object is weak (first Born approximation), this means that the modulus of the image (hence its intensity) is negligibly affected by the scattered waves. Conventional Zernike phase contrast microscopy [
1] partly resolves this problem by reducing the amplitude of the undiffracted light and by introducing an additional 90° phase shift into the diffracted light. In the image, both terms (scattered and unscattered) now interfere strongly (they are in phase or anti-phase with one another), greatly increasing the visibility of the specimen. However, conventional Zernike phase contrast microscopy is not quantitative and suffers from artifacts, such as “halos,” which surround the edges of phase structures in the specimen and result in a reduced resolution. Other phase contrast imaging techniques such as differential interference contrast (DIC) do not suffer under loss of resolution, but DIC still does not yet result in quantitative phase imaging. In fact, DIC is a two-beam interference method with a lateral shear that approximately matches the microscope’s resolution. It is hence sensitive to the phase gradient. Attempts have been made to recover the quantitative phase using spatial light modulators as an adjustable phase delay unit in Zernike phase contrast microscopy [
2], called Spatial Light Interference Microscopy (SLIM) with the delay applied to phase ring, or in DIC, called Gradient Light Interference Microscopy (GLIM) [
3] with the delay applied in the Fourier domain followed by an integration of the recovered phase gradient. However, SLIM still suffers from halo artifacts and loss of resolution, and GLIM suffers from the lack of directional sensitivity, which in detail means that it is insensitive to structural details oriented in a direction perpendicular to the shear direction. Instead of constant phases steps, various different shears have been applied in Reference [
4] in order to recover the phase quantitatively.
On the other hand, the well-established digital holography only works well outside the laboratory environment if measures, such as pulsed laser light (freeze the motion in time) or common path geometries (both arms experience same environment), are applied in order to reduce the impact of disturbing environmental conditions on the recorded hologram. In rare cases of single-cell imaging can Gabor holography or lateral shearing interferometry be applied to recover the phase quantitatively. In these particular cases, the specimen only covers a small fraction of the field of view. Hence, the specimen region can by means of lateral shearing be brought into interference with a neighboring region, where light has passed through in an undiffracted manner. This approach offers a robust and compact solution to recover the phase. However, it is limited to the imaging of a few cells only. Instead, our endeavor is the imaging of thin tissue in order to discard the labeling in histopathology.
Iterative quantitative phase imaging can cover the aforementioned shortcomings via the recording of multiple diffraction patterns, which are then computer processed in an iterative manner to recover the quantitative phase. A key to phase retrieval imaging is the recording of the same information on multiple speckle decorrelated patterns. Many techniques have been developed based on this principle, such as the recording of two or more diffraction patterns at different planes [
5]. In Reference [
6], an aperture is moved across the object and the corresponding diffraction patterns are sequentially recorded. A phase mask has been applied to modulate the wavefront in References [
7,
8] and the phase information could be recovered from diffraction patterns recorded at different wavelengths. The latter suffers from the problem of dispersion effects that result in different responses of the object under investigation with respect to the wavelength employed. Therefore, each of the recorded wavelength’s corresponding speckle patterns may hold different information, which hinders or makes the application of the iterative phase retrieval approach impossible. In Reference [
9], not the distance between sensor and object but the distance between point source and object was changed. Hence, compared to Reference [
5], the lateral resolution did not suffer since it was the same for all diffraction patterns recorded. Moreover, the retrieval algorithms could be simplified via the application of the direct Fresnel transform.
In this paper, the optical performance of the curved illumination phase retrieval algorithm with regard to the optical resolution, phase sensitivity, and signal to noise ratio (SNR) was investigated and compared to digital off-axis holography using the same sensor and same distance to the object. Furthermore, the curved illumination phase retrieval method was applied for the label-free discrimination of cancerous and healthy human renal tissue.
2. Experimental Setup
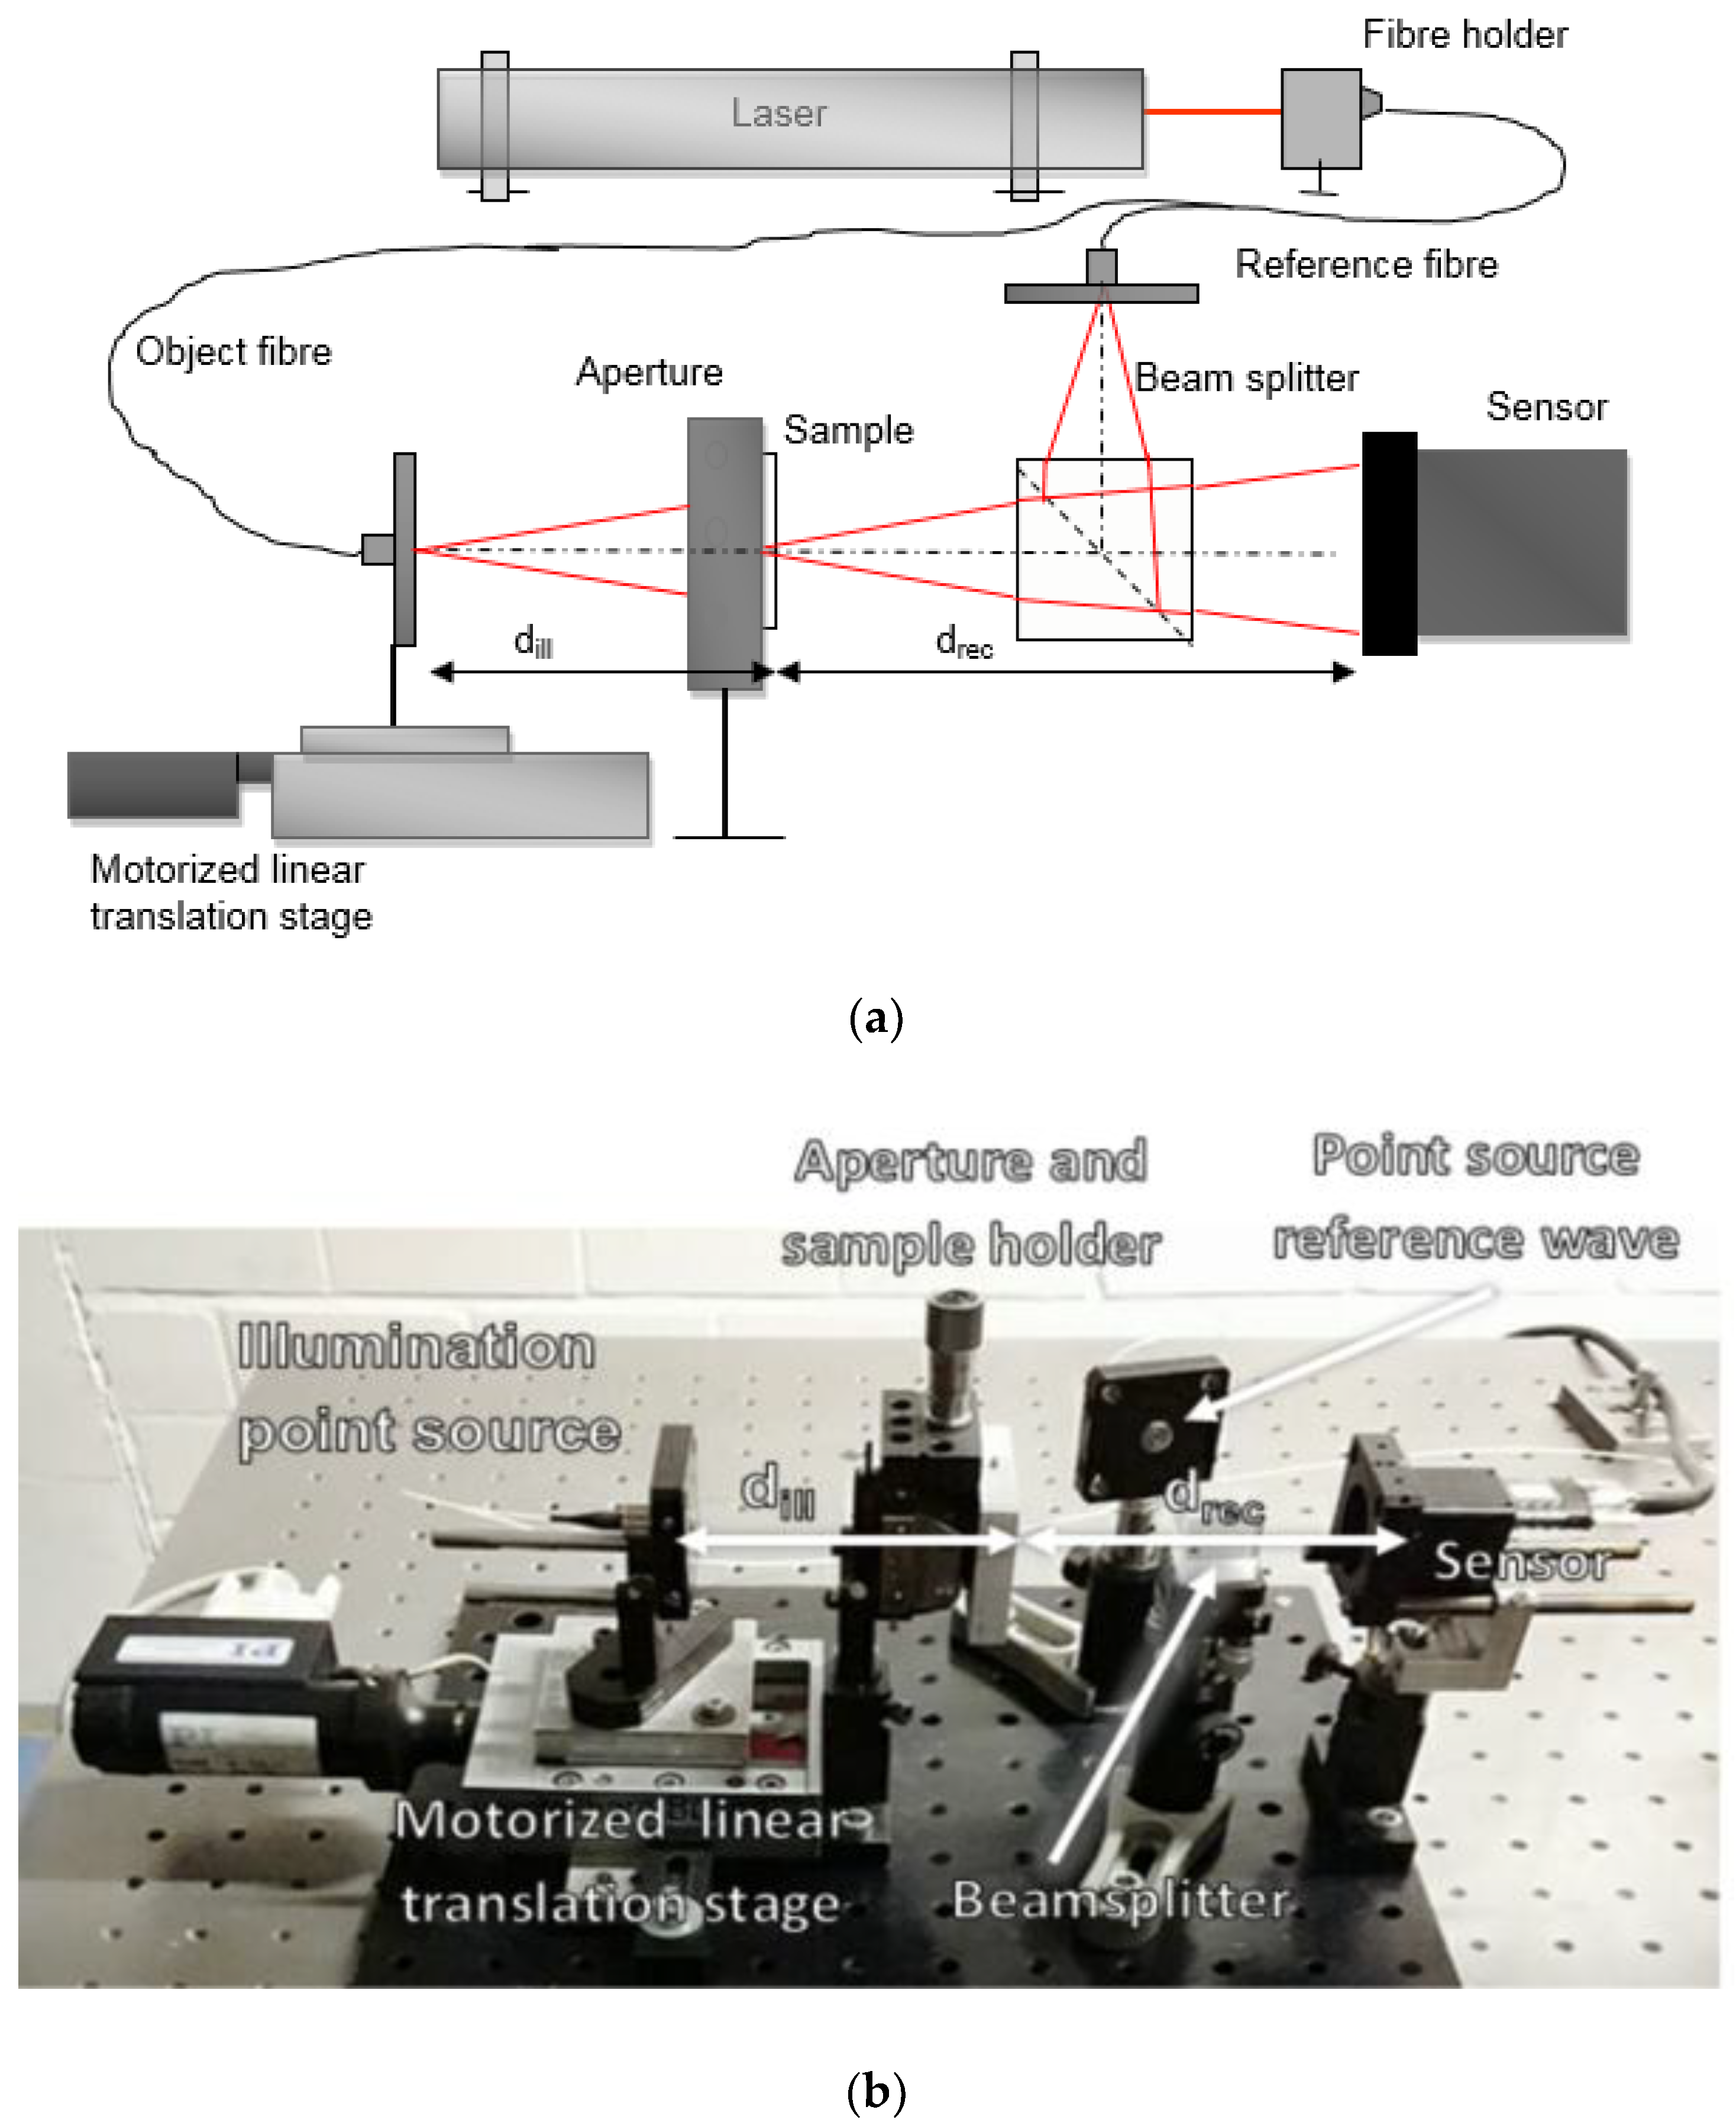
The experimental setup for both systems, iterative phase retrieval and digital holography, was configured on a breadboard in order to enable transportation to our medical partners in Tübingen to investigate human samples on site. The setup is shown in
Figure 1. Light is launched from a HeNe Laser (Spectra-Physics, Irvine, CA, USA) (632.83 nm) into a single mode fibre coupler. One end of the fibre coupler is used as a point source. The wavelength and the distance to the object define the illumination function impinging upon the object. An aperture is positioned in close proximity to the object in order to restrict the field of view to ensure that the frequencies in the detector plane are below the Nyquist limit. The object-diffracted light and the reference wave are combined via a beam splitter cube of 20 mm length (Thorlabs BS016, 50:50 Non-Polarizing Beamsplitter Cube, 400–700 nm, Thorlabs, Newton, NJ, USA) and directed at slightly different angles to the sensor, at which an off-axis digital hologram is recorded. The distance between the illumination point source and the object is 85 mm. The sensor employed is Ximea Modell MQ013RG-E2 (1280 × 1024, 5.3 µm pixel size). For the iterative phase retrieval system, the reference fibre is removed from the setup and the motorized actuator (Physik Instrumente M125.11, Physik Instrumente, Karlsruhe, Germany) holding the point source is axially displaced to different predefined positions to ensure the recording of speckle decorrelated diffraction patterns, as pointed out in Reference [
9]. For the sake of a fair comparison, the beam splitter cube was not removed between the two different experiments, which resulted in the same effect on the object beam and its wavefront. Due to the smaller refraction angle in the glass (NBK7), the divergent wavefronts leaving the beam splitter have a stronger curvature compared to an equivalent passage of light through air. Therefore, the interference pattern appears to have been recorded from a shorter recording distance than the geometrical path length. Considering the refractive index of glass, the interferometrically recorded path length can be calculated, which we from now on refer to as virtual path length:
The actuator and the sensor are controlled using the in-house developed software ITOM [
10], which enables an automated procedure.
At first, the resolution was investigated employing a United States Air Force resolution test target. The sensor was positioned at a virtual path length distance of 93 mm with respect to the object, and the point source at distances ranging from 73 mm to 85 mm with respect to the object. In accordance with the Nyquist criterion:
The object size
X was restricted to 5.5 mm, with
drec being the object to camera distance, and Δ
x′ the sensor’s pixel size. The minimum displacement
dsp_axial applied to the actuator in order to obtain speckle decorrelation was:
which was equal to 0.6 mm, with
λ being the wavelength (632.83 nm),
dill the longest illumination distance (85 mm) and
X being the object size. Speckle represented high-frequency information, which hence decorrelated quicker than low-frequency components.
In order to likewise obtain sufficient decorrelation of low-frequency components, the available displacement of the actuator was employed, with the recording of 10 diffraction patterns separated by 1.33 mm. For the reconstruction, the combined distance
dcomb of the illumination and recording scheme was used in the implementation of the direct Fresnel propagation:
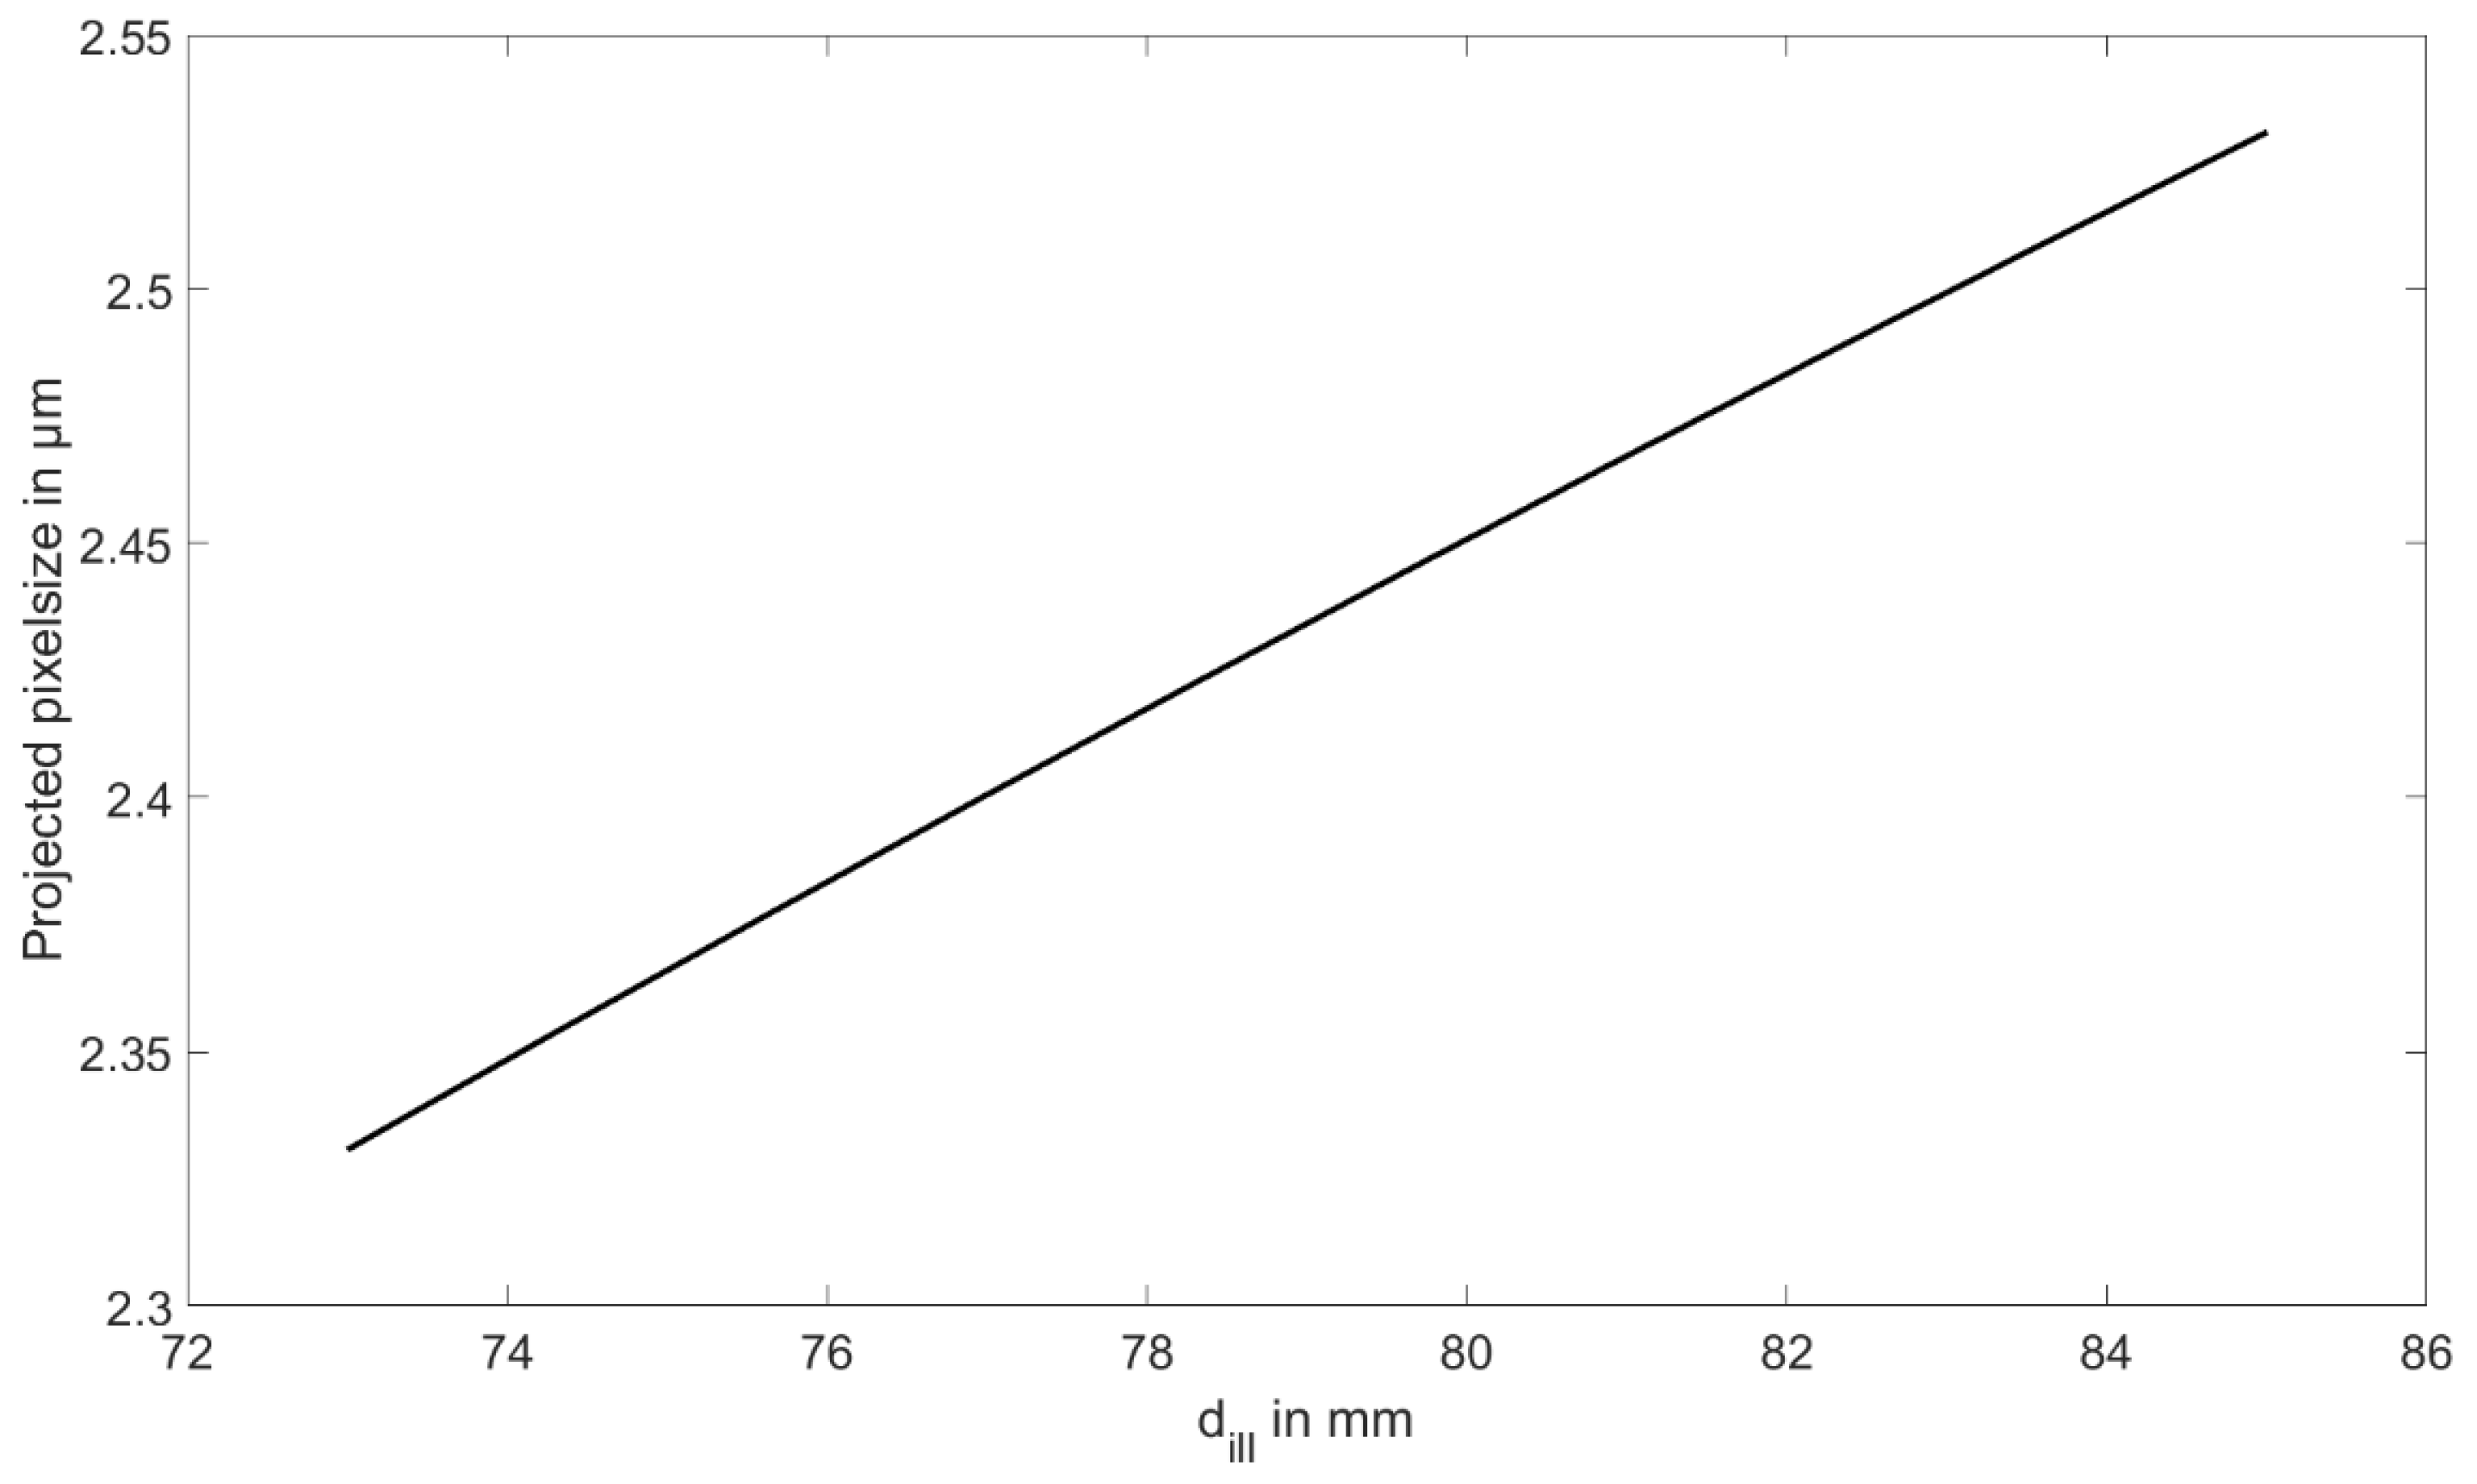
The application of illumination sources with different curvature acts like a magnification to the recorded diffraction pattern, and in that manner, resulting in a changed pixel size
’ that will have to be applied in the reconstruction instead of the sensor’s pixel size Δ
x’:
The relationship between the illumination distance and the resulting projected pixel size
has graphically been represented in
Figure 2. However, the pixel size in the reconstruction plane when employing the direct Fresnel method is the same for all illumination distances as pointed out in Reference [
9].
The iterative approach was implemented in the conventional manner, replacing the recovered amplitude with the square root of the recorded intensity pattern at each plane while preserving the phase. In addition, Parseval’s theorem was implemented to ensure the correct contribution of each diffraction pattern to the recovered complex wave.
The off-axis holograms were first Fourier filtered for the extraction of the image term only [
11]. Afterwards, the numerical reconstruction was performed using the direct Fresnel method [
11]. The reconstruction distance
drecon that had to be employed, represents a function of the combined distance
dcomb and the reference source point distance
dref (with the virtual path length
dref = 103 mm to the source of the reference wave):
Furthermore, the magnification adjusted pixel-size , see Equation (5), was used in the reconstruction process.
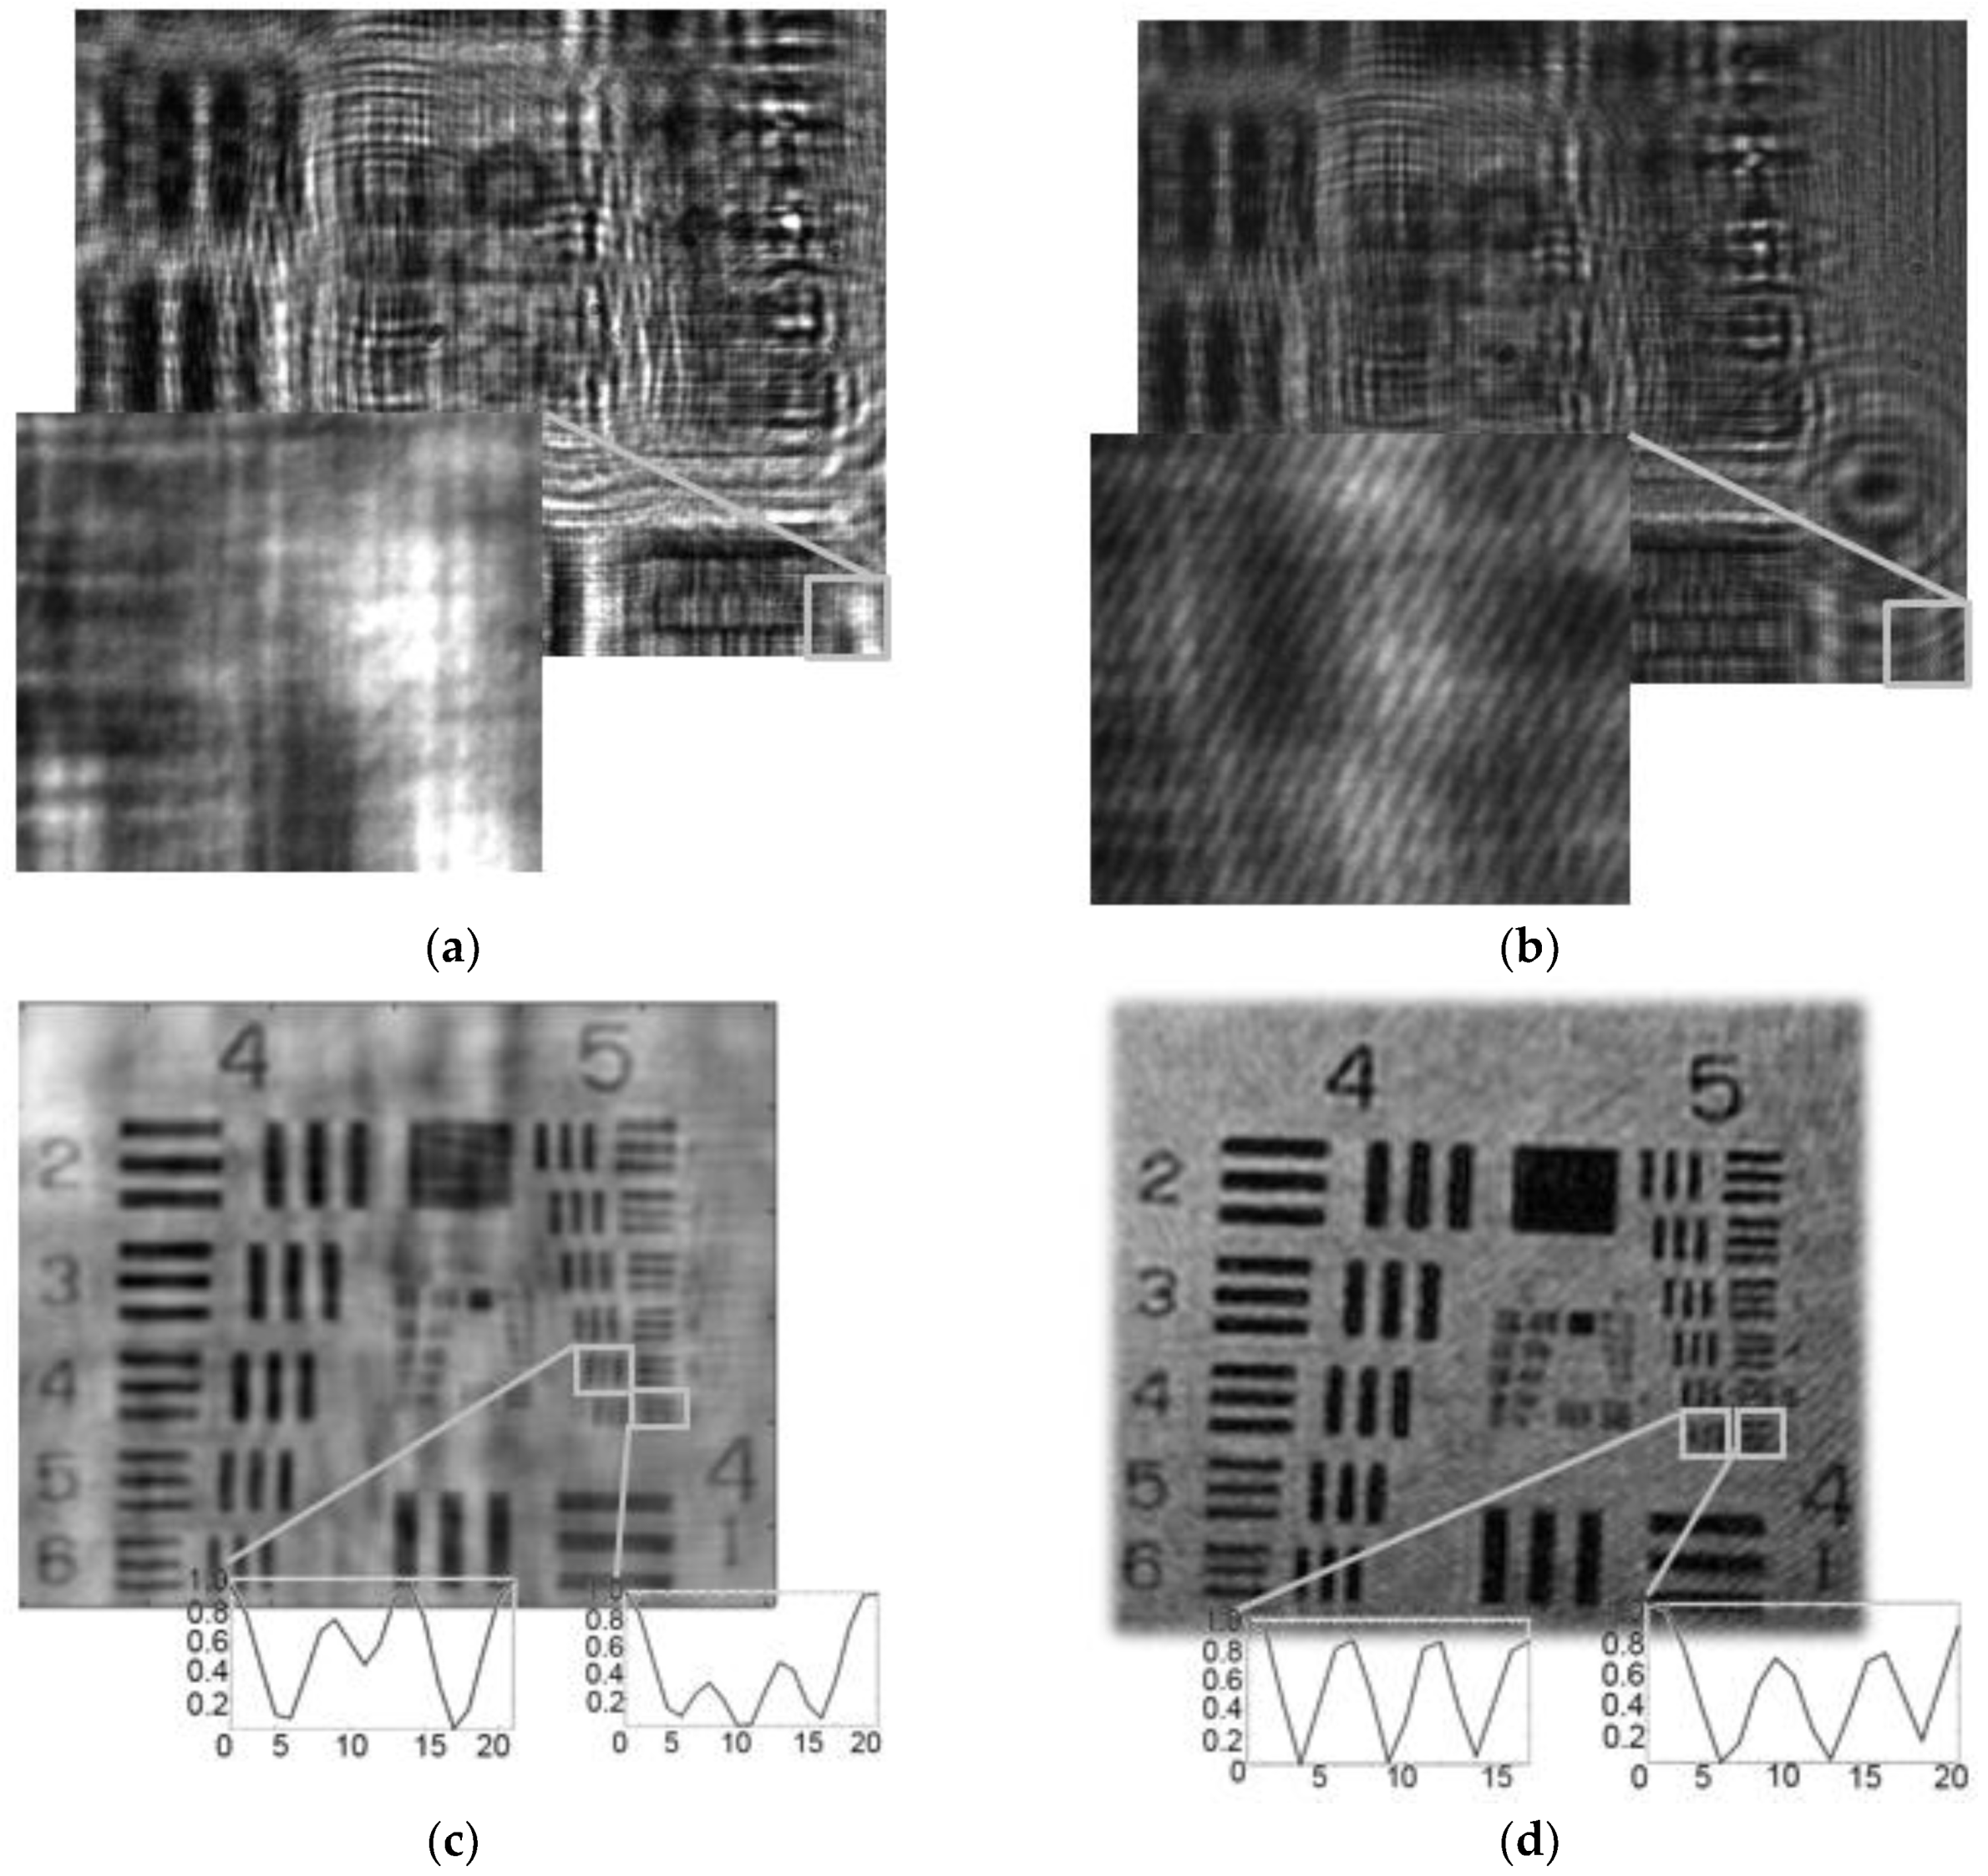
A recorded diffraction pattern and a recorded digital hologram are shown in
Figure 3a,b, including a zoomed-in region at the bottom-right corner. The zoomed-in region highlights the effect of self-interference as encountered in the diffraction pattern and the interference with a separate reference wave, which arise at the off-axis hologram leading to the characteristic carrier frequency. The corresponding amplitude reconstructions are shown in
Figure 3c,d. The averaged cross-section plots of the test target element that can still be resolved are shown at the bottom corner. The abscissa represents the pixel position and the ordinate represents the normalized averaged amplitude value. The resolution obtained has been evaluated with respect to Rayleigh’s resolution criterion. Care was taken to ensure that the ratio between the smallest maximum and largest minimum of the investigated averaged test target element was always smaller than 0.81. For the phase retrieval approach group 5’s 5th and 6th element could be resolved for vertical and horizontal orientation, respectively, which corresponded to the recovery of structural details of 9.84 µm and 8.77 µm in width. Test target element 6 in group 5 could be resolved for both horizontal and vertical orientation when employing digital holography, which corresponded to resolving structural details of 8.77 µm in width. In conclusion, the iterative approach and the phase retrieval method performed similarly well.
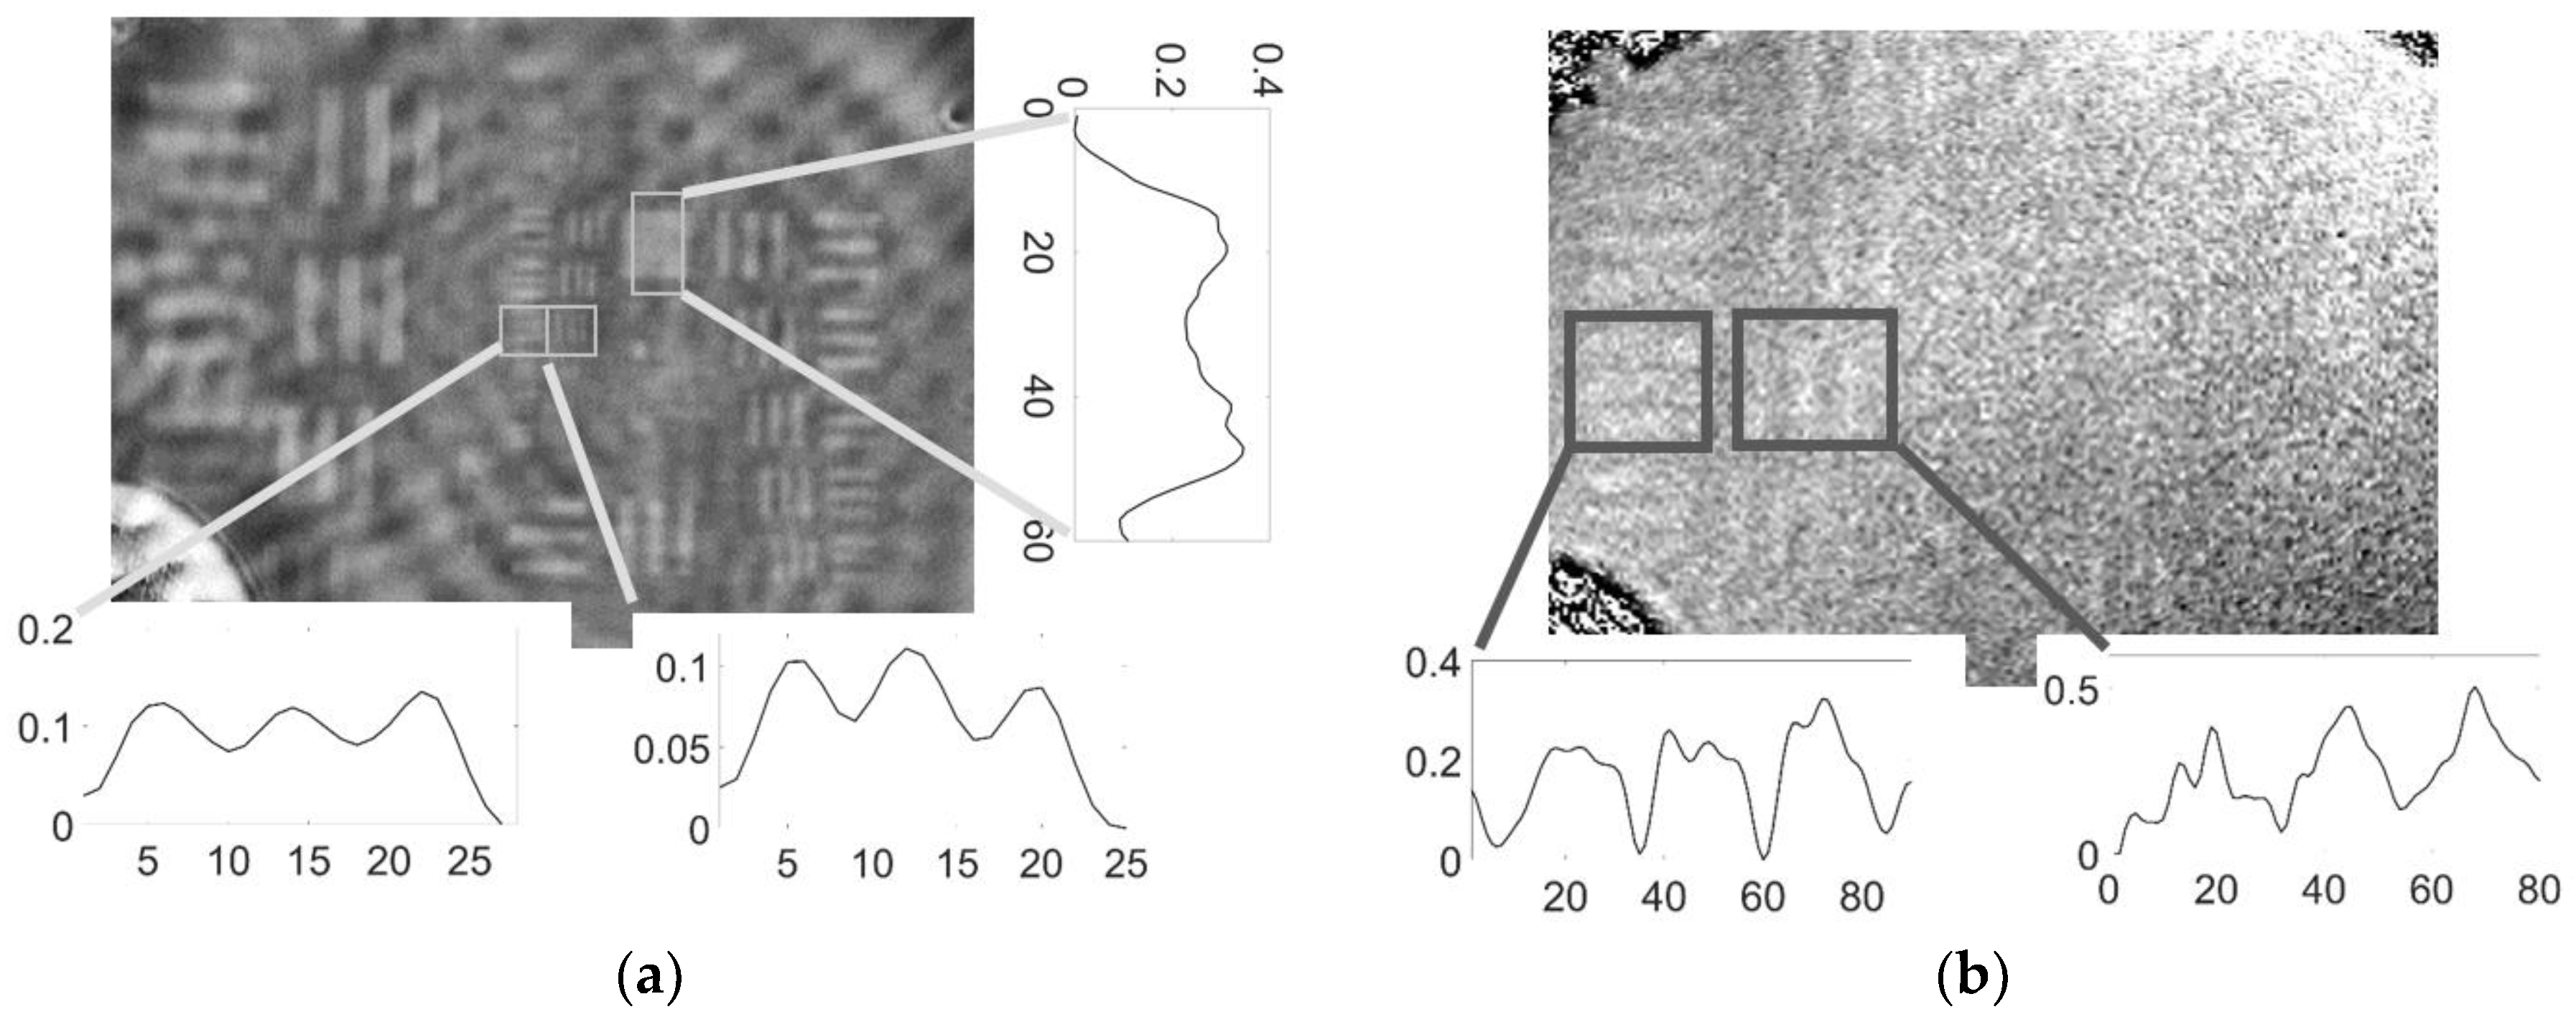
Besides the possibility to enable lensless imaging, the most prominent advantage of quantitative phase imaging is its high sensitivity to changes in the phase. At a next step, the phase sensitivity of the iterative phase retrieval method and off-axis digital holography have been compared (see
Figure 4). For this purpose, a particularly designed and in-house manufactured fully transparent test target, with the elements etched into to the glass to a depth of 79.1 nm (
L = λ/8 for 633 nm wavelength), was created. With an approximate refractive index n of the glass of 1.5, the resulting phase step Δ
ϕ was:
The resolution and the signal to noise ratio were used as objective quantitative measures in support of this comparison. It can be appreciated that the iterative phase retrieval approach performed significantly better in terms of resolution and signal to noise ratio. The abscissa in the graphs at the bottom of
Figure 4a,b correspond to the pixel position and the ordinate to phase in radians. Moreover, an averaged cross-section across the square can be seen at the left side of
Figure 4a, with the same parameter representation of the axis. The phase difference obtained for the square in comparison to its surrounding was 0.346 rad, which matched well with the expected phase step of 0.393 rad. For the iterative phase retrieval approach, the third element in group five could still be resolved (40.3 lp/mm, resulting in a smallest resolvable structure of 12.04 µm in width), whereas for the digital off-axis hologram group 3 element 4 could only be resolved (11.3 lp/mm, resulting in a smallest resolvable structure of 44.19 µm in width). The significantly improved resolution and signal to noise ratio for the phase retrieval approach in comparison to off-axis digital holography were due to the application of various speckle decorrelated diffraction patterns resulting in reducing speckle noise and different incident angles on the specimen, as in incoherent imaging [
12]. According to Reference [
13], the signal to noise ratio was calculated as the ratio between:
with µ representing the mean value and σ the standard deviation. The SNR obtained for the digital holographic phase reconstruction was 6.08 and 22.78 for the quantitative phase image obtained via the iterative approach. Moreover, any environmental changes in the two interfering arms, caused for instance by heat, were likewise recorded and may hence negatively affect the result.
3. Application to Medical Imaging
After demonstrating the functionality of the iterative phase retrieval technique on a USAF test target, it was then applied for biomedical applications with the motivation to assist the discrimination between cancerous and normal tissue for histopathology, which currently necessitates the time-consuming staining process (roughly 15 min) in order to visualize cell structures, by which the discrimination is made possible.
An intraoperative measurement technique based on quantitative phase imaging, which is sensitive to the slightest change in the propagation of the light due to refractive index changes, will reduce the time to a few seconds, which consequently results in decreasing costs and less stress/harm on the patient and the surgeon.
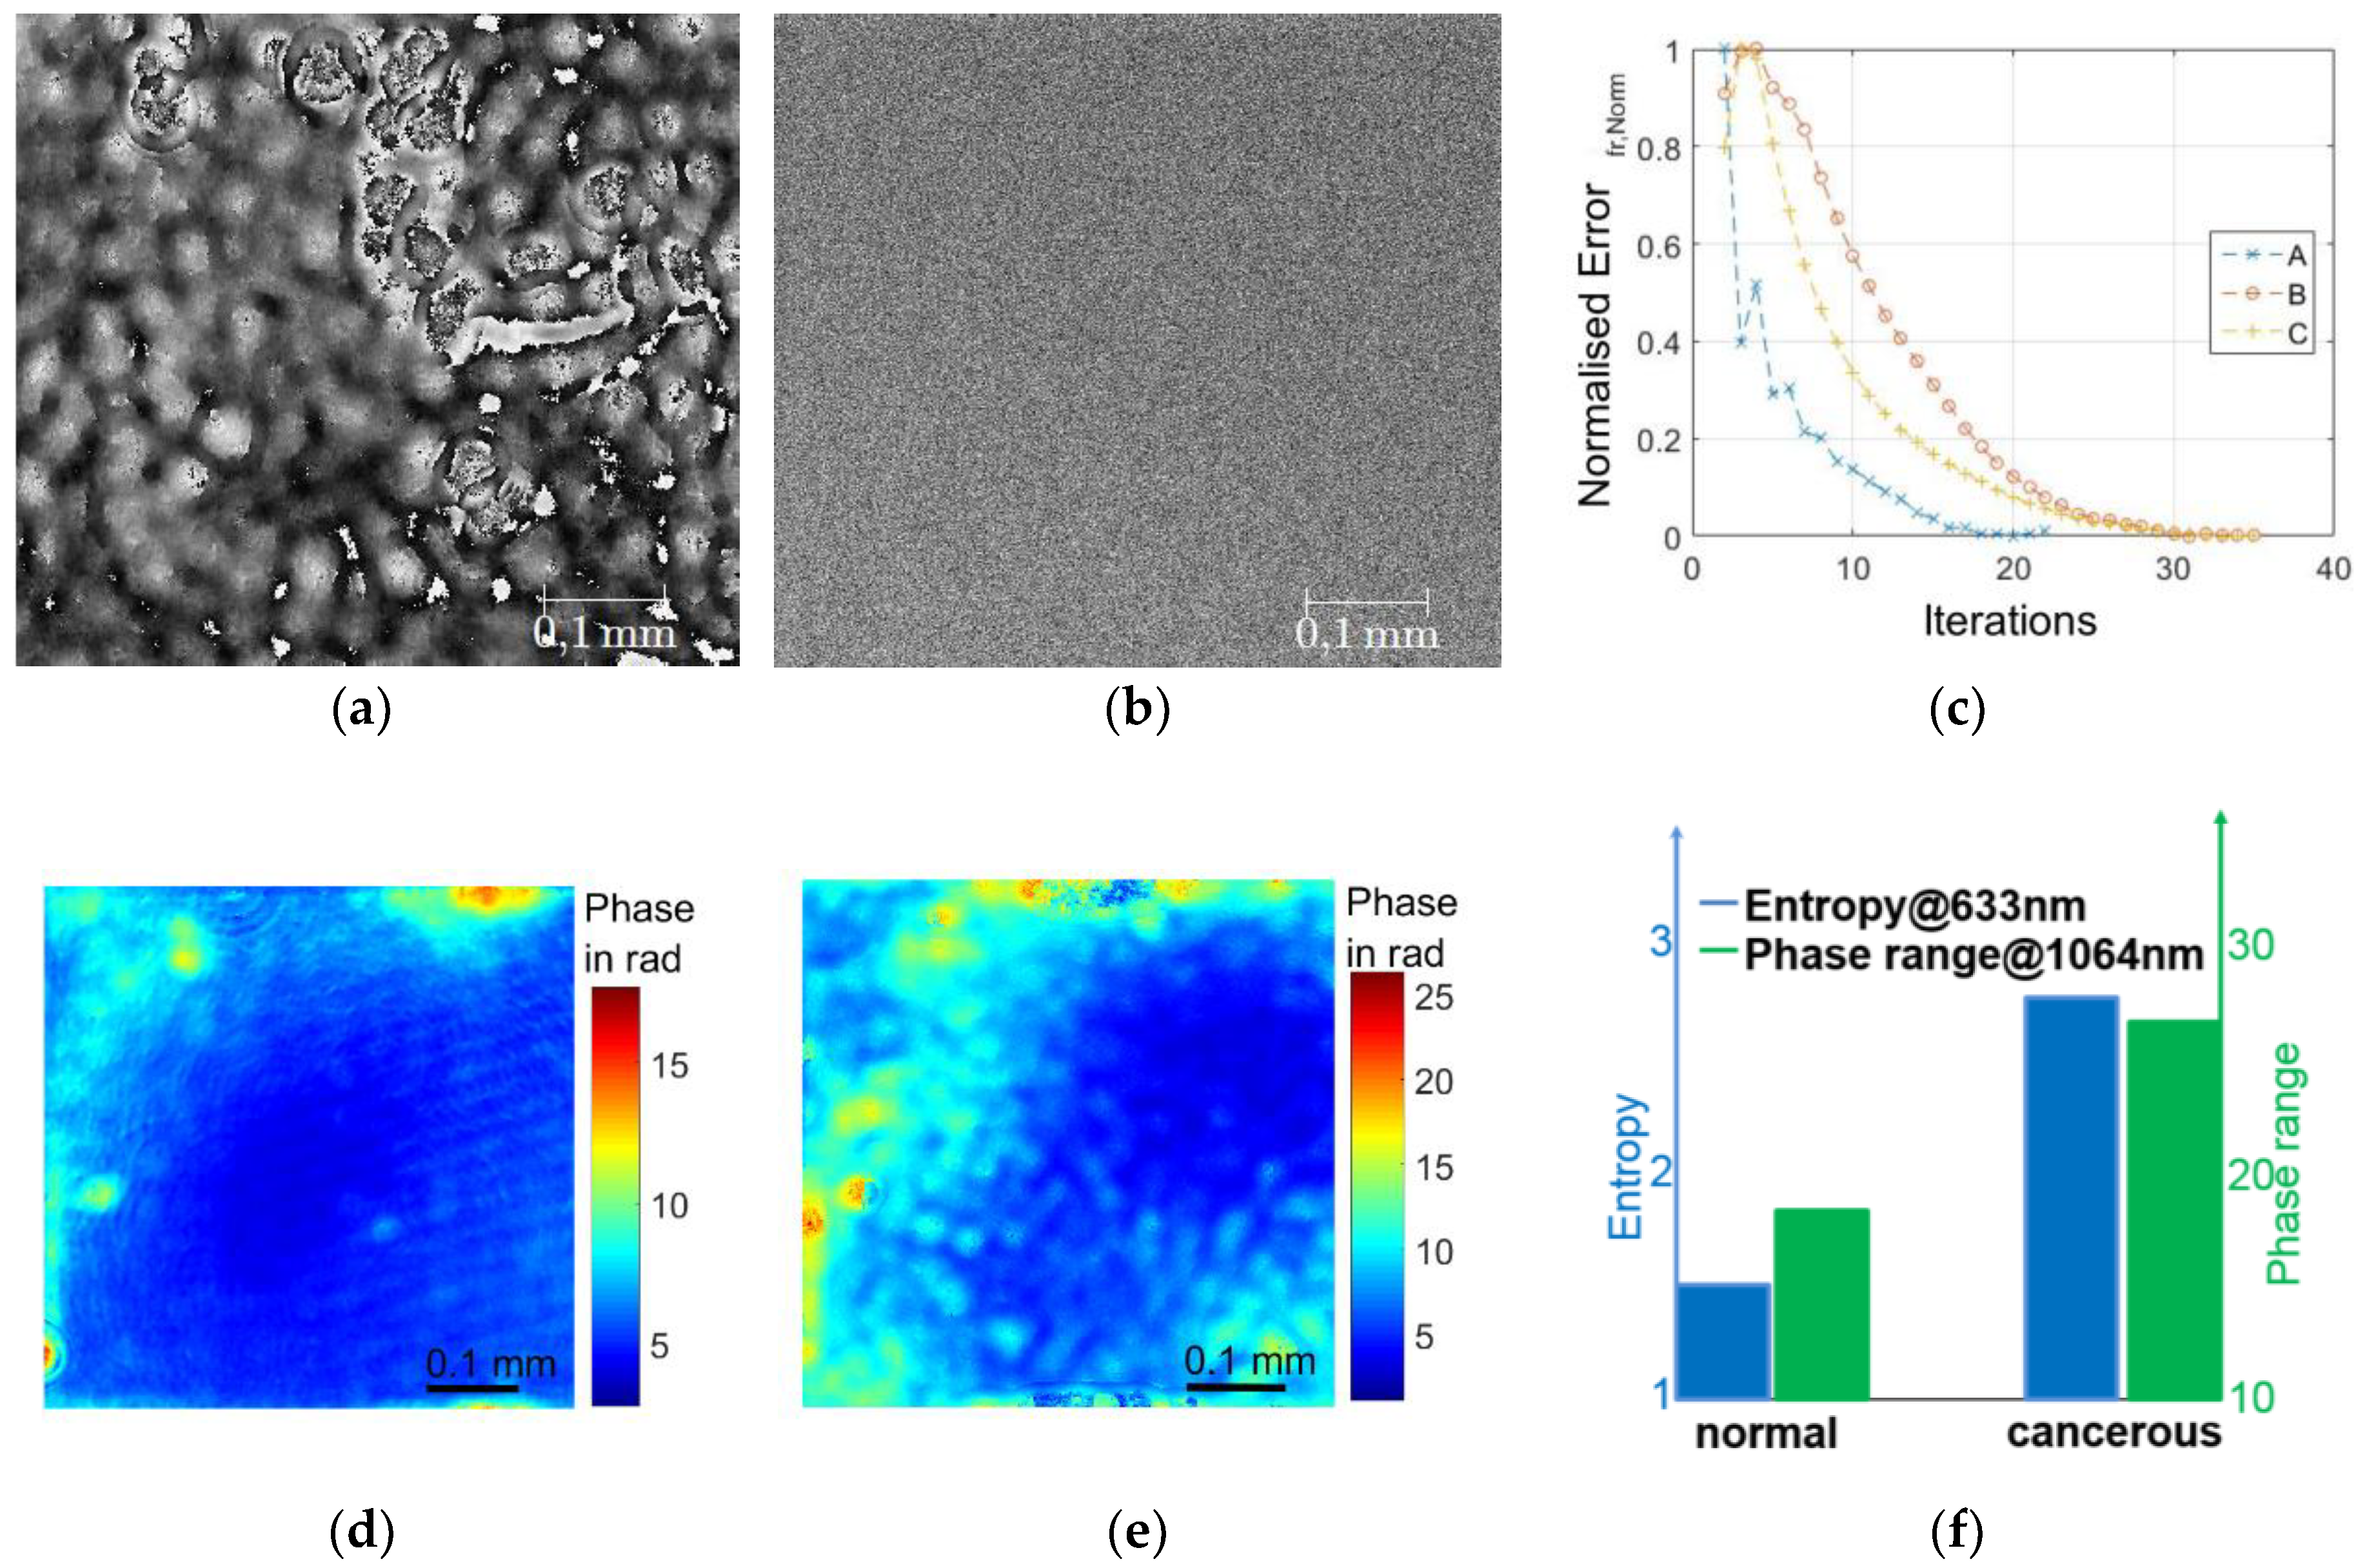
Three thin paraffine tissue sections of 5–7 µm thickness from cancerous and healthy renal tissue of oncologic surgeries have been investigated. Two different wavelengths have been employed to investigate those samples: 633 nm and 1064 nm (Nd:YAG) (see
Figure 5). To track the convergence of the iterative algorithm, an error measure, represented by the root mean square difference between the measured diffraction pattern intensity and the iteratively retrieved intensity, was introduced. A quickly declining error measure over the number of iterations is shown in
Figure 5c, which indicates a good convergence of the algorithms. The capital letters A, B, and C represent different diffraction planes.
In
Figure 5a,b, the quantitative phase reconstructions for normal and tumorous tissue are shown. For the healthy tissue, a smooth and almost regular phase could be reconstructed, which confirmed the findings in Reference [
14], where a more regular structure was likewise reported for normal tissue. For the cancerous tissue, a noisy phase reconstruction was obtained for 633 nm, which indicated either that cancerous tissue at such thickness consisted of more scattering layers and/or that cancerous tissue consisted of finer scattering features resulting in large scattering angles, which therefore cannot be recorded by the optical arrangement. The latter has been confirmed by various publications, where a more finely meshed extra cellular matrix has been reported for cancerous tissue in comparison to normal tissue [
15,
16]. For comparison, in the case of tumorous tissue, scans resulted in a noisy phase image due to multiple scattering events within the tissue (see
Figure 5 b). A possible reason for the increased scattering is the more densely structured extracellular matrix and the hyper-vascularization in tumorous tissue. The changes in scattering behavior on a cellular level have already been reported in Reference [
17]. Therefore, it is not too surprising that the changed scattering behavior can likewise be observed on tissue level. In this case, due to multiple scattering events on the cancerous tissue, a very strong difference can be appreciated between the two phase reconstructions.
In order to enable visualization of a smooth phase distribution for all samples, a Nd:YAG with 1064 nm was employed, by which the scattering coefficient according to Mie scattering could be reduced by a factor of 8. This was clearly visible in the phase reconstructions. After unwrapping the obtained phase maps, an increase in phase delay was recognized, which indicated that the refractive index of the cancerous sample was increased in comparison to the healthy sample (all sections of the same thickness), see
Figure 5d,e, which corresponds to the findings in Reference [
14]. The entropy was used to evaluate the scattering at 633 nm and the phase range (difference between maximum and minimum phase value) at 1064 nm. The corresponding values for both parameters have been plotted and are displayed in
Figure 5f.

 ,
, 


