Abstract
The effects of nano-TiO2 mediated photocatalysis on Microcystis aeruginosa, a common species that causes algal bloom, were studied. The metabolic activity of the M. aeruginosa cells was inhibited by nano-TiO2 mediated photocatalysis, as demonstrated by the significant decrease in metabolic heat with the increase in the time of photocatalysis. SEM images also showed that photocatalysis significantly altered the surface morphology of the cells, and the cell disruption was observed by treatment for 6 h. The nano-TiO2 mediated photocatalysis decreased the negative charge on the cell surface because the hydrophilic carboxylic acid groups and ammonium groups in the proteins were modified by free radicals. Metal cations of different valence and charge density could neutralize the negative charges on the cell surface to varying degrees. The adsorption heat of metal cations on the cell surface was higher for the control cells than the cells by photocatalysis, because the surface of the latter was modified and had lower charge density.
1. Introduction
In recent decades, algal blooms have occurred increasingly frequently in lakes and reservoirs around the world, and seriously threaten the supply of clean drinking water [1,2]. Microcystis aeruginosa is a common species that causes algal blooms and affects water quality [3,4]. It can also release microcystins, which are a class of toxins that endanger the health of animals and humans [5,6].
Advanced oxidation processes (AOPs) can efficiently degrade various pollutants. The AOPs produce highly reactive free radicals, mainly the hydroxyl radical (HO∙), which can break down organic molecules. The hydroxyl radical can convert organic molecules into CO2 and H2O [7,8]. Free radicals can also damage algae cells, inhibit the growth of algae, and thus can be used to treat algal bloom. Among the AOPs, photocatalysis by nano-TiO2 has attracted much attention, because the catalyst is inexpensive and highly stable. In photocatalytic oxidation, photons with greater energy than the band-gap energy excite the valence band electrons and expedite the breakdown of organic pollutants [9]. In addition, illuminating the catalyst active surface with sufficient energy can help create a positive hole (h+) in the valence band and produce an electron (e−) into the conduction band. The positive hole can then oxidize either the organic pollutant or H2O and generate the hydroxyl radicals [10].
Coagulation is one of the most common methods to treat algal bloom. The coagulants can turn the algal bloom suspended in water into a gel and then form a clot. M. aeruginosa is known for its negatively charged surface, and can thus be aggregated through charge neutralization with cationic metallic coagulants (e.g., inorganic metallic substances such as aluminum and iron salts) [11]. The mechanism of coagulation involves activation, adhesion, and aggregation of the algal bloom [12]. It must be noted that the cell surface plays an important role in the protecting cell. In this work, to demonstrate the biological effect of photocatalysis on M. aeruginosa with regard to metabolism, morphological change, and surface zeta potential, M. aeruginosa was treated with nano-TiO2 upon UV irradiation. Specifically, metabolic heat was measured to evaluate the effect of AOPs on M. aeruginosa. The morphology of M. aeruginosa cells was observed to analyze the surface feature. Zeta potential and metallic adsorption were determined after nano-TiO2 treatment to evaluate the role of metallic coagulant in damaging M. aeruginosa.
2. Materials and Methods
2.1. Cells and Reagents
M. aeruginosa (FACHB-905) was received from the Freshwater Algae Culture Collection in the Institute of Hydrobiology, Chinese Academy of Science. M. aeruginosa was grown in BG-11 nutrient solution (pH = 7.5). The algae culture was cultivated in an incubator at a constant temperature of 25 °C under 2000 lx with a light-dark cycle of 12 h/12 h. The cultures were harvested at 2 × 10⁶ cells/mL in the exponential growth phase.
Nano-TiO2 (P25) was purchased from Degussa AG (Essen, Germany). Other reagents were purchased from Shenshi Chem. Deionized water was used in all experiments.
2.2. Photocatalysis
M. aeruginosa cells were washed with PBS buffer before exposure to nano-TiO2 and UV irradiation. In a typical procedure, a suspension of M. aeruginosa was centrifuged at 4000× rpm for 5 min, and the pellets were then resuspended in 0.05 mol/L PBS buffer. This operation was repeated three times to thoroughly remove the culture. Afterwards, M. aeruginosa was suspended in PBS buffer at 2 × 10⁶ cells/mL.
The concentration of nano-TiO2 was 100 mg/L, which was the optimum value tested. Beyond this value, nano-TiO2 would coagulate and adversely affect the light transmission. After ultrasonic dispersion in PBS buffer for 15 min, the nano-TiO2 was mixed with M. aeruginosa and stirred at 1000 r/min for 30 min avoiding light. The photocatalysis was carried out by irradiating the mixture with monochromatic light (wavelength 340–380 nm) under a 150 W mercury lamp for 0, 1, 2, 4, and 6 h, respectively (Figure 1). The distance between the lamp and the M. aeruginosa suspension was about 20 cm. Agitation speed can influence the degradation rate. When the agitation speed is too slow, the uniform distribution of nano-TiO2 cannot be maintained. When the agitation speed is too high, the active site of TiO2 would have too short of a contact time with M. aeruginosa cells, which will reduce the reaction rate. Therefore, the mixture was stirred at 1000 r/min in our study.
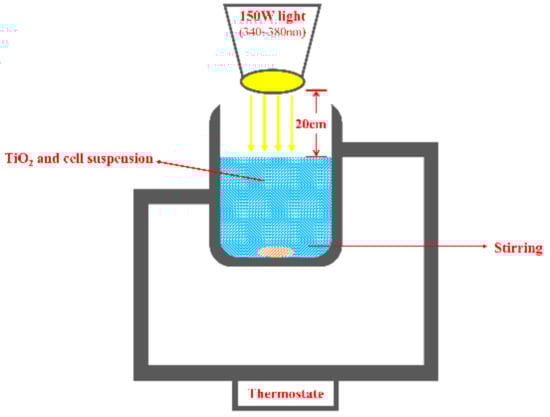
Figure 1.
Schematic diagram of the photocatalytic reactor.
2.3. Measurement of Metabolic Heat
After photocatalysis, the metabolic thermogenic curve of M. aeruginosa was recorded at 26 °C in real time on a TAM Air system (Thermometric AB, Sweden) as follows. The suspension of M. aeruginosa (5 mL) was put into the sample cell, and distilledwater (5 mL) was put into the reference cell. The TAM Air system recorded the metabolic process of M. aeruginosa. When calculating the metabolic paratmeter values, the interference signal data were deleted in the initial phase of the measurement.
2.4. Morphology
The morphology of M. aeruginosa was observed after nano-TiO2 mediated photocatalysis for different times. Glutaraldehyde and osmium tetraoxide (OsO4) were used to fix the cells and dehydrate the protein (or lipid). The cells were then dehydrated with ethanol of gradually increasing concentration (50%, 60%, 70%, 80%, 90%, 95%, and 100%), and finally examined under a Hitachi S-4800 scanning electron microscope (SEM).
2.5. Charge Density on the M. aeruginosa Surface
The M. aeruginosa cells were subject to microelectrophoresis on a JS94G+ zeta potential analyzer (Shanghai Powereach Digital Technology Equipment Co., Ltd., Shanghai, China). The zeta potential was calculated by measuring the migration distance of colloid under an electric field. M. aeruginosa cells were considered as colloids because their particle size and charge density resembled those of colloids [13,14].
One sample group was quantified to assess the influence of nano-TiO2 mediated photocatalysis on the surface charges of M. aeruginosa cells. Other sample groups were quantified to assess the variation of charge density with the addition of metal ions (LiCl, NaCl, KCl, MgCl2, CaCl2, SrCl2, BaCl2, AlCl3, and FeCl3) at pH = 7.55.
2.6. Adsorption Heat
The adsorption heat of cations on the surface of M. aeruginosa was measured on an isoperibol calorimeter (Figure 2). The calorimeter was completely surrounded by a jacket of constant and uniform temperature. In the isothermally jacketed calorimeter, some but not all of the heat of reaction is transferred to an outer isothermal heat jacket. The leakage modulus should be constant, and heat transfer due to convection should be kept as small as possible. The heat was calculated from the temperature-time measurements.
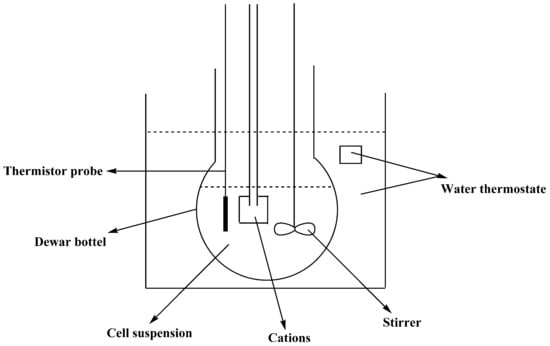
Figure 2.
Schematic diagram of the isoperibol calorimeter used for adsorption heat measurement.
Before the test, the instrument was first calibrated by measuring the dissolution of KCl in water at 298.15 K. A suspension of M. aeruginosa (100 mL, 2 × 10⁶ cells/mL) was put into a Dewar bottle and allowed to arrive at the equilibrium temperature. The sample box was then opened to release the solution of the cations (2 mL, 1 mol/L) into the cell suspension (see Ref. [15] for more procedural details), and the generated heat was recorded. Since the cations were in excess, the heat of dilution of the cations in 100 mL of water was calculated. The adsorption heat of the cations on the cell surface was finally obtained by subtracting the heat of dilution from the generated heat.
3. Results and Discussion
3.1. Metabolic Heat of M. aeruginosa Cells
The growth of microorganisms includes the lag stage, the log stage, the stationary stage, and the decline stage [16,17]. Figure 3 shows the metabolic heat of M. aeruginosa cells after treatment with nano-TiO2 mediated photocatalysis and without nutrients from the culture. On the whole, the metabolic heat declined gradually and ceased finally.
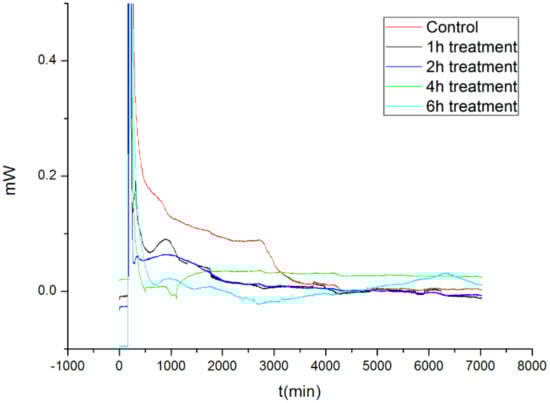
Figure 3.
The metabolic heat of M. aeruginosa after nano-TiO2 mediated photocatalysis.
M. aeruginosa makes use of nitrogen, phosphorus, and other nutrients to maintain its metabolism. Without nutrition from external sources, the cells can still live on endogenous nutrients for some time. Glycogen is the energy and carbon source stored in the cells. During photosynthesis, a large amount of optical energy is converted into chemical energy and stored in glycogen.
Compared with the control M. aeruginosa cells, the nano-TiO2 photocatalyzed cells experienced inhibited metabolism. The inhibition was more severe when the nano-TiO2 mediated photocatalysis lasted longer.
Table 1 lists the metabolic parameters for the M. aeruginosa cells that were treated with nano-TiO2. In the table, Pmax is the measured maximum output power during metabolism, and QT is the total heat produced for the entire metabolic process. Clearly, both Pmax and QT decreased upon prolonged nano-TiO2 mediated photocatalysis. In particular, the cells that underwent nano-TiO2 mediated photocatalysis for 6 h generated negligible metabolic heat.

Table 1.
Metabolic parameters for the M. aeruginosa cells by nano-TiO2 mediated photocatalysis.
A simple photolysis test suggested that the illumination without nano-TiO2 showed little action on M. aeruginosa. Nano-TiO2, particularly in the anatase form, is a photocatalyst. Upon irradiation with UV light, TiO2 can produce electrons (e−) and holes (h+) on its surface. The holes are strongly oxidative and can oxidize water to create hydroxyl radicals, and can also oxidize organic molecules directly [18,19].
hν + TiO2 → hole+ + e−
H2O + e− → OH− + HO∙
H2O + h+ → H+ + HO2∙
O2 + e− → O2∙
The HO∙, O2∙, and HO2∙ radicals produced in the photocatalytic process are reactive enough to attack many organic bonds, such as C–C, C–H, C–N, C–O, and H–O [20,21]. Thus, the free radicals produced by nano-TiO2 can efficiently modify the molecules in microorganisms. As a result, nano-TiO2 mediated photocatalysis can inhibit the metabolic activity and even damage the cells. The band gap of nano-TiO2 is 3.2 eV, so the wavelength of light should be less than or equal to 387.5 nm. Therefore, in our study, a monochromatic lamp was used for the photocatalysis with high efficiency.
3.2. Morphology of the M. aeruginosa Cells
Since the cell wall and membrane were exposed to the free radicals in the medium, we also investigated the damage on the outermost layer of M. aeruginosa cells caused by nano-TiO2 mediated photocatalysis. Figure 4 shows the morphology of the M. aeruginosa cells after nano-TiO2 mediated photocatalysis. The control cells exhibited regular sphericity with a diameter of 2.5 µm, and regular wrinkles appeared on the cell surface at the nano-level (Figure 4A). After nano-TiO2 mediated photocatalysis for 1 h and 2 h, the surface became much rougher than that of the control cells (Figure 4B,C). Photocatalysis for 4 h deformed the surface morphology of the M. aeruginosa cells (Figure 4D). After photocatalysis for 6 h, the cells were disrupted (Figure 4E).
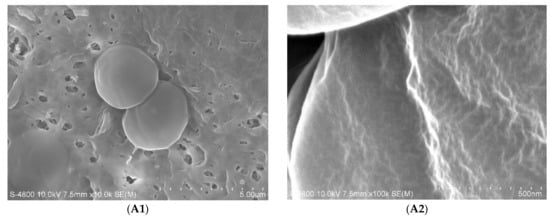
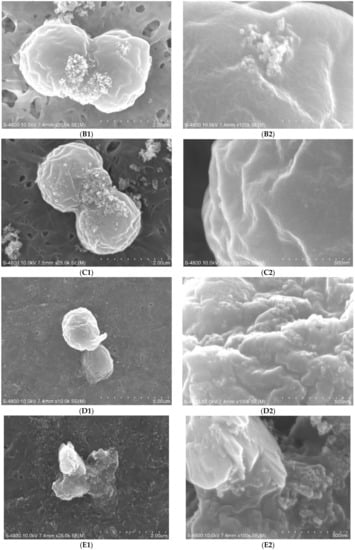
Figure 4.
SEM images of M. aeruginosa cells after nano-TiO2 mediated photocatalysis. (A1,A2): the control; (B1,B2): 1 h treatment; (C1,C2): 2 h treatment; (D1,D2): 4 h treatment; (E1,E2): 6 h treatment.
The cell wall and cell membrane is the outermost layer of the M. aeruginosa cells. They consist of extracellular polymeric substances, and they are responsible for the adsorption of nutrients and the defense against environmental toxins [22]. When the cells were exposed to UV irradiation in the presence of nano-TiO2 for 4 h, the cell wall and cell membrane were seriously damaged, but the cells still remained spherical and did not show major morphological changes. However, when the irradiation was extended to 6 h, the cells were erupted, most likely due to the failure of the cell wall. A previous report found that the main mechanism of degradation involves hydroxyl substitution, which could occur repeatedly [23]. When M. aeruginosa cells were exposed to free radicals generated by nano-TiO2, hydroxyl substitution of extracellular polymeric substances may also have occurred repeatedly, which ultimately led to the photolysis of organic molecules.
The nano-TiO2 also experienced changes during the photocatalytic process. At the beginning, nano-TiO2 particles were suspended well in cell solution. After some time, nano-TiO2 particles tended to coagulate, but there were no Ti4+ ions detected in solution. The nano-TiO2 particles showed a particle size of 25 nm and were easy to aggregate due to high surface energy. In the photocatalytic process, the particle size increased gradually. However, nano-TiO2 is chemically stable and Ti4+ ions would not be released from nano-TiO2 particles into solution.
3.3. Charge Density on the M. aeruginosa Cell Surface
Figure 5 shows how the charge density of the M. aeruginosa cells varies with the time of nano-TiO2 mediated photocatalysis. The zeta potential of the control M. aeruginosa cell surface was −30.20 ± 0.32 mV. M. aeruginosa was characterized with negative charges, which resulted from the molecular groups on the surface. Both the cell wall and the cell membrane contain plenty of proteins, which consist of amine (–NH2) and carboxylic acid (–COOH) functional groups that are joined orderly through peptide bonds. The carboxylic acid groups (−COOH) can be deprotonated to become the negatively charged carboxylates (−COO−), and the amino groups (−NH2) can be protonated to become the positively charge ammonium groups (−NH3+). When the pH of the cell suspension exceeded the isoelectric point, the cells would carry negative charge. Generally, the pH of the cell suspension is higher than the isoelectric point of bacteria. As a result, the M. aeruginosa cells were characterized with negative charges [23,24].
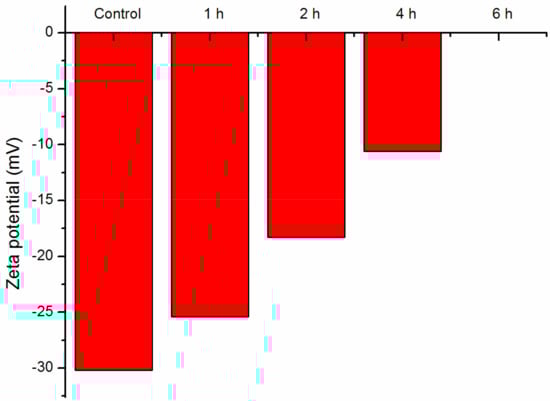
Figure 5.
Zeta potential of M. aeruginosa cells after nano-TiO2 mediated photocatalysis.
After the M. aeruginosa cells were subject to nano-TiO2 mediated photocatalysis, their zeta potential decreased; that is, the negative charges on the cell surface decreased. When the time of nano-TiO2 mediated photocatalysis was increased to 6 h, the zeta potential could no longer be measured. Both the carboxylic acid groups and the ammonium groups in the proteins are hydrophilic. The proteins are inserted into the phospholipids bilayer and extracellular polymeric substances in the cell wall and cell membrane, and the hydrophilic groups (−COOH and –NH3+) are exposed to the external environment and easily damaged by free radicals during nano-TiO2 mediated photocatalysis [24]. Therefore, the charge density decreased significantly due to the damages of the hydrophilic groups.
3.4. Adsorption Heat of Cations on the M. aeruginosa Cells
Figure 6 shows the zeta potential as a function of the addition of cations (Li+, Na+, K+, Mg2+, Ca2+, Sr2+, Ba2+, Al3+, and Fe3+). Both the charge density and the zeta potential decreased significantly upon the addition of cations. The surface of M. aeruginosa cells carried negative charges and adsorbed cations as a result of electrostatic attraction. Among the cations of the first main group, the ability to neutralize negative charges ranked as K+ > Na+ > Li+. Similarly, the cations of the second main group ranked as Ba2+ > Sr2+ > Ca2+ > Mg2+. Within each group, the metal ion with higher charge density had stronger ability to neutralize negative charges. Cations of the second main group are divalent, and thus showed stronger ability to neutralize negative charges than those of the first main group. Furthermore, Al3+ and Fe3+ had the strongest ability to neutralize negative charges and changed the zeta potential the most dramatically. The results suggested that in neutralizing negative charges, the valence of the metal ion was the main driver, and the charge density of the metal ion also affected the strength of the impact. Among all tested metal ions, Al3+and Fe3+ showed the strongest ability in changing the surface charges of the M. aeruginosa cells.
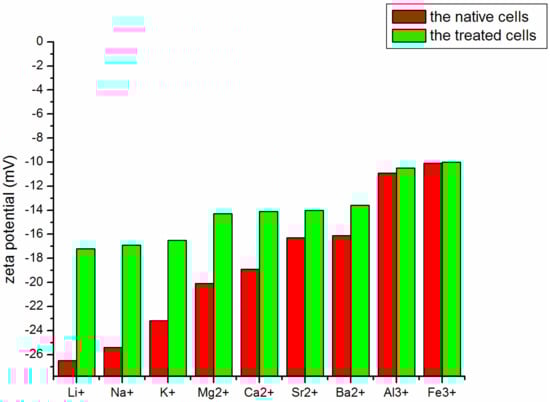
Figure 6.
Zeta potential of M. aeruginosa cells after addition of different cations.
Table 2 shows the heat released when the cations bound to the cell surface. An exothermal process was observed for all tested cations. Theoretically, the binding reaction is accompanied with the formation of a chemical bond that is weaker than the covalent bond and similar to the hydrogen bond. During binding, the energy of the cation–cell system was reduced and heat was released. This heat depended on the valence and the charge density of the added cations, and ranked as K+ > Na+ > Li+, Ba2+ > Sr2+ > Ca2+ > Mg2+, and Al3+ > Ba2+ > K+. This order is reasonable because the valence and the charge density of the cation affected the bond strength and bond energy [25], which in turn determined the amount of heat released. The exothermal process indicated a negative enthalpy change. Besides, during electrostatic interaction, the cations migrated from the solution and were bound to the cell surface. The degree of order increased and the entropy of the system decreased, which in fact impeded the adsorption process. Nevertheless, the negative enthalpy change was strong enough to overcome the entropy factor and realize the binding process. Therefore, the electrostatic adsorption on the cell surface was “enthalpy-driven”.
Table 2.
Adsorption heat of cations on M. aeruginosa cells after the addition of cations.
The adsorption heat of cations was lower for the treated cells than the native cells. As outlined before, the amine (–NH2) groups were modified by free radicals during photocatalysis. Consequently, the charge density on the cell surface decreased, which led to weaker binding between cations and the cells.
4. Conclusions
The stress of nano-TiO2 mediated photocatalysis on Microcystis aeruginosa, a common species that causes algal bloom, was studied by several methods. The metabolic activity of M. aeruginosa was damaged by free radicals that were produced by nano-TiO2 mediated photocatalysis, which reacted with the hydrophilic groups (−COOH and –NH3+) on the cell surface. The metabolic heat of M. aeruginosa decreased upon prolonged treatment of nano-TiO2 mediated photocatalysis, indicating the metabolic activity of the cells was inhibited. The SEM images showed how the surface morphology of the cells deteriorated along with nano-TiO2 mediated photocatalysis, and cell disruption was observed after the photocatalysis was carried out for 6 h. The surface of the M. aeruginosa cells were negatively charged due to the presence of proteins. Nano-TiO2 mediated photocatalysis decreased the negative charges on the cell surface by damaging the hydrophilic carboxylic acid groups and ammonium groups with free radicals. The density of negative charges on the cell surface decreased with the addition of cations. The valence of the cation was the primary factor that affected the neutralization of negative charges on the cell surface, and the charge density of the cation was the secondary factor in this process. The nano-TiO2 can damage Microcystis aeruginosa cells, which may be used in the algae bloom control, as a promising candidate for coagulant of water pollution treatment.
Author Contributions
X.C. conceived and designed the experiments; Y.G. performed the experiments; P.L. analyzed the data.
Funding
This study was supported by the Chinese National Natural Science Foundation (No. 51579159).
Conflicts of Interest
The authors declared no conflicts of interest.
References
- Lapointe, B.E.; Herren, L.W.; Debortoli, D.D.; Vogel, M.A. Evidence of sewage-driven eutrophication and harmful algal blooms in Florida’s Indian River Lagoon. Harmful Algae 2015, 43, 82–102. [Google Scholar] [CrossRef]
- Isaacs, J.D.; Strangman, W.K.; Barbera, A.E.; Mallin, M.A.; McIver, M.R.; Wright, J.L. Microcystins and two new micropeptin cyanopeptides produced by unprecedented Microcystis aeruginosa blooms in North Carolina’s Cape Fear River. Harmful Algae 2014, 31, 82–86. [Google Scholar] [CrossRef] [PubMed]
- Burford, M.A.; Johnson, S.A.; Cook, A.J.; Packer, T.V.; Taylor, B.M.; Townsley, E.R. Correlations between watershed and reservoir characteristics, and algal blooms in subtropical reservoirs. Water Res. 2007, 41, 4105–4114. [Google Scholar] [CrossRef] [PubMed]
- Smith, V.H. Eutrophication of freshwater and coastal marine ecosystems a global problem. Environ. Sci. Pollut. Res. 2003, 10, 126–139. [Google Scholar] [CrossRef]
- Bhattacharya, R.; Sugendran, K.; Dangi, R.; Rao, P. Toxicity evaluation of freshwater cyanobacterium Microcystis aeruginosa PCC 7806: II. Nephrotoxicity in rats. Biomed. Environ. Sci. BES 1997, 10, 93–101. [Google Scholar] [PubMed]
- Fang, J.; Ma, J.; Yang, X.; Shang, C. Formation of carbonaceous and nitrogenous disinfection by-products from the chlorination of Microcystis aeruginosa. Water Res. 2010, 44, 1934–1940. [Google Scholar] [CrossRef] [PubMed]
- Kurniawan, T.A.; Lo, W.-H.; Chan, G. Radicals-catalyzed oxidation reactions for degradation of recalcitrant compounds from landfill leachate. Chem. Eng. J. 2006, 125, 35–57. [Google Scholar] [CrossRef]
- Meeroff, D.E.; Bloetscher, F.; Reddy, D.; Gasnier, F.; Jain, S.; McBarnette, A.; Hamaguchi, H. Application of photochemical technologies for treatment of landfill leachate. J. Hazard. Mater. 2012, 209, 299–307. [Google Scholar] [CrossRef] [PubMed]
- Li, G.; Li, L.; Boerio-Goates, J.; Woodfield, B.F. High purity anatase TiO2 nanocrystals: Near room-temperature synthesis, grain growth kinetics, and surface hydration chemistry. J. Am. Chem. Soc. 2005, 127, 8659–8666. [Google Scholar] [CrossRef] [PubMed]
- Su, W.; Chen, J.; Wu, L.; Wang, X.; Wang, X.; Fu, X. Visible light photocatalysis on praseodymium (III)-nitrate-modified TiO2 prepared by an ultrasound method. Appl. Catal. B Environ. 2008, 77, 264–271. [Google Scholar] [CrossRef]
- Xu, H.; Pei, H.; Xiao, H.; Li, X.; Ma, C.; Hu, W. Inactivation of Microcystis aeruginosa by hydrogen-terminated porous Si wafer: Performance and mechanisms. J. Photochem. Photobiol. B Biol. 2016, 158, 23–29. [Google Scholar] [CrossRef] [PubMed]
- Qi, J.; Lan, H.; Miao, S.; Xu, Q.; Liu, R.; Liu, H.; Qu, J. KMnO4–Fe (II) pretreatment to enhance Microcystis aeruginosa removal by aluminum coagulation: Does it work after long distance transportation? Water Res. 2016, 88, 127–134. [Google Scholar] [CrossRef] [PubMed]
- Guillouxbenatier, M.; Guerreau, J.; Feuillat, M. Influence of initial colloid content on yeast macromolecule production and on the metabolism of wine microorganisms. Am. J. Enol. Vitic. 1995, 46, 486–492. [Google Scholar]
- Bradford, S.A.; Torkzaban, S.; Kim, H. Modeling colloid and microorganism transport and release with transients in solution ionic strength. Water Res. 2012, 48, 77–86. [Google Scholar] [CrossRef]
- Chen, X.; Feng, W.; Yu, Y. Studies on the nongrowth metabolism of the different strains of Tetrahymena cells by isothermal microcalorimetry. J. Therm. Anal. Calorim. 2014, 115, 2145–2149. [Google Scholar] [CrossRef]
- Chen, X.; Feng, W.; Yu, Y. Comparisons among six strains of Tetrahymena by microcalorimetry. J. Therm. Anal. Calorim. 2014, 115, 2151–2158. [Google Scholar] [CrossRef]
- Chen, X.-J.; Miao, W.; Liu, Y.; Shen, Y.-F.; Feng, W.-S.; Yu, T.; Yu, Y.H. Microcalorimetry as a possible tool for phylogenetic studies of Tetrahymena. J. Therm. Anal. Calorim. 2005, 84, 429–433. [Google Scholar] [CrossRef]
- West, R.H.; Celnik, M.S.; Inderwildi, O.R.; Kraft, M.; Beran, G.J.; Green, W.H. Toward a comprehensive model of the synthesis of TiO2 particles from TiCl4. Ind. Eng. Chem. Res. 2007, 46, 6147–6156. [Google Scholar] [CrossRef]
- Casarin, M.; Maccato, C.; Vittadini, A. Molecular chemisorption on TiO2 (110): A local point of view. J. Phys. Chem. B 1998, 102, 10745–10752. [Google Scholar] [CrossRef]
- Wang, C.; Wang, X.; Wang, P.; Chen, B.; Hou, J.; Qian, J.; Yang, Y. Effects of iron on growth, antioxidant enzyme activity, bound extracellular polymeric substances and microcystin production of Microcystis aeruginosa FACHB-905. Ecotoxicol. Environ. Saf. 2016, 132, 231–239. [Google Scholar] [CrossRef] [PubMed]
- Pei, H.; Xu, H.; Xiao, H.; Sun, J.; Hu, W.; Li, X.; Ma, C.; Jin, Y. Using a novel hydrogen-terminated porous Si wafer to enhance Microcystis aeruginosa effective removal by chitosan at a low dosage. Colloids Surf. A Physicochem. Eng. Asp. 2016, 499, 88–96. [Google Scholar] [CrossRef]
- Sand, S.L.; Nissen-Meyer, J.; Sand, O.; Haug, T.M. Plantaricin A, a cationic peptide produced by Lactobacillus plantarum, permeabilizes eukaryotic cell membranes by a mechanism dependent on negative surface charge linked to glycosylated membrane proteins. Biochim. Biophys. Acta 2013, 1828, 249–259. [Google Scholar] [CrossRef] [PubMed]
- Petrella, A.; Mascolo, G.; Murgolo, S.; Petruzzelli, V.; Ranieri, E.; Spasiano, D.; Petruzzelli, D. Photocatalytic oxidation of organic micro-pollutants: Pilot plant investigation and mechanistic aspects of the degradation reaction. Chem. Eng. Commun. 2016, 203, 1298–1307. [Google Scholar] [CrossRef]
- Peng, L.; Wenli, D.; Qisui, W.; Xi, L. The envelope damage of Tetrahymena in the presence of TiO2 combined with UV light. Photochem. Photobiol. 2010, 86, 633–638. [Google Scholar] [CrossRef] [PubMed]
- Liu, P.; Wang, Q.; Li, X.; Zhang, Z. Zeta-potentials and enthalpy changes in the process of electrostatic self-assembly of cations on silica surface. Powder Technol. 2009, 193, 46–49. [Google Scholar]
© 2018 by the authors. Licensee MDPI, Basel, Switzerland. This article is an open access article distributed under the terms and conditions of the Creative Commons Attribution (CC BY) license (http://creativecommons.org/licenses/by/4.0/).