Evaluation of a Smart System for the Optimization of Logistics Performance of a Pruning Biomass Value Chain


Abstract
Featured Application
Abstract
1. Introduction
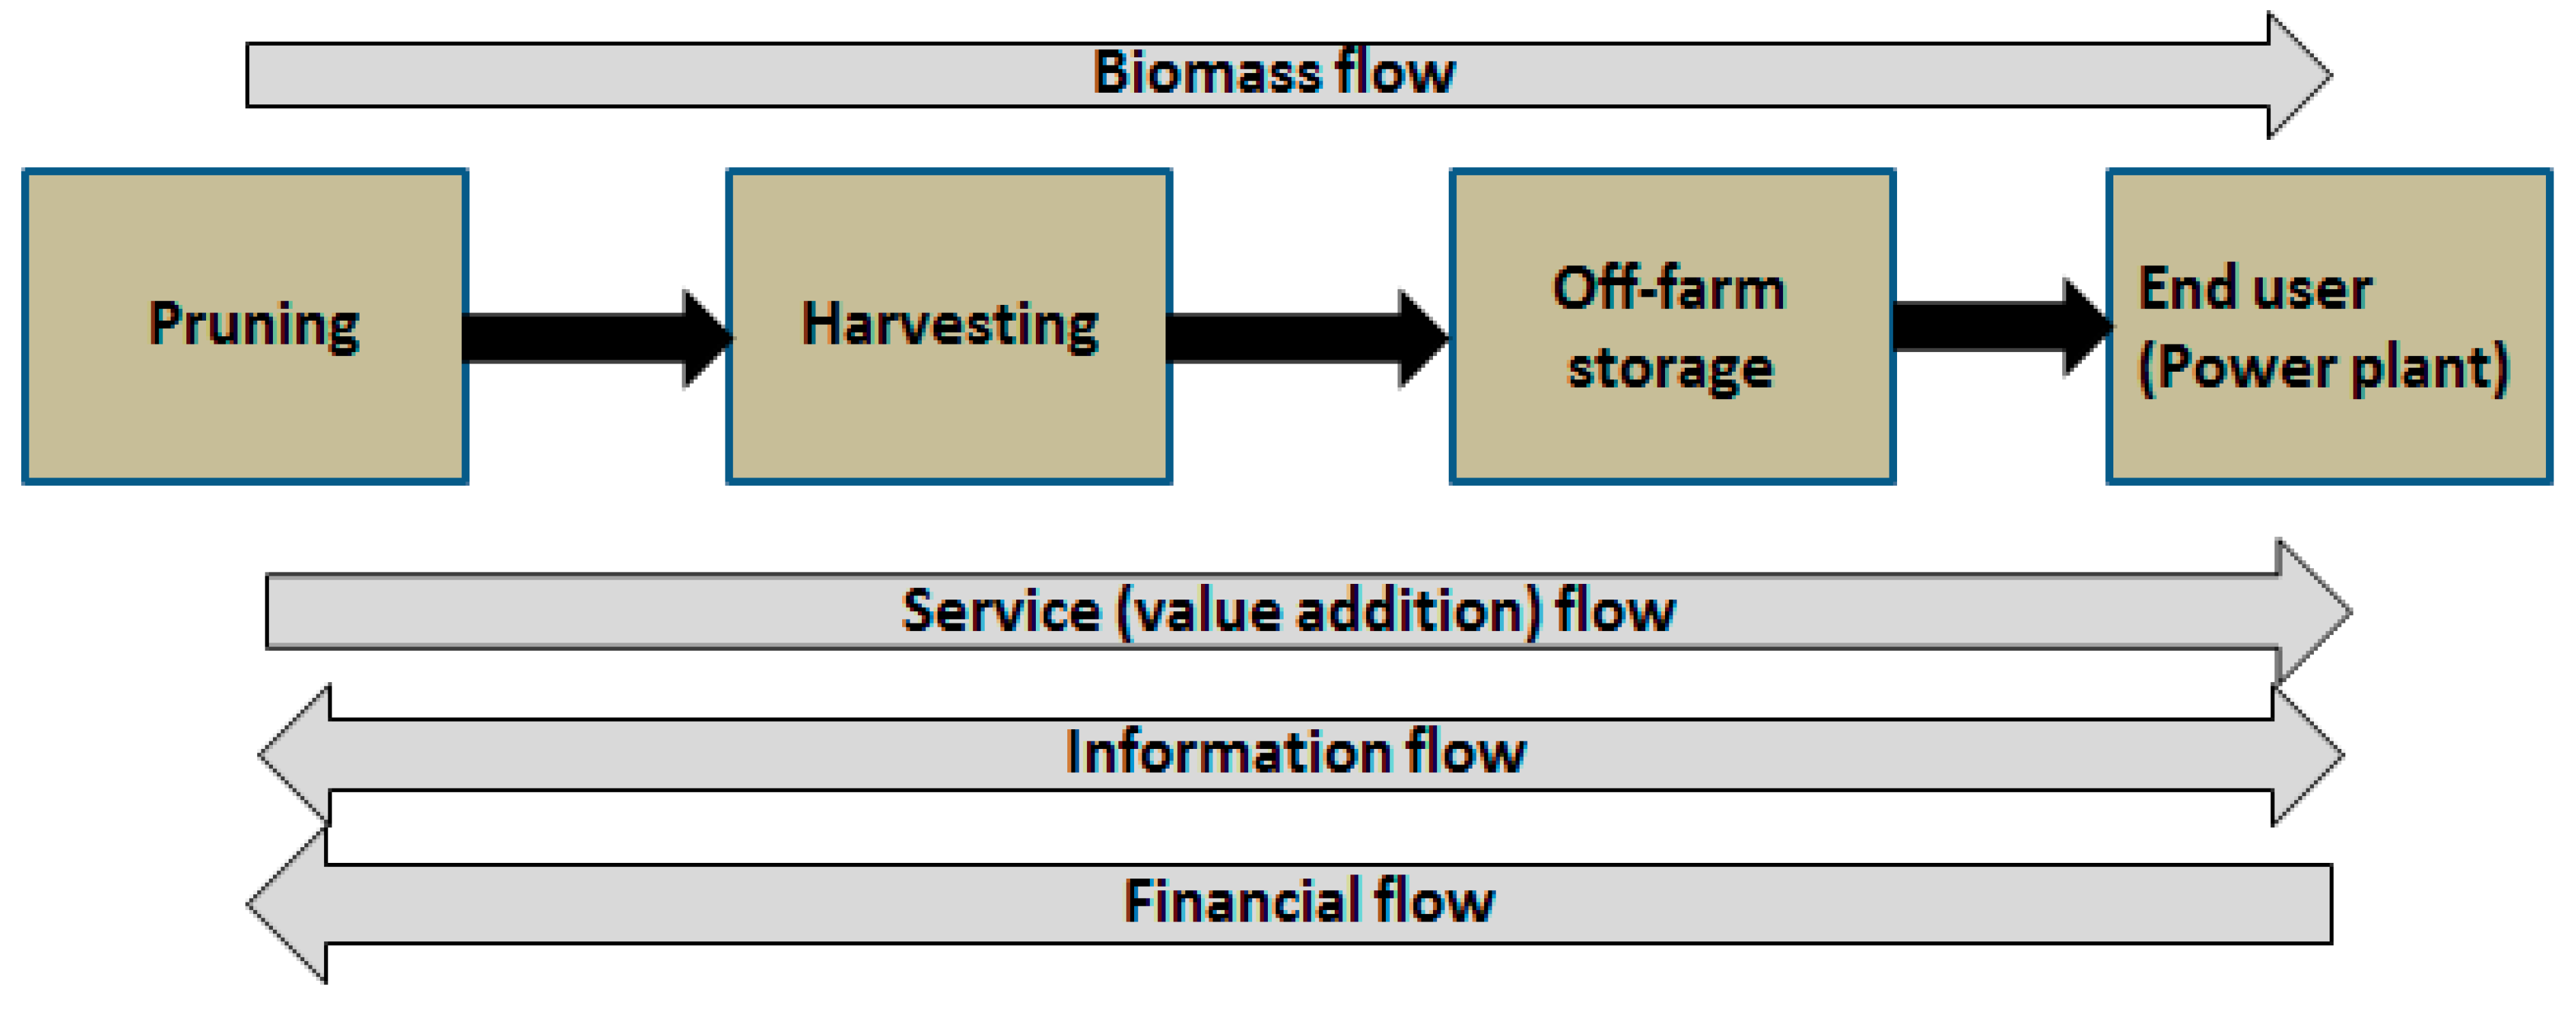
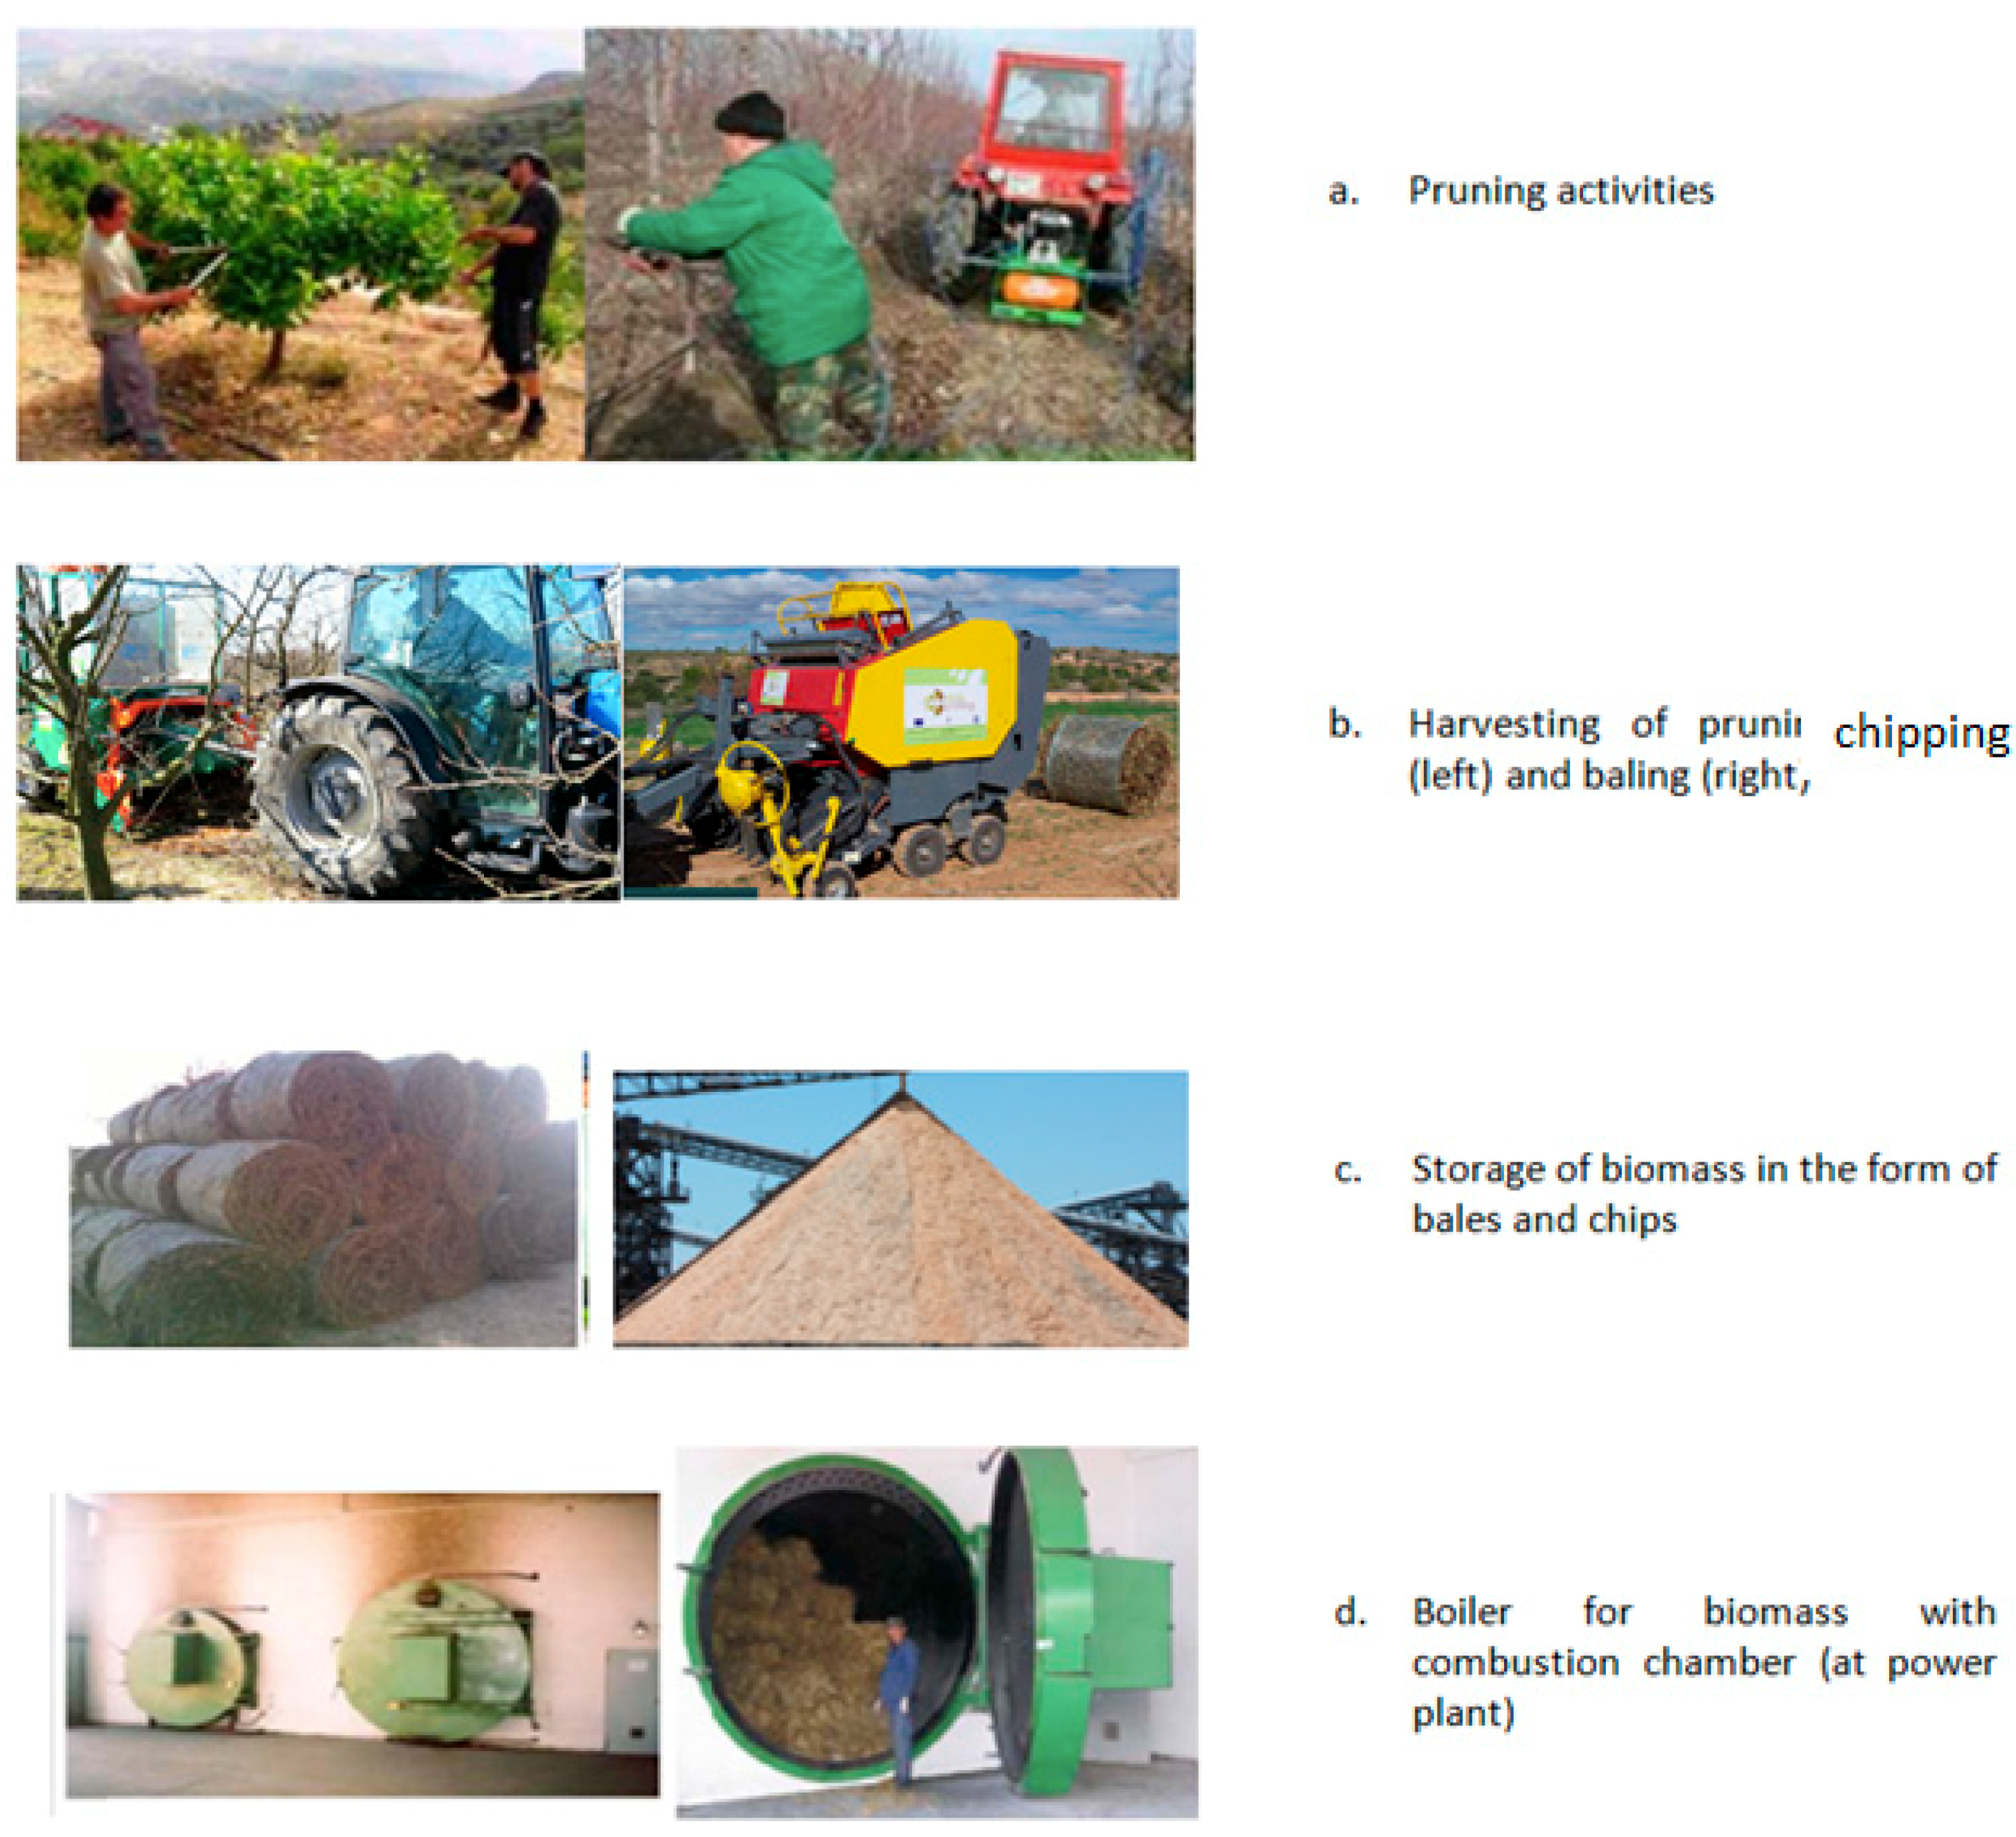
1.1. Pruning Biomass Logistics Chain
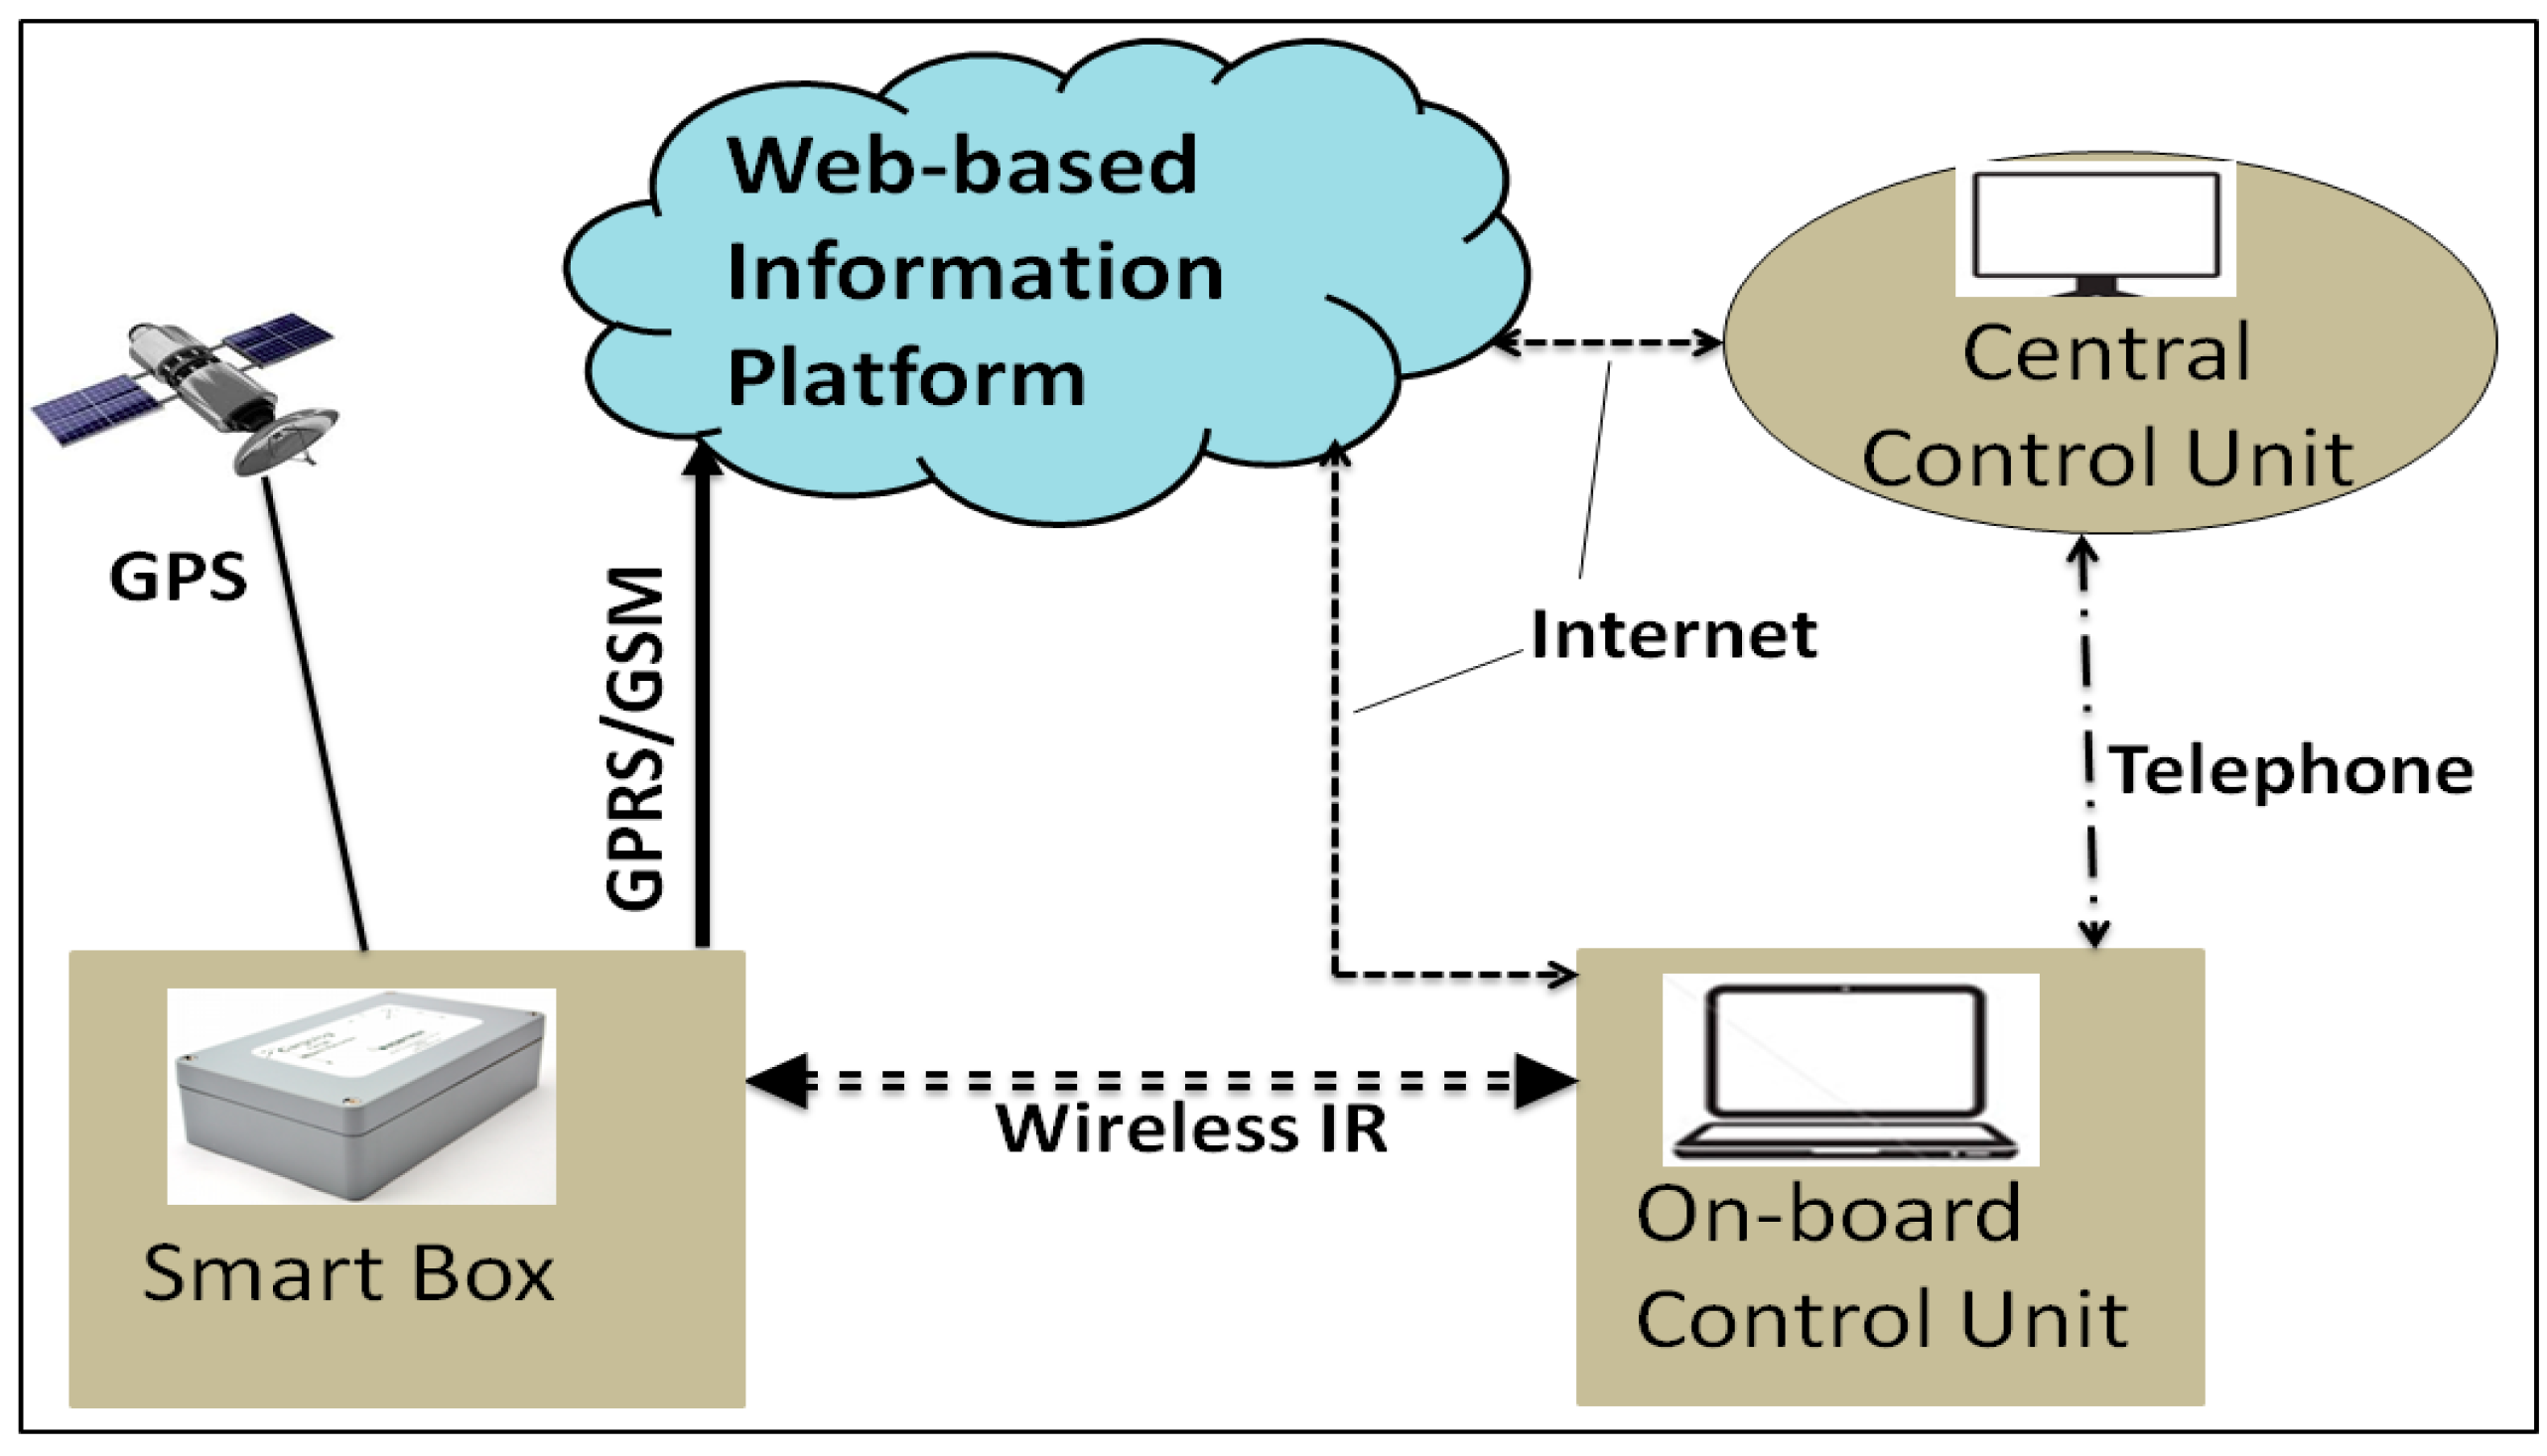
1.2. Smart Logistics System and Its Utilization by Different Actors
2. Testing and Evaluation Methodology
2.1. Usability Testing
2.2. Metrics and Product Quality Model for Evaluation of SLS
2.2.1. Metrics for Performance Evaluation
2.2.2. Product Quality Model
2.3. Smart System Testing
2.3.1. Smart Box Installation and Training
2.3.2. Smart System Field Testing
3. Evaluation Results and Discussion
3.1. Data Retrieved from Central Database of the Smart System
3.2. Data on Product Delivery Information
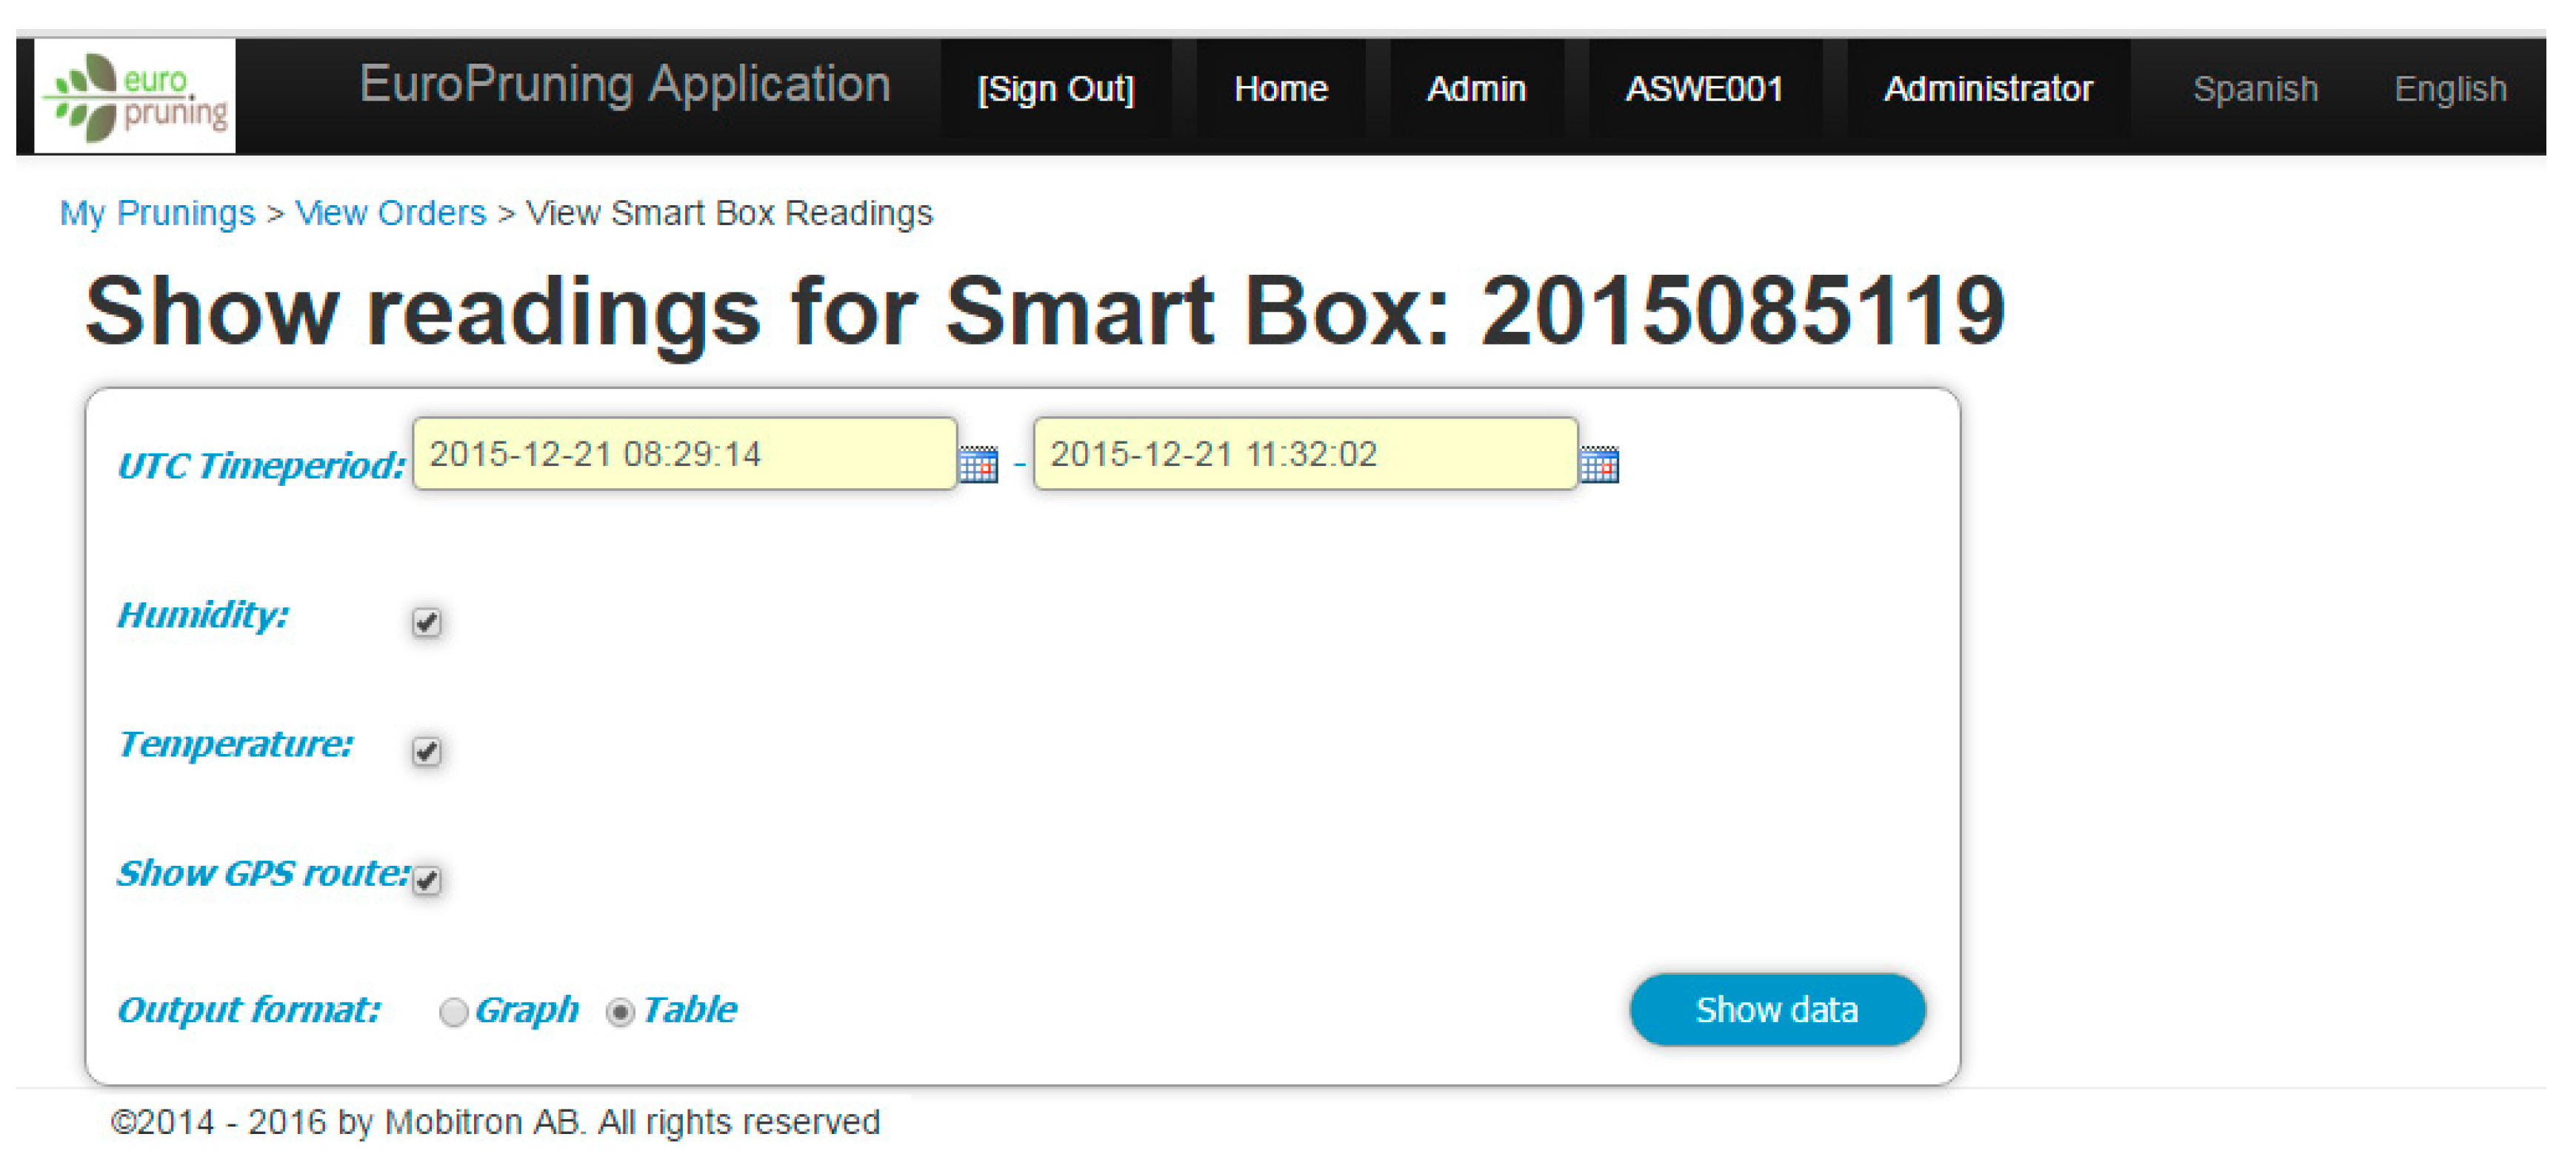
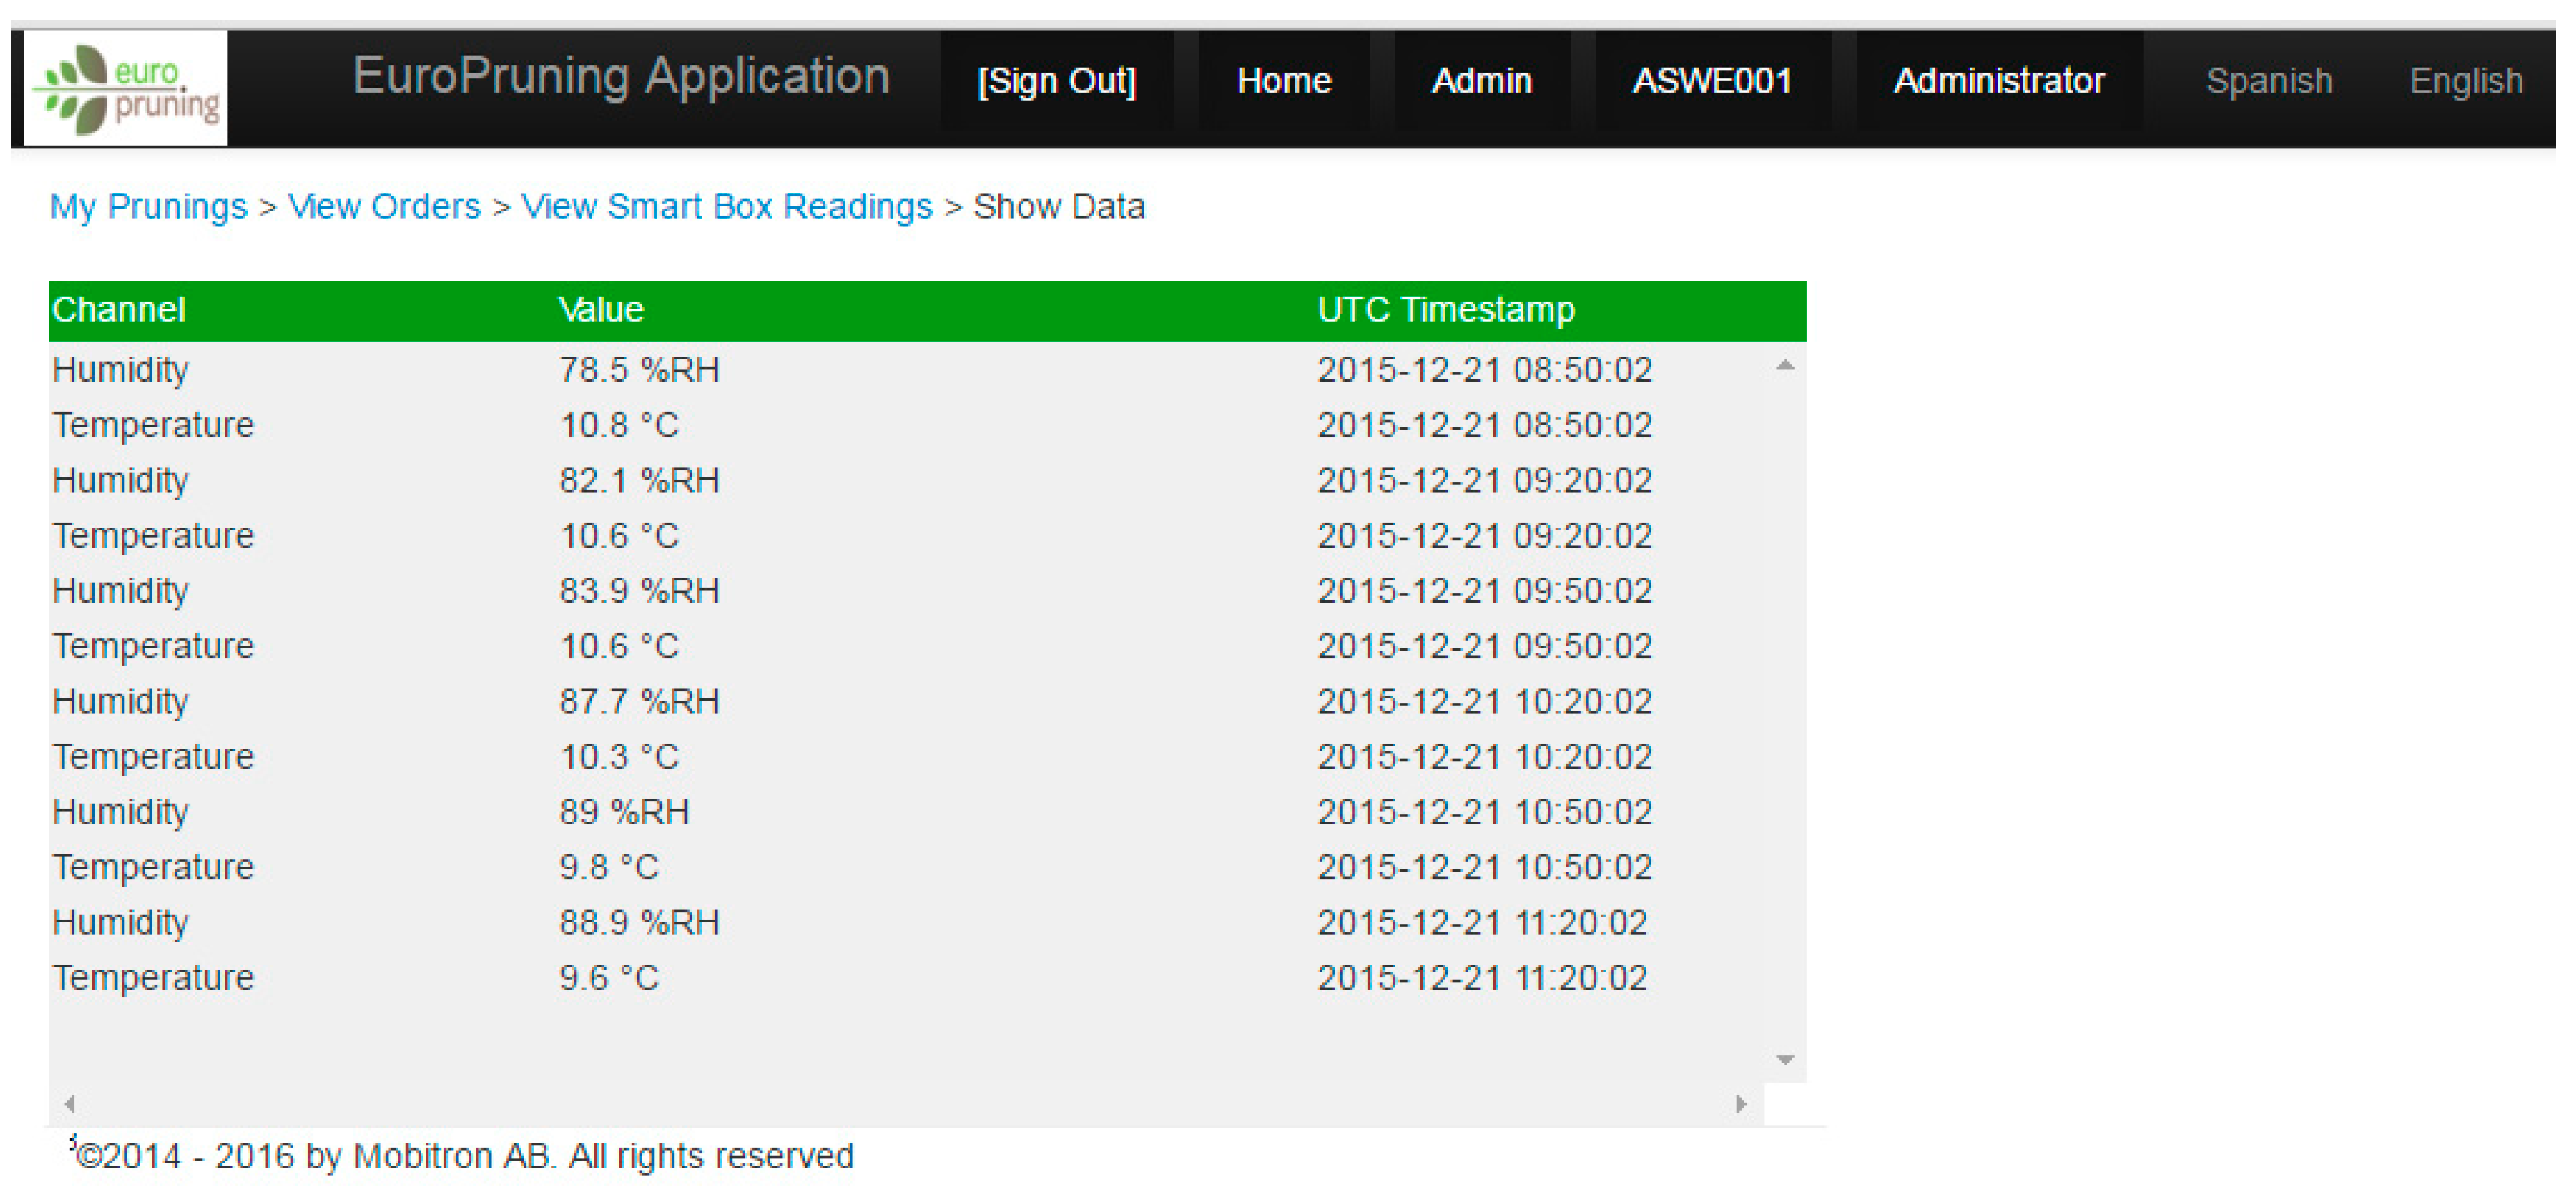
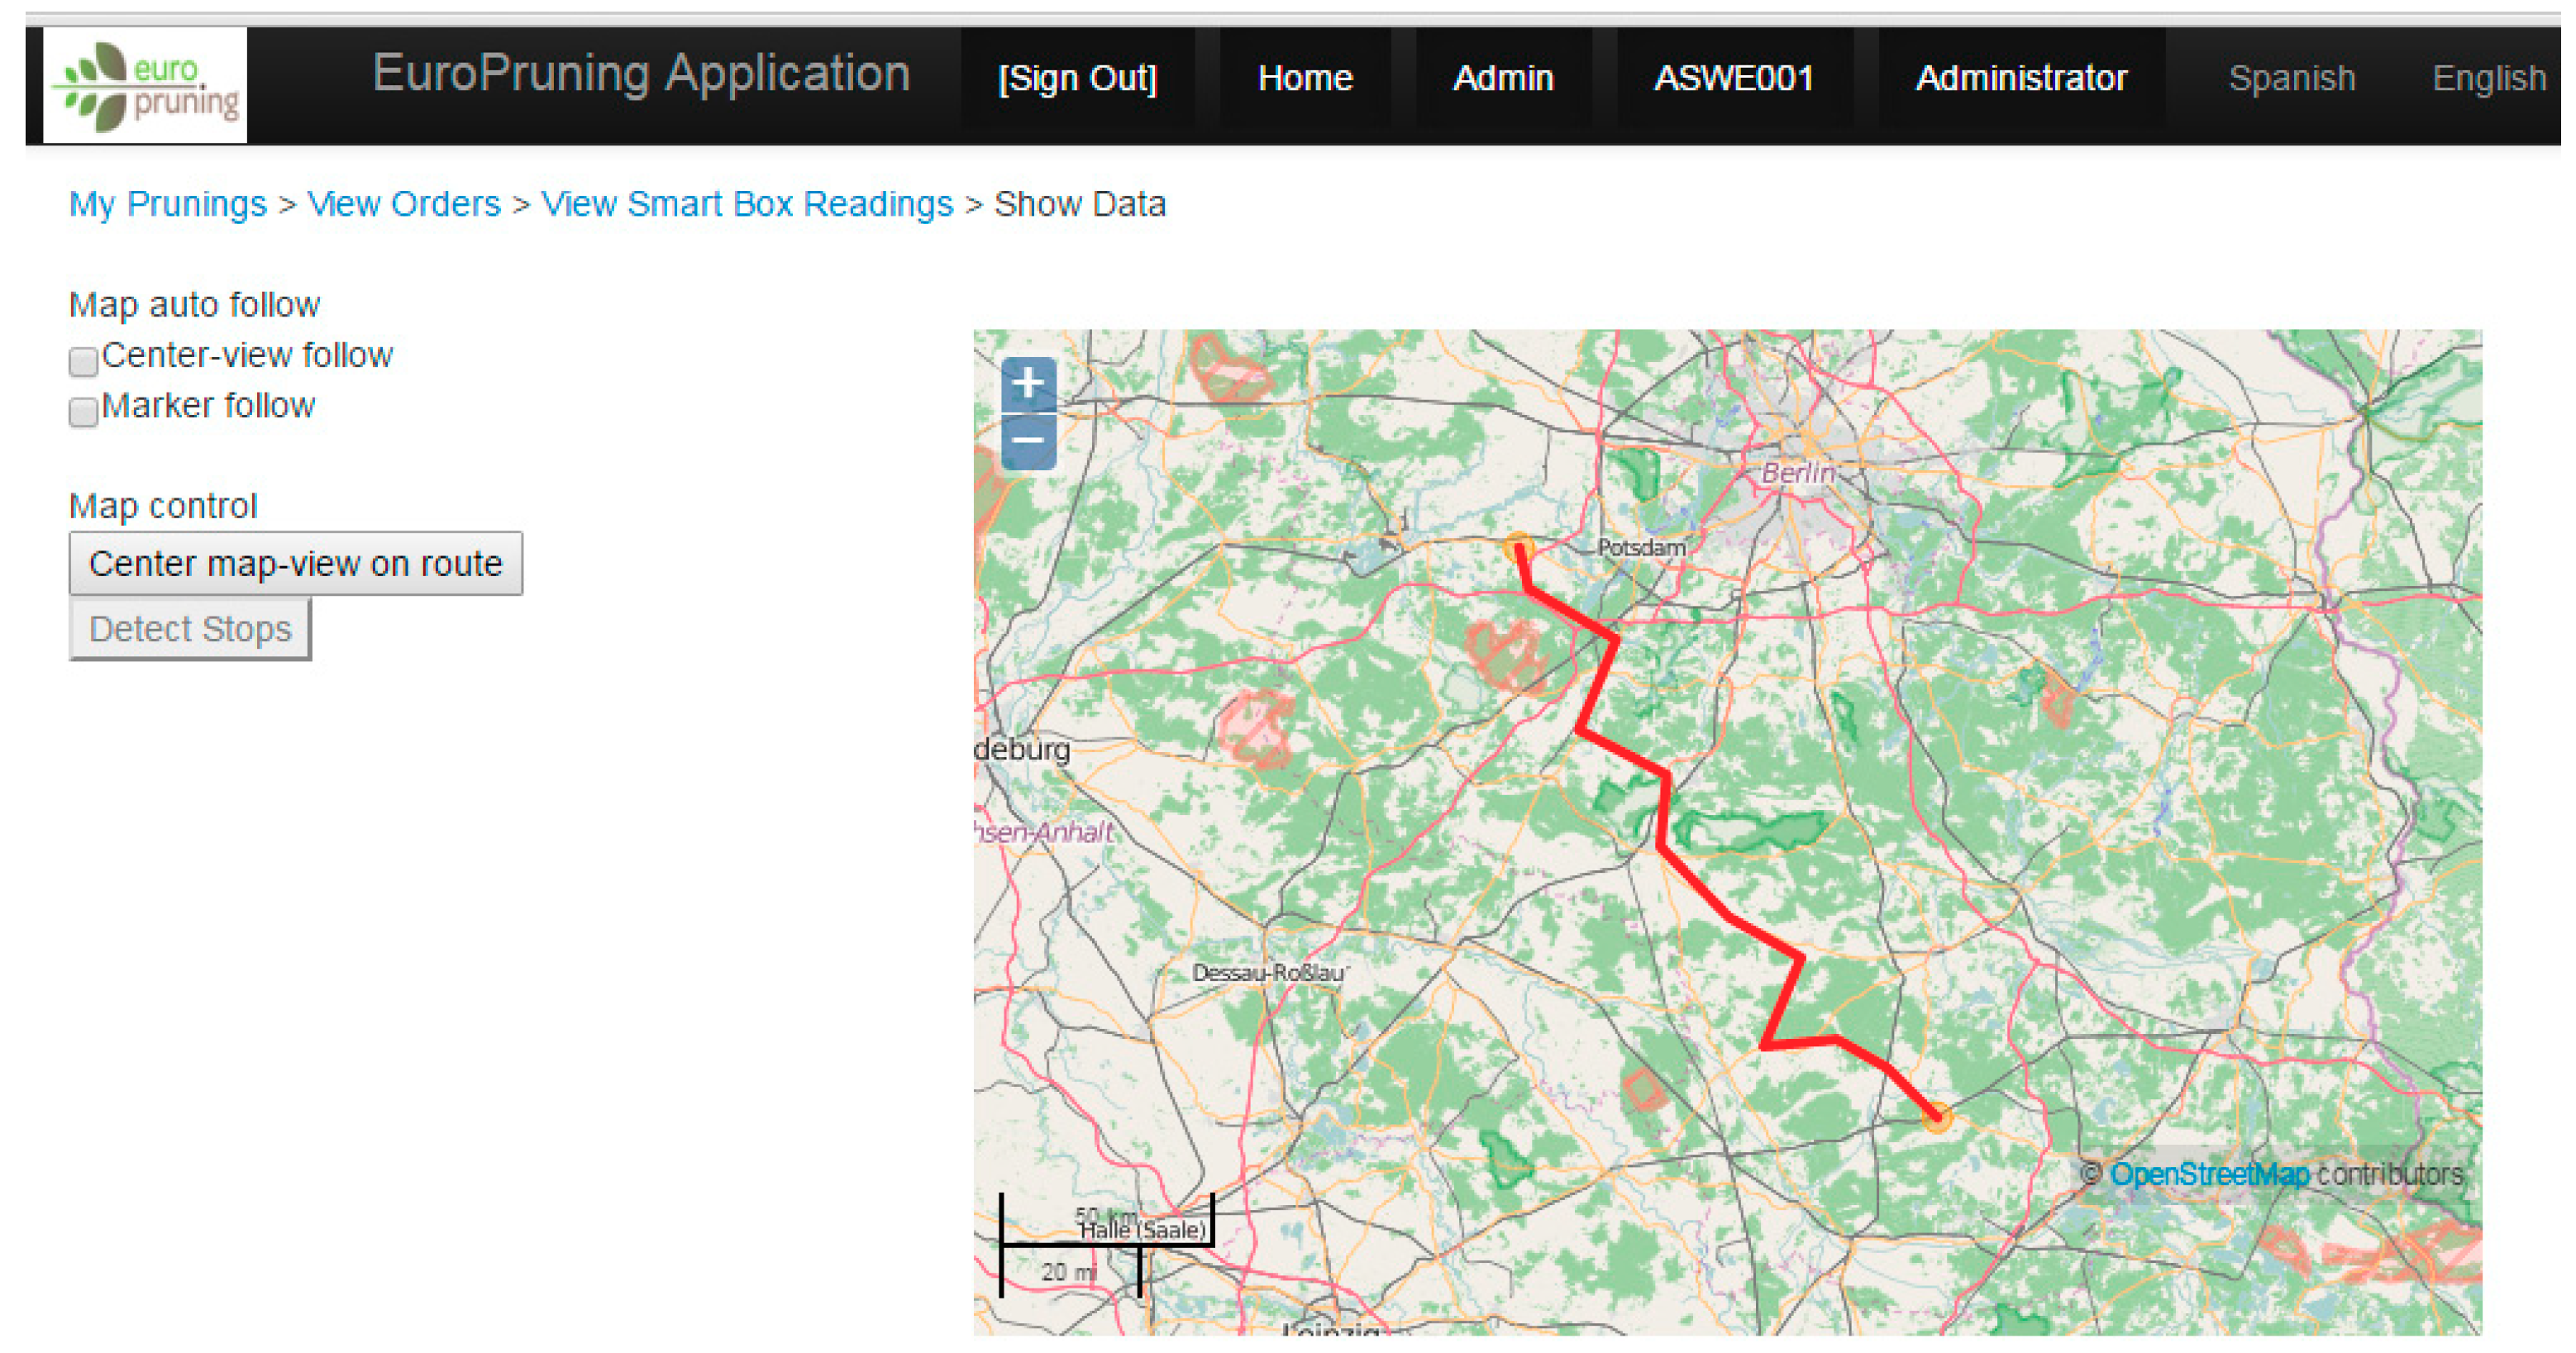
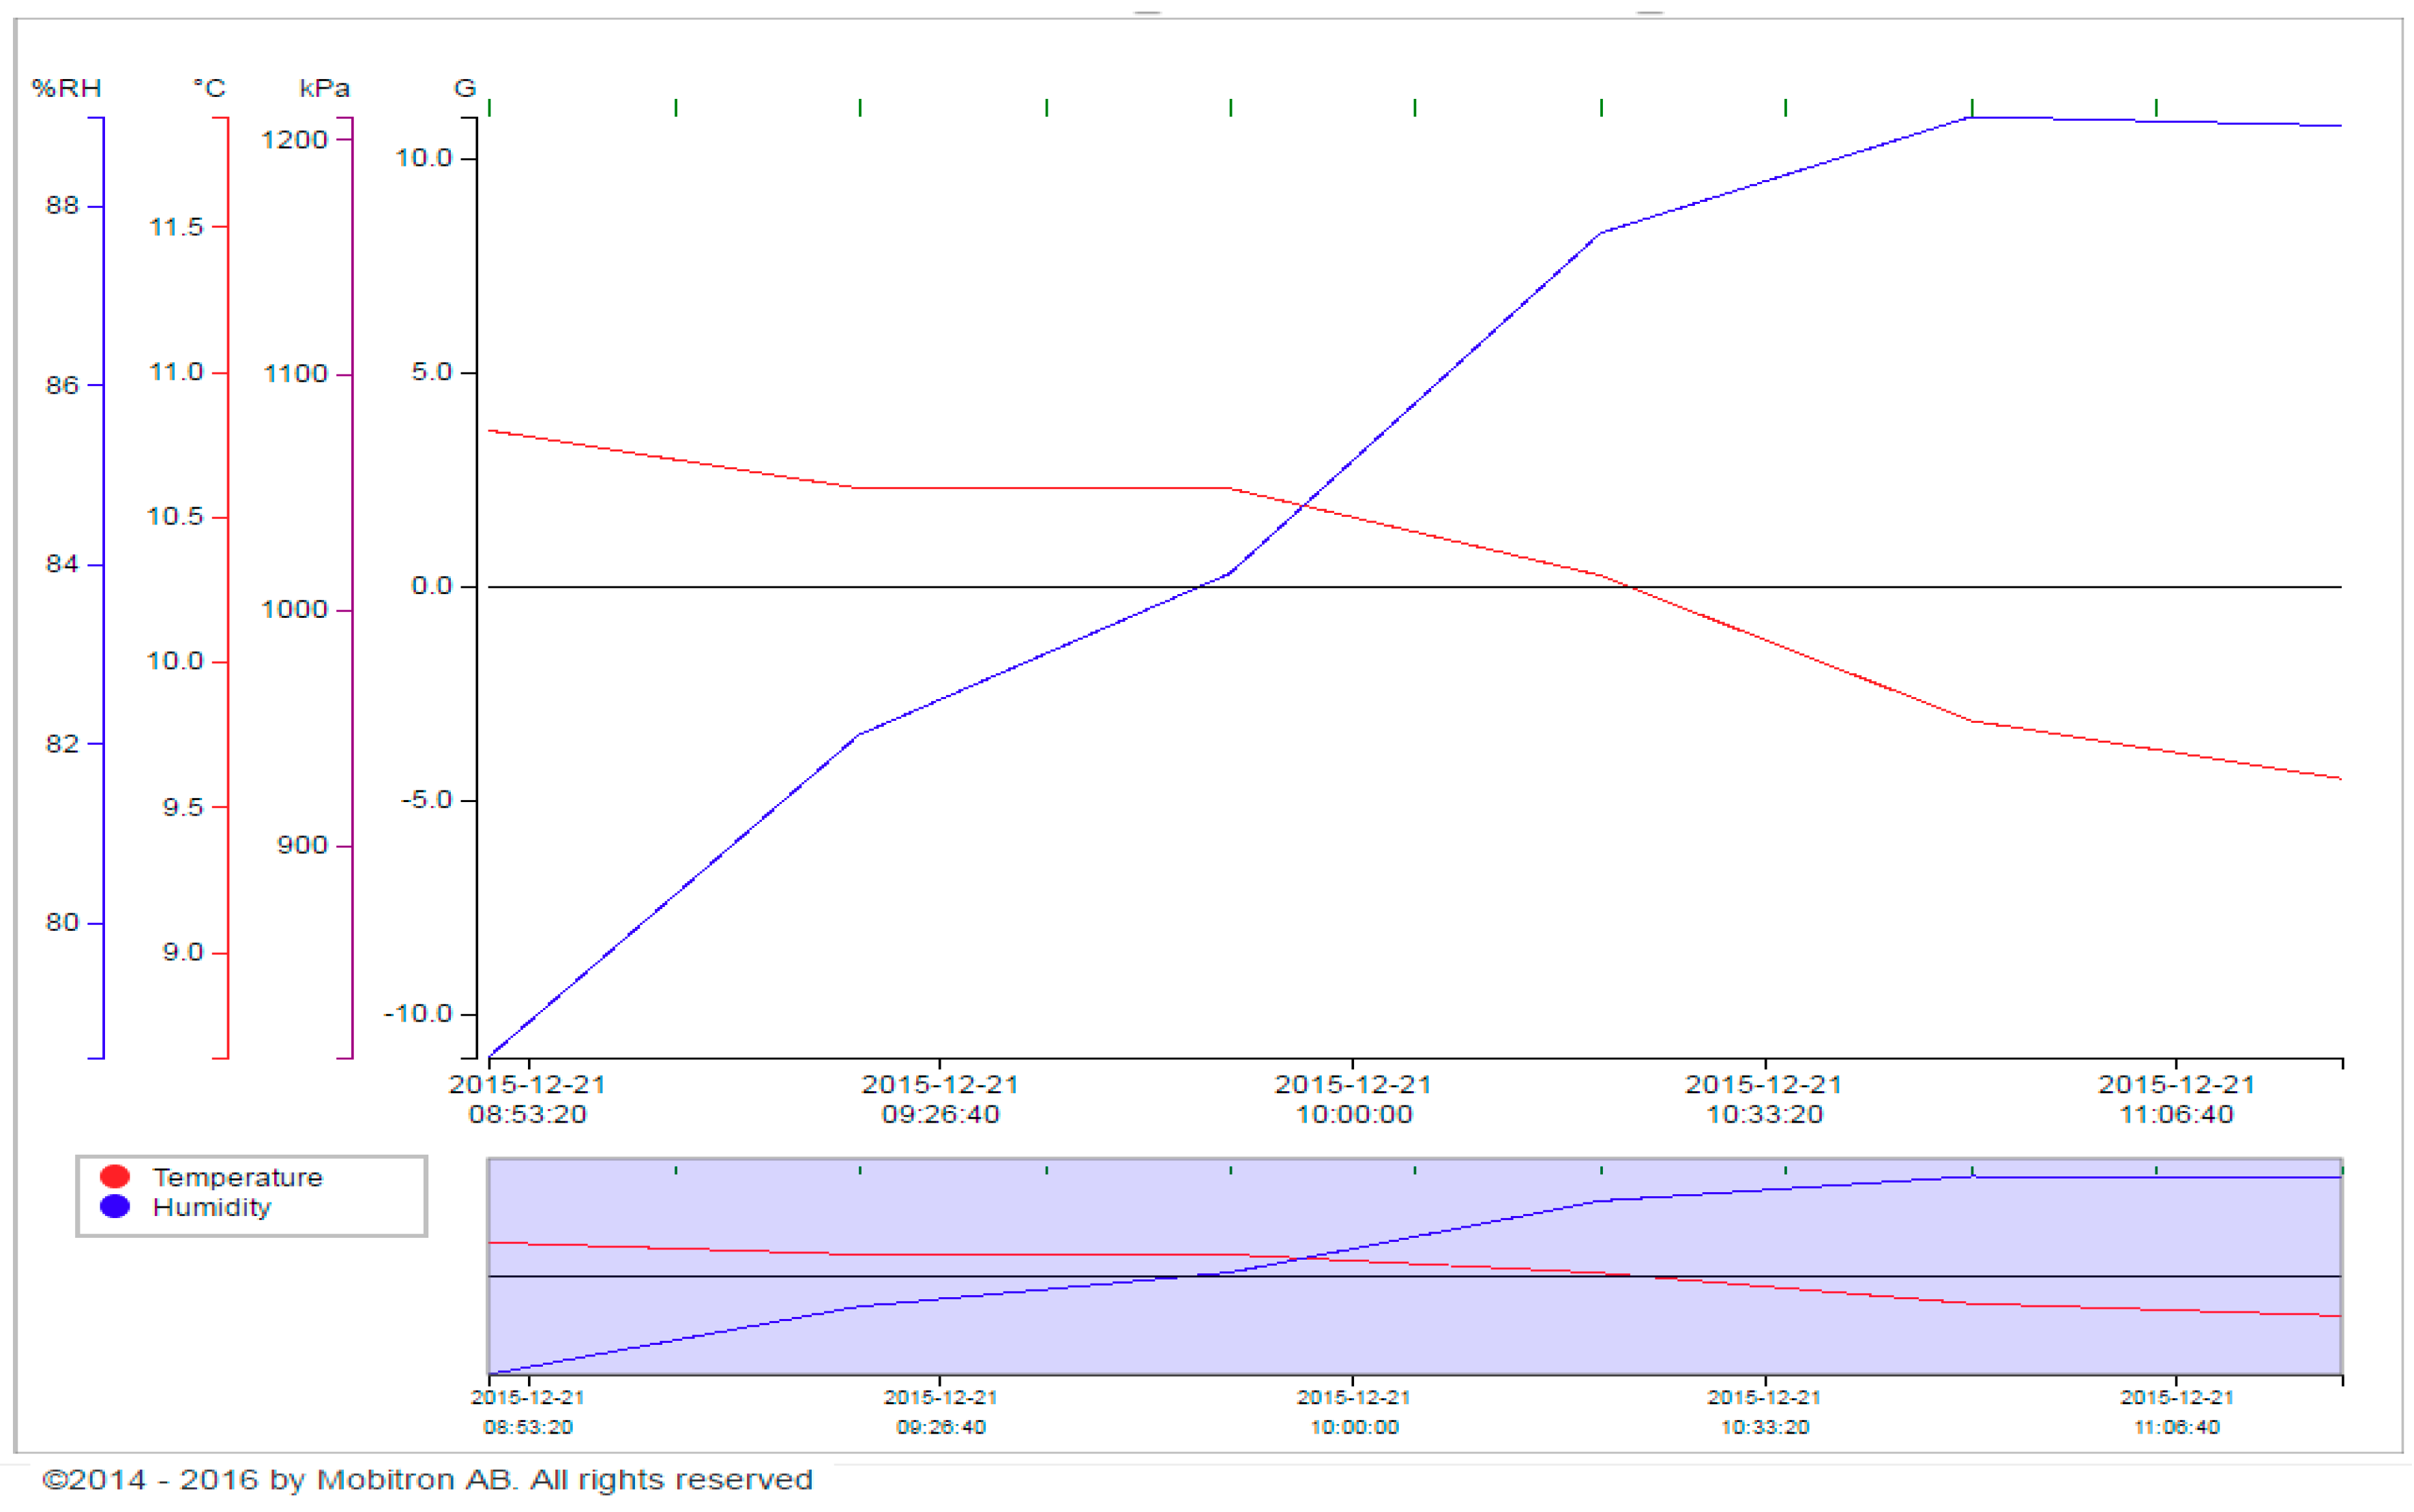
3.3. Data Recorded and Visualized Directly on Platform
3.4. Information Flow and Product Traceability Performance of the Smart System
3.5. Evaluation of Smart System Using Product Quality Model
3.6. Major Recommended Improvements
4. Conclusions
- ➣
- values of parameters recorded and stored in the spreadsheet database with 41 columns (for each pruning product registered with a specific lot number),
- ➣
- feedback and problems encountered during the test, and
- ➣
- selected performance metrics in relation to product quality model adapted from ISO/IEC FDIS 9126-1 standard.
Author Contributions
Funding
Conflicts of Interest
Appendix A

| 1 | 2 | 3 | 4 | 5 | 6 | 7 | 8 | 9 | 10 | 11 |
| title | status | Provider ID | Transporter ID | Consumer ID | Shipment ID | Cargolog Serial No | Delivery Code | latitude | longitude | Destination Longitude |
| ATBTest | ordered | FSWE001 | DDEU012 | CSWE001 | 2015085119 | FSWE001-CSWE001 | 52.403554 | 13.063443 | 13.97707995 | |
| ATBTest2 | ordered | FSWE001 | DDEU012 | CSWE001 | 2015085119 | FSWE001-CSWE001 | 52.305625 | 12.836196 | 13.9770799 | |
| ATBTest3 | ordered | FSWE001 | DDEU012 | CSWE001 | 2015085119 | FSWE001-CSWE001 | 52.484537 | 12.838255 | 13.9770799 | |
| ATBTest4 | ordered | FSWE001 | DDEU012 | CSWE001 | 2015085119 | FSWE001-CSWE001 | 52.277906 | 13.141066 | 13.9770799 | |
| ATBTest5 | ordered | FSWE001 | DDEU012 | CSWE001 | 2015085119 | FSWE001-CSWE001 | 52.514216 | 12.904860 | 13.9770799 | |
| Delivery 02 | routed | FDEU004 | DSWE001 | CSWE001 | 21 | FDEU004-CSWE001 | 51.1656 | 10.45152600 | 13.9770799 | |
| Field 1 | routed | FDEU020 | DDEU012 | CDEU014 | 78 | 2015085119 | FDEU020-CDEU014 | 52.373172 | 12.879107 | 12.9964099 |
| Field 2 | ordered | FDEU020 | DDEU012 | CDEU011 | FDEU020-CDEU011 | 52.390351 | 12.732488 | 13.3759440 | ||
| Field 4 | ready | FDEU020 | 52.450598 | 12.833617 | ||||||
| Field 3 | routed | FDEU020 | DDEU012 | CDEU015 | 80 | 2015085119 | FDEU020-CDEU015 | 52.373889 | 12.854585 | 13.7257835 |
| Field 8 | routed | FDEU020 | DDEU012 | CDEU013 | 67 | FDEU020-CDEU013 | 52.36694 | 12.87653 | 12.6542489 | |
| 12 | 13 | 14 | 15 | 16 | 17 | 18 | 19 | 20 | 21 | |
| title | Destination Latitude | Lot Number | quantity | species | Origin Classification | Traded Form | Particle Size | Bale Diameter | Moisture Content | Ash Content |
| ATBTest | 57.74525490 | 151012B01R1 | 3.0000 | Lemon | 1.1.1.1 | chips | ||||
| ATBTest2 | 57.74525490 | 151016B01R1 | 6.0000 | Orange | 1.1.1.1 | chips | P16A | |||
| ATBTest3 | 57.74525490 | 151016B02R1 | 10.0000 | Tangerine | 1.1.1.1 | branches | P16A | |||
| ATBTest4 | 57.74525490 | 151016B03R1 | 50.0000 | Apple | 1.1.1.1 | bale_round | 1.20 | |||
| ATBTest5 | 57.74525490 | 151016B04R1 | 60.0000 | Plum | 1.1.1.1 | chips | ||||
| Delivery 02 | 57.7452549 | 141127N01R1 | 3.0000 | Cherry | 1.1.1.4 | chips | P45A | 1.00 | 60.00 | 2.00 |
| Field 1 | 52.47596 | 151007B01R1 | 1.9000 | Apple | 1.1.1.1 | bale_round | 1.20 | |||
| Field 2 | 52.509649 | 151008B01R1 | 13.0000 | Apple | 1.1.1.1 | bale_round | 1.20 | |||
| Field 4 | 151008B02R1 | 1.0000 | Cherry | 1.1.1.1 | bale_round | 1.00 | ||||
| Field 3 | 51.6350451 | 151008B03R1 | 0.6000 | Cherry | 1.1.1.1 | bale_round | 1.00 | |||
| Field 8 | 53.5605655 | 151008B04R1 | 2.6000 | Apple | 1.1.1.1 | bale_round | 1.20 | |||
| Field 7 | 53.5605655 | 151008B05R1 | 8.3000 | Apple | 1.1.1.1 | bale_round | 1.20 | |||
| 22 | 23 | 24 | 25 | 26 | 27 | 28 | 29 | 30 | 31 | |
| title | Density Chips | Density Bale | Calorific Value | Crop Characteristics | Pruning Date | Collection Date | Storage Days | piled | Chemically Treated | covered |
| ATBTest | 14 April 2015 | 4 May 2015 | 150 | 0 | 0 | 0 | ||||
| ATBTest2 | 4 October 2015 | 5 October 2015 | 10 | 0 | 0 | 0 | ||||
| ATBTest3 | 1 September 2015 | 5 October 2015 | 20 | 0 | 0 | 0 | ||||
| ATBTest4 | 9 August 2015 | 14 August 2015 | 30 | 0 | 0 | 0 | ||||
| ATBTest5 | 8 June 2015 | 17 August 2015 | 60 | 0 | 0 | 0 | ||||
| Delivery 02 | 2.00 | 1.00 | 1.00 | 27 November 2015 | 28 November 2014 | 2 | 1 | 1 | 1 | |
| Field 1 | 23 February 2014 | 9 March 2014 | 180 | 1 | 0 | 0 | ||||
| Field 2 | 4 March 2015 | 16 October 2014 | 180 | 1 | 0 | 0 | ||||
| Field 4 | 25 February 2014 | 18 March 2014 | 180 | 1 | 0 | 0 | ||||
| Field 3 | 23 March 2014 | 26 March 2015 | 180 | 1 | 0 | 0 | ||||
| Field 8 | 26 March 2014 | 30 March 2015 | 180 | 1 | 0 | 0 | ||||
| Field 7 | 27 March 2014 | 14 November 2015 | 180 | 1 | 0 | 0 | ||||
| 32 | 33 | 34 | 35 | 36 | 37 | 38 | 39 | 40 | 41 | |
| title | moved | contaminated | Use Storage | Storage Longitude | Storage Latitude | Pickup Date | Delivery Date | Created Date | Modified Date | Modified By User ID |
| ATBTest | 0 | 0 | 1 | 13.012569 | 52.43828 | 15 October 2015 08:32 | 15 October 2015 11:56 | 12 October 2015 09:22 | 18 November 2015 11:04 | DDEU012 |
| ATBTest2 | 0 | 0 | 0 | 16 October 2015 07:59 | 16 October 2015 09:11 | 16 October 2015 08:27 | 16 November 2015 10:02 | DDEU012 | ||
| ATBTest3 | 0 | 0 | 0 | 16 October 2015 12:09 | 16 October 2015 08:32 | 18 November 2015 11:04 | DDEU012 | |||
| ATBTest4 | 0 | 0 | 0 | 16 October 2015 09:38 | 16 October 2015 12:09 | 16 October 2015 08:33 | 18 November 2015 11:04 | DDEU012 | ||
| ATBTest5 | 0 | 0 | 0 | 16 October 2015 10:20 | 16 October 2015 12:09 | 16 October 2015 09:27 | 18 November 2015 11:04 | DDEU012 | ||
| Delivery 02 | 1 | 0 | 0 | 27 November 2015 12:01 | 31 March 2015 08:01 | DSWE001 | ||||
| Field 1 | 1 | 1 | 0 | 18 December 2015 08:56 | 8 October 2015 14:59 | 21 December 2015 08:14 | DDEU012 | |||
| Field 2 | 1 | 1 | 0 | 8 October 2015 15:02 | 21 December 2015 08:08 | DDEU012 | ||||
| Field 4 | 1 | 1 | 0 | 8 October 2015 15:04 | 8 October 2015 15:19 | FDEU020 | ||||
| Field 3 | 1 | 0 | 0 | 21 December 2015 08:29 | 21 December 2015 11:32 | 8 October 2015 15:11 | 8 February 2016 10:18 | DDEU012 | ||
| Field 8 | 1 | 1 | 0 | 8 October 2015 15:15 | 18 November 2015 11:04 | DDEU012 | ||||
| Field 7 | 1 | 0 | 0 | 17 November 2015 11:17 | 19 November 2015 11:23 | 8 October 2015 15:17 | 19 November 2015 11:39 | DDEU012 |
References
- EuroPruning. Available online: http://www.europruning.eu (accessed on 28 December 2017).
- Gebresenbet, G.; Bosona, T.; Olsson, S.-O.; Garcia, D. Smart System for the Optimization of Logistics Performance of the Pruning Biomass Value Chain. Appl. Sci 2018, 8, 1162. [Google Scholar] [CrossRef]
- Hendershott, T. Electronic trading in financial markets. IT Prof. 2003, 4, 10–14. [Google Scholar] [CrossRef]
- Iakovou, E.; Karagiannidis, A.; Vlachos, D.; Toka, A.; Malamakis, A. Waste biomass-to-energy supply chain management: A critical synthesis. Waste Manag. 2010, 30, 1860–1870. [Google Scholar] [CrossRef] [PubMed]
- Europruning Application Platform. Available online: http://europruning.mobitron.se/public/en (accessed on 16 July 2018).
- Cerchione, S.; Cerchione, R.; Singh, R.; Centobelli, P.; Shabani, A. Food cold chain management: From a structured literature review to a conceptual framework and research agenda. Int. J. Logist. Manag. 2018, 29, 792–821. [Google Scholar] [CrossRef]
- Seuring, S.; Muller, M. From a literature review to a conceptual framework for sustainable supply chain management. J. Clean Prod. 2008, 16, 1699–1710. [Google Scholar] [CrossRef]
- Dumas, J.S.; Fox, J.E. Usability testing: Current practice and future directions. In Human-Computer Interaction: Development Process; Book Chapter; CRC Press: Boca Raton, FL, USA, 2009; pp. 232–253. Available online: https://www.taylorfrancis.com/books/e/9781420088892/chapters/10.1201%2F9781420088892-18 (accessed on 18 October 2018).
- ISO/IEC 25010:2011(en). Systems and Software Engineering-Systems and Software Quality Requirements and Evaluation (Square)-System and Software Quality Models. Available online: https://www.iso.org/obp/ui/#iso:std:iso-iec:25010:ed-1:v1:en (accessed on 23 July 2018).
- ISO/IEC (2000). Information Technology—Software Product Quality—Part 1: Quality Model. ISO/IEC FDIS 9126-1. Available online: http://www.cse.unsw.edu.au/~cs3710/PMmaterials/Resources/9126-1%20Standard.pdf (accessed on 24 March 2016).
- Bosona, T.; Gebresenbet, G.; Olsson, S.-O. Traceability System for Improved Utilization of Solid Biofuel from Agricultural Prunings. Sustainability 2018, 10, 258. [Google Scholar] [CrossRef]
- CIRCE (2014). Description of the Biomass Specifications for the Value Chain. Deliverable 2.1 of EuroPruning Project. Available online: http://www.europruning.eu/web/lists/pubfiles.aspx?type=pubdeliverables (accessed on 29 May 2017).
- Smart Logistics and Cost-Effective Transportation. Available online: http://www.europruning.eu/web/data/category.aspx?id=smartlogistics (accessed on 30 December 2017).
- Santa, J.; Zamora-Izquierdo, M.A.; Jara, A.J.; Gómez-Skarmeta, A.F. Telematic platform for integral management of agricultural/perishable goods in terrestrial logistics. Comput. Electron. Agric. 2012, 80, 31–40. [Google Scholar] [CrossRef]


| Action | Actor | Description of Actions to Be Performed |
|---|---|---|
| Add new user | Administrator | Logistics manager who administers the smart system can add new users to the system. New label codes will be assigned to new actors. |
| Add new pruning | Farmers | Farmers have to input pruning quality parameters required by end users. |
| Edit pruning | Farmers | Farmers can update input information such as pruning quality parameters while it is in “pending” status. |
| Delete pruning | Farmers | Farmers can delete pruning as long as it is still pending and has not been flagged as “ready”. |
| Make ready | Farmers | Farmers can flag pruning as “ready” so that consumers can view that pruning and order it. |
| Generate QR code | Farmers | Farmers can generate a quick read (QR) code for “pending”, “ready”, and “ordered” pruning. |
| Order pruning | Consumers | Consumers order pruning based on quality parameters. Consumers select a transporter from a list registered in the central system. |
| Add to shipment | Transporters | Transporters select orders to be included in one shipment in order to plan the route between locations of chosen orders. |
| Plan route | Transporters | Transporters generate driving instructions for source and destination locations for all orders included in one shipment. |
| Add to pruning | Traders | Traders use the tool to select which orders are part of a new treated pruning offer. Trader can add new pruning quality parameters, e.g., if bales are chipped. |
| Basic Characteristics | Description as Applied in SLS Testing |
|---|---|
| System to evaluate | Used to evaluate the SLS. Usability testing is an evaluation approach that can be applied to evaluate almost any product or technology; for example, software for database management, network management tools, early-stage prototypes, and related help manuals. |
| Focus | The focus was on usability of the SLS. The test was intended to validate the first release of the smart system (smart box and information platform) prototype, with less consideration of marketability of the product. |
| Participants | The intended main participants were (potential) end users of the smart system who were actors of the pruning supply chain (farmers, pruning traders, transporters, power plants). Test participants and administrators interacted during tests. Training and instruction guides were provided before starting. During this testing, research centers such as Leibniz Institute for Agricultural Engineering Potsdam-Bornim (ATB) in Germany, Research Centre for Energy Resources and Consumption (CIRCE) in Spain, and the Swedish University of Agricultural Sciences (SLU) as well as Gruyser (transport dealer) participated actively. |
| Tasks | The smart system has different functional features. Each participant considers the specific functionality of the system that best fits him/her. Test participants who act as farmers perform tasks that the pruning producers perform, while traders perform what processors and traders of biomass perform using the system. Similarly, transporters and consumers test features of the system that serve the transport company and end consumers of the pruning biomass. |
| Data | Pruning biomass–related data were recorded, stored in a database, and analyzed. Both problems and positive aspects noticed during tests were analyzed. Data collected with three prototypes were used to evaluate the functionality of similar features of the system but with different smart box prototypes. Accordingly, a data triangulation test approach was used, especially to test data storage and display capability of the central information platform by analyzing data sourced from testing with three different prototypes. |
| Results | Test results were used to improve the smart system and communicate the research outputs. These analysis results are documented, archived, and used to identify what problems surfaced and how to solve them. |
| Attribute | Description |
|---|---|
| Functionality | How easy it is for the system to integrate its functional units while maintaining the security and accuracy of service provided |
| Reliability | How well the smart system can provide service with required precision |
| Usability | How easy it is for the smart system to learn, operate, and analyze the data and make decisions |
| Efficiency | Amount of resources and time required by the system to perform its intended function |
| Maintainability | How easy it is for the system to identify and fix an error |
| Portability | How easy it is to move the smart box from one place to another and to move the application platform from one server to another |
| Column No. | Column Header as Implemented in Database | Description of Parameters under Each Column Header |
|---|---|---|
| 1 | title | Name given to the biomass registered with a unique lot number |
| 2 | status | Status of the registered biomass along logistics chain (e.g., delivered or not) |
| 3 | providerID | Label code assigned to the provider (i.e., farmer or trader) of the biomass |
| 4 | transporterID | Label code assigned to the transport company delivering the biomass |
| 5 | consumerID | Label code assigned to the end user that ordered (purchased) the biomass |
| 6 | shipmentID | Number to identify the delivery route of the biomass with the indicated lot number |
| 7 | Cargolog SerialNo | Identification number of smart box used by the transporter while transporting this specific biomass |
| 8 | deliveryCode | Product delivery identification number to monitor the traceability of product movement along the chain |
| 9 | latitude | Latitude of the location where the biomass is to be picked up |
| 10 | longitude | Longitude of the location where the biomass is to be picked up |
| 11 | destinationLongitude | Longitude of the location where the biomass is to be delivered |
| 12 | destinationLatitude | Latitude of the location where the biomass is to be delivered |
| 13 | lotNumber | LotNumber associated with the specific biomass product under consideration |
| 14 | quantity | Quantity of biomass associated with each lot number |
| 15 | species | Sources of agricultural pruning where biomass product is produced |
| 16 | originClassification | Identification of origin and source according to classification in standard EN-ISO 17225-1:2014 |
| 17 | tradedForm | Information on traded form of biomass |
| 18 | particleSize | Particle size distribution of chips |
| 19 | baleDiameter | Diameter of traded bale |
| 20 | moistureContent | Moisture content of biomass |
| 21 | ashContent | Ash content of biomass |
| 22 | densityChips | Density of traded chips |
| 23 | densityBale | Density of traded bales |
| 24 | calorificValue | Caloric value of traded biomass |
| 25 | cropCharacteristics | Additional information regarding biomass production and source |
| 26 | pruningDate | Date when farmer pruned fruit or other trees |
| 27 | collectionDate | Date when pruning is gathered (on farm) to be transported or processed (e.g., chipping) |
| 28 | storageDays | Duration of storage at storage site, in days |
| 29 | piled | Information to identify whether biomass is stored as large pile or spread as small heaps |
| 30 | chemicallyTreated | Information regarding whether biomass product is chemically treated or not |
| 31 | covered | Information indicating whether biomass storage is covered or not |
| 32 | moved | Information to identify whether machinery is used to move biomass at storage site |
| 33 | contaminated | Information to identify whether biomass has been contaminated with impurities |
| 34 | useStorage | Information indicating whether storage is used and if it is located at a different position than the address of farm or trader |
| 35 | storageLongitude | Longitude value of storage |
| 36 | storageLatitude | Latitude value of storage |
| 37 | pickupDate | Date and time when the product is picked up for delivery to intended destination |
| 38 | deliveryDate | Date and time when the product is delivered to intended destination |
| 39 | createdDate | Date and time indicating when the product is registered on the platform server |
| 40 | modifiedDate | Date and time indicating when the status (see column 2) of the product along the delivery process is changed by next actor |
| 41 | modifiedByUserID | Label code assigned to the actor who changed the status of product (see column 40) |
| Country | Recorded Product with Specific Lot Number (N) | Route Planned for Product Delivery | Product Delivered to Consumer * | ||
|---|---|---|---|---|---|
| Number | % | Number | % | ||
| Sweden | 28 | 21 | 75 | 14 | 50 |
| Spain | 65 | 31 | 48 | NA | NA |
| Germany | 11 | 4 | 36 | 3 | 27 |
| Total | 104 | 56 | 54 | 17 | 16 |
| Product (Lot Number) | Recorded Moisture Content (%) | Remark | ||
|---|---|---|---|---|
| Storage (start) | Storage (end) | Relative Humidity (RH) Measured by Smart Tool | ||
| Field1 (151007B01R1) | 31.68 | 31.68 | NA | Data were not transferred properly |
| Field3 (151008B03R1) | 31.68 | 13.36 | 78.5–88.9 | RH measured during transport |
| Field7 (151008B05R1) | 31.68 | 13.36 | 91.8–93.2 | RH measured during transport |
| Field8 (151008B04R1) | 31.68 | 31.68 | NA | Route planned, but pruning was not transported |
| Column Header (Indicating Parameter) as Implemented in Central Database | Correctly Recorded Values of Registered Products for Which Route Planning Was Done (%) | |||
|---|---|---|---|---|
| Sweden N = 21 | Spain N = 31 | Germany N = 4 | Relevance Level of the Parameter for Traceability Information | |
| title | 100 | 100 | 100 | Mandatory |
| Status | 100 | 100 | 100 | Supporting information |
| providerID | 100 | 100 | 100 | Mandatory |
| transporterID | 100 | 100 | 100 | Mandatory |
| consumerID | 100 | 100 | 100 | Mandatory |
| cargologSerialNo | 67 | 0 | 75 | Supporting information |
| deliveryCode | 91 | 68 | 100 | Very important |
| lotNumber | 100 | 100 | 100 | Mandatory |
| pickupDate | 67 | 0 | 75 | Supporting information |
| deliveryDate | 67 | 0 | 50 | Very important |
| modifiedByUserID | 100 | 100 | 100 | Supporting information |
| Functional Features | Main Actor Responsible for the Activity | Satisfaction Level (Ease of Use of the Tool and Precision of Results) * | ||||
|---|---|---|---|---|---|---|
| 1 | 2 | 3 | 4 | 5 | ||
| Data entering (uploading) onto web-based platform | Biomass producer | √ | ||||
| Data recording by smart box | Transporter | √ | ||||
| Data transfer from smart box to central database | Transporter | √ | ||||
| Searching for available product and ordering for purchase | Trader and consumer | √ | ||||
| Whole pruning supply chain management support | System administrator | √ | ||||
| Product quality monitoring and traceability capability | System administrator, consumer | √ | ||||
| Attribute | Smart Logistics System Performance Description |
|---|---|
| Functionality | Suitability: The smart system is designed for management of pruning biomass logistics activities. It is suitable for collecting and managing pruning-related data and provides service for all registered actors of the pruning supply chain. Completeness: The system enables complete data to be obtained regarding the biomass quality and quantity as well as its flow along the supply chain. Accuracy: For more than 95% of data parameters included in the spreadsheet-based database, the system accurately displays the recorded data and information. In some cases, errors were noticed, mainly due to problems encountered during data transfer from the smart box. Interoperability: The smart system effectively integrates different functional units such as GPS and GPRS/GSM devices, temperature and humidity recording tools, and the information platform. The data stored in the central database can be downloaded and easily analyzed using spreadsheets, facilitating further interoperability of the system. |
| Efficiency | Time saving: The tool enables transporters to plan their best transport routes, reducing driving time and distance. Each producer can use the online platform to announce its products while end users and/or traders can buy the ready products and transport services easily online, where the system is managed by an administrator. Resource utilization: Once the pruning biomass-to-energy value chain is initiated, the smart system facilities the coordinated utilization of available resources owned by actors in the chain. Capacity: The smart system has functional capacity to record, transfer, and store adequate data along the pruning biomass logistics chain from producer to end user. It facilities the traceability of pruning quality and logistics management, leading to economic efficiency. |
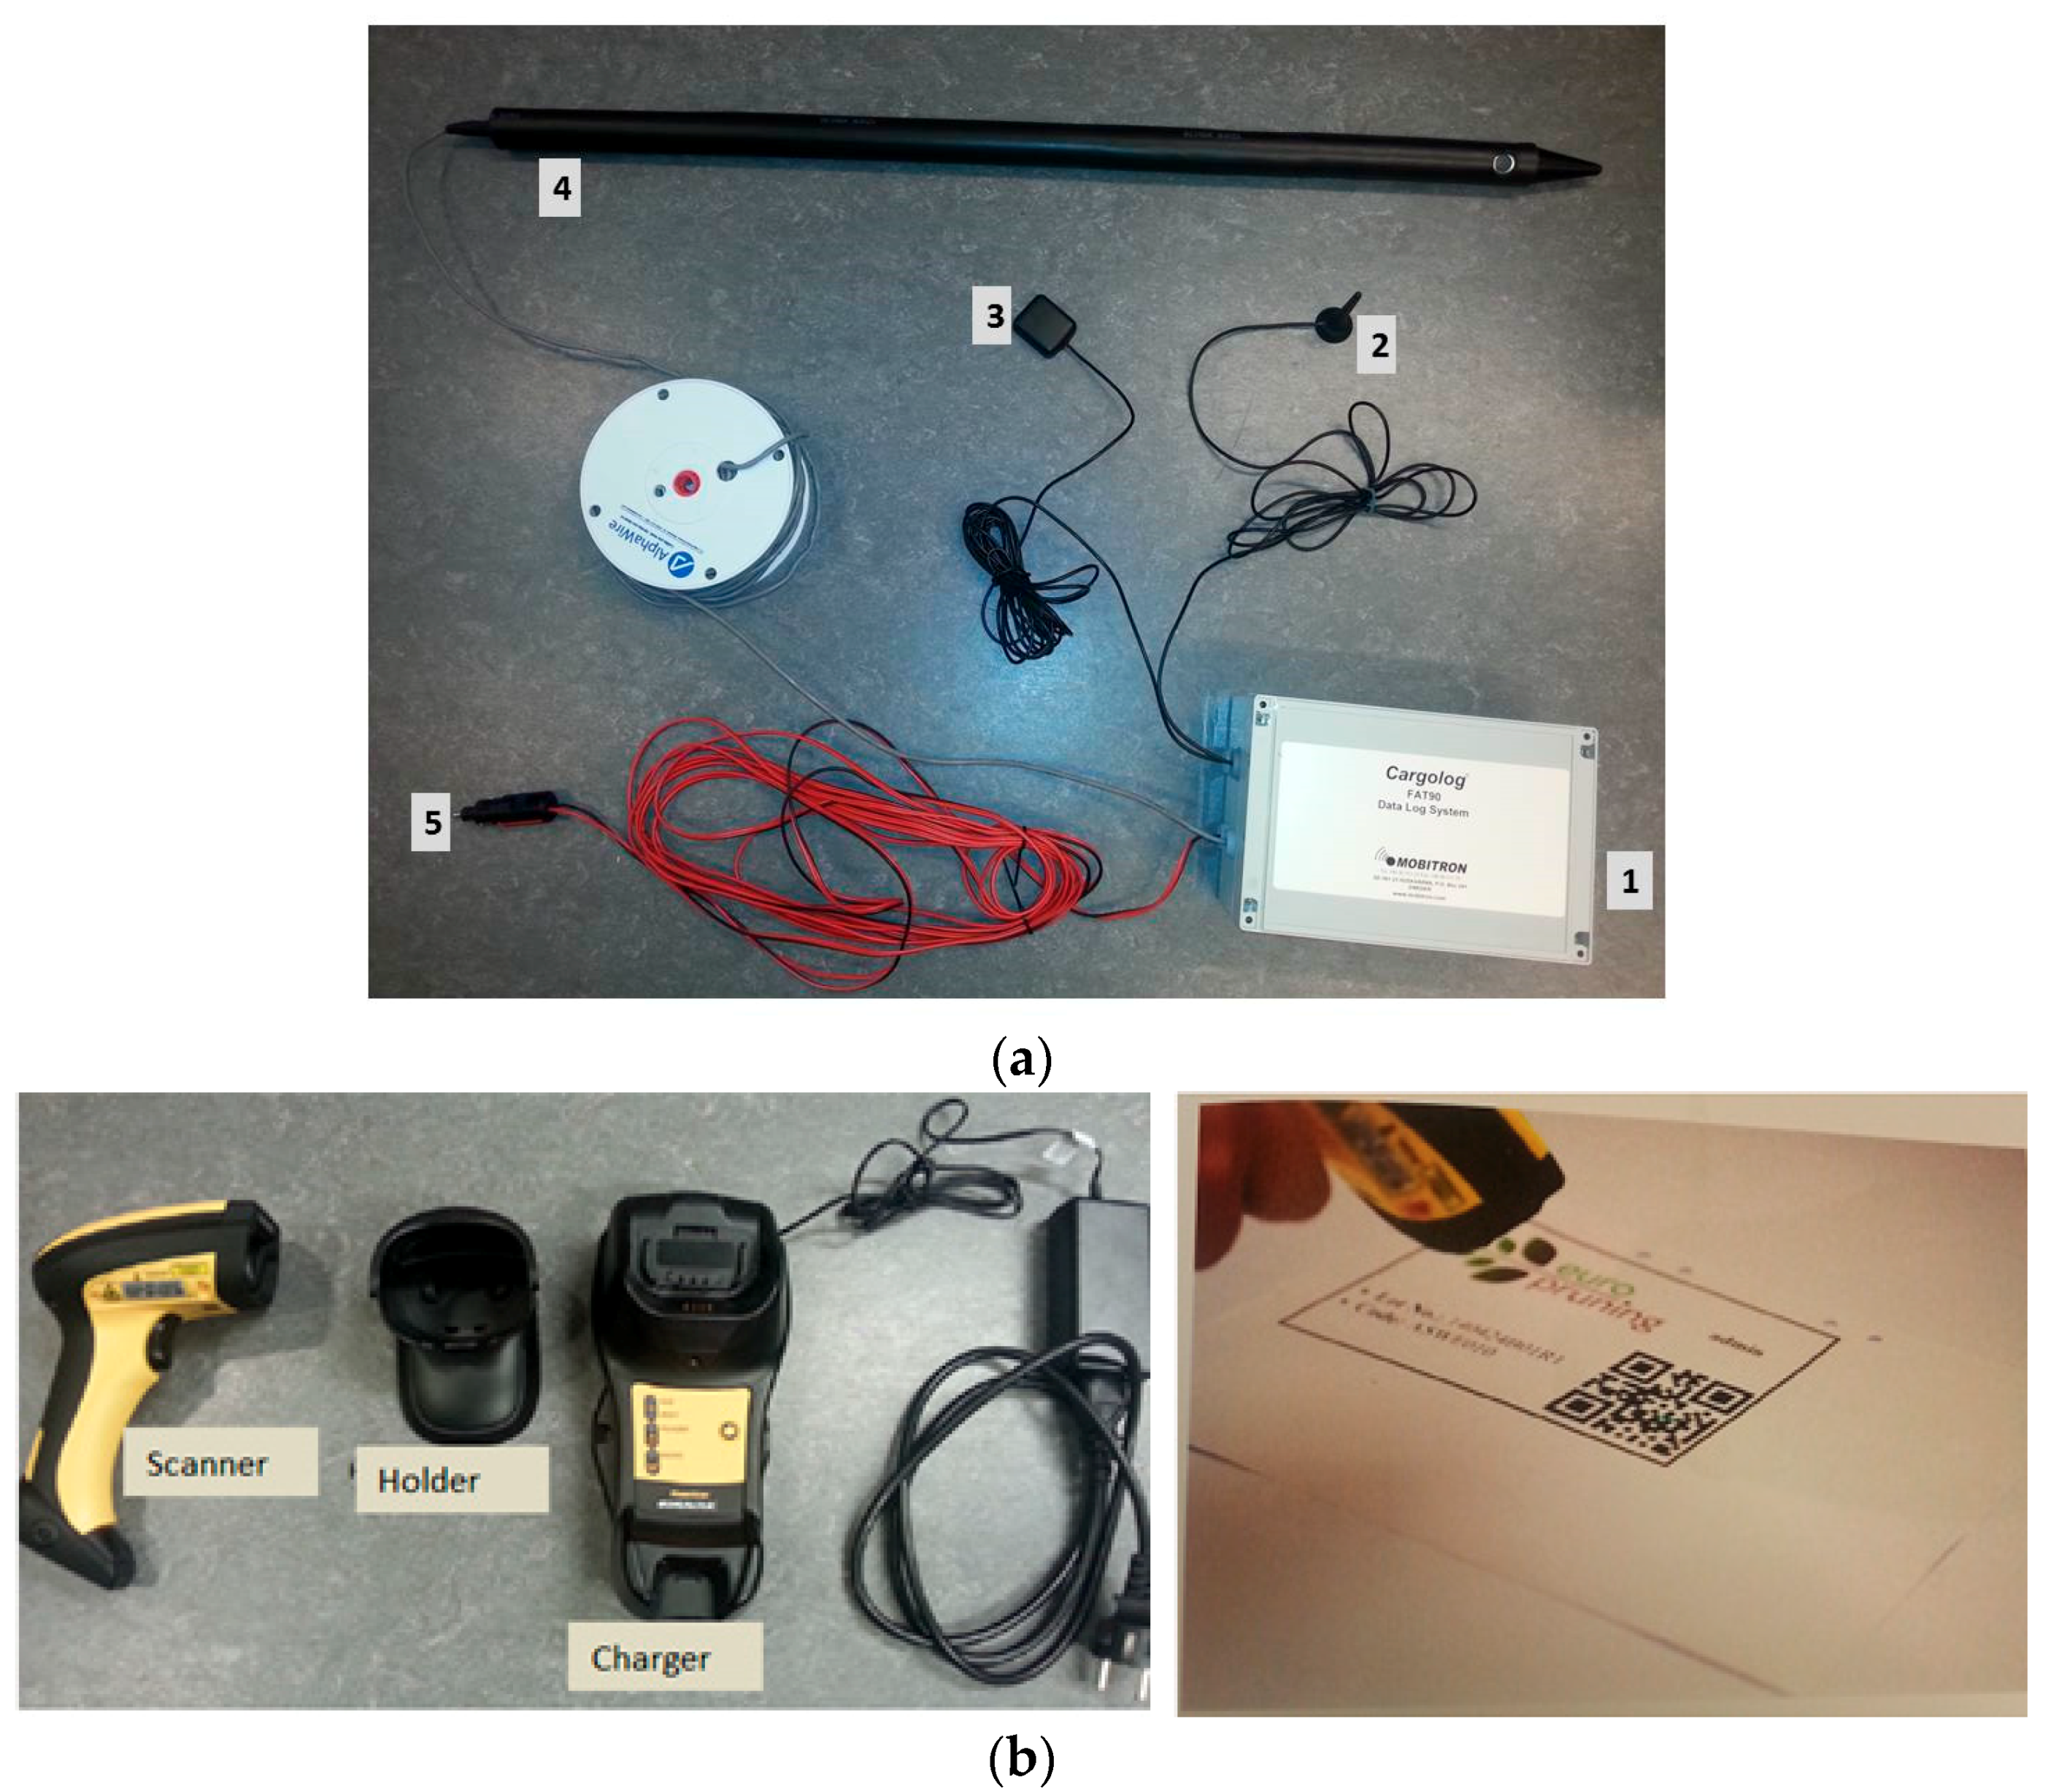
| Usability | Appropriateness: The smart system is appropriate, as it enables recording, documentation, and having adequate data centrally, which in turn facilitates the performance analysis and traceability of pruning biomass. Learnability: The tool has a guiding manual to facilitate training and learning to use the system. Once registered by the administrator, each actor can easily practice and use the information platform. User error protection: Once training is provided, there are fewer user errors when using the smart box. Once the power cable is plugged in, the recording will be triggered (started and ended) by a separate portable scanner used to read QR codes on biomass labels. While using the information platform, each registered actor can record and edit only the data he/she provides but not those of other users. Therefore, user error is minimized and can be easily corrected by the respective responsible actor. Accessibility: The smart system will be accessible to all interested actors involved in the pruning-to-energy value chain. However, each user should be registered by the system administrator first and get a specific identification code (labelling code as described in [2,10]). Understandability: The system can be used effectively if initial training and user guide documents are provided. However, how to interpret some displayed values and how to analyze the gathered data can be difficult for many users and should be handled only by experienced (well-trained) system administrators. Attractiveness: The web-based user interface information platform has integrated up-to-date Google Maps, which increases the aesthetics and attractiveness of the online platform. Operability: Components of the smart box are connected to a recording unit by cables [2] (see Figure 5). It has no plug-in and plug-out system for the cables increasing difficulty during operation, indicating that improvement is required. There should also be power on and off buttons for user-friendly operation. |
| Reliability | Maturity: The smart system is newly developed and tested for the first time. Further repeated tests and evaluation are recommended to increase its maturity level. Availability: The tool is newly developed and not available on the market. From feedback during testing activities, there is a potential market for the smart system, and the tool could be made available for marketing. Fault tolerance: The test results indicate that all registered pruning products were successfully recorded and stored in the central database with associated product quality characteristics. This indicates that a trader or consumer can confidently order any product registered on the information platform and made ready for sale. Other faults, if any, in relation to real-time data during transport may be tolerable. Recoverability: Once the product is registered in the central platform, much associated information will be generated as the product moves downward along the pruning logistics chain. This increases the recoverability of some missed data, if any. |
| Security | Confidentiality: Personal information of registered actors is confidential, as it can only be accessed by system administrators (of the information platform). Integrity: The system well integrates data recorded by the smart box and related data provided by pruning biomass producers. Accountability: All registered users are accountable for the information they provide to intended users of the information platform. The system enables pinpointing damages that could happen at any stage along the logistics chain through the pruning traceability system integrated in the smart system. Authenticity: All registered actors have specific codes and access to and recognition of data and information they provided. |
| Maintainability | Modularity: The smart box components can be disassembled and reassembled by the prototype developer. This facilitates maintenance service. Reusability: The system can be maintained and reused. Maintenance service may be required on average once a year, and some parts of the smart box may need to be replaced. Modifiability: The information platform can be modified based on the interest of users or if additional service is required. Testability: Both the smart box and the information platform are testable. After appropriate maintenance, the system will be well tested before it is used. |
| Portability | Adaptability: The possibility of adapting to logistics of biomass other than pruning residues, such as forest wood products, was taken into consideration during the development of the smart logistics system. Installability: The smart box has a metal case with a magnetic foot for easy and appropriate mounting on a truck. The metal case is used to protect the smart box from mechanical damage, aggressive gases, liquids, and humidity. Packaging: The smart box needs to be shipped from its manufacturing place to end users. The packaging system for this should be hard enough for protection from damage due to impact. Improved packaging is recommended for this purpose. |
© 2018 by the authors. Licensee MDPI, Basel, Switzerland. This article is an open access article distributed under the terms and conditions of the Creative Commons Attribution (CC BY) license (http://creativecommons.org/licenses/by/4.0/).
Share and Cite
Bosona, T.; Gebresenbet, G.; Olsson, S.-O.; Garcia, D.; Germer, S. Evaluation of a Smart System for the Optimization of Logistics Performance of a Pruning Biomass Value Chain. Appl. Sci. 2018, 8, 1987. https://doi.org/10.3390/app8101987
Bosona T, Gebresenbet G, Olsson S-O, Garcia D, Germer S. Evaluation of a Smart System for the Optimization of Logistics Performance of a Pruning Biomass Value Chain. Applied Sciences. 2018; 8(10):1987. https://doi.org/10.3390/app8101987
Chicago/Turabian StyleBosona, Techane, Girma Gebresenbet, Sven-Olof Olsson, Daniel Garcia, and Sonja Germer. 2018. "Evaluation of a Smart System for the Optimization of Logistics Performance of a Pruning Biomass Value Chain" Applied Sciences 8, no. 10: 1987. https://doi.org/10.3390/app8101987
APA StyleBosona, T., Gebresenbet, G., Olsson, S.-O., Garcia, D., & Germer, S. (2018). Evaluation of a Smart System for the Optimization of Logistics Performance of a Pruning Biomass Value Chain. Applied Sciences, 8(10), 1987. https://doi.org/10.3390/app8101987