1. Introduction
Barium strontium niobates (BSNs), characterized by extraordinary photorefractive, electro-optic, dielectric, piezoelectric, and pyroelectric properties [
1,
2], are among the promising and sought-after materials for use in pyroelectric detectors, holographic memory devices, etc. Traditionally, BSN media are used in the form of monocrystals and thin films, less often as ceramics [
3]. The known difficulties in obtaining single crystals and the highest temperatures of sintering of ceramics (>1720 K) make it preferable to choose a solid state in the form of low-dimensional structures (thin films), which is explained by the intensive development of works aimed at the creation of integrated devices, as well as low temperature processes for the preparation of thin-film BSN products, including a sol-gel method on a magnesium oxide substrate [
3].
The extreme components of the system under study are BaNb
2O
6 and SrNb
2O
6. The first has two polymorphic modifications [
4], one of which has a hexagonal symmetry and is stable in a narrow temperature range below (but near) the melting point, the other (low-temperature) phase is rhombic with
a = 12.17 Å,
b = 10.25 Å,
c = 3.94 Å. SrNb
2O
6 is not ferroelectric (FE), having a complex structure that is not isomorphic to either BaNb
2O
6 or PbNb
2O
6. The solid solutions (SS) of the binary system (1) of BaNb
2O
6-xSrNb
2O
6 have FE properties [
5], having two FE phases: one is tetragonal, isostructural Pb
0.5Ba
0.5Nb
2O
6, stable at 0.20 ≤
x ≤ 0.45; another—rhombic, similar to PbNb
2O
6, stable at 0.60 ≤
x ≤ 0.80. In Reference [
6], it is asserted that BSN crystals belong to the structure of unfilled tungsten bronzes, in which only 5/6 cationic positions are statistically populated. The basis of the structure is a three-dimensional framework formed by NbO
6 octahedra and forming three types of structural channels: the narrowest channels of the triangular section are not filled; the cross-sectional averages of the quadrangular channels are filled with Sr atoms, the pentagonal channels are filled with Ba and Sr atoms.
The complex structure of tungsten bronzes, which include BSN media, BaNb2O6 polymorphism, the non-isomorphism of the second extreme component of the system, SrNb2O6, and the absence of FE properties in it limit the range of FE SS. This, as well as the multistage nature of the SS formation processes make it difficult to manufacture them without impurities of extraneous phases.
Considering all the above, it seems relevant to establish the regularities of phase formation of niobates of barium, strontium, and their SS under the conditions of the variability of the thermodynamic prehistory; the construction of a phase diagram and the identification of its relationship with the electrophysical properties of BSN ceramics; study of the grain structure, dielectric hysteresis, and relaxation phenomena in BSN-50.
2. Materials and Methods
SS on the basis of binary system (1 −
x)BaNb
2O
6-
xSrNb
2O
6 (BSN) (0.0 ≤
x ≤ 1.0 Δ
x = 0.1) were the objects of the research. The samples were produced by two-stage solid-phase synthesis followed by sintering in conventional ceramic technology with variation in sintering temperature. X-ray studies were performed by powder diffraction on a DRON-3 diffractometer using Co
Kα radiation. The cell parameters were calculated in accordance with the standard procedure, the measurement error was: Δ
a = Δ
b = Δ
c = ± (0.003 ÷ 0.004) Å, Δ
V = ± 0.05 Å
3, where
a,
b,
c are the parameters cell [
7]. The measurement error for
ρexp. was ±(0.01). The measurement error for
L. was ±(0.4) dB.
A scanning electron microscope JSM-6390L (Japan) with a microanalyzer system from Oxford Instruments (Oxford, UK) was used to study the microstructure of the chips. The resolution of the microscope is up to 1.2 nm with an accelerating voltage of 30 kV (image in secondary electrons), the limits of the accelerating voltage are from 0.5 to 30 kV, the increase is from ×10 to ×1,000,000, the beam current is up to 200 nA.
High- temperature dielectric spectra were examined by means of the precision LCR-meters (Agilent 4980A: Agilent Technologies, Santa-Clara, CA, USA; WayneKerr 6500B: Wayne Kerr Electronics, London, UK). The measurements were carried out in the temperature range of (300–920) K and in the frequency range
f = (20–10
6) Hz. The microwave absorption of the ceramic samples was investigated using method presented in Reference [
8].
3. Results
By the variation of technological regulations (temperature, multiplicity, and duration of firing), optimal conditions for the phase formation of SS (1 −
x)BaNb
2O
6-
xSrNb
2O
6 are established, ensuring a practical absence (<5%) of ballast media during synthesis. The choice of optimal sintering temperatures (T
sint.) for a series of samples burned at (1570 ÷ 1670) K showed that ceramics obtained at the T
sint. = 1650K (
Figure 1) [
9] have the highest density, which was confirmed by measurements of the
ε/
ε0 dependences on T in the heat-cool regime (
f = 500 kHz): the largest peaks
ε/
ε0, the smallest temperature hysteresis at temperatures below the Curie temperature (T
c), and its absence above T
c is characteristic precisely for ceramics prepared at this T
sint. (
Figure 2a).
Figure 2b shows the dielectric spectra of the studied SS, which also demonstrate the best quality of the samples at this temperature.
Figure 3 shows the phase diagram of the system in which: in the interval 0.0 ≤
x < 0.2 there are SS with R structure of BaNb
2O
6-R phase; at 0.05 ≤
x ≤ 0.15, the R phase and the SS with the tetragonal—tungsten bronze (TTB) structure are coexist, marked by us as the T phase and formed in the interval 0.1 ≤
x ≤ 0.8; at 0.7 ≤
x ≤ 0.8 the T phase and the SS with a monoclinic structure SrNb
2O
6-M phase are coexist; at 0.8 <
x ≤ 1.0 there is an M phase.
Table 1 shows the symmetry and cell parameters of SS Ba
1−xSr
xNb
3O
6 [
10].
It can be seen that near the SS on the basis of BaNb2O6 and SrNb2O6, the parameters and the cell volume practically do not change. In the interval 0.0 < x ≤ 0.1, the parameters a, b, and V of the R cell increase, despite the replacement of Ba+2 (R = 1.38 Å) with a smaller Sr+2 size (R = 1.20 Å).
This means that the latter is built in position A1 in quadrangular channels, where there is no barium. T phase is divided into two equal concentration areas: at 0.1 ≤ x ≤ 0.4 the change in structural parameters has a non-monotonic character, and at 0.4 ≤ x ≤ 0.7 the parameters decrease monotonically. In the first region, in accordance with the dependence V(x), at x = 0.1 ÷ 0.2, the filling of the positions A1 is decisive, at x = 0.2 ÷ 0.3—the substitution of Sr+2 → Ba+2 at positions A2 in pentagonal channels, and for x = 0.3 ÷ 0.4—re-filling positions A1.
In the second region, where the cell volume decreases monotonically, it is obvious that only Sr
+2 → Ba
+2 substitution occurs at positions A2 in pentagonal channels, which agrees with the results of the study of single crystals [
11]. In this work, crystals in the interval 0.32 ≤
x ≤ 0.82 were investigated and showed that in the interval
x ≈ 0.35 ÷ 0.45 the A1 positions are filled with strontium, respectively, from 66% to 72% and the substitution of Sr
+2 → Ba
+2 at positions A2.
At
x > 0.45, the amount of Sr in quadrangular channels does not change, and only the replacement of ions in pentagonal channels takes place. It is interesting to note that, according to Reference [
11], in the congruently melting SS, the amount of Sr and Ba in the pentagonal channels is almost identical. Thus, in BSN ceramics, as in single crystals [
11], as the concentration of Sr increases, the formation of the TTB structure proceeds in two stages: positions A1 and A2 (SS1) are filled in the interval
x = 0.1 ÷ 0.4, but within this interval the one or the other process prevails. At
x > 0.4, the filling of positions A1 stops and only the replacement of Sr
+2 → Ba
+2 takes place in positions A2 (SS2). Thus, near
x ~ 0.45, there is a configuration transition between two types of isomorphic SS (SS1 → SS2).
Figure 4 shows the
ε/
ε0(T) dependences of ceramics with
x = 0.2 ÷ 0.7 (Δ
x = 0.1) in the temperature-frequency range under consideration, obtained in the cooling mode. It can be seen that the
ε/
ε0(T) dependences are in accordance with the phase diagram of the system: increase of Sr content leads to an increase in the relaxation properties, accompanied by a large blurring and a shift towards room temperatures in the region of the ferroelectric-paraelectric phase transition, which correlates with Reference [
11]. Barium strontium niobate ceramics have a homogeneous, dense, practically non-porous microstructure (
Figure 5) from crystallites of size (5 ÷ 10) μm, which indicates a sufficiently high quality of the studied object.
As can be seen from
Figure 6, the
ε/
ε0(T) dependences of the BSN-50 ceramics considered as an example at T
m < T < T
d (T
d is the Burns temperature below which the polar nano-regions appear) is well approximated by the formula 1/
ε − 1/
εm = (T − T
m)
γ/C
1 (
γ is the smearing parameter of the PT,
εm and T
m are, respectively, the height and temperature of the maximum
ε/
ε0(T)), and T
m(
f) is the Fogel-Fulcher ratio
f =
f0 exp{E
a/[k·(T
m − T
f)]} (
f0 is the frequency of attempts to overcome the potential barrier E
a, k is the Boltzmann constant, and T
f is the Vogel-Fulcher temperature). The established high value of
γ ~ 1.99, the fulfillment of the Curie-Weiss law only at T ≥ T
d and the tendency to zero residual polarization only at T ~ T
d testify to the high degree of blurring of the FE-PF PT, and the anomalies on the
ε/
ε0(T), and tg
δ (T) in the vicinity of T
f = 355 K, most likely, about the transition of BSN-50 from the relaxor to the macrodomain state. The blurring of the FE → PE phase transition in the object is most likely due to fluctuations in the chemical composition over the volume of the material due to the disordered arrangement of the Ba and Sr atoms in the structure.
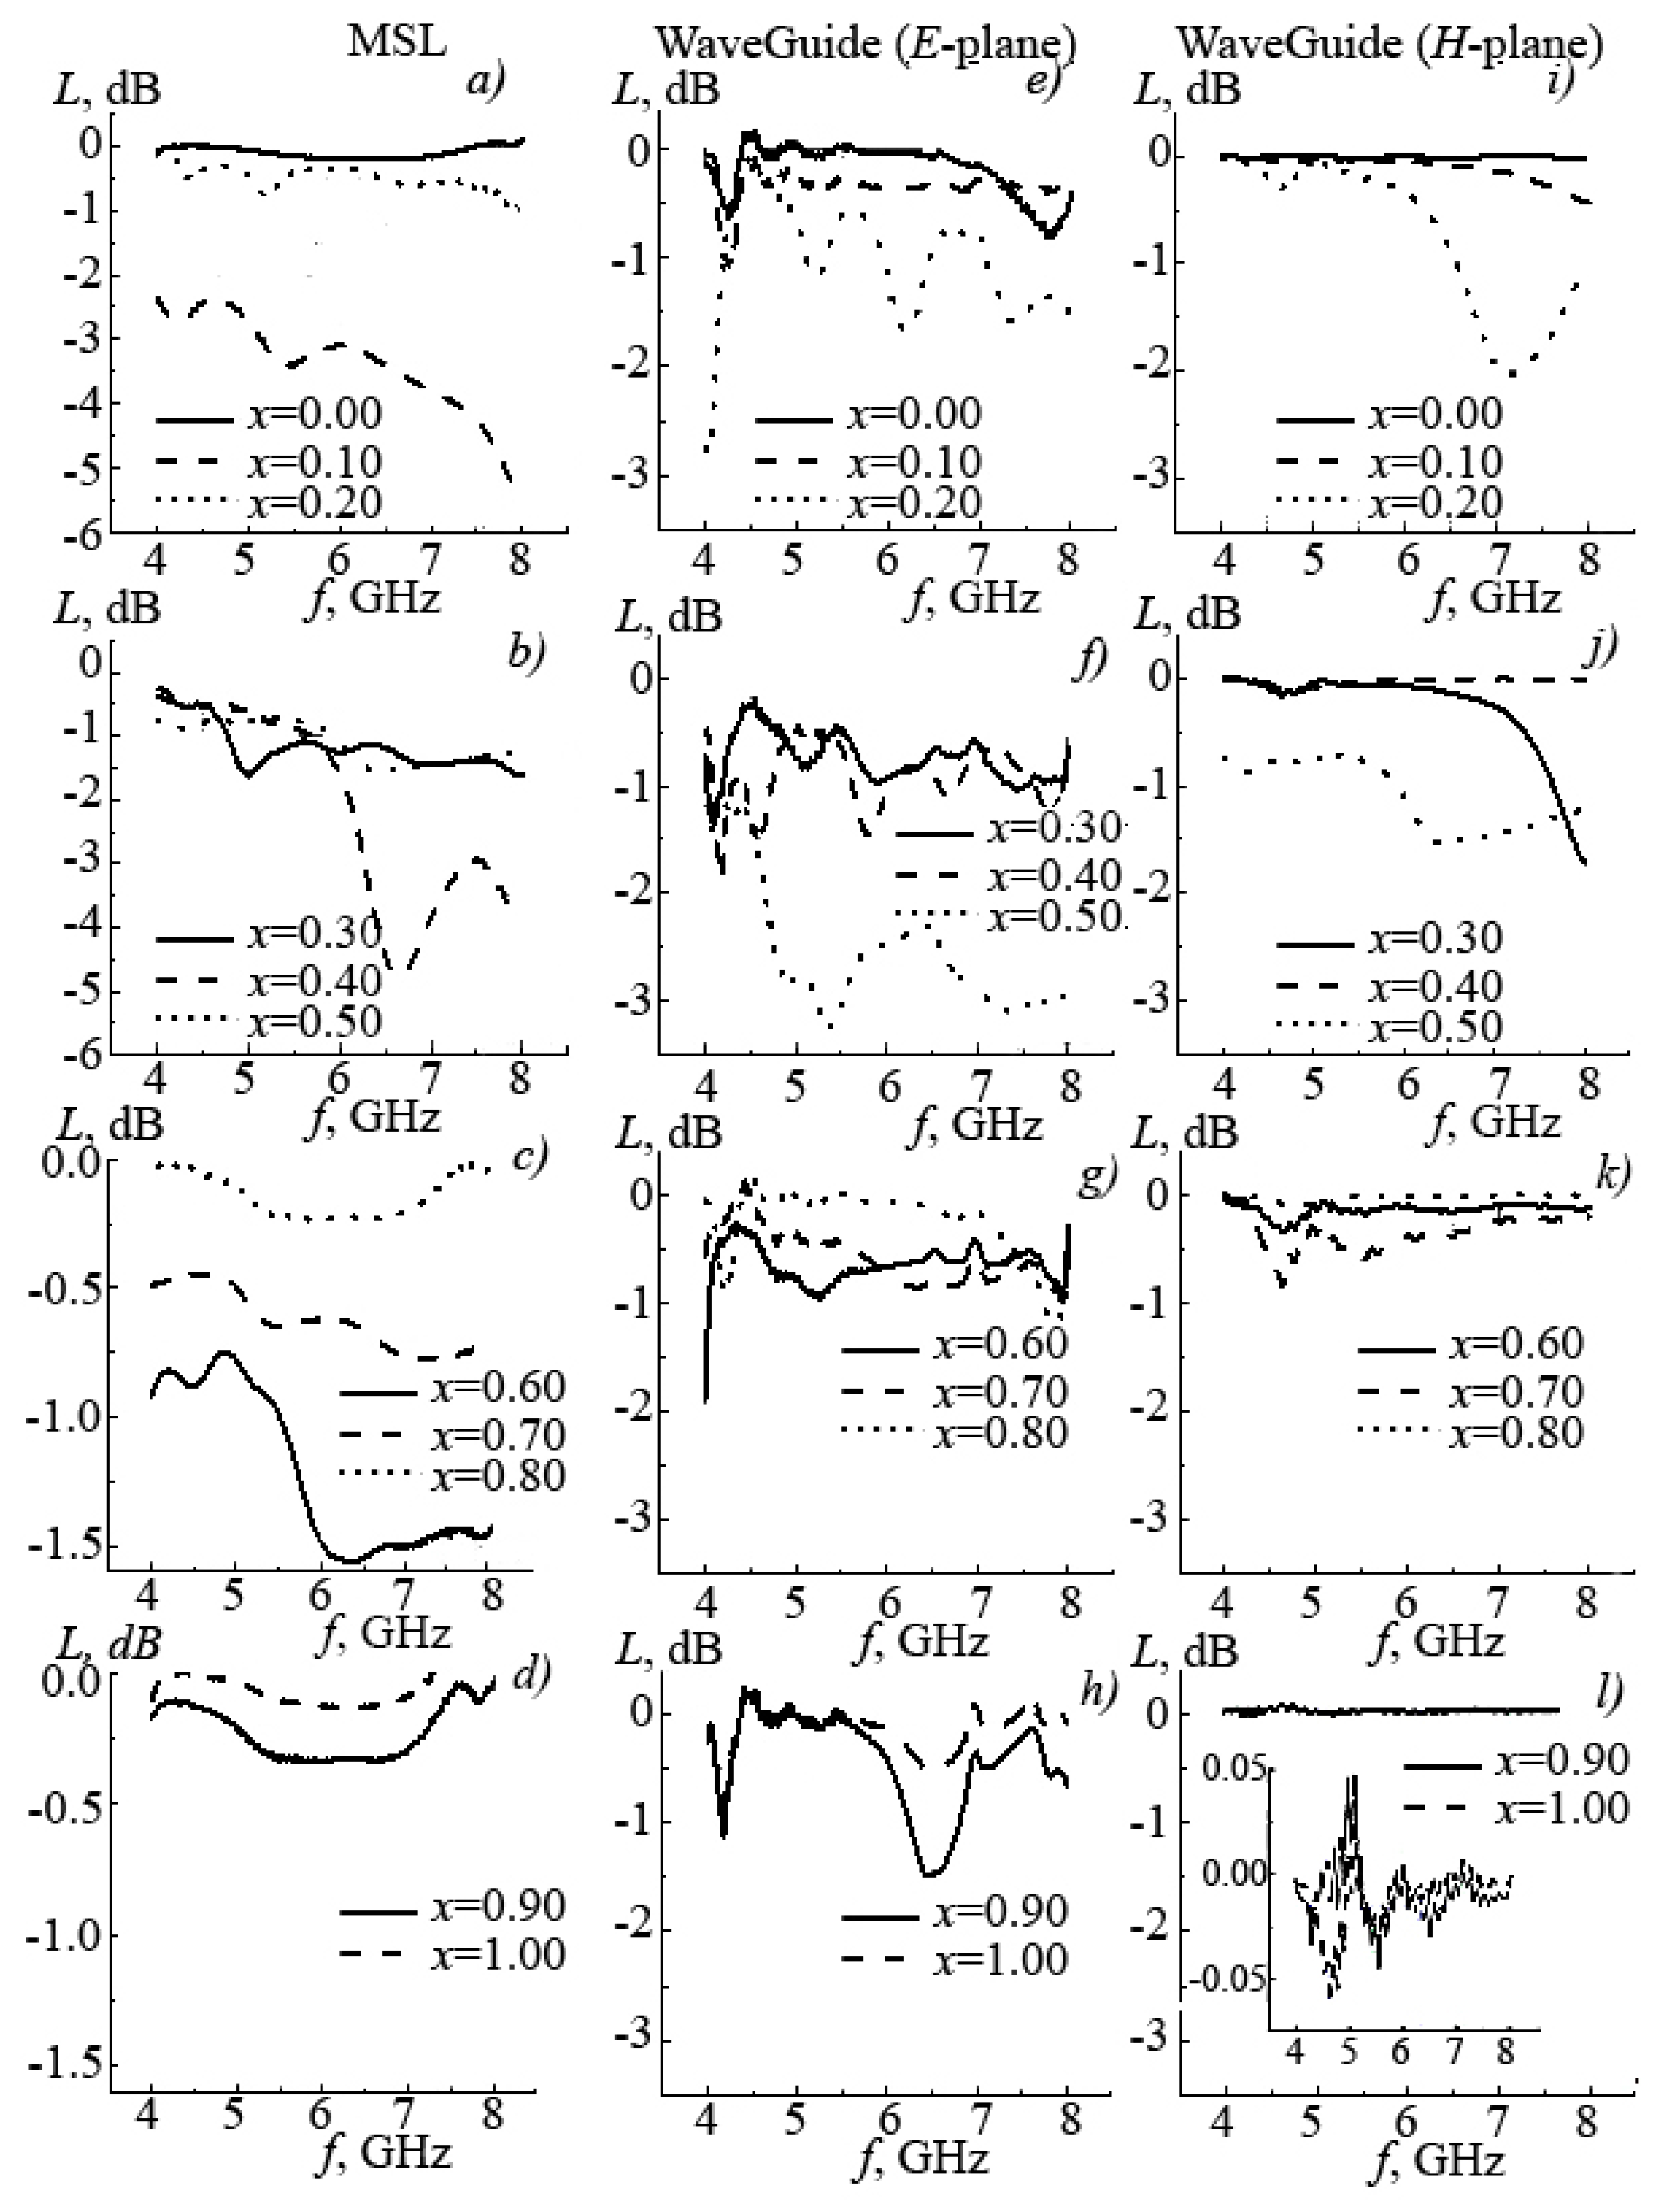
Figure 7 [
8] shows the absorption spectra of
L, the electromagnetic radiation energy of the SS BSN system obtained using two different techniques.
In the first method, the micro strip line (MSL) was used as a transmission line (
Figure 7a–d), in the second method, a rectangular waveguide (
Figure 7e–l). In both cases, the sample was placed in the region of the transmission line near the maximum concentration of the electric electromagnetic field. In this case, the sample was placed in two directions in the waveguide line: in the E-plane (
Figure 7e–h) and H-plane (
Figure 7i–l).
Analysis of the figures showed that studies using MSL are more promising, because of its greater sensitivity to the crystal-chemical state of the sample. This is due to a greater connection with the MSL both in the E- and H-field. Some discrepancies in the magnitude and nature of the change in L in measurements with the help of MSL and the waveguide line are due, to a certain extent, to differences in the distribution of the electromagnetic field in all three methods.
Figure 8 presents dependences of
L(
x) with superposition of the phase diagram of the system. As can be seen, the maximum absorption is realized in the vicinity of phase transitions of various nature, associated with the change in the types of SS and the formation of morphotropic regions, accompanied by the development of a defective situation due to rupture of chemical bonds, accumulation and ordering of defects, impurity phases, an increase in the number of interface boundaries, and as a consequence, the increase of dielectric losses.
4. Conclusions
The phase diagram of the system (1 − x)BaNb2O6-xSrNb2O6 (BSN) (0.0 ≤ x ≤ 1.0) with two morphotropic areas localized within the intervals of 0.05 ≤ x ≤ 0.15 and 0.70 ≤ x ≤ 0.80 and the configuration transition, where x ~ 0.45, was built up; the gradual formation of the structure of TTB was shown; the conformance of changes in dielectric characteristics of SS to the state diagram was established.
It was established that in SS system (1 − x)BaNb2O6-xSrNb2O6 the maximum absorption of super-high-frequency energy of electromagnetic radiation occurs in the area of structural instabilities of different nature (SS type changes formation of morphotropic areas), that is associated with the development of faulty situation in the respective media due to breaking of chemical bonds in case of structure rearrangement, accumulation, and ordering of vacancies, impurity phases, increasing in the number of interphase boundaries, and as a result, growth of dielectric losses.
In the studied ceramics BSN-50, it was shown that a smeared ferro-paraelectric transition to the relaxed ferroelectric state occurs within the temperature range of (340 ÷ 385) K; a sharp increase of ε′/ε0 and tgδ to paraelectric field is caused by the phenomena of electrical conductivity due to the niobium recovery, and as a result, the formation of anion vacancies.

 ,
, 


