Impact and Control of Reflected Noise from an Overpass Bottom


Abstract
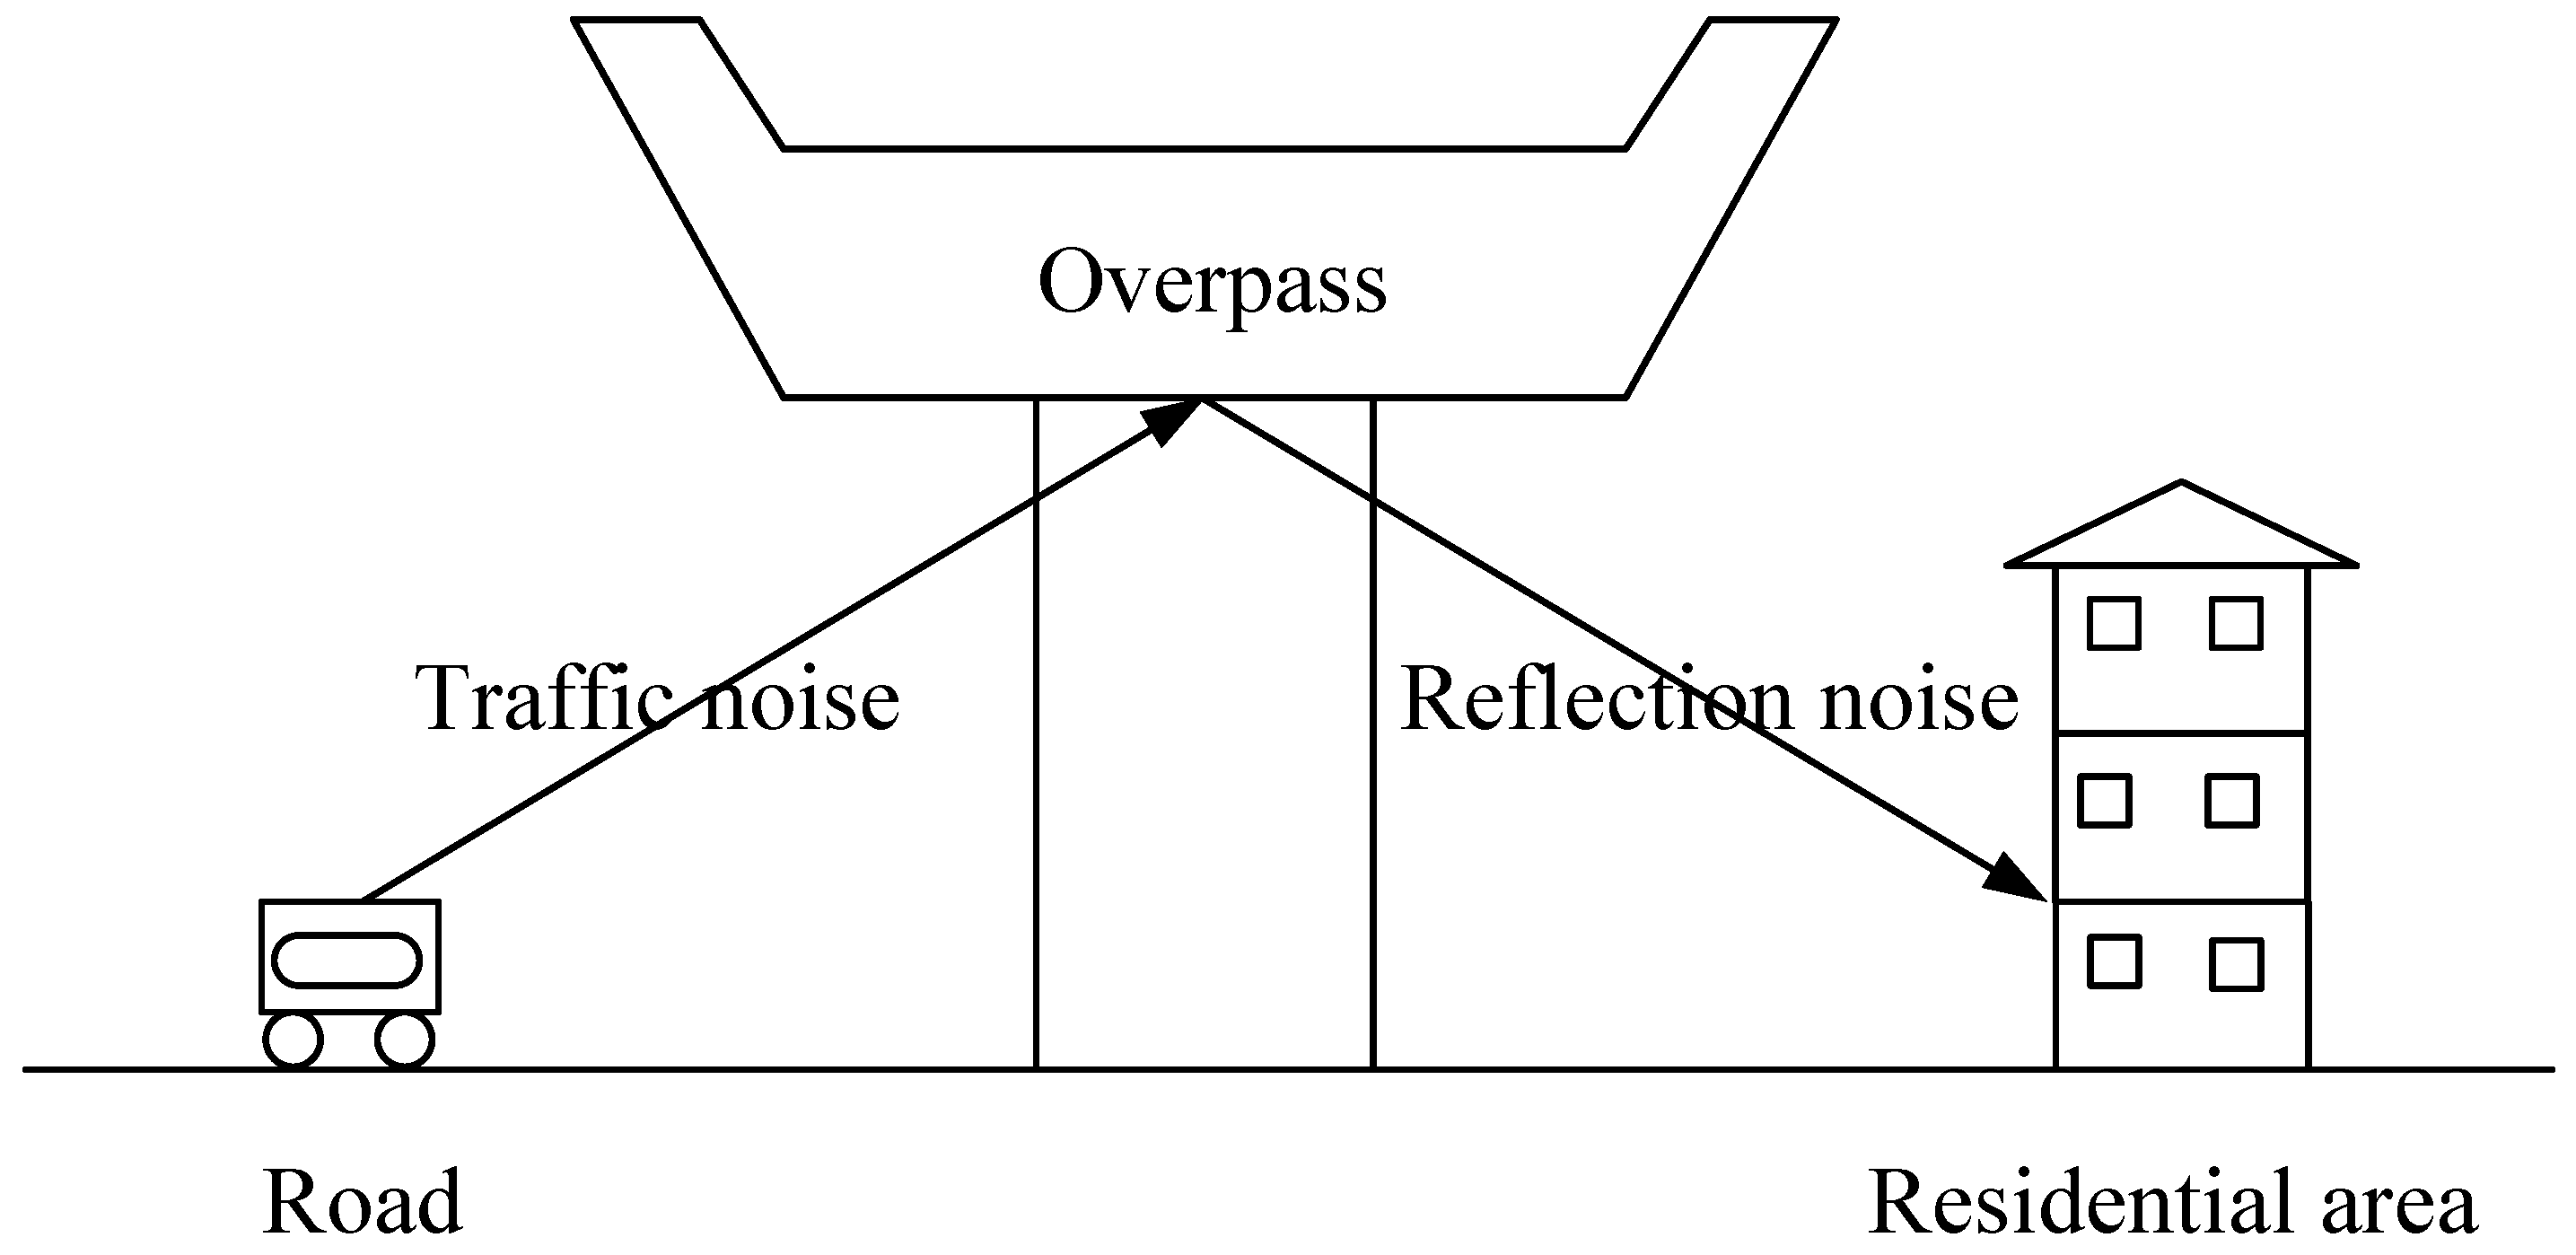
1. Introduction
2. Materials and Methods
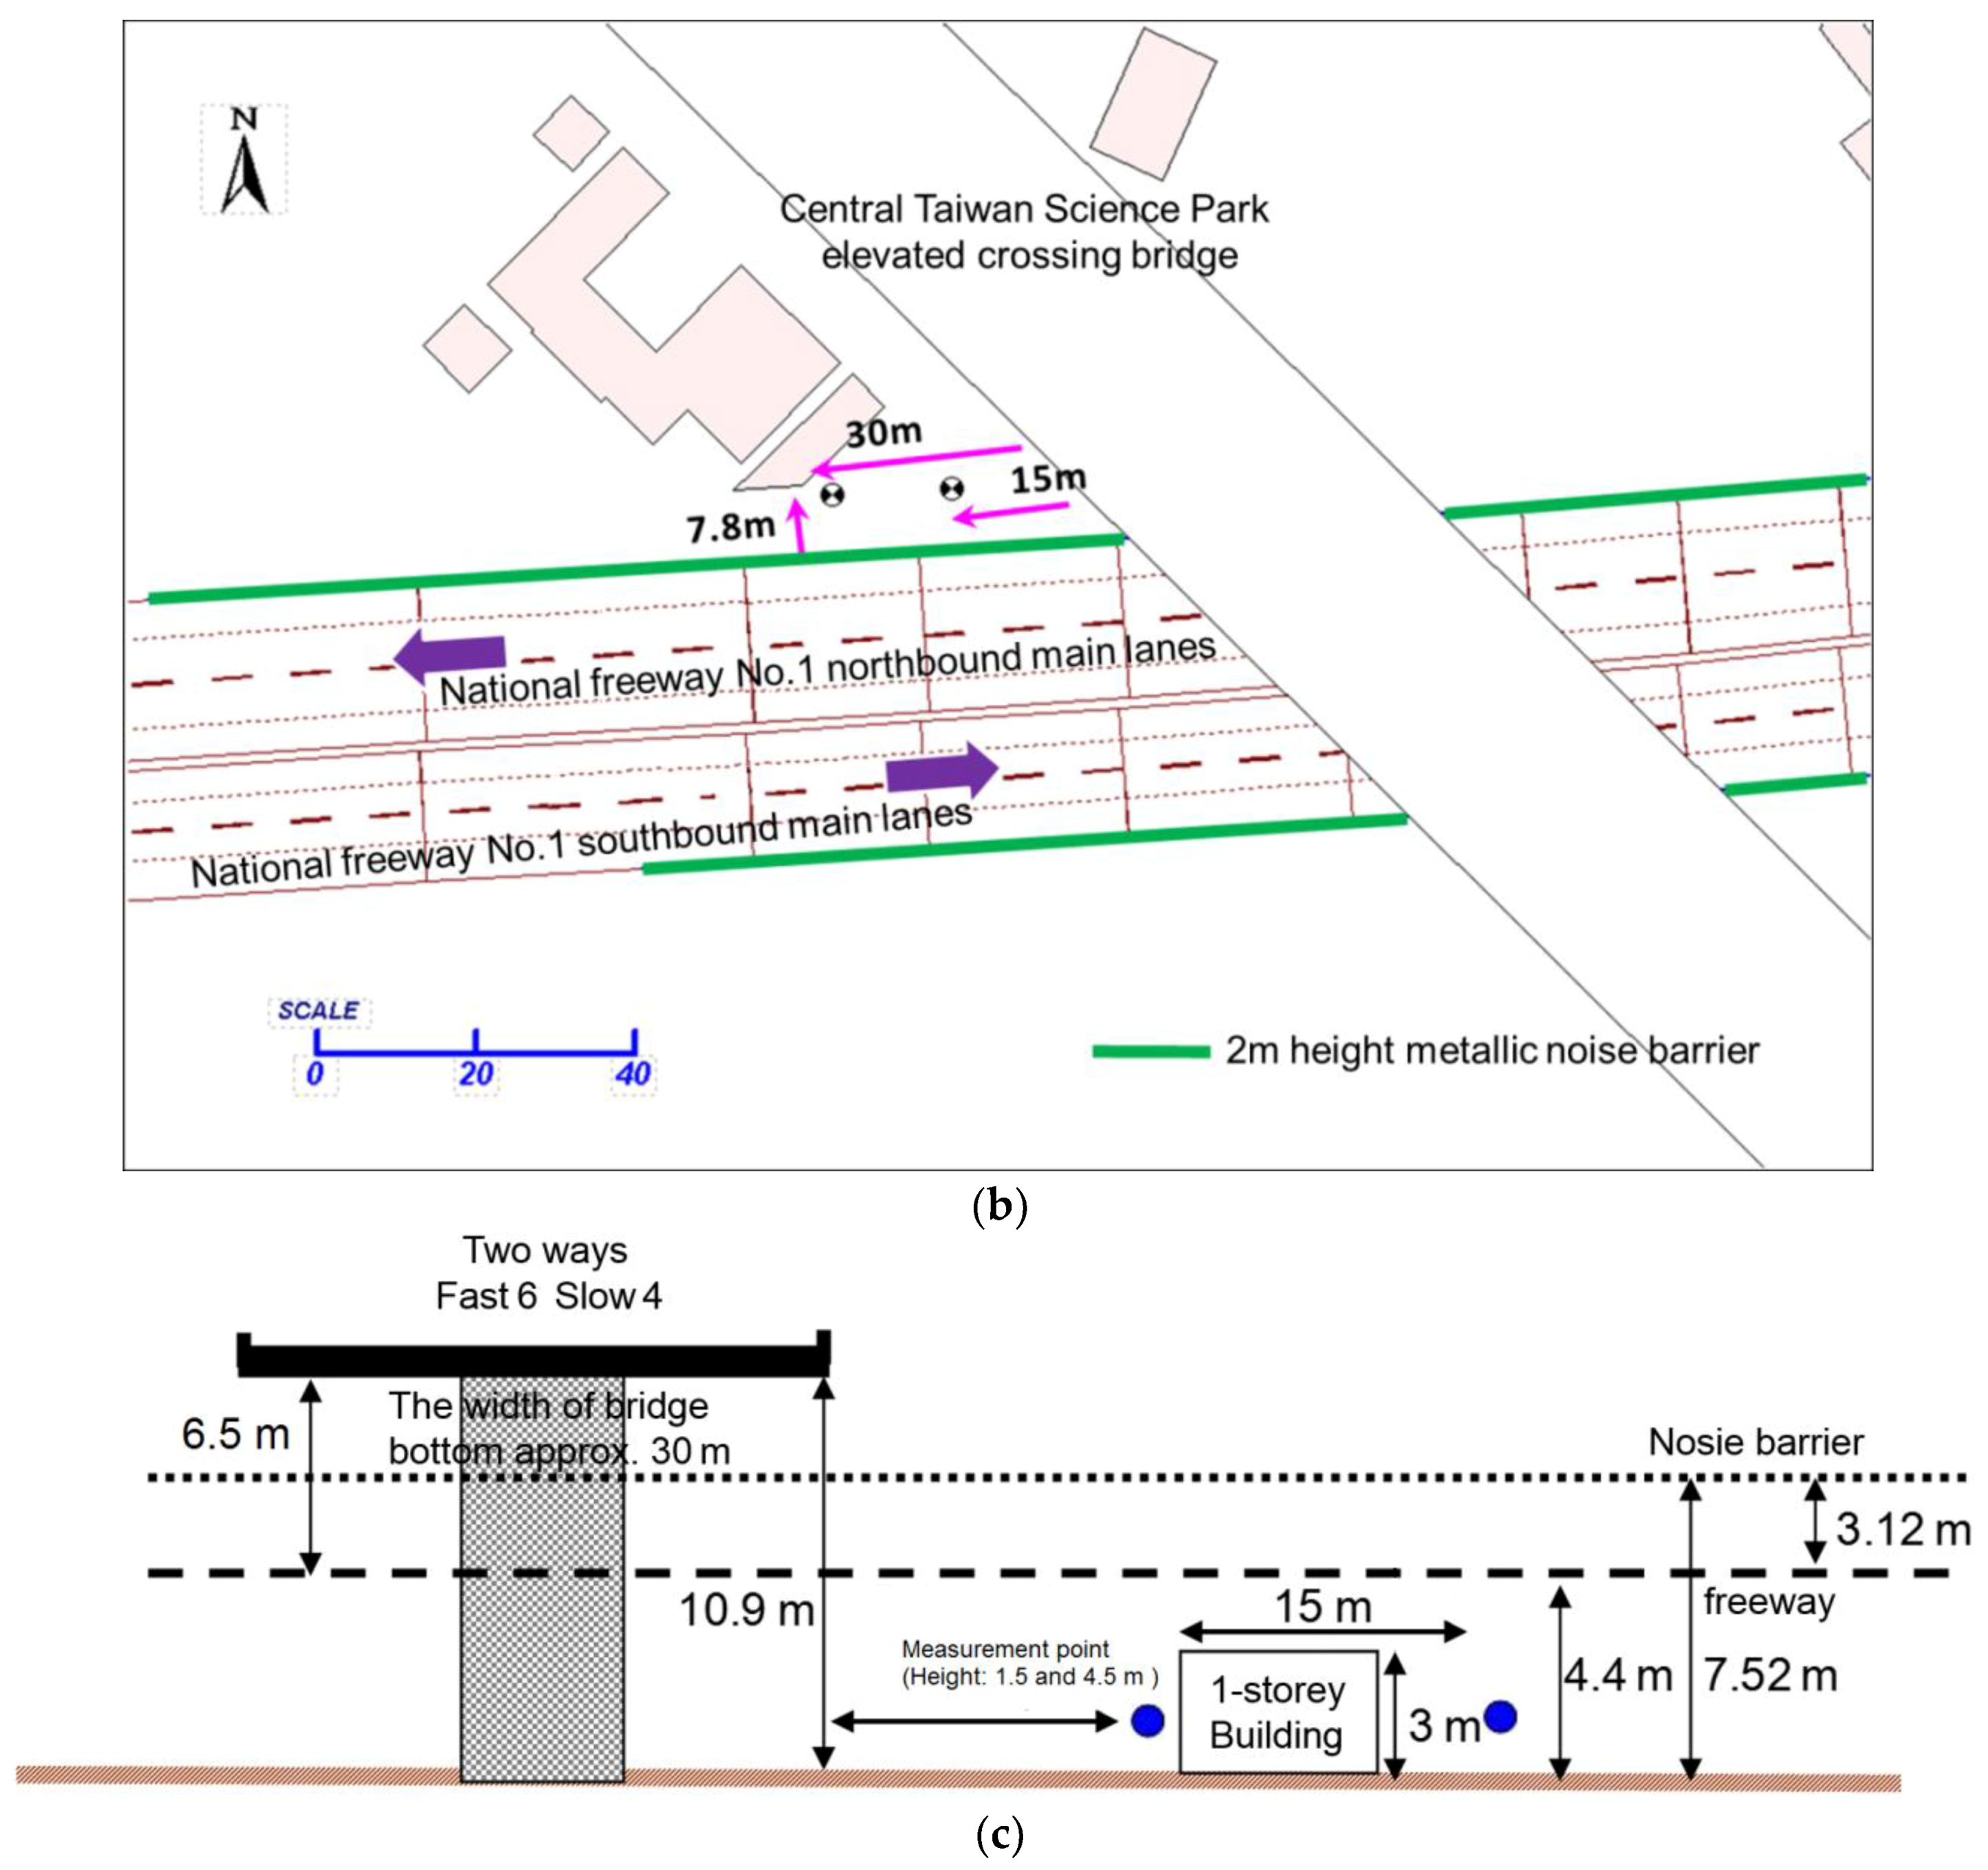
2.1. Measurement Methods and Investigation Sites
2.2. Different Overpass Bottom Materials
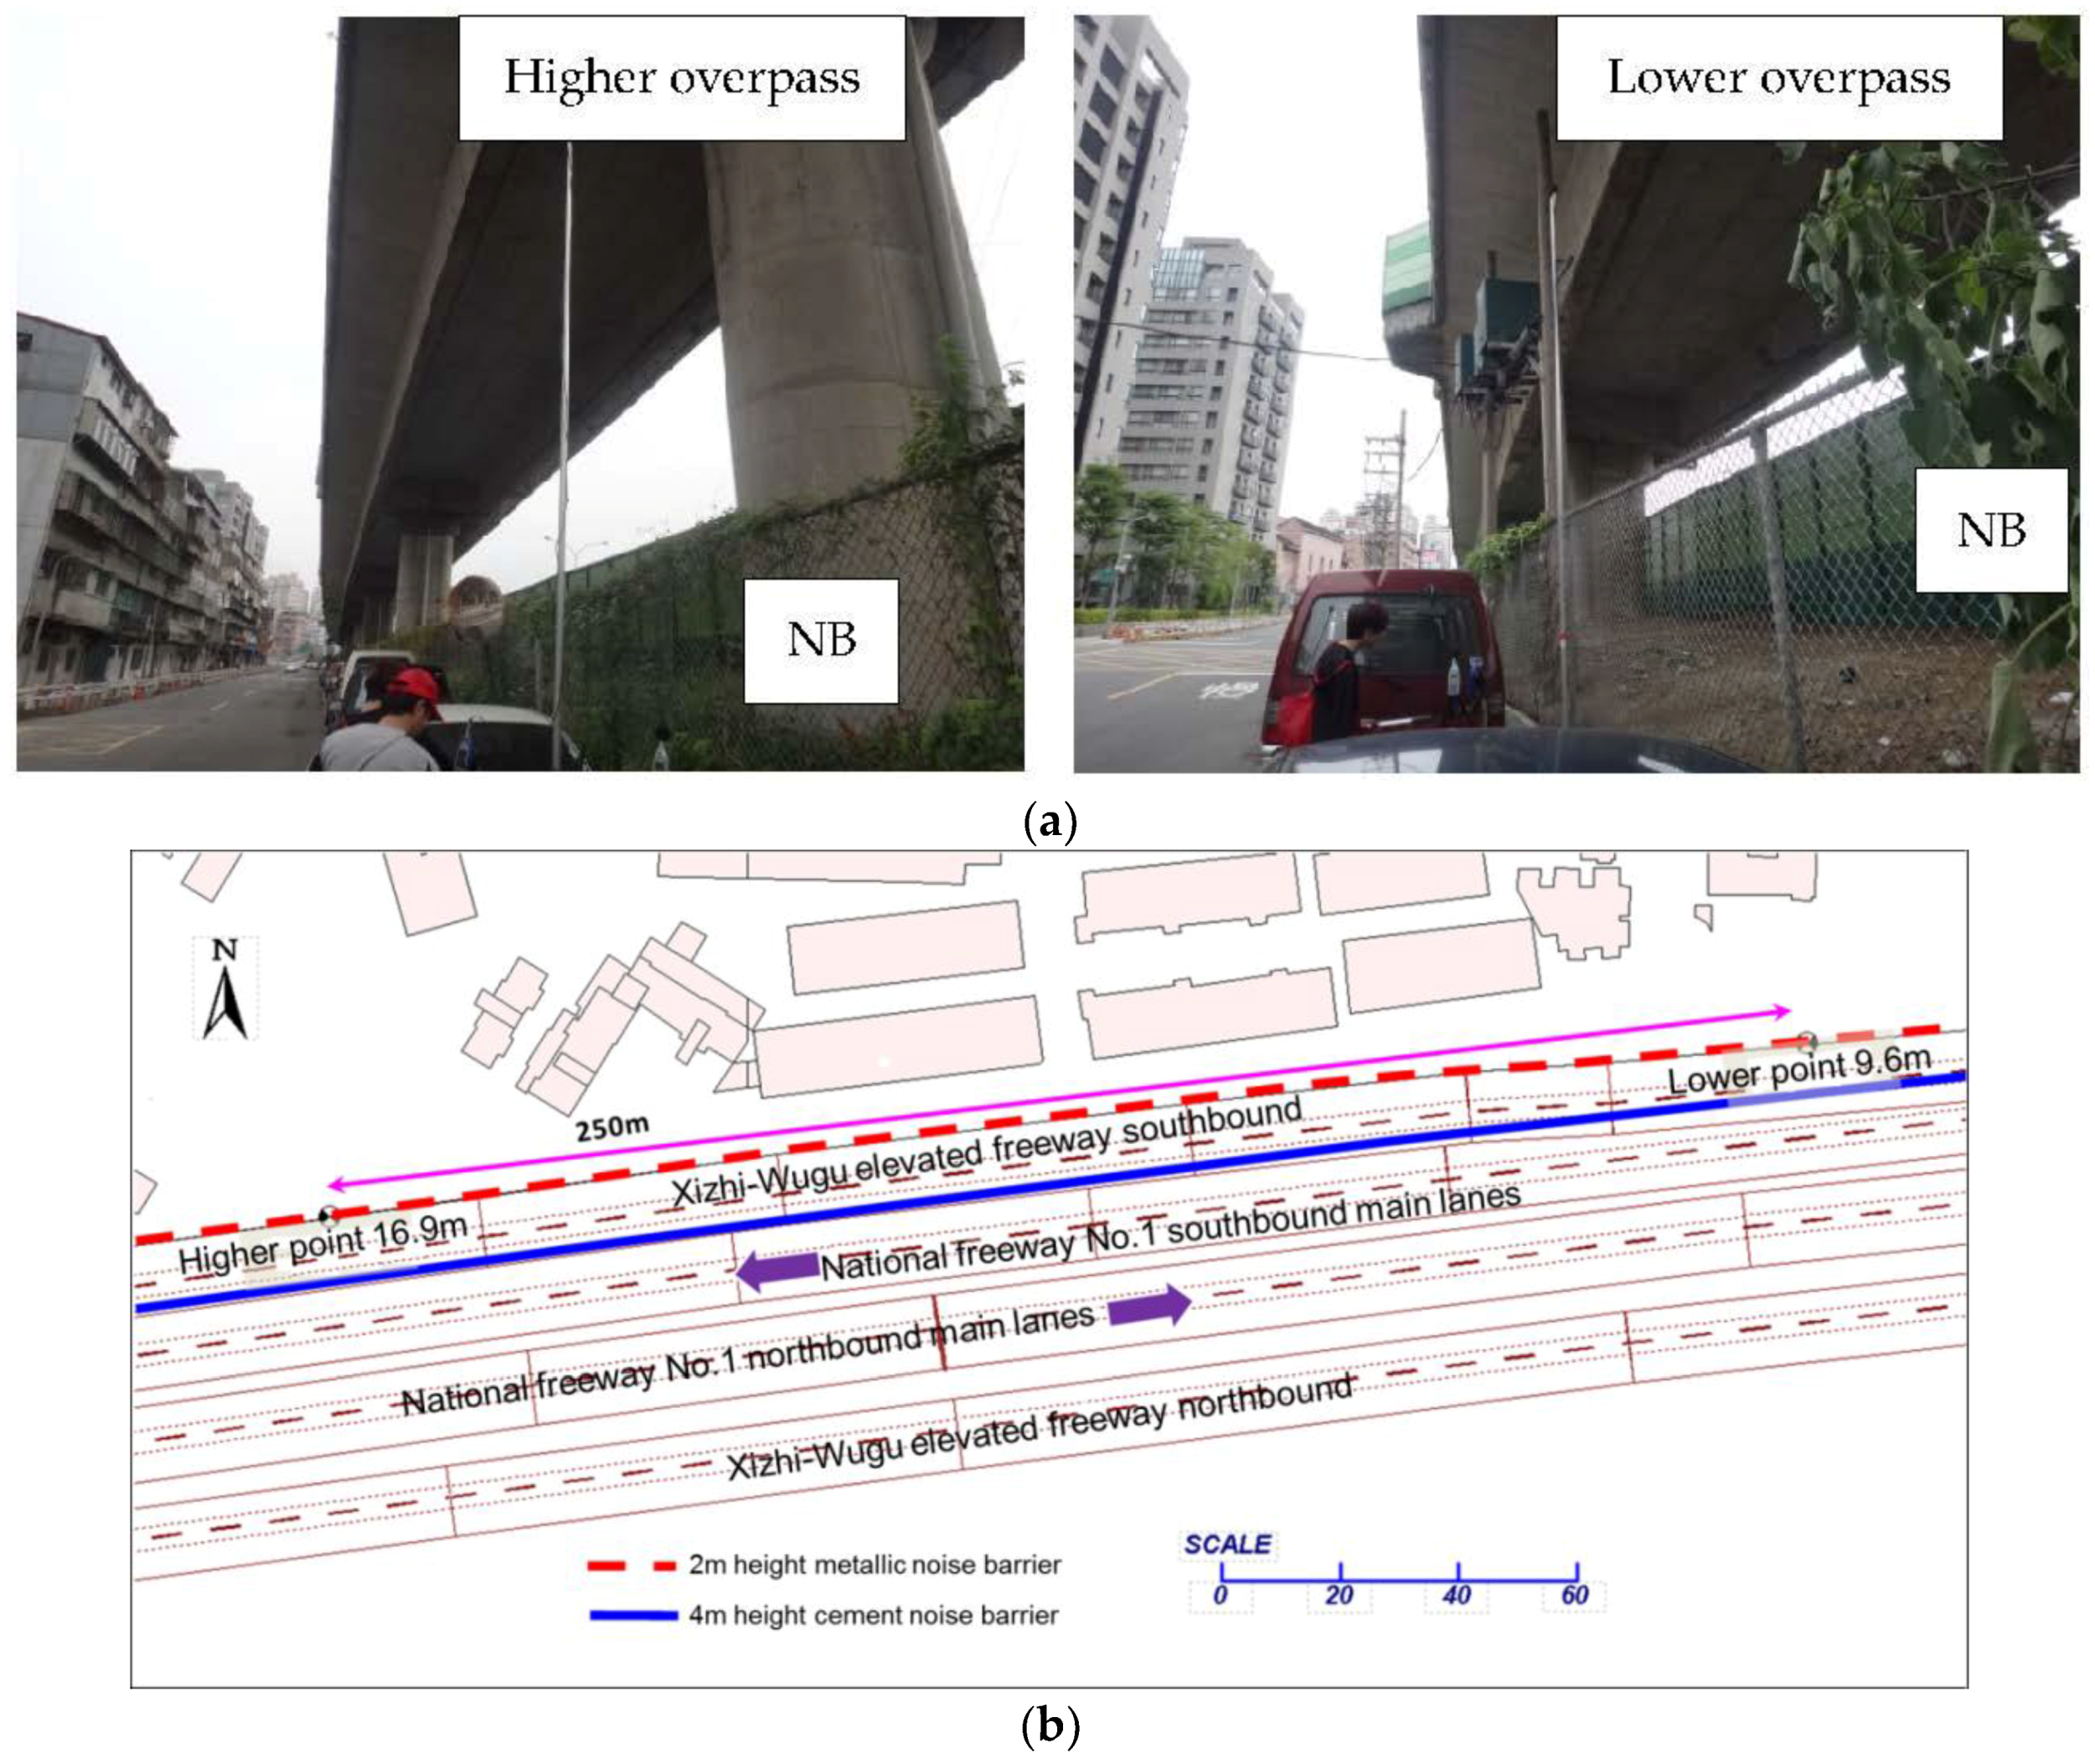
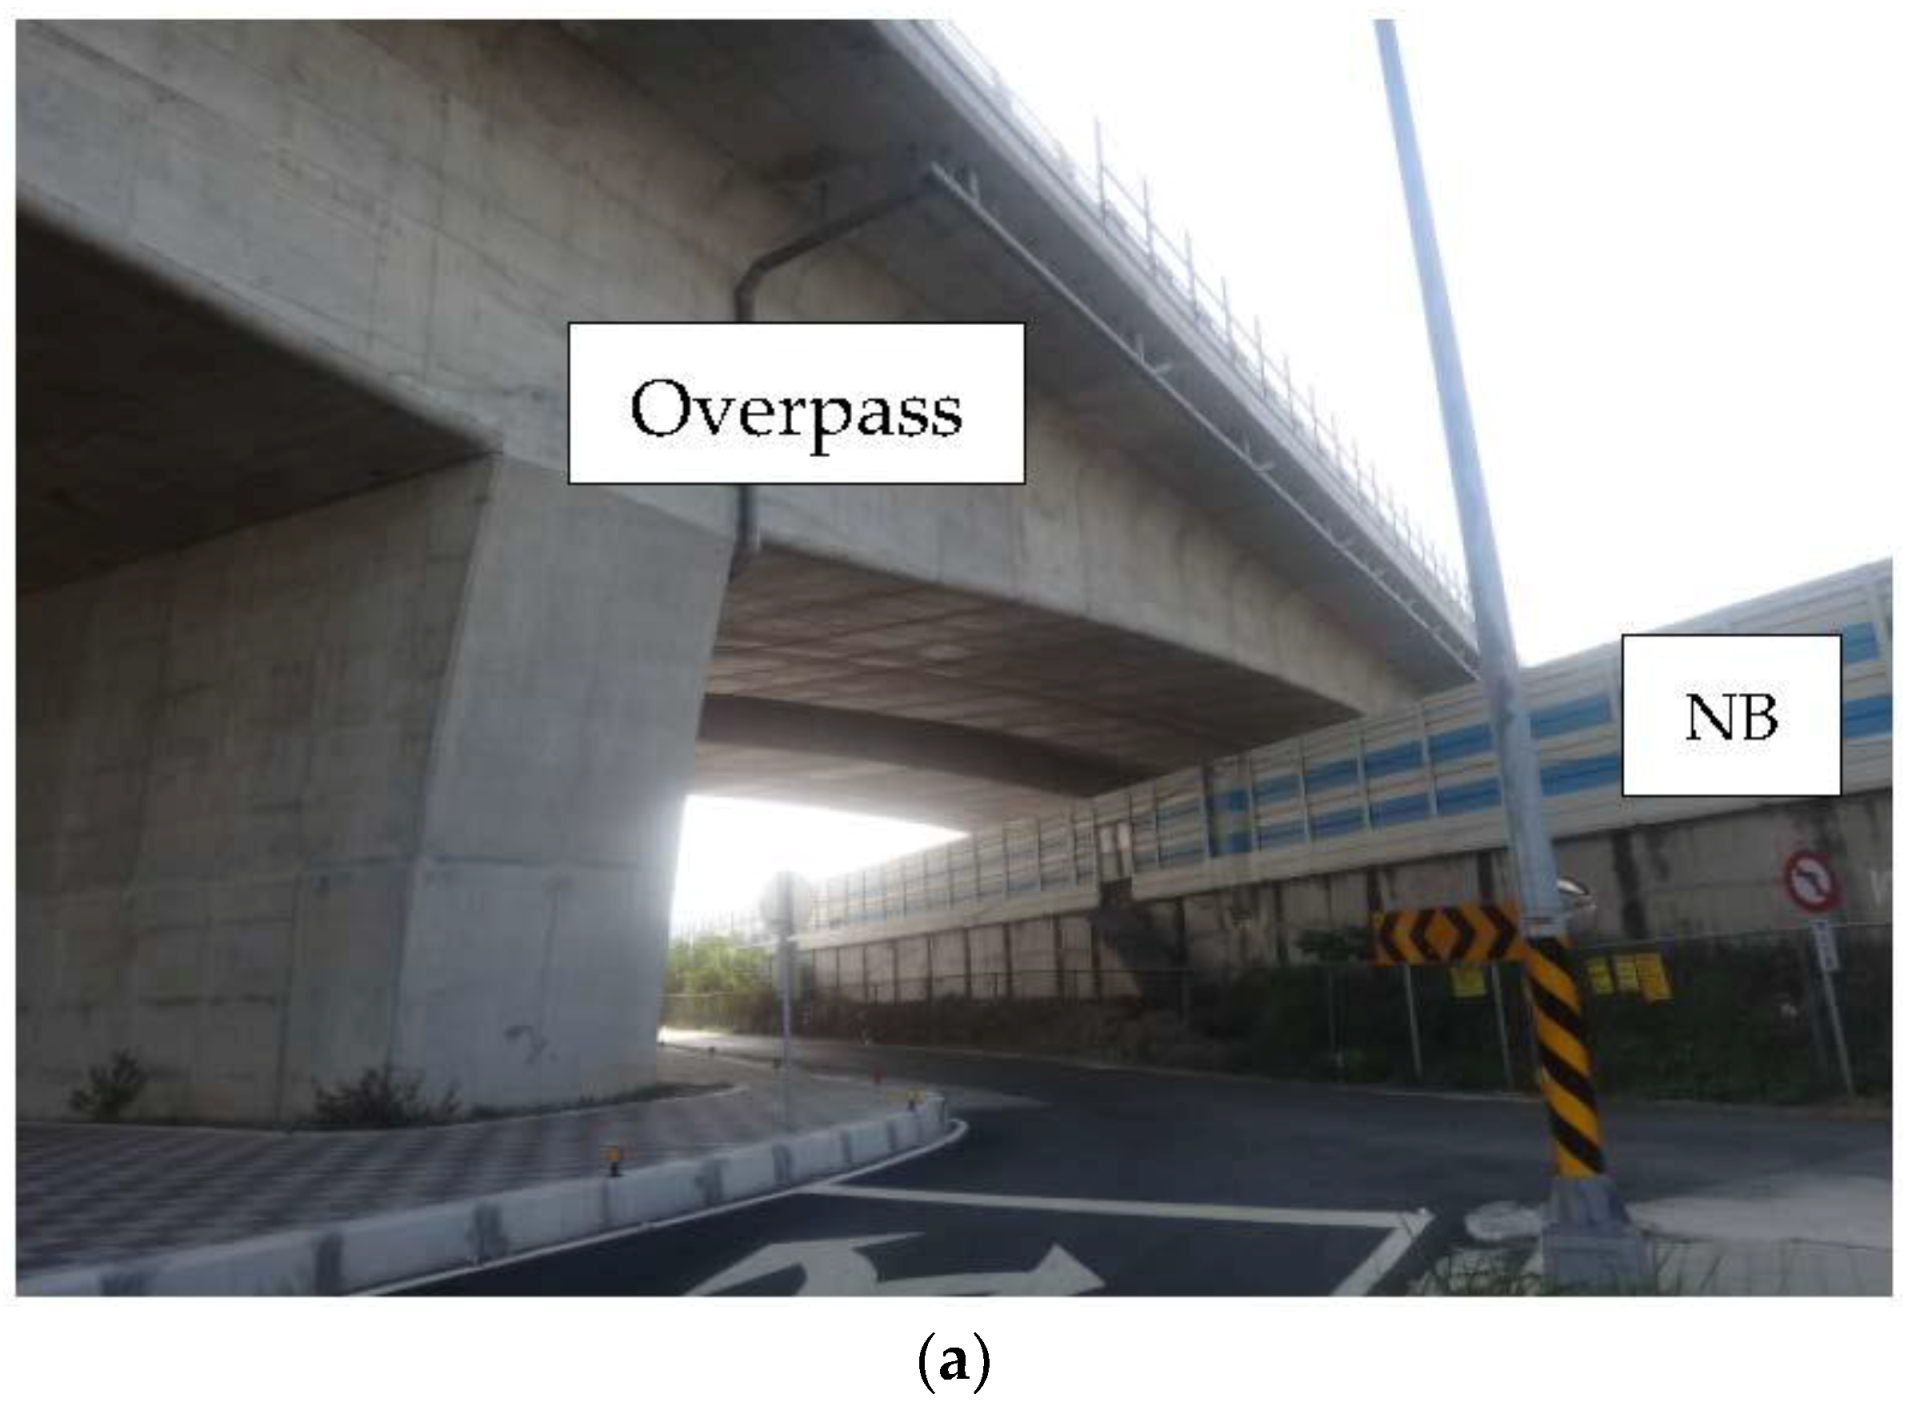
2.3. Different Overpass Heights
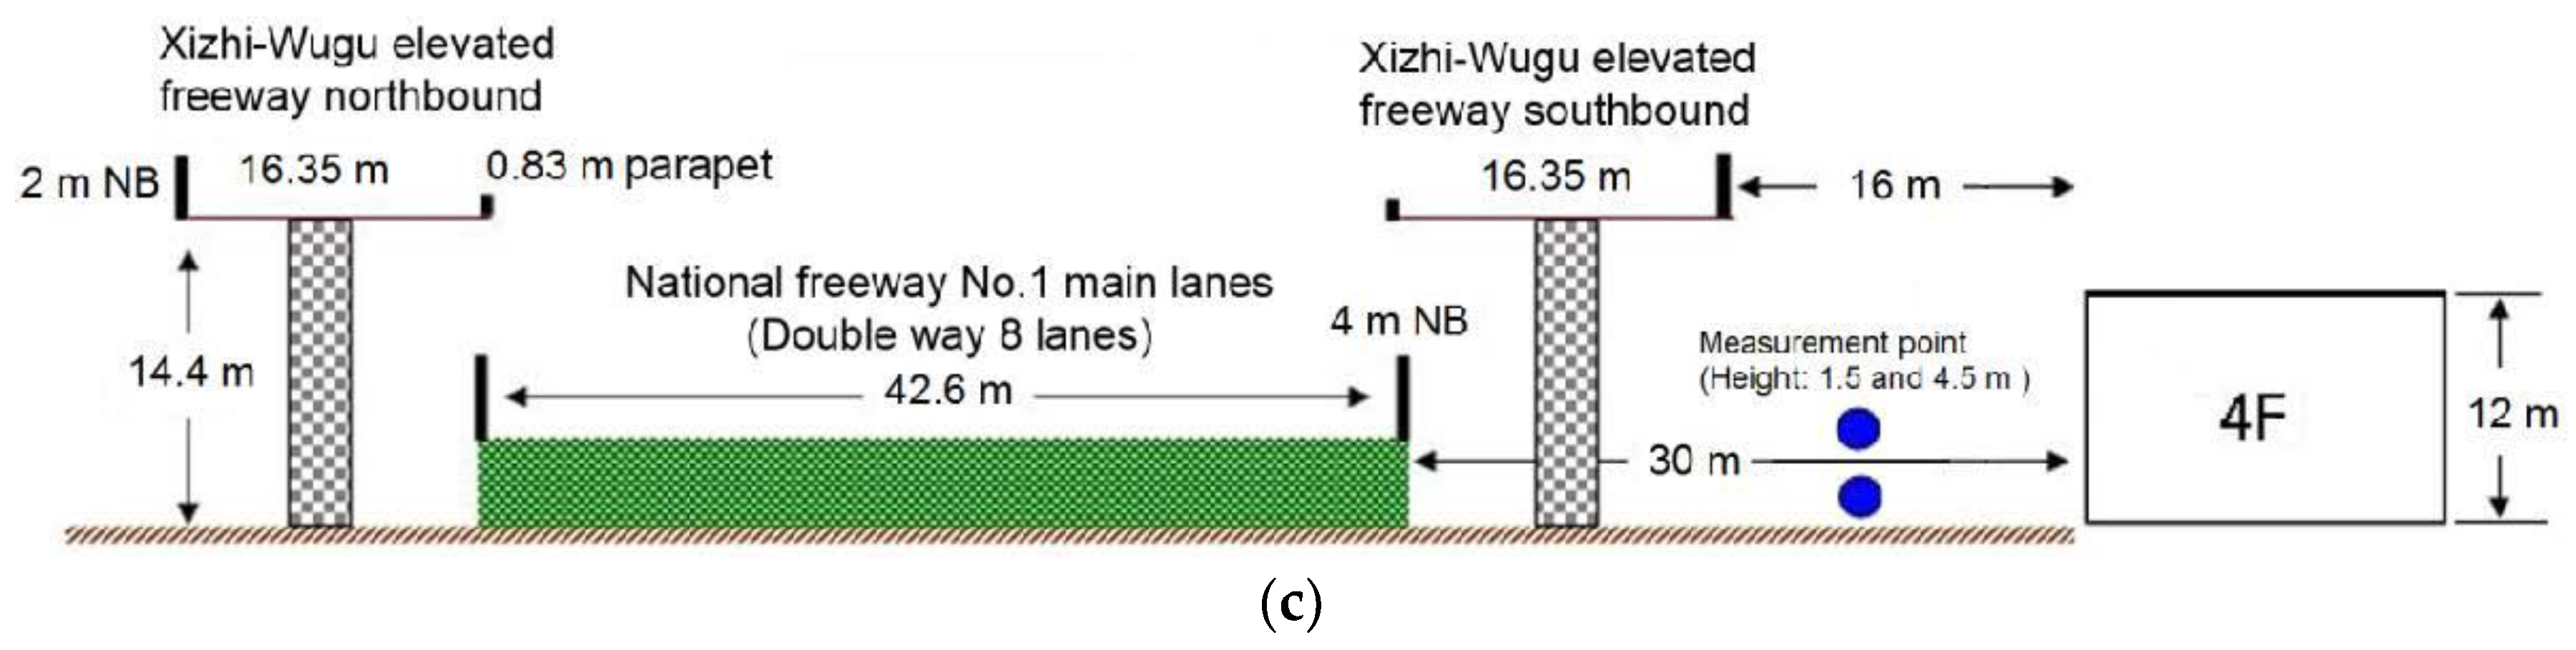
2.4. Different Road Structures (Overpass Going across the Noise Source Road)
2.5. Sound Field Simulation
- Twenty five meters horizontally from the centerline of the outer lane and 2.25 m vertically from the road surface;
- The road was paved with non-corrugated mastic asphalt;
- The maximum allowable speed is 100 km/h;
- The road longitudinal slope is less than 5%;
- The free sound propagation on a flat and straight road is a straight line.
3. Results and Discussion
3.1. Reflection Noise Analysis and Improvement Results with Different Overpass Bottom Materials (Steel and RC)
3.2. Reflected Noise Analysis and Improvement Results with Different Overpass Heights
3.3. Reflected Noise Analysis and Improvement Results for Different Road Structures (Overpass Going across the Noise Source Road)
4. Conclusions
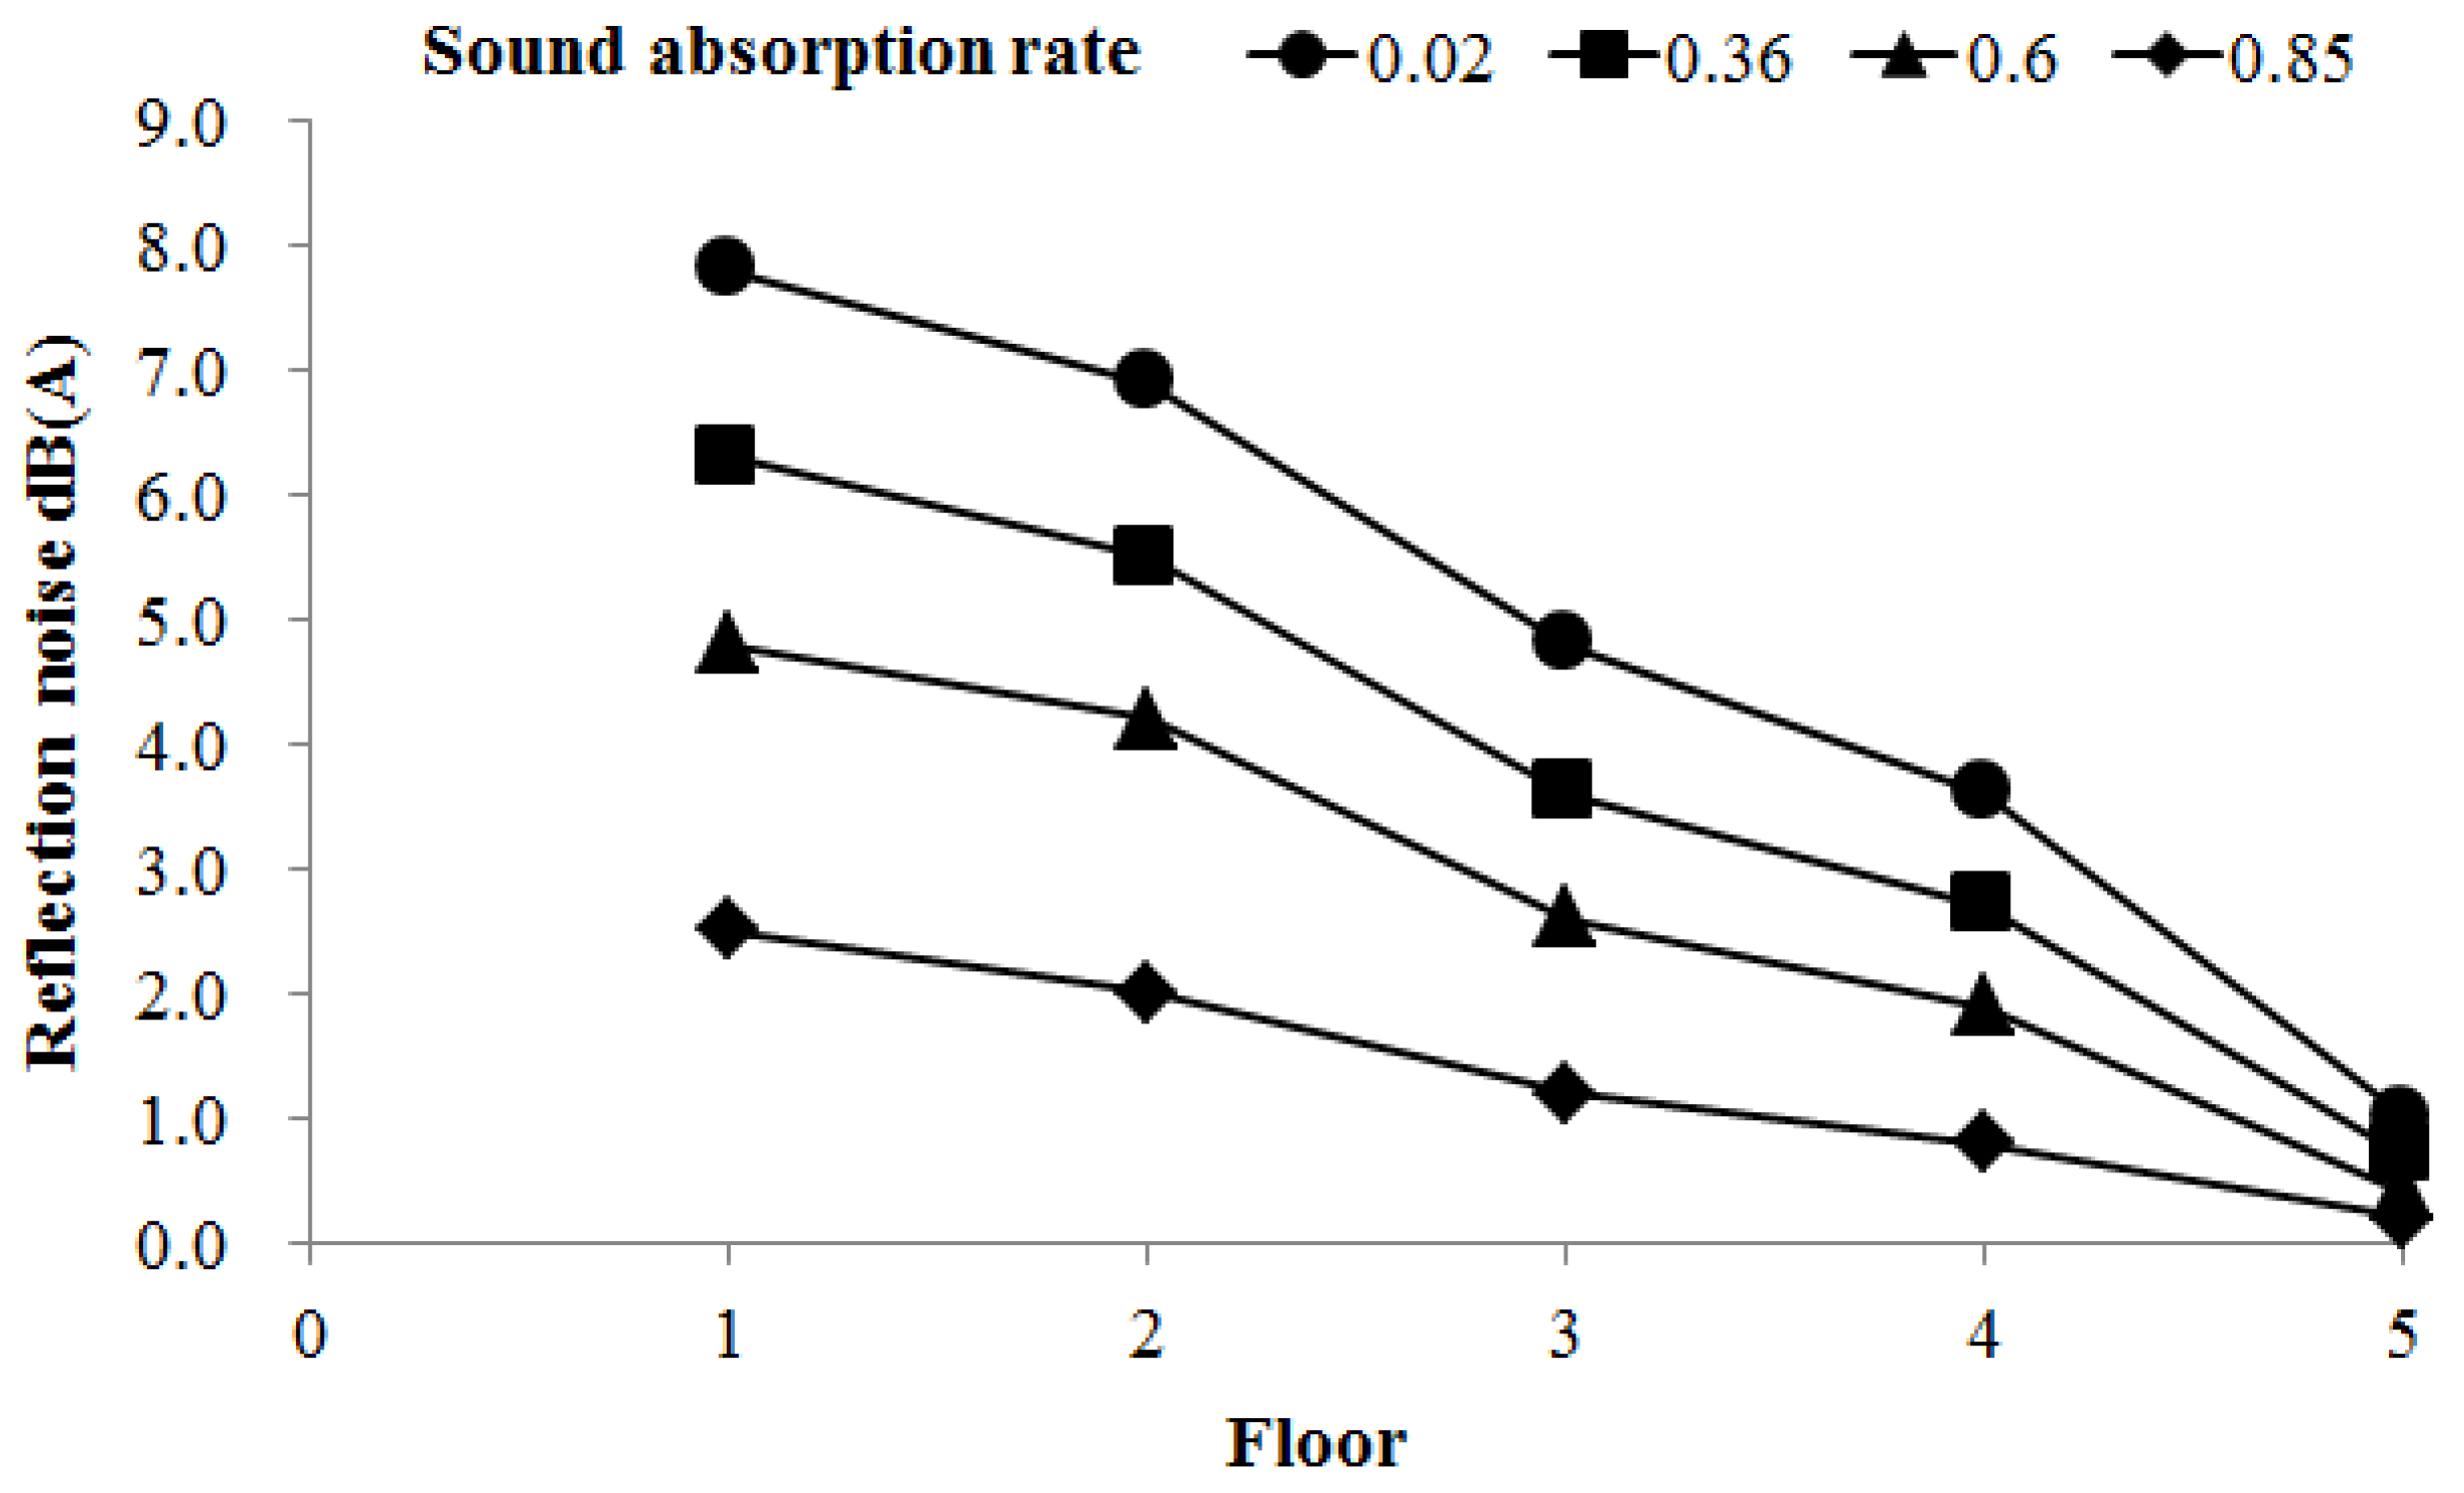
- Reflected noise from the bottom of an elevated road may be as high as 7.8 dB(A) and reflected noise increased the noise level on low floors more than on high floors.
- Overpass height had an effect on the reflected noise level. As overpass height increased, the level of reflected noise decreased.
- When the distance between the overpass side and a receiver exceeded 30 m, the level of reflected noise reduced significantly.
- As the sound absorption rate of the sound absorbing material installed on the overpass bottom increased, the noise reduction effect increased. A sound absorbing material with a sound absorption rate of at least 0.60 is recommended to reduce reflected noise level.
- By installing sound absorbing materials on the overpass bottom and providing an adequate green space buffer zone (distance between a residential area and an overpass), namely, adopting the approach of “distance attenuation + control of propagation path”, the impact of reflection noises on nearby residents will be further reduced.
- At all three investigation sites, reflected noise crossed over acoustic barriers, such that a feasible method to reduce reflected noise is to increase the height of acoustic barriers on both sides of the freeway.
Supplementary Materials
Author Contributions
Funding
Acknowledgments
Conflicts of Interest
References
- Morley, D.W.; de Hoogh, K.; Fecht, D.; Fabbri, F.; Bell, M.; Goodman, P.S.; Elliott, P.; Hodgson, S.; Hansell, A.L.; Gulliver, J. International scale implementation of the CNOSSOSEU road traffic noise prediction model for epidemiological studies. Environ. Pollut. 2015, 206, 332–341. [Google Scholar] [CrossRef] [PubMed]
- Ruiz-Padillo, A.; Ruiz, D.P.; Torija, A.J.; Ramos-Ridao, Á. Selection of suitable alternatives to reduce the environmental impact of road traffic noise using a fuzzy multi-criteria decision model. Environ. Impact Assess. Rev. 2016, 61, 8–18. [Google Scholar] [CrossRef]
- Licitra, G.; Fredianelli, L.; Petri, D.; Vigotti, M.A. Annoyance evaluation due to overall railway noise and vibration in Pisa urban areas. Sci. Total Environ. 2016, 568, 1315–1325. [Google Scholar] [CrossRef] [PubMed]
- Bunn, F.; Zannin, P.H.T. Assessment of railway noise in an urban setting. Appl. Acoust. 2016, 104, 16–23. [Google Scholar] [CrossRef]
- Gagliardi, P.; Fredianelli, L.; Simonetti, D.; Licitra, G. ADS-B system as a useful tool for testing and redrawing noise management strategies at Pisa Airport. Acta Acust. United Acust. 2017, 103, 543–551. [Google Scholar] [CrossRef]
- Iglesias-Merchan, C.; Diaz-Balteiro, L.; Soliño, M. Transportation planning and quiet natural areas preservation: Aircraft overflights noise assessment in a National Park. Transp. Res. Part D Transp. Environ. 2005, 41, 1–12. [Google Scholar] [CrossRef]
- Fredianelli, L.; Gallo, P.; Licitra, G.; Carpita, S. Analytical assessment of wind turbine noise impact at receiver by means of residual noise determination without the wind farm shutdown. Noise Control Eng. J. 2017, 65, 417–433. [Google Scholar] [CrossRef]
- Michaud, D.S.; Feder, K.; Keith, S.E.; Voicescu, S.A.; Marro, L.; Than, J.; Guay, M.; Denning, A.; McGuire, D.; Bower, T.; et al. Exposure to wind turbine noise: Perceptual responses and reported health effects. J. Acoust. Soc. Am. 2016, 139, 1443–1454. [Google Scholar] [CrossRef] [PubMed]
- Muzet, A. Environmental noise, sleep and health. Sleep Med. Rev. 2007, 11, 135–142. [Google Scholar] [CrossRef] [PubMed]
- Hygge, S.; Evans, G.W.; Bullinger, M. A prospective study of some effects of aircraft noise on cognitive performance in schoolchildren. Psychol. Sci. 2002, 13, 469–474. [Google Scholar] [CrossRef] [PubMed]
- Lercher, P.; Evans, G.W.; Meis, M. Ambient noise and cognitive processes among primary schoolchildren. Environ. Behav. 2003, 35, 725–735. [Google Scholar] [CrossRef]
- Chetoni, M.; Ascari, E.; Bianco, F.; Fredianelli, L.; Licitra, G.; Cori, L. Global noise score indicator for classroom evaluation of acoustic performances in LIFE GIOCONDA project. Noise Mapp. 2016, 3, 157–171. [Google Scholar] [CrossRef]
- Dratva, J.; Phuleria, H.C.; Foraster, M.; Gaspoz, J.M.; Keidel, D.; Künzli, N.; Liu, L.J.; Pons, M.; Zemp, E.; Gerbase, M.W.; et al. Transportation noise and blood pressure in a population-based sample of adults. Environ. Health Perspect. 2012, 120, 50–55. [Google Scholar] [CrossRef] [PubMed]
- Babisch, W.; Beule, B.; Schust, M.; Kersten, N.; Ising, H. Traffic noise and risk of myocardial infarction. Epidemiology 2005, 16, 33–40. [Google Scholar] [CrossRef] [PubMed]
- Babisch, W.; Swart, W.; Houthuijs, D.; Selander, J.; Bluhm, G.; Pershagen, G.; Dimakopoulou, K.; Haralabidis, A.S.; Katsouyanni, K.; Davou, E.; et al. Exposure modifiers of the relationships of transportation noise with high blood pressure and noise annoyance. J. Acoust. Soc. Am. 2012, 132, 3788–3808. [Google Scholar] [CrossRef] [PubMed]
- Miedema, H.M.; Oudshoorn, C.G. Annoyance from transportation noise: Relationships with exposure metrics DNL and DENL and their confidence intervals. Environ. Health Perspect. 2001, 109, 409–416. [Google Scholar] [CrossRef] [PubMed]
- Fredianelli, L.; Carpita, S.; Licitra, G. A procedure for deriving wind turbine noise limits by taking into account annoyance. Sci. Total Environ. 2018, 648, 728–736. [Google Scholar] [CrossRef] [PubMed]
- Winroth, J.; Kropp, W.; Hoever, C.; Beckenbauer, T.; Männel, M. Investigating generation mechanisms of tyre/road noise by speed exponent analysis. Appl. Acoust. 2017, 115, 101–108. [Google Scholar] [CrossRef]
- Licitra, G.; Ascari, E.; Fredianelli, L. Prioritizing process in action plans: A review of approaches. Curr. Pollut. Rep. 2017, 3, 151–161. [Google Scholar] [CrossRef]
- D’Alessandro, F.; Schiavoni, S. A review and comparative analysis of European priority indices for noise action plans. Sci. Total Environ. 2015, 518, 290–301. [Google Scholar] [CrossRef] [PubMed]
- Licitra, G.; Teti, L.; Cerchiai, M. A modified Close Proximity method to evaluate the time trends of road pavements acoustical performances. Appl. Acoust. 2014, 76, 167–179. [Google Scholar] [CrossRef]
- Knabben, R.M.; Trichês, G.; Gerges, S.N.Y.; Vergara, E.F. Evaluation of sound absorption capacity of asphalt mixtures. Appl. Acoust. 2016, 114, 266–274. [Google Scholar] [CrossRef]
- Sagartzazu, X.; Hervella-Nieto, L.; Pagalday, J.M. Review in sound absorbing materials. Arch. Comput. Methods Eng. 2008, 15, 311–342. [Google Scholar] [CrossRef]
- Cao, L.; Qiuxia, F.; Si, Y.; Ding, B.; Yu, J. Porous materials for sound absorption. Compos. Commun. 2018, 10, 25–35. [Google Scholar]
- Huang, Y.; Bird, R.N.; Heidrich, O. A review of the use of recycled solid waste materials in asphalt pavements. Resour. Conserv. Recycl. 2007, 52, 58–73. [Google Scholar] [CrossRef]
- Herman, L.A.; Seshadri, S.R.; Pinckney, E. Placement of sound-absorbing materials to control traffic noise reflections at a highway underpass. Trans. Res. Rec. J. Trans. Res. Board 1999, 1670, 69–75. [Google Scholar] [CrossRef]
- Washington State Department Transportation (WSDOT). I-5 Ship Canal Bridge: Noise Pilot Project Measurement Results; WSDOT: Seattle, WA, USA, 2012.
- Silva, L.T.; Fonseca, F.; Rodrigues, D.; Campos, A. Assessing the influence of urban geometry on noise propagation by using the sky view factor. J. Environ. Plan Manag. 2018, 61, 535–552. [Google Scholar] [CrossRef]
- National Academies of Sciences, Engineering, and Medicine (NASEM). Field Evaluation of Reflected Noise from a Single Noise Barrier—Phase 1; The National Academies Press: Washington, DC, USA, 2016. [Google Scholar]
- Watts, G.R. Acoustic performance of parallel traffic noise barriers. Appl. Acoust. 1996, 47, 95–119. [Google Scholar] [CrossRef]
- Watts, G.R.; Godfrey, N.S. Effects on roadside noise levels of sound absorptive materials in noise barriers. Appl. Acoust. 1999, 58, 385–402. [Google Scholar] [CrossRef]
- Ismail, M.R.; Oldham, D.J. A scale model investigation of sound reflection from building facades. Appl. Acoust. 2005, 66, 123–147. [Google Scholar] [CrossRef]
- Mak, C.M.; Leung, W.K.; Jiang, G.S. Measurement and prediction of road traffic noise at different building floor levels in Hong Kong. Build. Serv. Eng. Res. Technol. 2010, 31, 131–139. [Google Scholar] [CrossRef]
- Washington State Department Transportation (WSDOT). I-5 Ship Canal Bridge Noise Study; WSDOT: Seattle, WA, USA, 2005.
- Garai, M.; Guidorzi, P. Sound reflection measurements on noise barriers in critical conditions. Build. Environ. 2015, 94, 752–763. [Google Scholar] [CrossRef]
- Reiter, P.; Wehr, R.; Ziegelwanger, H. Simulation and measurement of noise barrier sound-reflection properties. Appl. Acoust. 2017, 123, 133–142. [Google Scholar] [CrossRef]
- Lee, P.J.; Kim, Y.H.; Jeon, J.Y.; Song, K.D. Effects of apartment building façade and balcony design on the reduction of exterior noise. Build. Environ. 2007, 42, 3517–3528. [Google Scholar] [CrossRef]
- Heutschi, K.; Bühlmann, E.; Oertli, J. Options for reducing noise from roads and railway lines. Transp. Res. Part A Policy Pract. 2016, 94, 308–322. [Google Scholar] [CrossRef]
- Federal Highway Administration (FHWA). Measurement of Highway-related Noise; US Department of Transportation: Washington, DC, USA, 1996.
- American National Standards Institute (ANSI). ANSI S12.8-Methods for Determination of Insertion Loss of Outdoor Noise Barriers; ANSI: Washington, DC, USA, 1998. [Google Scholar]
- Ogata, Y.; Kitagawa, T.; Saito, H. Prediction model for railway noise in consideration of sound reflection on bridge. Q. Rep. RTRI 2017, 58, 133–138. [Google Scholar] [CrossRef]
- Health and Safety Executive (HSE). Noise at Work, The Control of Noise at WORK Regulations 2005; HSE: London, UK, 2005.
- Gozalo, G.R.; Morillas, J.M.B.; González, D.M.; Moraga, P.A. Relationships among satisfaction, noise perception, and use of urban green spaces. Sci. Total Environ. 2018, 624, 438–450. [Google Scholar] [CrossRef] [PubMed]


| Sound Receiving Point | LAeq,1h Simulation Value (1) dB(A) | LAeq,1h Measurement Value (2) dB(A) | Deviation (1)–(2) dB(A) |
|---|---|---|---|
| Steel overpass (sound meter 1.5 m above the ground) | 78.7 | 78.2 | 0.5 |
| Steel overpass (sound meter 4.5 m above the ground) | 81.0 | 79.1 | 1.9 |
| RC overpass (sound meter 1.5 m above the ground) | 78.6 | 77.9 | 0.7 |
| RC overpass (sound meter 4.5 m above the ground) | 80.9 | 79.5 | 1.4 |
| Steel Overpass | RC Overpass | ||||
|---|---|---|---|---|---|
| Floor | LAeq,1h dB(A) | Reflected Noise dB(A) | LAeq,1h dB(A) | Reflected Noise dB(A) | |
| Noise level on each floor | 1F | 78.2 | 7.7 | 78.2 | 7.8 |
| 2F | 80.9 | 6.9 | 80.8 | 6.9 | |
| 3F | 82.7 | 4.3 | 83.1 | 4.8 | |
| 4F | 84.8 | 3.5 | 84.6 | 3.6 | |
| 5F | 84.5 | 1.1 | 84.1 | 1.0 | |
| Sound Receiving Point | LAeq,1h Simulation Value (1) dB(A) | LAeq,1h Measurement Value (2) dB(A) | Deviation (1)–(2) dB(A) |
|---|---|---|---|
| Overpass height (17 m) (sound meter is 1.5 m above the ground) | 67.6 | 69.1 | −1.5 |
| Overpass height (17 m) (sound meter is 4.5 m above the ground) | 70.1 | 70.0 | 0.1 |
| Overpass height (10 m) (sound meter is 1.5 m above the ground) | 69.2 | 69.9 | −0.7 |
| Overpass height (10 m) (sound meter is 4.5 m above the ground) | 72.8 | 71.0 | 1.8 |
| High Section | Low Section | ||||
|---|---|---|---|---|---|
| Floor | LAeq,1h dB(A) | Reflected Noise dB(A) | LAeq,1h dB(A) | Reflected Noise dB(A) | |
| Noise level on each floor | 1F | 66.1 | 1.1 | 66.7 | 1.8 |
| 2F | 68.6 | 0.8 | 69.3 | 1.4 | |
| 3F | 71.7 | 0.5 | 71.7 | 0 | |
| 4F | 74.8 | 0 | 75.4 | 0 | |
| 5F | 76.3 | 0 | 69.2 | 0 | |
| Floor | Sound absorption rate 0.36 | Sound absorption rate 0.85 | Sound absorption rate 0.36 | Sound absorption rate 0.85 | |
| Decrease in reflected noise by sound absorbing material on the bottom of the overpass | 1F | −0.7 | −1.8 | −0.8 | −2.1 |
| 2F | −0.5 | −1.3 | −0.6 | −1.6 | |
| 3F | −0.3 | −0.8 | 0 | 0 | |
| 4F | 0 | 0 | 0 | 0 | |
| 5F | 0 | 0 | 0 | 0 | |
| Sound Receiving Point | LAeq,1h Simulation Value (1) dB(A) | LAeq,1h Measurement Value (2) dB(A) | Deviation (1)–(2) dB(A) |
|---|---|---|---|
| Distance from overpass side: 15 m (sound meter is 1.5 m above the ground) | 69.9 | 69.7 | 0.2 |
| Distance from overpass side: 15 m (sound meter is 4.5 m above the ground) | 72.0 | 71.6 | 0.4 |
| Distance from overpass side: 30 m (sound meter is 1.5 m above the ground) | 68.9 | 66.3 | 2.6 |
| Distance from overpass side: 30 m (sound meter is 4.5 m above the ground) | 71.4 | 69.8 | 1.6 |
| Distance from Overpass | LAeq,1h dB(A) | Reflected Noise dB(A) | |
|---|---|---|---|
| Noise level at each distance | 15 m | 70.2 | 5.4 |
| 30 m | 69.0 | 2.8 | |
| 45 m | 68.0 | 1.9 | |
| 60 m | 67.5 | 1.4 | |
| 75 m | 67.4 | 0.9 | |
| Distance from overpass | Sound absorption rate 0.36 | Sound absorption rate 0.85 | |
| Decrease in reflected noise by absorbing materials on the bottom of the overpass | 15 m | −1.1 | −3.6 |
| 30 m | −0.7 | −1.9 | |
| 45 m | −0.5 | −1.3 | |
| 60 m | −0.4 | −1.0 | |
| 75 m | −0.2 | −0.6 |
© 2018 by the authors. Licensee MDPI, Basel, Switzerland. This article is an open access article distributed under the terms and conditions of the Creative Commons Attribution (CC BY) license (http://creativecommons.org/licenses/by/4.0/).
Share and Cite
Lin, C.-C.; Peng, Y.-P.; Tsai, Y.-P.; Chang, Y.-C.; Chen, K.-F. Impact and Control of Reflected Noise from an Overpass Bottom. Appl. Sci. 2018, 8, 1908. https://doi.org/10.3390/app8101908
Lin C-C, Peng Y-P, Tsai Y-P, Chang Y-C, Chen K-F. Impact and Control of Reflected Noise from an Overpass Bottom. Applied Sciences. 2018; 8(10):1908. https://doi.org/10.3390/app8101908
Chicago/Turabian StyleLin, Chi-Chwen, Yen-Ping Peng, Yung-Pin Tsai, Yu-Chen Chang, and Ku-Fan Chen. 2018. "Impact and Control of Reflected Noise from an Overpass Bottom" Applied Sciences 8, no. 10: 1908. https://doi.org/10.3390/app8101908
APA StyleLin, C.-C., Peng, Y.-P., Tsai, Y.-P., Chang, Y.-C., & Chen, K.-F. (2018). Impact and Control of Reflected Noise from an Overpass Bottom. Applied Sciences, 8(10), 1908. https://doi.org/10.3390/app8101908