Numerical Analysis for Performance Evaluation of a Multi-Functional CO2 Heat Pump Water Heating System

Abstract
:1. Introduction
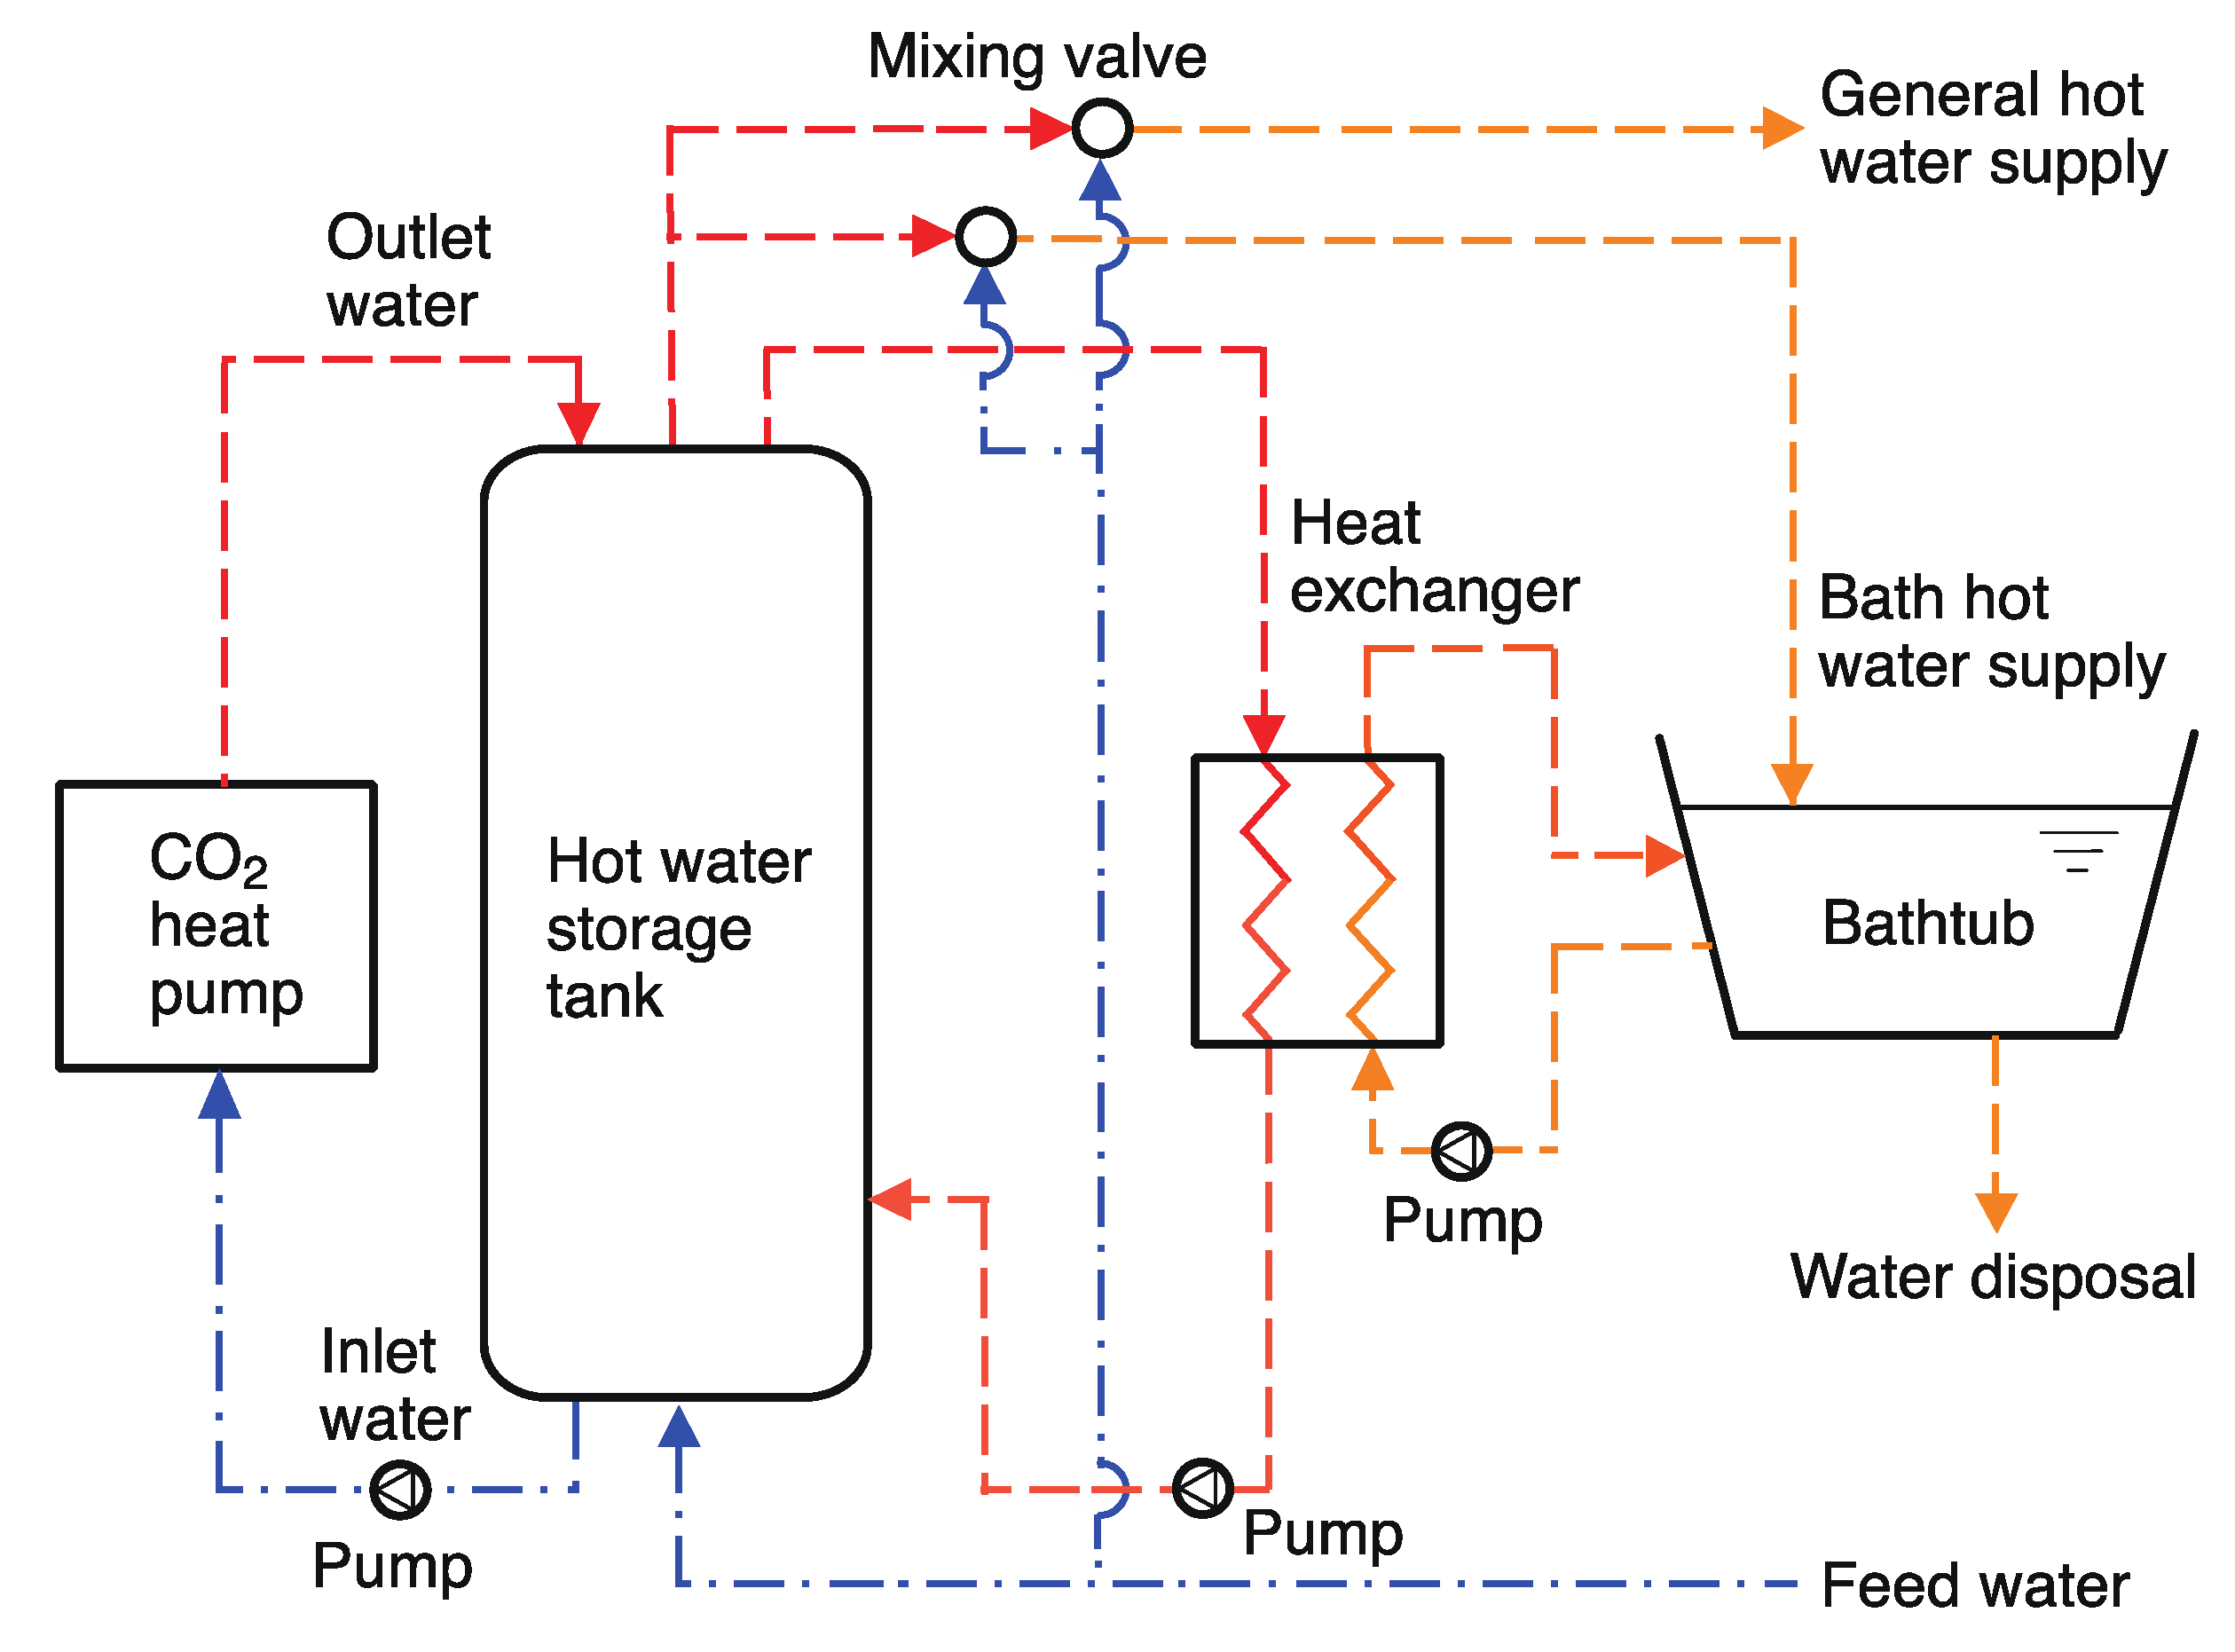
2. CO2 HP WHS
3. System Modeling
3.1. Component Models
3.2. System Model
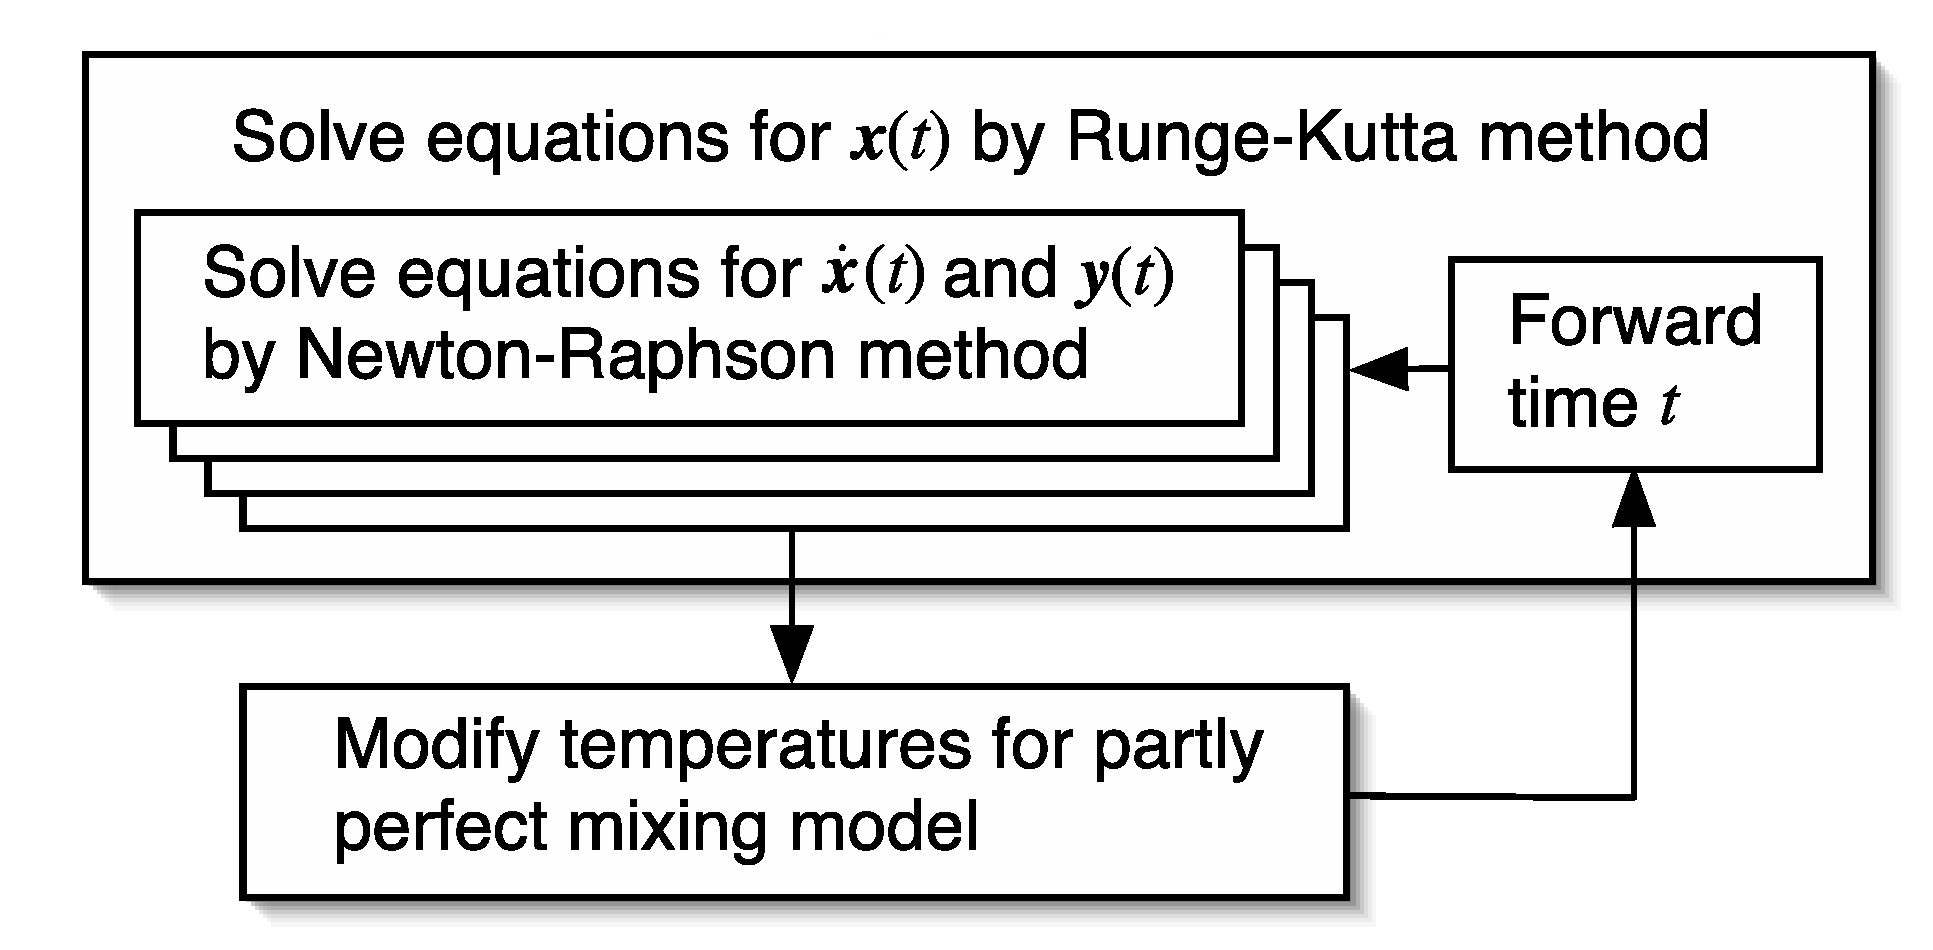
3.3. Numerical Solution
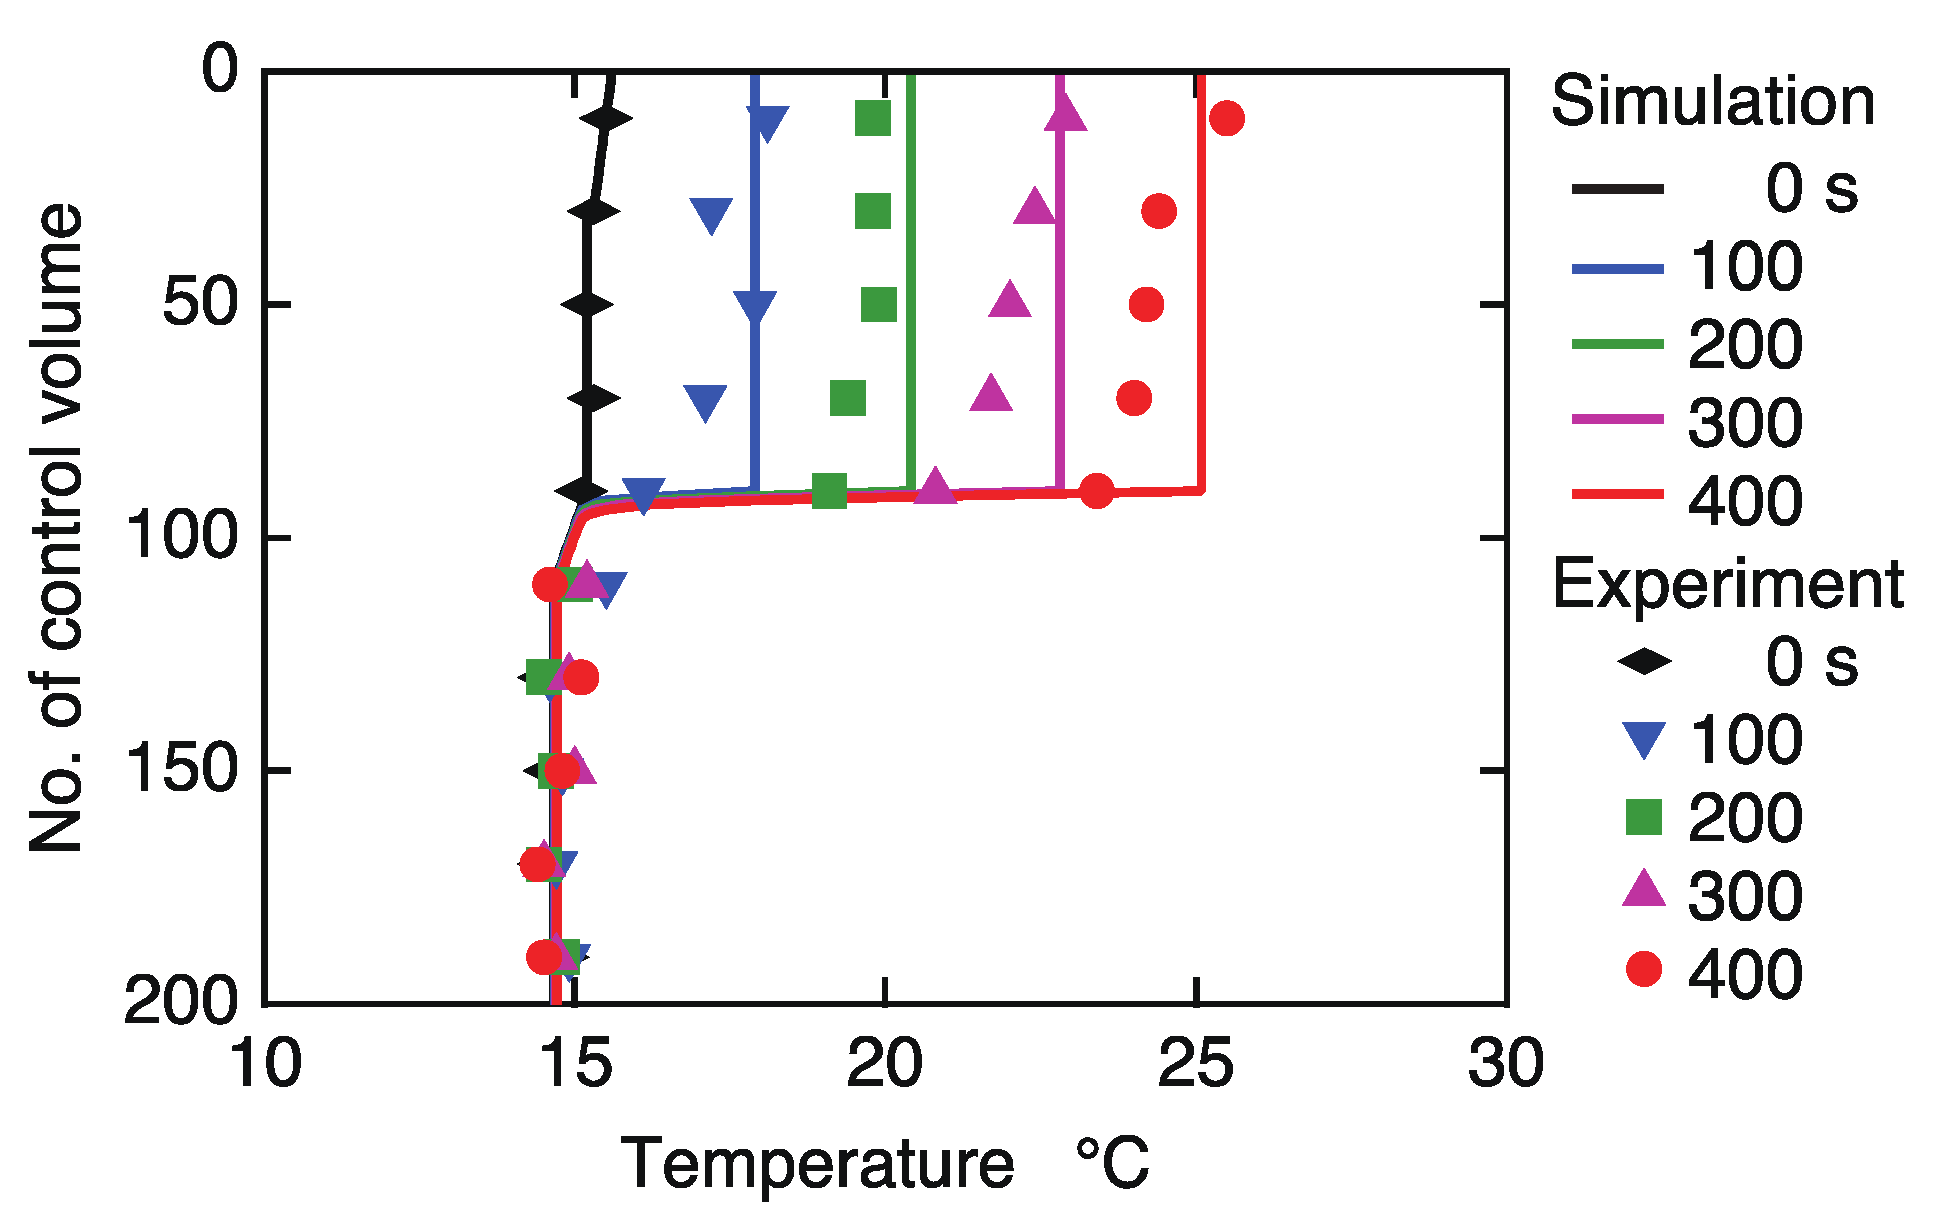
4. Experiments for Storage Tank
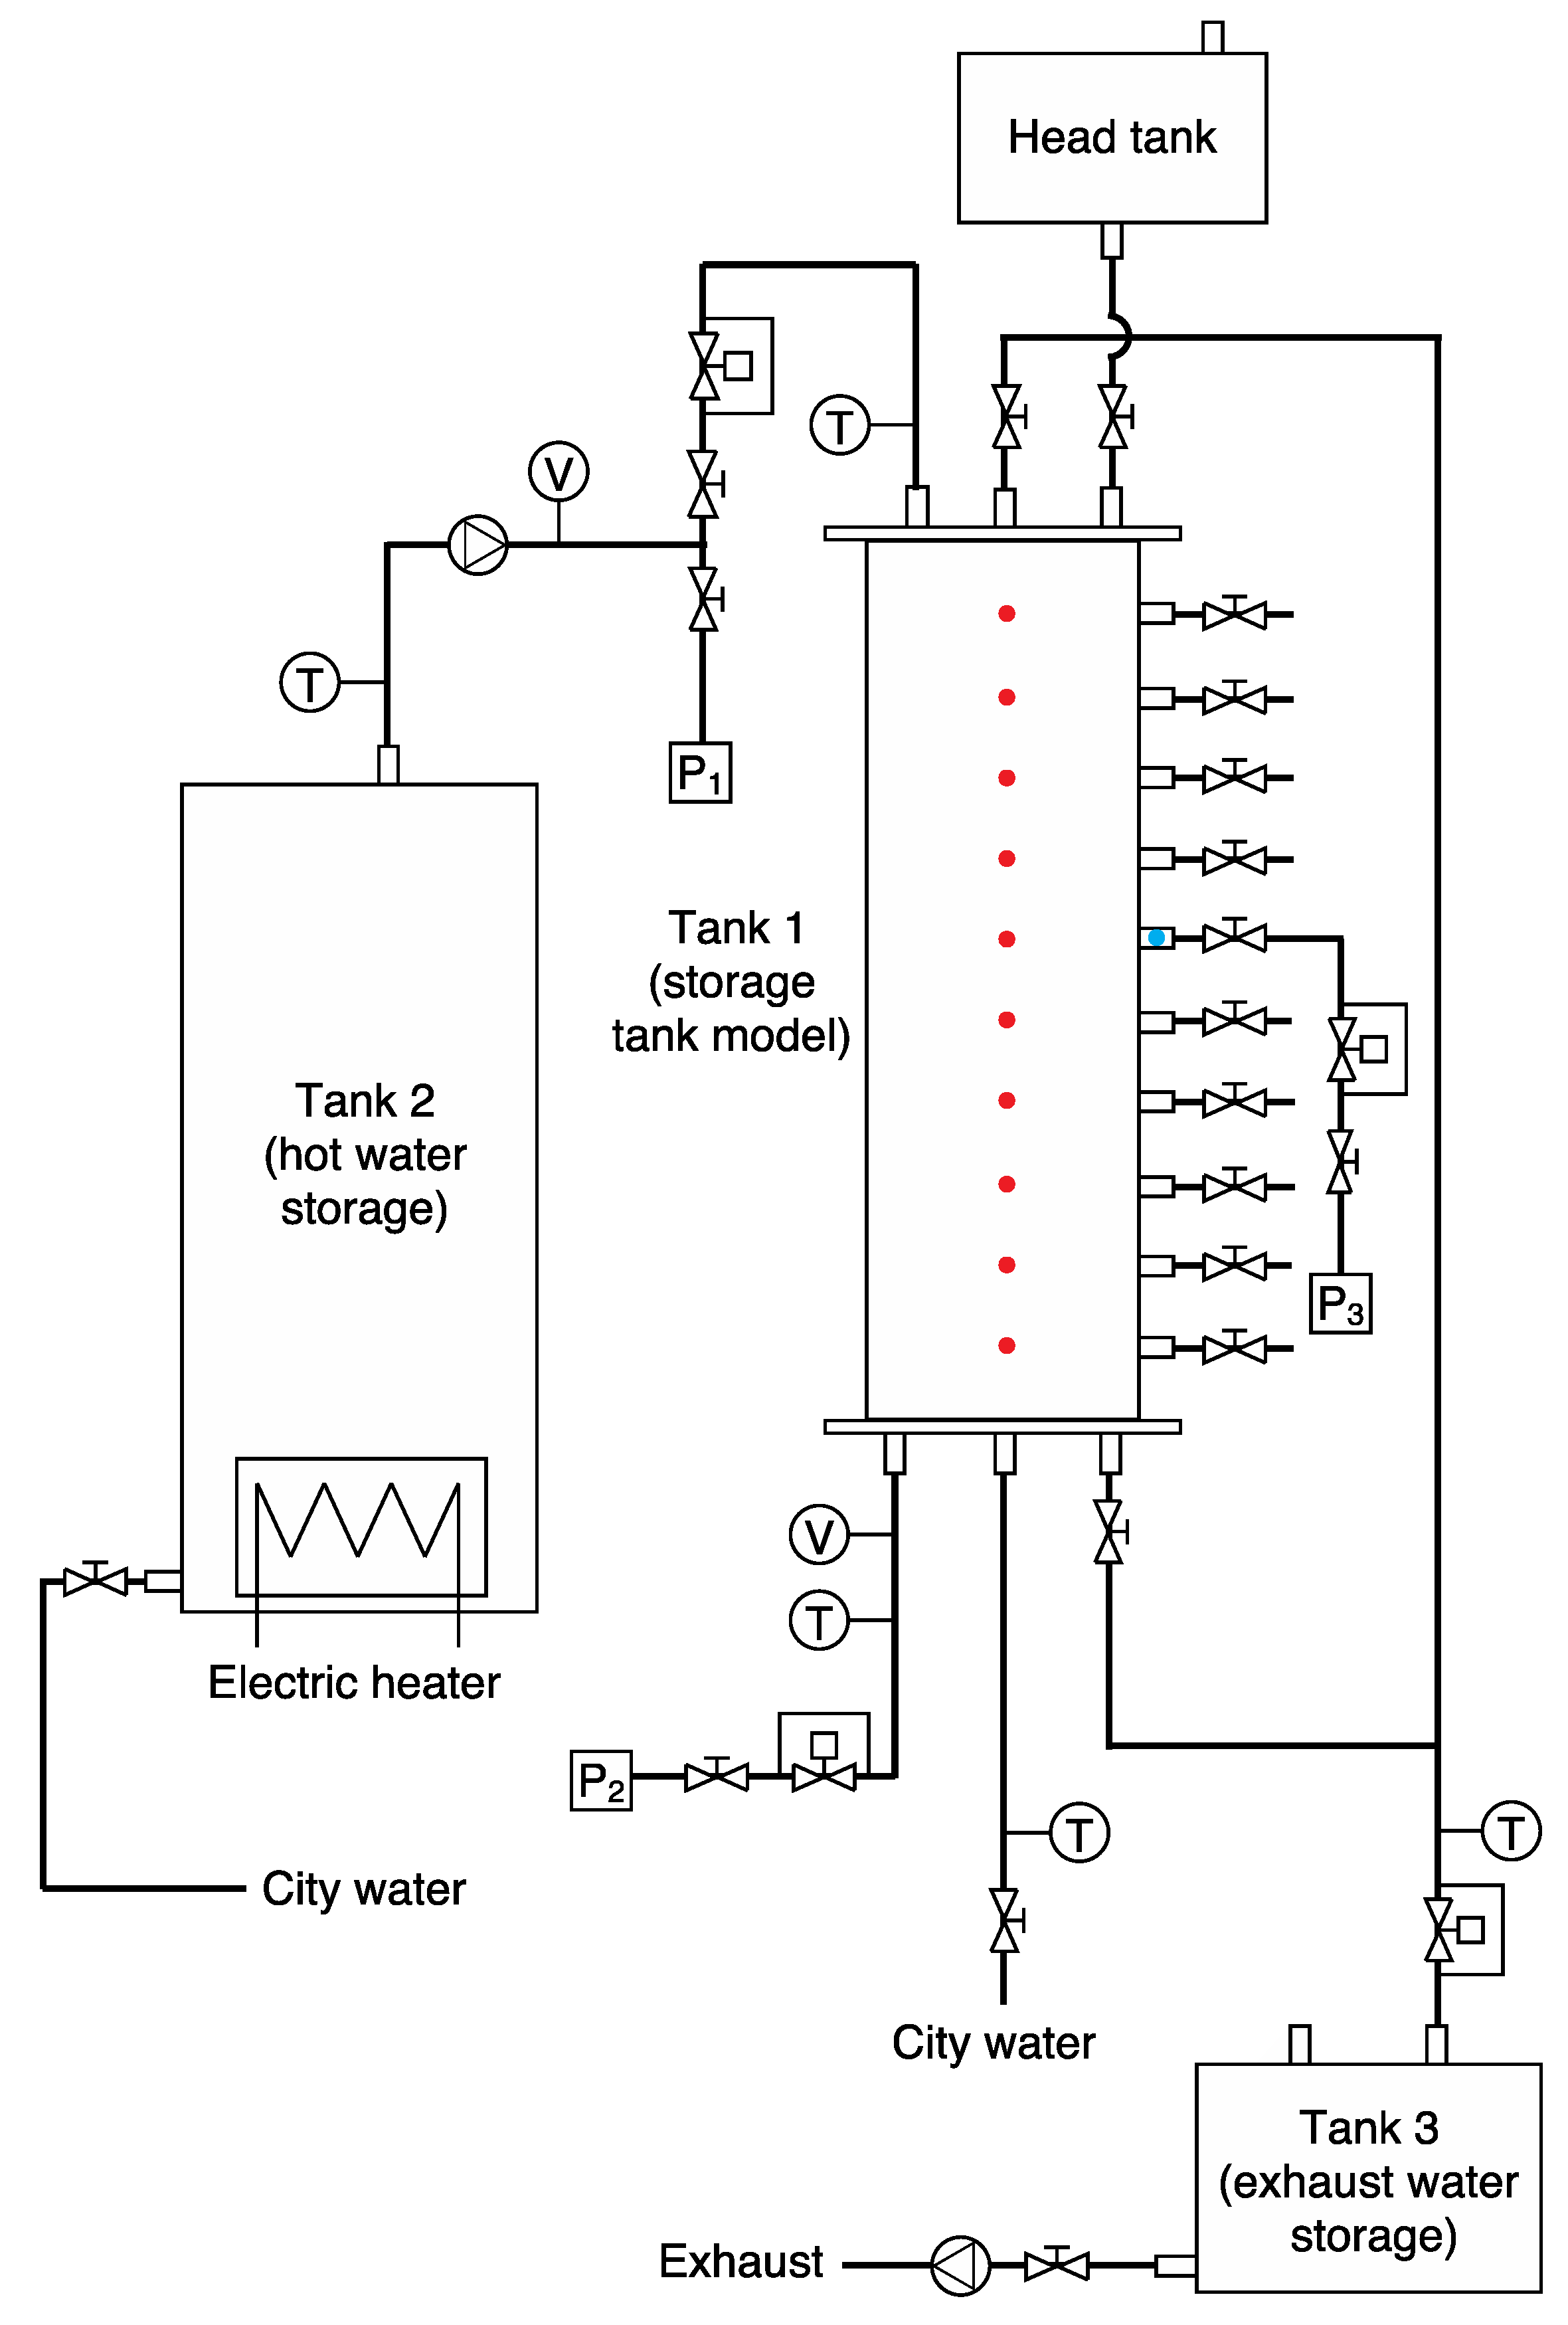
4.1. Experimental Setup
4.2. Case A
4.3. Case B
5. Numerical Study
5.1. Conditions
5.2. Results and Discussion
6. Conclusions
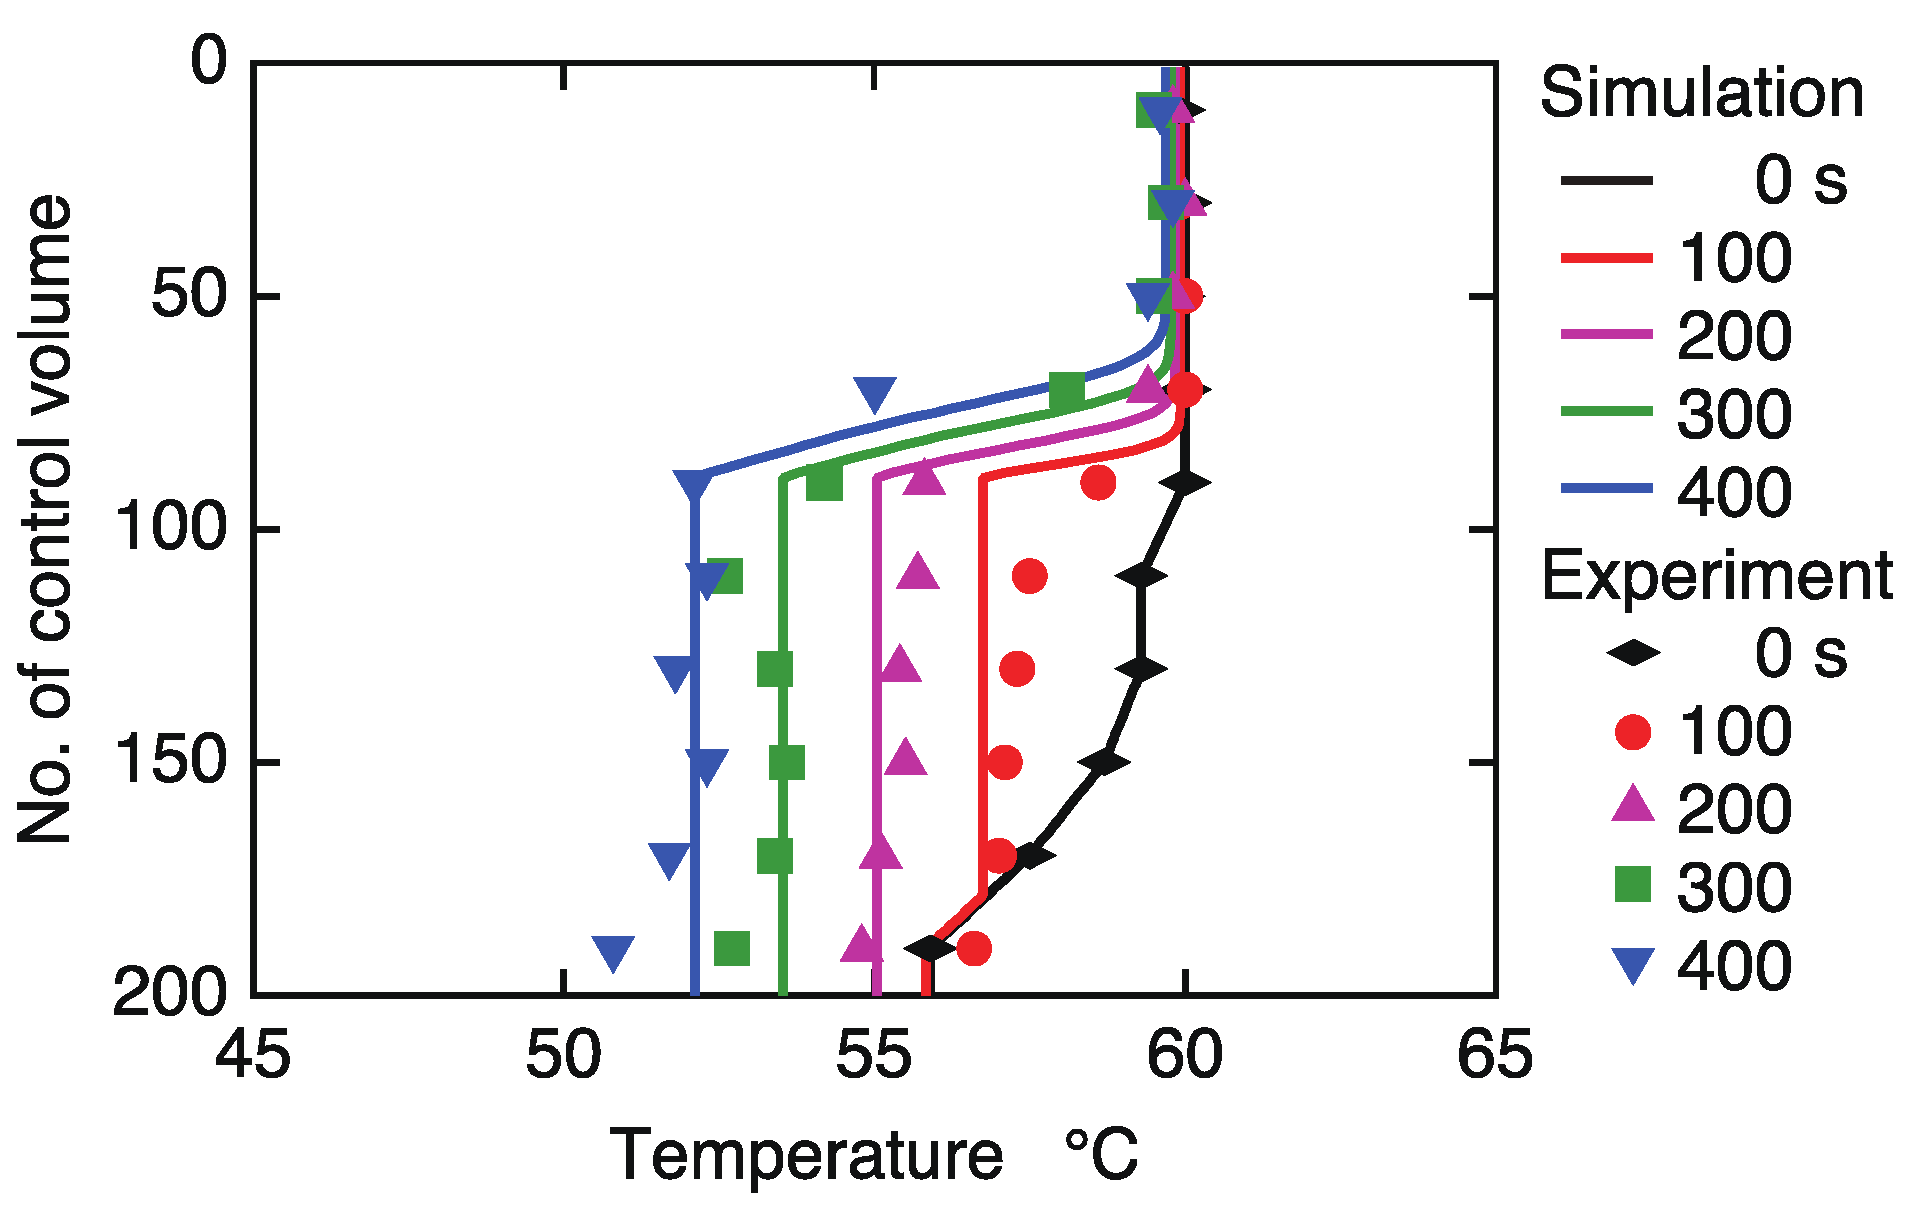
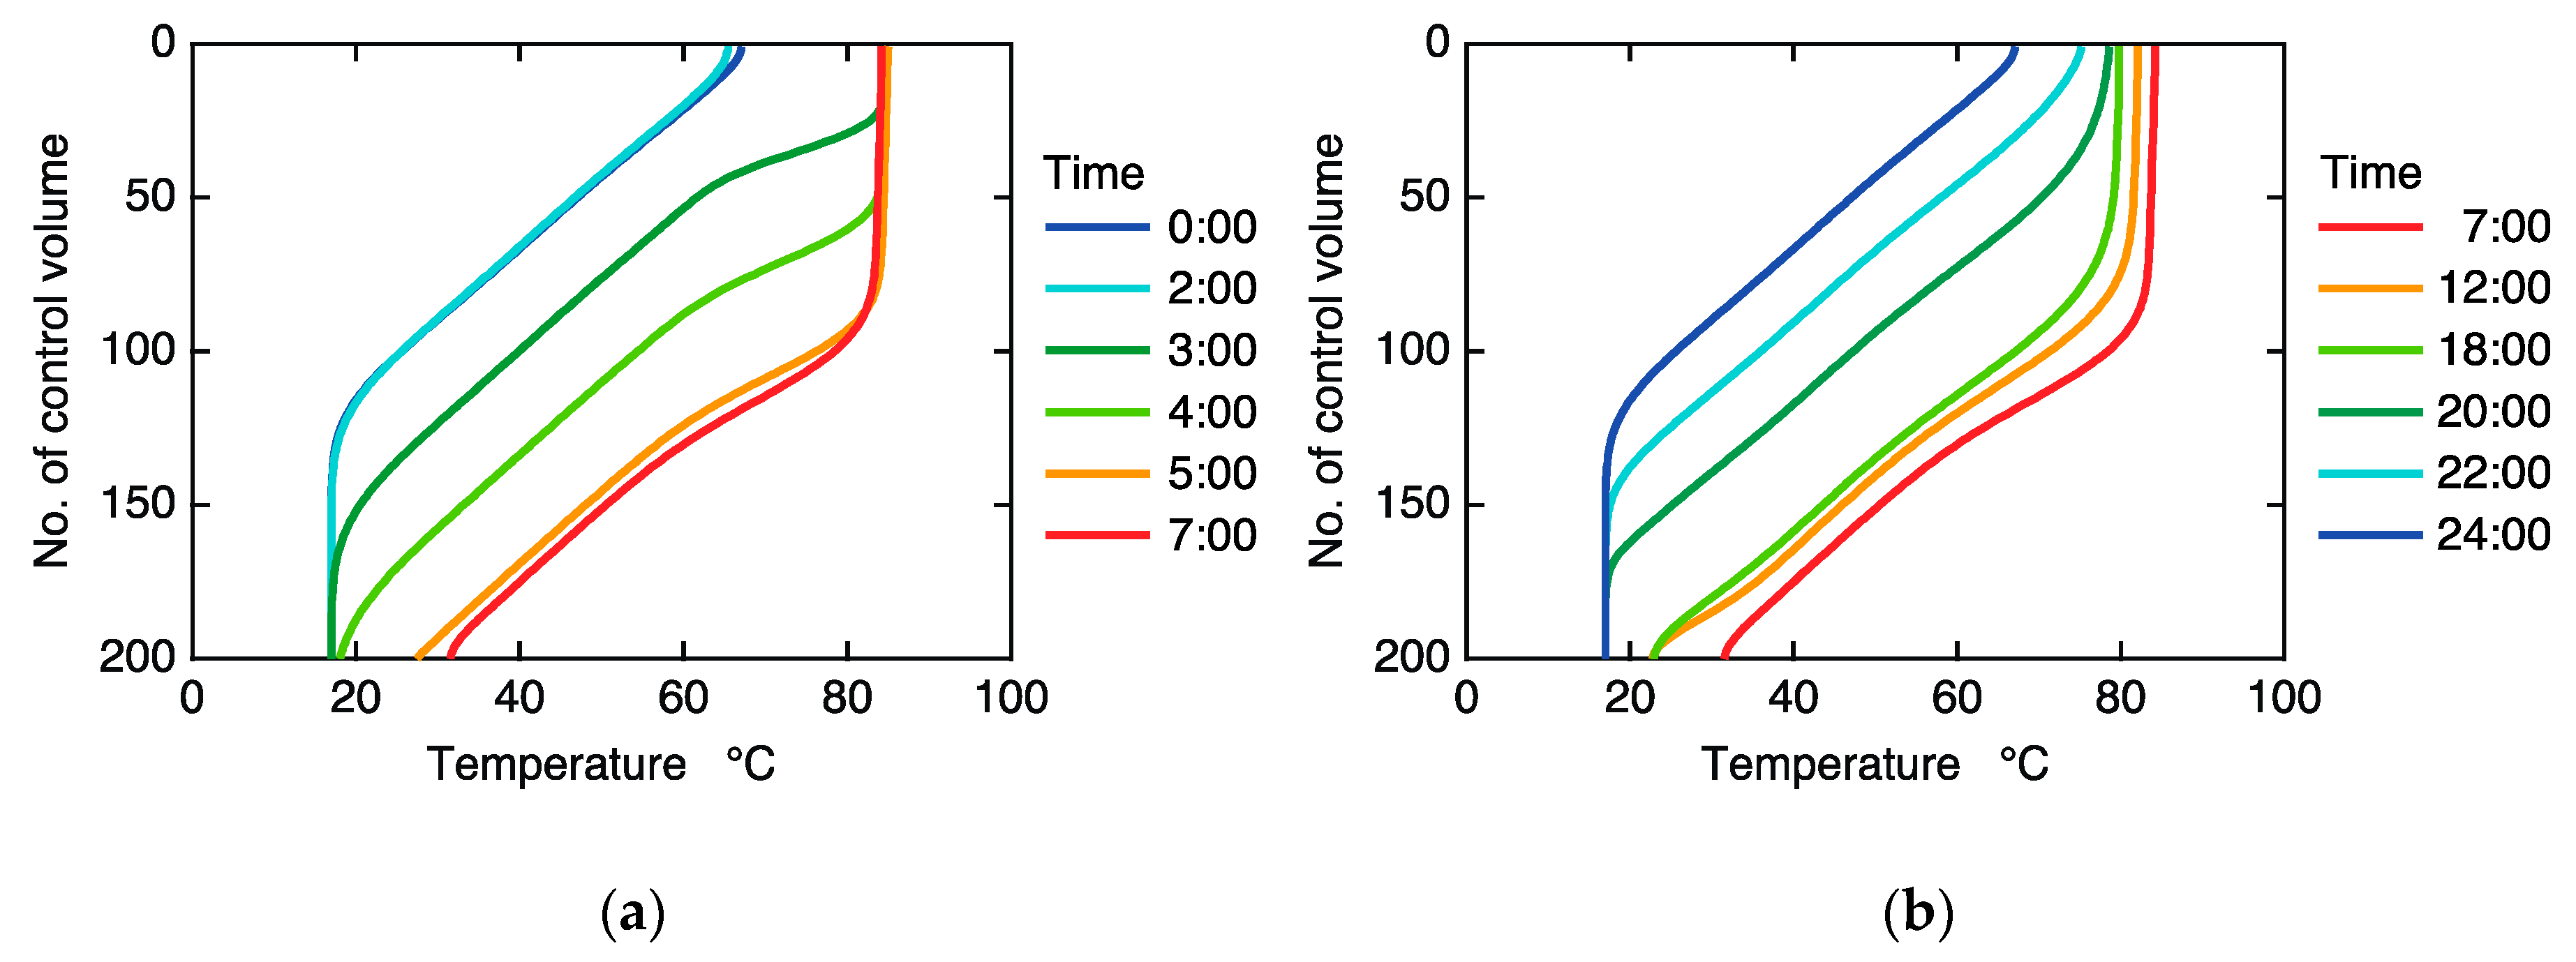
- In the multi-functional system, the temperature at the middle of the storage tank rises when hot water is returned to the bottom of the storage tank. As the position for hot water return is heightened, the part with a constant temperature at the middle of the storage tank is also heightened.
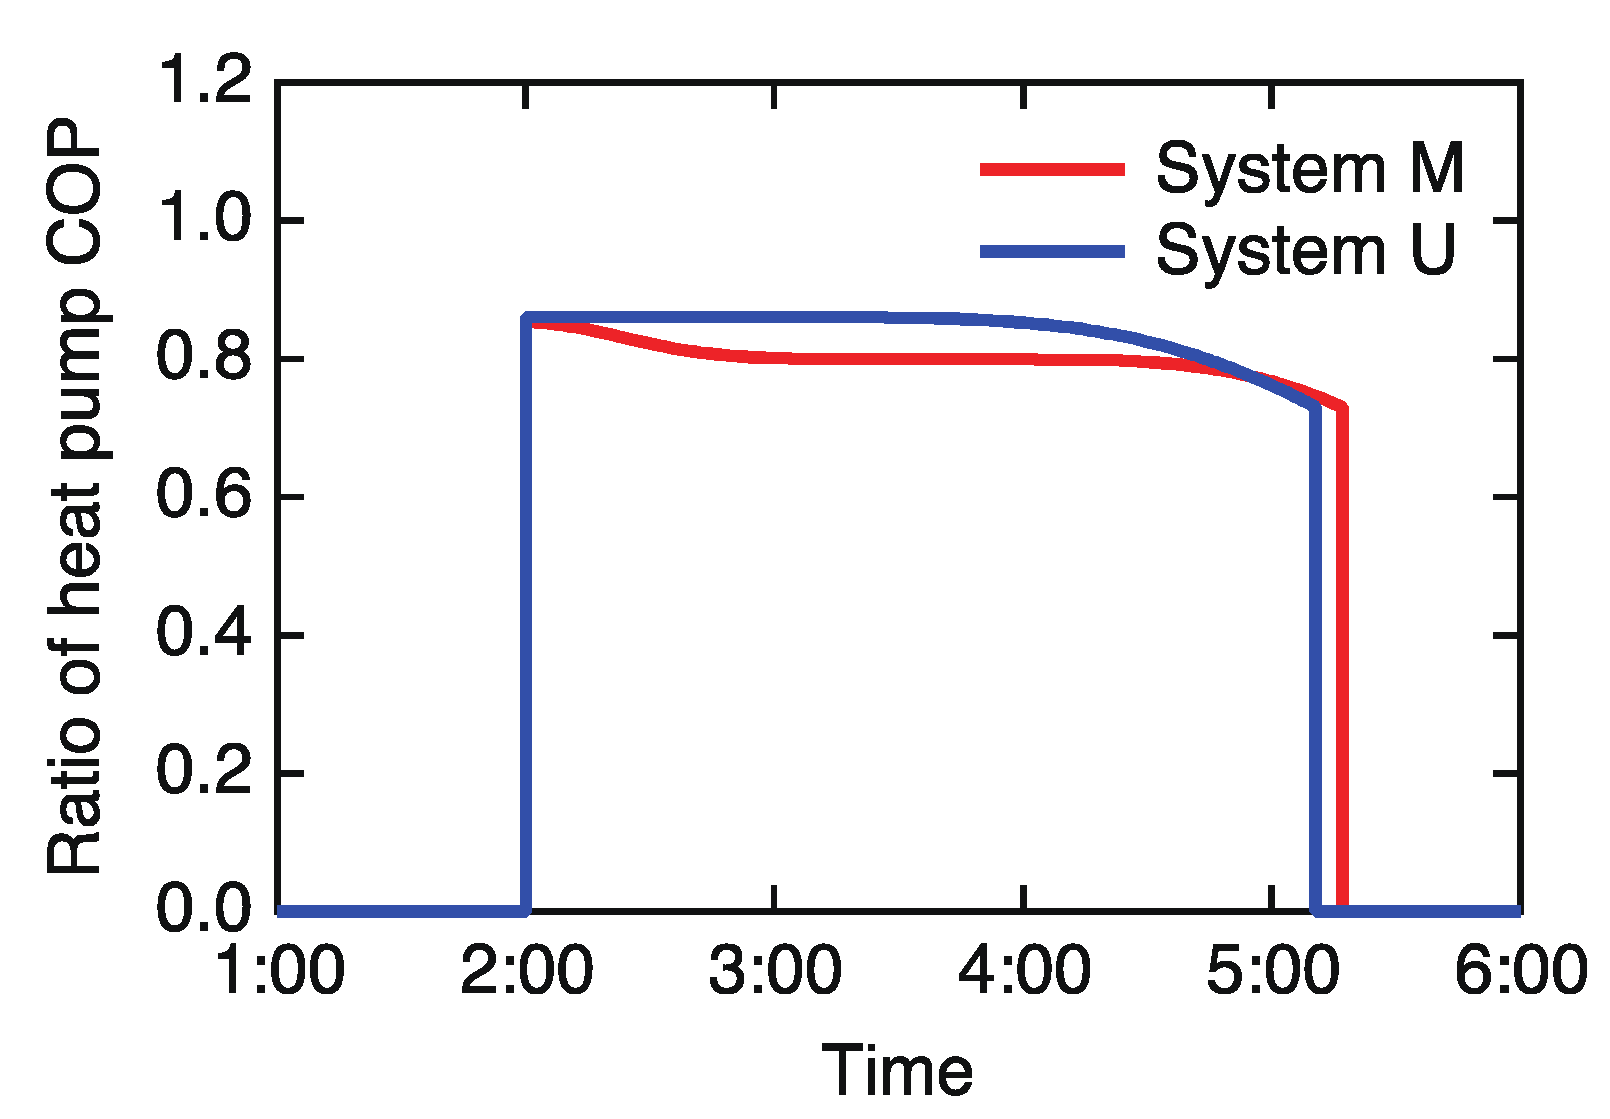
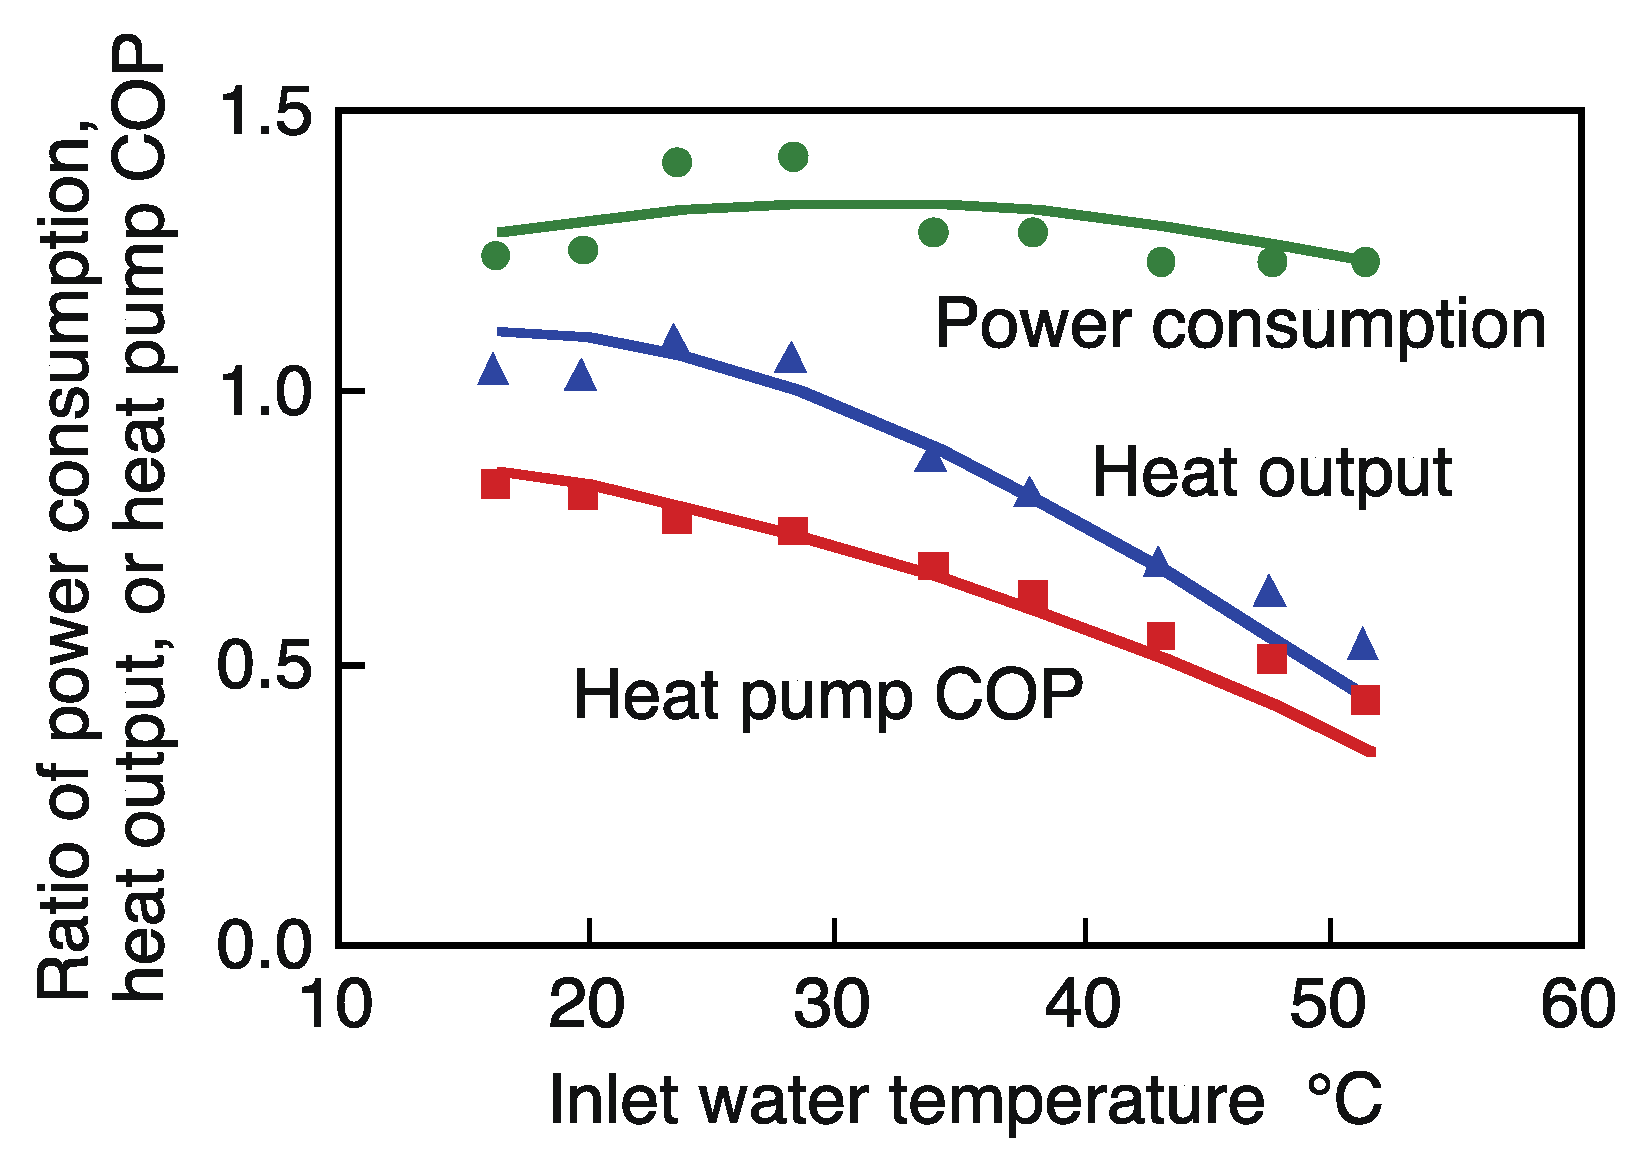
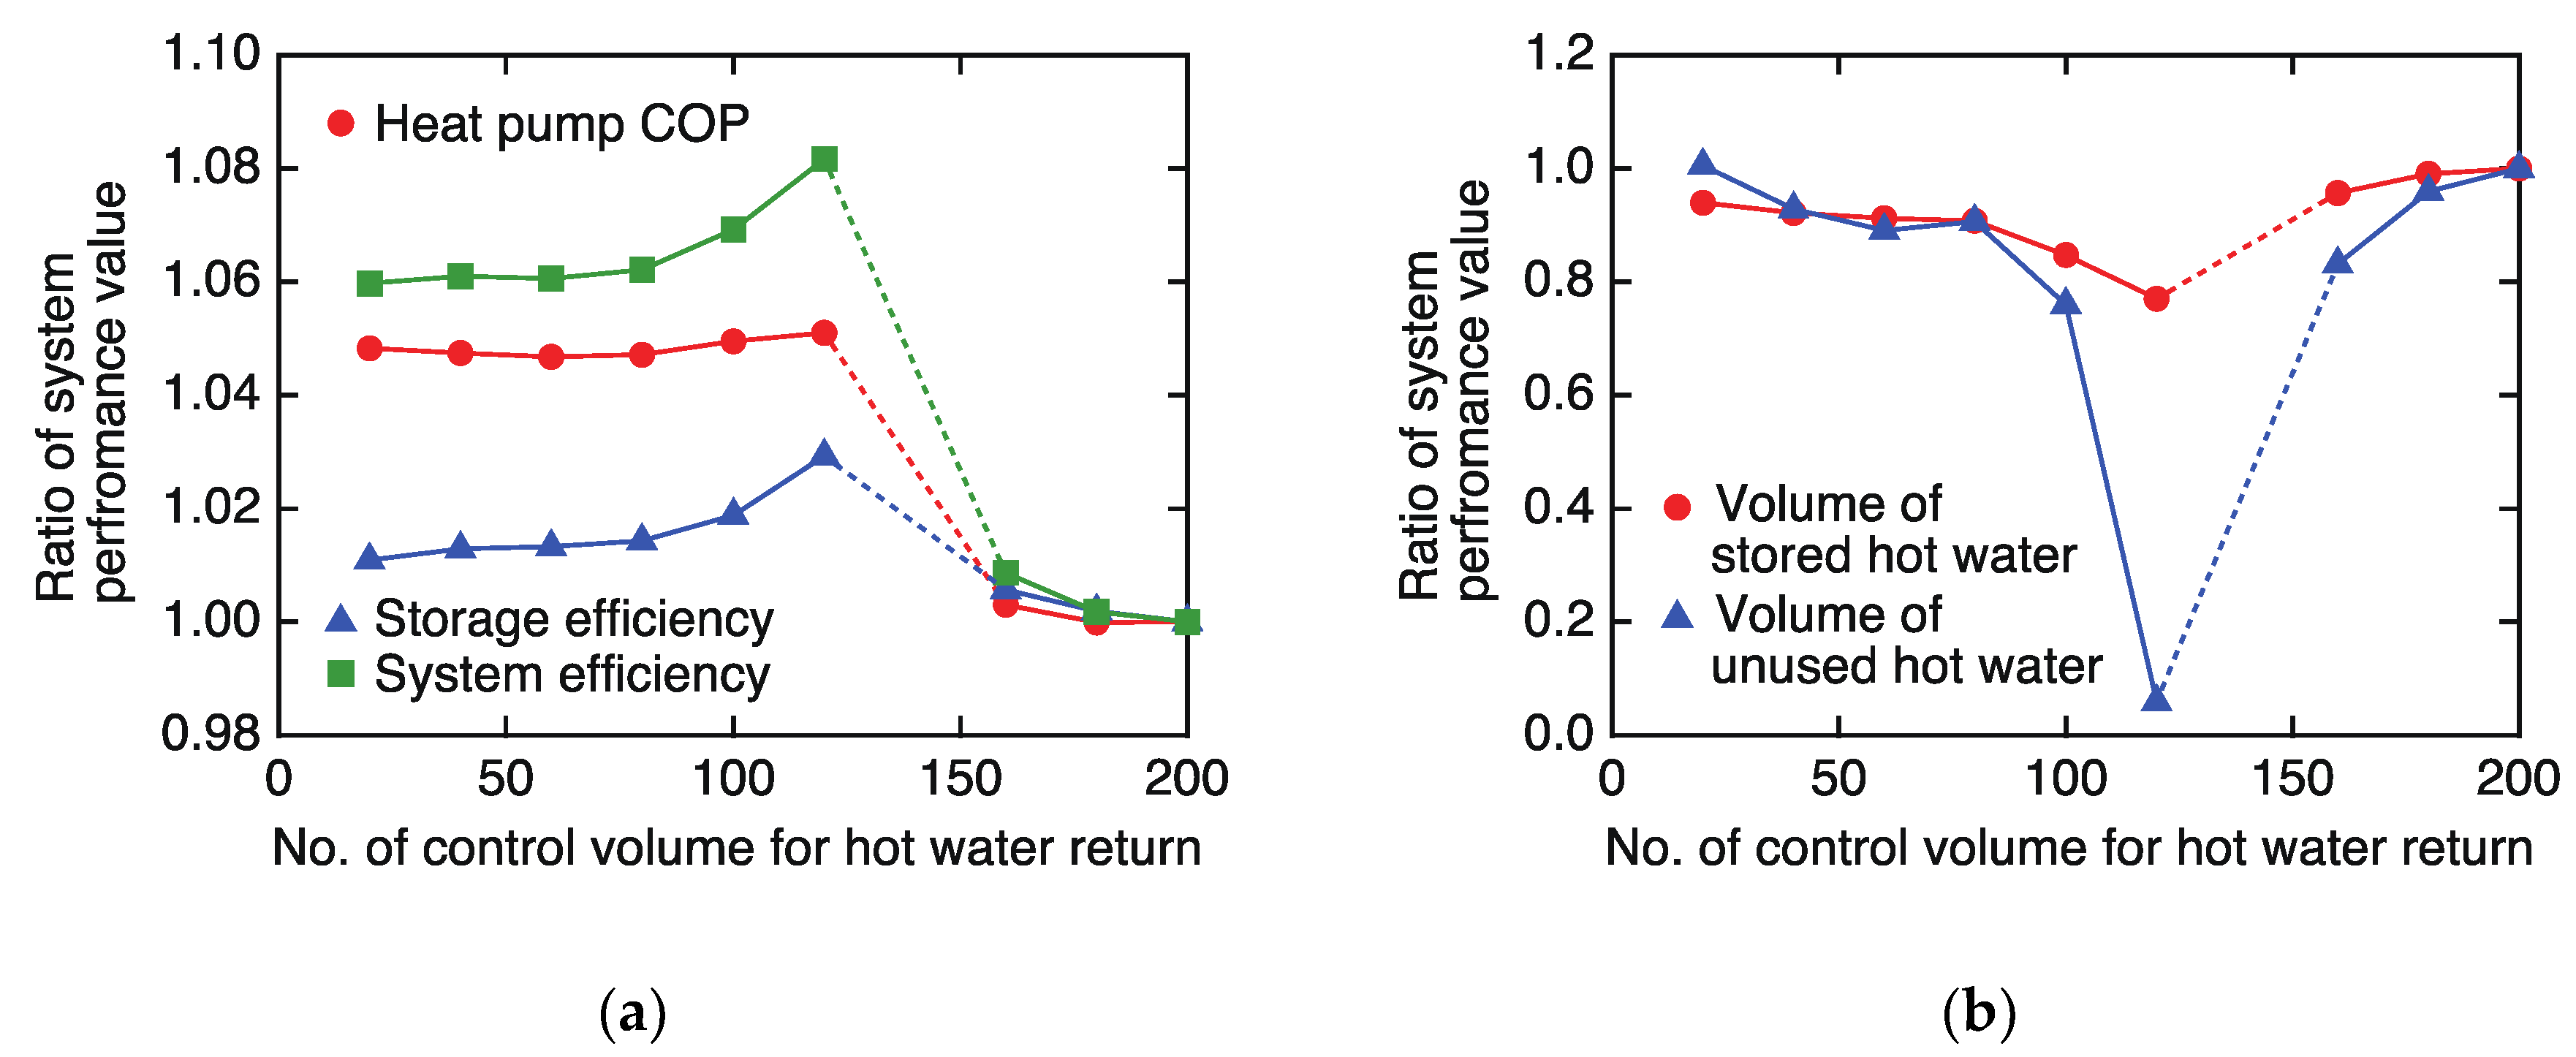
- The multi-functional system has almost constant (although lower) HP COP during the middle of HP operation when hot water returned to the bottom of the storage tank. As a result, the daily HP COP in the multi-functional system decreased by 4.7% as compared to that in the uni-functional system. However, this decrease recovered when the position for hot water return heightened.
- The average temperature in the storage tank in the multi-functional system became higher than that in the uni-functional system, when hot water returned to the bottom of the storage tank. Thus, the storage efficiency in the multi-functional system also decreased as compared to that in the uni-functional system, although its decrease rate remained only 0.2%. Since the average temperature in the storage tank decreased when the position for hot water return heightened, the storage efficiency became higher than that in the uni-functional system.
- As a whole, the system efficiency in the multi-functional system decreased by 4.9% as compared to that in the uni-functional system, when hot water returned to the bottom of the storage tank. When the position for hot water return heightened, the system efficiency also became higher than that in the uni-functional system.
- The volume of unused hot water in the multi-functional system decreased by 16.3% as compared to that in the uni-functional system, when hot water returned to the bottom of the storage tank. Furthermore, when the position for hot water return heightened, the volume of unused hot water decreased.
- When the constant temperature in the storage tank by the hot water return was slightly above the inlet water temperature for HP shutdown, unique temperature distributions arised. The storage and system efficiencies increased drastically, while the volume of unused hot water decreased drastically. Thus, a deficit in hot water supply may arise.
Author Contributions
Funding
Conflicts of Interest
Nomenclature
| A | cylindrical surface area or heat transfer area [m2] |
| c | specific heat of water [J/(kg·°C)] |
| f | vector for equations |
| H | height [m] |
| J | number of control volumes |
| l | heat loss coefficient [1/s] |
| m | mass [kg] |
| mass flow rate [kg/s] | |
| heat flow rate [W] | |
| S | horizontal sectional area [m2] |
| T | temperature [°C] |
| t | time [s] |
| U | overall heat transfer coefficient [W/(m2·°C)] |
| V | volume [m3] |
| power consumption [W] | |
| x | vector for variables with their derivatives |
| derivatives of variables for x | |
| y | vector for variables without their derivatives |
| α, β, γ | coefficients of quadratic functions |
| η | coefficient of performance (COP) |
| λ | heat conductivity of water [W/(m2·°C)] |
| ρ | density of water [kg/m3] |
| Subscripts | |
| BT | bathtub |
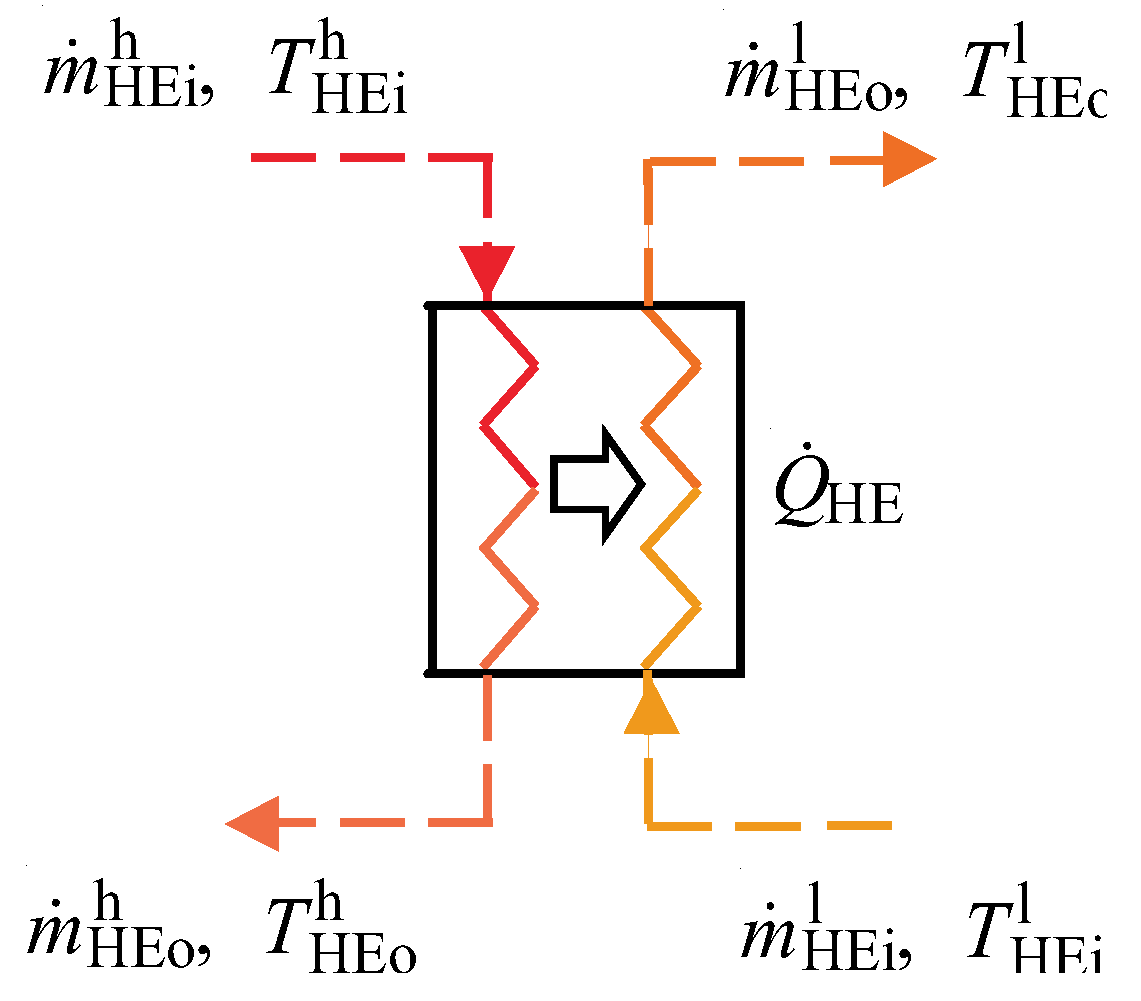
| HE | heat exchanger |
| HP | CO2 heat pump |
| i | inlet |
| j | index for control volumes |
| k | control volume for hot water return |
| MV | mixing valve |
| o | outlet |
| ST | hot water storage tank |
| 0 | initial state |
| Superscripts | |
| a | air |
| b | bottom |
| d | water disposal |
| h | higher temperature |
| l | lower temperature |
| r | hot water return |
| s | hot water supply |
| t | top |
| x | heat exchange |
Appendix A
Appendix A.1. CO2 HP

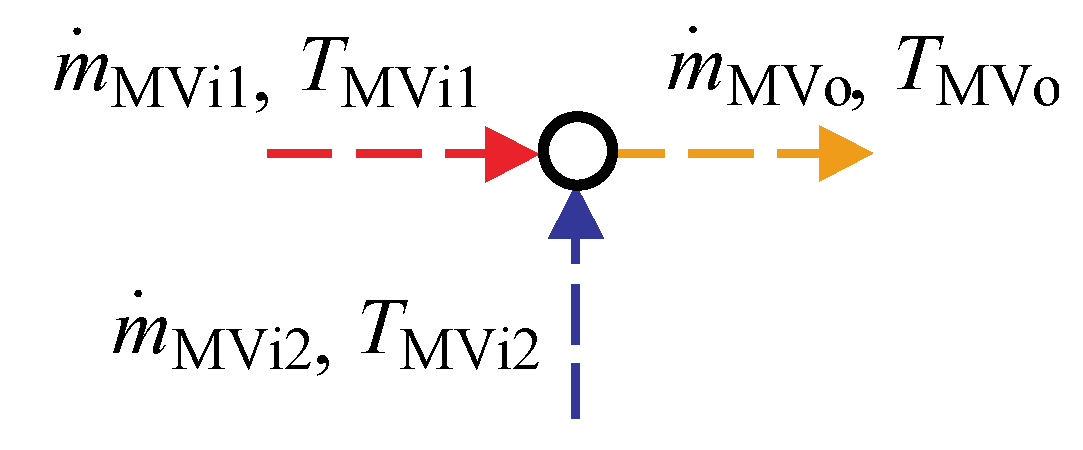
Appendix A.2. Mixing Valve

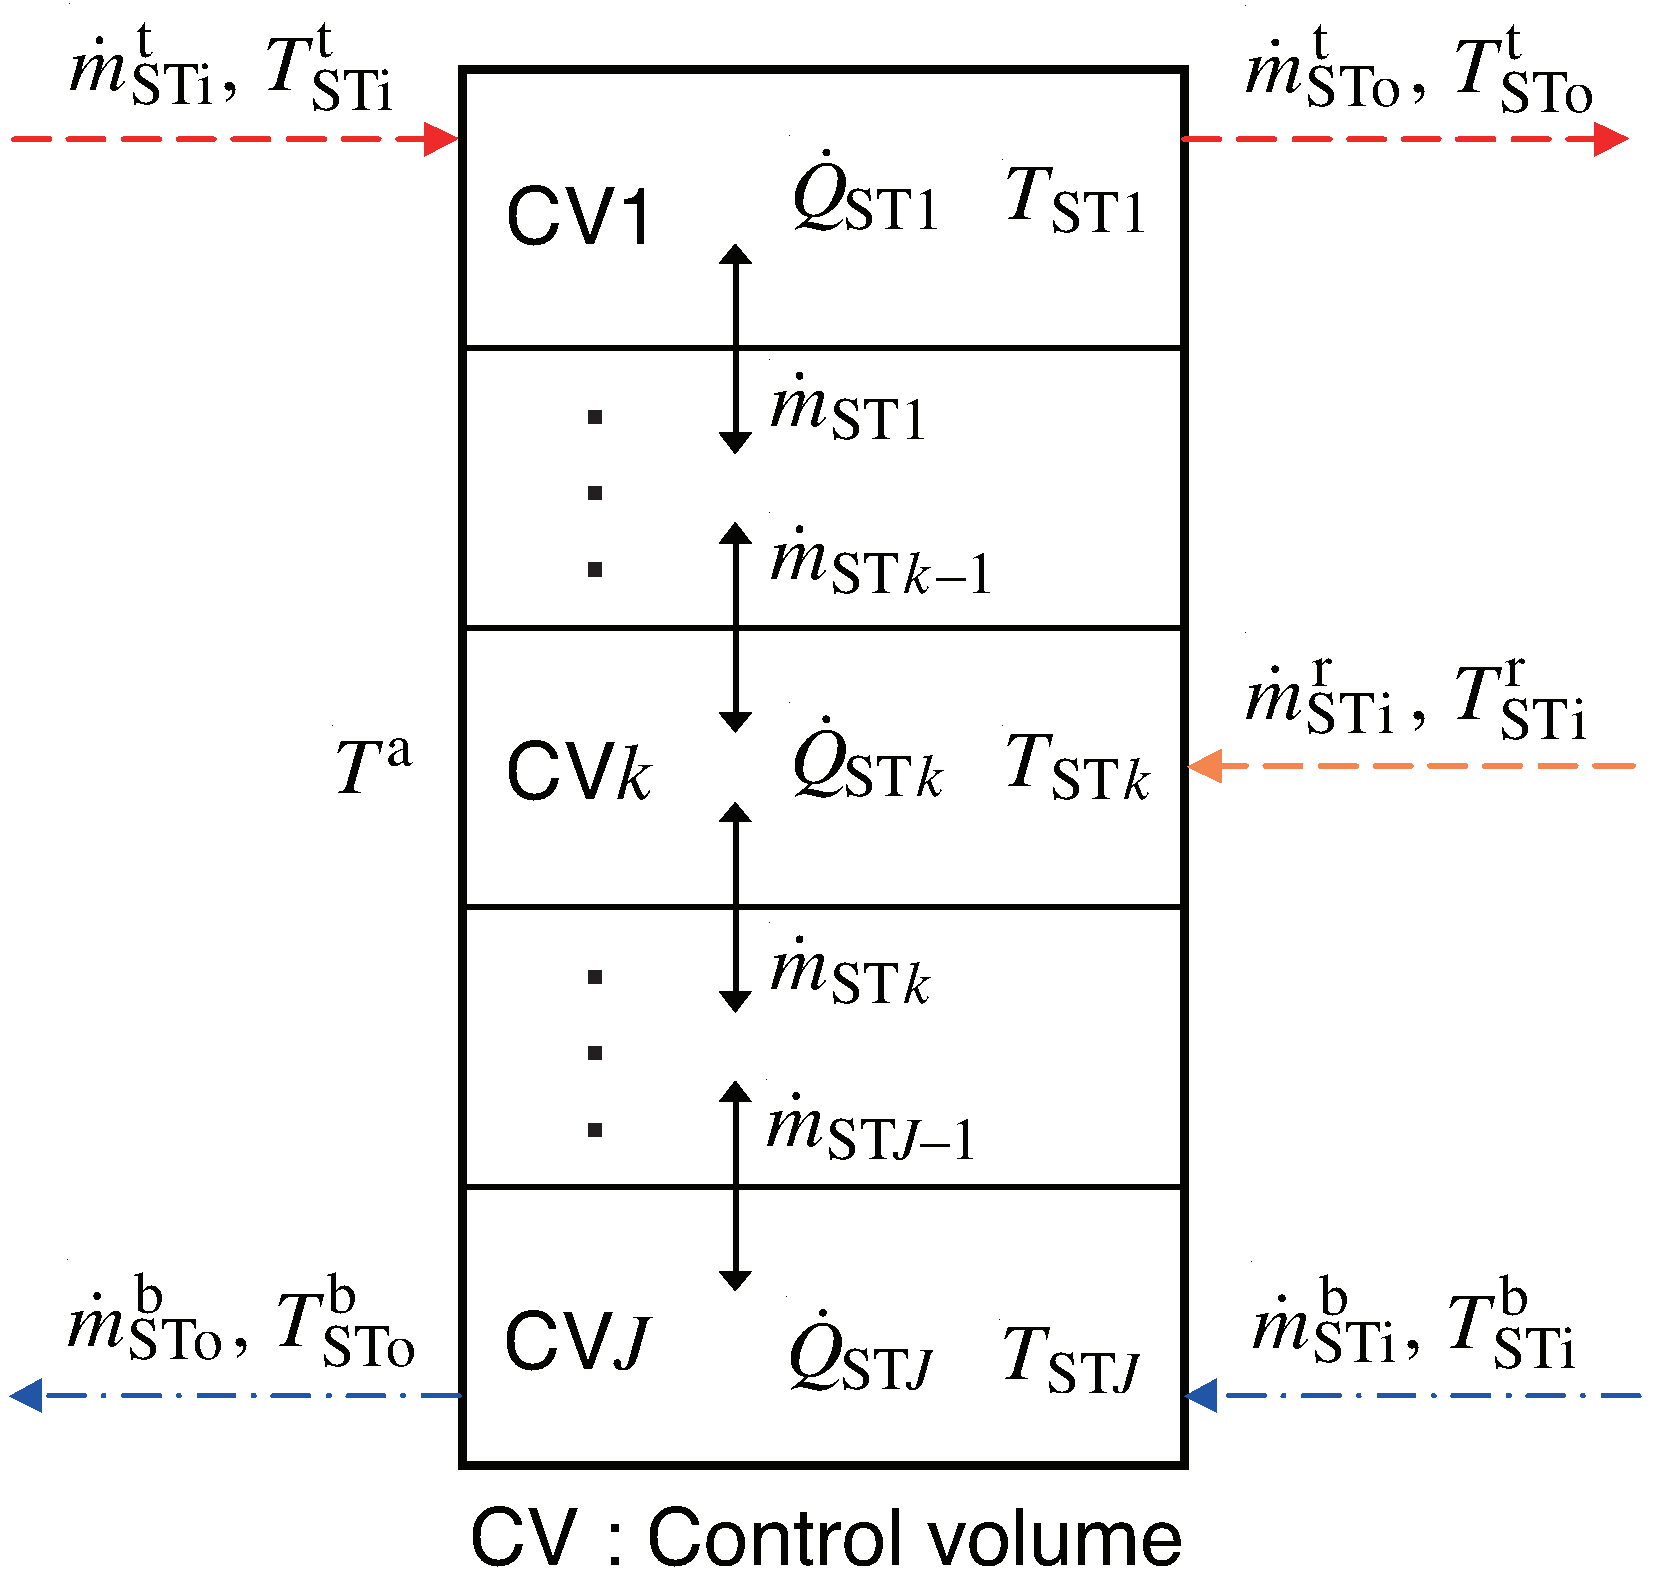
Appendix A.3. Storage Tank

Appendix A.4. Heat Exchanger
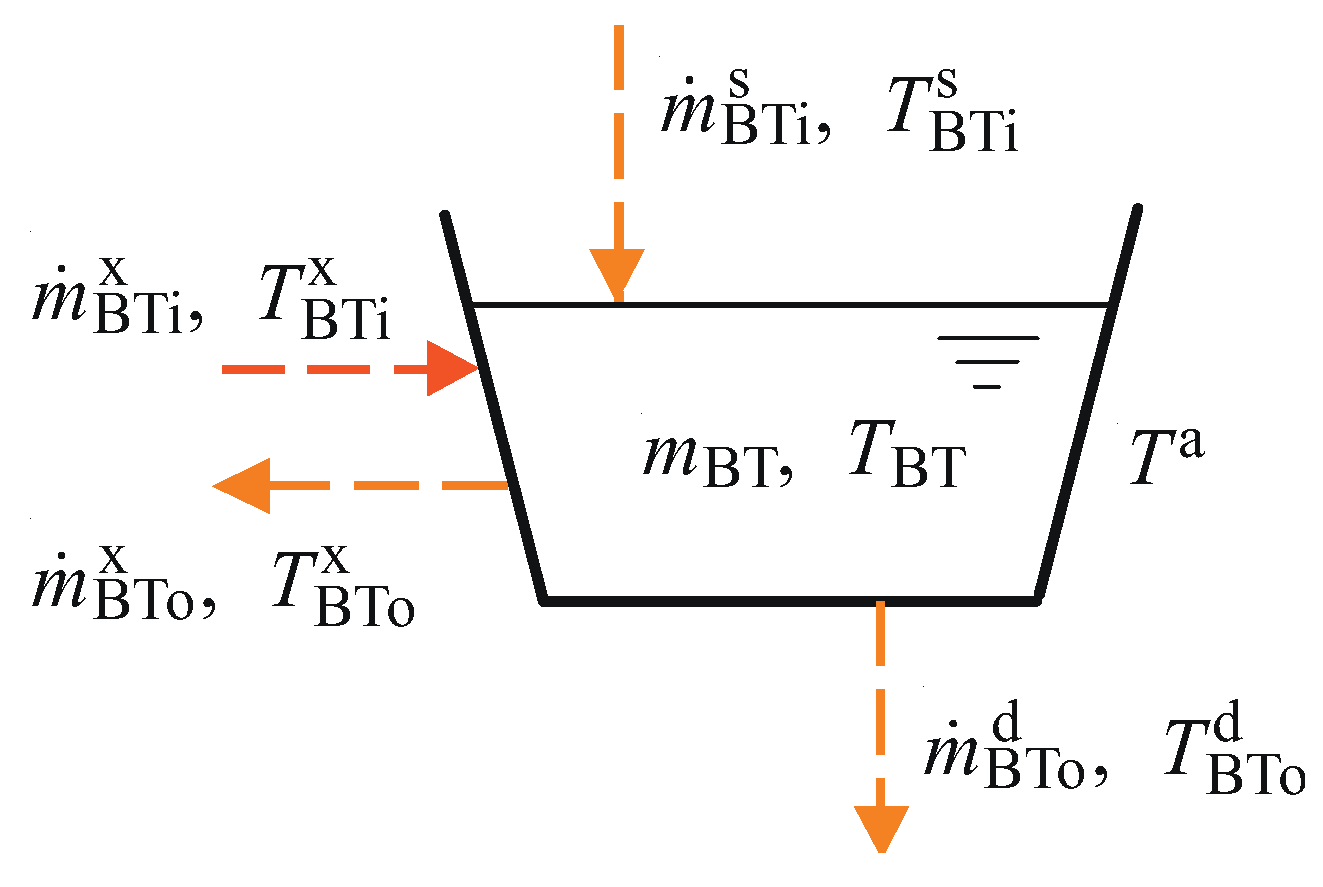
Appendix A.5. Bathtub

References
- The Energy Data and Modelling Center, The Institute of Energy Economics, Japan. Handbook of Energy and Economic Statistics in Japan, 2013 Ver.; The Energy Conservation Center: Tokyo, Japan, 2013. [Google Scholar]
- Hashimoto, K. Technology and market development of CO2 heat pump water heaters (ECO CUTE) in Japan. IEA Heat Pump Cent. Newsl. 2006, 24, 12–16. [Google Scholar]
- Nekså, P. CO2 heat pump systems. Int. J. Refrig. 2002, 25, 421–427. [Google Scholar] [CrossRef]
- Ma, Y.T.; Liu, Z.Y.; Tian, H. A review of transcritical carbon dioxide heat pump and refrigeration cycles. Energy 2013, 55, 156–172. [Google Scholar] [CrossRef]
- Nekså, P.; Rekstad, H.; Zakeri, R.; Schiefloe, P.A. CO2-Heat pump water heater: characteristics, system design and experimental results. Int. J. Refrig. 1998, 21, 172–179. [Google Scholar] [CrossRef]
- White, S.D.; Yarrall, M.G.; Cleland, D.J.; Hedley, R.A. Modelling the performance of a transcritical CO2 heat pump for high temperature heating. Int. J. Refrig. 2002, 25, 479–486. [Google Scholar] [CrossRef]
- Richter, M.R.; Song, S.M.; Yin, J.M.; Kim, M.H.; Bullard, C.W.; Hrnjak, P.S. Experimental results of transcritical CO2 heat pump for residential application. Energy 2003, 28, 1005–1019. [Google Scholar] [CrossRef]
- Hwang, Y.; Radermacher, R. Theoretical evaluation of carbon dioxide refrigeration cycle. Int. J. Heat. Vent. Air-Cond. Refrig. Res. 1998, 4, 1–20. [Google Scholar] [CrossRef]
- Skaugen, G.; Nekså, P.; Pettersen, J. Simulation of trans-critical CO2 vapour compression systems. In Proceedings of the 5th IIR-Gustav Lorentzen Conference on Natural Working Fluids, Guangzhou, China, 17–20 September 2002; pp. 82–89. [Google Scholar]
- Yokoyama, R.; Shimizu, T.; Takemura, K.; Ito, K. Performance analysis of a hot water supply system with a CO2 heat pump by numerical simulation (1st report, modeling and analysis of heat pump). JSME Int. J. Ser. B 2006, 49, 541–548. [Google Scholar] [CrossRef]
- Laipvadit, P.; Tiansuwan, J.; Kiatsiriroat, T.; Aye, L. Theoretical performance analysis of heat pump water heaters using carbon dioxide as refrigerant. Int. J. Energy Res. 2008, 32, 356–366. [Google Scholar] [CrossRef]
- Yang, J.L.; Ma, Y.T.; Li, M.X.; Hua, J. Modeling and simulating the transcritical CO2 heat pump system. Energy 2010, 35, 4812–4818. [Google Scholar] [CrossRef]
- Yamaguchi, S.; Kato, D.; Saito, K.; Kawai, S. Development and validation of static simulation model for CO2 heat pump. Int. J. Heat Mass Transf. 2011, 54, 1896–1906. [Google Scholar] [CrossRef]
- Lin, K.H.; Kuo, C.S.; Hsieh, W.D.; Wang, C.C. Modeling and simulation of the transcritical CO2 heat pump System. Int. J. Refrig. 2013, 36, 2048–2064. [Google Scholar] [CrossRef]
- Cavallini, A.; Cecchinato, L.; Corradi, M.; Fornasieri, E.; Zilio, C. Two-stage transcritical carbon dioxide cycle optimization: A theoretical and experimental analysis. Int. J. Refrig. 2005, 28, 1274–1283. [Google Scholar] [CrossRef]
- Aprea, C.; Maiorino, A. Heat rejection pressure optimization for a carbon dioxide split system: An experimental study. Appl. Energy 2009, 86, 2373–2380. [Google Scholar] [CrossRef]
- Xu, X.X.; Chen, G.M.; Tang, L.M.; Zhu, Z.J. Experimental investigation on performance of transcritical CO2 heat pump system with ejector under optimum high-side pressure. Energy 2012, 44, 870–877. [Google Scholar] [CrossRef]
- Qi, P.C.; He, Y.L.; Wang, X.L.; Meng, X.Z. Experimental investigation of the optimal rejection pressure for a transcritical CO2 heat pump water heater. Appl. Therm. Eng. 2013, 56, 120–125. [Google Scholar] [CrossRef]
- Rodrigo, L.; Laura, N.-A.; Daniel, S.; Jesús, C.-G.; Ramón, C. Subcooling methods for CO2 refrigeration cycles: A review. Int. J. Refrig. 2008, 93, 85–107. [Google Scholar]
- Sarkar, J.; Bhattacharyya, S.; Ram Gopal, M. Optimization of a transcritical CO2 heat pump cycle for simultaneous cooling and heating applications. Int. J. Refrig. 2004, 27, 830–838. [Google Scholar] [CrossRef]
- Sarkar, J.; Bhattacharyya, S.; Ram Gopal, M. Simulation of a transcritical CO2 heat pump cycle for simultaneous cooling and heating applications. Int. J. Refrig. 2006, 29, 735–743. [Google Scholar] [CrossRef]
- Sarkar, J.; Bhattacharyya, S.; Ram Gopal, M. Performance of a transcritical CO2 heat pump for simultaneous water cooling and heating. ASHRAE Trans. 2010, 116, 534–541. [Google Scholar]
- Jribi, S.; Saha, B.B.; Koyama, S.; Bentaher, H. Modeling and simulation of an activated carbon–CO2 four bed based adsorption cooling system. Energy Convers. Manag. 2014, 78, 985–991. [Google Scholar] [CrossRef]
- Ali, S.M.; Chakraborty, A.; Leong, K.C. CO2-assisted compression adsorption hybrid for cooling and desalination. Energy Convers. Manag. 2017, 143, 538–552. [Google Scholar] [CrossRef]
- Sarkar, J.; Bhattacharyya, S.; Ram Gopal, M. Transcritical CO2 heat pump systems: Exergy analysis including heat transfer and fluid flow effects. Energy Convers. Manag. 2005, 46, 2053–2067. [Google Scholar] [CrossRef]
- Fazelpour, F.; Morosuk, T. Exergoeconomic analysis of carbon dioxide transcritical refrigeration machines. Int. J. Refrig. 2014, 38, 128–139. [Google Scholar] [CrossRef]
- Cecchinato, L.; Corradi, M.; Fornasieri, E.; Zamboni, L. Carbon dioxide as refrigerant for tap water heat pumps: A comparison with the traditional solution. Int. J. Refrig. 2005, 28, 1250–1258. [Google Scholar] [CrossRef]
- Stene, J. Residential CO2 heat pump system for combined space heating and hot water heating. Int. J. Refrig. 2005, 28, 1259–1265. [Google Scholar] [CrossRef]
- Minetto, S. Theoretical and experimental analysis of a CO2 heat pump for domestic hot water. Int. J. Refrig. 2011, 34, 742–751. [Google Scholar] [CrossRef]
- Fernandez, N.; Hwang, Y.; Radermacher, R. Comparison of CO2 heat pump water heater performance with baseline cycle and two high COP cycles. Int. J. Refrig. 2010, 33, 635–644. [Google Scholar] [CrossRef]
- Yokoyama, R.; Shimizu, T.; Ito, K.; Takemura, K. Influence of ambient temperatures on performance of a CO2 heat pump water heating system. Energy 2007, 32, 388–398. [Google Scholar] [CrossRef]
- Yokoyama, R.; Okagaki, S.; Wakui, T.; Takemura, K. Influence of operation temperatures on performance of a CO2 heat pump water heating system. J. Environ. Eng. 2008, 3, 61–73. [Google Scholar] [CrossRef]
- Yokoyama, R. Exergy analysis of CO2 heat pump water heating systems. In Proceedings of the 7th International Symposium on Environmentally Conscious Design and Inverse Manufacturing, Kyoto, Japan, 30 November–2 December 2011; pp. 120–125. [Google Scholar]
- Yokoyama, R.; Wakui, T.; Kamakari, J.; Takemura, K. Performance Analysis of a CO2 heat pump water heating system under a daily change in a standardized demand. Energy 2010, 35, 718–728. [Google Scholar] [CrossRef]
- Yokoyama, R.; Kohno, Y.; Wakui, T.; Takemura, K. Performance analysis of a CO2 heat pump water heating system under a daily change in a simulated demand. Trans. JSRAE 2010, 27, 355–364. [Google Scholar]
- Ohkura, M.; Yokoyama, R.; Nakamata, T.; Wakui, T. Numerical analysis on performance enhancement of a CO2 heat pump water heating system by extracting tepid water. Energy 2015, 87, 435–447. [Google Scholar] [CrossRef]
- Yokoyama, R.; Kato, R.; Wakui, T.; Takemura, K. Performance estimation and optimal operation of a CO2 heat pump water heating system. Int. J. Thermodyn. 2013, 16, 62–72. [Google Scholar] [CrossRef]
- Deng, S.; Dai, Y.J.; Wang, R.Z. Performance optimization and analysis of solar combi-system with carbon dioxide heat pump. Sol. Energy 2013, 98, 212–225. [Google Scholar] [CrossRef]
- Residential Heat Pump Water Heaters; Japanese Industrial Standard, No. JIS C 9220: 2011; Japanese Standards Association: Tokyo, Japan, 2011.
- Yokoyama, R.; Okagaki, S.; Ito, K.; Takemura, K. Performance Analysis of a CO2 Heat Pump Water Heating System by Numerical Simulation with a Simplified Model. In Proceedings of the 19th International Conference on Efficiency, Cost, Optimization, Simulation and Environmental Impact of Energy Systems, Aghia Pelagia, Crete, Greece, 12–14 July 2006; pp. 1353–1360. [Google Scholar]


| Specification | Value |
|---|---|
| Volume | 119 L |
| Height | 1.05 m |
| Diameter | 0.38 m |
| Overall heat transfer coefficient | 5.7 W/(m2·°C) |
| Equipment | Specification | Value |
|---|---|---|
| CO2 heat pump | Rated heat output | 4.50 kW |
| Parameters α1 | 2.90 | |
| β 1 | 35.9 × 10⁻³ | |
| γ 1 | 23.8 × 10⁻⁶ | |
| α 2 | −0.386 | |
| β 2 | −5.40 × 10⁻³ | |
| γ 2 | 88.0 × 10⁻⁶ | |
| α 3 | 0.00430 | |
| β 3 | −19.2 × 10⁻³ | |
| γ 3 | 73.0 × 10⁻⁶ | |
| α 4 | 0.415 | |
| β 4 | 6.94 × 10⁻³ | |
| γ 4 | 56.8 × 10⁻⁶ | |
| α 5 | −87.2 | |
| β 5 | −7.69 × 10⁻³ | |
| γ 5 | 20.3 × 10⁻³ | |
| α 6 | −0.00033 | |
| β 6 | −2.36 × 10⁻³ | |
| γ 6 | 19.1 × 10⁻⁶ | |
| Hot water storage tank | Volume | 370 L |
| Height | 1.45 m | |
| Diameter Overall heat transfer coefficient | 0.57 m 0.80 W/(m2·°C) | |
| Heat exchanger | Product of overall heat transfer coefficient and area | 500 W/°C |
| Bathtub | Heat loss coefficient | 14.0 × 10⁻⁶ 1/s |
| Item | System M | System U |
|---|---|---|
| Ratio of heat pump COP | 0.953 | 1.000 |
| Ratio of storage efficiency | 0.998 | 1.000 |
| Ratio of system efficiency | 0.951 | 1.000 |
| Volume of stored hot water | 790.5 L | 775.4 L |
| Volume of unused hot water | 166.4 L | 198.7 L |
© 2018 by the authors. Licensee MDPI, Basel, Switzerland. This article is an open access article distributed under the terms and conditions of the Creative Commons Attribution (CC BY) license (http://creativecommons.org/licenses/by/4.0/).
Share and Cite
Yokoyama, R.; Ohkura, M.; Nakamata, T.; Wakui, T. Numerical Analysis for Performance Evaluation of a Multi-Functional CO2 Heat Pump Water Heating System. Appl. Sci. 2018, 8, 1829. https://doi.org/10.3390/app8101829
Yokoyama R, Ohkura M, Nakamata T, Wakui T. Numerical Analysis for Performance Evaluation of a Multi-Functional CO2 Heat Pump Water Heating System. Applied Sciences. 2018; 8(10):1829. https://doi.org/10.3390/app8101829
Chicago/Turabian StyleYokoyama, Ryohei, Masashi Ohkura, Takuya Nakamata, and Tetsuya Wakui. 2018. "Numerical Analysis for Performance Evaluation of a Multi-Functional CO2 Heat Pump Water Heating System" Applied Sciences 8, no. 10: 1829. https://doi.org/10.3390/app8101829
APA StyleYokoyama, R., Ohkura, M., Nakamata, T., & Wakui, T. (2018). Numerical Analysis for Performance Evaluation of a Multi-Functional CO2 Heat Pump Water Heating System. Applied Sciences, 8(10), 1829. https://doi.org/10.3390/app8101829