Featured Application
This paper presents a method to identify the location and depth of surface cracks in cylindrical components based on scanning laser line source (SLLS) techniques. The research results are conducive to improving the accuracy and efficiency of laser ultrasonic testing for complex structures such as curved surface structures.
Abstract
Cylindrical structures play an important role in industrial fields. The surface crack is a typical defect in the cylindrical structures. Non-destructive surface crack detection of these structures is critical to the safe operation of the equipment. In this study, the signal enhancement of the scanning laser line source (SLLS) method is investigated by a numerical simulation method to identify the location and depth of the surface crack in the aluminum cylinder. A fully coupled explicit finite element model is established to study the signal enhancement of cylindrical surface waves on the aluminum cylinder. The simulation results indicate that the signal enhancement of the SLLS is more sensitive to the surface crack of a cylinder than that of the scanning laser detection (SLD) because of the wider span and higher peak. Due to the phase shift characteristics of surface waves on the cylinder, the maximum peak-to-peak amplitude of signal enhancement in the SLLS method (the SLLS peak) is affected by the detection position and diameter of the cylinder. Therefore, an optimization approach for detection position in SLLS is proposed for the location of surface crack on the cylinder. The locations of the surface crack on the solid cylinders with different diameters are investigated using simulated laser ultrasonic field data. Moreover, we find that the SLLS peak for signal enhancement can effectively respond to the crack depth within a limited scope which is dependent on the directivity pattern of the longitudinal waves.
1. Introduction
Cylindrical structures are widely used and play an extremely important role in industrial fields, for example in rocket shells, turbine shafts, engine crankshafts, train axles, pipelines, wind turbine towers, pressure vessels, etc. Cylindrical structures usually work under very tough conditions that involve bearing cyclic loads, impact loads, corrosion, high or low temperatures, and so on, and are prone to crack initiation [1,2,3]. Crack initiation and growth threaten the safety of structures, and would result in serious consequences such as casualties and significant financial losses. In practice, cracks initiate predominantly at the surface [4]. Therefore, it is of utmost importance that surface cracks on cylindrical structures are detected.
A variety of methods have been developed for the efficient detection of cracks on cylinders, such as optical fibers [5], electrical resistance [6], vibration detection [7], magnetic induction [8], infrared thermography [9], and ultrasound testing [10,11,12,13]. Among them, the ultrasound testing technique has been widely used due to its relatively high spatial resolution, portable operation, high performance ratio, and high effectiveness in damage detection. However, the application of traditional ultrasonic techniques is limited, especially in environments of high temperature and radiation. In addition, traditional ultrasonic techniques are difficult to apply to the curved surface for the coupling difficulty of traditional transducers [14].
Non-contact ultrasonic techniques are of practical importance, since it permits making ultrasonic measurements at elevated temperatures, in corrosive and other hostile environments, in geometrically difficult-to-reach locations, at a remote distance from the test structure [15]. Currently, non-contact ultrasonic techniques are practicable using air-coupled transducers [16,17], optical interferometers [18,19], electromagnetic acoustic transducers (EMATs) [20,21], and laser generation. Since the 1960s, pulsed lasers have emerged as an alternative method for the generation and detection of ultrasound. Laser ultrasonic techniques provide a number of advantages over traditional ultrasonic methods such as high spatial resolution, non-contact generation, and distant testing. Laser ultrasonic techniques are very suitable for the detection of the surface crack on the curved surface [22,23,24,25,26,27,28].
In previous works, the propagation of ultrasound generated by a pulsed laser on the cylinder was studied both theoretically and experimentally. Shant Kenderian [22] found that there was a strong phase shift as the wave propagated along the circumferential path of cylindrical specimens, and the phase shift was directly related to the radius of the curvature and, to an extent, was much more sensitive than dispersion. Pan [23,24] presented 3D and 2D models that predict the acoustic waves generated by a laser point pulse and line pulse in a transversely isotropic cylinder. Mineo et al. [25] developed a numerical approach to efficiently study the phase shift effects on different materials, curvatures, and frequencies. Clorennec and Royer [26] applied laser ultrasonic techniques for the detection of surface-breaking slots in steel cylinders, and the results indicated that defects of lower size had a cumulative effect on the reflected Rayleigh waves. Yan Zhao et al. [27,28] established a finite element model (FEM) to investigate the laser-induced circumferential waves of a hollow cylinder with a crack, and the results showed that the existence of surface cracks and inner cracks generated a bipolar waveform between the S0 mode and A0 mode in the circumferential waves. To the author’s knowledge, although there have been many studies on the propagation of ultrasound generated by a pulsed laser on the solid cylinder, little research has been devoted to detecting the surface crack on the cylindrical structures, using laser ultrasonics [26,27,28]. This paper focuses on the surface crack detection of the solid cylinder. Identification methods for the surface crack location and surface crack depth of a solid aluminum cylinder will be discussed in detail, using a numerical method.
Generally, the types of ultrasonic waves used to detect the surface crack are Lamb waves [29,30], Rayleigh waves [31], circumferential surface waves [26], and circumferential guided waves [32,33]. In our work, we use circumferential surface waves to detect the surface crack of a solid cylinder. Traditional techniques for the identification of the surface crack rely on monitoring the reflection (pulse-echo) or changes in the amplitude of transmission (pitch-catch) of the incident wave caused by the presence of a surface crack [34,35]. However, the changes in the amplitude of reflection and transmission are often too weak to be detected for small defects relative to the wavelength of the generated Rayleigh wave. The scanning laser line source (SLLS) technique was proposed as an alternative inspection method to overcome these size limitations [36]. The SLLS technique is based on monitoring the changes of the amplitude or frequency of laser ultrasonic as a laser source scans over a crack. When the laser scanning is close to a surface-breaking defect in a metal sample, the peak-to-peak amplitude of the ultrasonic Rayleigh wave increases significantly compared to the Rayleigh wave that is generated in the far field [34,37,38]. Results of previous experiments and numerical simulations showed that this signal enhancement effectively identified surface cracks on plates [34,37]. In fact, surface-breaking defects often have a complicated geometry other than the “normal slot” used in many calibration tests [39]. The signal enhancement factor could be used to identify the position of branched defects and provide an idea of the defect geometry. For the angled surface defect, near field enhancements in the amplitude and frequency of surface waves could potentially be used to identify different angled cracks in real samples. When compared to the SLLS method, the scanning of the detection point may be a better method for locating angled surface defects [40]. Although many scholars have adopted the signal enhancement of the SLLS method to identify the surface crack of plates, very few studies have focused on the detection of the surface crack on the solid cylinder, using signal enhancement. In comparison to the surface waves propagating on plates, surface waves propagating on the solid cylinder demonstrate characteristics of phase shift and are more susceptible to interference from other types of waves. This makes the surface crack detection of a solid cylinder based on the signal enhancement method more difficult to implement. Therefore, this paper explores the signal enhancement method for laser scanning detection of the surface crack in a solid cylinder. The optimization approach of detection position in SLLS is proposed for the location of the surface crack on the solid aluminum cylinder and the SLLS peak of signal enhancement within a limited scope is adopted to identify the surface crack depth of a solid aluminum cylinder.
In light of the complexity of the generation of laser ultrasonics and the interactive process of the acoustic wave with the surface crack, a numerical method is suitable for dealing with these complicated processes due to its flexibility in modeling complicated geometry and the feasibility of obtaining full field numerical solutions [41,42]. Furthermore, numerical modeling of laser ultrasonics can allow direct studies on the interplay of the various factors, leading to the improvement of experimental design [42,43]. In this paper, an explicit finite element model of laser ultrasonics is developed for the acquisition of laser ultrasonic field data in a cylinder and a fully coupled thermal-stress method is considered here. Following that, we explore the interaction of laser ultrasonics with the surface crack of the solid cylinder in detail.
2. Numerical Model of Laser Ultrasonics for a Solid Cylinder
The principle of generation of laser ultrasonics can be expressed as follows: When laser pulses illuminate the surface of a metallic material, one part of the total energy is absorbed by the surface region of the material, causing temperature rise by heat absorption. Thermal energy then diffuses into the specimen as thermal waves. The heated region undergoes thermal expansion, and thermoelastic stresses generate elastic waves (ultrasound) that propagate deep within the sample [44]. Various modes of ultrasound are formed under the constraints of the material surface and internal conditions. In this paper, the discussion of laser power is restricted to a safe level so that ultrasonic waves can be generated and used for non-destructive testing (NDT) applications without harming target specimens. The thermoelastic fields are governed by the coupled equations of thermoelasticity. The governing equations for an isotropic solid are represented as follows [45]:
where is the temperature field inside the sample; is the ambient temperature; u is the displacement vector field; k is thermal conductivity; is the density of the sample; cv is the specific heat; q is the energy of a pulsed laser; is the thermoacoustic coupling constant: ; is linear expansion coefficient; and are the Lamé constants.
Without considering viscous damping, the finite-element formulation of governing equations, Equations (1) and (2), can be expressed as [46]:
where T is the temperature matrix; U is the displacement matrix; M is the mass matrix; is the thermo-mechanical coupling matrix; is the stiffness matrix; is the mechanical-thermal coupling matrix; is the heat capacity matrix; is the heat transfer matrix; F is the node load vector; Q is the temperature load matrix. A fully coupled thermal-stress method is achieved by the setting of the parameters and .
The explicit finite element method is used in this paper to solve the laser-ultrasonic coupling (Equations (3) and (4)). Solutions of the thermal and mechanical equations are simultaneously obtained by an explicit coupling matrix. The explicit approach does not require iterations or solving tangent stiffness matrices and therefore occupies fewer computing resources than an implicit solution; it has a high computational efficiency. However, the explicit finite element method is only conditionally stable. The time increment used in an explicit approach must be smaller than the stability limit of the operators for the center difference method and forward difference methods [47,48,49]. The implicit finite element method is unconditionally stable, and there is no inherent limit to the size of the time increment. The number of incremental steps used in a typical implicit simulation is several orders of magnitude smaller than that in an explicit simulation. However, the laser-induced stress wave has a high frequency and a wide bandwidth. In order to obtain a high accuracy of stress wave propagation, the incremental step must be very small, so the advantages of an implicit mode are not prominent. In summary, the explicit finite element method has a higher computational efficiency and requires fewer computer resources than the implicit method when dealing with thermoelastic problems [48,49].
In the explicit finite element model of laser ultrasonics, the equations of motion for the body are integrated using the explicit central difference integration rule, while the heat transfer equations are integrated using the explicit forward-difference time integration rule.
where . Equations (5) and (6) are brought into Equations (3) and (4) to obtain the solution of the fully coupled finite element equation.
In this research, a laser line source parallel to the cylinder axis in the length direction is used in FEM. A laser source with an approximate Gaussian beam energy distribution is used to thermoelastically generate ultrasonic waves in the solid aluminum cylinder studied. The rise time of the laser beam pulse is 4 ns. The width of the laser line source is 1 mm. The values of the laser energy density is set to E = 1 mJ per unit length of the line source. A slot parallel to the cylinder axis is used to simulate the surface crack on the isotropic aluminum cylinder. In this paper, the length of the cylinder, the length of the slot, and the length of the laser line source are assumed to be infinite. Therefore, the ultrasonic field excited by the laser line source in the isotropic cylinder can be simplified to a two-dimensional cross section of the cylinder [45], as shown in Figure 1.
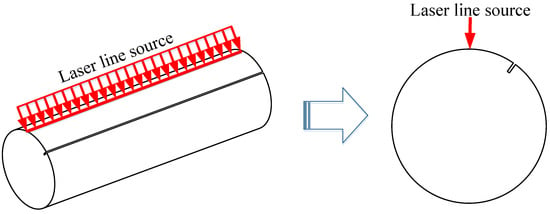
Figure 1.
Simplification of the simulated model cylinder from 3D to 2D.
In procedures of explicit dynamics, the temporal and spatial resolution of finite element simulations are of fundamental importance to the stability and accuracy of the solution. Laser generated ultrasound waves require a very small time-step to accurately resolve their high frequencies components. After several tests, the explicit finite element model converges steadily when the incremental time step ∆t = 0.5 ns is imposed.
A reasonable spatial resolution for the propagating waves can be obtained if the size of the finite elements spatial grids is at least 1/20 of the shortest wavelength to be analyzed [50].
where is the element length and is the shortest wavelength of interest. In this paper, the recommended finite element size is 20 μm, which is much finer for obtaining the transient ultrasonic field accurately.
In order to verify the explicit finite element simulation model, a comparison has been performed using Pan’s study [23], which contains the results of experimental and calculated normal displacements at an observation angle of 180° for an aluminum cylinder under thermoelastic generation. In our research, the properties of the aluminum cylinder used for numerical simulations are shown in Table 1. The numerical results are presented in Figure 2a. LL is the first longitudinal wave reflected from the cylindrical surface, and LT are the converted waves of longitudinal and transverse waves converted at the cylindrical surface. The numerical results agree well with the results of [23]. This indicates that the finite element model we established is reasonable and has the potential to be used in a further study of the surface crack identification with laser ultrasonic testing. Furthermore, Figure 2b shows the velocity magnitude map where we can clearly distinguish the spatial distribution of various waveforms. Ultrasonic waves that are excited by a pulsed laser in a cylinder are surface skimming longitudinal wave, surface wave, longitudinal wave, and shear wave [25]. In the ultrasonic wave field generated by a pulsed laser, the surface wave mode traveling along the top surface is most dominant, and the surface skimming longitudinal wave mode having a longitudinal wave velocity propagates just underneath the top surface. Then, the longitudinal waves and shear waves modes become prevailing in the cylinder body as they move further away from the laser source [51].

Table 1.
Properties of the aluminum cylinder used in numerical simulations.
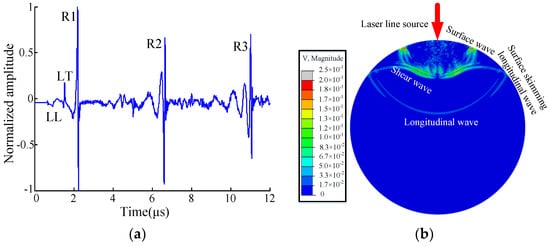
Figure 2.
(a) Normal displacements at the observation angle of 180° relative to the center of the laser line source on the surface of a cylinder with a diameter of 4.12 mm (LL: the reflected longitudinal wave; LT: the converted waves of the longitudinal and transverse wave; R1, R2, R3: the first, second, and third roundtrips of the cylindrical surface waves). (b) The velocity magnitude map at 3.7 μs.
3. Signal Enhancement of Cylindrical Surface Waves
In this section, the signal enhancement of surface waves is investigated based on the numerical model described above. A Cartesian coordinate system is set up on a cylinder that has a diameter of 20 mm, as shown in Figure 3. Point D represents the detection position. The angle between D and the center of the laser line source on the surface of the cylinder is θ (0 ≤ θ ≤ 180°). α is the angle between the negative direction of the x-axis and the artificial rectangular crack with a depth of 1.0 mm and width of 0.2 mm. The incident direction of the laser beam is defined as the y-axis. In order to ensure the accuracy of detection and facilitate the laser ultrasonic detection of the cylinders, the position of excitation and detection are fixed, and laser ultrasonic scanning detection of the cylinder is achieved by rotating the cylinder clockwise. For the sake of convenience, we assume that the initial position of the cylinder is α = 0. During the clockwise rotation of the cylinder, the crack first passes through the laser excitation beam and then passes through detection point D, as shown in Figure 3.
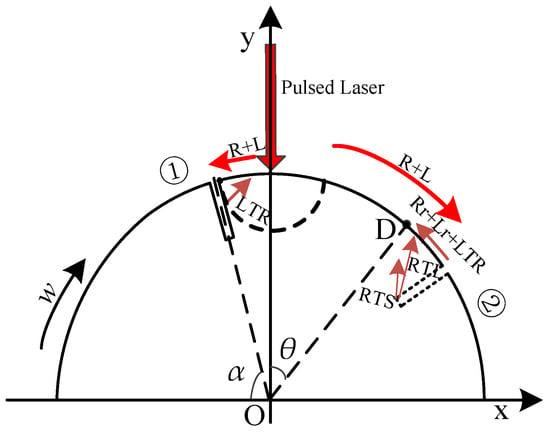
Figure 3.
Schematic diagram of the cross section of the half cylinder (L—the surface skimming longitudinal wave; R—the surface wave; Lr—the reflected surface skimming longitudinal wave; LTR—the mode-converted longitudinal-to-Rayleigh wave; RTL—the mode-converted Rayleigh-to-longitudinal wave; Rr—the reflected Rayleigh wave; RTS—the mode-converted Rayleigh-to-shear wave; ➀, ➁—the positions of surface cracks; RTL, RTS are not marked at Position ➀; w—the rotation direction of the cylinder; D—the detection point; α—the angle between the negative direction of the x-axis and the artificial rectangular crack; θ—the angle between D and the center of the laser line source.
The ultrasonic surface waves excited by a pulsed laser propagate simultaneously clockwise and counterclockwise on the surface of the cylinder. When the surface waves meet the crack, the parts of the surface waves with a wavelength greater than the crack depth will continue to propagate across the crack, while the surface waves with a wavelength smaller than the crack depth will act on the edge of the crack. Figure 4 presents the B-scan image of the out-of-plane velocity of the scattered surface waves at a surface crack that is 1.0 mm deep when the crack position is α = 150° and the detection position is θ = 10°~90°. The most dominant features that corresponded to the various wave modes are labeled and their propagation paths are shown at Position ➁ in Figure 3.
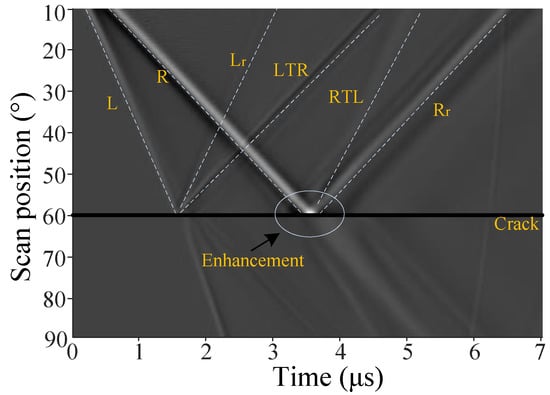
Figure 4.
B-scan showing the out-of-plane velocity from FEM when α = 150°, θ = 10°~90°. The dotted lines in the graph are used to assist with the identification of the types of scattered waves.
According to the Huygens principle, when the ultrasonic waves act on the edge of a crack, the corner of the crack can be recognized as a new source of ultrasonic waves reflector. The surface skimming longitudinal wave (L) reaches the edge of the crack first, and interacts with the crack to generate the reflected surface skimming longitudinal wave (Lr) and the mode-converted longitudinal-to-Rayleigh wave (LTR). The surface wave (R) then interacts with the crack and generates the reflected Rayleigh wave (Rr), the mode-converted Rayleigh-to-longitudinal wave (RTL), and the mode-converted Rayleigh-to-shear wave (RTS) [52]. Since the RTS has less energy in the out-of-plane displacement, it is not obvious in the B-scan shown in Figure 4. At the edge of the crack, the R wave and any Rr or mode-converted waves interfere, and a significant amplitude enhancement can be observed. This region is marked in Figure 4. The signal enhancement in the near field of the crack can be explained by the wave superposition of RTL, R, and Rr. From the spatial distribution of the mode-converted bulk wave, the out-of-plane displacement has a relatively large contribution from the RTL that comes from the lower crack tip [38], as shown at Position ➁ in Figure 3. It has been suggested that the signal enhancement near the surface crack can be used as a fingerprint of the presence of the surface crack, which is the same as that of the plate. Unfortunately, as the distance from the surface crack increases, the amplitude of RTL attenuates rapidly, hence the signal enhancement can only be detected in a small area near the edge of the surface crack.
With the crack scanning close to the pulsed laser source, the counterclockwise propagating surface wave generated by the pulsed laser source interacts with the crack at position α, as shown at Position ➀ in Figure 3. As mentioned above, Lr, LTR, Rr, RTL, and RTS are generated by the interaction between waves that propagate on the cylindrical surface and the crack. The arrival time of these waves, whose paths (0 ≤ α ≤ 90°) are shown schematically at Position ➀ in Figure 3, are given by
where d is the diameter of the cylinder; , , and are the propagation velocities of the Rayleigh, longitudinal, and shear waves in the solid cylinder, and they can be estimated at dominant frequency of laser excitation. and ignore the time of the wave propagation in the crack depth and the crack width.
Figure 5a shows the out-of-plane displacement at θ = 30° when the crack position α is 60°, 65°, 70°, 75°, 80°, and 85°. According to Equations (8)–(12), the various wave modes can be identified and are thus labeled in Figure 5a. It is observed that, at the crack position α = 85°, a new wave appears at the position of LTR and superimposes with the surface wave. Since the six signals in Figure 5 are displayed at the same time, the amplitude of each signal will be scaled down. For a clearer analysis of this new wave, the out-of-plane displacements of α = 60°, 80°, and 85° and θ = 30° are selected and are presented in Figure 6. Compared with other modes of waves, the surface wave is dominant when the crack position α is 60° and 80°. It is observed that, when the crack position α is 80°, a new wave appears at the time of LTR, and the amplitude is significantly larger than that of the other waves except for the surface wave, as shown in Figure 6b. However, when the crack position is 85°, where it is closer to the excitation source position, the new wave dominates the out-of-plane displacement and superimposes with the surface wave, resulting in an increase of peak-to-peak, as shown in Figure 6c. According to the propagation time of the wave, this new wave can only be a converted wave of the longitudinal wave that is generated by the interaction between the longitudinal propagation inside of the material and the edge of the crack. Figure 5b shows the out-of-plane displacement for α = 80° when the detection position θ is 5°, 10°, 15°, 20°, 25°, and 30°. This shows that, as the detection distance increases, the time interval between the superposition waves of LTR and the new wave with Rr remains unchanged. It also reveals that the new wave has the same velocity as the Rayleigh waves, so we can deduce that the new wave is the LTR, and the mode can be explained by the pulse laser impinging on the top surface of the cylinder and propagating into the cylinder. Some components of longitudinal waves with limited directions impact on the edge of the notch so that the longitudinal waves are converted into the Rayleigh waves, which in turn propagate back into the surface of the cylinder and superimpose with the surface waves. When the crack is closer to the excitation source, more longitudinal waves are converted into surface waves, resulting in the enhancement of the surface waves.

Figure 5.
Out-of-plane displacement at (a) α = 60°, 65°, 70°, 75°, 80°, and 85° and θ = 30°; (b) α = 80° and θ = 5°, 10°, 15°, 20°, 25°, and 30°.

Figure 6.
Out-of-plane displacement at θ = 30°—(a) α = 60°; (b) α = 80°; (c) α = 85°.
In the plate, the laser scanning method can be divided into SLLS and scanning laser detection (SLD) techniques [40]. The SLD method is mainly performed by scanning the detector. When the detection position is close to the edge of the crack, the peak-to-peak amplitudes of the surface waves in the near field of the crack are enhanced due to the superposition of the reflected wave, RTL, and the incident wave. Meanwhile, the enhancement of the surface waves can be used as a fingerprint of the presence of the surface crack. The SLLS method is realized by scanning the pulse laser beam. When the pulsed laser beam approaches the edge of the crack, the peak-to-peak amplitudes of the surface waves also increase. In light of the above discussion, during the laser ultrasonic scanning detection of a cylinder, the crack approaching the laser source can be recognized as SLLS, and the crack passing the detection point can be considered as SLD.
Figure 7 shows the peak-to-peak amplitudes of the SLLS and SLD when the cylinder is rotated counterclockwise from the position α = 0. This indicates that the peak-to-peak amplitudes of surface waves rapidly increase in the range of α = 60~90°, and rapidly decrease after the crack has passed the laser source. Comparing the peak-to-peak amplitudes of the SLLS and SLD, it can be seen that the SLLS peak is obviously higher than that of the SLD peak. This is mainly due to the different modes of superposition waves in these two cases, which has been discussed above. Moreover, the span of the peak-to-peak variation of the SLLS method is much larger than that of the SLD method, as shown in Figure 7. This is because the RTL, which plays a decisive role in the signal enhancement of the SLD method, attenuates rapidly as the distance increases. On the other hand, the attenuation of the LTR, which makes a relatively large contribution to the signal enhancement of the SLLS, is very small in comparison.
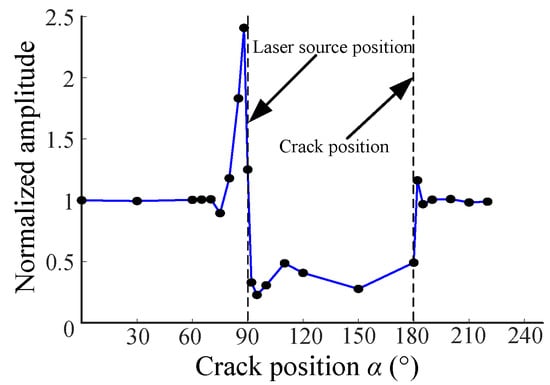
Figure 7.
Peak-to-peak amplitudes of the cylindrical surface waves.
In light of the above discussion, it is obvious that the signal enhancement of the SLLS method is more sensitive in the identification of the surface crack on a cylinder than that of the SLD method.
4. Identification of Surface Crack Location
The existence of a surface crack in a cylinder results in an enhancement of the surface waves near the laser line source. In response, the signal enhancement method has been developed for the identification of the surface crack on the cylinder. However, due to the different circumferential distances from the excited laser source, the degree of signal enhancement is different. This will be presented in the follow-up discussion. In this section, an optimization approach for the detection position in SLLS is proposed to locate the surface crack on the cylinder. The surface crack’s location on the cylinder with different diameters is investigated using the simulated laser ultrasonic field data. For numerical simulations, the cracked cylinder model described in the previous section is utilized.
4.1. Optimal Detection Position in the SLLS Method
In [22], there appeared to be strong shift effects as the wave propagated along the circumferential path of the cylindrical specimens. The phase shift effect was observed even under conditions where dispersion is not detected. The phase shift causes the polarity of the surface wave to be different at different positions from the excitation source [22,25], as shown in Figure 8f. When the scattered waves superimpose with the surface waves, which have a different polarity, the peak-to-peak of the cylindrical surface waves may increase or decrease. Figure 8a–e show the variations in the peak-to-peak amplitudes of surface waves at different positions of detection, when the SLLS method is used. It is clear that the crack at α = 90° can be identified by the peak-to-peak amplitude enhancement. However, the SLLS peaks are different at different positions of detection. The SLLS peaks at θ = 90° and 120° is higher than that of θ = 30°, 60°, and 120°. The SLLS peaks of the cracked cylinder (see Figure 8a–e) at the unipolar position of the intact surface waves (see Figure 8f) are significantly higher than that of the cracked cylinder at the bipolar position. In fact, higher SLLS peaks are more conducive to the identification of the surface crack.
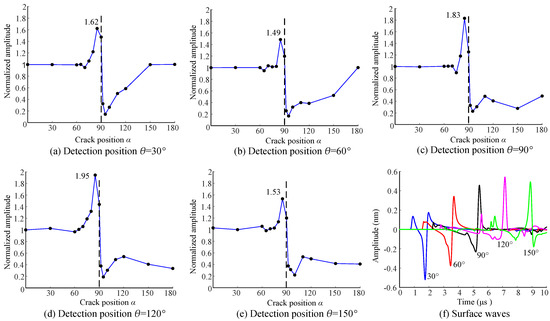
Figure 8.
(a–e) The peak-to-peak amplitudes of surfaces waves on the cracked cylinder with a diameter of 20 mm, when θ is 30°, 60°, 90°, 120°, and 150°. (f) The surface waves of the intact cylinder when θ is 30°, 60°, 90°, 120°, and 150°. All peak-to-peak amplitudes are normalized to a peak-to-peak amplitude at α = 0, and the dashed line indicates the position of the crack. The numbers marked in the figure represent the value of the scanning laser line source (SLLS) peaks.
To explore the inducement of the phenomenon shown in Figure 8, we define the remaining waves (RWs) as the difference between the waves propagating on the cracked cylinder and the waves propagating on the intact cylinder. According to the analysis in the previous section, the RWs are the superposition of LTR waves and reflection waves on the surface waves, although the LTR waves constitute the main part, as shown in Figure 6 and Figure 9. It is observed from Figure 9 that there is also a regular change in the polarity of the RWs at different positions of detection, which indicates that the phase shift also exists in the RWs. Comparing Figure 9a–e, it is found that, when the surface waves of the intact cylinder or the RWs are unipolar, the superposition of the RWs and the surface waves increase the peak-to-peak amplitudes. When the surface waves and the RWs are bipolar, there is a partial wave cancellation as the RWs superimpose with the surface waves, as shown in Figure 9b.
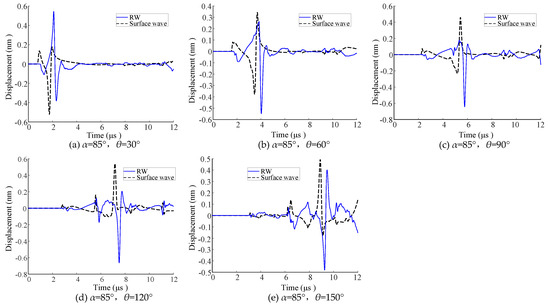
Figure 9.
(a–e) Surface waves on the intact cylinder (solid lines) and the remaining waves (RWs) on the cracked cylinder (dashed lines) at α = 85° when θ = 30°, 60°, 90°, 120°, and 150°.
In order to further study the signal enhancement at different positions of detection, the phase shift of the surface waves on the intact cylinder and the RWs on the cracked cylinder with a diameter of 20 mm are shown in Figure 10. The calculation method of the instantaneous phase of surface waves is obtained from the method described in [22]. The fit curve for the phase shift of the surface waves on the intact cylinder is , and the fit curve for the phase shift of the RWs on the cracked cylinder is . This indicates that the phase shift of the surface waves on the intact cylinder at the unit circumferential angle is 1.44, while that of the RWs on the cracked cylinder is 1.58. As shown in Figure 10, the change in the phase shift for these two situations is similar. The main reason for the difference is that the RWs are not composed of one type of wave but, rather, are a superposition of the Rr and the LTR waves. The initial phase of the surface wave on the intact cylinder is 1.84° when the circumferential position is 0°. It is known that the surface wave excited by the laser line source is a unipolar wave when the detection position is near the laser source. The initial phase of the RWs on the cracked cylinder is −151.57°, which indicates that the polarity of the RWs is opposite to the surface wave and the RWs are almost unipolar waves at θ = 0°.
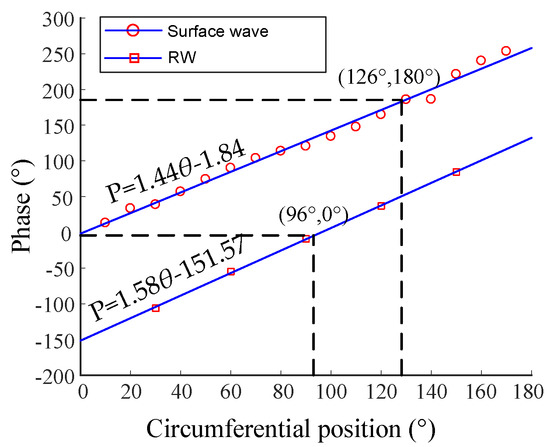
Figure 10.
Phase shifts of cylindrical surface waves on the intact cylinder and the RWs on the cracked cylinder, both with a 20 mm diameter. The solid lines represent fit curves for the phase shift of the cylindrical surface waves and the RWs.
According to the fit curve of the phase shift displayed in Figure 10, we obtain the unipolar position of the surface waves and the RWs. When P = 0° or 180°, the surface waves of the intact cylinder are unipolar and the unipolar detection position is obtained at θ = 1.28° or 126°. Using the same method, the RWs are unipolar waves when θ = 96°. Thus, it is observed from Figure 8a–e that the SLLS peak is the highest when θ = 120°, where the position is near the unipolar position of the surface waves on the intact cylinder and the RWs. Simultaneously, the SLLS peak of the surface waves at θ = 60° is obviously smaller than that of the other positions due to the bipolar superposition of the surface waves on the intact cylinder and the RWs on the cracked cylinder. The unipolar position of the surface waves of an intact cylinder can be recognized as the approximate optimal detection position for the location of a surface crack using the SLLS method.
4.2. Location of Surface Crack on Cylinders with Different Diameters
On the basis of the surface wave velocity equation for the cylindrical surface [53], Shant Kenderian separated the phase term of the surface wave as a part of the dispersion equation, and obtained a relationship between the phase, velocity, frequency, radius, and elastic constants. The formula is as follows [22]:
where … represent the different functions of , , and and have the units of velocity squared; , R is the radius of the cylinder; k is the wavenumber; Ф is the phase of wave propagation.
Equation (13) indicates that the phase of the cylindrical surface wave is not only related to the material of the cylinder but also closely related to its diameter. Therefore, this section explores the location of the surface crack on cylindrical structures with different diameters using the laser ultrasonic SLLS method.
Figure 11 shows the peak-to-peak variation of SLLS signals at detection positions of θ = 30°, 60°, 90°, 120°, and 150° for a cylinder with a diameter of 10 mm. There is a signal enhancement near the surface crack edge and a rapid drop in the peak-to-peak amplitudes after the crack passes the laser source at any θ. Comparing Figure 11a–e, the SLLS peaks are still different at different positions of detection. It is observed that the SLLS peaks of the 10 mm diameter cylinder at θ = 120° and 150° are significantly higher than those of the other detection angles, while the SLLS peaks of the 20 mm diameter cylinder are significantly higher at θ = 90° and 120°. For the unipolar position of the surface waves of the intact cylinder (Figure 11f), the SLLS peak is significantly higher than that for the bipolar positions (see Figure 11a–e), which is the same trend for the lager cylinder.
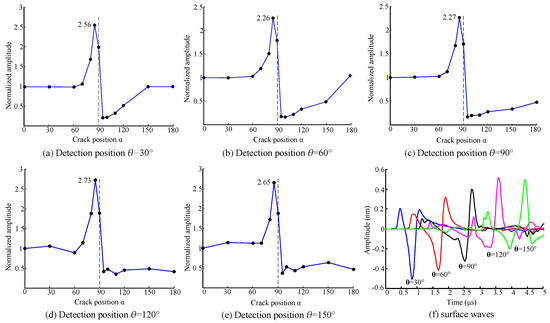
Figure 11.
(a–e) The peak-to-peak amplitudes of surfaces waves on the cracked cylinder with a diameter of 10 mm, when θ is 30°, 60°, 90°, 120°, and 150°. (f) The surface waves on the intact cylinder when θ is 30°, 60°, 90°, 120°, and 150°.
Figure 12 shows the phase shift of the surface waves on the intact cylinder with a diameter of 10 mm and of RWs on the cracked cylinder. The fit curve of the phase shift on the intact cylinder is . When P = 0 or 180°, the unipolar position of the surface waves on the intact cylinder is θ = 5°or 139°. The fit curve for the phase shift of the RWs on the cracked cylinder is . The unipolar position of the RWs is θ = 125°. This suggests that the SLLS peaks at θ = 120° and 150°, which are near the unipolar position, are higher than those at other detection angles because of the superimposition of the unipolar waves of the surface waves and the RWs. Furthermore, as can been seen from the initial phase of the surface waves, the surface waves and the RWs are unipolar and the polarities are opposite at θ = 0.
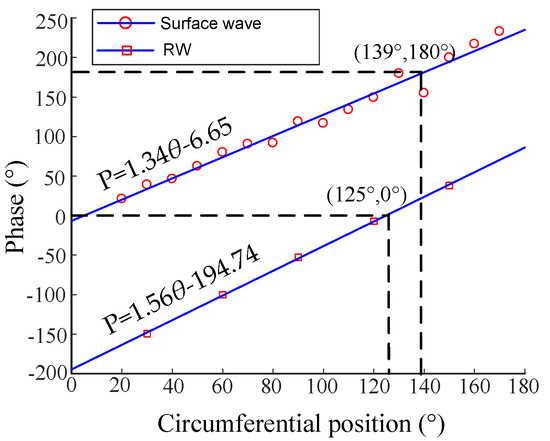
Figure 12.
Phase shifts of the surface waves on the intact cylinder and the RWs on the cracked cylinder, both with a 10 mm diameter.
Likewise, the unipolar position of the surface waves of an intact cylinder with different diameters can be recognized as the approximate optimal position for crack detection using the SLLS method. It is clear from Figure 10 and Figure 12 that the phase shift rule of surface waves is different for different diameters. In order to describe the difference of the phase shift in cylinders of different diameters, the phase shift rate (PSR) here is defined as the variation of the phase per unit distance along the circumferential surface. The PSR of different diameters is investigated using the FEM of laser ultrasonics, as described in the previous section. The variation of the PSR with diameter is shown in Figure 13. The fit curve of the PSR with different diameters is PSR = 22.98exp(−0.05R). As the diameter of the cylinder is decreased, the PSR is increased and the phase shift changes faster. When the diameter of the cylinder is infinite, the specimen is a plate. At this time, the phase shift rate is 0, which also indicates that there is no phase shift for the surface waves on a plate. Therefore, it can be deduced that the SLLS peaks of the surface waves in the plate will remain constant when the attenuation of the surface wave propagation is neglected.
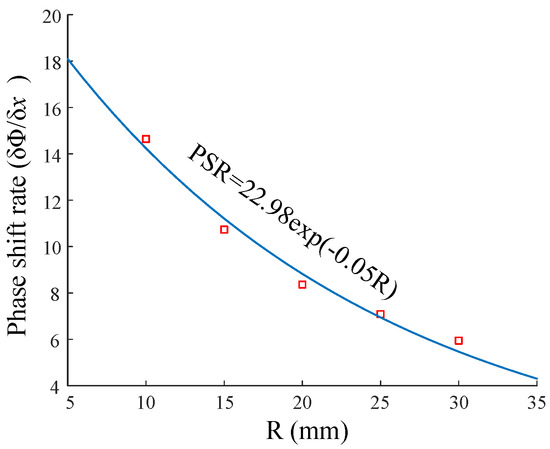
Figure 13.
Phase shift rate (PSR) as a function of cylinder diameters.
In light of the above discussion, for cylinders with different diameters, the steps of locating the surface crack can be described as follows: First, the PSR corresponding to the respective diameter is obtained from the phase rate curve. Second, the phase shift curve of the intact cylinder is constructed by the phase shift rate and the initial phase, which is usually ignored. Third, the unipolar position of the surface waves is obtained from the phase shift curve. Finally, the SLLS method is implemented for the location of a surface crack on the cylinder, while the unipolar position is used as the optimal detection position.
5. Identification of Surface Crack Depth
In the present work, the surface crack of the metal material is equivalent to a filter: the laser ultrasonic signals with a wavelength less than the crack depth interact with the edge of the crack to transform into scattered waves, and the laser ultrasonic signals with a wavelength larger than the depth of the crack cross the crack and form transmission waves that continue to propagate. Therefore, the depth of the surface crack affects the signal enhancement, which can be induced by the superposition of scattered waves and incident waves. In this section, a method for determining the depth of the surface crack by using the SLLS peaks of signal enhancement is investigated.
Studies were made using rectangular cracks with a range of depths. The depths of the cracks on the cylinder with diameters of 10 and 20 mm range from 0.2 to 2.0 mm with a step of 0.2 mm. In order to obtain the SLLS peaks, the position of the crack in the SLLS method is at α = 85°, while the positions of detection are at θ = 30°, 60°, 90°, 120°, and 150°. Figure 14 shows the main results of this study.
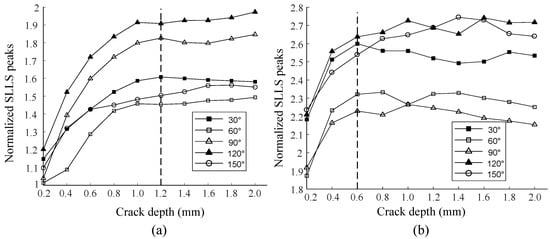
Figure 14.
Normalized SLLS peaks as a function of the depth of the crack at α = 85° on a cylinder. Detection positions θ are at 30°, 60°, 90°, 120°, and 150° as labeled. Cylinder diameter of (a) 20 mm and (b) 10 mm are studied.
It can be observed from Figure 14a that, with each increment of the crack depth, the SLLS peaks for different detection positions rise monotonically until the crack depth is 1.2 mm. It then remains almost unchanged. The trend of the SLLS peaks variation with the depth of the crack is independent of the position of detection. The same trend can be observed in Figure 14b. The trends of the SLLS peaks for each position of detection for a diameter of 10 mm are much more complex than those for a diameter of 20 mm. This is due to the reduction of the diameter, which results in the susceptibility of the propagation of the surface waves on the cylindrical surface to interference from other types of waves.
From the discussion in Section 3, we know that the enhancement of the signal in the SLLS method is mainly due to the superposition of LTR with the surface wave that propagates clockwise. The LTR is generated by the interaction of longitudinal waves propagating inside the material with the edge of the crack. From the perspective of the spatial distribution of the wave propagation, as the crack depth increases, more longitudinal waves are affected by the edge of the cracks and more converted surface waves are generated, resulting in an increased SLLS peaks. However, the longitudinal waves propagating inside the material demonstrate a directivity pattern, as shown in Figure 15a. The directivity pattern of the longitudinal waves excited by the laser line source is obtained according to the calculation method in the cited literature [54]. It is observed from Figure 15a that the amplitude directivity of longitudinal waves in aluminum is 30~60°and 120~180°. The geometric relationship between the crack and the laser source is shown in Figure 15b, where d = 20 mm, β = 30°, and α = 85°. According to the geometric relation, we obtain h = 1.3 mm, which indicates that, if the crack depth exceeds 1.3 mm, the range of the amplitude directivity pattern is 90~120°. Hence, the energy of the longitudinal waves is very small, resulting in very little energy in the LTR. Therefore, the SLLS peaks no longer continue to increase, as shown in Figure 14a. To verify the results, we obtained h = 0.6 mm for the cylinder with a diameter of 10 mm, based on the same calculation method. Figure 15b shows that, when the depth of the crack exceeds 0.6 mm, the SLLS peaks no longer increase, and oscillations occur.
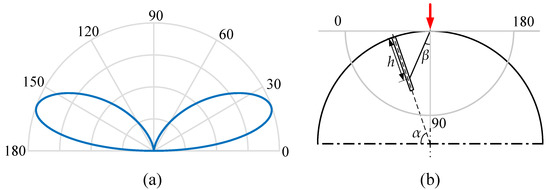
Figure 15.
(a) Directivity pattern of the longitudinal waves excited by a laser line source in aluminum; (b) The geometric relationship between the crack and the laser source; h is the crack depth; β is the angle between the center of the laser line source and the direction of longitudinal wave propagation.
In light of the above discussion, the SLLS peaks are proposed to characterize the depth of the crack on a cylinder within the amplitude patterns of longitudinal waves. In other words, the SLLS peaks of signal enhancement only respond to the depth of the surface crack within a limited range. To resolve this problem, a time-frequency analysis method can be proposed to detect the depth of the crack over a wider range, and this will be studied in our future research.
6. Conclusions
The signal enhancement of cylindrical surface waves on the cracked cylinder has been demonstrated by a fully coupled explicit finite element model. The physical mechanisms of signal enhancement of the SLLS method and the SLD method in the near field are explained by interference between the direct surface waves and various scattered waves. The simulation results indicate that the signal enhancement of the SLLS method is more sensitive to the surface crack on a cylinder than that of the SLD method, given the wider span and higher peak of the peak-to-peak variation.
Due to the phase shift characteristic of the surface waves in the cylinder, the signal enhancement is affected by the position of detection, and the SLLS peaks at the unipolar position of the surface waves is significantly higher than that at the bipolar position. The unipolar position of the surface waves on an intact cylinder can be recognized as the approximate optimal position for the location of the surface crack using the SLLS method. The phase shift of the cylindrical surface waves is also affected by the diameter of the cylinder. To locate the surface crack on the solid cylinders with different diameters, the PSR at the diameter can first be obtained from the PSR curve, the phase shift curve can then be constructed to obtain the unipolar position of the surface waves. The unipolar position can be taken as the optimal position of detection to locate the surface crack in the SLLS method.
The depth of the surface crack affects the longitudinal wave and induces its conversion into a surface wave in the SLLS method. Due to the directivity pattern of the propagation of the longitudinal wave, the SLLS peaks no longer follow the depth of the crack when the depth of the crack exceeds a certain range, which can be calculated from the amplitude directivity pattern of the longitudinal wave. Therefore, the enhancement of the SLLS peaks can effectively represent the changes in the depth of the crack only within a limited range, which is dependent on the directivity pattern of the longitudinal waves.
This work presents a method to identify the location and the depth of the surface crack in the cylindrical structures. It provides a feasible way for the in-situ and non-contact detection of the surface crack on the cylinder. It is worth noting that realistic cracks are often relatively rough, are nonplanar, and can be partially closed. A future study with the method proposed in this paper will focus on the detection of realistic surface cracks in the cylinder.
Author Contributions
X.L. and Y.L. ran the simulation; X.L. analyzed the data and wrote the manuscript; S.Y. and Y.C. reviewed the manuscript and provided supervision and guidance in this research; X.L. and X.G. edited the manuscript; all authors contributed to discussions and feedback of the manuscript.
Funding
This research was funded by the National Natural Science Foundation of China under Grant Number 51375434.
Conflicts of Interest
The authors declare no conflict of interest.
References
- Richard, H.A.; Sander, M. Fatigue Crack Growth; Springer: Berlin/Heidelberg, Germany, 2016; pp. 239–249. ISBN 978-3-319-32534-7. [Google Scholar]
- Palin-Luc, T.; Pérez-Mora, R.; Bathias, C.; Domínguez, G.; Paris, P.C.; Arana, J.L. Fatigue crack initiation and growth on a steel in the very high cycle regime with sea water corrosion. Eng. Fract. Mech. 2010, 77, 1953–1962. [Google Scholar] [CrossRef]
- Homma, H.; Shah, Q.; Kawada, S. Effect of temperature gradient on crack initiation. Int. J. Press. Vessels Pip. 1995, 63, 339–345. [Google Scholar] [CrossRef]
- Turnbull, A. Characterising the early stages of crack development in environment-assisted cracking. Corros. Eng. Sci. Technol. 2017, 52, 533–540. [Google Scholar] [CrossRef]
- Choi, B.-H.; Kwon, I.-B. Strain pattern detection of composite cylinders using optical fibers after low velocity impacts. Compos. Sci. Technol. 2018, 154, 64–75. [Google Scholar] [CrossRef]
- Kwon, D.-J.; Shin, P.-S.; Kim, J.-H.; Wang, Z.-J.; DeVries, K.L.; Park, J.-M. Detection of damage in cylindrical parts of carbon fiber/epoxy composites using electrical resistance (er) measurements. Compos. Part B 2016, 99, 528–532. [Google Scholar] [CrossRef]
- Wang, K.; Guo, D.; Heyns, P.S. The application of order tracking for vibration analysis of a varying speed rotor with a propagating transverse crack. Eng. Fail. Anal. 2012, 21, 91–101. [Google Scholar] [CrossRef]
- Morgenstern, T.; Himmel, J.; Kanoun, O. Crack detection in rods using the magnetic induction. TM-Tech. Mess. 2014, 81, 573–580. [Google Scholar]
- Basheer, C.; Krishnamurthy, C.; Balasubramaniam, K. Hot-rod thermography for defect detection. Insigh 2017, 59, 484–490. [Google Scholar] [CrossRef]
- Gaul, L.; Sprenger, H.; Schaal, C.; Bischoff, S. Structural health monitoring of cylindrical structures using guided ultrasonic waves. Acta Mech. 2012, 223, 1669–1680. [Google Scholar] [CrossRef]
- Cheong, Y.-M.; Lee, D.-H.; Jung, H.-K. Ultrasonic guided wave parameters for detection of axial cracks in feeder pipes of phwr nuclear power plants. Ultrasonics 2004, 42, 883–888. [Google Scholar] [CrossRef] [PubMed]
- Siqueira, M.; Gatts, C.; Da Silva, R.; Rebello, J. The use of ultrasonic guided waves and wavelets analysis in pipe inspection. Ultrasonics 2004, 41, 785–797. [Google Scholar] [CrossRef] [PubMed]
- Tua, P.; Quek, S.; Wang, Q. Detection of cracks in cylindrical pipes and plates using piezo-actuated lamb waves. Smart Mater. Struct. 2005, 14, 1325. [Google Scholar] [CrossRef]
- Pan, Y.; Rossignol, C.; Audoin, B. Identification of laser generated acoustic waves in the two-dimensional transient response of cylinders. J. Acoust. Soc. Am. 2005, 117, 3600–3608. [Google Scholar] [CrossRef] [PubMed]
- Green, R.E., Jr. Non-contact ultrasonic techniques. Ultrasonics 2004, 42, 9–16. [Google Scholar] [CrossRef] [PubMed]
- Purnell, P.; Gan, T.; Hutchins, D.; Berriman, J. Noncontact ultrasonic diagnostics in concrete: A preliminary investigation. Cem. Concr. Res. 2004, 34, 1185–1188. [Google Scholar] [CrossRef]
- Hutchins, D.; Burrascano, P.; Davis, L.; Laureti, S.; Ricci, M. Coded waveforms for optimised air-coupled ultrasonic nondestructive evaluation. Ultrasonics 2014, 54, 1745–1759. [Google Scholar] [CrossRef] [PubMed]
- Koehler, B.; Hentges, G.; Mueller, W. Improvement of ultrasonic testing of concrete by combining signal conditioning methods, scanning laser vibrometer and space averaging techniques. NDT E Int. 1998, 31, 281–287. [Google Scholar] [CrossRef]
- Longo, R.; Vanlanduit, S.; Vanherzeele, J.; Guillaume, P. A method for crack sizing using laser doppler vibrometer measurements of surface acoustic waves. Ultrasonics 2010, 50, 76–80. [Google Scholar] [CrossRef] [PubMed]
- Thring, C.; Fan, Y.; Edwards, R. Focused rayleigh wave emat for characterisation of surface-breaking defects. NDT E Int. 2016, 81, 20–27. [Google Scholar] [CrossRef]
- Rosli, M.; Edwards, R.; Fan, Y. In-plane and out-of-plane measurements of rayleigh waves using emats for characterising surface cracks. NDT E Int. 2012, 49, 1–9. [Google Scholar] [CrossRef]
- Kenderian, S. Phase and dispersion of cylindrical surface waves. Nondestruct. Eval. 2010, 21, 224–240. [Google Scholar] [CrossRef]
- Pan, Y.; Rossignol, C.; Audoin, B. Acoustic waves generated by a laser line pulse in a transversely isotropic cylinder. Appl. Phys. Lett. 2003, 82, 4379–4381. [Google Scholar] [CrossRef]
- Pan, Y.; Perton, M.; Audoin, B.; Rossignol, C. Acoustic waves generated by a laser point pulse in a transversely isotropic cylinder. J. Acoust. Soc. Am. 2006, 119, 243–250. [Google Scholar] [CrossRef] [PubMed]
- Mineo, C.; Cerniglia, D.; Pantano, A. Surface waves on cylindrical solids: Numerical and experimental study. Ultrasonics 2013, 53, 913–921. [Google Scholar] [CrossRef] [PubMed]
- Clorennec, D.; Royer, D.; Walaszek, H. Nondestructive evaluation of cylindrical parts using laser ultrasonics. Ultrasonics 2002, 40, 783–789. [Google Scholar] [CrossRef]
- Zhao, Y.; Shen, Z.H.; Lu, J.; Ni, X.W.; Cui, Y.P. A numerical study of the interaction of laser-generated circumferential wave with defect on hollow cylinder. Opt. Laser Technol. 2012, 44, 407–411. [Google Scholar] [CrossRef]
- Zhao, Y.; Shen, Z.H.; Lu, J.; Ni, X.W.; Wang, Z.X.; Cui, Y.P. Simulation of differential circumferential wave induced by a laser pulse in hollow cylinder with an inner surface defect. Eur. Phys. J. Appl. Phys. 2012, 58, 20503. [Google Scholar] [CrossRef]
- Rathod, V.; Panchal, M.; Roy Mahapatra, D.; Gopalakrishnan, S. Lamb wave based sensor network for identification of damages in plate structures. In Proceedings of the 50th AIAA/ASME/ASCE/AHS/ASC Structures, Structural Dynamics, and Materials Conference, Palm Springs, CA, USA, 8–11 April 2009; p. 2328. [Google Scholar]
- Rathod, V.; Mahapatra, D.R. Estimation of fatigue damage parameters using guided wave technique. In Proceedings of the SPIE Smart Structures and Materials + Nondestructive Evaluation and Health Monitoring 2014, San Diego, CA, USA, 10–14 March 2014; p. 90642B. [Google Scholar]
- Edwards, R.S.; Dixon, S.; Jian, X. Characterisation of defects in the railhead using ultrasonic surface waves. NDT E Int. 2006, 39, 468–475. [Google Scholar] [CrossRef]
- Satyarnarayan, L.; Chandrasekaran, J.; Maxfield, B.; Balasubramaniam, K. Circumferential higher order guided wave modes for the detection and sizing of cracks and pinholes in pipe support regions. NDT E Int. 2008, 41, 32–43. [Google Scholar] [CrossRef]
- Towfighi, S.; Kundu, T. Elastic wave propagation in anisotropic spherical curved plates. Int. J. Solids Struct. 2003, 40, 5495–5510. [Google Scholar] [CrossRef]
- Jeong, H.; Park, M.-C. Finite-element analysis of laser-generated ultrasounds for wave propagation and interaction with surface-breaking cracks. Nondestruct. Eval. 2005, 16, 1–14. [Google Scholar] [CrossRef]
- Zhou, Z.; Zhang, K.; Zhou, J.; Sun, G.; Wang, J. Application of laser ultrasonic technique for non-contact detection of structural surface-breaking cracks. Opt. Laser Technol. 2015, 73, 173–178. [Google Scholar] [CrossRef]
- Kromine, A.; Fomitchov, P.; Krishnaswamy, S.; Achenbach, J. Laser ultrasonic detection of surface breaking discontinuities. Mater. Eval. 2000, 58, 173–177. [Google Scholar]
- Edwards, R.; Jian, X.; Fan, Y.; Dixon, S. Signal enhancement of the in-plane and out-of-plane rayleigh wave components. Appl. Phys. Lett. 2005, 87, 194104. [Google Scholar] [CrossRef]
- Jian, X.; Dixon, S.; Guo, N.; Edwards, R. Rayleigh wave interaction with surface-breaking cracks. J. Appl. Phys. 2007, 101, 064906. [Google Scholar] [CrossRef]
- Hernandez-Valle, F.; Dutton, B.; Edwards, R. Laser ultrasonic characterisation of branched surface-breaking defects. NDT E Int. 2014, 68, 113–119. [Google Scholar] [CrossRef]
- Dutton, B.; Clough, A.; Edwards, R. Near field enhancements from angled surface defects; a comparison of scanning laser source and scanning laser detection techniques. J. Nondestruct. Eval. 2011, 30, 64–70. [Google Scholar] [CrossRef]
- Shen, Z.; Xu, B.; Ni, X.; Lu, J. Numerical simulation of laser-generated ultrasonic waves in layered plates. J. Phys. D Appl. Phys. 2004, 37, 2364. [Google Scholar] [CrossRef]
- Liu, P.; Sohn, H. Numerical simulation of damage detection using laser-generated ultrasound. Ultrasonics 2016, 69, 248–258. [Google Scholar] [CrossRef] [PubMed]
- Taheri, H.; Koester, L.W.; Bigelow, T.A.; Bond, L.J. Thermoelastic finite element modeling of laser generated ultrasound in additive manufacturing materials. In Proceedings of the ASNT Annual Conference 2017, Nashville, TN, USA, 30 October–2 November 2017; pp. 188–198. [Google Scholar]
- Scruby, C.B.; Drain, L.E. Laser Ultrasonics: Techniques and Applications; Adam Hilger: Bristol, UK, 1990; pp. 223–228. ISBN 0–7503-0050-7. [Google Scholar]
- Arias, I.; Achenbach, J.D. Thermoelastic generation of ultrasound by line-focused laser irradiation. Int. J. Solids Struct. 2003, 40, 6917–6935. [Google Scholar] [CrossRef]
- Liu, W.; Hong, J.-W. Modeling of three-dimensional lamb wave propagation excited by laser pulses. Ultrasonics 2015, 55, 113–122. [Google Scholar] [CrossRef] [PubMed]
- Abaqus Analysis User’s Guide. Available online: http://abaqus.software.polimi.it/v6.13/books/usb/default.htm (accessed on 7 September 2018).
- Mineo, C.; Cerniglia, D.; Pantano, A. Numerical study for a new methodology of flaws detection in train axles. Ultrasonics 2014, 54, 841–849. [Google Scholar] [CrossRef] [PubMed]
- Pantano, A.; Cerniglia, D. Simulation of laser generated ultrasound with application to defect detection. Appl. Phys. A Mater. Sci. Process. 2008, 91, 521–528. [Google Scholar] [CrossRef]
- Xu, B.; Shen, Z.; Wang, J.; Ni, X.; Guan, J.; Lu, J. Thermoelastic finite element modeling of laser generation ultrasound. J. Appl. Phys. 2006, 99, 033508. [Google Scholar] [CrossRef]
- An, Y.K.; Kwon, Y.; Sohn, H. Noncontact laser ultrasonic crack detection for plates with additional structural complexities. Struct. Health Monit. 2013, 12, 522–538. [Google Scholar] [CrossRef]
- Guan, J. Numerical study on signal enhancement of the rayleigh wave in the near-field of surface defects. Jpn. J. Appl. Phys. 2010, 49, 062502. [Google Scholar] [CrossRef]
- Viktorov, I.A. Rayleigh and Lamb Waves: Physical Theory and Applications; Plenum Press: New York, NY, USA, 1967; pp. 29–65. [Google Scholar]
- Bernstein, J.R.; Spicer, J.B. Line source representation for laser-generated ultrasound in aluminum. J. Acoust. Soc. Am. 2000, 107, 1352–1357. [Google Scholar] [CrossRef] [PubMed]
© 2018 by the authors. Licensee MDPI, Basel, Switzerland. This article is an open access article distributed under the terms and conditions of the Creative Commons Attribution (CC BY) license (http://creativecommons.org/licenses/by/4.0/).