Article

Power Prediction of Bifacial Si PV Module with Different Reflection Conditions on Rooftop

Department of Electrical Engineering, Konkuk University, 120 Neungdong, Gwangjin, Seoul 05029, Korea
*
Author to whom correspondence should be addressed.
Appl. Sci. 2018, 8(10), 1752; https://doi.org/10.3390/app8101752
Submission received: 14 August 2018 / Revised: 21 September 2018 / Accepted: 25 September 2018 / Published: 28 September 2018
(This article belongs to the Special Issue Building-Integrated Photovoltaics)

Abstract

:
A bifacial solar module has a structure that allows the rear electrode to be added to the existing silicon photovoltaic module structure. Thus, it can capture energy from both the front and rear sides of the module. In this paper, modeling is suggested to estimate the amount of energy generated from the rear of the bifacial photovoltaic module. After calculating the amount of irradiance from the rear side, the estimated power generation is compared with the real power output from the rear side of the module. The experiments were performed using four different environments with different albedos. The theoretical prediction of the model shows a maximum of 5% and average of 1.86% error in the measurement data. Based on the nature of the bifacial solar module, which receives additional irradiance from the rear side, this study compared the output amounts with respect to different rear environments. Recently, installation of floating Photovoltaic has been increasing. As the reflection of irradiation from the water surface occurs, the positive influence of the installation with the bifacial photovoltaic can be expected. We are confident that this research will contribute to zero energy construction by designing systems based on bifacial PV module with high performance ratio when applying solar power in a microgrid environment, which is the future energy.

1. Introduction

Among high-efficiency solar cells, interests in low-cost, high-efficiency Si solar cells such as bifacial solar cells are increasing. Photovoltaics (PVs) on restricted land should be installed on buildings or on the ground [1]. The power would be correlated with the location installed for the applications [2] and environmental temperature [3], thus Building-Integrated Photovoltaics (BIPVs) and Floating Photovoltaics (FPVs) are becoming more common these days. Unlike conventional solar modules, which use the solar radiation transmitted through the front of the existing Si photovoltaic module, it generates electricity using the solar radiation transmitted through the front and the back [4]. The bifacial module has an advantage that it generates power from the incidence irradiance from both the front and the rear sides of the module. However, there are limitations in predicting and measuring accurate front and rear outputs leading to total power. Recent research indicates that the output of the bifacial module is boosted up to 50% over the single-sided module depending on the backside environment [5]. The power output of the bifacial module increases by about 20% when it is installed at the optimum height and no blockage for the direct sun array shining on the area beneath the module [6]. A study on output change according to the height and installation angle [7] would also be critical issue. Prediction of bifacial module output could be basically obtained from one-diode model [8]. Performance gain could be used for the comparison of operation for the bifacial module [9]. Annual change in power generation would also be measured with different installation [10,11]. Measurements are underway to analyze the power generation of the module depending on the rear side status of the module such as rooftop design environments [12,13,14,15]. Rear side power would be obtained using the modeling of output power from the measurement of the I–V curve (current–voltage curve) [16].
Therefore, it is expected that the use of the bifacial module will be frequent, so it is important to predict the power output of the bifacial module.
In the paper, a basic prediction model is introduced to calculate both the output of front and back sides of bifacial module. The total amount of output power is calculated and measured by estimating the amount of back side output using the amount of output power of bifacial module under Standard Test Conditions (STC) condition. The experiments were then measured for the elements of various bifacial PV output on an outdoor test site. The experimental data then allow investigation on multiple factors that influence on the bifacial PV performance, including ground albedo, angle, direction and the position of the module and the date and time to be measured.
The front and rear side of the output power are then estimated to be added to compare with the experimental data within an error rate range.

Concept of Experiments

The variation of the output power could be obtained depending on the amount of irradiance on the rear surface. Bifacial crystalline silicon photovoltaic modules are structured to add electrodes to the back side of the existing mono-facial crystalline photovoltaic module manufacturing process [17]. The passivated emitter and rear cell (PERC) is of very high interest for both research institutes and industry [18]. The solar modules used in this study were therefore fabricated using n-PERC cells.
In this paper, a module using n-PERC cells fabricated for research purpose was used for the experiment in Figure 1. The main content is that the modeling that predicts the effect of irradiance on the rear side is presented by analyzing the outputs from the front side and the rear side separately. The output is confirmed by predicting the irradiance characteristics according to Albedo, which affects the amount of irradiance on the rear side of the module. Based on the results of various studies, the solar power generation system in Korea is constructed at an installation angle of 30° for optimal output conditions, so the bifacial crystalline silicon solar module also analyzes the output characteristics at an angle of 30°. In this paper, the direct solar irradiance is estimated by considering the inclination angle of the earth, the latitude, the angle of incidence of solar irradiance, and the installation angle of the solar module, and the total irradiance affecting the rear is calculated using the direct and scattered amount of irradiance. It is explained that the output power varies depending on the albedo of the rear surface. In addition, comparisons were made for different environments to compare the output depending on the amount of irradiance on the rear side.
The goal of this study is to use the collected data in a preliminary step to improve Rooftop Photovoltaic system and other PV environments with bifacial crystalline Si solar modules.

2. Modeling and Method

2.1. Rear Side Reflection

The solar radiation directly affects the output of the solar module. The sun’s altitude and direction of incidence, which vary with the seasons, account for a large amount of sun entering the solar module. Therefore, in this paper, we try to predict the output power using the solar radiation, which varies with altitude and date, rather than acquiring the incident irradiance into a simple pyranometer attached on the rear side [19]. It is assumed that the total irradiance ( I T o t a l ) entering the back of the bifacial solar module is the sum of the direct irradiance ( I R e a r , d i r ) and diffuse irradiance ( I R e a r , d i f f ) [20,21]. At the rear, it is divided into the amount of irradiance reflected directly from the ground and the amount reflected from the surroundings. The total irradiance is expressed in terms of the GHI (Global Horizontal Irradiance), which is the amount of irradiance incident on the horizontal surface. The total irradiance includes both Direct Normal Irradiance (DNI) and Diffuse Horizontal Irradiance (DHI) [16].
Direct irradiance and reflected irradiation incident on the inclined module were measured by Ineichen et al. [22], and the scattered radiation dose is based on the Perez model [23]. In this paper, the view factor is used to determine the element of back reflection to be predicted. The concept of view factor based on heat transfer was introduced to explain the directional effect of radiant heat transfer between two surfaces [24]. View factor is a pure geometric quantity that is independent of heat and surface properties. The view factor from i to j is defined as “ F i j ” or “ F i j ”.   F i j is the part of the irradiation that directly strikes from surface i to j .
For example, the view factor “ F 12 ” represents the amount of direct radiation from Surface 1 to Surface 2, and “ F 12 ” represents the amount of radiation from Surface 2 to Surface 1. The basic principle for obtaining the view factor is shown in Figure 2.
Equation (1) is used to obtain F 12 .
  F 12 = 1 A 1 A 2 A 1 c o s θ 1 c o s θ 2 π r 2 d A 1 d A 2
In this paper, the total area of irradiance affecting the rear side of the module is obtained by using the view factor, assuming that the area of the module is A m and A s is the area of the ground where the irradiance that affects the back of the module is reflected. A N S is the area that could not directly affect the back of the module.
Therefore, it can be said that the irradiance reflected on the rear side of the module is determined by the shadow of the module and the outer part of the shadow. Figure 3 shows the two components of the irradiance reflected on the rear side of the module.
The total area of the irradiance affecting the rear of the module can be expressed by the view factor. F m s is the View Factor of region A S of irradiance affecting the area of A m . β is the angle between the module and the ground, as shown in Equation (2).
  F m s = 1 c o s ( 180 ° β ) 2
Therefore, the irradiance incident on the rear surface can be expressed as the sum of the amounts of direct irradiance and scattered irradiance on the area of the module ( A m ). The albedo coefficient α is used for determining the direct irradiance ( I R e a r , d i r ) and scattered irradiance ( I R e a r , d i f f ) incident on the rear side as shown in Equation (3).
  I R e a r = α D N I F A S A m + α ( G H I D N I ) F A S A m

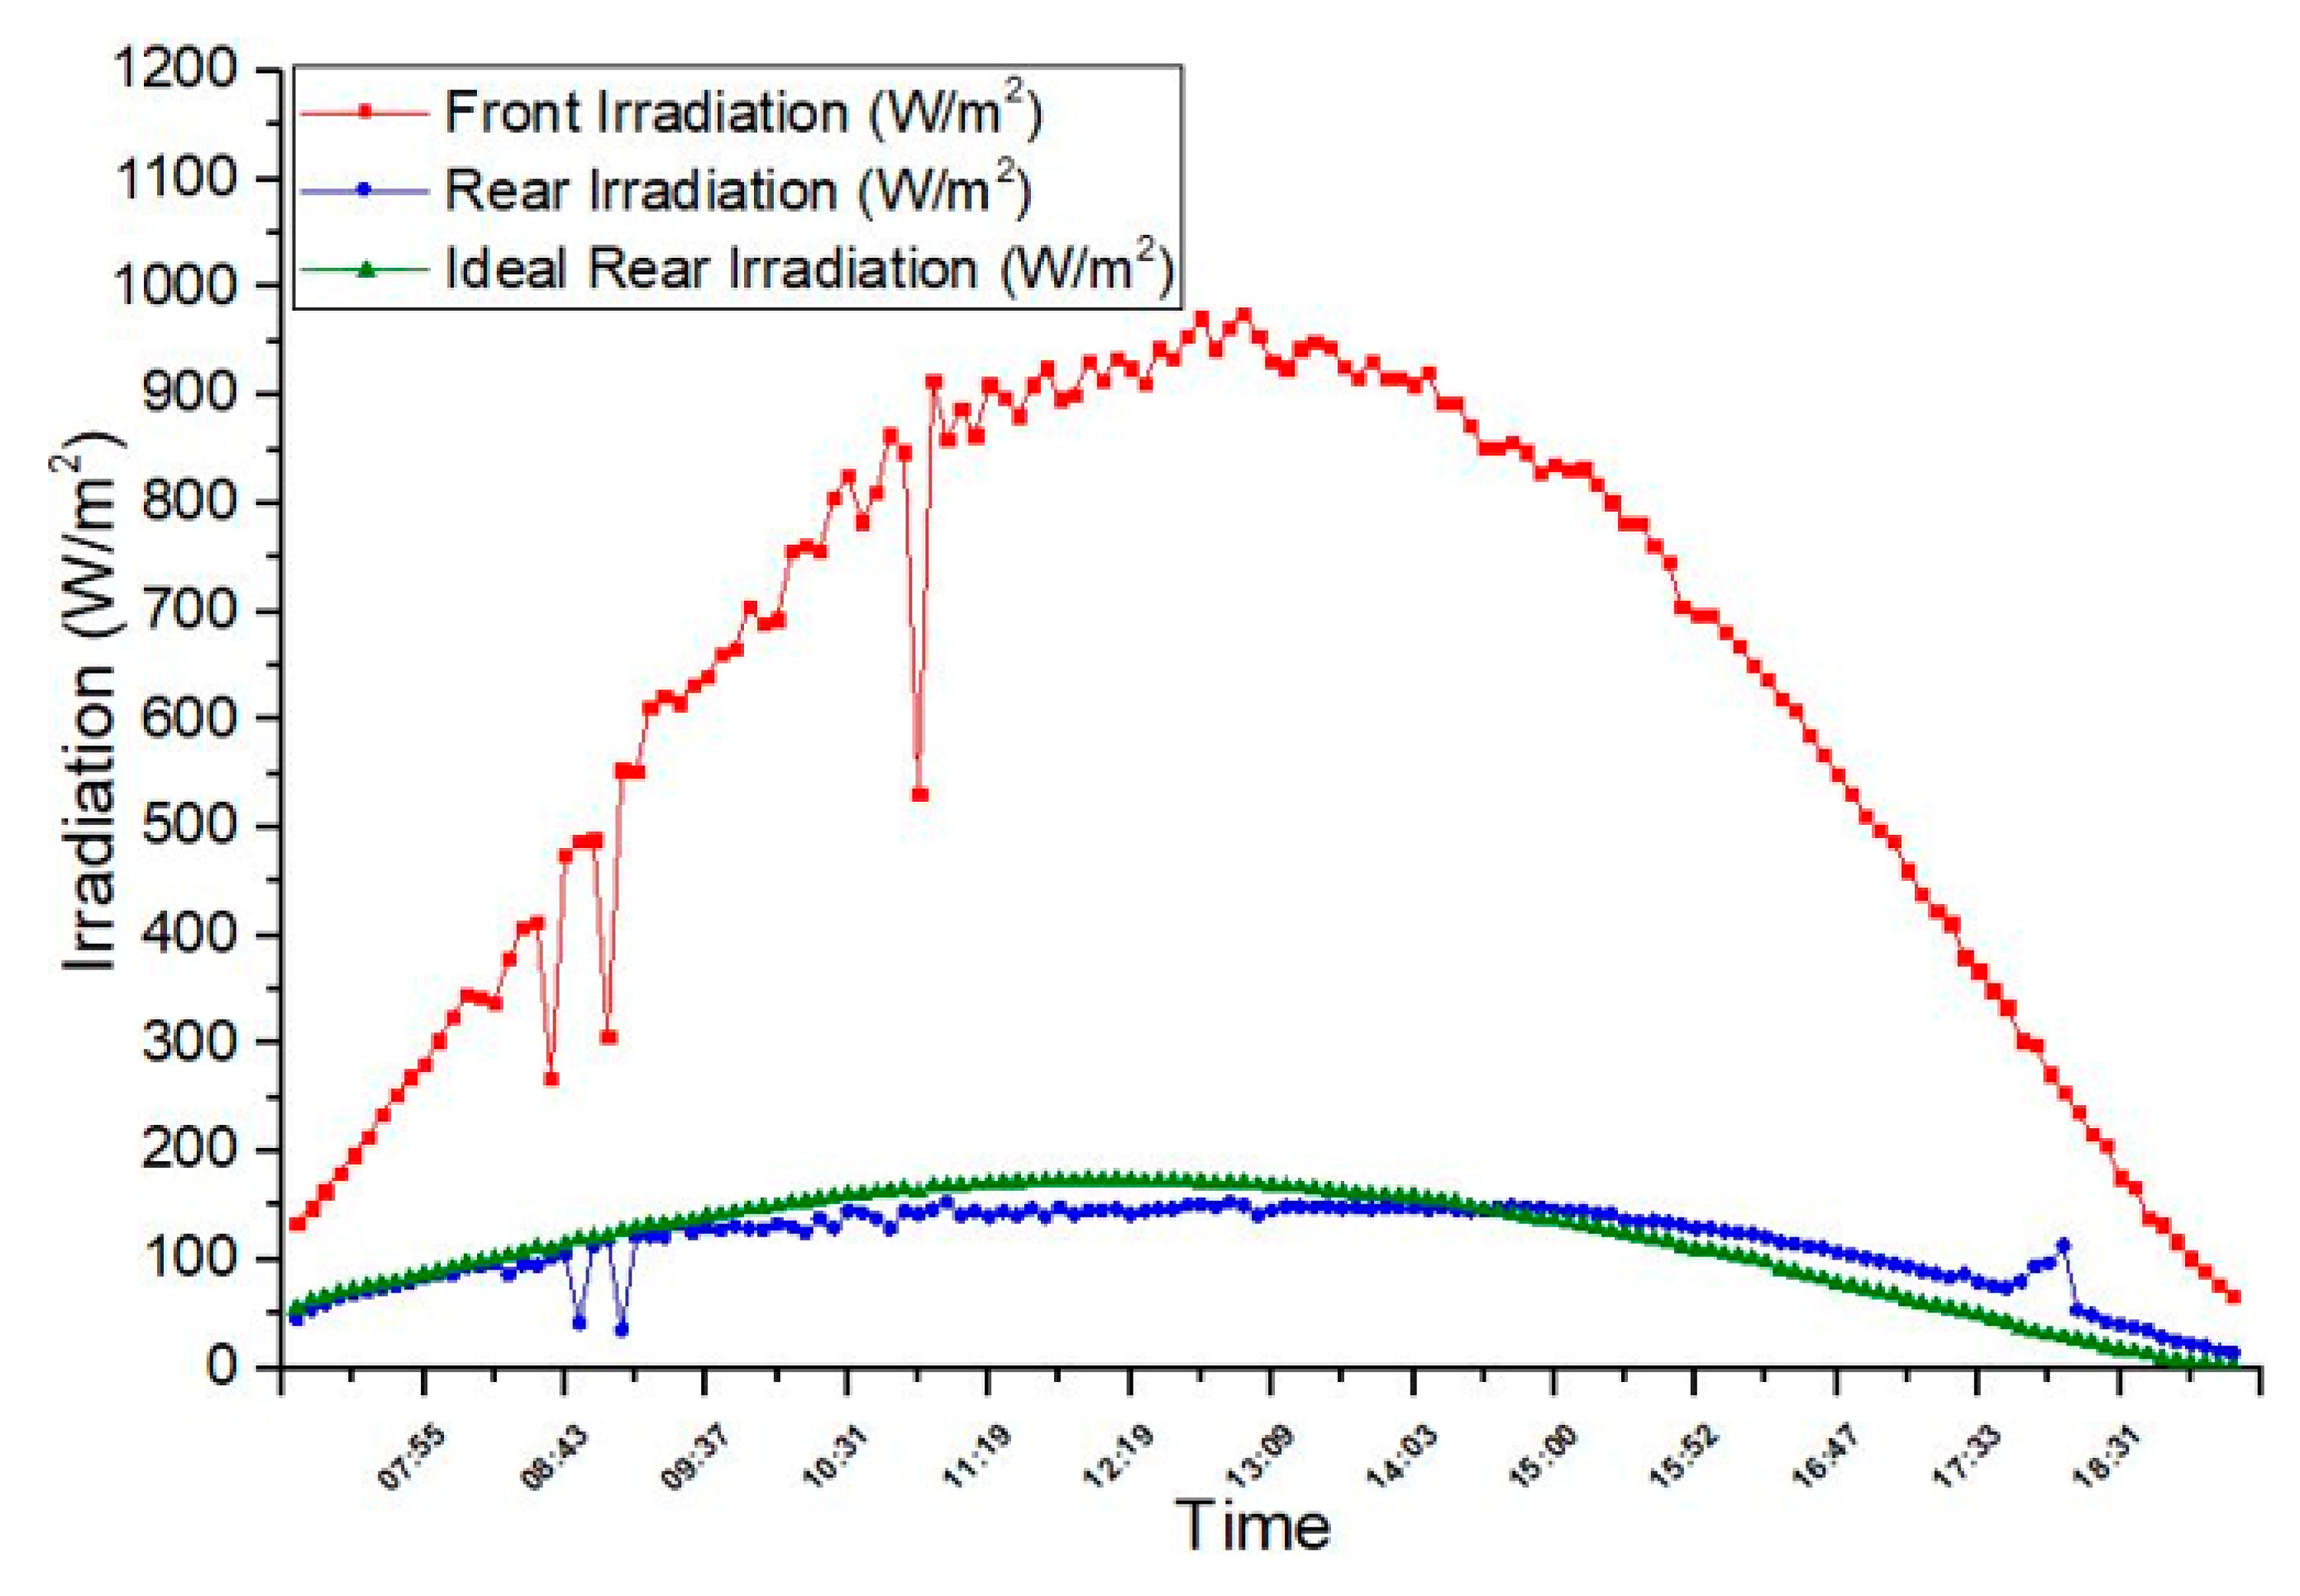
2.2. Irradiance Prediction of the Rear Side

When the solar module is installed, the value of the total irradiance ( I T o t a l ) reaching the module can be divided into the front irradiance ( I F r o n t ) and the rear irradiance ( I R e a r ). The amount of irradiance entering the front side of the module can be easily measured by installing an irradiance detector. On the other hand, it is difficult to measure the irradiance on the rear side because of scattered and direct irradiance. Therefore, the irradiance entering the rear of the module is divided into a direct reflection component and an indirect reflection component.
The amount of total irradiance ( I R e a r ) on the module by the rear environment is expressed as the sum of direct reflection and indirect reflection. Therefore, the total amount of irradiance on the rear side of the module is assumed to be as given by Equation (4).
  I R e a r = I R e a r , d i r   +   I R e a r , d i f f
To express the direct irradiance and scattered irradiance, we use the concept of view factor described in Section 2.1. Therefore, Equation (3) can be expressed by Equations (5) and (6).
I r e a r = α D N I 1 c o s ( 180 ° β ) 2 + α ( G H I D N I ) ( 1 c o s ( 180 ° β ) 2 F m )
I r e a r = α D N I 1 + c o s β 2 + α ( G H I D N I ) ( 1 + c o s β 2 F m )
1 + c o s β 2 is a value showing the area where the sunlight is reflected and scattered by the rear environment on the rear part of the module due to the view factor when the ground and module are installed at an angle of β. α is the coefficient of albedo due to the rear environment. F m is defined by the View Factor affecting to the module from the ground based on the process of obtaining F m s . In Equation (6), the values of α, 1 + c o s β 2 , and F m are considered as constants. The total irradiation (GHI) and the amount of DNI depend on the location, time, and environment of the place where the solar module is installed.

2.3. Prediction of the Total Irradiation

The amount of total irradiation (GHI) can be considered the same as that measured in the solar irradiation system installed at the front of the module. The amount of DNI can be obtained according to the installation location, time, and environment. The amount of direct irradiance can be obtained from Equation (7) [25].
  D N I = G   ×   c o s θ z s
In Equation (7), G is the amount of solar irradiation corresponding to the location, time, and environment on d n day of experiment and θ z s is the angle between the direction perpendicular (Zenith) to the ground and the sun.   d n day is the number of days that have elapsed since the first day of a year. For example, 31 December has a d n day of 365 [26]. The tilted angle was changed from 20° to 90° in a step size of 0.1°, and the corresponding value of maximum global irradiance for a specific period is defined as the optimal tilted angle [27].
Figure 4 supports the process of obtaining the global irradiance value for the formula. Latitude is the angle measured at the center of the earth, between the equator plane and experiment point. It is expressed either north or south and varies from 0° to 90°. Declination is the angle made between the plane of the equator and the line joining the two center of the earth and the sun. The declination varies between 23.45 ° δ 23.45 ° . It is positive during summer and negative during winter. The solar time is represented by ω . It is the sun’s angular deviation from south and the range is 180 ° ω 180 ° , negative before solar noon. θ Z S is the Zenith Angle. It is incidence angle of sunbeam on a horizontal surface. During the same day, Zenith angle determines amount of radiation received by surface [25].
G = 1367 ε 0 0.7 A M 0.678
In Equation (8), ε 0 is the eccentricity correction factor that corrects the eccentric observed value and converts it to the value at the original observation point. The Air Mass (AM) would be a coefficient that specifies the effect of the atmosphere on a clear day. c o s θ Z S can be calculated by Equation (9).
  c o s θ Z S = s i n δ s i n + c o s δ c o s c o s ω  
In Equation (9), δ is the slope of the sun. ω is expressed as ω = 0° at noon and changes by 15° per hour. represents the latitude of the measurement position.
In most engineering applications, the simplest expression for the eccentricity correction factor on d n day is given by Equation (10).
  ε = 1 + 0.033 c o s ( 360 d n 365 )  
The slope δ of the sun can be obtained from Equation (11).
  δ = 23.45 ° s i n [ 360 ( d n + 284 ) 365 ]  
The AM can be obtained from Equation (12).
  A M = 1 c o s θ Z S  
Based on the above, the DNI can be expressed as Equation (13)
  D N I   =   1367 × 23.45 ° s i n [ 360 ( d n + 284 ) 365 ] × 0.7 A M 0.678 × c o s θ Z S  

2.4. Prediction of Output of the Bifacial Module

The output power of the bifacial module ( P b i f a c i a l ) is assumed to be the sum of the front output power ( P f r o n t ) and the rear output power ( P r e a r ).
After the bifacial module is manufactured, the outputs of the front side and the rear side of the module are measured under the Standard Test Conditions (STC). As the measured output power is reflected without absorbing all the irradiance, it is corrected by the coefficient κ which is the ratio of the total area of the module to the area without the cell and ribbon. It is assumed that the difference between the front output and the rear output is the additional output power, as shown in Equation (14).
  P S T C , a d d i t i o n a l = κ P S T C , f r o n t P S T C , r e a r  
I r e a r in Equation (15) is obtained by using the position of the measurement point and the date time by installing it at the measuring point of the bifacial module and measuring the solar irradiance of the front ( I r e a l . f r o n t ) .
Using Equations (15) and (16), the output from the rear side is predicted.
  1000   W / m 2   :   P S T C , r e a r = I r e a r   : P r e a l , r e a r  
  P r e a l , r e a r = P S T C , r e a r   ×   I r e a r 1000   W / m 2  
Similarly, the output from the front side is predicted using Equations (17) and (18).
  1000   W / m 2   :   P S T C , f r o n t = I f r o n t   : P r e a l , f r o n t  
  P r e a l , f r o n t = P S T C , f r o n t   ×   I f r o n t 1000   W / m 2  
The output from the front side and rear side can be predicted using the above, and the total output of the bifacial module can be represented as the sum of these values, as shown in Equation (19).
  P r e a l , t o t a l = P r e a l , f r o n t + P r e a l , r e a r  

3. Proof of Theoretical Approach

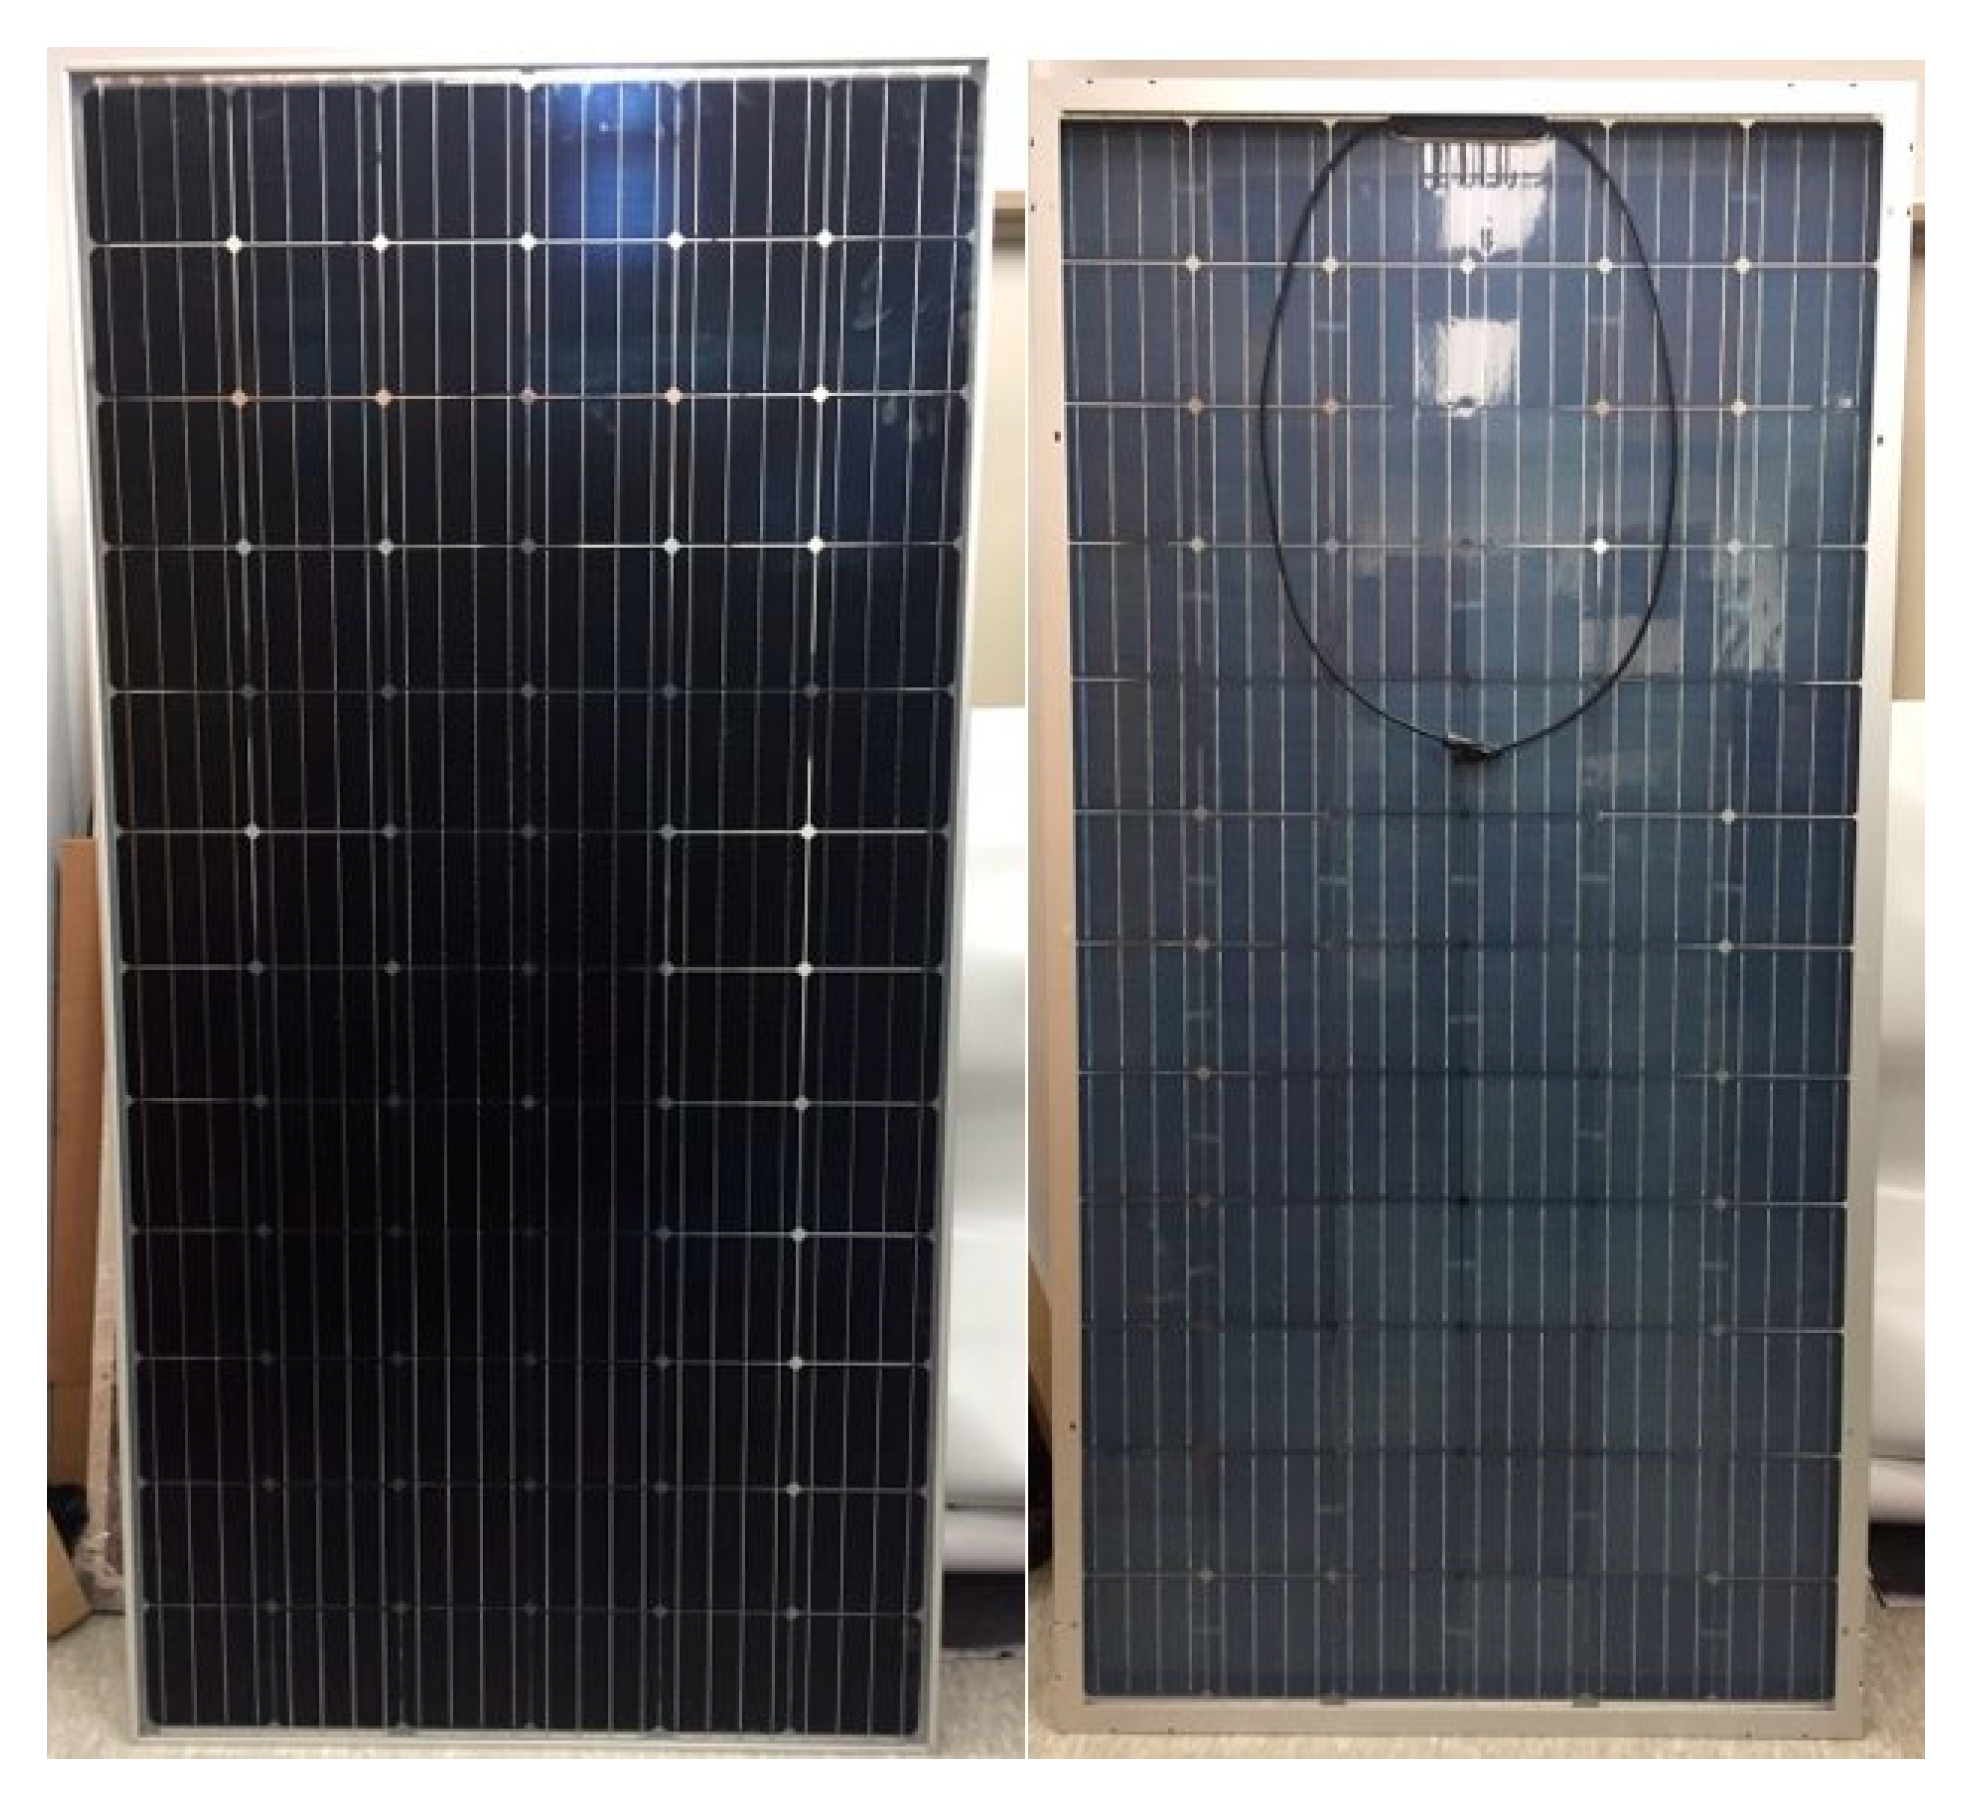
3.1. Experimental Preparation
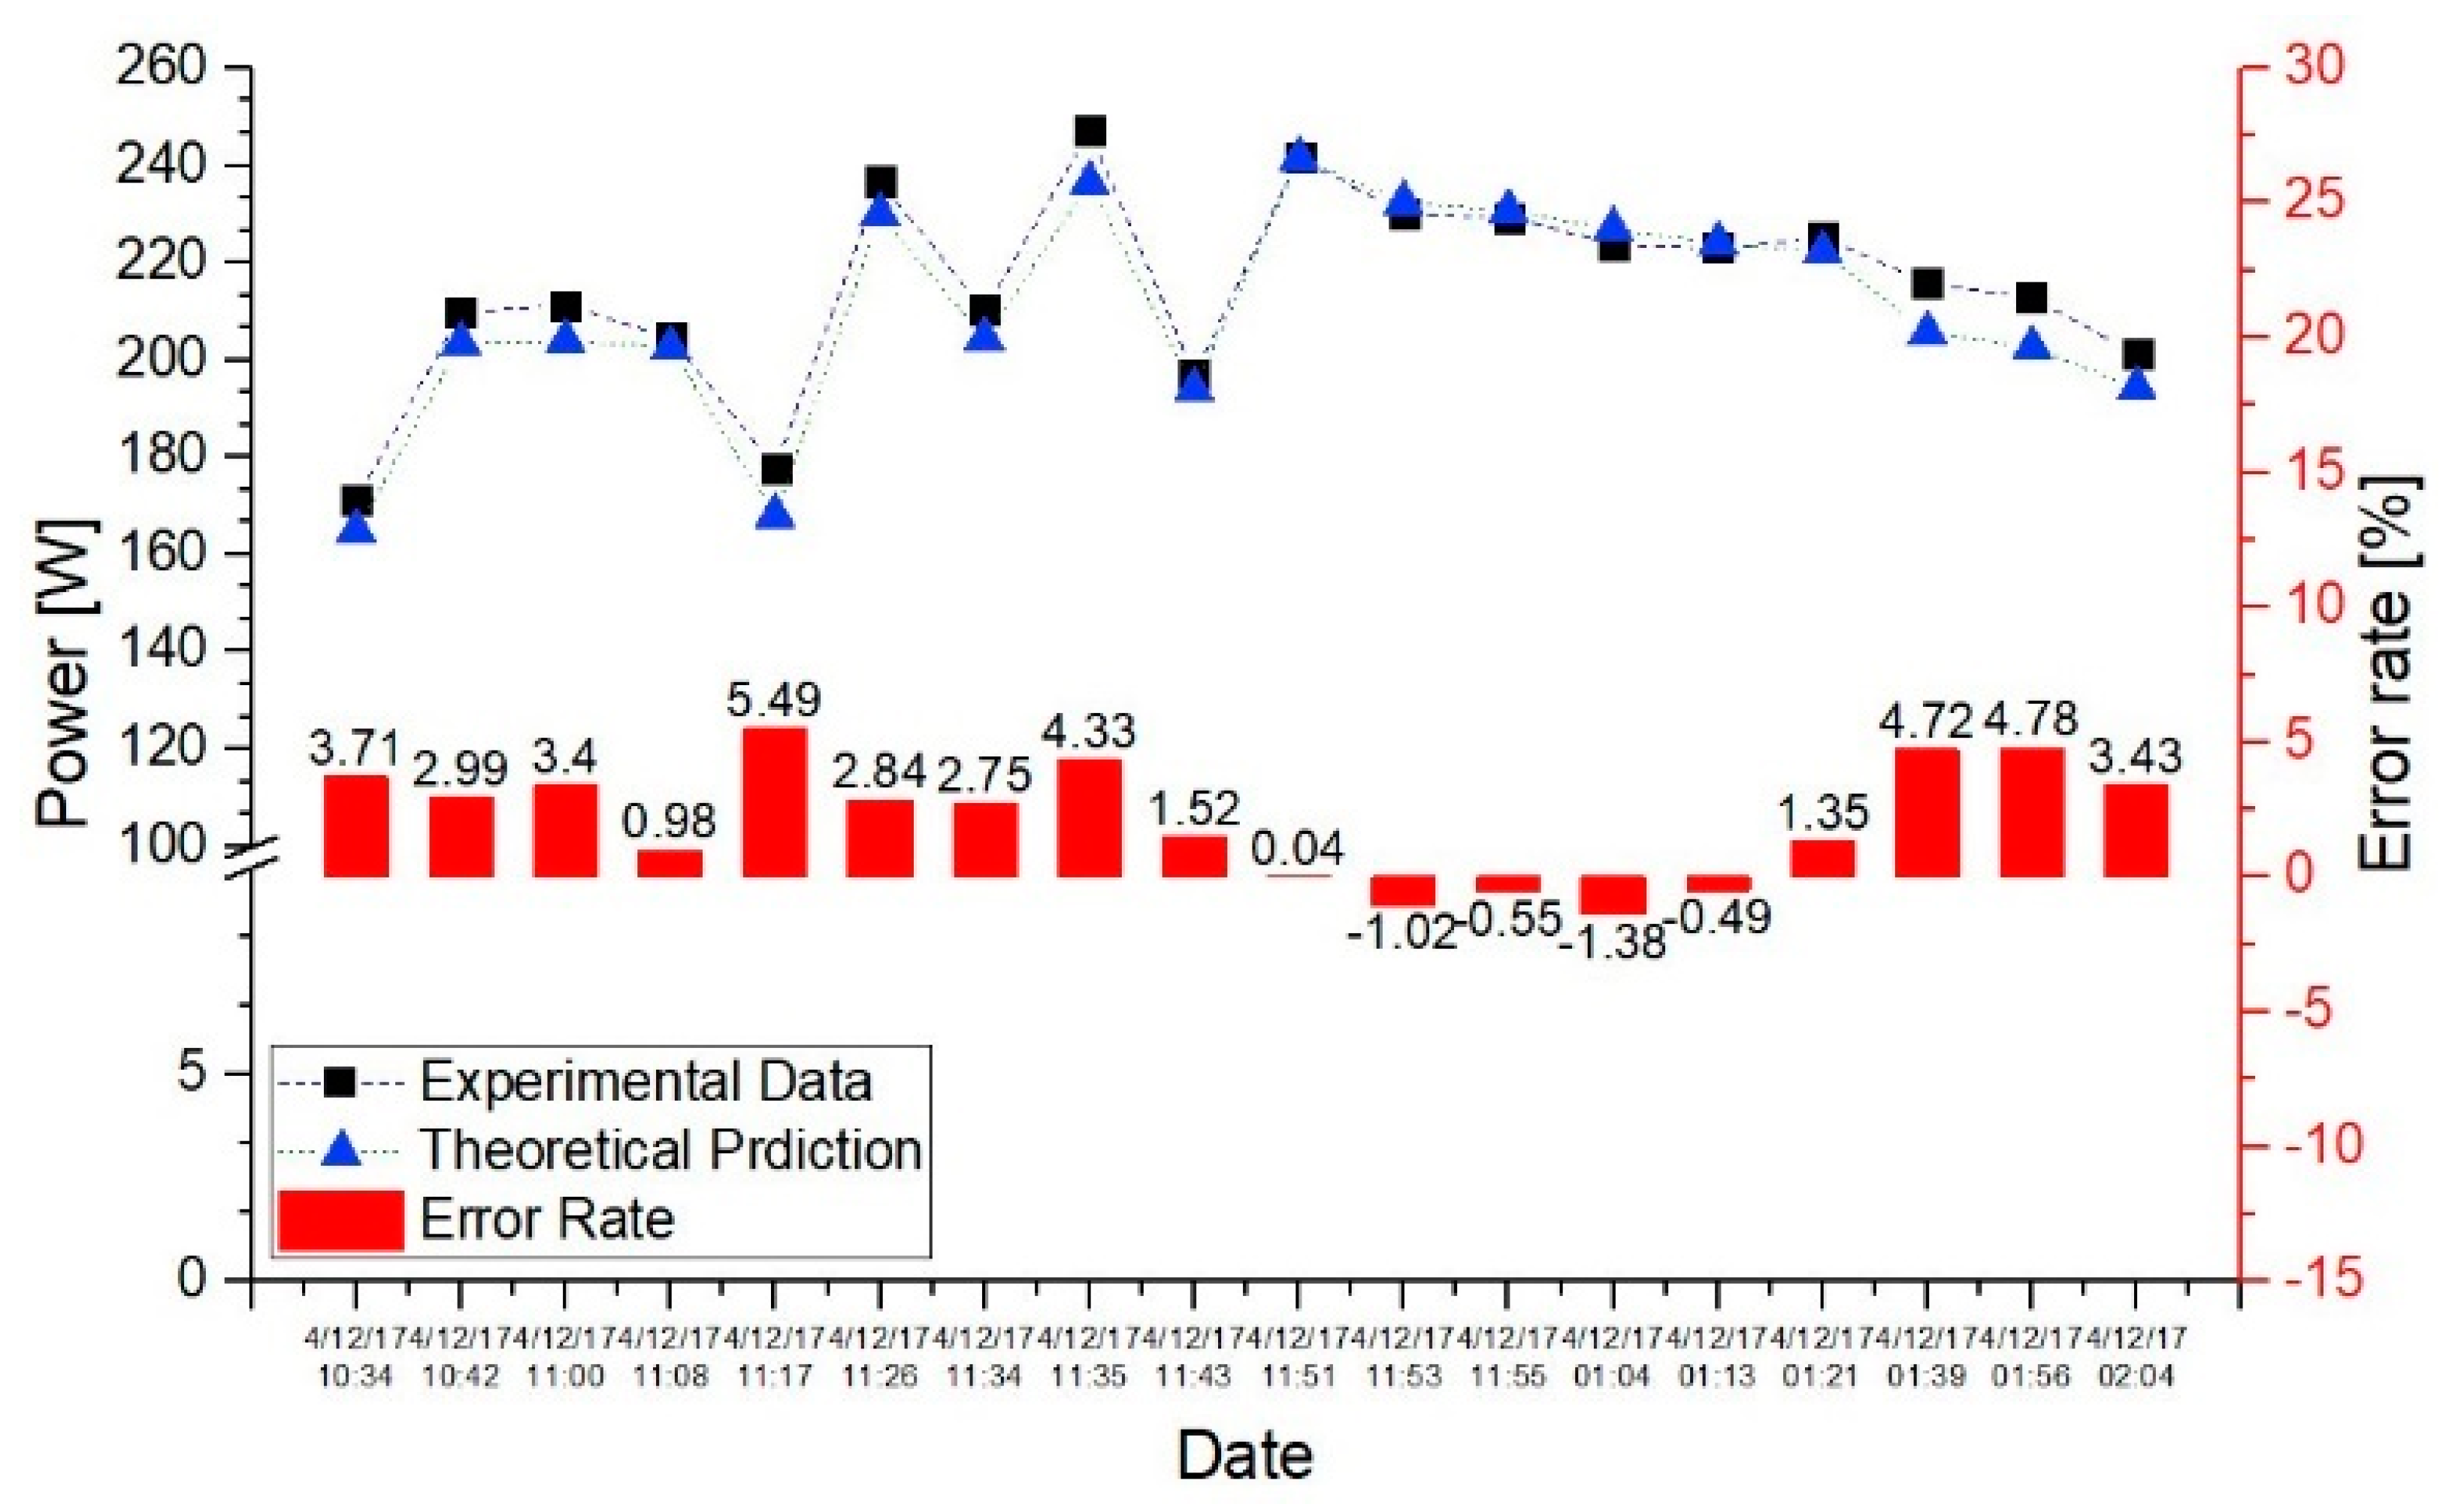
Experiments were conducted outdoors to verify the accuracy of the proposed modeling. All the suggested coefficients of the tilt angles, time, latitude, and solar time of the day of measurement were obtained and the rear side irradiance was predicted. After calculating the outputs from the rear and front sides, the error was measured to compare the sum of the predicted outputs of both sides with the in-situ output power measured by the I–V measuring device. To investigate the effect of irradiance on the rear side, four different environments with different albedo values were created. The 58-cell modules were manufactured for the test using a bifacial solar cell fabricated using commercial fabrication line. Under Standard Test Condition (STC), the maximum power of the front side is 262.3 W, the power of the rear side is 217 W, and the efficiency is measured as 16.2%.
Figure 5 is the module used in Experiments 1–4. Figure 6 shows the test data of the modules obtained from the official test report. Table 1 shows the environmental albedo of the rear environment, the environmental condition of the floor, and the amount of output on STC of the module used for Experiments 1–4. Figure 7 shows the environments of Experiments 1–4. Figure 8 is the site and environment for experiment on the ground.
The experimental site is the rooftop of a four-story building located at 37.54° latitude and 127.08° longitude with different backside reflection conditions, as shown in Figure 7. Therefore, it is confirmed that the value of was set to 37.54°. The module was installed at 30°. The d n , δ , and ε values could be obtained from the date of the experimental data. The data were obtained using the latitude of the test site of the module installed in the southeast direction as the parameters for obtaining the GHI on d n th day, and the exact time and date obtained from the experimental data. A solar irradiation meter was installed for measuring the actual irradiation. However, it was installed on the upper part to minimize the influence of the shadow on the module. The rear environment area is constructed considering the shadow formed by the irradiance.
The conditions of the experimental environment were ε [°] = 0.994, δ [°] = 8.294, [°] = 37.54, and c o s θ Z S [°] = 29.47.

3.2. Test Results

The output power ( P e x p . r e a r ) of the rear side was estimated through the modeling by using the actual measured output power on the test position and environment. The power output is obtained using the Profitest from Gossen in Figure 9. The measurement duration for separate measurement of individual modules of Profitest is higher than 20 ms (approximately 100 pairs of measured values), and thus the capacitive characteristics of the device under test have no influence on measurement. The software shows the visualization, evaluation and documentation of measured characteristic curves with database shown in Figure 10. Raw data obtained from the Profitest were used for the measurement analysis of bifacial module.
In Experiments 1–4, the minimum errors between the in-situ output power and the predicted output are 1.58%, 1.5%, 0.8%, and 0.4%, respectively. The maximum errors are 4.45%, 4.45%, 6.7%, and 4.8%. In the modeling proposed in this study, the experimental error rate in the TEST BED was determined to be approximately 5%. The reason the sampling time of Experiments 1–4 is different for each experiment is that we only compared data which had more than 700 W / m 2 solar radiation on each day.
Figure 11 shows the result of Experiment 1. It is the comparison of the modeling output and the measured output for about two hours before and after noon with no clouds and the exact solar irradiation. The error rate is compared with the measured output based on the modeling output.
Figure 12 shows the result of Experiment 2. The results of Experiment 2 considered environmental conditions to be measured under the same environmental conditions as Experiment 1.
Figure 13 shows the results of Experiment 3. Experiment 3 was also conducted under similar environmental conditions.
Figure 14 shows the result graph for Experiment 4. Experiment 4 shows that the influence of the solar irradiation on the day of experiment is significant, even though it considers that there is little reflection on the backside of the module. In addition, it can be concluded that the error rate of the experiment is small when the solar irradiation amount is high and DNI amount is large.
Using this experimental method, the modeling output power is compared with the output power obtained throughout the day in a normal soil environment.
Figure 15 shows the solar irradiation measured at 5-min intervals from 10:15 to 15:00 on 2 September 2017.
Figure 16 shows the error rate by comparing the modeling output with the measured data at every 5-min interval from 10:15 to 15:00 on 9 February 2017. From the results, when the solar radiation is high, the error rate between modeling data with experimental data is as low as less than 5%. The lower is the solar radiation amount, the larger is the error rate.
The solar irradiation system used Profitest from Gossen (Nuremberg, Germany) with a pyranometer (Gossen, Nuremberg and Germany) having calibrated monocrystalline irradiation sensor with integrated Pt1000 temperature sensor [28], as shown in Figure 15. The pyranometer is then installed to examine the amount of irradiation incident on the rear surface, as shown in Figure 17.
Figure 18 shows the irradiation data obtained from the measurements of the front pyranometer, the rear pyranometer and the modeling from 07:00 to 19:00 on 18 July 2018. Since the solar module follows the smallest output value, the amount of irradiation incident on each cell is required on the rear surface, but it is assumed that only one irradiation is representative in the experimental environment. In Figure 18, the output of the module takes a relatively larger ratio when the irradiation amount is low rather than high at the front. It can be assumed that there is a saturation value of the rear irradiation which can be received at the maximum.
Figure 19 is a graph showing the difference in the values of the irradiance measured through the rear pyranometer and predicted through the modeling. The solar radiation on the front is injected directly from the sun. Most of the incident irradiance into rear side at high irradiation condition, however, comes from the directly reflected irradiance resource around the environments. It is very noticeable to observe that the backside solar radiation is not proportional to the amount of front solar radiation because most of the irradiance into rear side of the module is diffused component of the irradiance. The average difference is 20.1 (W/ m 2 ). In future experiments, it is considered to install a small pyranometer of each cell on the rear side and to compare the output value with the minimum irradiance value.

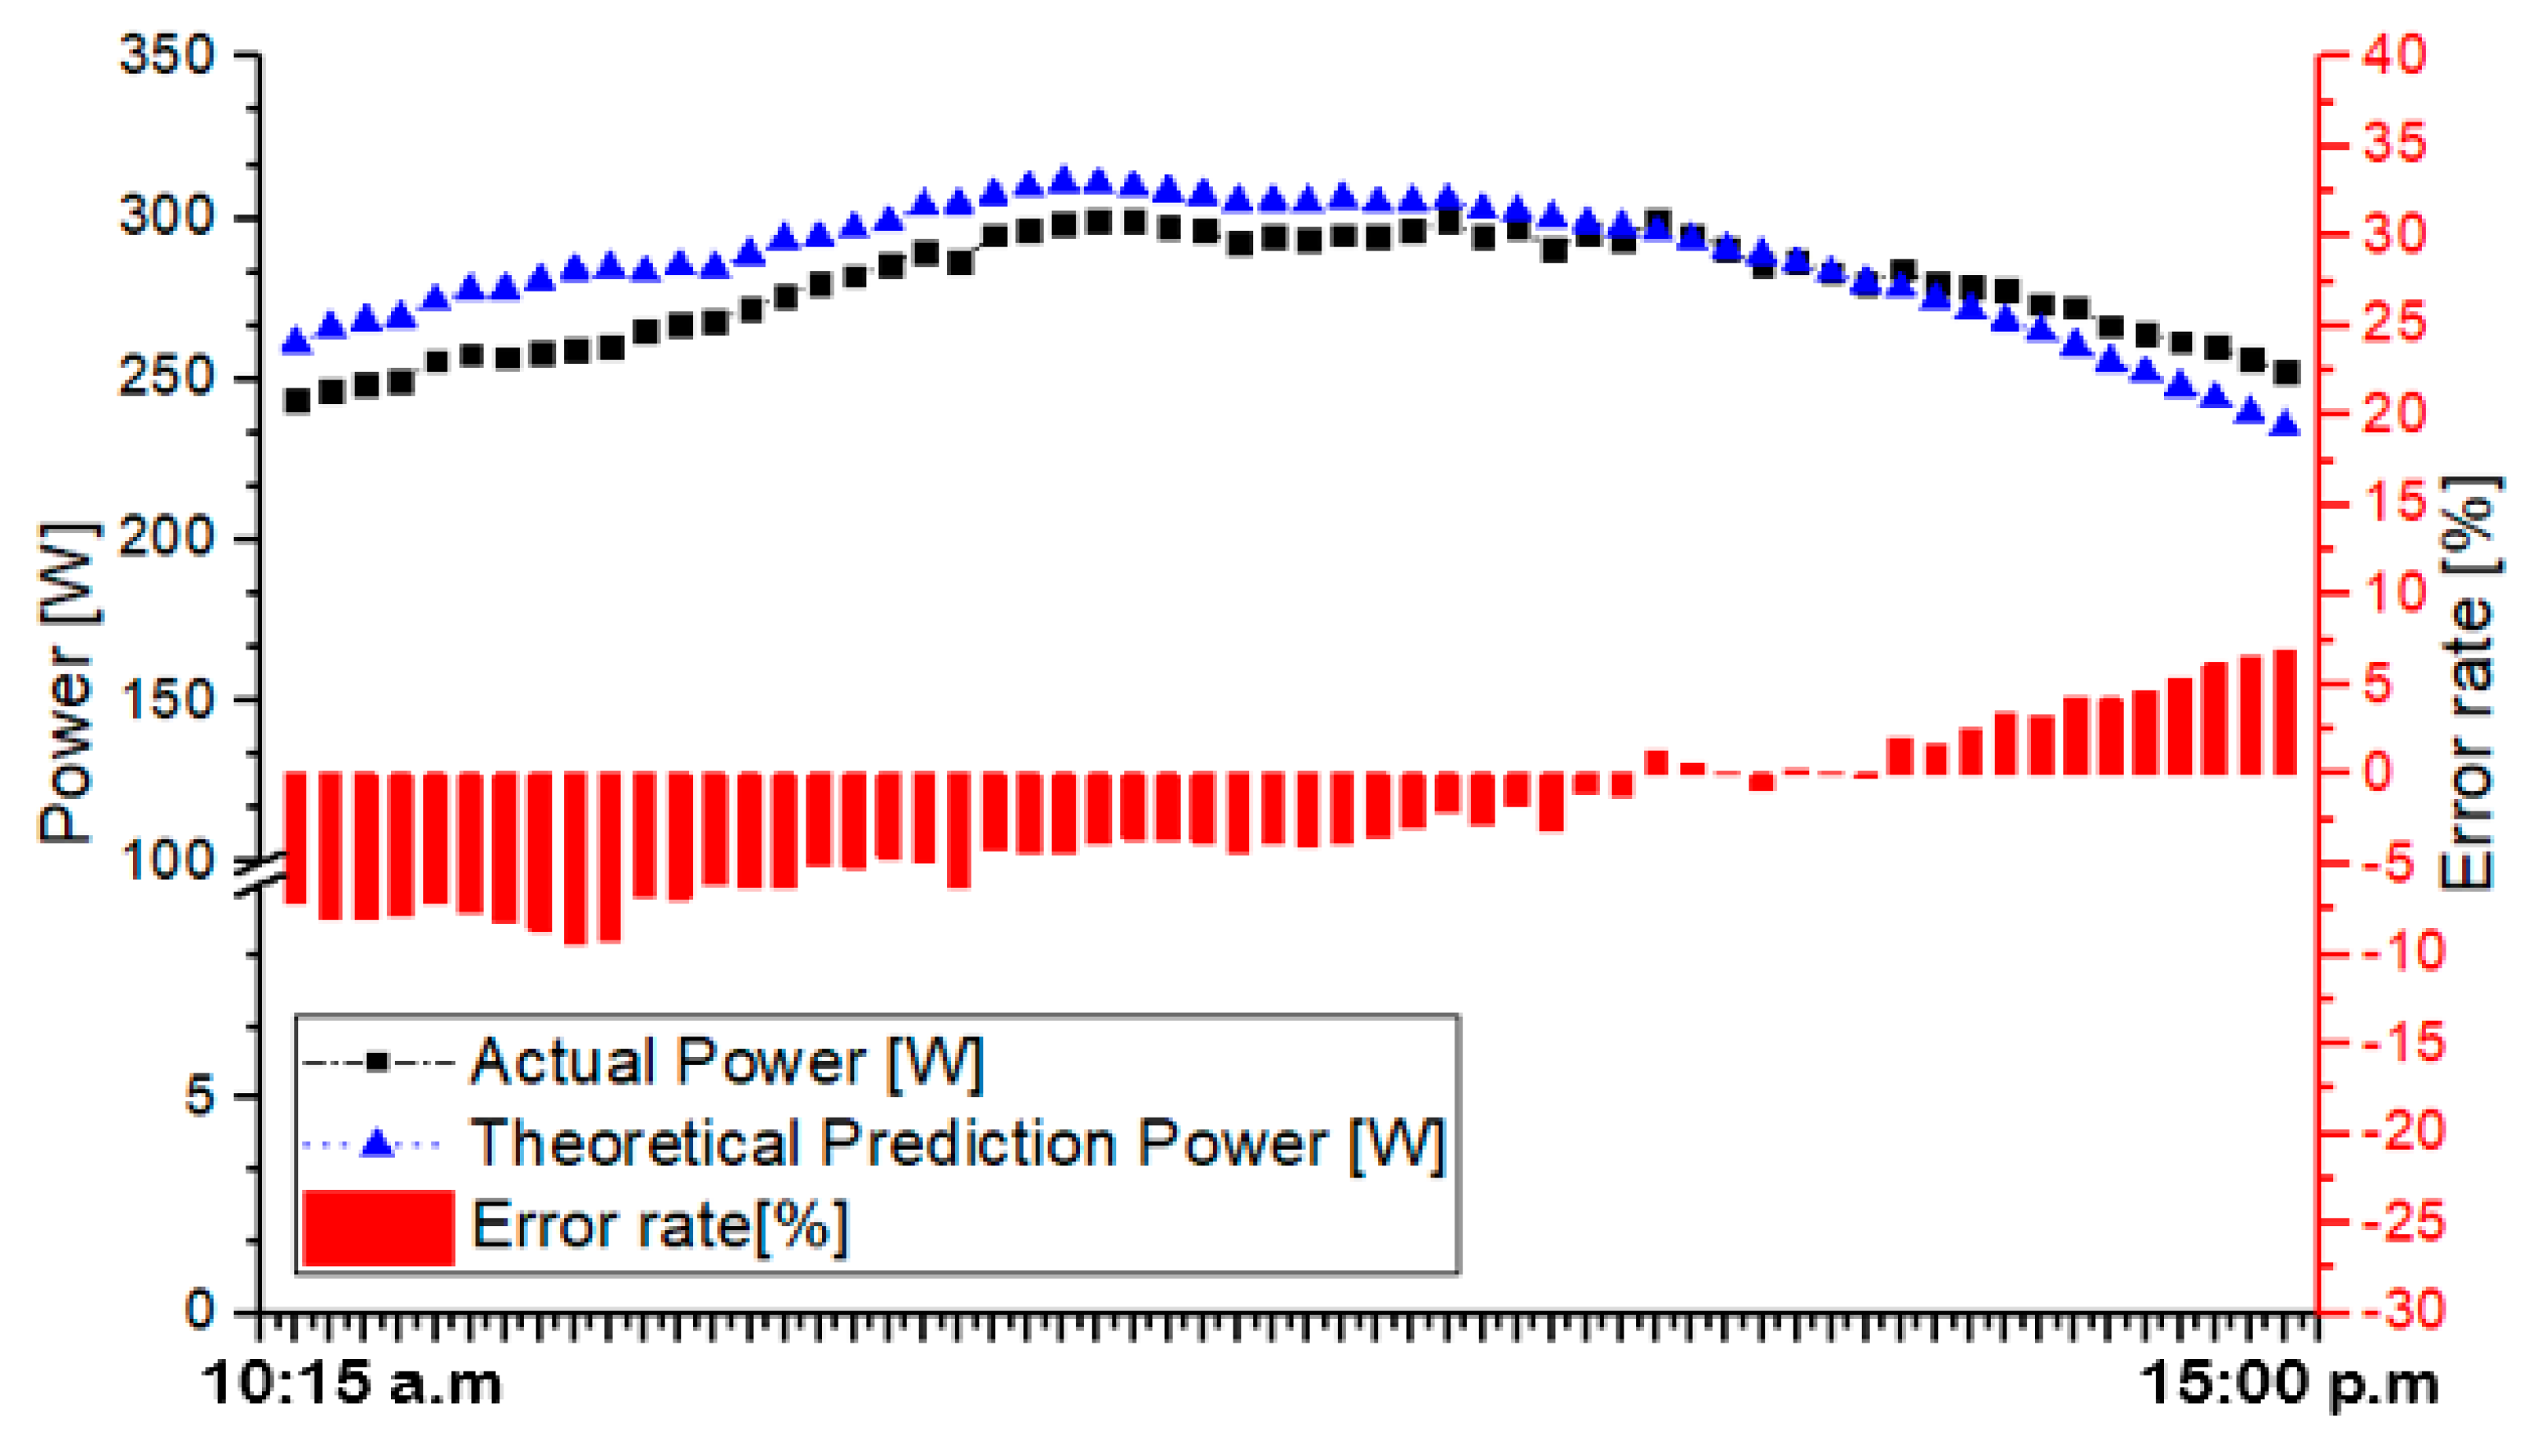
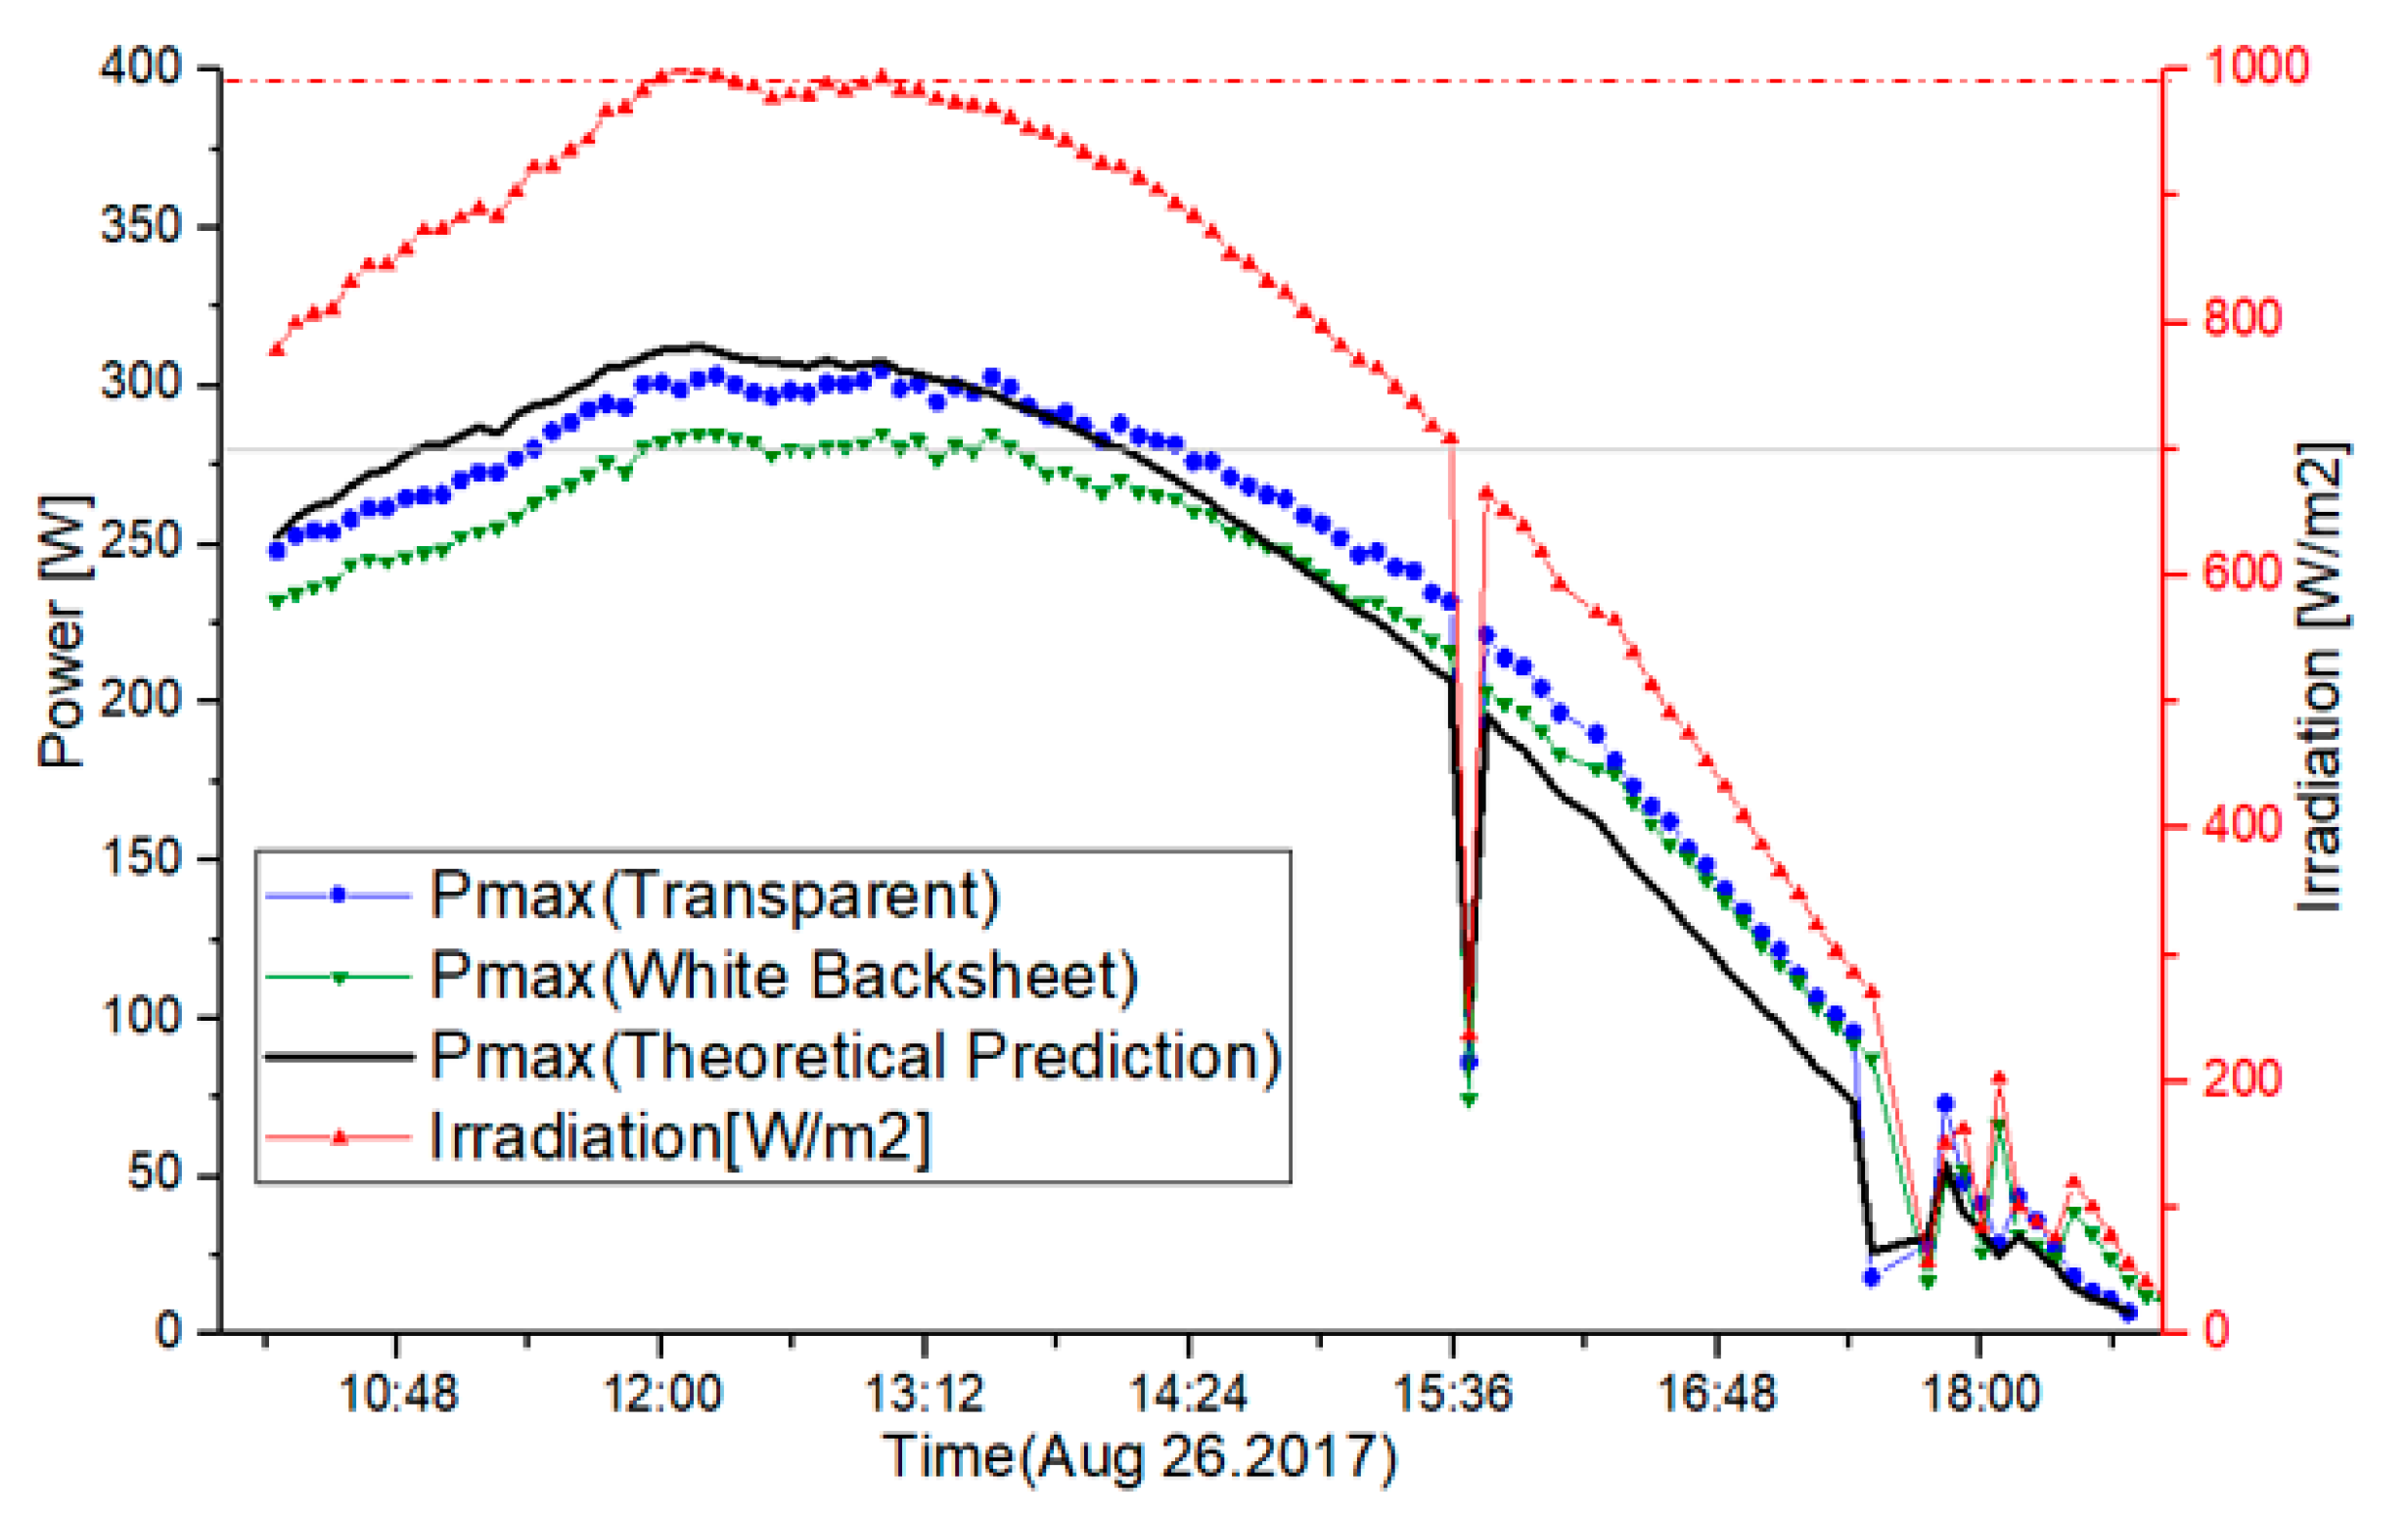
3.3. Application Test 1

In the previous experiment, when the solar irradiation amount was 700 W/ m 2 or more, the error rate was low in predicting the backside irradiance, but, when the solar irradiation amount was 700 W/ m 2 or less, the error rate was large. The back side irradiance shows a large influence by the total solar irradiation. Accordingly, the outputs of the bifacial module with a white back sheet and one with a transparent back sheet in the same environment were compared.
Figure 20 shows the module used in the experiment having 72 p-type cells and maximum power of the front side under STC is 340.4 W, while the one of rear side is 221.1 W, showing 17.73% of module efficiency.
On one day in August, the output of a bifacial PV module was measured and predicted with a white painted backside environment shown in Figure 7. The maximum output power of the module in STC condition is 340 W.
It is very important to notice that the maximum power was 439 W instantly with a white painted reflection condition. Figure 21 shows 66 data measured every 5 min from 11:03 to 16:28 on one day in August.
From the results in Figure 21, when the irradiation amount on bifacial module is more than 700 W/ m 2 , majority of the power induced is found to come from the back reflection only which could be also confirmed from a previous study [29]. However, when the irradiation is less than 700 W/ m 2 , additional factors, such as scattered irradiance from surroundings, should be considered due to the decrease of rear side reflection. It is very interesting to note therefore that theoretical prediction would lead to an increase of an error rate (average 10.6%) at low irradiation shown in the figure without counting the additional factors, while average error rate of 3.1% was calculated at the solar irradiation mostly exceeding 1000 W/m2 for ± 1 h based on noon.
From the result, it is important to note that, if the environment using the bifacial module is optimized for back side reflection, the maximum efficiency would increase more than 32%, compared with the power at STC, which is measured in this experiment.

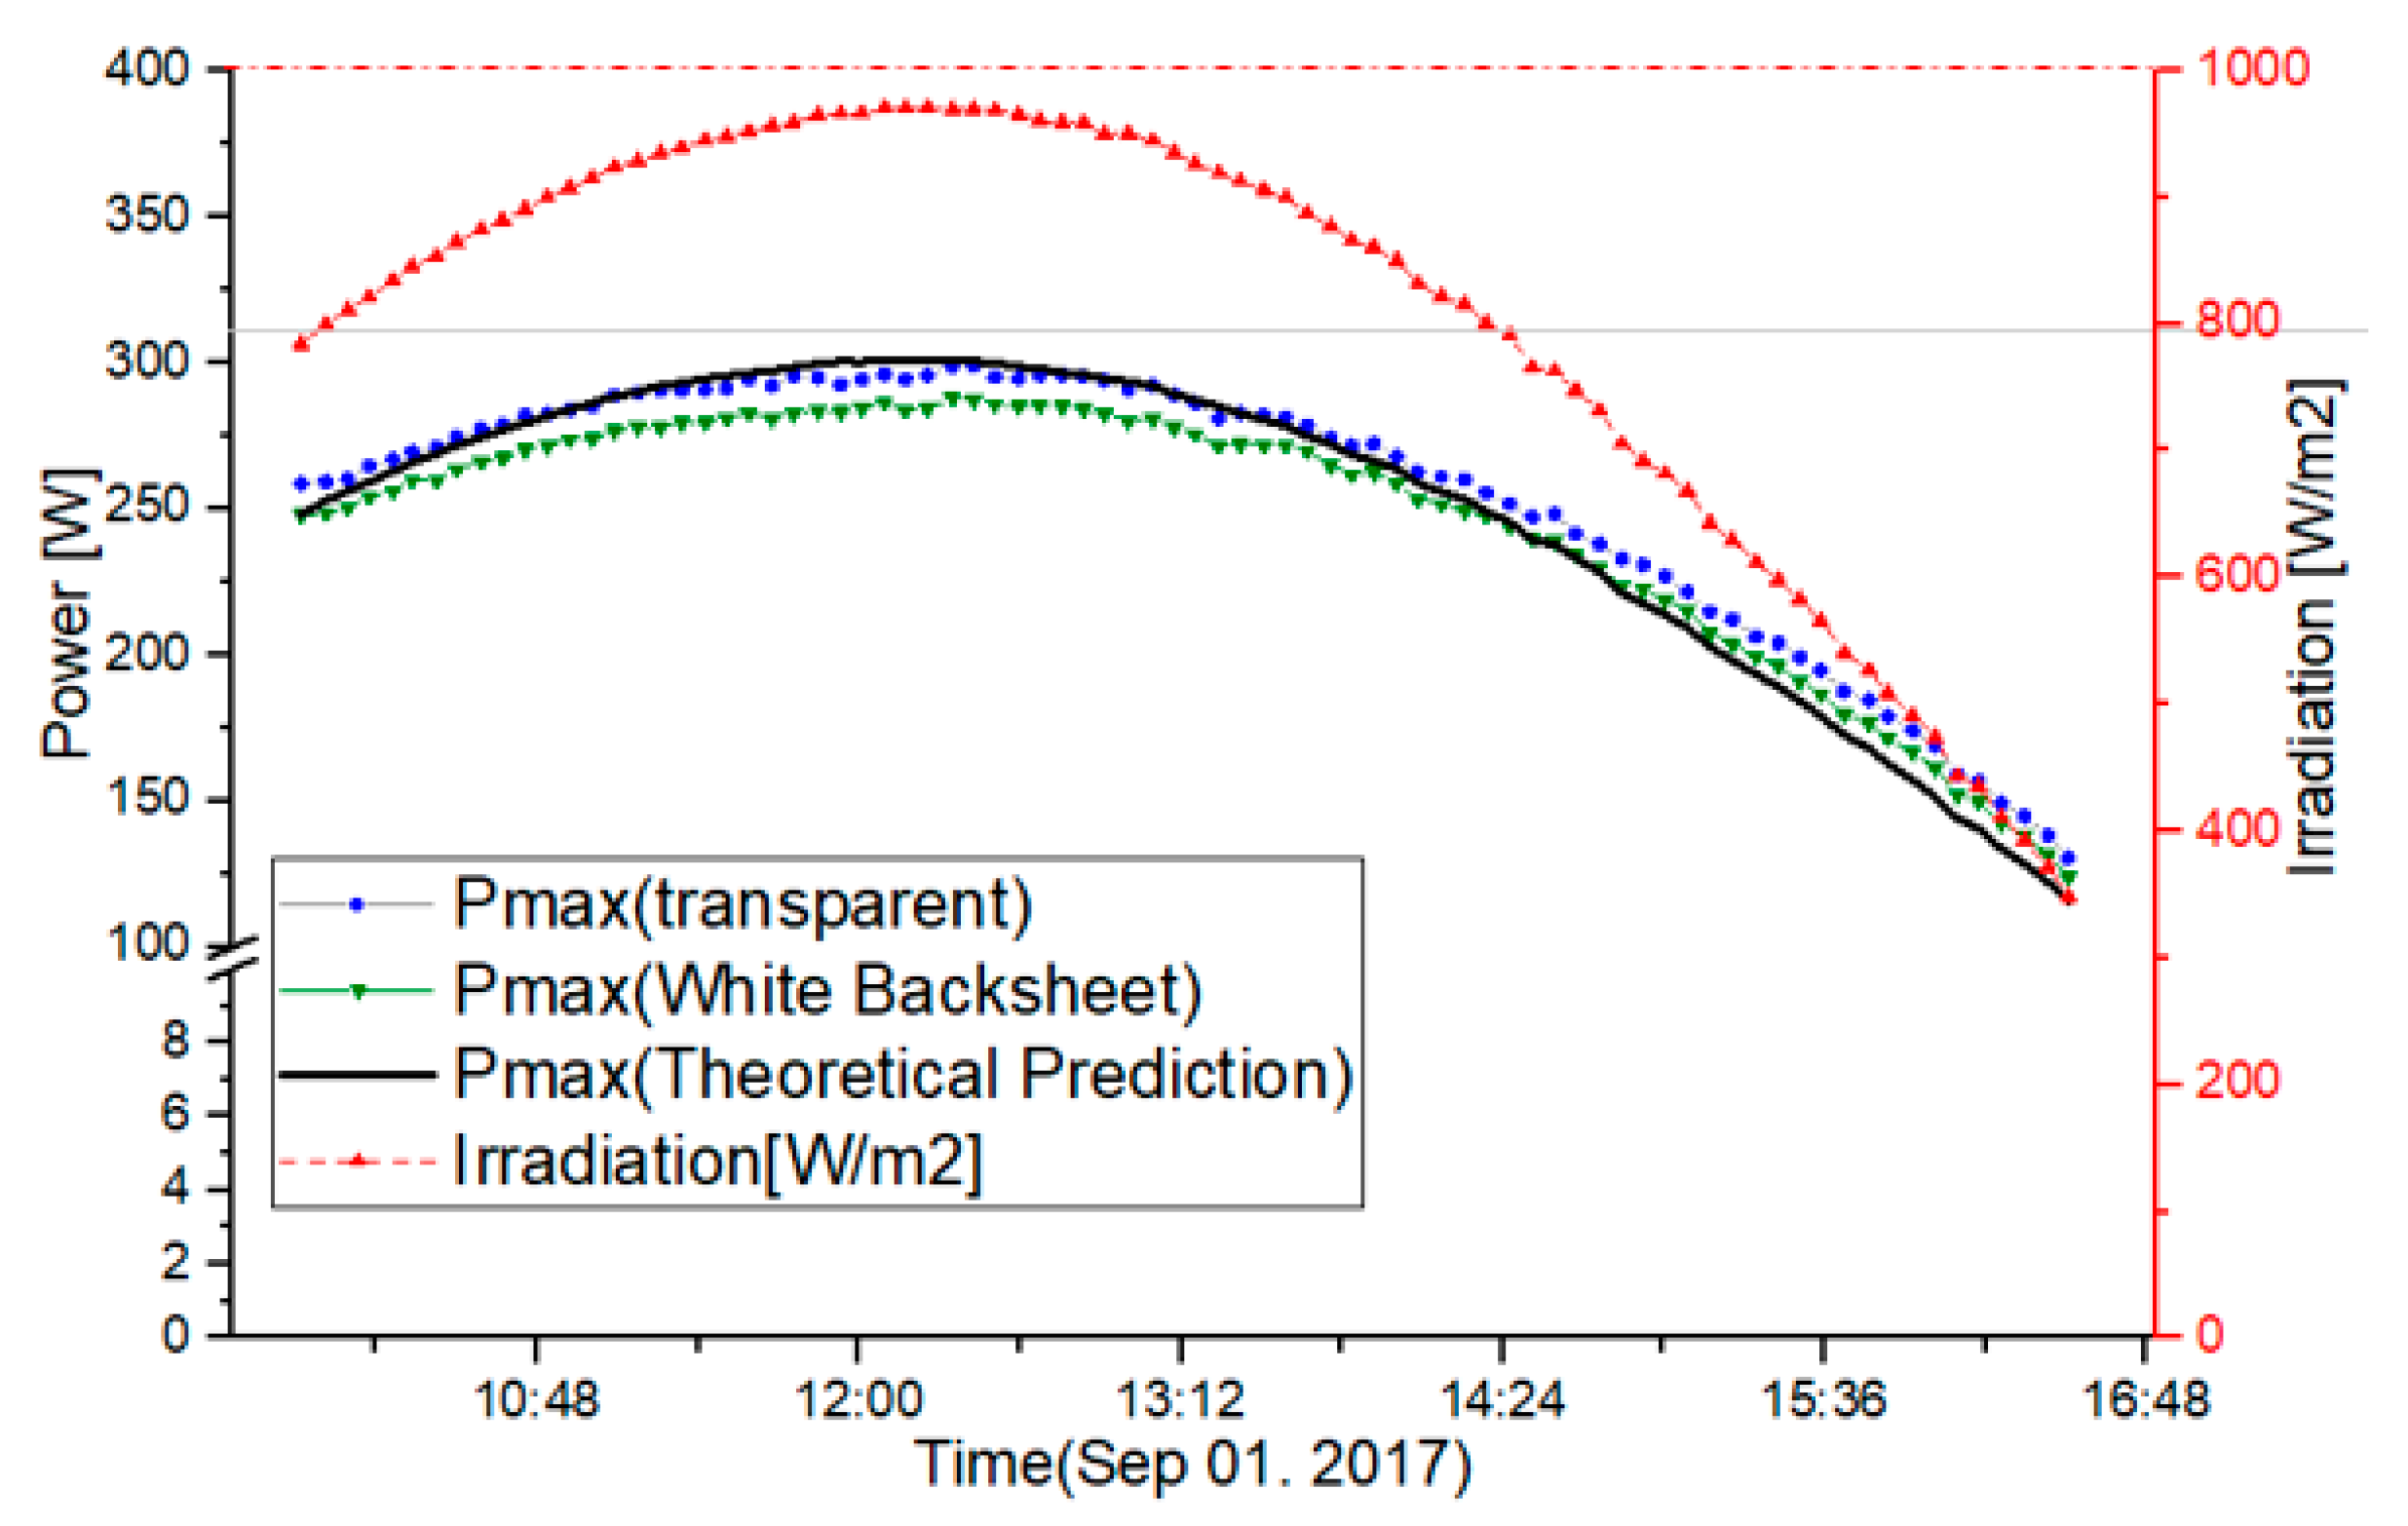
3.4. Application Test 2

The power output of the bifacial module obtained through the theoretical prediction is compared with the measured data shown in Figure 22 and Figure 23. When the irradiation was higher than 700 W/ m 2 , the average error rates were 3.93% and 2.21% on a day for Exp. 5 and Exp. 6, respectively. While Exp. 5 shows fluctuation of the data due to the intermittent shading, Exp. 6 assumed the solar irradiation is mostly less than 1000 W/m2 at noon and the amount of solar irradiation would be incident uniformly. Under irradiation less than 700 W/ m 2 , however, the average error rates increase up to 12.8% in Exp. 5 and 17.8% in Exp. 6.
In Figure 22, the maximum irradiation was 1002.3 W/ m 2 from a pyranometer. The output of the bifacial module with a transparent back sheet was measured to be higher at every point than the one with an opaque white back sheet. In Figure 23, however, when the maximum irradiation is 970.9 W/ m 2 and Exp. 6, there were some points where the output of the bifacial module with the transparent back sheet was lower than that of the white back sheet. This is because the bifacial module is highly influenced by the front side irradiation at low irradiance intensity, so that it is determined that the rear environment and materials are decided when considering the influence on the rear surface. However, because the output of the bifacial module is higher during most of the experiment time, it is better to make the rear side transparent when using a bifacial module.
In Exp. 5, the lower is the solar irradiation, the greater is the difference between the output obtained through modeling and the actual measured output. Accordingly, additional elements are required to predict the backside irradiance in Exp. 5. On the other hand, it is imperative to note that, if the bifacial module is connected with optimum capacity of ESS (Energy Storage System), it would lead to the increase of stability of the power network [30].

4. Conclusions

In this paper, we propose a modeling method to estimate the amount of irradiance on the rear side of the module, as the output power of the bifacial photovoltaic module changes according to the composition of the rear side environment. The output power was confirmed through experiments. Depending on where the solar module is installed, the direct and diffuse components of the irradiance are different, and, because of the rotation of the earth, it receives different levels of solar irradiation depending on the current date. Therefore, it is necessary to predict the amount of irradiance on the rear side of the module considering the position, environment, and time of measurement. Previously, the bifacial module was evaluated by comparing the output power amount of the rear side to that of the front side. In this paper, we predicted the output amount depending on the rear side environment. From the prediction based on the modeling proposed in this paper, the error rate was confirmed to be within a maximum value of 5% and average value of 1.84%, which allows it to be used in theoretical prediction. It is obvious that the rear environment should be taken into consideration when installing the bifacial module because the output amount is measured differently depending on the albedos of the mono-facial modules and the bifacial modules. Because it is efficient to use a solar module with a high efficiency output in a narrow terrain, the proposed model will be useful in predicting the efficiency achieved by applying a bifacial module to water-based photovoltaics or BIPV in the future. To accurately predict the output at low irradiation as well as the high solar irradiation through the output obtained through the modeling, the elements of weather affecting humidity and reflection are additionally required in addition to albedo, direct irradiation and scattered irradiation. Recently, installation of floating Photovoltaic has been increasing. As the reflection of irradiation from the water surface occurs, the positive influence of the installation with the bifacial photovoltaic can be expected. We are confident that this research will contribute to zero energy construction by designing systems based on bifacial PV module with high performance ratio when applying solar power in a microgrid environment, which is the future energy network.

Author Contributions

H.L.C. developed her own primary model for power prediction of bifacial Si PV Module in Rooftop using view factor. B.G.B., S.Y.P. and J.H.C. added experimental methods at the test site (rooftop of department of engineering building at Konkuk University) with different albedos. H.K.A. integrated the design of systems based on bifacial PV modules with respect to the application to BIPVs, FPVs and MPVs (Marine PVs) for microgrid to grid connected networks.

Funding

This research was supported by the New and Renewable Energy Technology Program of the Korea Institute of Energy Technology Evaluation and Planning (KETEP), granted financial resources by the Ministry of Trade, Industry and Energy, Republic of Korea (No. 20183010014260).

Acknowledgments

To the memory of Dr. Sehwan Ryu who devoted himself to the PV industry and research.

Conflicts of Interest

The authors declare no conflict of interest.

Nomenclature

I T o t a l Total irradiance
I R e a r , d i r Direct irradiance
I R e a r , d i f f Diffuse irradiance
GHIGlobal Horizontal Irradiance
DNIDirect Normal Irradiance
DHIDiffuse Horizontal Irradiance
F m s View Factor of A S of irradiance affecting A m
αAlbedo coefficient
β Angle between the module and ground
I F r o n t Front irradiance
I R e a r Rear irradiance
GAmount of solar irradiation
θ z s Angle between the direction perpendicular
ε 0 Eccentricity correction factor
AMAir Mass
δ Slope of the sun
ω The solar time
Latitude of measurement position
P b i f a c i a l Output power of bifacial module
P f r o n t Front output power
P r e a r Rear output power
I r e a l . f r o n t Solar irradiance of the front
I r e a l . r e a r Solar irradiance of the rear
P S T C , f r o n t Front output power on STC
P S T C , r e a r Rear output power on STC
Error   rate Difference between predicted output and actual output

References

  1. Kim, J.Y.; Kim, S.B.; Park, S.W. The Effect of the Renewal Portfolio Standards (RPS) on Electric Power Generation in Korea. Korean Soc. Public Adm. 2016, 27, 131–160. [Google Scholar]
  2. Wang, D.D.; Sueyoshi, T. Assessment of large commercial rooftop photovoltaic system installations: Evidence from California. Appl. Energy 2017, 188, 45–55. [Google Scholar] [CrossRef]
  3. Kamuyu, W.C.L.; Lim, J.R.; Won, C.S.; Ahn, H.K. Prediction Model of Photovoltaic Module Temperature for Power Performance of Floating PVs. Energies 2018, 11, 447. [Google Scholar] [CrossRef]
  4. Kang, J.G.; Kim, J.T. Development Trend of Bifacial Solar Cell Technology. Bull. Korea Photovolt. Soc. 2015, 1, 57–64. [Google Scholar]
  5. Bifacial Solar Photovoltaic Modules Program on Technology Innovation. Electric Power Research Institute. 2016. Available online: https://www.epri.com/#/pages/product/3002009163/ (accessed on 25 August 2018).
  6. Wang, S.; Wilkie, O.; Lam, J.; Steeman, R.; Zhang, W.; Khoo, K.S.; Sim, C.S.; Rostan, H. Bifacial photovoltaic systems energy yield modelling. Energy Procedia 2015, 77, 428–433. [Google Scholar] [CrossRef]
  7. Yusufoglu, U.A.; Pletzer, T.M.; Koduvelikulathu, L.J.; Comparotto, C.; Kopecek, R.; Kurz, H. Analysis of the annual performance of bifacial modules and optimization methods. IEEE J. Photovolt. 2015, 5, 320–328. [Google Scholar] [CrossRef]
  8. Singh, J.P.; Aberle, A.G.; Walsh, T.M. Electrical characterization method for bifacial photovoltaic modules. Sol. Energy Mater. Sol. Cells 2014, 127, 136–142. [Google Scholar] [CrossRef]
  9. Shoukry, I.; Libal, J.; Kopecek, R.; Wefringhaus, E.; Werner, J. Modelling of bifacial gain for stand-alone and in-field installed bifacial PV modules. Energy Procedia 2016, 92, 600–608. [Google Scholar] [CrossRef]
  10. Castillo-Aguilella, J.E.; Hauser, P.S. Bifacial Photovoltaic Module Best-Fit Annual Energy Yield Model with Azimuthal Correction. In Proceedings of the 2016 IEEE 43rd Photovoltaic Specialists Conference (PVSC), Portland, OR, USA, 5–10 June 2016. [Google Scholar]
  11. Steven, S.; Sung, J.S.; George, F. Characterizing Electrical Output of bifacial photovoltaic modules by altering reflective materials. J. Build. Constr. Plan. Res. 2016, 4, 41–55. [Google Scholar]
  12. Kreinin, L.; Bordin, N.; Karsenty, A.; Drori, A.; Grobgeld, D.; Eisenberg, N. PV Module Power Gain due to Bifacial Design. In Proceedings of the 35th IEEE Photovoltaic Specialists Conference, Honolulu, HI, USA, 20–25 June 2010. [Google Scholar]
  13. Kang, J.G.; Kim, J.H.; Kim, J.T. Analysis of Generation Characteristics of a Bifacial BIPV System According to Installation Methods. Curr. Photovolt. Res. (KPVS) 2015, 3, 121–125. [Google Scholar]
  14. Van Aken, B.B.; Okel, L.A.G.; Liu, J.; Luxembourg, S.L.; Van Roosmalen, J.A.M. White Bifacial Modules—Improved STC Performance Combined with Bifacial Energy Yield. In Proceedings of the 32nd European Photovoltaic Solar Energy Conference and Exhibition, Munich, Germany, 20–24 June 2016; 1BO.12.2. pp. 42–47. [Google Scholar]
  15. Appelbaum, J. Bifacial photovoltaic panels field. Renew. Energy 2016, 85, 338–343. [Google Scholar] [CrossRef]
  16. Yusufoglu, U.A.; Lee, T.H.; Pletzer, T.M.; Halm, A.; Koduveliklathu, L.J.; Comparotto, C.; Kurz, H. Simulation of energy production by bifacial modules with revision of ground reflection. Energy Procedia 2014, 55, 389–395. [Google Scholar] [CrossRef]
  17. Duran, C.; Buck, T.; Kopecek, R.; Libal, J.; Traverso, F. Bifacial solar cells with boron back surface field. In Proceedings of the 25th European Photovoltaic Solar Energy Conference and Exhibition, Valencia, Spain, 6–10 September 2010; pp. 2348–2352. [Google Scholar] [CrossRef]
  18. Werner, S.; Lohmüller, E.; Saint-Cast, P.; Greulich, J.; Weber, J.; Maier, S.; Wasmer, S. Key aspects for fabrication of p-type Cz-Si PERC solar cells exceeding 22% conversion efficiency. In Proceedings of the 33rd EUPVSEC—33rd European PV Solar Energy Conference and Exhibition, Amsterdam, The Netherlands, 25–29 September 2017. [Google Scholar]
  19. Guo, M.; Zang, H.; Gao, S.; Chen, T.; Xiao, J.; Cheng, L.; Sun, G. Optimal tilt angle and orientation of photovoltaic modules using HS algorithm in different climates of China. Appl. Sci. 2017, 7, 1028. [Google Scholar] [CrossRef]
  20. SolarWorld. How to Maximize Energy Yield with Bifacial Technology. White Paper. 2016. Available online: Https://solarkingmi.com/assets/How-to-Maximize-Energy-Yield-with-Bifacial-Solar-Technology-SW9001US.pdf (accessed on 9 August 2018).
  21. Hansen, C.W.; Stein, J.S.; Deline, C.; MacAlpine, S.; Marion, B.; Asgharzadeh, A. Analysis of irradiance models for bifacial PV modules. In Proceedings of the IEEE 43rd Photovoltaic Specialists Conference (PVSC), Portland, OR, USA, 5–10 June 2016; pp. 138–143. [Google Scholar] [CrossRef]
  22. Ineichen, P.; Guisan, O.; Perez, R. Ground-reflected radiation and albedo. Sol. Energy 1990, 44, 207–214. [Google Scholar] [CrossRef] [Green Version]
  23. Perez, R.; Ineichen, P.; Seals, R.; Michalsky, J.; Stewart, R. Modeling daylight availability and irradiance components from direct and global irradiance. Sol. Energy 1990, 44, 271–289. [Google Scholar] [CrossRef]
  24. Yunus, C.A.; Afshin, J.G. Heat and Mass Transfer: Fundamentals and Applications; McGraw-Hill Education: New York, NY, USA, 2011. [Google Scholar]
  25. John, A.D.; William, A.B. Solar Engineering of Thermal Processes, 4th ed.; John Wiley & Sons, Inc.: Hoboken, NJ, USA, 2013. [Google Scholar]
  26. Tang, R.; Yu, Y. Feasibility and optical performance of one axis three positions sun-tracking polar-axis aligned CPCs for photovoltaic applications. Sol. Energy 2010, 84, 1666–1675. [Google Scholar] [CrossRef]
  27. Zang, H.; Guo, M.; Wei, Z.; Sun, G. Determination of the optimal tilt angle of solar collectors for different climates of china. Sustainability 2016, 8, 654. [Google Scholar] [CrossRef]
  28. Peak Power Measuring Instrument and Curve Tracer for PV Modules and Strings. Available online: https://www.gossenmetrawatt.com/resources/p1/profitest-pv/profitest-pv-db_gb.pdf (accessed on 25 August 2018).
  29. Riley, D.; Hansen, C.; Stein, J.; Lave, M.; Marion, J.K.B.; Toor, F. A Performance Model for Bifacial PV Modules. In Proceedings of the 44th IEEE PVSC, Washington, DC, USA, 25–30 June 2017. [Google Scholar]
  30. Lee, H.G.; Kim, G.G.; Bhang, B.G.; Kim, D.K.; Park, N.S.; Ahn, H.K. Design Algorithm for Optimum Capacity of ESS Connected with PVs Under the RPS Program. IEEE Access 2018, 45899–45906. [Google Scholar] [CrossRef]
Figure 1. n-PERC Cell Structure and Module used in the experiment. PERC: The passivated emitter and rear contact. P-BSF: Phosphorus Back Surface Field. B-Emitter: Boron Emitter.
Applsci 08 01752 g001
Figure 2. The view factor between two surfaces.
Applsci 08 01752 g002
Figure 3. The components of the reflected radiation to the rear side.
Applsci 08 01752 g003
Figure 4. Terminologies for the measurement.
Applsci 08 01752 g004
Figure 5. Bifacial Module used in the Experiments 1–4.
Applsci 08 01752 g005
Figure 6. Output parameters of the module used under Standard Test Condition (STC).
Applsci 08 01752 g006
Figure 7. Site and environment of Experiments 1–4.
Applsci 08 01752 g007
Figure 8. Site and environment for experiment on the ground.
Applsci 08 01752 g008
Figure 9. Measurement tools using IV-Checker (Gossen Metrawatt, Nuremberg, Germany).
Applsci 08 01752 g009
Figure 10. I–V test results.
Applsci 08 01752 g010
Figure 11. Experimental data of Exp. 1.
Applsci 08 01752 g011
Figure 12. Experimental data of Exp. 2.
Applsci 08 01752 g012
Figure 13. Experimental data of Exp. 3.
Applsci 08 01752 g013
Figure 14. Experimental data of Exp. 4.
Applsci 08 01752 g014
Figure 15. The solar irradiation measured at 5-min intervals from 10:15 to 15:00 on 9 February 2017.
Applsci 08 01752 g015
Figure 16. The error rate by comparing the modeling output with the measured data.
Applsci 08 01752 g016
Figure 17. Pyranometer installed on the back of the modules.
Applsci 08 01752 g017
Figure 18. Irradiation data obtained from the measurements of the front pyranometer, the rear pyranometer and the modeling from 07:00 to 19:00 on 18 July 2018.
Applsci 08 01752 g018
Figure 19. The difference in the values of the irradiance measured through the rear pyranometer and predicted through the modeling.
Applsci 08 01752 g019
Figure 20. The 72-cell Si bifacial photovoltaic (PV) module used in application test.
Applsci 08 01752 g020
Figure 21. Theoretical prediction and measured data at 5-min intervals from 11:03. to 16:28 on 25 August 2017 (white painted back ground).
Applsci 08 01752 g021
Figure 22. Output comparison between transparent and white back sheet on Exp. 5.
Applsci 08 01752 g022
Figure 23. Output comparison between transparent and white back sheet on Exp. 6.
Applsci 08 01752 g023
Table 1. In-situ and module powers in the experiments.
TypeFloor ConditionAlbedo P S T C , f r o n t   ( W )
Exp. 1White Paint0.85262
Exp. 2Green Paint0.25262
Exp. 3Black Paint0.1262
Exp. 4Cement0.4262

