Abstract
In this experiment, the T-joint of a 6082 aluminum alloy was welded by metal inert gas (MIG) welding and a fatigue test was carried out at room temperature. The mechanisms of generating pores and of fatigue fracture in welded joints are revealed in the case of incomplete penetration. There are two main types of pores: pores that are not welded and pores that are near the upper weld line of the weld. During welding, bubbles in the molten pool are adsorbed on the surface oxide film that is not penetrated, and cannot be floated to form pores; since it is a T-shaped welded joint, the molten pool is overhanged during welding, thereby forming pores near the fusion line. The fatigue strength of the welded joint based on the S–N curve at 107 cycles is estimated to be 37.6 MPa, which can reliably be predicted in engineering applications. Fatigue tests show that fatigue cracks are all generated in the pores of the incomplete penetration, and it and the pores form a long precrack, which leads to large stress concentration, and the fracture occurs under a small applied load. Grain morphology around the pores also has a large effect on the fatigue properties of the T-weld joint. In the weld’s fatigue fracture, it was found that the crack stable-extension zone exhibited ductile-fracture characteristics, and the instantaneous fault zone is composed of a large number of tear-type dimples showing ductile fractures.
1. Introduction
The 6082 Al alloy belongs to the Al–Mg–Si series of alloys, which can be strengthened by heat treatment and it has medium strength. Because of its good physical and chemical properties (e.g., low density, high strength, good weldability, and corrosion resistance), it is widely used in airplanes, other forms of transportation, the chemical industry, architecture, and machinery manufacturing [1,2,3,4].
With the increasing emphasis on lightweighting automobiles and rail transit in recent years, an increasing number of aluminum alloys have been used in the field of automobiles, rail transit, aerospace, and other fields [5,6]. In the automotive industry around the world, a wide range of aluminum-alloy models have been optimized [7,8,9,10]. A large number of aluminum alloys are used in structures, such as section beams, end bumpers, bases, sills, side-member frames, and frame bolsters [11,12,13], and these structures also have a number of T-joints present. These play a vital role in their entire structure. The preferred welding process for the 6082 Al alloy is normally metal inert gas welding (MIG) due to its comparatively easier applicability and lower cost [14]. Due to the influence of the welding thermal cycle, the mechanical properties of welded joints greatly change. Observations suggest that, in series 6000 aluminum alloys, the heat-affected zone is the weakest region, even after natural aging happens. This softening effect can lead to the remarkable reduction of proof strength in the heat-affected zone in the range of 30–50%, and this region typically extends 10–30 mm from the center of the weld [15]. It is reported that, during the MIG welding process, an arc is maintained between a continuous solid-wire electrode and the work piece, thereby causing a current flow that generates thermal energy in the partially ionized inert gas. The arc and the melt pool are shielded from atmospheric contamination by an inert or active gas. The typical microstructure of the fusion zone of an MIG joint contains a dendrite structure with wider arm spacing [16]. In previous work, the mechanical properties and fatigue strength of MIG butt welds with and without reinforcement as well as MIG T-fillet welded joints, both performed on 6082-T651 alloy plates, were analysed. It was observed that the friction stir processing significantly increases the fatigue strength of MIG welds. This behavior was mainly attributed to the geometry modification in the weld toe, reduction of weld defects, and grain refinement of the microstructure [17,18].
However, the T-joint is prone to incomplete penetration during welding. At present, there is no complete study on the causes of the occurrence of pores when the T-weld joint is not welded and fatigue performance when the weld is not penetrated [19]. Therefore, research on unwelded aluminum-alloy T-weld joints was carried out to conclude that the light weight and high speed of rail transit in high-speed trains are of great significance.
2. Experimental Process
2.1. Experimental Materials
In this experiment, the 6082 T6 aluminum alloy was selected as the base material. Since the ER5356 welding wire has good fluidity and it can prevent the occurrence of welding hot cracks, an ER5356 welding wire with a diameter of 1.2 mm was used for welding. Argon gas was used as a shielding gas during the welding process. The composition of the 6082 aluminum alloy and ER5356 welding wire is shown in Table 1. The mechanical properties of the 6082 aluminum alloy are in Table 2.

Table 1.
Chemical composition of the 6082 aluminum alloy and ER5356 welding wire (mass fraction %).
Table 2.
Mechanical properties of the 6082 aluminum alloy.
2.2. Test Methods
This experiment uses the MIG welding method for welding. Figure 1 displays the welding principle diagram. Welding-process parameters are shown in Table 3. The surface of the sample was sanded with sandpaper before the experiment to remove the oxide film from the welded portion, and then washed with acetone and dried. After the welding was completed, the sample was cut, ground, polished, and etched, and the metallographic structure was observed on a microscope (EPIPHOT300, Nikon, Tokyo, Japan); joint-hardness test was performed while using an HXD-1000 Vickers hardness tester, the hardness test-point spacing was 0.2 mm. Loading force was 100 gf and the load time was 15 s. The welded sample was polished at both ends and a high-frequency fatigue test was carried out. The fatigue diagram of the T-joint is shown in Figure 2. Its thickness was 7 mm and the thickness of the horizontal plate was 10 mm. The stress ratio of the fatigue test was R = 0.1 and the load sizes were 32.5, 35, 37.5, 40, 40.25, 45, 50, 55, 60, and 70 MPa. The target number of iterations was set to be over 107 cycles. A scanning electron microscope was used to observe the fracture and the failure sample surface to better reveal crack initiation and propagation details.
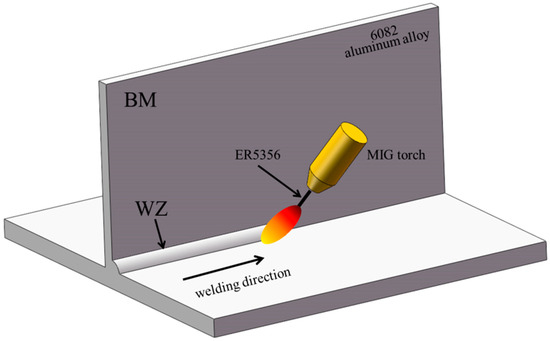
Figure 1.
Schematic diagram of metal inert gas (MIG) welding.
Table 3.
Welding parameters of the 6082 aluminum alloy.
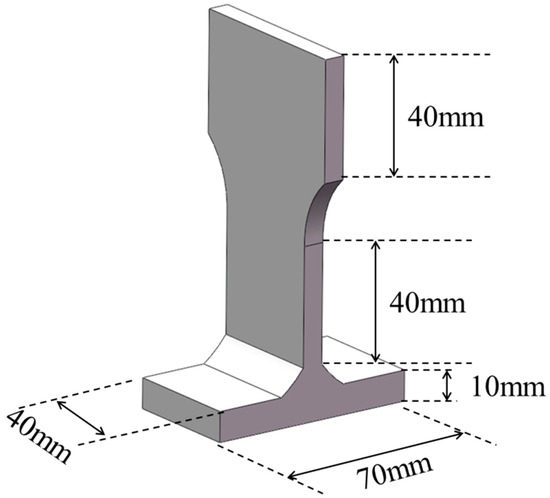
Figure 2.
Fatigue test for T welded joint of 6082 aluminum alloy with MIG welding.
3. Experimental Results and Analysis
3.1. 6082 Aluminum Alloy MIG-Welding T-Joint Microstructure
The solidification of the weld metal generally begins at the boundary of the weld pool, i.e., it solidifies from the solid–liquid interface. Solidification ways are plane solidification, cell solidification, and dendritic solidification. The way of solidification depends on temperature gradient (G), crystallization rate (R), and the supercooling of components [20].
In the 6082 aluminum-alloy MIG-welded T-joint, as shown in Figure 3a, when crystallization at the boundary of the molten pool begins, the components are supercooled to form cell crystals, and it can be observed that these grains adhere to the unmelted base material and they start to grow (in the yellow box). These grains have many different orientations during initial growth, but the grains along the direction of the temperature gradient compete for growth, and grains grown along other directions are inhibited and stop growing, thereby forming a length of about 100 μm. Cell crystal: since the solubility of the solid phase of the aluminum alloy is less than the solubility of the liquid phase, as the solid phase formed by solidification increases, solute concentration in the liquid phase increases, so the subcooling of the component increases, and the cell crystal appears to laterally form a cell shape. Dendritic (blue elliptical area): Figure 3b shows the microstructure of the weld center. At the center of the weld, the degree of the components’ supercooling continues to increase, and the molten metal receives little restraining force around the core and can be nucleated from the inside of the liquid phase during crystallization. A snowflake-shaped equiaxed crystal (within a yellow circle) having a diameter of about 50 μm is formed. However, in the process of equiaxed crystal growth, due to the agitation of the arc during the welding process, the equiaxed crystals are broken. If the agitation is small, then the incompletely fractured equiaxed crystals forms larger dendrites (blue in the color box); when large agitation is applied, a plurality of fine crystal grains having a diameter of 10–20 μm are formed to achieve the effect of refining the crystal grains. Refining the grains reduces the tendency of the liquefaction crack of the welded joint and improves the crack-propagation resistance of the welded joint.
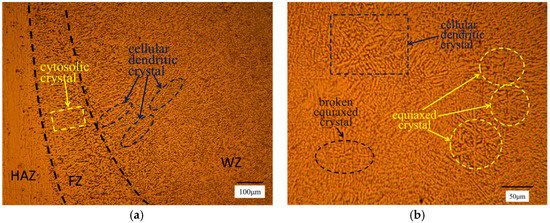
Figure 3.
Microstructure of weld joint of MIG-welded T joint of 6082 aluminum alloy. (a) Grain-boundary growth mode of weld pool; and, (b) grain structure of weld center.
Figure 4a shows the microstructure of the 6082 aluminum alloy base material, and the base material grains are fibrous along the rolling direction of the sheet. A large number of second phases are dispersed on the α(Al) aluminum substrate, and there are more black second phases on the base material. In addition to the melting of the filler metal during the welding process, the base material undergoes recrystallization under the action of thermal cycling to form a heat-affected zone (HAZ), as shown in Figure 4b. By observing the HAZ of the welded joint, the number of particles of the second phase is significantly reduced, and it can be observed that the color of the HAZ is brighter than that of the base metal, which is mainly due to the original dispersion distribution in the base metal when it is affected by the heat source. A large amount of fine second phases diffuse into α(Al) to form a supersaturated solid solution, so that the content of second phases is greatly reduced and the color becomes lighter. By comparing the microstructure of the base material and the HAZ, it can be observed that the grains in the HAZ are significantly grown due to the influence of the welding thermal cycle, and the fibrous structure does not change in length, but the width is significantly increased.
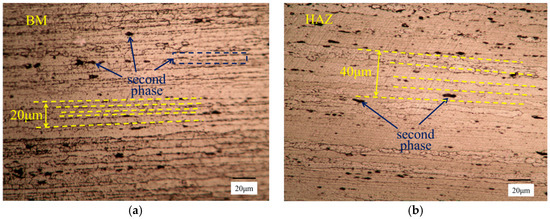
Figure 4.
6082 microstructure of T-welded joint of aluminum alloy: (a) base material (BM); and, (b) heat-affected zone (HAZ).
3.2. Hardness Analysis
Figure 5a shows the hardness distribution of the welded joint of the 6082 aluminum alloy. The hardness test point is shown in Figure 5b (from point A to point B), and the measuring point spacing is 0.2 mm. The medium hardness test points are divided into seven parts of the base material areas I, II, III, IV, V, VI, and base material (BM), including the weld zone and the heat-affected zone. During the welding process, the base metal changes due to the thermal cycle of the weld, and its mechanical properties change. This is called the heat-affected zone. In the 6XXX series aluminum alloy, the strength of the base metal mainly depends on the second phase of the failure-strengthened aluminum alloy. These second phases mainly include the GP zone, β″, β′, and β (Mg2Si), under the action of thermal cycling. These second phases dissolve and precipitate. The maximum temperature that can exist in the GP zone is 150 °C; the temperature of the β″ phase dissolution and precipitation is about 240–250 °C; precipitation temperature of β′ phase is about 250–320 °C; precipitation temperature of β phase is about 450 °C; and, the dissolution temperature is approximately 550 °C [21]. Therefore, when the HAZ is subjected to different welding thermal cycles, different second-phase particles in different parts are precipitated and dissolved, so the hardness of the HAZ also greatly varies.
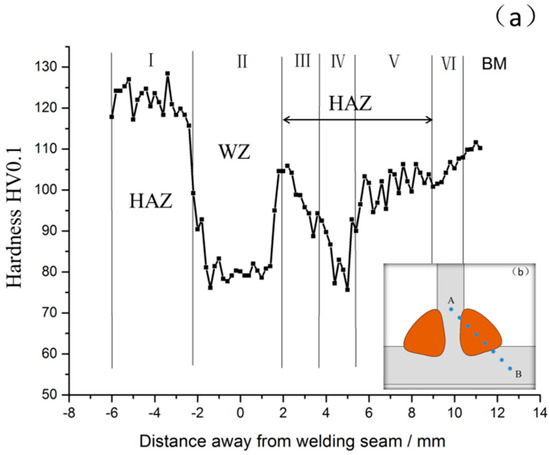
Figure 5.
6082 hardness distribution of T-welded joint of aluminum alloy: (a) weld hardness distribution; and (b) weld hardness test point.
From the hardness diagram, we can see that the hardness of Zone I is the highest and the highest value even reaches 130 HV. After the weld zone of Zone II, hardness drops sharply. It can be seen that the hardness of the weld zone is about 77–83 HV and the hardness reaches 70 of the base metal. The hardness increases rapidly to about 105 HV after passing through the weld zone. The hardness of the HAZ in Zone III is basically the same as that of the base metal; as it moves away from the center of the weld, the hardness curve begins to fall in Zone IV, the heat affected zone. This is a softening zone, as the hardness in Zone IV is about 75 HV, which almost reaches the lowest hardness value of the whole welded joint; when entering Zone V, the whole curve shows an upward trend, but the curve is very unstable between each test point. The change is very large: when the curve enters Zone VI, the hardness curve is stable at around 100 HV. After that, the curve rises steadily and finally reaches the hardness of the base material of about 110 HV, indicating that the hardness point has hit the base material (BM).
In Figure 5a, Zones I and III are both quenching zones in the heat-affected zone and Zone I is the zone of the T-joint neutral plate. It can be seen from the figure that the hardness is the highest in this zone and the hardness can be averaged at 124 HV. Zones I and III are the areas closest to the weld and have the highest heat temperature. Therefore, second-phase particles are dispersed in the base metal dissolve into α(Al) at high temperature to form a supersaturated body. The effect of dissolution strengthening led to an increase in the hardness of Zones I and III. Zone I is a vertical plate in the T-weld joint, and, during the welding process, it is subjected to two thermal cycles of welding. More second-phase particles are dissolved into α(Al), which greatly increases hardness. Average hardness reaches 125 HV; Zone IV is the softening zone of the heat-affected zone of the aluminum alloy, and hardness in this zone was at least 70 HV. In the softening zone, the highest temperature of the welding thermal cycle did not reach the dissolved Mg2Si dissolution temperature and only a small amount of β phase precipitates; at the same time, the strengthening phase grows under the action of the heating temperature, causing thermal influence under the action of multiple reasons. A softened zone appears in the zone.
Figure 6a is the microhardness curve of the T-joint transverse plate. The hardness test point is shown in Figure 6b (hardness test point from C to D); the left weld is the first weld and the right is the second weld. The hardness in Figure 6a is actually the hardness of the test heat-affected zone. From Figure 6a, we can see that the heat-affected zone of either the first weld or the second weld is consistent with the hardness characteristics that are described above, but the hardness of the heat-affected zone of the first weld on the left side should be greater than the hardness of the heat-affected zone of the second weld on the right side. From Figure 6a, it can also be found that the soft-zone width of the first-weld heat-affected zone (Area B) was about 8 mm, while the soft zone of the second-weld heat-affected zone (Area A) was only about 5 mm wide. The reason is mainly that the first pass of the heat-affected zone of the weld was affected by the second welding heat cycle in addition to the first welding heat cycle, which was equivalent to a heat treatment after welding, so that the hardness of the heat-affected zone was improved to some extent. After the second thermal cycle, the strengthening phase in the vicinity of the softening zone of the first weld grew and the precipitated strengthening phase was less, so the softening-zone width of the first weld increased.
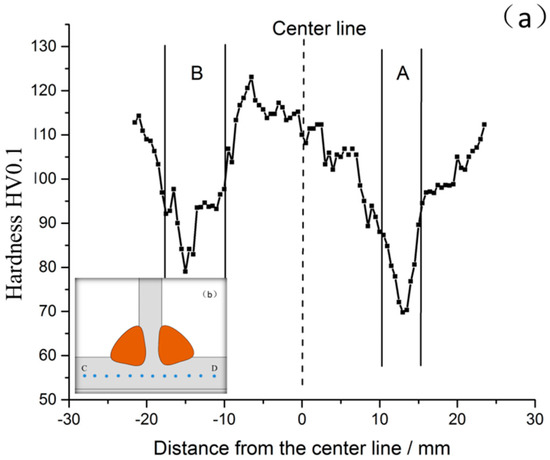
Figure 6.
Hardness distribution of T-type joints on the cross plate: (a) T-type joint transverse hardness; and, (b) T-type transverse-point joint hardness test.
3.3. Fatigue Test Analysis
According to the national standard GB/T15248-2008 (metal material axial constant amplitude low-cycle fatigue test method) in the lifting method for a high-cycle fatigue test, the results are shown in Table 4. This was after multiple tests to obtain multiple sets of cyclic-stress and cycle-number relationship data.
Table 4.
Fatigue-test data.
In the fatigue-test data of Table 4, the experimental stress ratio R = Smin/Smax = 0.1. When plotting the S–N curve, stress amplitude Sa = (Smax − Smin)/2 and fatigue life N are usually used as variables in the S–N curve. Fatigue life N is usually in the form of logarithmic coordinates, while stress amplitude is in the form of linear coordinates and logarithmic coordinates. This paper uses the form of logarithmic coordinates, because there is an approximately linear relationship between logN and logSa in a large N-value interval. Fatigue data for base metal and welded joints are matched by Equation (1).
where Sa is the stress amplitude, N is the number of fatigue cycles, k is the fatigue-strength coefficient, and C is the fatigue-strength coefficient defined when the number of cycles N = 1. In order to facilitate linear fitting, the logarithms of the two ends of Equation (1) are obtained in Equation (2):
According to Table 3, the S–N curve of the 6082 aluminum alloy T-weld joint was drawn, in which the abscissa is logN and the ordinate is logSa. The data of Table 3 were substituted and linear fitting was performed by using Origin software to obtain Figure 7.
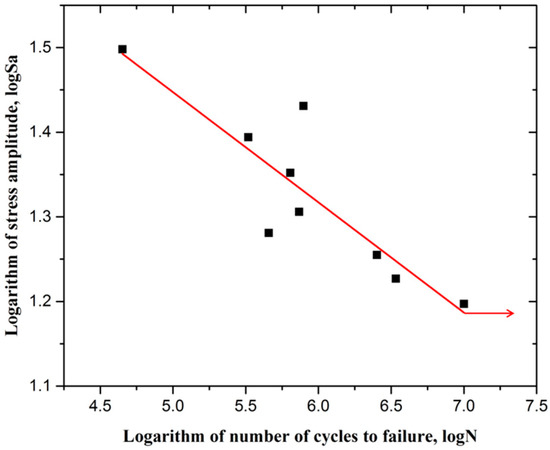
Figure 7.
6082 S–N curve of T-welded joint of aluminum alloy.
From the linear fitting results in Figure 7, it can be obtained that the life of the 6082 aluminum alloy T-welded joint increases significantly with the decrease of stress amplitude. When the stress level increased, the life of the welded joint rapidly decreased. The linear formula that is obtained by fitting is:
log N = −0.13023 logSa + log 125.5
It can be estimated by Equation (3) that the fatigue limit of the 6082 aluminum alloy T-weld joint is 37.6 MPa, and, when it exceeds this limit, the T-weld joint breaks. Analysis of the 6082 aluminum alloy T-weld joint with fatigue fracture found that all fracture locations occurred in the weld, indicating that the weld is a weak position for the welded joint.
3.4. T-Joint Fatigue Fracture and Fatigue Fracture
The fatigue-fracture specimen of the 6082 aluminum-alloy T-weld joint was observed. As shown in Figure 8, it was found that the fatigue crack originated from the root of the T-welded joint, spreading toward the weld, while the cracking that occurred at the T-weld joint was due to there being pores in the root of the 6082 aluminum alloy T-weld joint. Pores reduce the stress area of the welded joint, which reduces the mechanical properties of the joint. At the same time, under the action of the fatigue-test cyclic load, stress concentration occurs at the pore boundary, which causes the fatigue cracks to crack from the pores. It can be observed from Figure 8 that the T-shaped welded joint between the vertical plate and the horizontal plate was not welded at the left side of the air hole, which is equivalent to the existence of a preset crack before the fatigue test, which greatly reduces the fatigue life of the 6082 aluminum alloy T-weld joint and the maximum stress that can be carried. More unfortunately, there were pores at the nonfused edges, which caused cracking on the side of the pores close to the base metal, and cracking was more likely to occur on the weld side due to stress concentration. Therefore, pores and incomplete penetration are the main causes of fatigue fracture. The mechanisms of pores and cracking are described in detail further in the article.
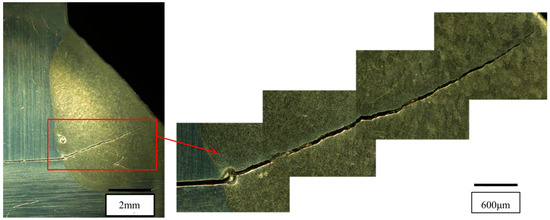
Figure 8.
Fatigue crack in T joint of 6082 aluminum alloy.
A fatigue test of the 6082 aluminum alloy T-welded joint was carried out. The fatigue fracture of the T-welded joint was analyzed by SEM. It was found that the fatigue source area was the pore of the weld root, and the fatigue crack was cracked by the pore. Crack stress-intensity factor ∆K was near the threshold value ∆Kth, and the crack was in the slow-expansion phase (Figure 9a). In Figure 9a, it was found that there were many secondary microcracks perpendicular to the fracture surface on the fracture surface. Figure 9b is an enlarged view of the yellow square of Figure 9a, in which there was a distinct ductile-fracture characteristic, where a large number of tearing ribs were present, which were caused by crack propagation in different planes. It can be observed in Figure 9b that the two tear edges eventually merged to form one tear edge (shown by a yellow arrow), which reflected the direction in which the crack extended from bottom to top. It can also be observed in Figure 9b that the cleavage-like step also illustrates the presence of cleavage-fracture characteristics at the fracture. Figure 9c shows the instantaneous break zone in the fatigue fracture, and it can be observed from the figure that semielliptical tear-shaped dimples are composed entirely of the instantaneous break zone, which is why these dimples are tear-shaped. At the same time, it can be observed that the size of the dimples is small, because they are due to fatigue cracks that are generated during the fracture process through the second-phase particles. The size of the second-phase particles in the weld of the 6082 aluminum alloy MIG welding was also small, which caused a smaller size-tearing dimple. It can be observed from the figure that the direction of the semicircular dimple opening was mainly in the direction indicated by the arrow, that is, the direction in which the main crack extended.
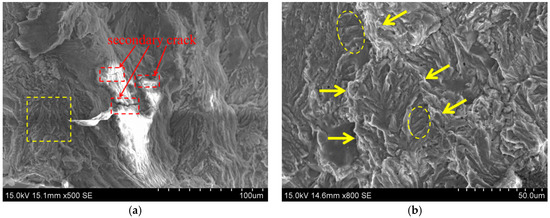
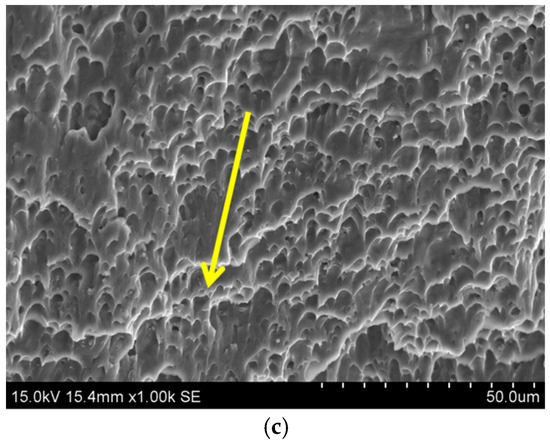
Figure 9.
(a) T-type joint weld fatigue fracture; (b) weld crack propagation area; and, (c) weld transient area.
4. Discussion
4.1. T-Type Joints Produce Pores
By observing the weld joint of the 6082 aluminum alloy T-joint bilateral welding, we can find that there was basically no porosity in the center of the weld and the pores mainly existed in two cases, as shown in Figure 10. The first case was that the pores presented in the penetration were near the pores near the weld line at the root of the weld; the second case is that the pore was near the weld line.
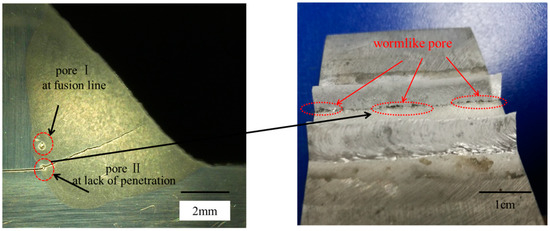
Figure 10.
Porosity distribution in T-joint.
The common cause of the pores in these two cases is that, in the 6082 aluminum-alloy T-welding, there was a large amount of surface oxide film at the joint between the vertical plate and the horizontal plate at the root of the weld. The surface of these oxide films adsorb moistures. The following reaction occurs during welding:
3H2O + Al = Al2O3 + 6H
According to Formula (4), it is known that a large amount of hydrogen is generated in the presence of moisture, and these hydrogen elements are generated at the bottom of the molten pool; a small portion of these hydrogen elements dissolve into the aluminum alloy in the liquid phase. However, most of the hydrogen element is present as hydrogen. However, the solubility of hydrogen in solid aluminum alloy is 0.036 mL/100 g, while the solubility of hydrogen in a liquid-phase aluminum alloy is 0.69 mL/100 g and the dissolution rate of hydrogen in the liquid phase and solid phase changed greatly. During the MIG-welding cooling process, there was supersaturated hydrogen in the liquid phase. When the temperature dropped to the solidus line, a large amount of hydrogen was precipitated. This precipitated hydrogen provided the conditions for bubble nucleation. On the other hand, the surface energy required for bubble nucleation is very low, so it is very easy to nucleate at the dendritic interface when the MIG is welded to the aluminum alloy. This provided conditions for bubble nucleation at the junction of the 6082 aluminum-alloy T-weld at the root of the weld and the transverse plate.
In the case of aluminum-alloy thick-plate T-type MIG welding, the case of incomplete penetration at the joint occurred, and, in the case of no penetration, the oxide film on the surface of the nonmelted base material provided an attachment point for the nucleation of the bubble. It can be seen from Figure 10 that most of the base metal in the T-joint did not melt, so bubbles that are generated near the fusion line tended to adhere to these oxide films, and the bubbles needed to satisfy the conditions in which they grow:
Ph represents the pressure in the bubble, σ is the surface tension of the liquid metal and the bubble, the surface tension of the liquid aluminum σ is 0.9 N/2 cm, and r is the bubble radius. At the beginning of bubble nucleation, the radius is extremely small, and the inside of the bubble needs a lot of pressure to grow. However, from Figure 10, we can observe that the pores generated at the T-joint were insect-like pores, and the length of the pores was long. This indicates that the bubble length was very long when the bubble is formed at the bottom of the molten pool, resulting in a large bubble radius r. It indicates that, during MIG welding, there is a large amount of bubble nucleation at the root of the T-joint along the welding direction. These bubbles come into contact with each other and fuse into insect-like long bubbles. This causes the internal pressure to be small, enabling the bubbles to continue to grow, which provides conditions for the growth of the bubble at the root of the T-joint.
Therefore, in all of the above cases, after the bubble is generated at the bottom of the T-joint root pool, the bubble density is generally lower than the density of the liquid-phase aluminum alloy, and the bubble floats out of the molten pool; however, as shown in Figure 11, the bubbles in the 6082 aluminum alloy T-joint weld pool were adsorbed on the surface oxide film where the T-joint was not penetrated. At the beginning of the welding, a large number of bubbles were adsorbed at the incomplete penetration. Since the density of the liquid aluminum alloy was small, the buoyancy of the bubble floating was also small, and the attraction between the oxide film and the bubble that needed to be overcome by the buoyancy is large, which caused the bubbles to not easily be separated from the surface oxide film. This gathers at the root of the T-joint that is not welded, and because there is residual air between the two base metals that are not welded, the air moves to the growing bubbles when heated, which causes the bubbles to grow. After the weld pool is solidified, a series of insect-like pores are formed at the root of the T-joint.
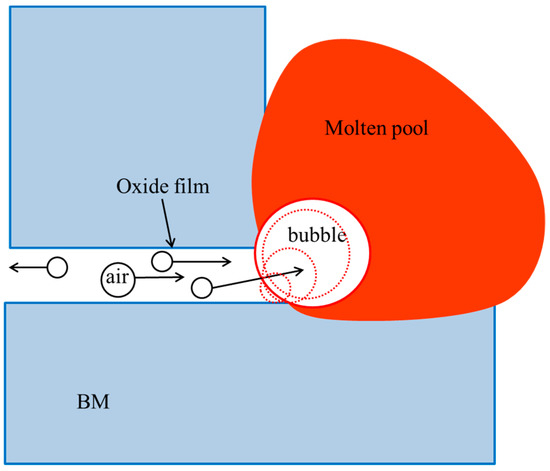
Figure 11.
Pore-forming mechanism at incomplete penetration.
In Figure 10, we can observe that in the second case of the pores, the pores near the weld root and near the weld line are near the weld line in the middle of the weld. There are two main reasons for this phenomenon: First, when the 6082 aluminum alloy T-joint is welded, the T-joint has more heat-conduction direction than the butt joint, and the aluminum alloy has high thermal conductivity, which makes the molten pool solidify. The speed is higher, preventing bubbles from floating up to form air holes; secondly, as shown in Figure 12, when the T-joint is formed, and when the molten pool is formed at the root of the two plate contacts, the molten pool is equivalently suspended for the vertical plate. Bubbles located in the upper part of the molten pool could easily overflow, but bubbles at the bottom of the molten pool needed to pass a greater distance on the floating path (Figure 12a). The bubbles at the bottom of the molten pool float up to the middle of the inverted suspended pool, and are connected to the edge of the molten pool, so as to be adsorbed on the edge of the molten pool, preventing the bubbles from floating. As the molten pool cooled, the pores near the fusion line were finally formed (Figure 12b).
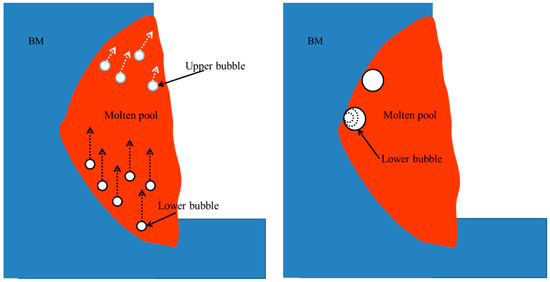
Figure 12.
Pore-forming mechanism at lack of penetration. (a) Bubbles floating up in the bath; and, (b) bubbles forming pores near the weld line.
4.2. Mechanism of Fatigue-Crack Generation
Next, we mainly analyze the main mechanism of the cracking of fatigue cracks at the pores. Cracking is mainly affected by stress concentration and the strength of stress distribution depends on stress-intensity factor K. The larger stress-intensity factor K is, the more concentrated stress is, and the easier the sample is to crack. In Figure 10, we can see that incomplete penetration corresponds to the existing precrack, as shown in Figure 13a, so we can establish a model of the precrack to calculate the stress-intensity factor of the precrack tip. Stress-intensity factor K of the precracked tip is derived from Westergaard [22]:
where β is a dimensionless factor related to the geometry of the sample, σ is the applied stress, and L is the length of the precrack. However, from Figure 10, we can observe that there were pores in the incomplete penetration, and when the pores are connected to the incomplete penetration, it can be regarded as increasing the length of the preset crack, as shown in Figure 13b. So, we can modify Equation (6):
where r is the pore radius. When the pores are connected to the incomplete penetration, it is equivalent to increasing the length of the precrack. From Equation (7), we can conclude that, when pores are connected to the incomplete penetration, K increases significantly, resulting in greater stress concentration. Cracking is more likely to occur here:
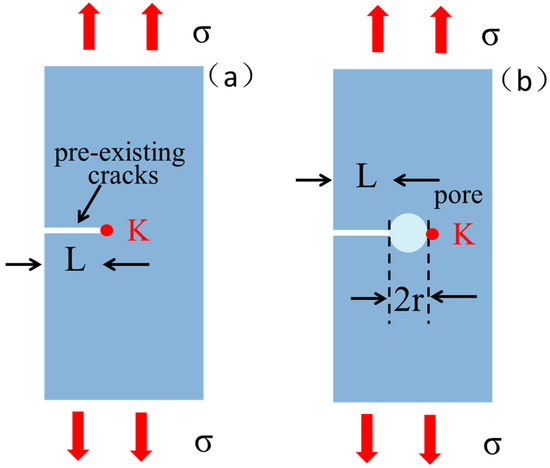
Figure 13.
Cracking mechanism in the case of no penetration; (a) no pores; (b) pores.
When fatigue cracks occur around the pores, a large number of microcracks appear around the pores. This shows that fatigue cracks appear in many parts around the pores, and as fatigue-test cracks continue to expand, some of the microcracks stop growing, and other parts of microcracks intersect to form a main crack, eventually leading to fatigue fracture.
In addition, pores were located near the fusion line, so the pore edges were surrounded by elongated columnar crystals. As shown in Figure 14a, protrusions and depressions were formed at the intersections of the grain boundaries of the columnar crystals, and the pores, and gaps formed at the depressions. Liu pointed out in their article that the gap could increase the stress concentration factor and the increased degree is related to the size of the gap [23]. If there are many equiaxed crystals inside the pore, the distance between them and the gap might be very small. In this way, stress-concentration factor at the gap is generally greater, so the crack always initiates at the gap.
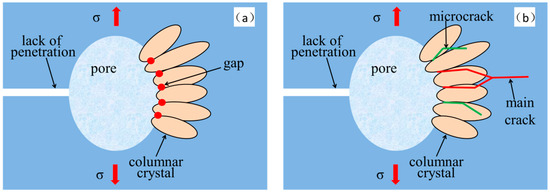
Figure 14.
Fatigue-crack initiation mechanism at pore: (a) fatigue-crack initiation at the intersection of columnar grain boundary and pore; and, (b) crack propagation after initiation.
Similarly, in this experiment, the elongated columnar crystals around the pores create larger gaps, which results in greater stress concentration, so cracks sprout under very small stresses. Fatigue cracks expand after the initiation of the gap at the pore edges, forming numerous microcracks. As shown in Figure 14b, if these microcracks are perpendicular to the applied load, they expand in an accelerating manner. During the expansion process, microcracks continuously to form the main crack, while some of the microcracks stopped expanding. This continuous expansion of the main crack eventually leads to fatigue fracture.
5. Conclusions
(1) When welding the 6082 aluminum-alloy T-joint, the weld metal begins to grow from the fusion zone. Due to the supercooling of the component, the cell boundary is changed from 100 μm to cell dendrites at the weld boundary, and the center of the weld is composed of equiaxed crystals and fine grains after the equiaxed crystals are broken. The vertical plate of the T-joint is equivalent to two thermal cycles, resulting in the highest hardness of 124 HV, while the hardness of the weld zone is 80 HV on average. However, there is a softened zone with a width of about 5 mm in the heat-affected zone of the entire welded joint, and its hardness is only 70 HV.
(2) The fatigue test of the 6082 aluminum-alloy T-weld joint shows that the fatigue life of the T-joint is significantly improved with the decrease of the stress amplitude. The fatigue limit of the 6082 aluminum alloy T-joint was calculated to be 37.6 MPa. Fatigue cracks are all initiated in the pores where the T-joint is not welded. During the crack-propagation process, the stable expansion zone has secondary cracks perpendicular to the main crack. The expansion zone has a large number of tearing edges and it exhibits some cleavage-fracture characteristics. In the instantaneous fault zone, a large number of tear-shaped dimples are distributed, and the instantaneous fault zone exhibits ductile fractures.
(3) The aluminum alloy in the liquid phase of the molten pool precipitates a large amount of hydrogen during solidification. These hydrogen atoms are adsorbed in the oxide film that is not penetrated, and grow to form bubbles, and the air that is not penetrated is moved to the bubble by heat. After the pool is cooled, it forms a pore that is not welded. At the same time, the molten pool of the T-joint is overhanged during welding, the bubbles in the lower part of the molten pool are adsorbed on the fusion line at the upper part of the molten pool when floating, and, finally, pores are formed.
(4) The incomplete penetration of the T-joint forms a precrack with the pores, which increases the stress-intensity factor and causes large stress concentration. At the same time, the elongated columnar crystal at the edge of the pores forms a gap at the grain boundary, and a greater stress concentration is formed at the gap, so fatigue cracks are all generated at the gap and expanded.
Author Contributions
Conceptualization, S.Y.; Data planner, C.D. and J.G.; Formal analysis, Q.X.; Capital acquisition, S.Y.; Investigation, C.D., J.G., Q.X. and Y.W.; Method, C.D.; Project management, C.D. and S.Y.; Resources, Q.X.; Supervision, S.Y.; Verification, J.G. and Y.W.; Writing-original-draft, C.D.; Manuscript editor, C.D.
Funding
This project is sponsored by the Shanghai Natural Science Foundation of China (Grant No.14ZR1418800).
Acknowledgments
This project is sponsored by Shanghai University of Engineering Science Innovation Fund for Graduate Students (No. 18KY0510).
Conflicts of Interest
The authors declare no conflict of interest.
References
- Pereira, A.M.; Ferreira, J.M.; Loureiro, A.; Costab, J.D.M.; Bártoloa, P.J. Effect of process parameters on the strength of resistance spot welds in 6082-T6 aluminum alloy. Mater. Des. 2010, 31, 2454–2463. [Google Scholar] [CrossRef]
- Kim, S.J.; Lee, S.J.; Jeong, J.Y. Electrochemical characteristics of Al-Mg and Al-Mg-Si alloy in sea water. Trans. Nonferr. Met. Soc. China 2012, 22, 881. (In Chinese) [Google Scholar] [CrossRef]
- Skillingberg, M.; Green, J. Aluminum applications in the rail industry. Light Met. Age 2007, 65, 8. [Google Scholar]
- Su, H. Aluminum application in the rail industry. Recycl. Resour. 2008, 24, 95–99. [Google Scholar]
- Yang, X. Introduction of dynamic of foreign high speed train related technology. Iron Road Locomot. Roll. Stock. Work. 2006, 1. (In Chinese) [Google Scholar]
- Sidhoma, N.; Laamouria, A.; Fathallahb, R.; Rahamc, C.B.; Lieurade, H.P. Fatigue strength improvement of 5083 H11 Al-alloy T-welded joints by shot peening: Experimental characterization and predictive approach. Int. J. Fatigue 2005, 27, 729–745. [Google Scholar] [CrossRef]
- Cho, J.H.; Kim, W.J.; Chang, G.L. Evolution of Microstructure and Mechanical Properties during Friction Stir Welding of A5083 and A6082. Procedia Eng. 2014, 81, 2080–2085. [Google Scholar] [CrossRef]
- Qin, G.; Lei, Z.; Su, Y.; Fu, B.; Meng, X.; Lin, S. Large spot laser assisted GMA brazing-fusion welding of aluminum alloy to galvanized steel. J. Mater. Process. Technol. 2014, 214, 2684–2692. [Google Scholar] [CrossRef]
- Gungor, B.; Kaluc, E. Mechanical and microstructural properties of robotic Cold Metal Transfer (CMT) welded 5083-H111 and 6082-T651 aluminum alloys. Mater. Des. 2014, 54, 207–211. [Google Scholar] [CrossRef]
- Jacome, L.A.; Weber, S.; Leitner, A. Influence of filler composition on the microstructure and mechanical properties of steel-aluminum joints produced by metal arc joining. Adv. Eng. Mater. 2009, 11, 350–358. [Google Scholar] [CrossRef]
- Costa, J.D.M.; Jesus, J.S.; Loureiro, A.; Ferreira, J.A.M.; Borrego, L.P. Fatigue life improvement of mig welded aluminium T-joints by friction stir processing. Int. J. Fatigue 2014, 61, 244–254. [Google Scholar] [CrossRef]
- İpekoğlu, G.; Erim, S.; Gören-Kiral, B.; Çam, G. Investigation into the effect of temper condition on friction stir weldability of AA6061 Al-alloy plates. Kov. Mater. 2013, 51, 155–163. [Google Scholar]
- Maya-Johnson, S.; Santa, J.F.; Mejía, O.L.; Aristizábal, S.; Ospina, S.; Cortés, P.A.; Giraldo, J.E. Effect of the number of welding repairs with GTAW on the mechanical behavior of AA7020 aluminum alloy welded joints. Metall. Mater. Trans. B 2015, 46, 2332–2339. [Google Scholar] [CrossRef]
- Wang, Z.; Tian, R. Aluminum Alloy and Processing Handbook; Central South University Press: Changsha, China, 2000. [Google Scholar]
- Madhusudhan, R.G.; Gokhale, A.; Prasad, R.K. Optimization of pulse frequency in pulsed current gas tungsten arc welding of aluminium-lithium. J. Mater. Sci. Technol. 1998, 14, 61–66. [Google Scholar]
- Windmann, M.; Röttger, A.; Kügler, H.; Theisen, W. Microstructure and mechanical properties of the heat-affected zone in laser-welded/brazed steel 22MnB5–AA6016 aluminum/AZ31 magnesium alloy. J. Mater. Process. Technol. 2017, 247, 11–18. [Google Scholar] [CrossRef]
- Lakshminarayanan, A.; Balasubramanian, V.; Elangovan, K. Effect of welding processes on tensile properties of AA6061 aluminium alloy joints. Int. J. Adv. Manuf. Technol. 2009, 40, 286–296. [Google Scholar] [CrossRef]
- Silva, J.; Costa, J.M.; Loureiro, A.; Ferreira, J.M. Fatigue Behaviour of AA6082-T6 MIG Welded Butt Joints Improved by Friction Stir Processing. Mater. Des. 2013, 51, 315–322. [Google Scholar] [CrossRef]
- Zangabad, P.S.; Khodabakhshi, F.; Simchi, A.; Kokabi, A.H. Fatigue fracture of friction-stir processed Al–Al 3 Ti–MgO hybrid nanocomposites. Int. J. Fatigue 2016, 87, 266–278. [Google Scholar] [CrossRef]
- Xiao, J.; Gong, W.; Liu, W.; Liu, J. Study on the microstructure and properties of 6005A-T6 / 6082-T6 aluminum alloy FSW and MIG joint. J. Changchun Univ. Technol. 2015, 1, 1. (In Chinese) [Google Scholar]
- Kumar, N.; Goel, S.; Jayaganthan, R. Effect of grain boundary misorientation, deformation temperature and AlFeMnSi-phase on fatigue life of 6082 Al alloy. Mater. Charact. 2017, 124, 229–240. [Google Scholar] [CrossRef]
- Westergaard, H.M. Bearing Pressures and Cracks. J. Appl. Mechunies 1939, 6, 49–53. [Google Scholar]
- Liu, H.; Yang, S. Microstructure characterization and mechanism of fatigue crack initiation near pores for 6005A CMT welded joint. Mater. Sci. Eng. A 2017, 707, 22–29. [Google Scholar] [CrossRef]
© 2018 by the authors. Licensee MDPI, Basel, Switzerland. This article is an open access article distributed under the terms and conditions of the Creative Commons Attribution (CC BY) license (http://creativecommons.org/licenses/by/4.0/).