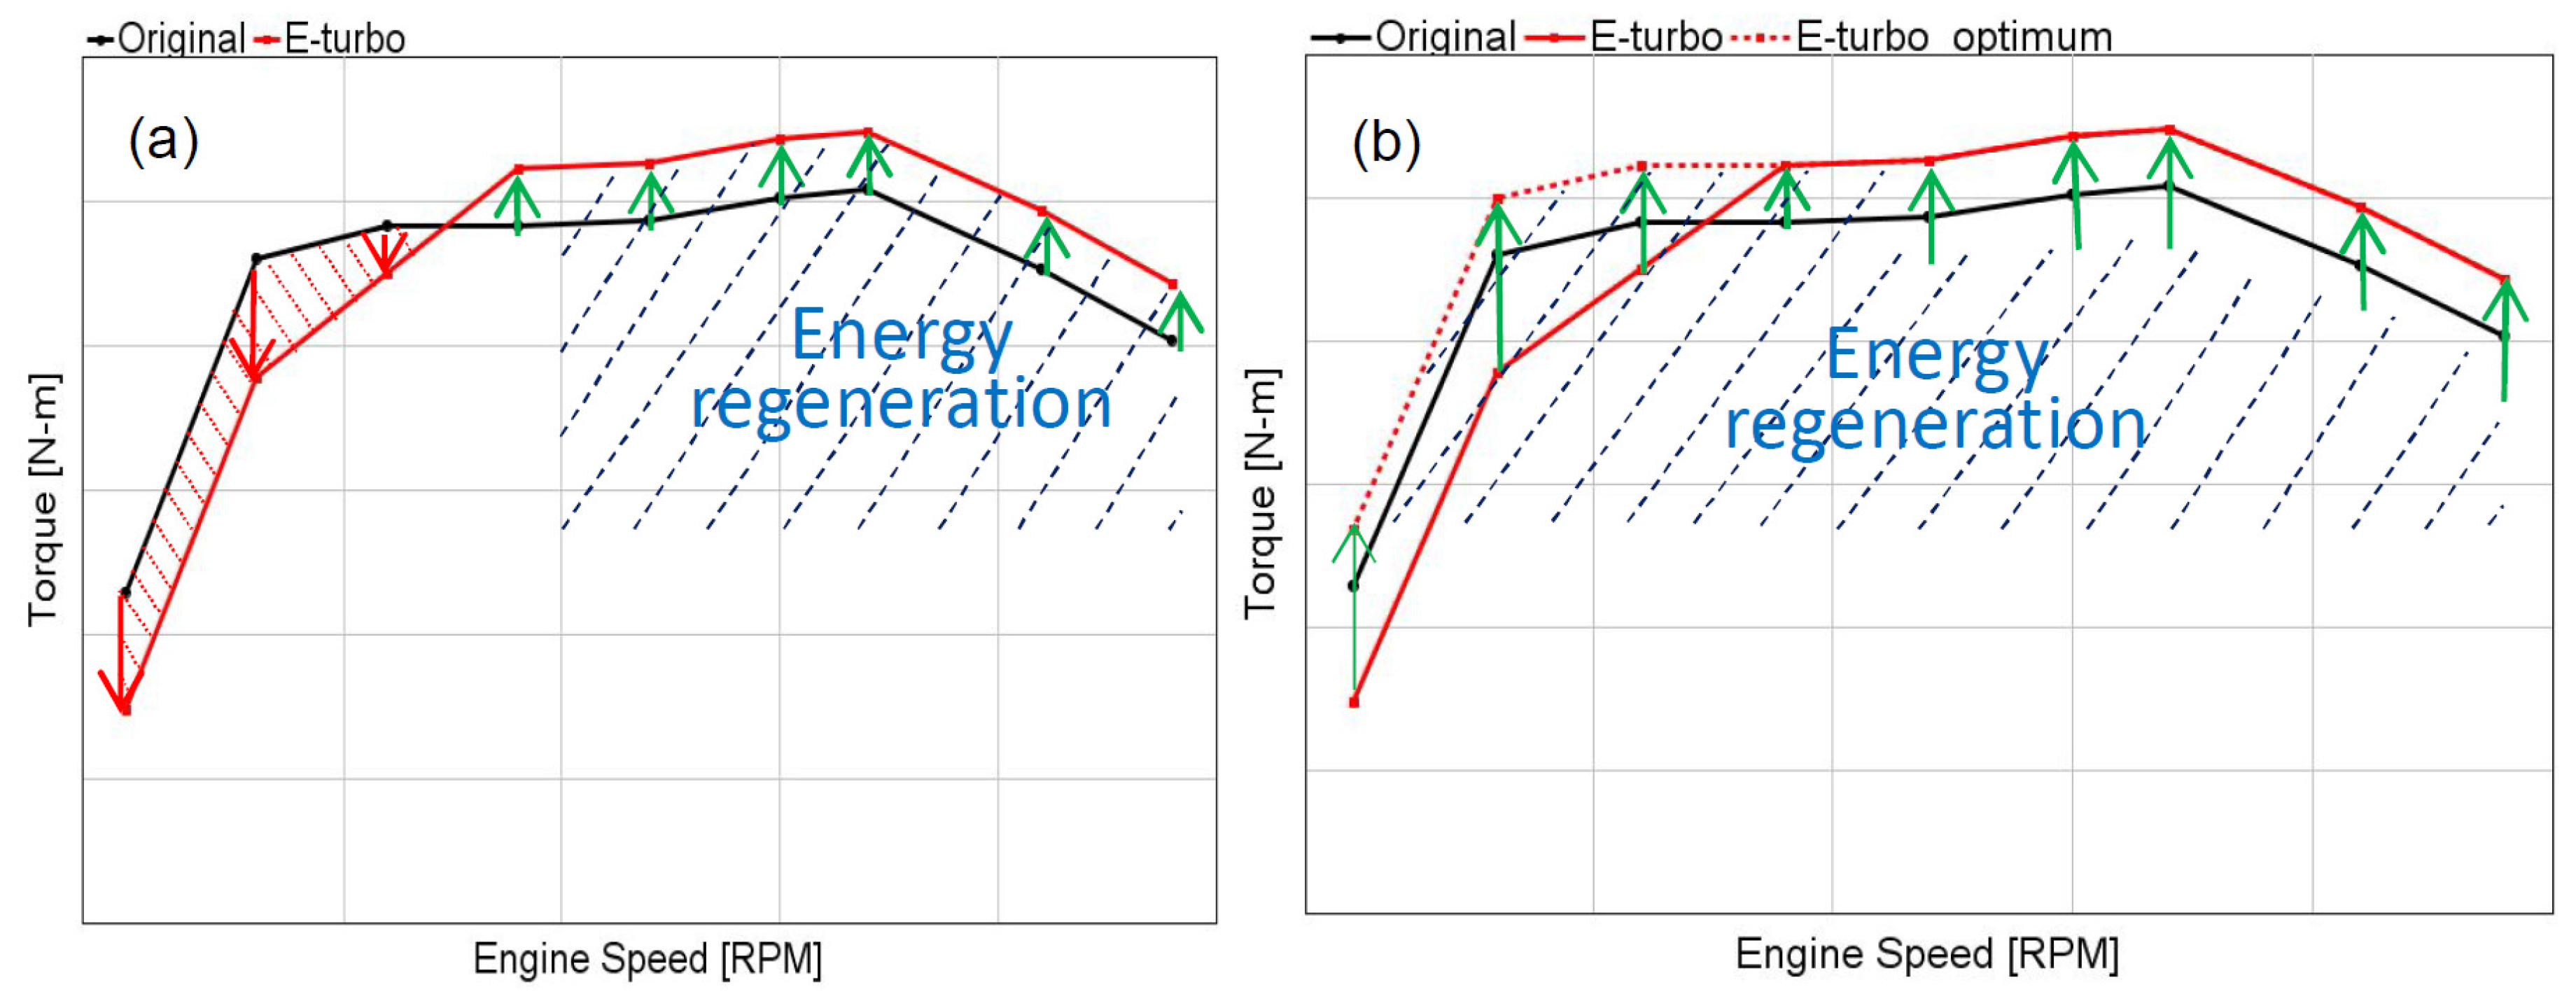
Figure 1.
Energy regeneration areas over the load/speed map of an engine: (a) current approach; (b) desired operation.
Figure 1.
Energy regeneration areas over the load/speed map of an engine: (a) current approach; (b) desired operation.
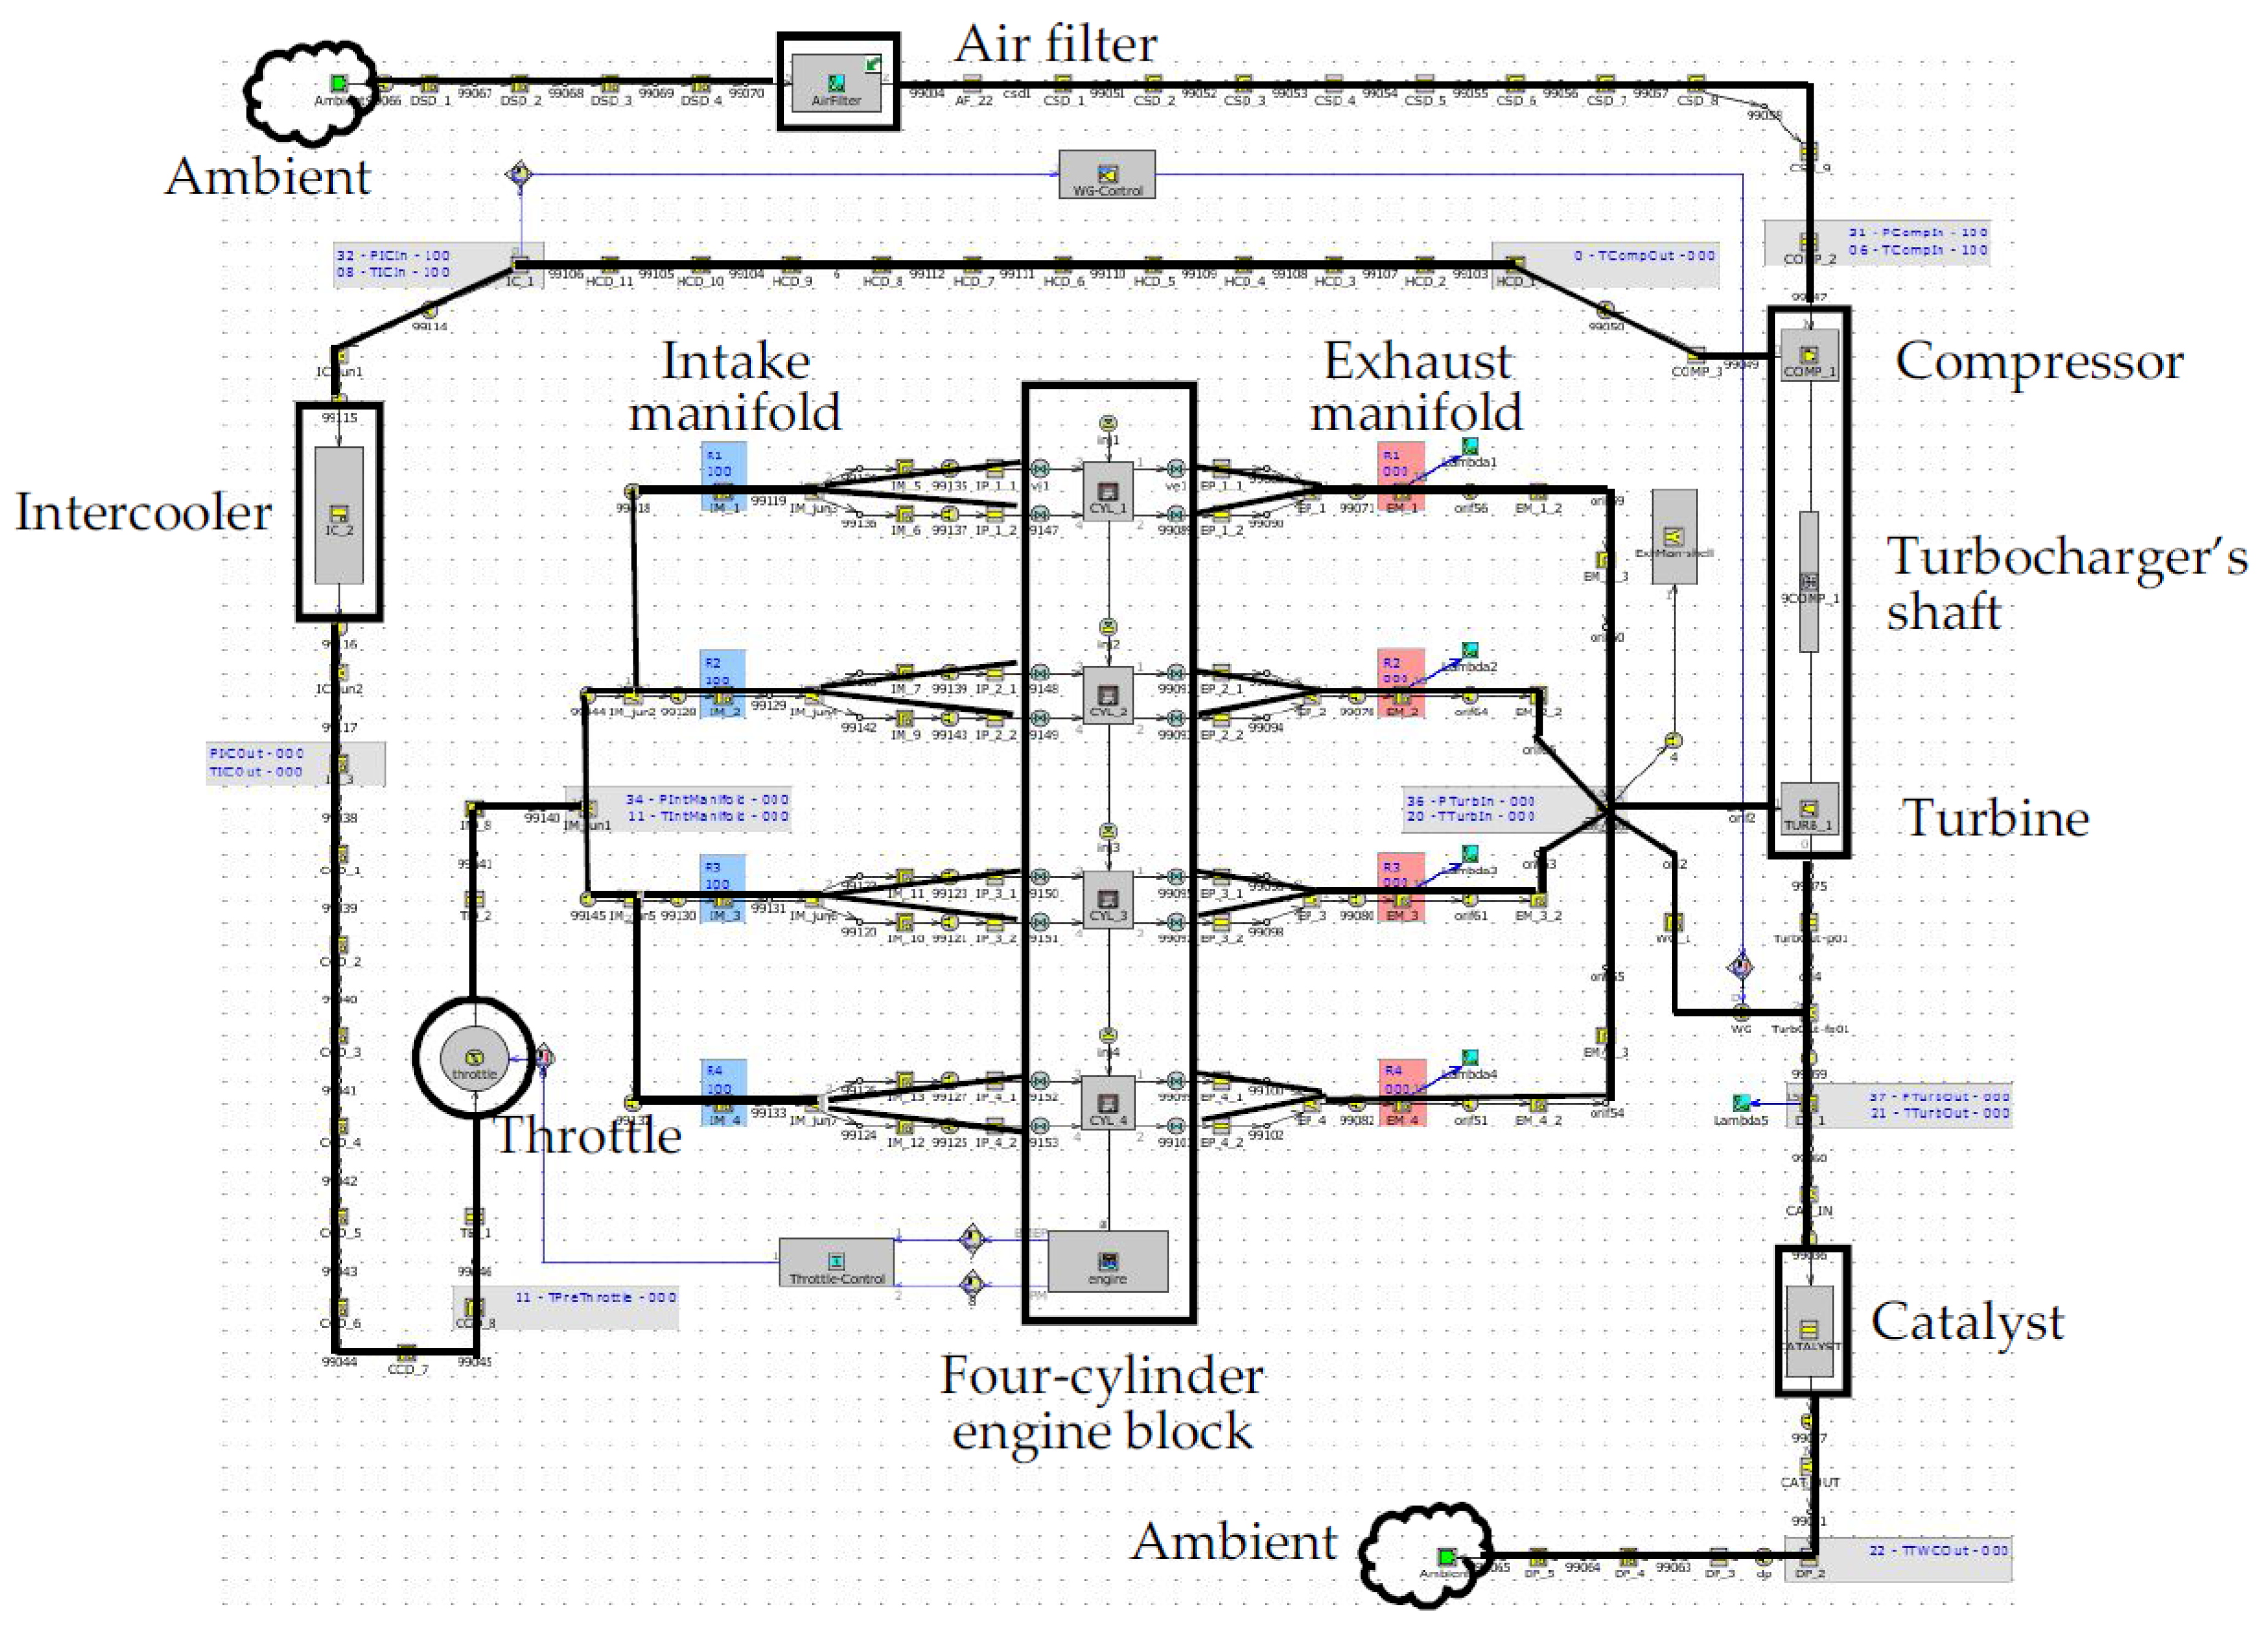
Figure 2.
1D model of the baseline 2.0 L turbocharged engine used in the present study.
Figure 2.
1D model of the baseline 2.0 L turbocharged engine used in the present study.
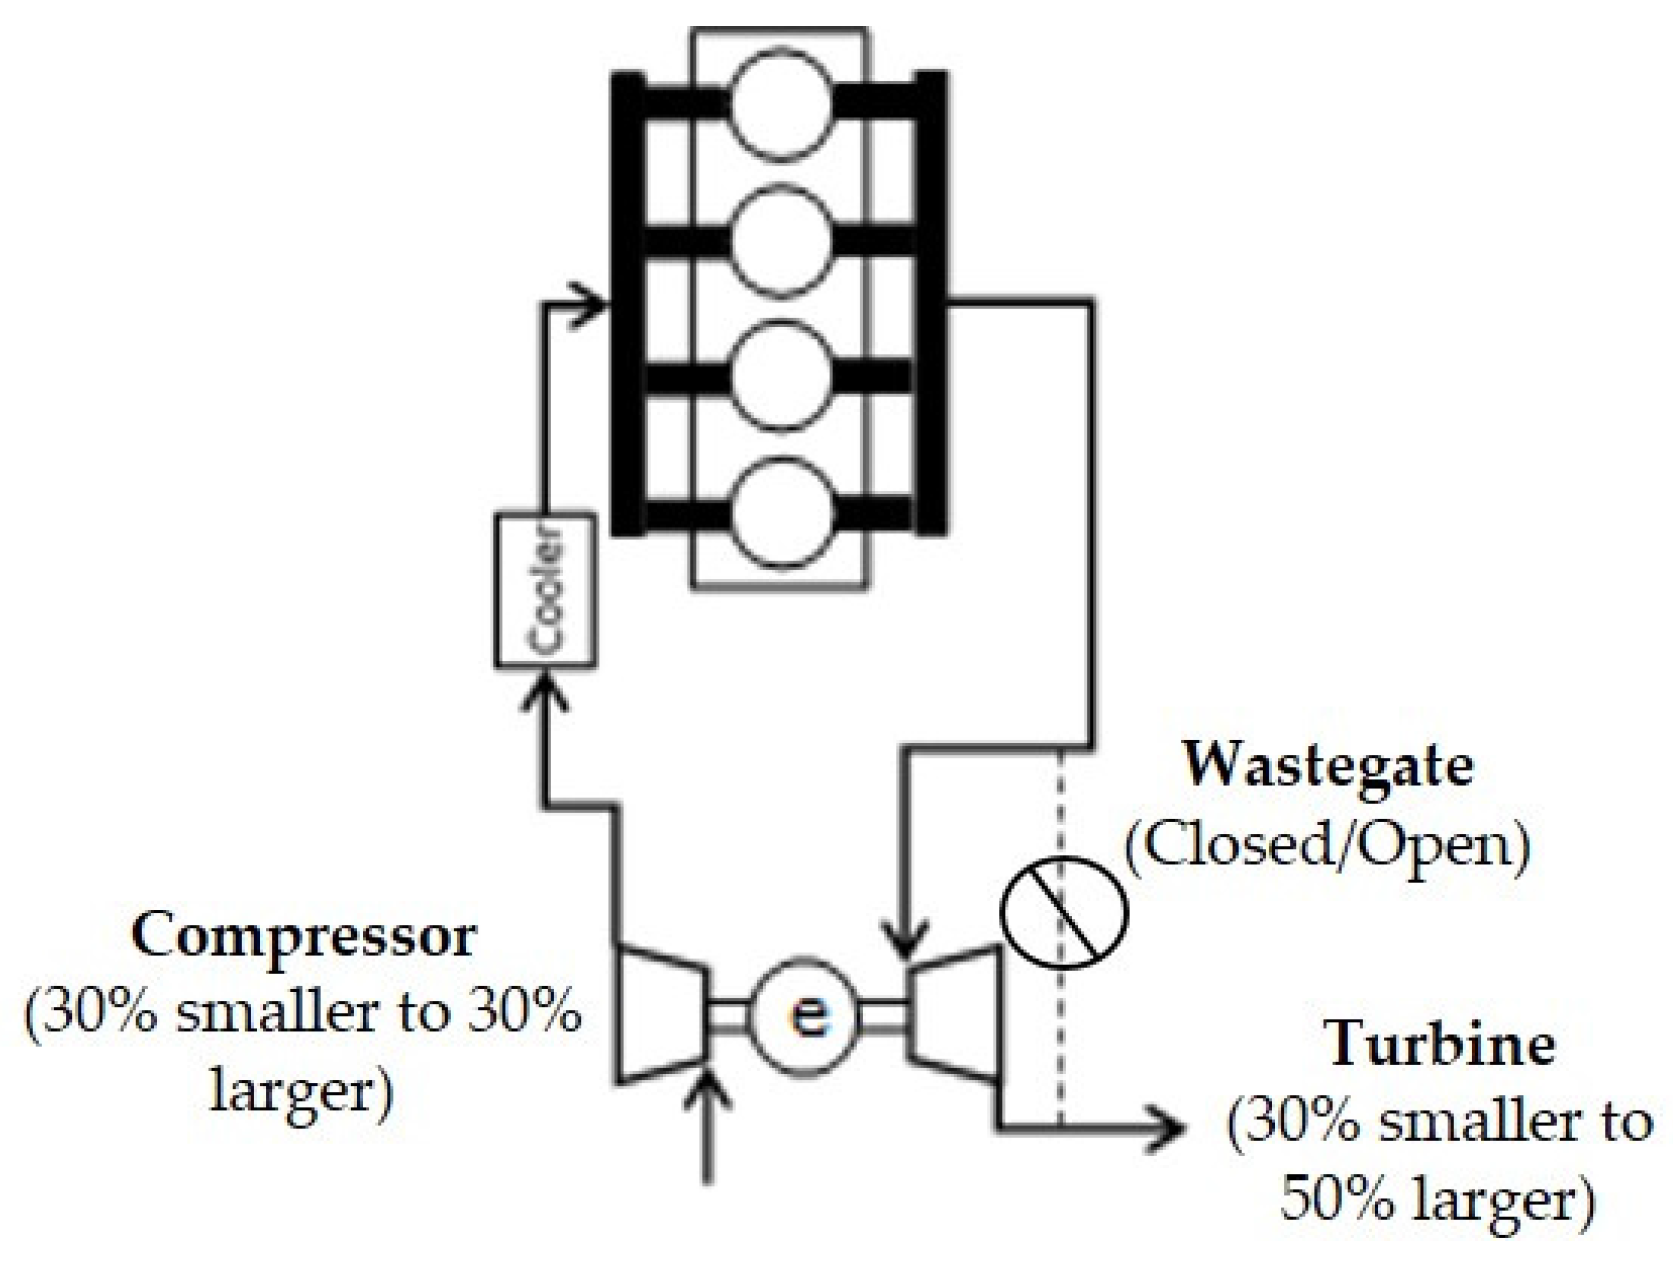
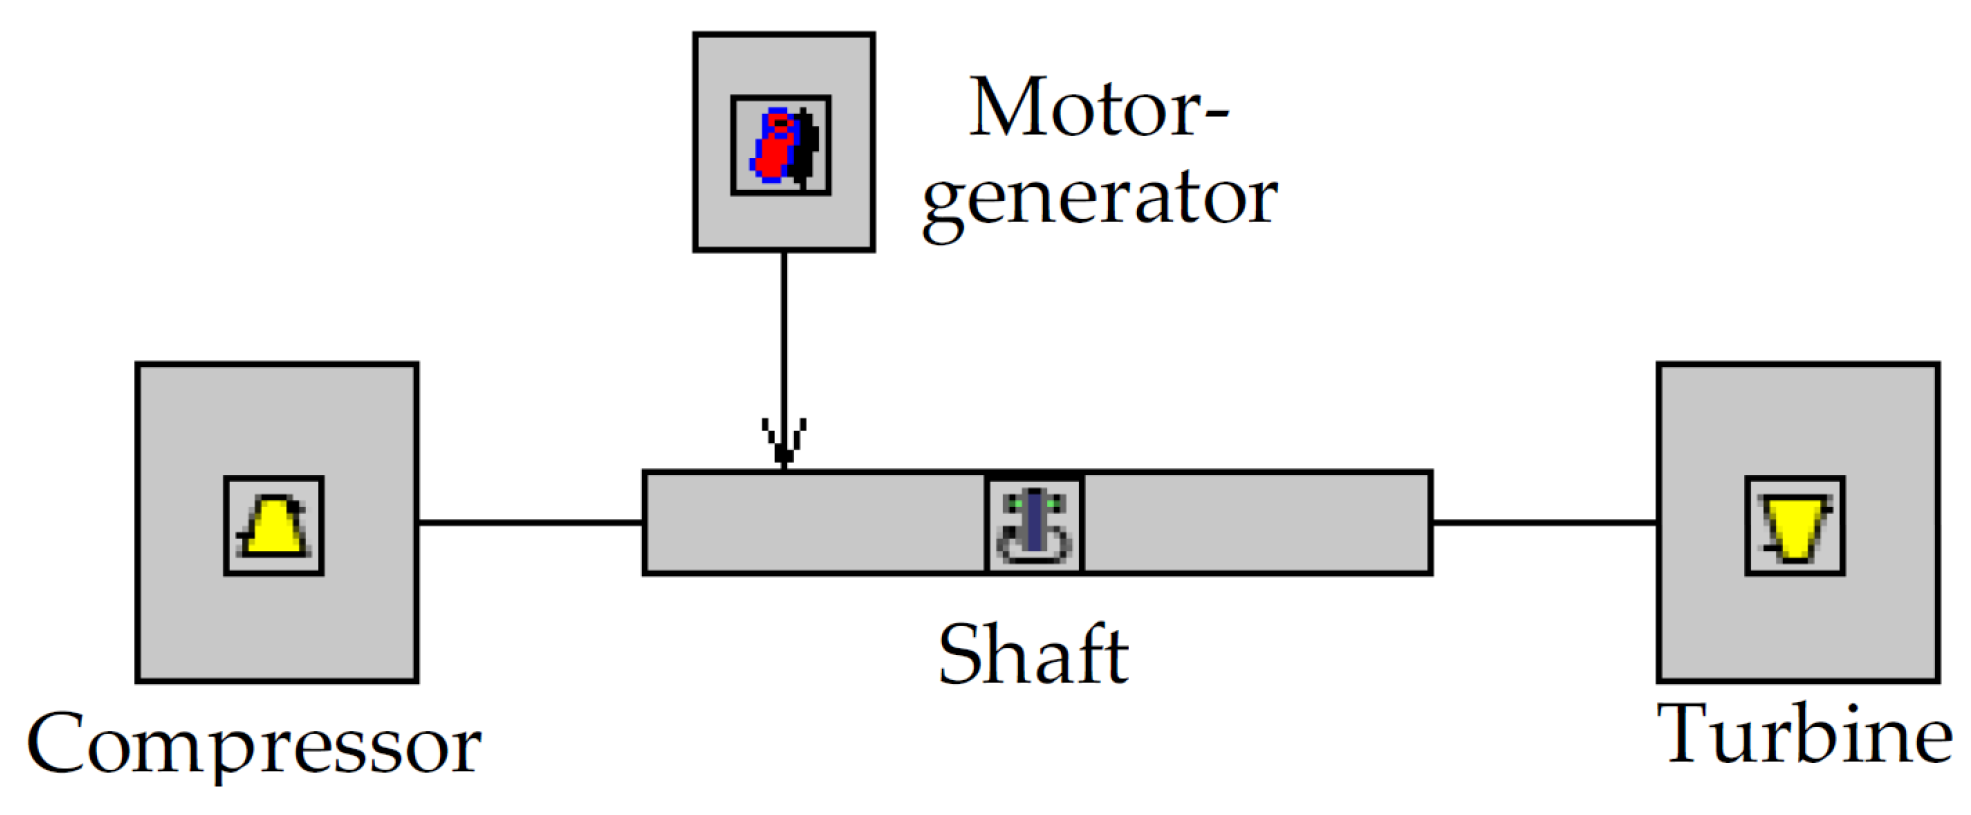
Figure 3.
Motor/generator component model used for converting the model to an e-turbo engine.
Figure 3.
Motor/generator component model used for converting the model to an e-turbo engine.
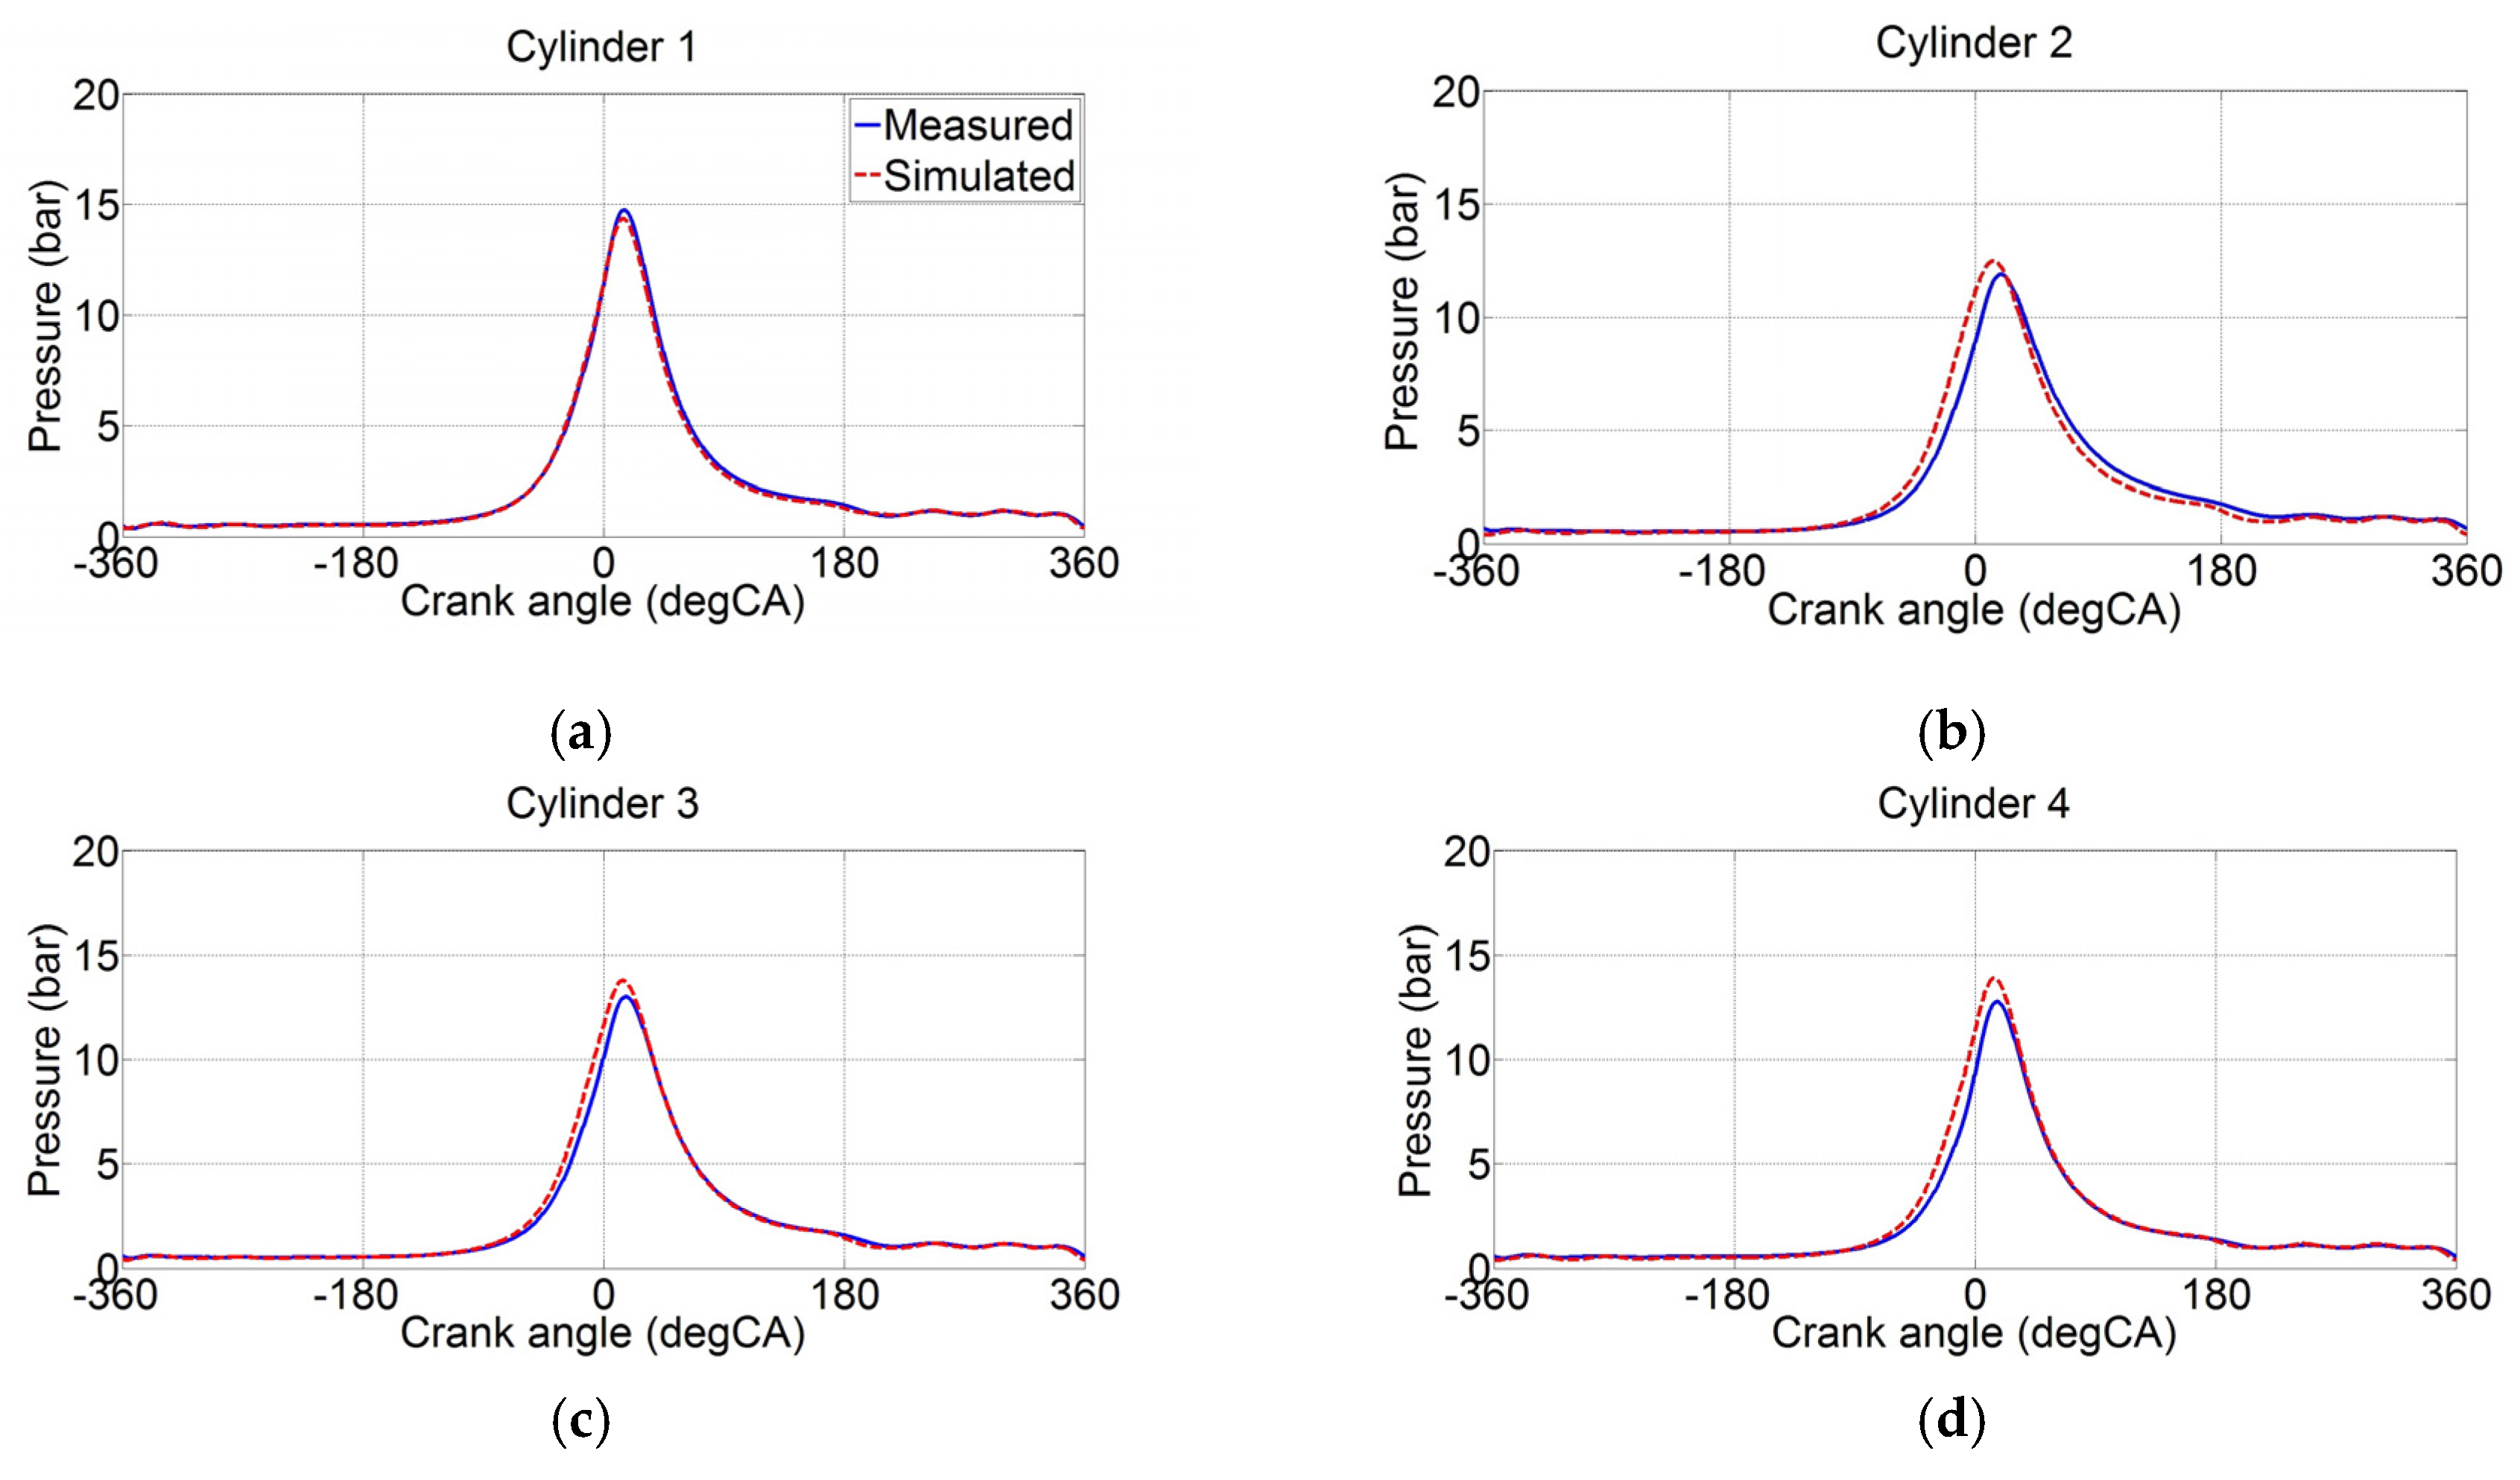
Figure 4.
Simulated cylinder pressure from Three Pressure Analysis (TPA) and measured pressure at low loads. (a) Cylinder 1; (b) Cylinder 2; (c) Cylinder 3; (d) Cylinder 4.
Figure 4.
Simulated cylinder pressure from Three Pressure Analysis (TPA) and measured pressure at low loads. (a) Cylinder 1; (b) Cylinder 2; (c) Cylinder 3; (d) Cylinder 4.
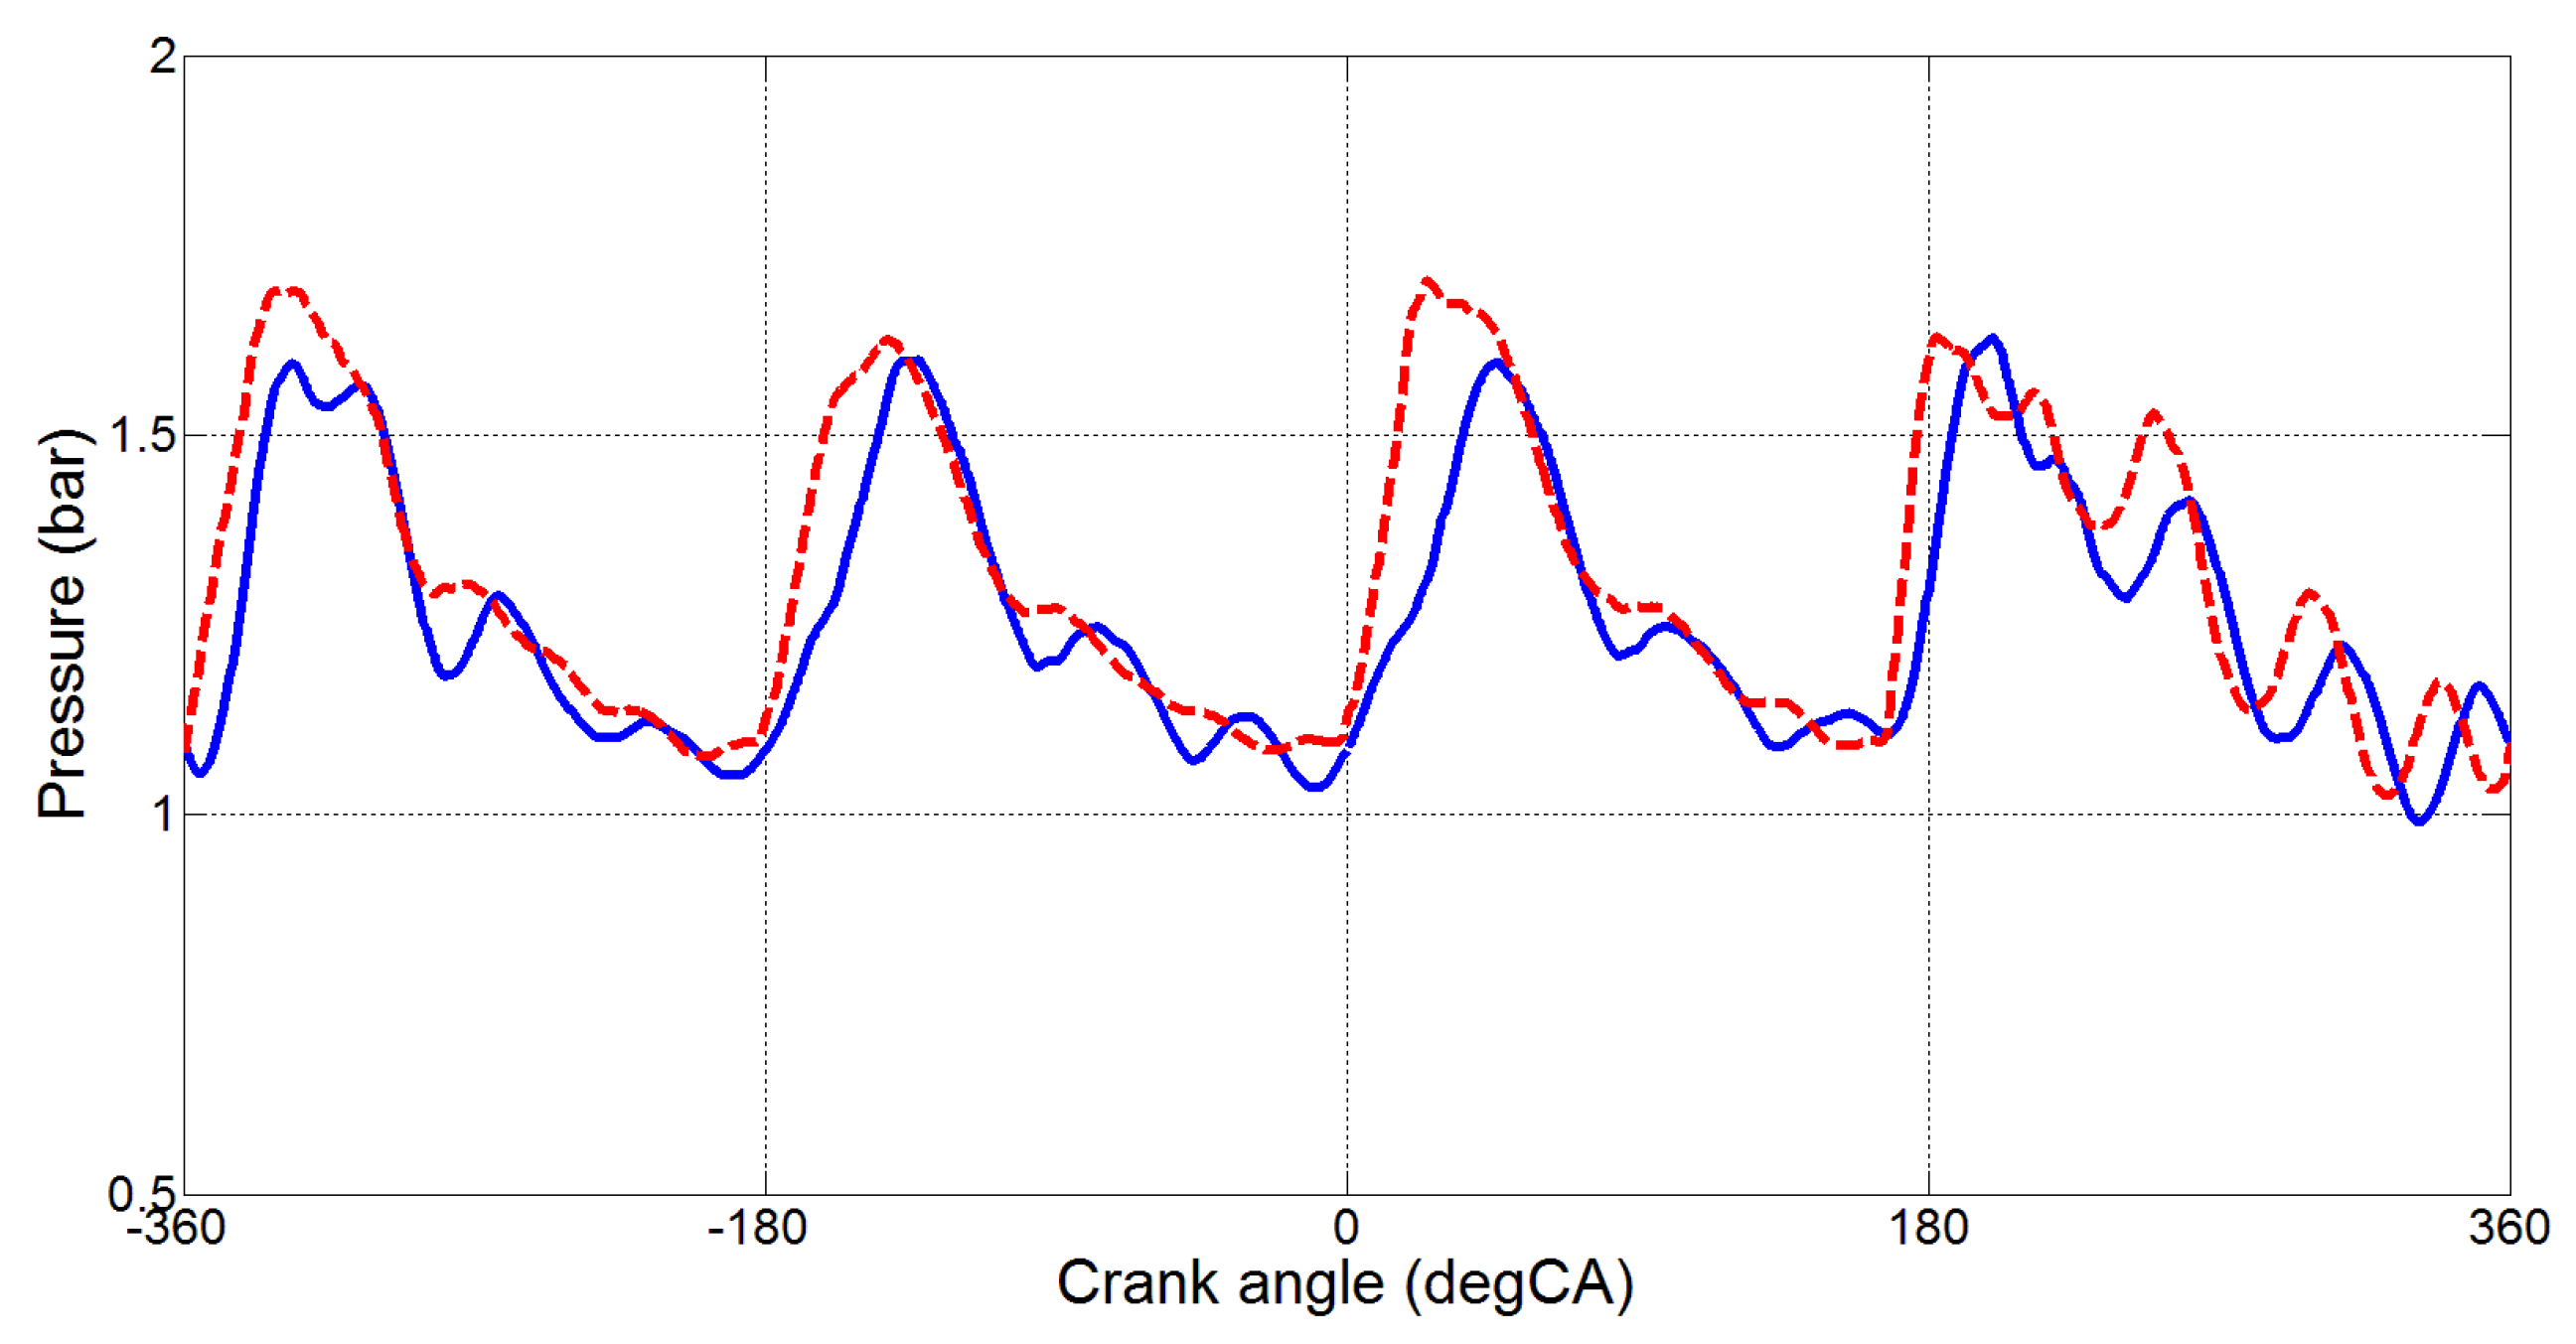
Figure 5.
Instantaneous pressure at exhaust port of Cylinder 1, 2000 rpm medium-load.
Figure 5.
Instantaneous pressure at exhaust port of Cylinder 1, 2000 rpm medium-load.
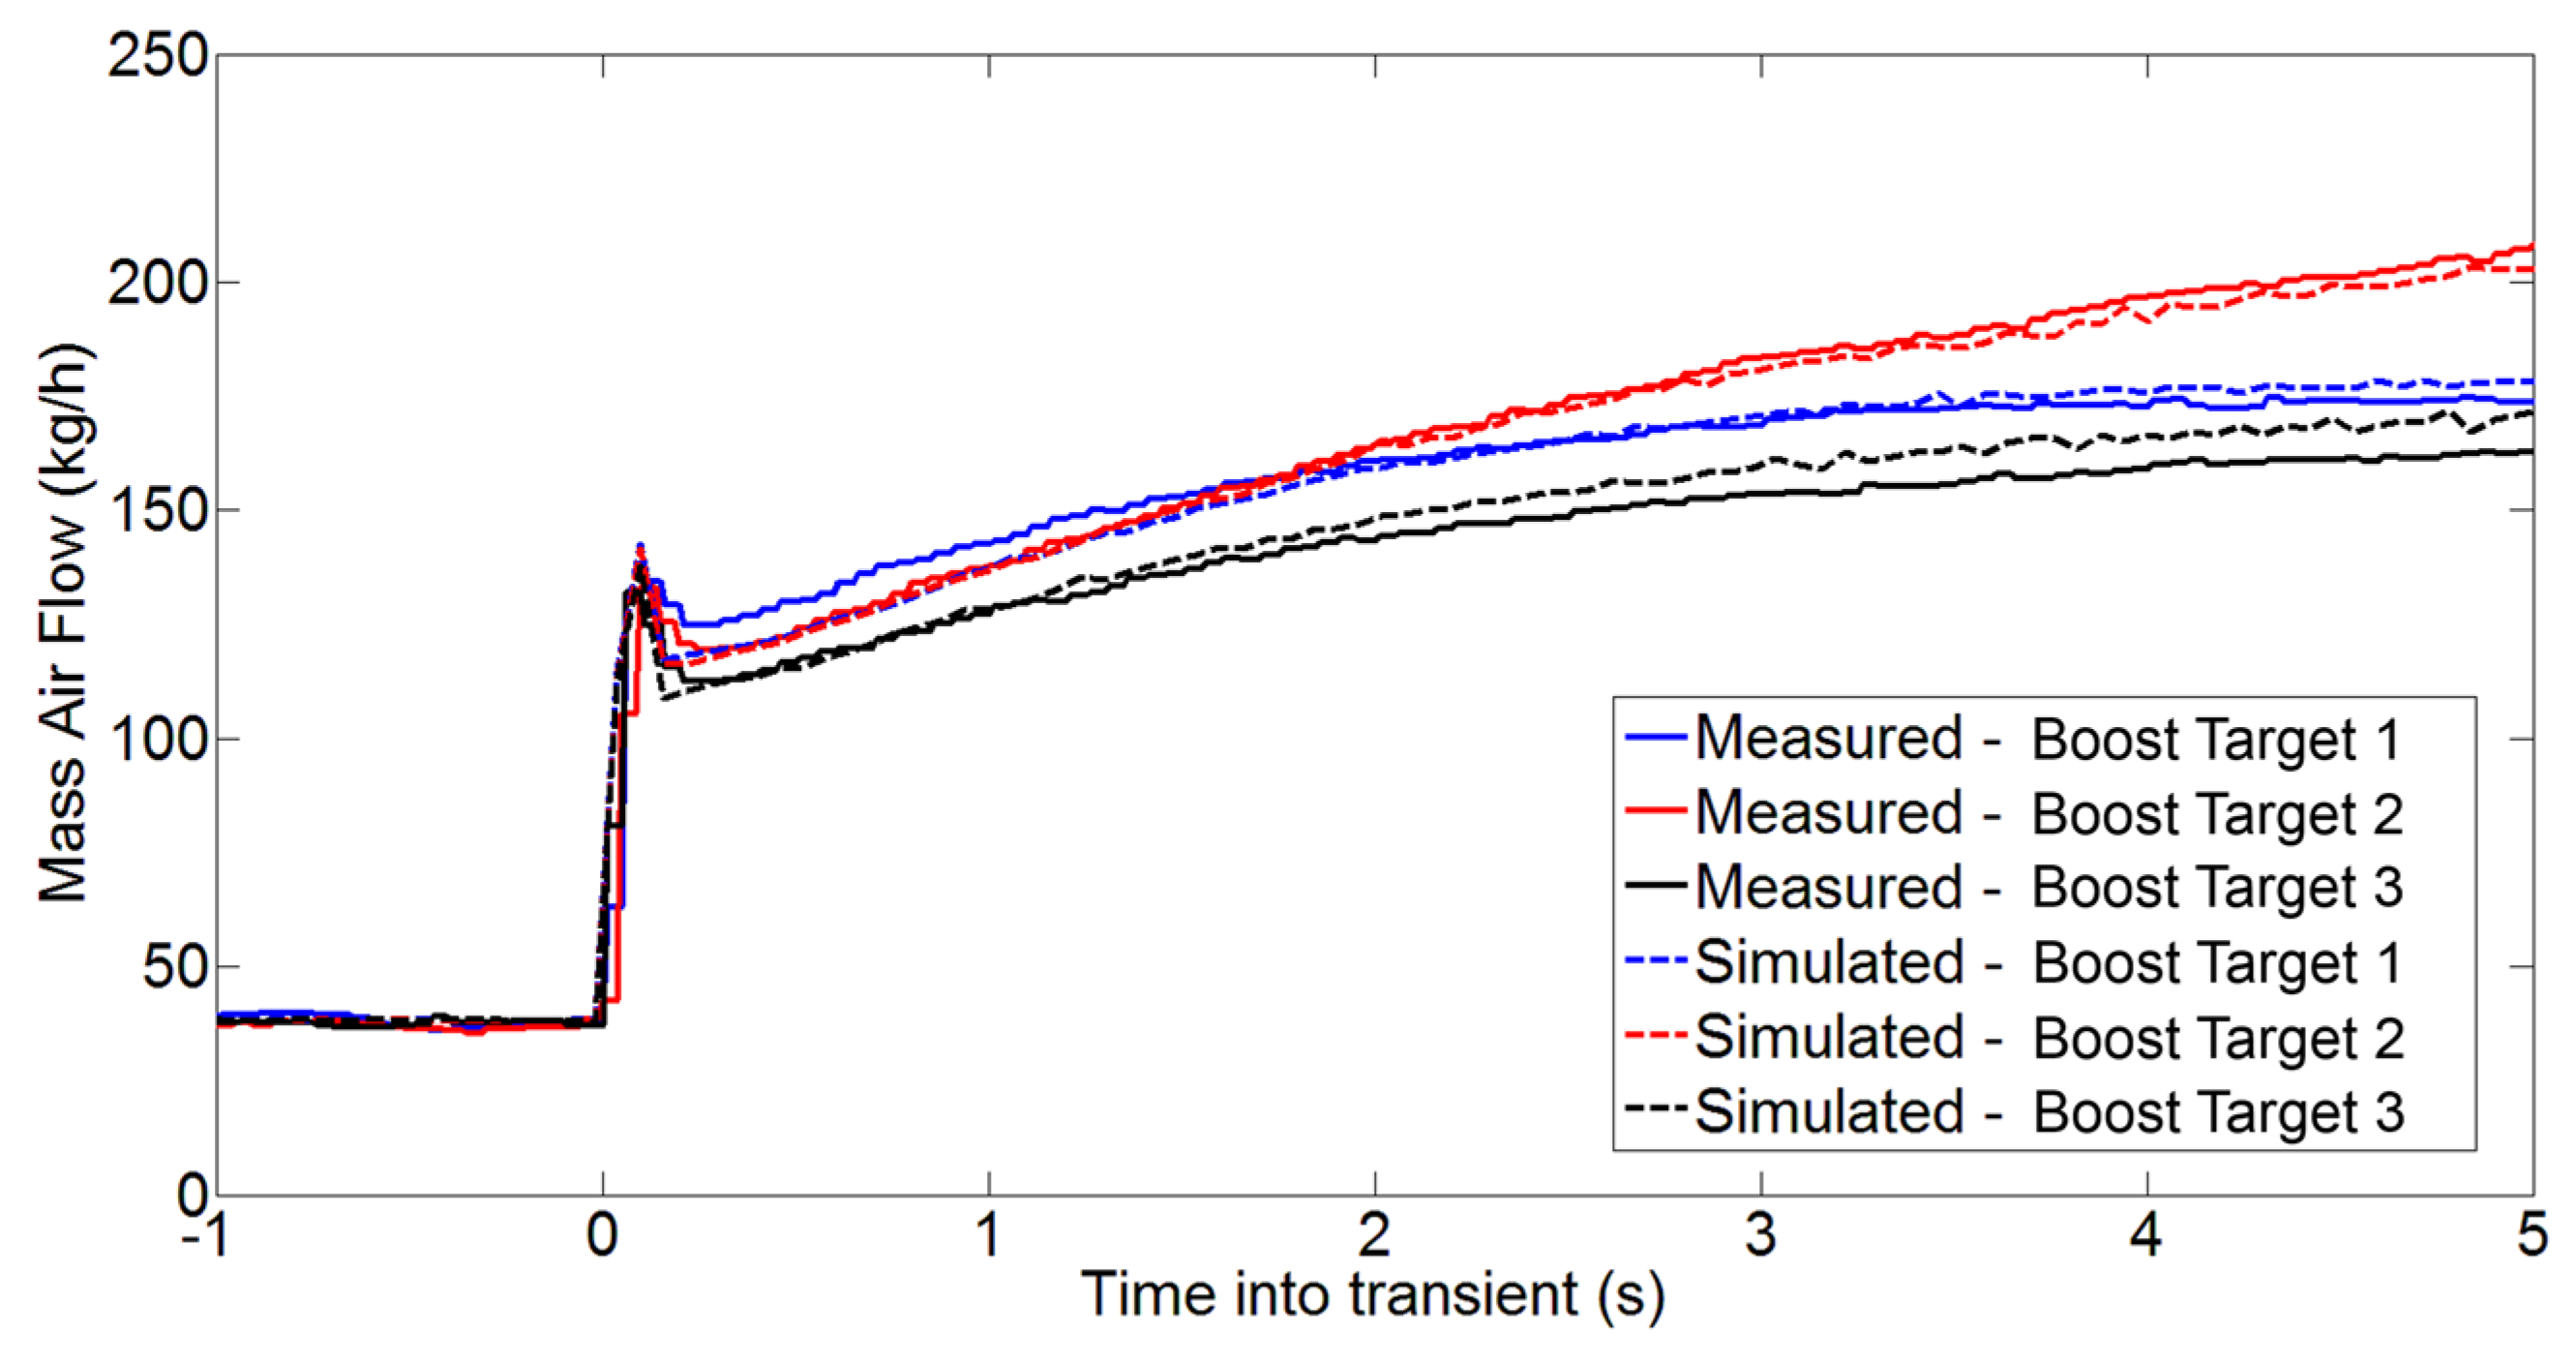
Figure 6.
Comparison between measurement and simulation results of transient performance for different boost targets with imposed turbocharger rotational speed.
Figure 6.
Comparison between measurement and simulation results of transient performance for different boost targets with imposed turbocharger rotational speed.
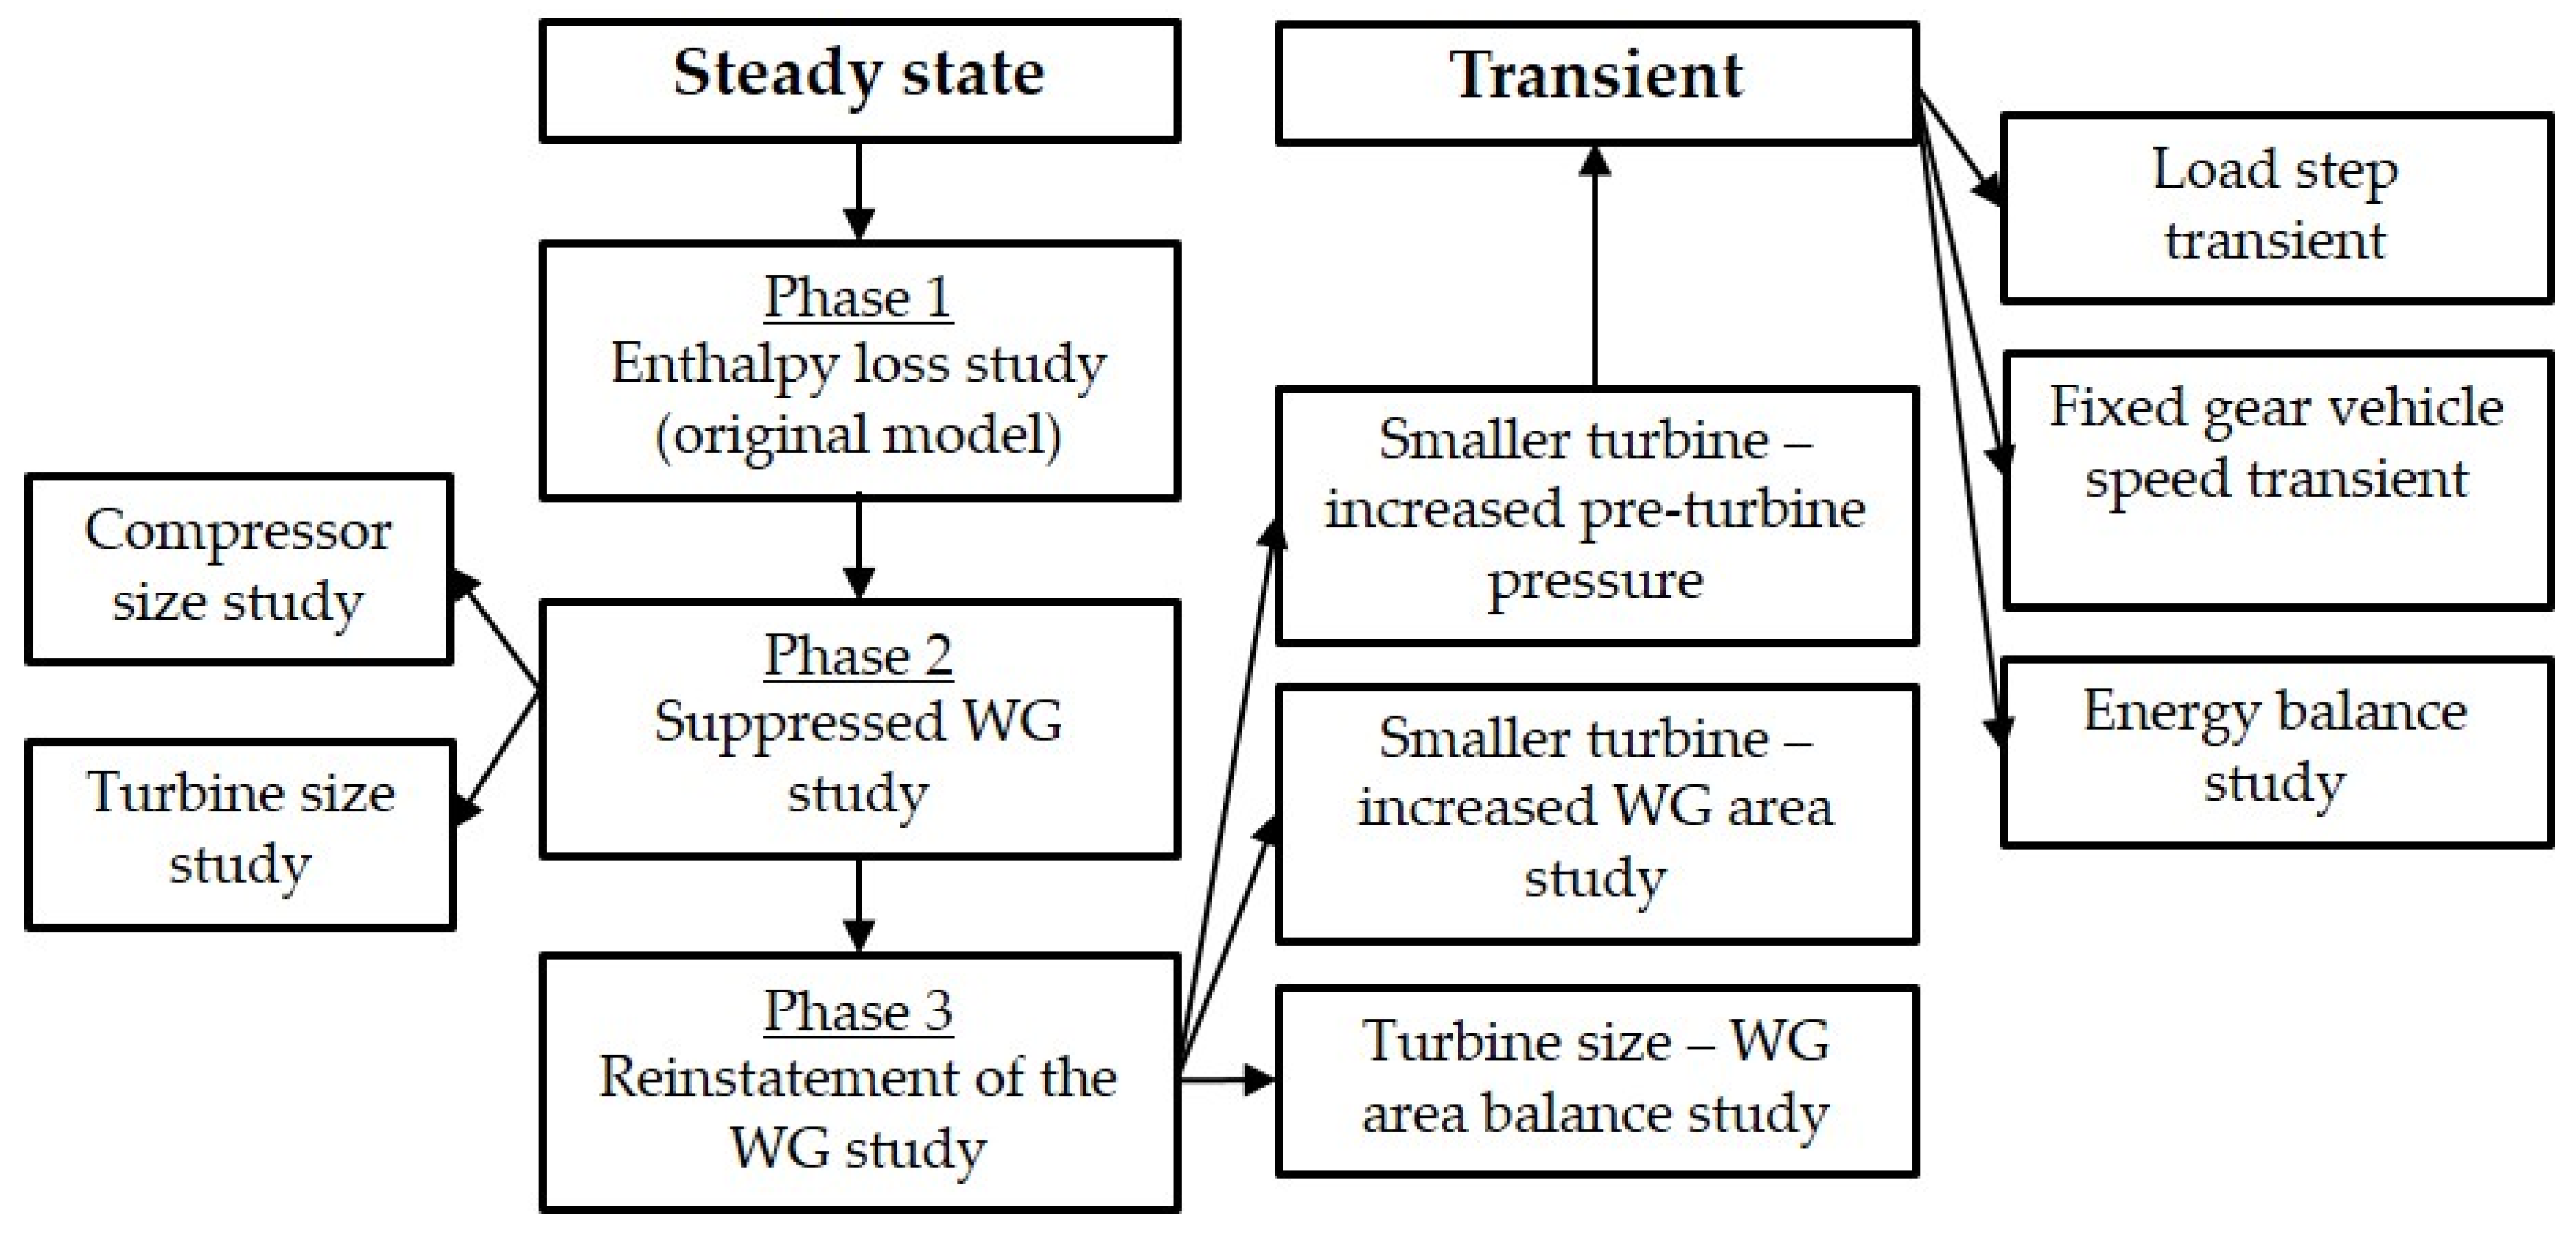
Figure 7.
Flowchart of the simulation process. WG, wastegate.
Figure 7.
Flowchart of the simulation process. WG, wastegate.
Figure 8.
Area of investigation for the steady-state simulations.
Figure 8.
Area of investigation for the steady-state simulations.
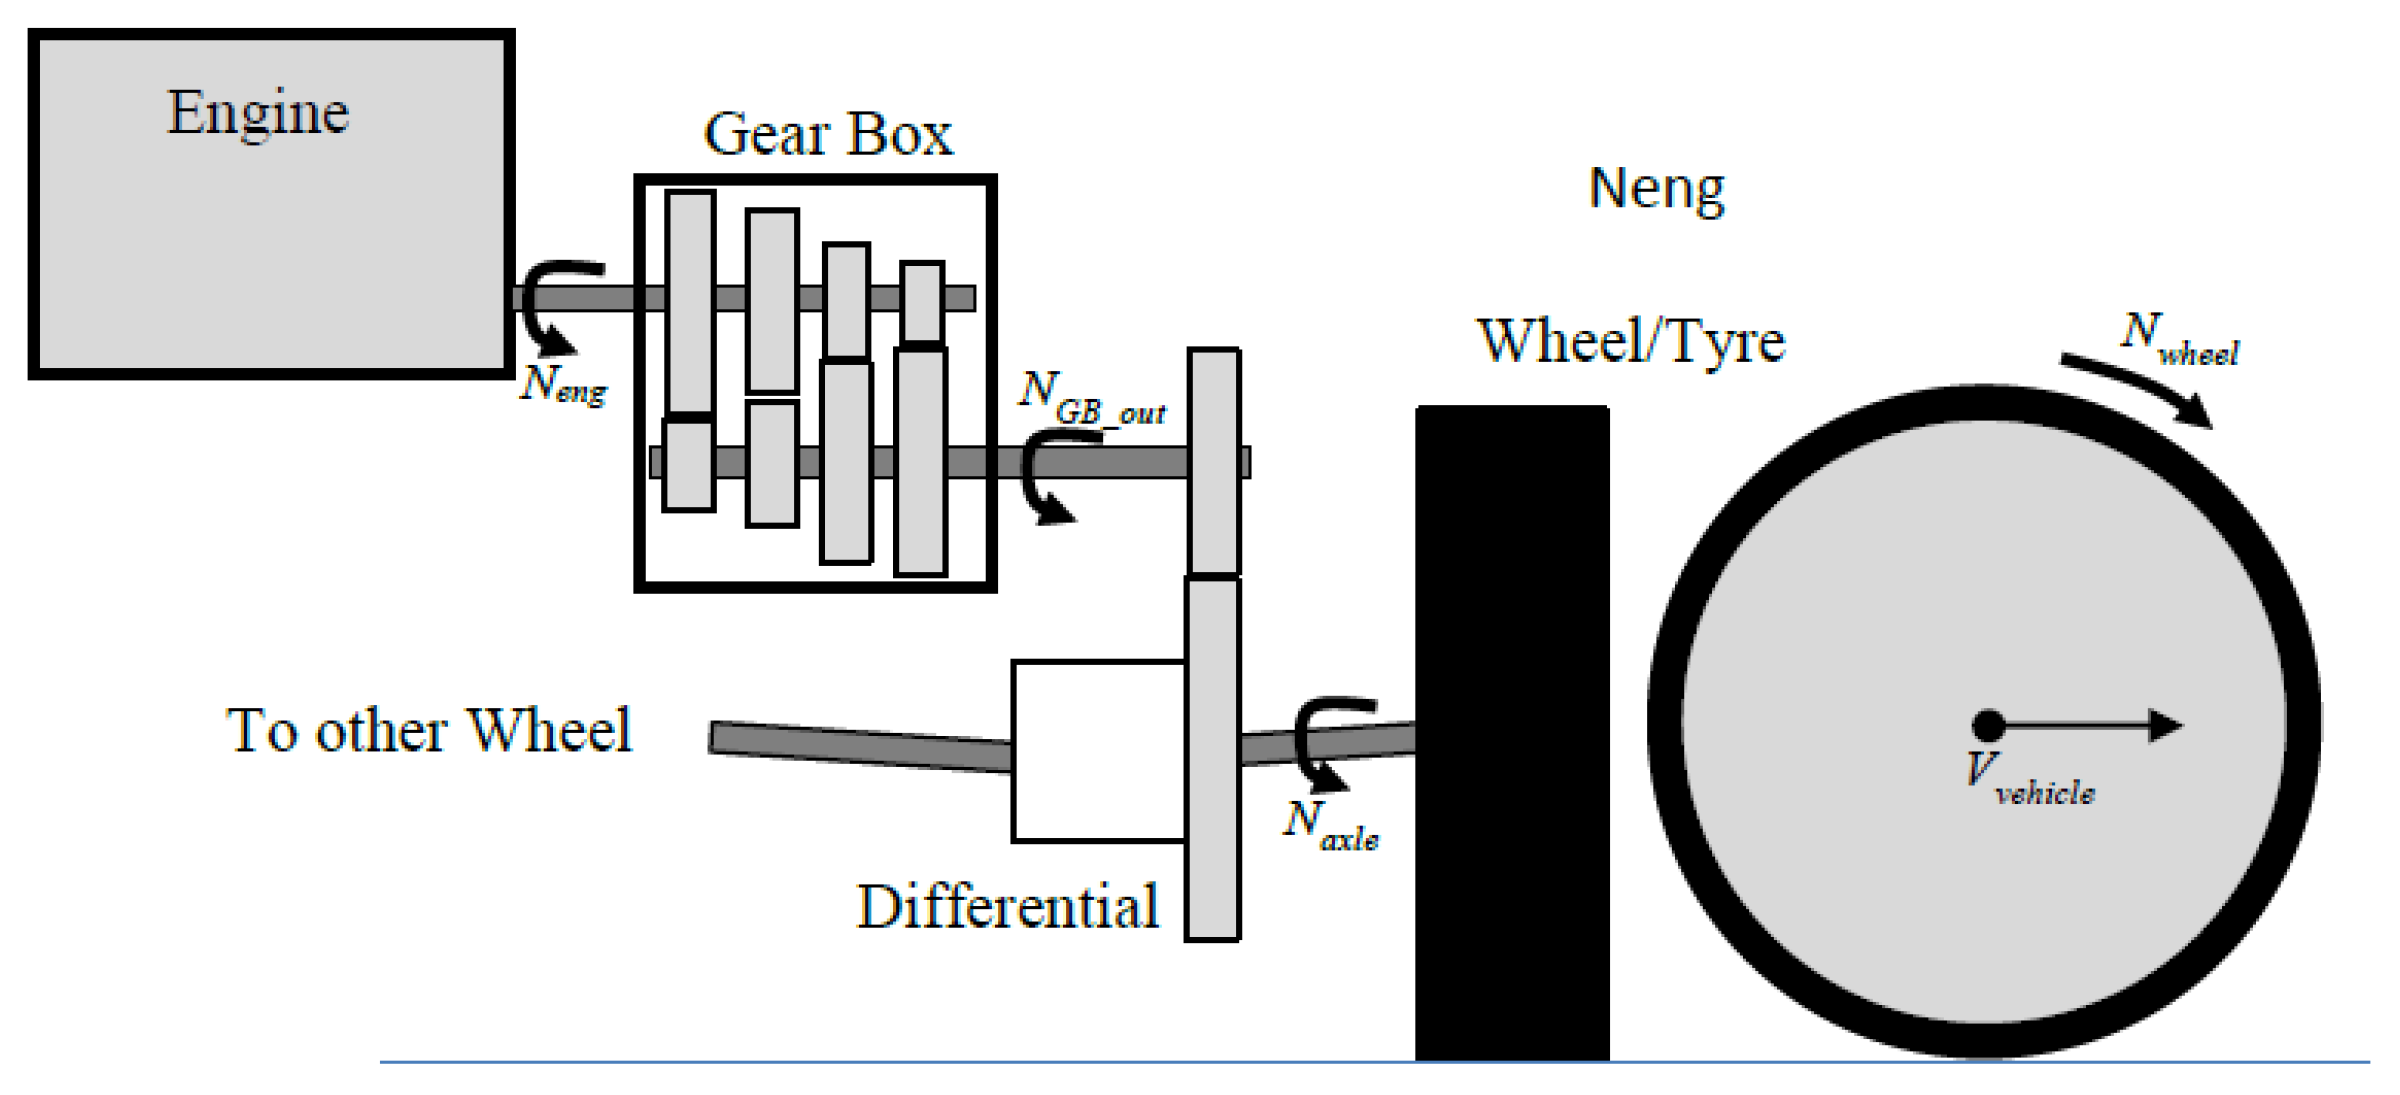
Figure 9.
Schematic of total inertia applied to the engine.
Figure 9.
Schematic of total inertia applied to the engine.
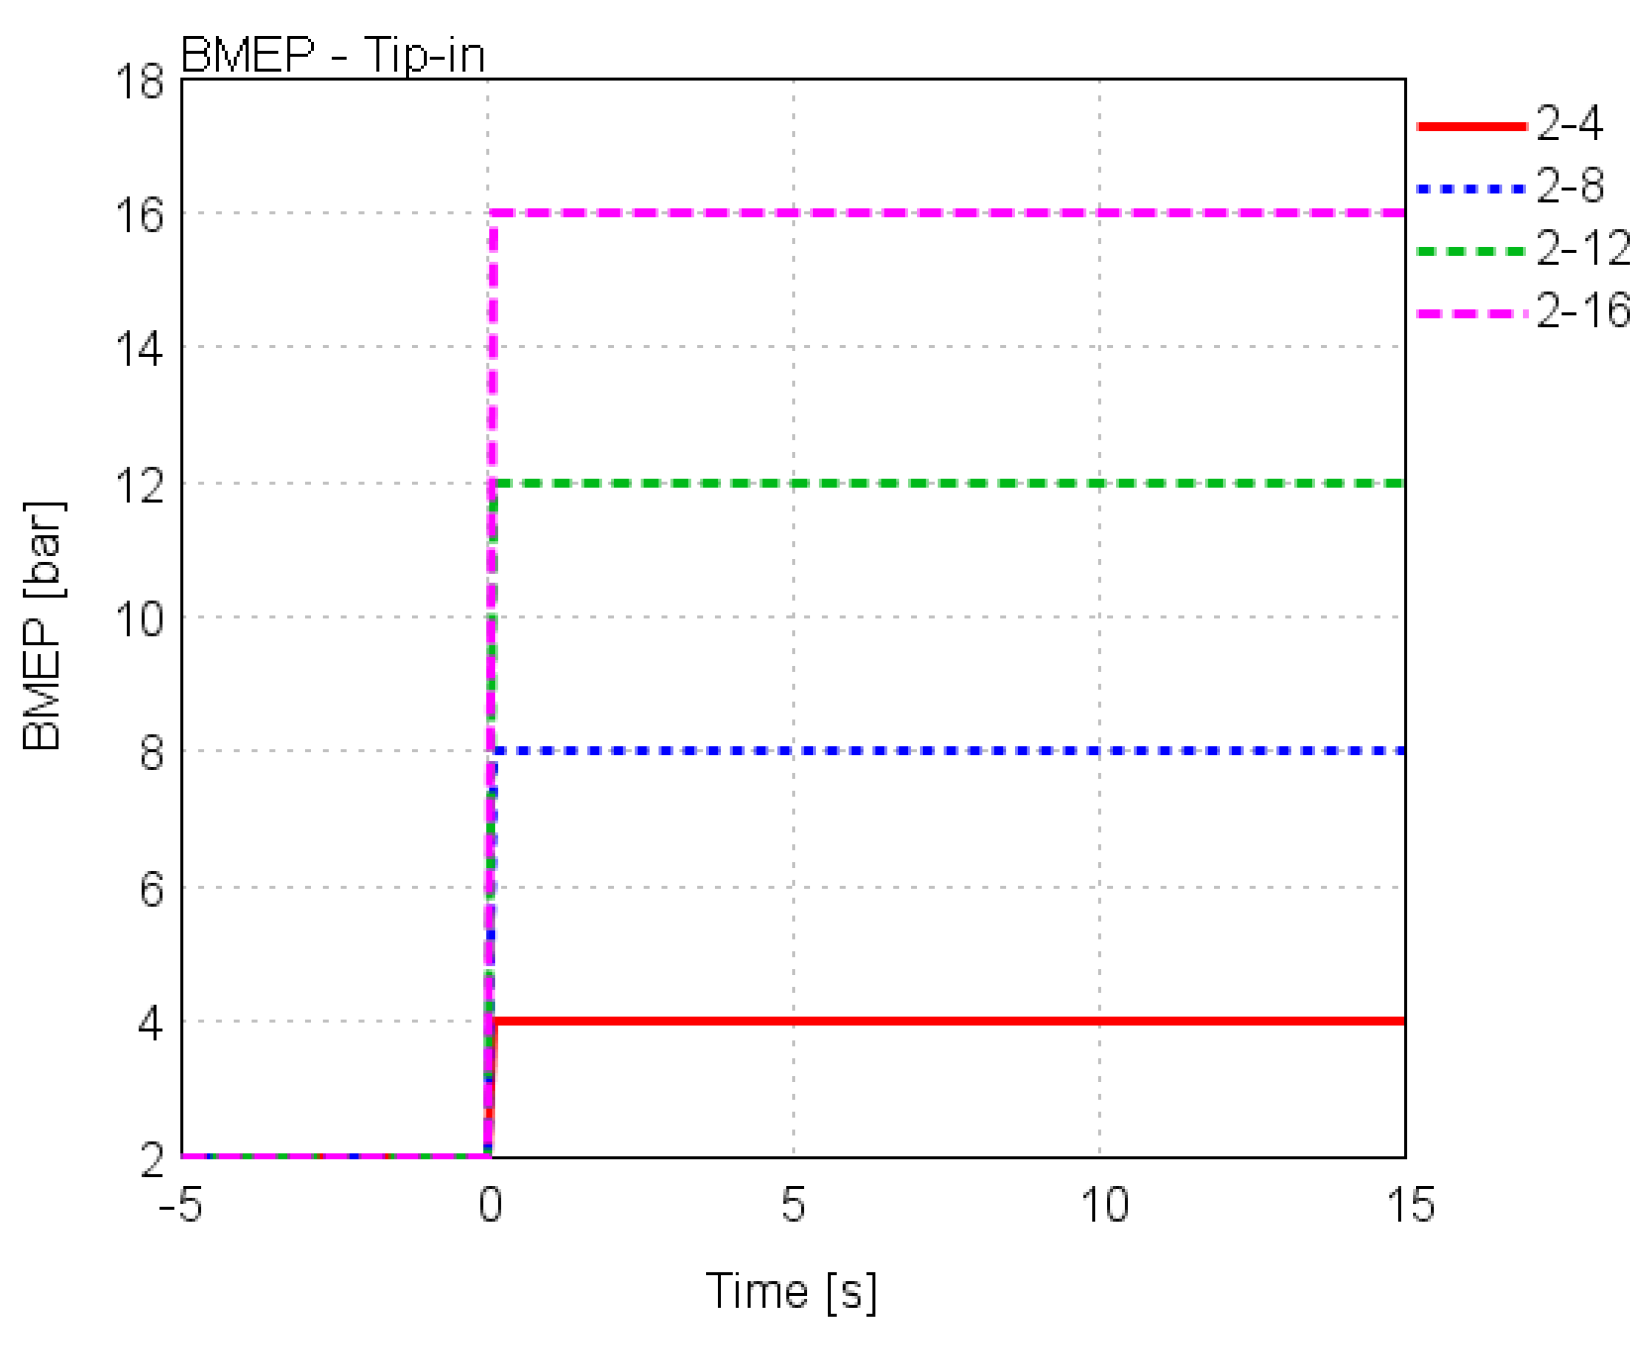
Figure 10.
Fixed gear vehicle speed BMEP tip-ins.
Figure 10.
Fixed gear vehicle speed BMEP tip-ins.
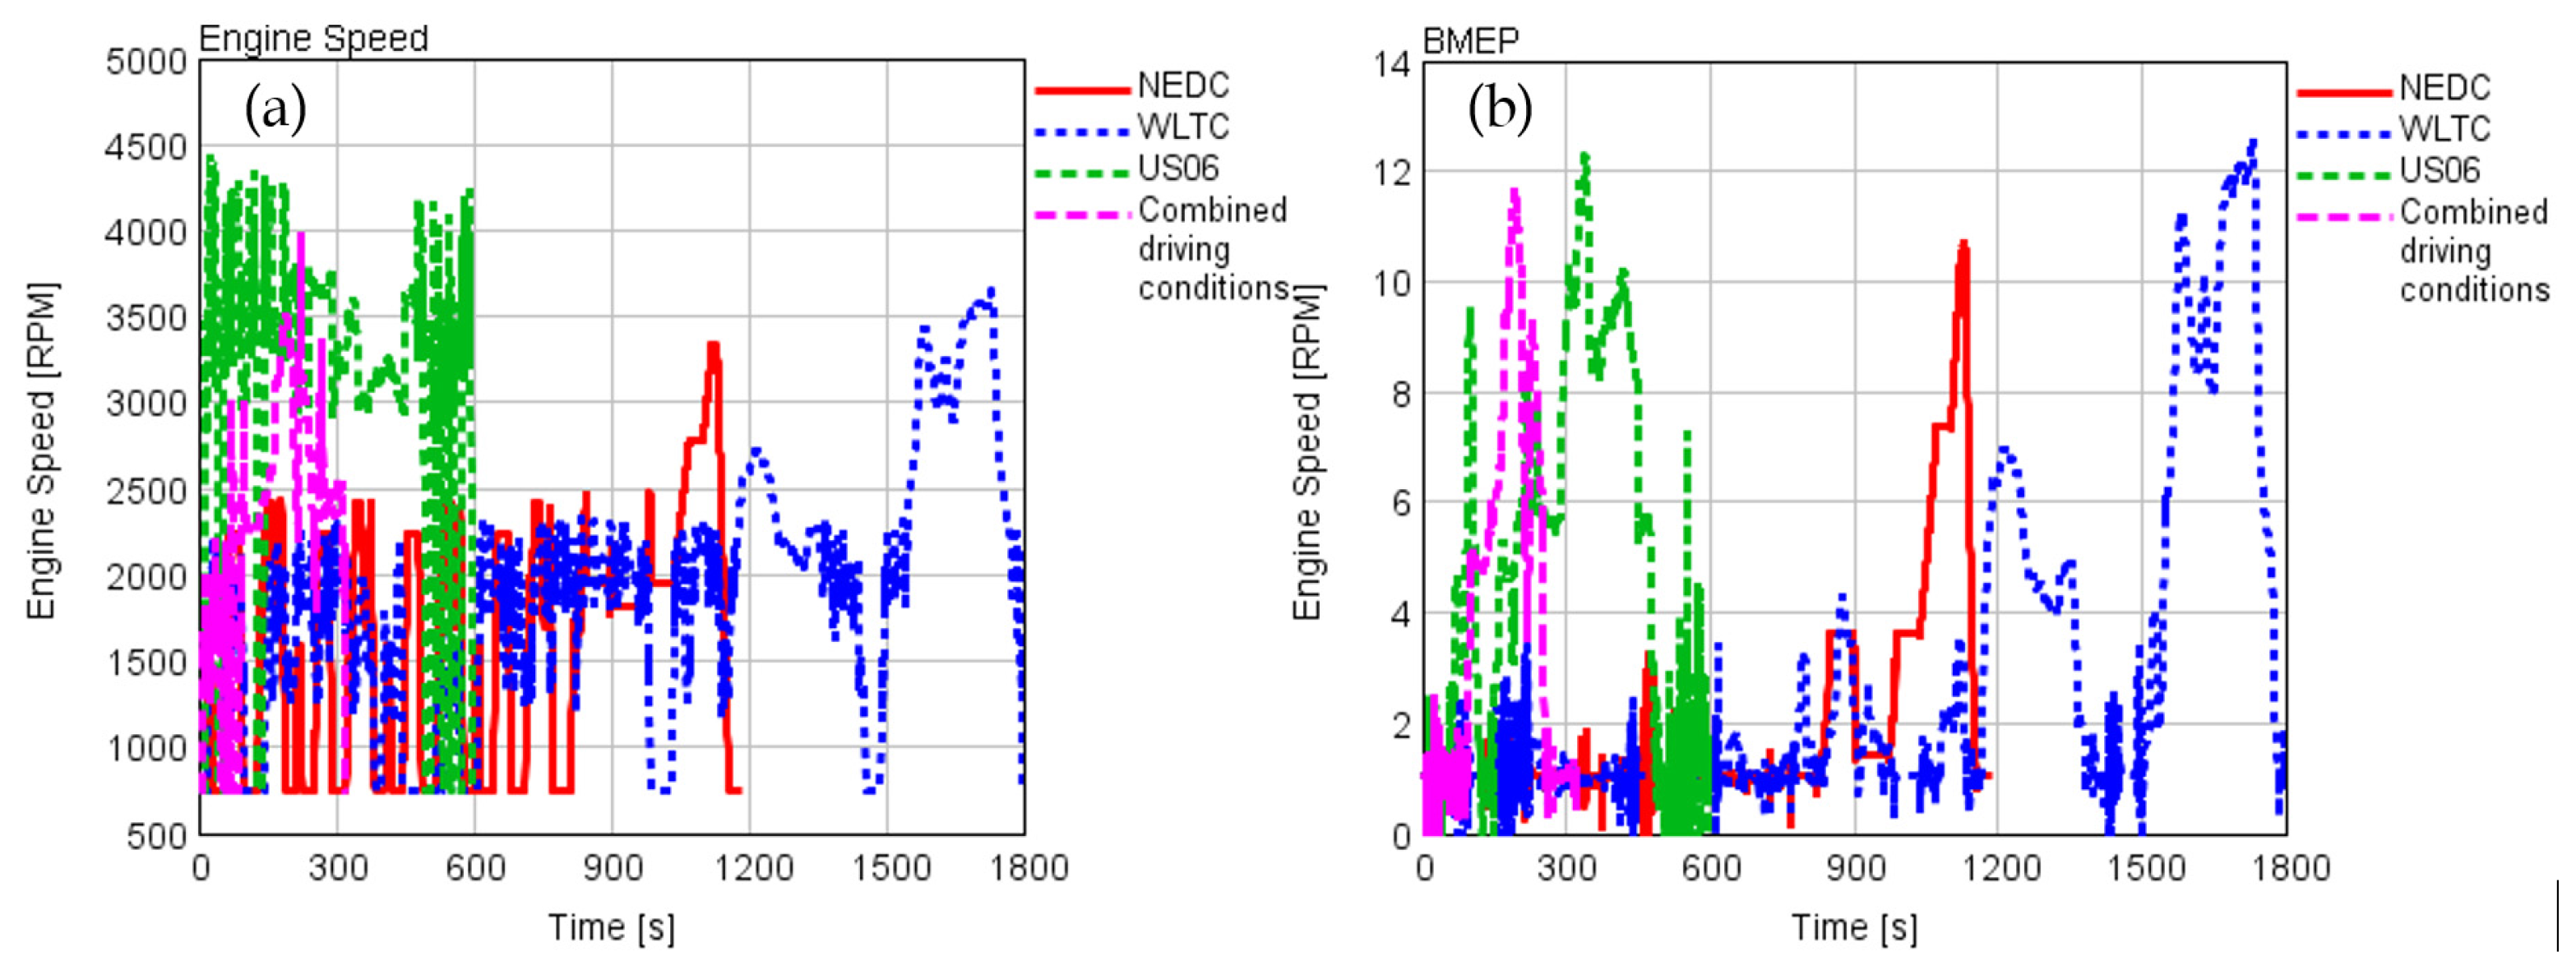
Figure 11.
Driving cycles conditions: (a) engine speed; (b) engine BMEP. NEDC, New European Driving Cycle; WLTC, Worldwide harmonized Light vehicles Test Cycle.
Figure 11.
Driving cycles conditions: (a) engine speed; (b) engine BMEP. NEDC, New European Driving Cycle; WLTC, Worldwide harmonized Light vehicles Test Cycle.
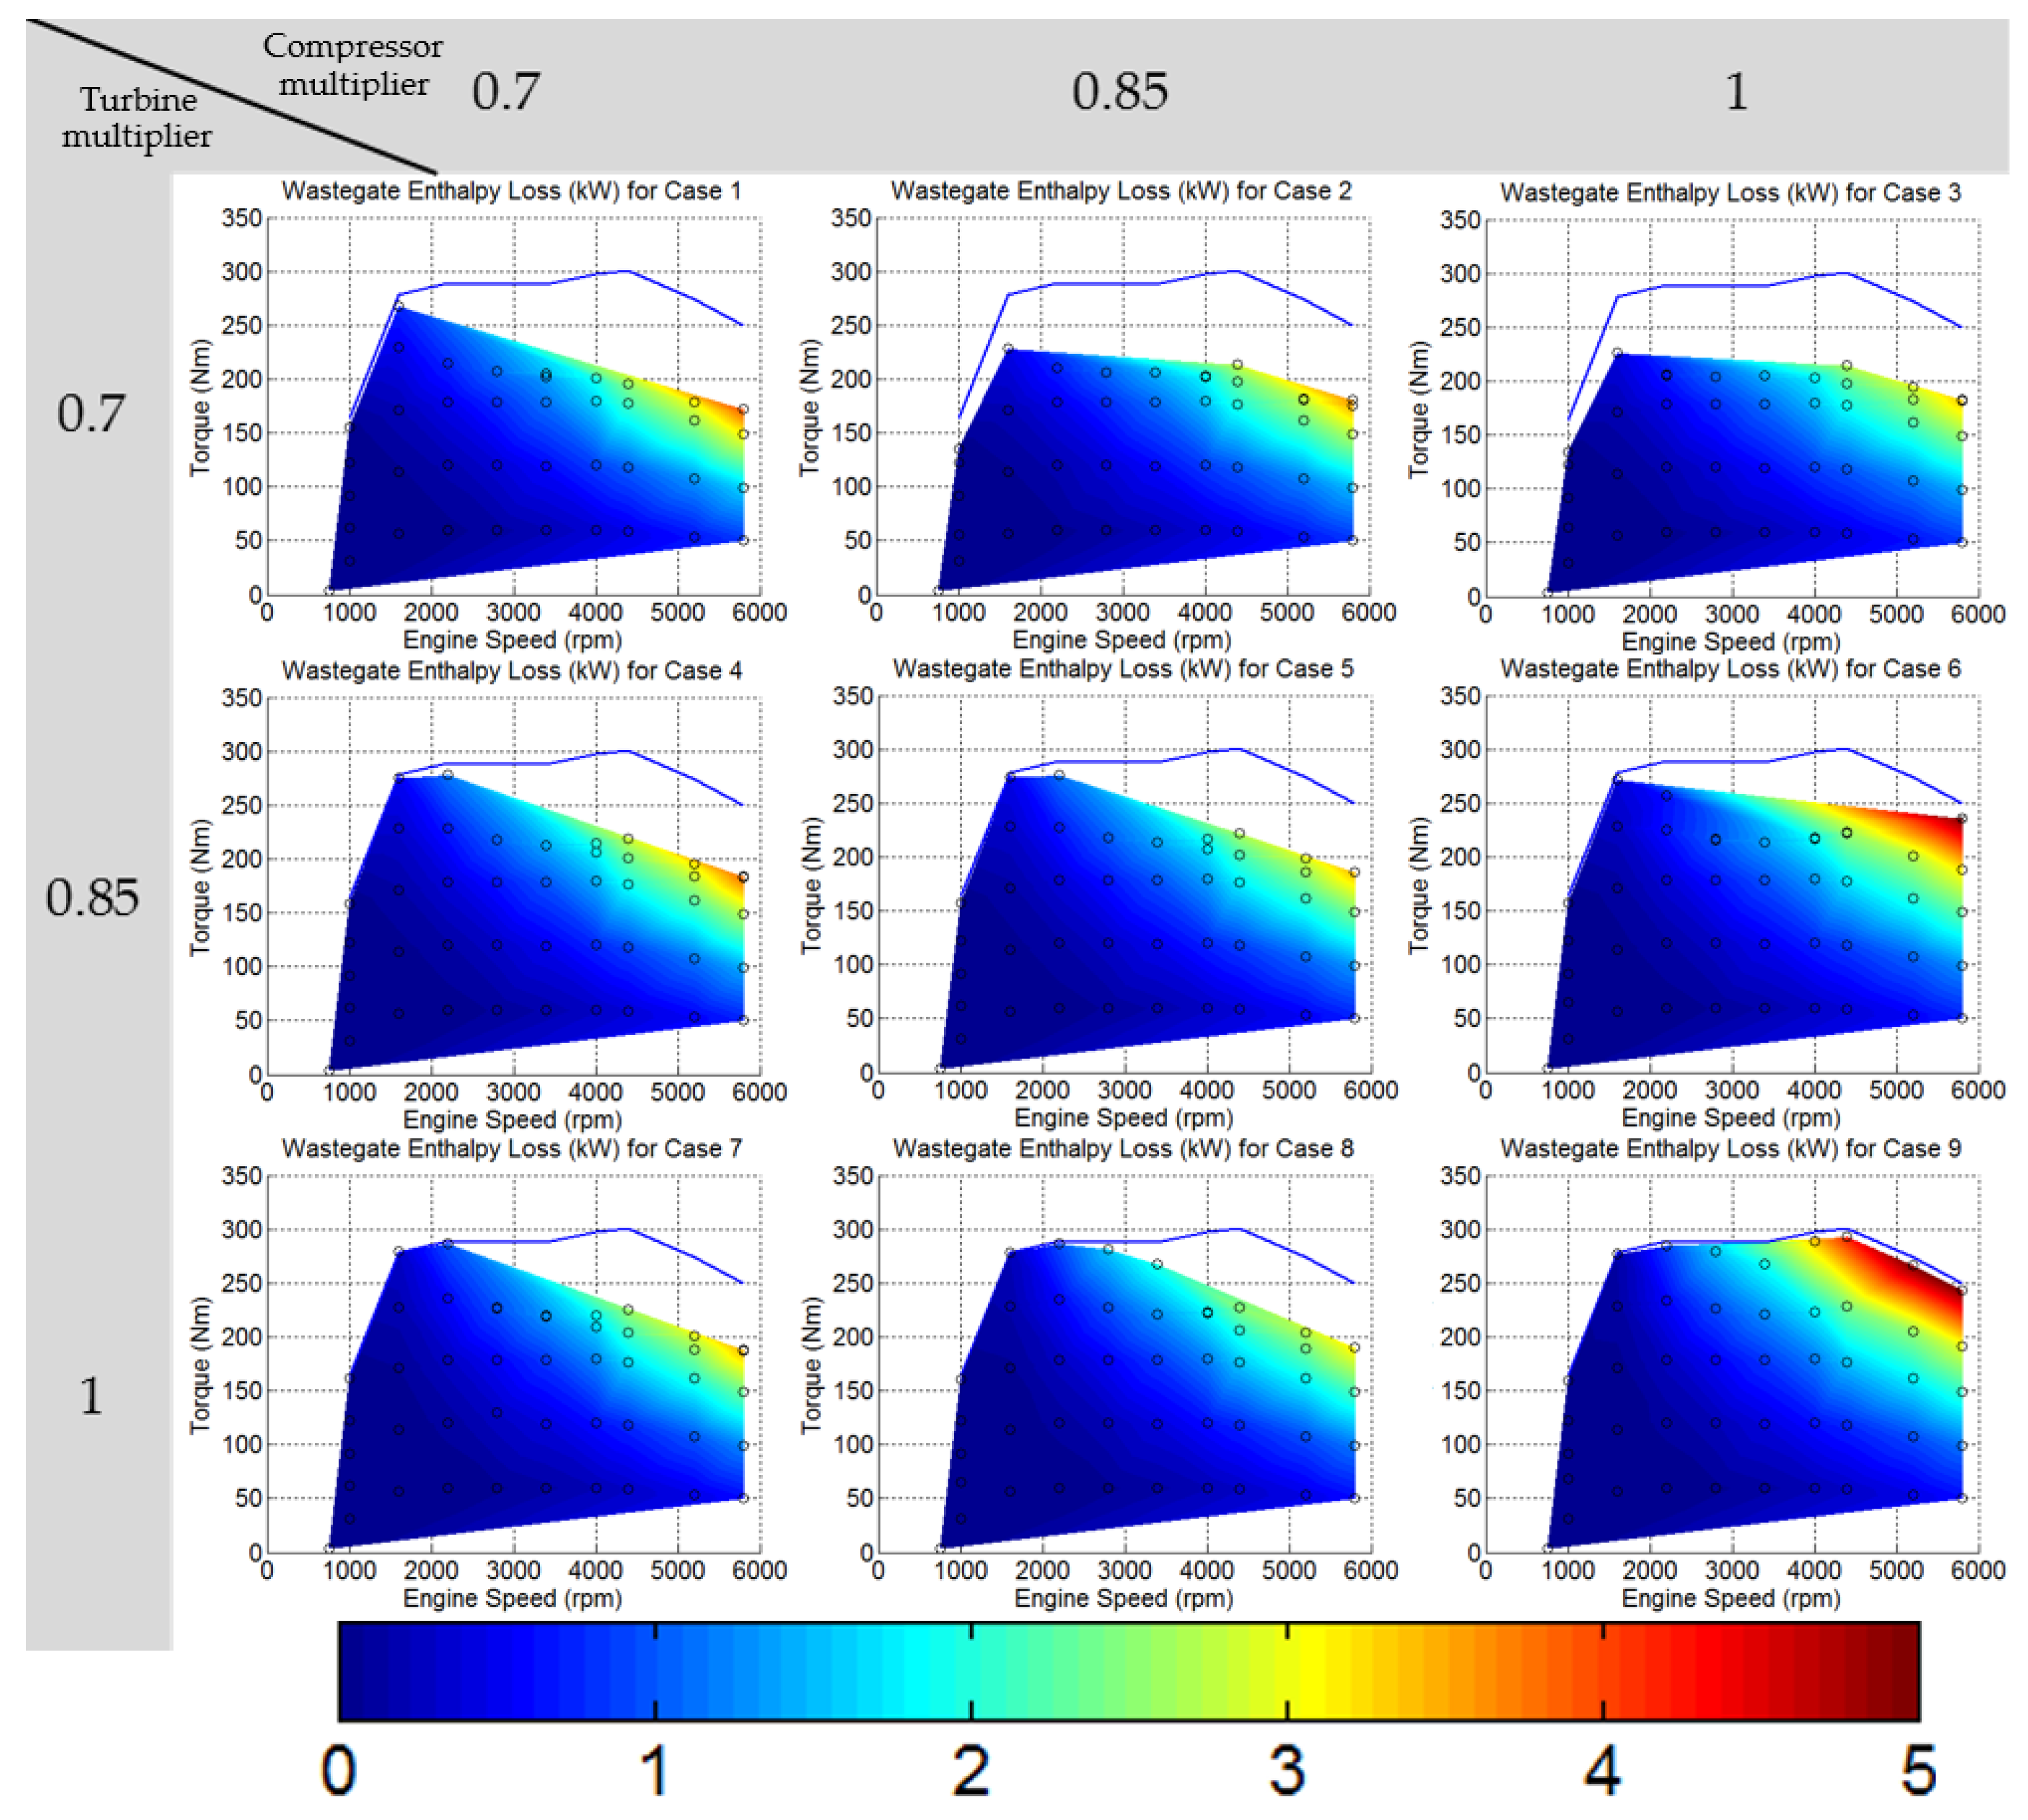
Figure 12.
Phase 1: DoE analysis of the waste-gated enthalpy loss for the different compressor and turbine sizes; the blue line represents the maximum torque line of the baseline engine’s model as provided by the manufacturer (λ < 1); the ○ symbols indicate data points; the ⨂ symbol indicates a limit violation at specific points.
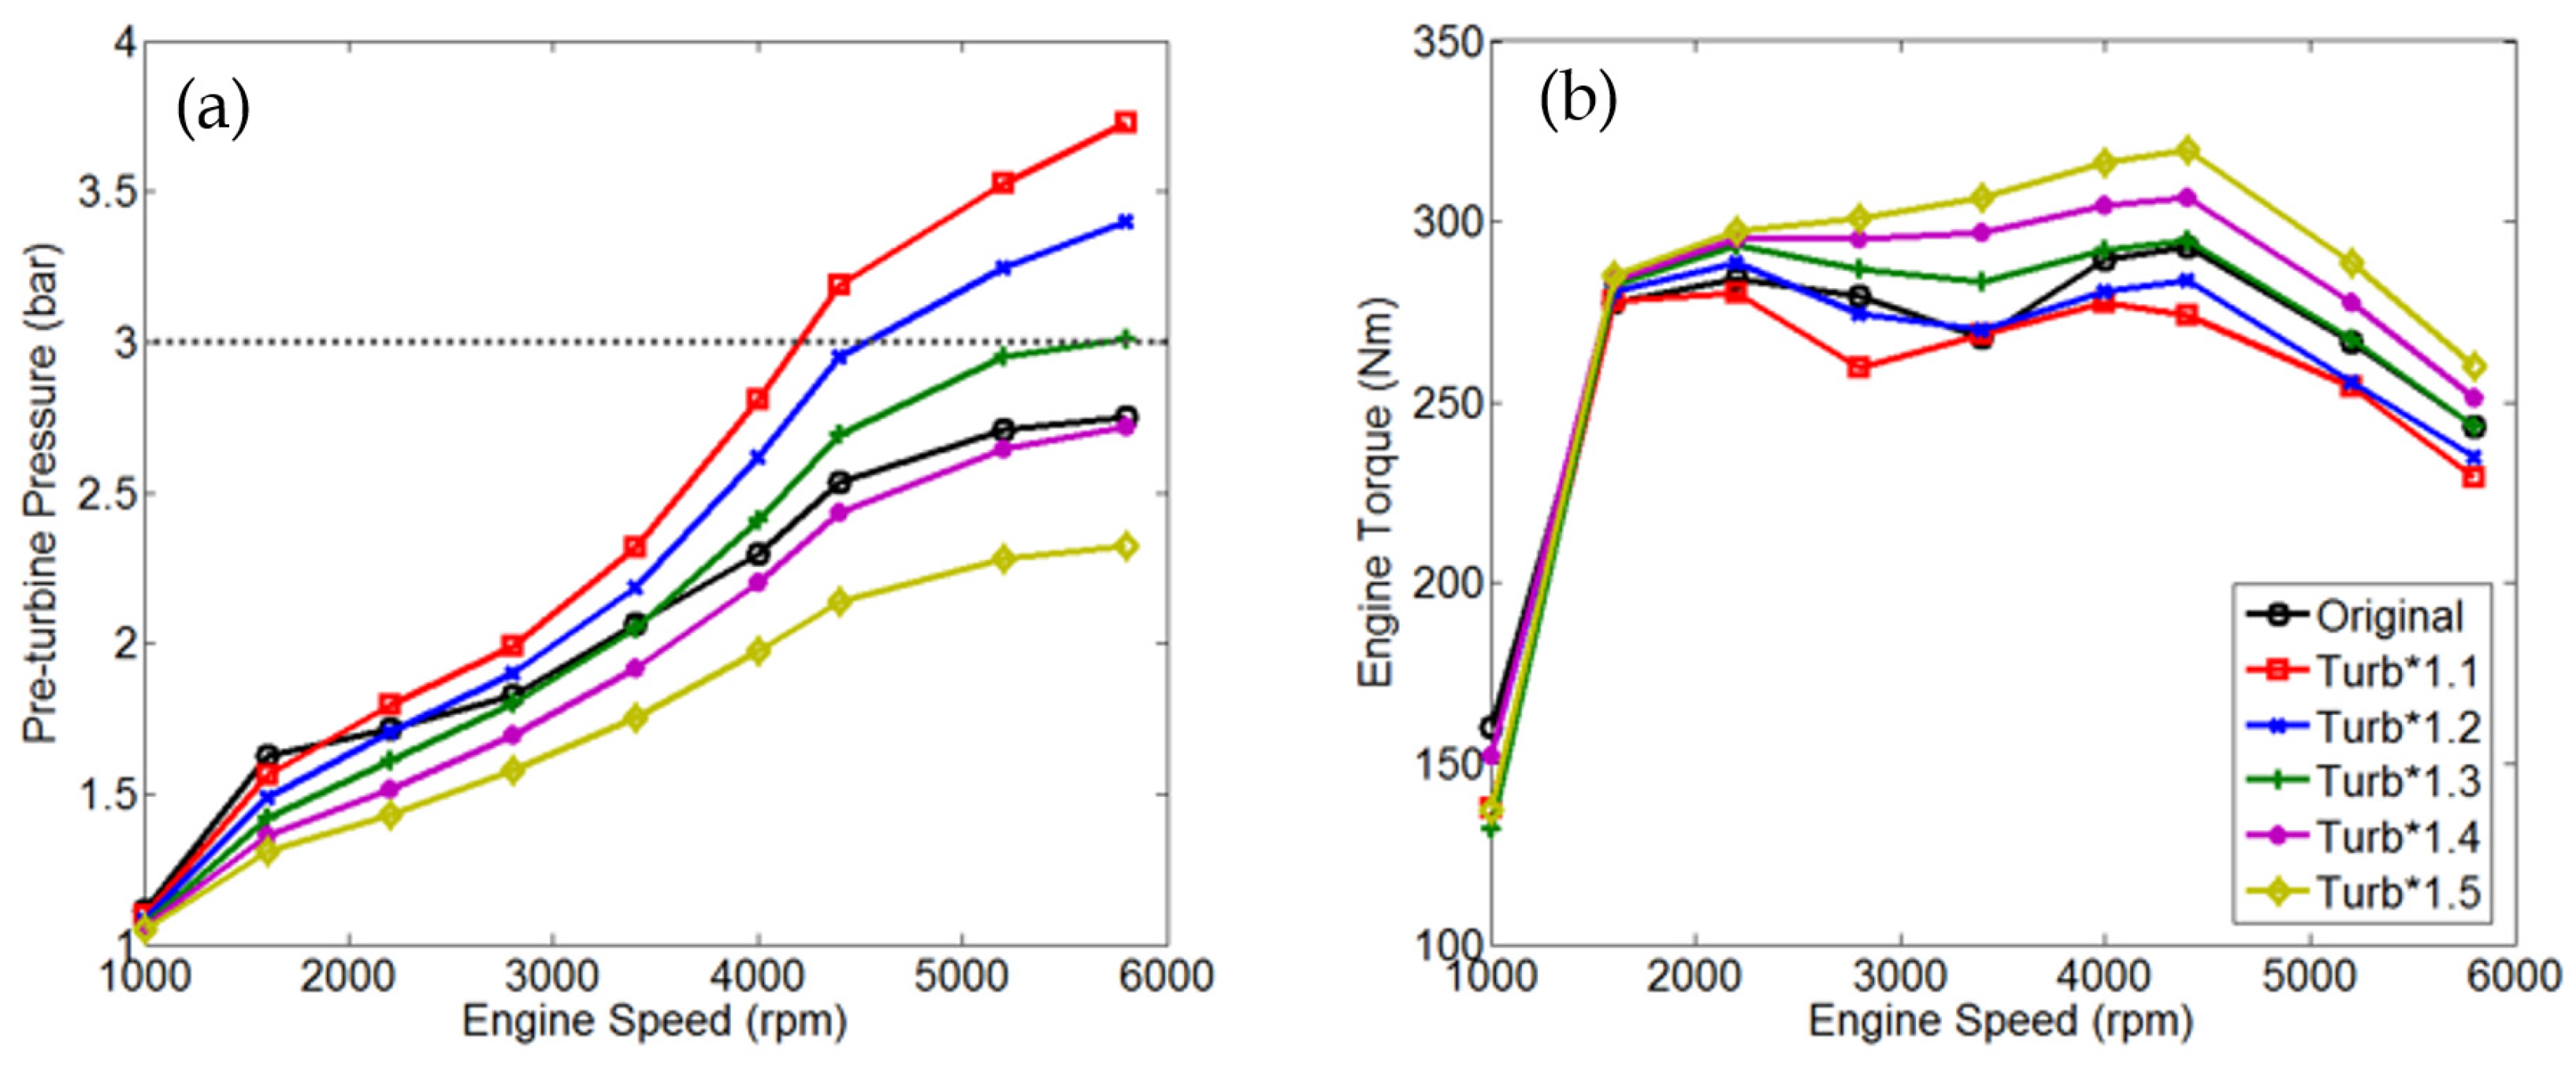
Figure 13.
Engine’s performance results for various turbines sizes and the wastegate completely shut: (a) pre-turbine pressure; (b) engine torque.
Figure 13.
Engine’s performance results for various turbines sizes and the wastegate completely shut: (a) pre-turbine pressure; (b) engine torque.
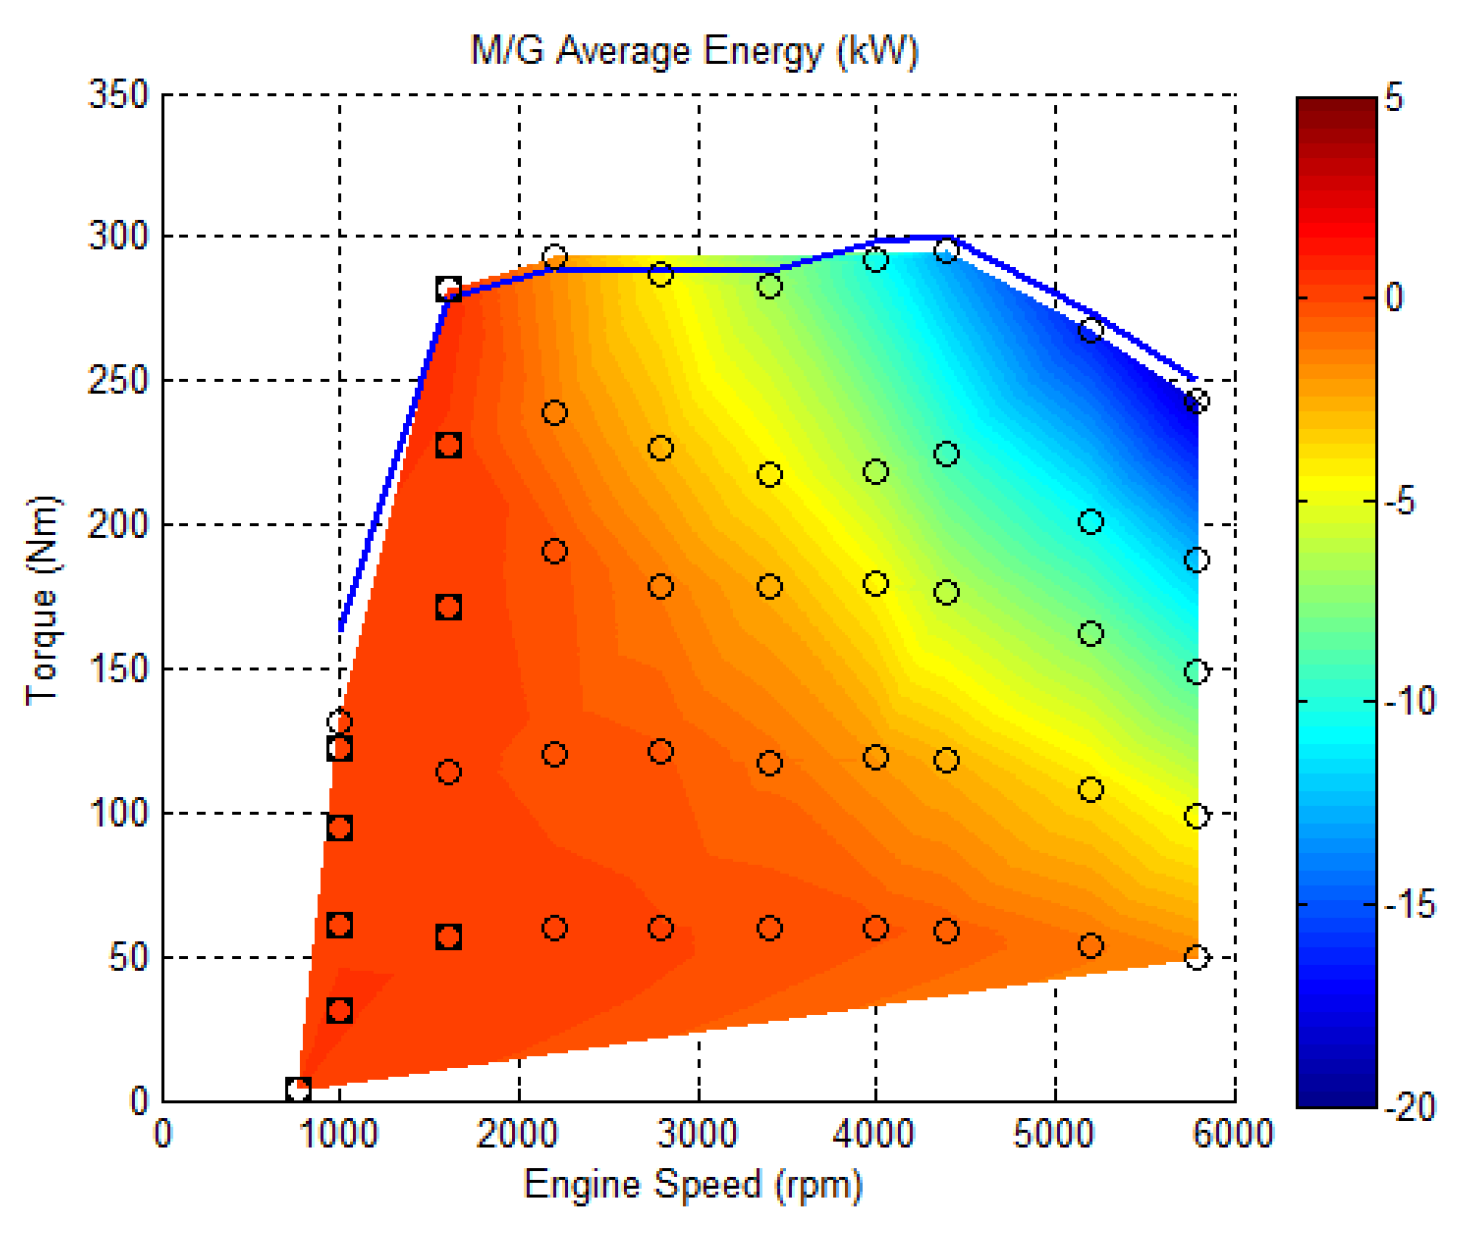
Figure 14.
Phase 2: Motor-generator average energy for the case with original compressor, 30% larger turbine and the WG valve completely shut; negative values indicate energy harvesting; positive values indicate the need for energy provision; the blue line represents the maximum torque line of the baseline engine’s model as provided by the manufacturer (λ < 1); the ⨂ symbol indicates limit violation; ⌼ indicates energy provision area.
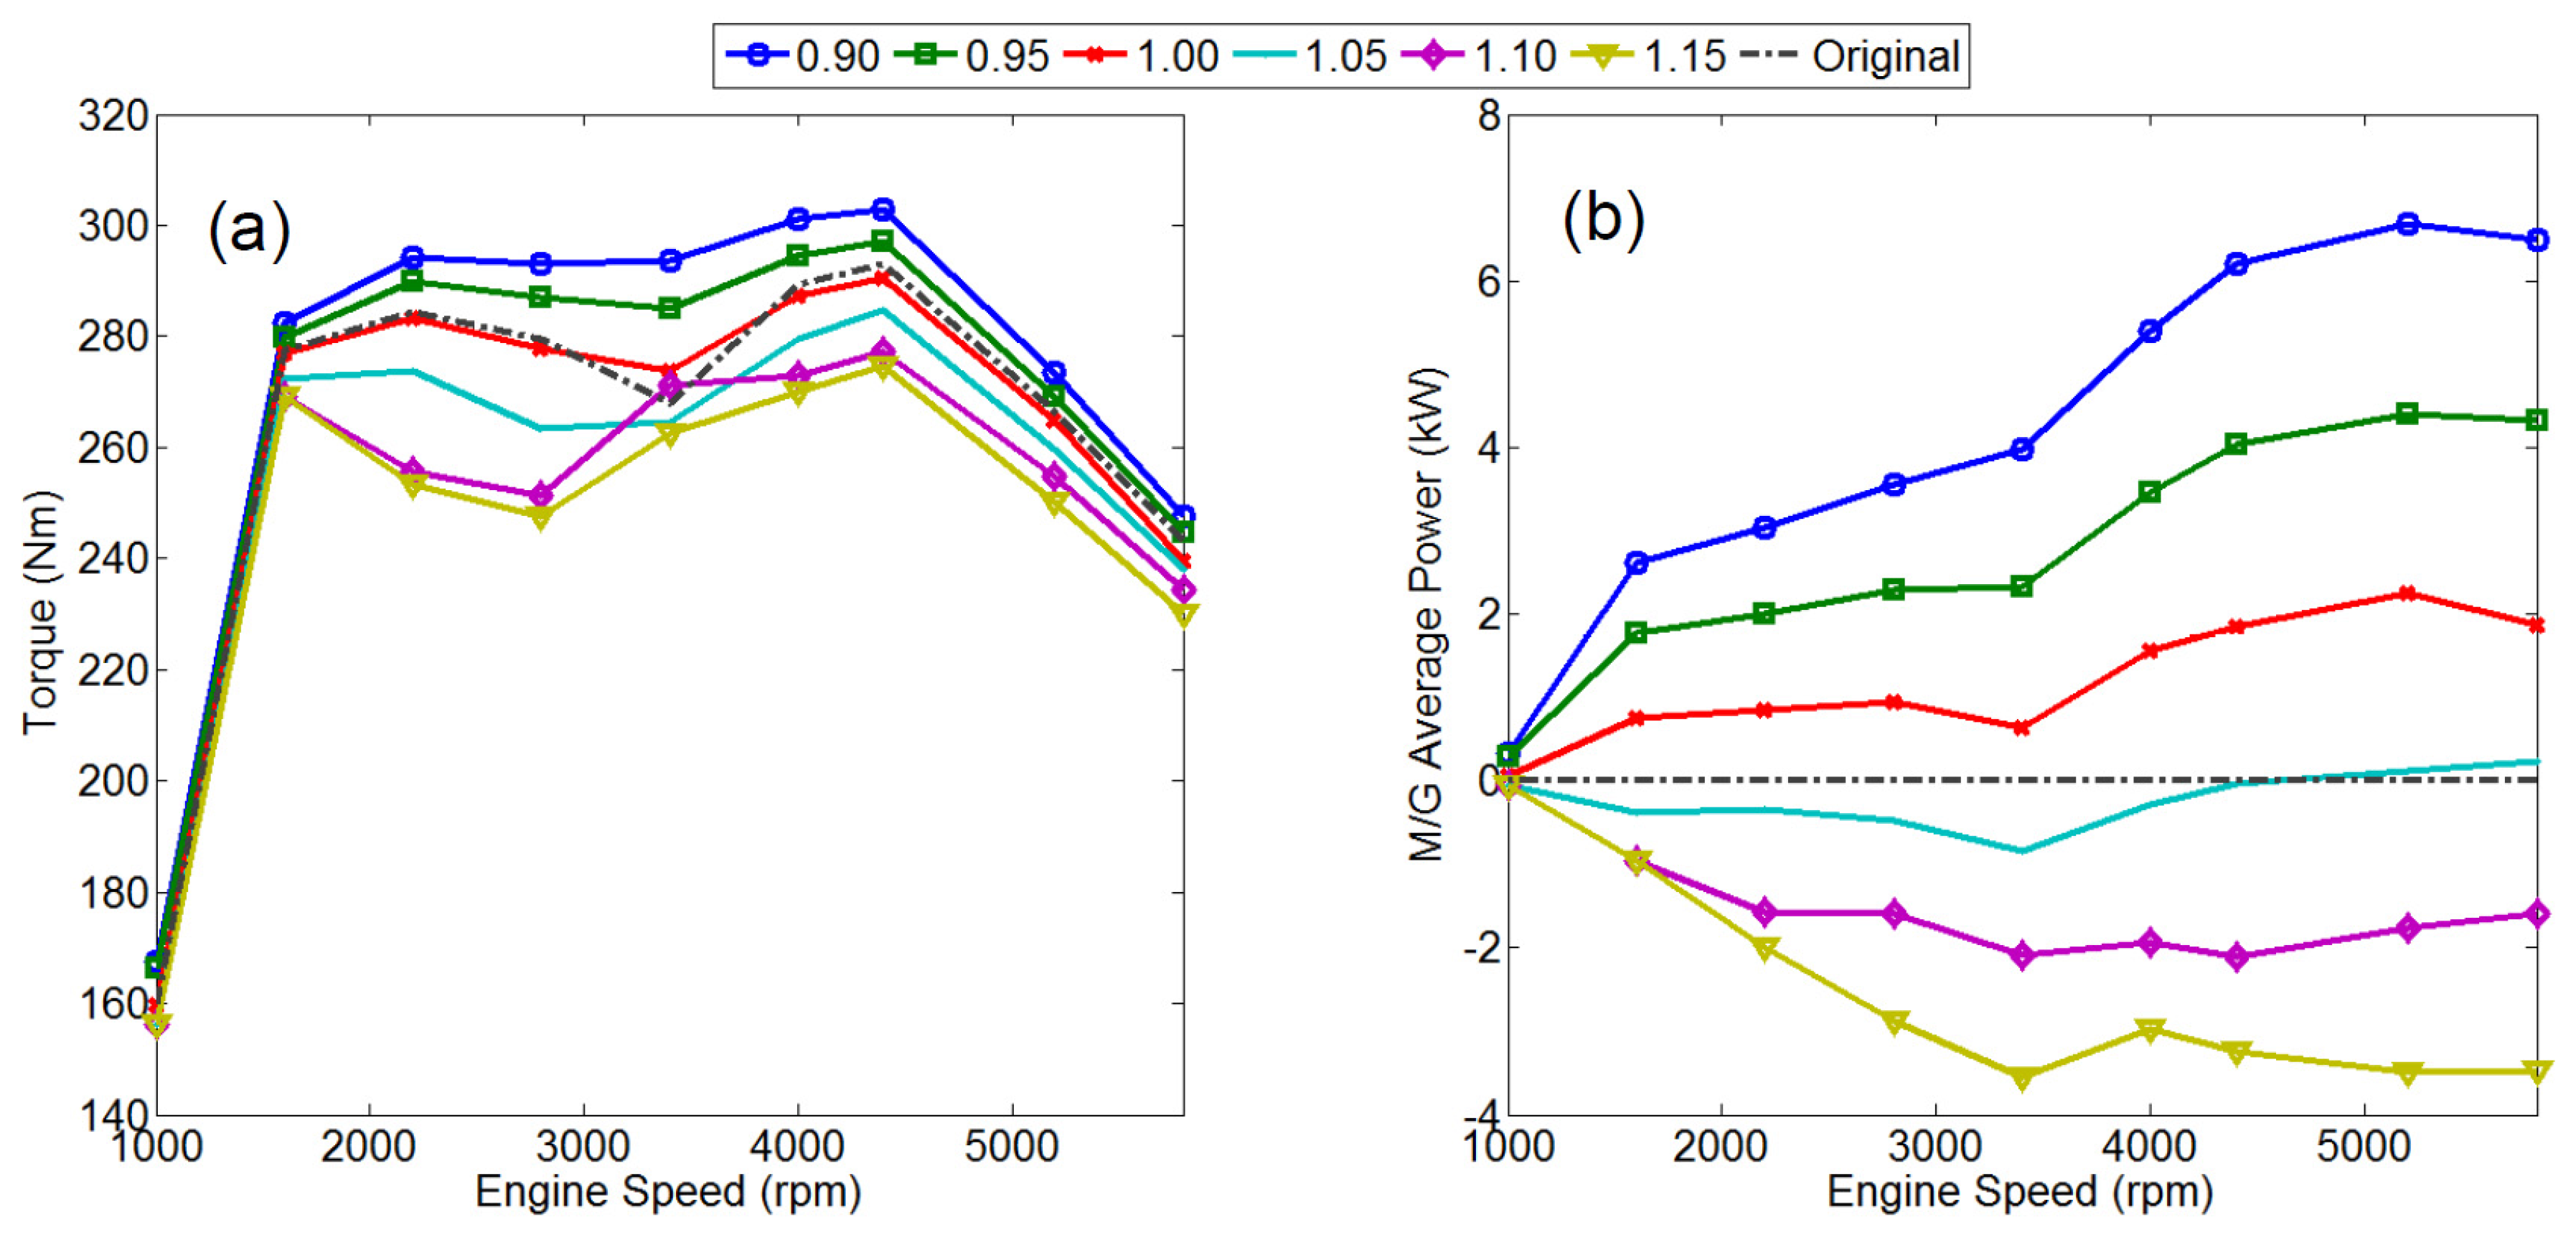
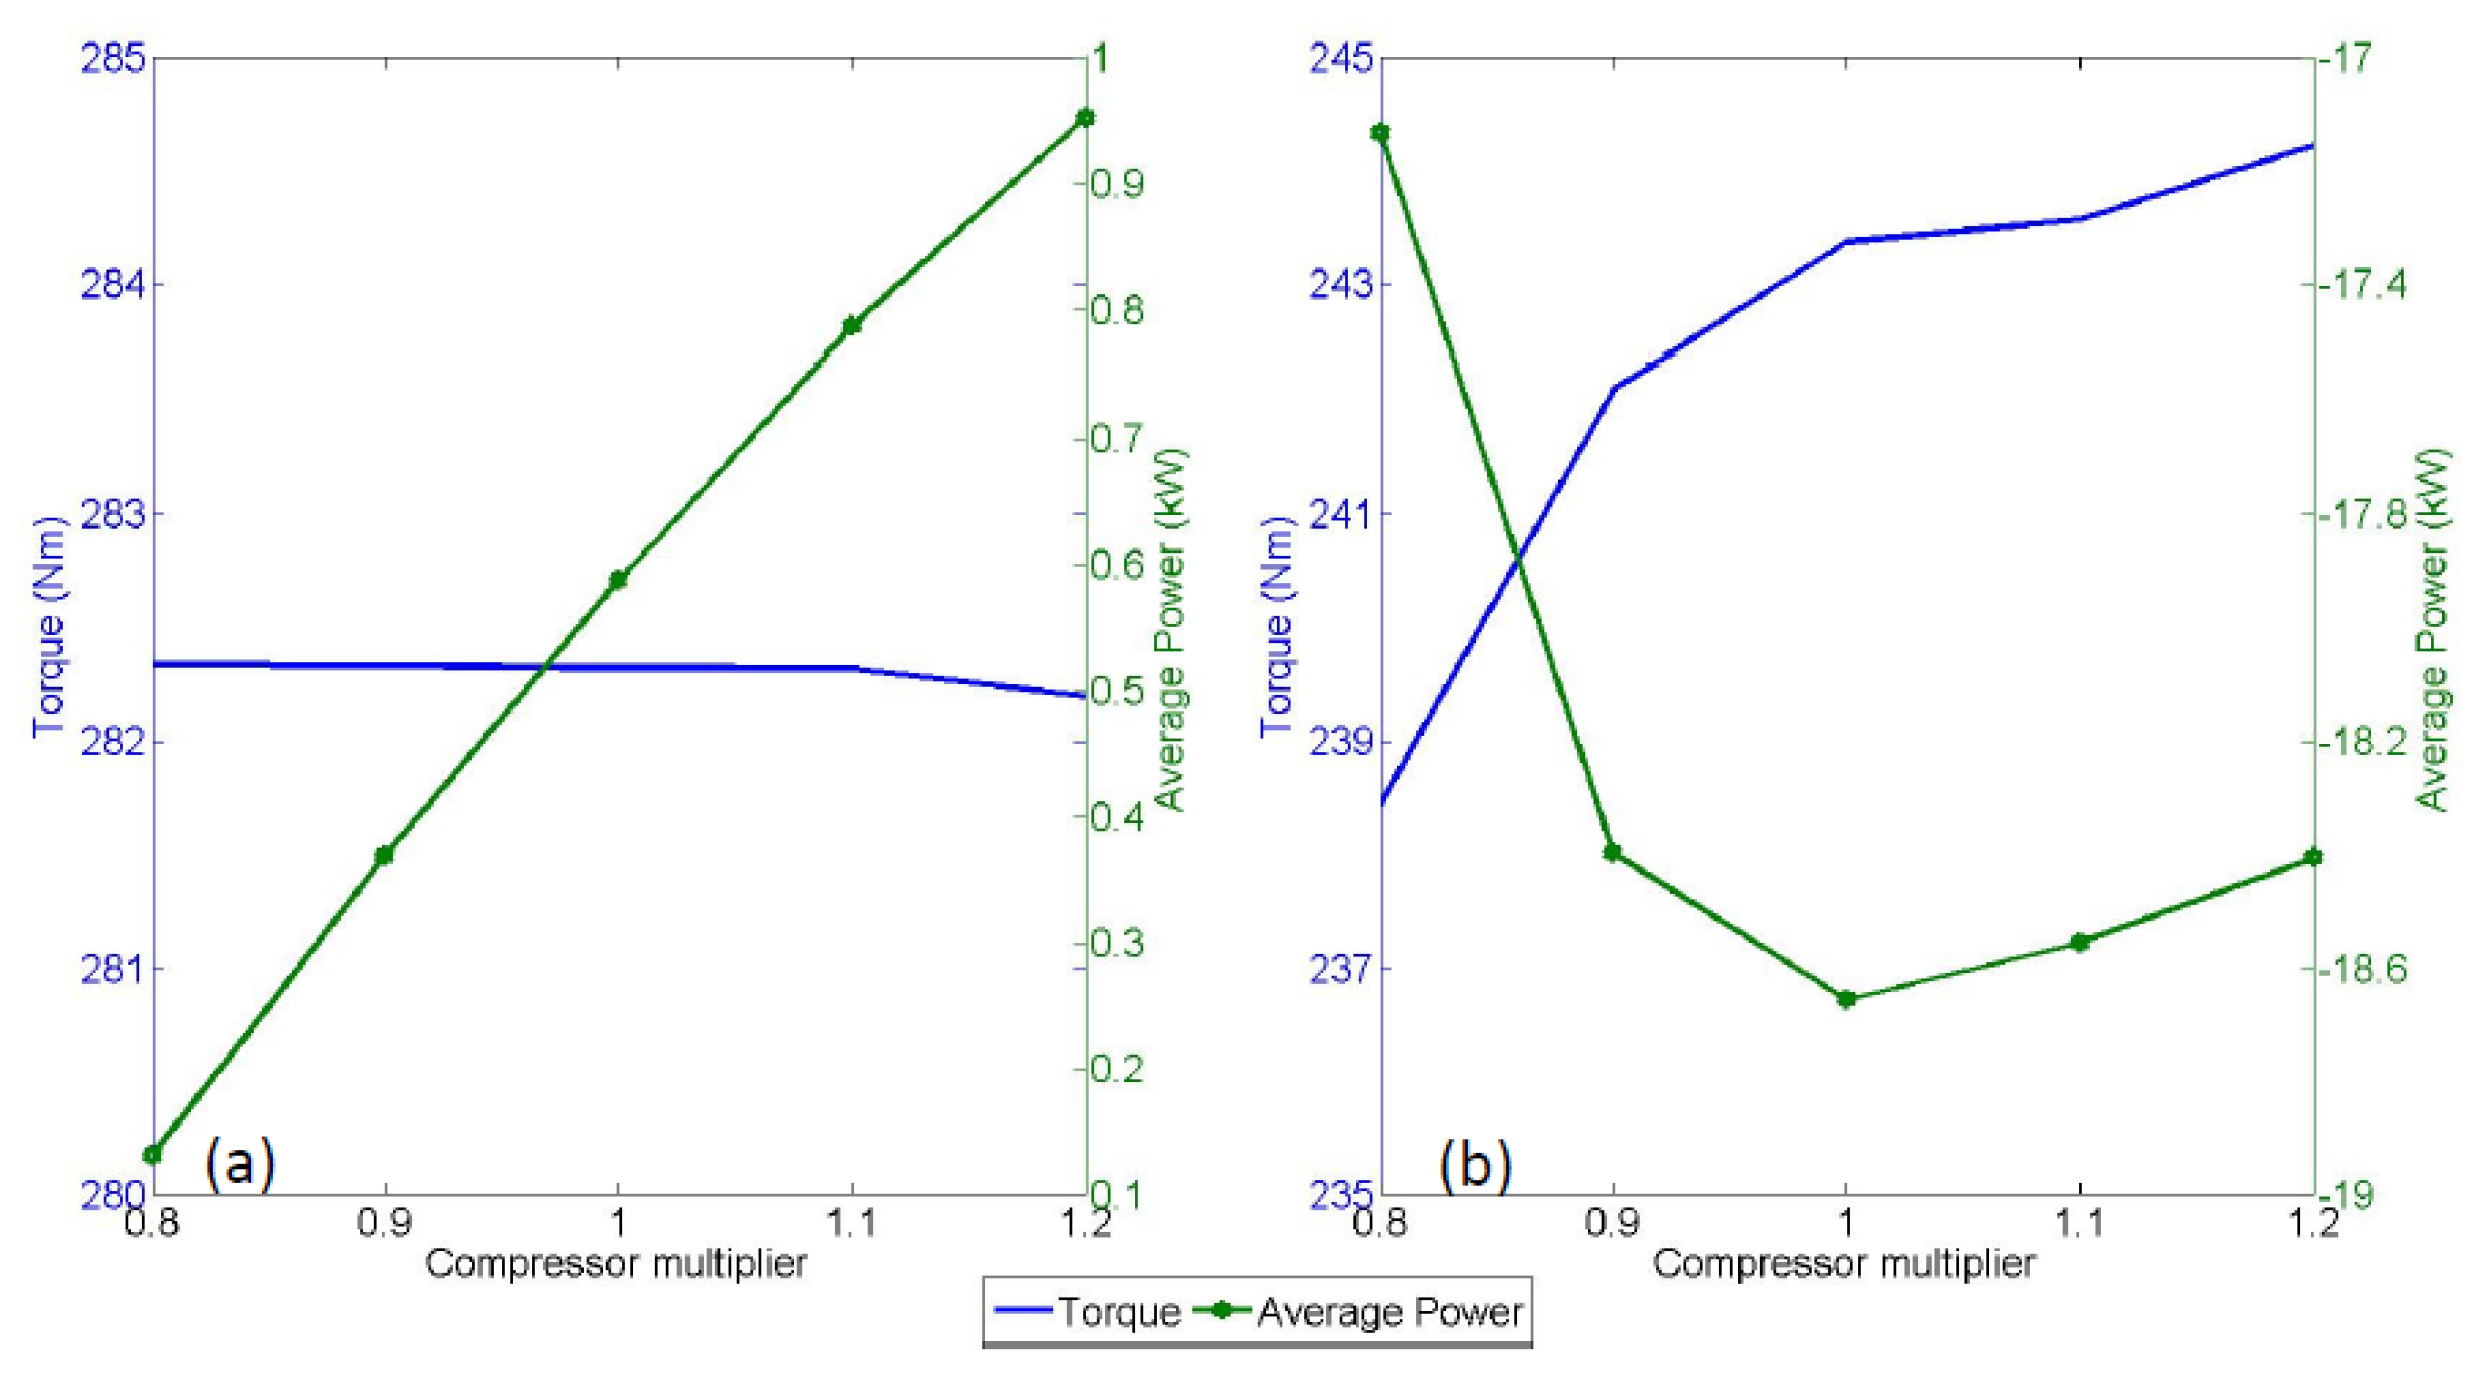
Figure 15.
Effect of compressor’s size on average power and torque: (a) 1600 rpm; (b) 5800 rpm.
Figure 15.
Effect of compressor’s size on average power and torque: (a) 1600 rpm; (b) 5800 rpm.
Figure 16.
Balance study for different turbine sizes and wastegate areas for meeting the baseline engine’s maximum torque.
Figure 16.
Balance study for different turbine sizes and wastegate areas for meeting the baseline engine’s maximum torque.
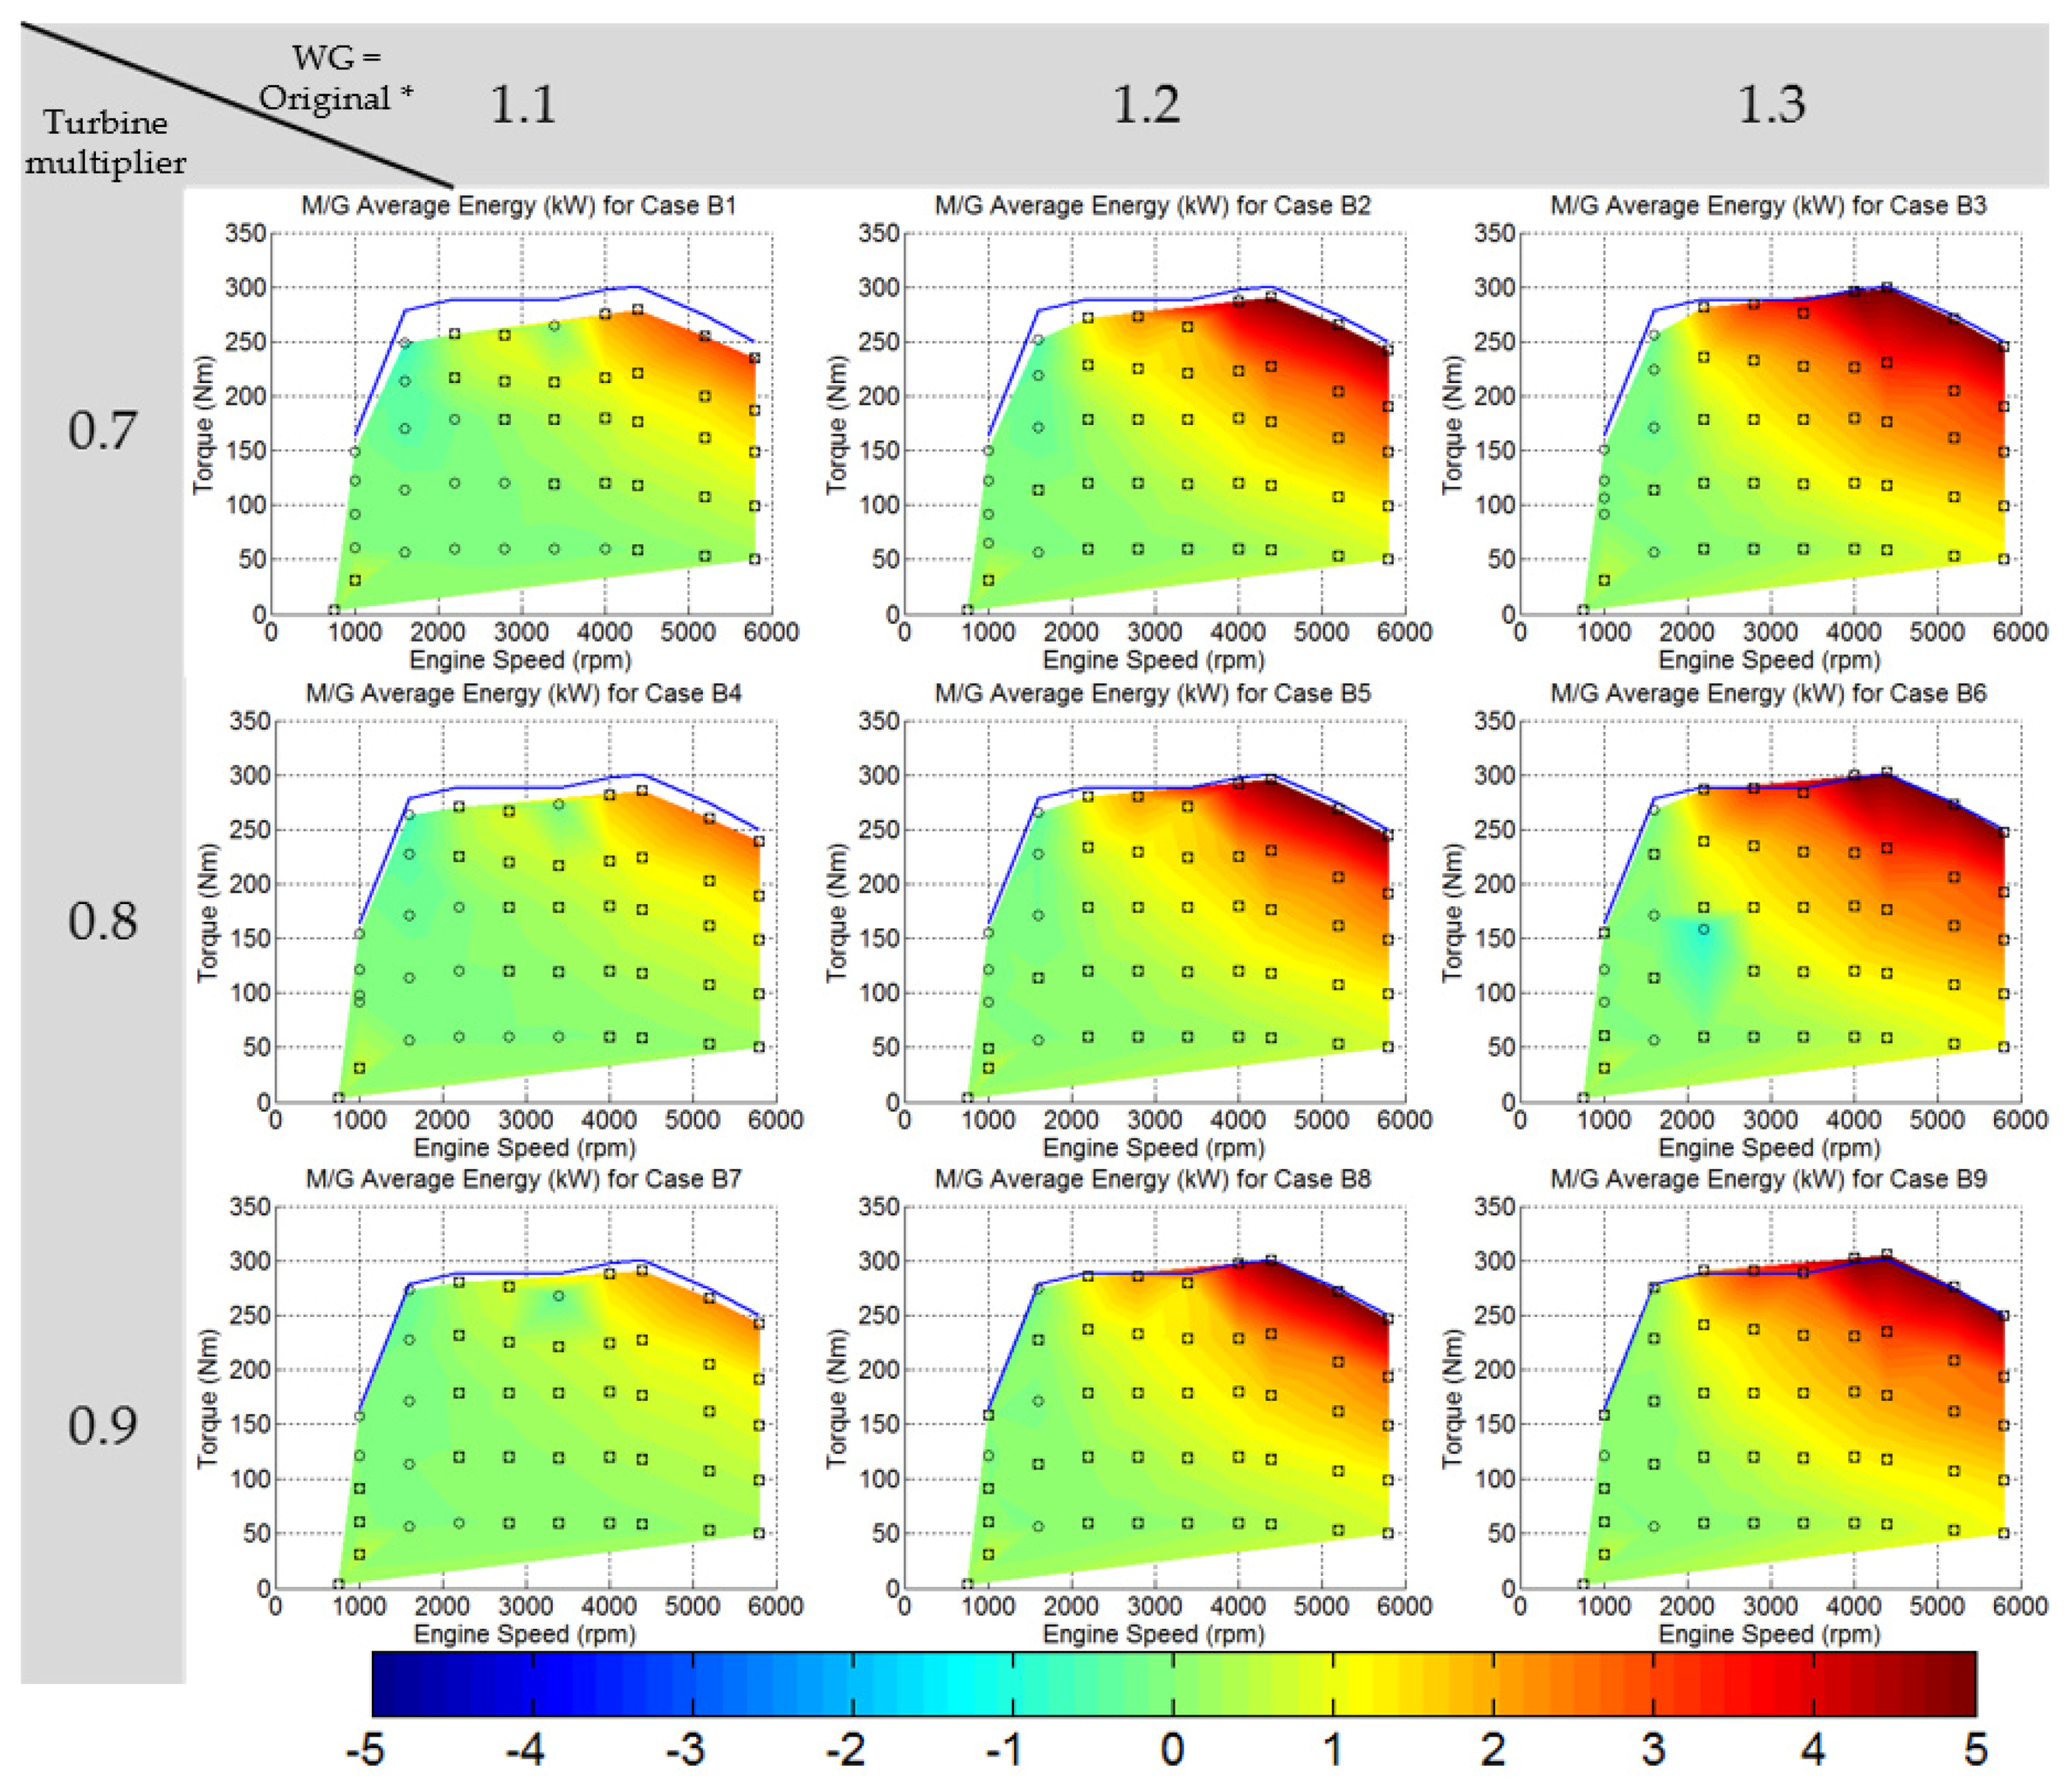
Figure 17.
Phase 3: DoE analysis of the motor-generator average energy for different turbine sizes and WG areas; negative values indicate energy harvesting; positive values indicate need for energy provision; blue line represents the maximum torque line of the baseline engine’s model as provided by the manufacturer (λ < 1); ⨂ symbol indicates limit violation; ⌼ indicates energy provision area.
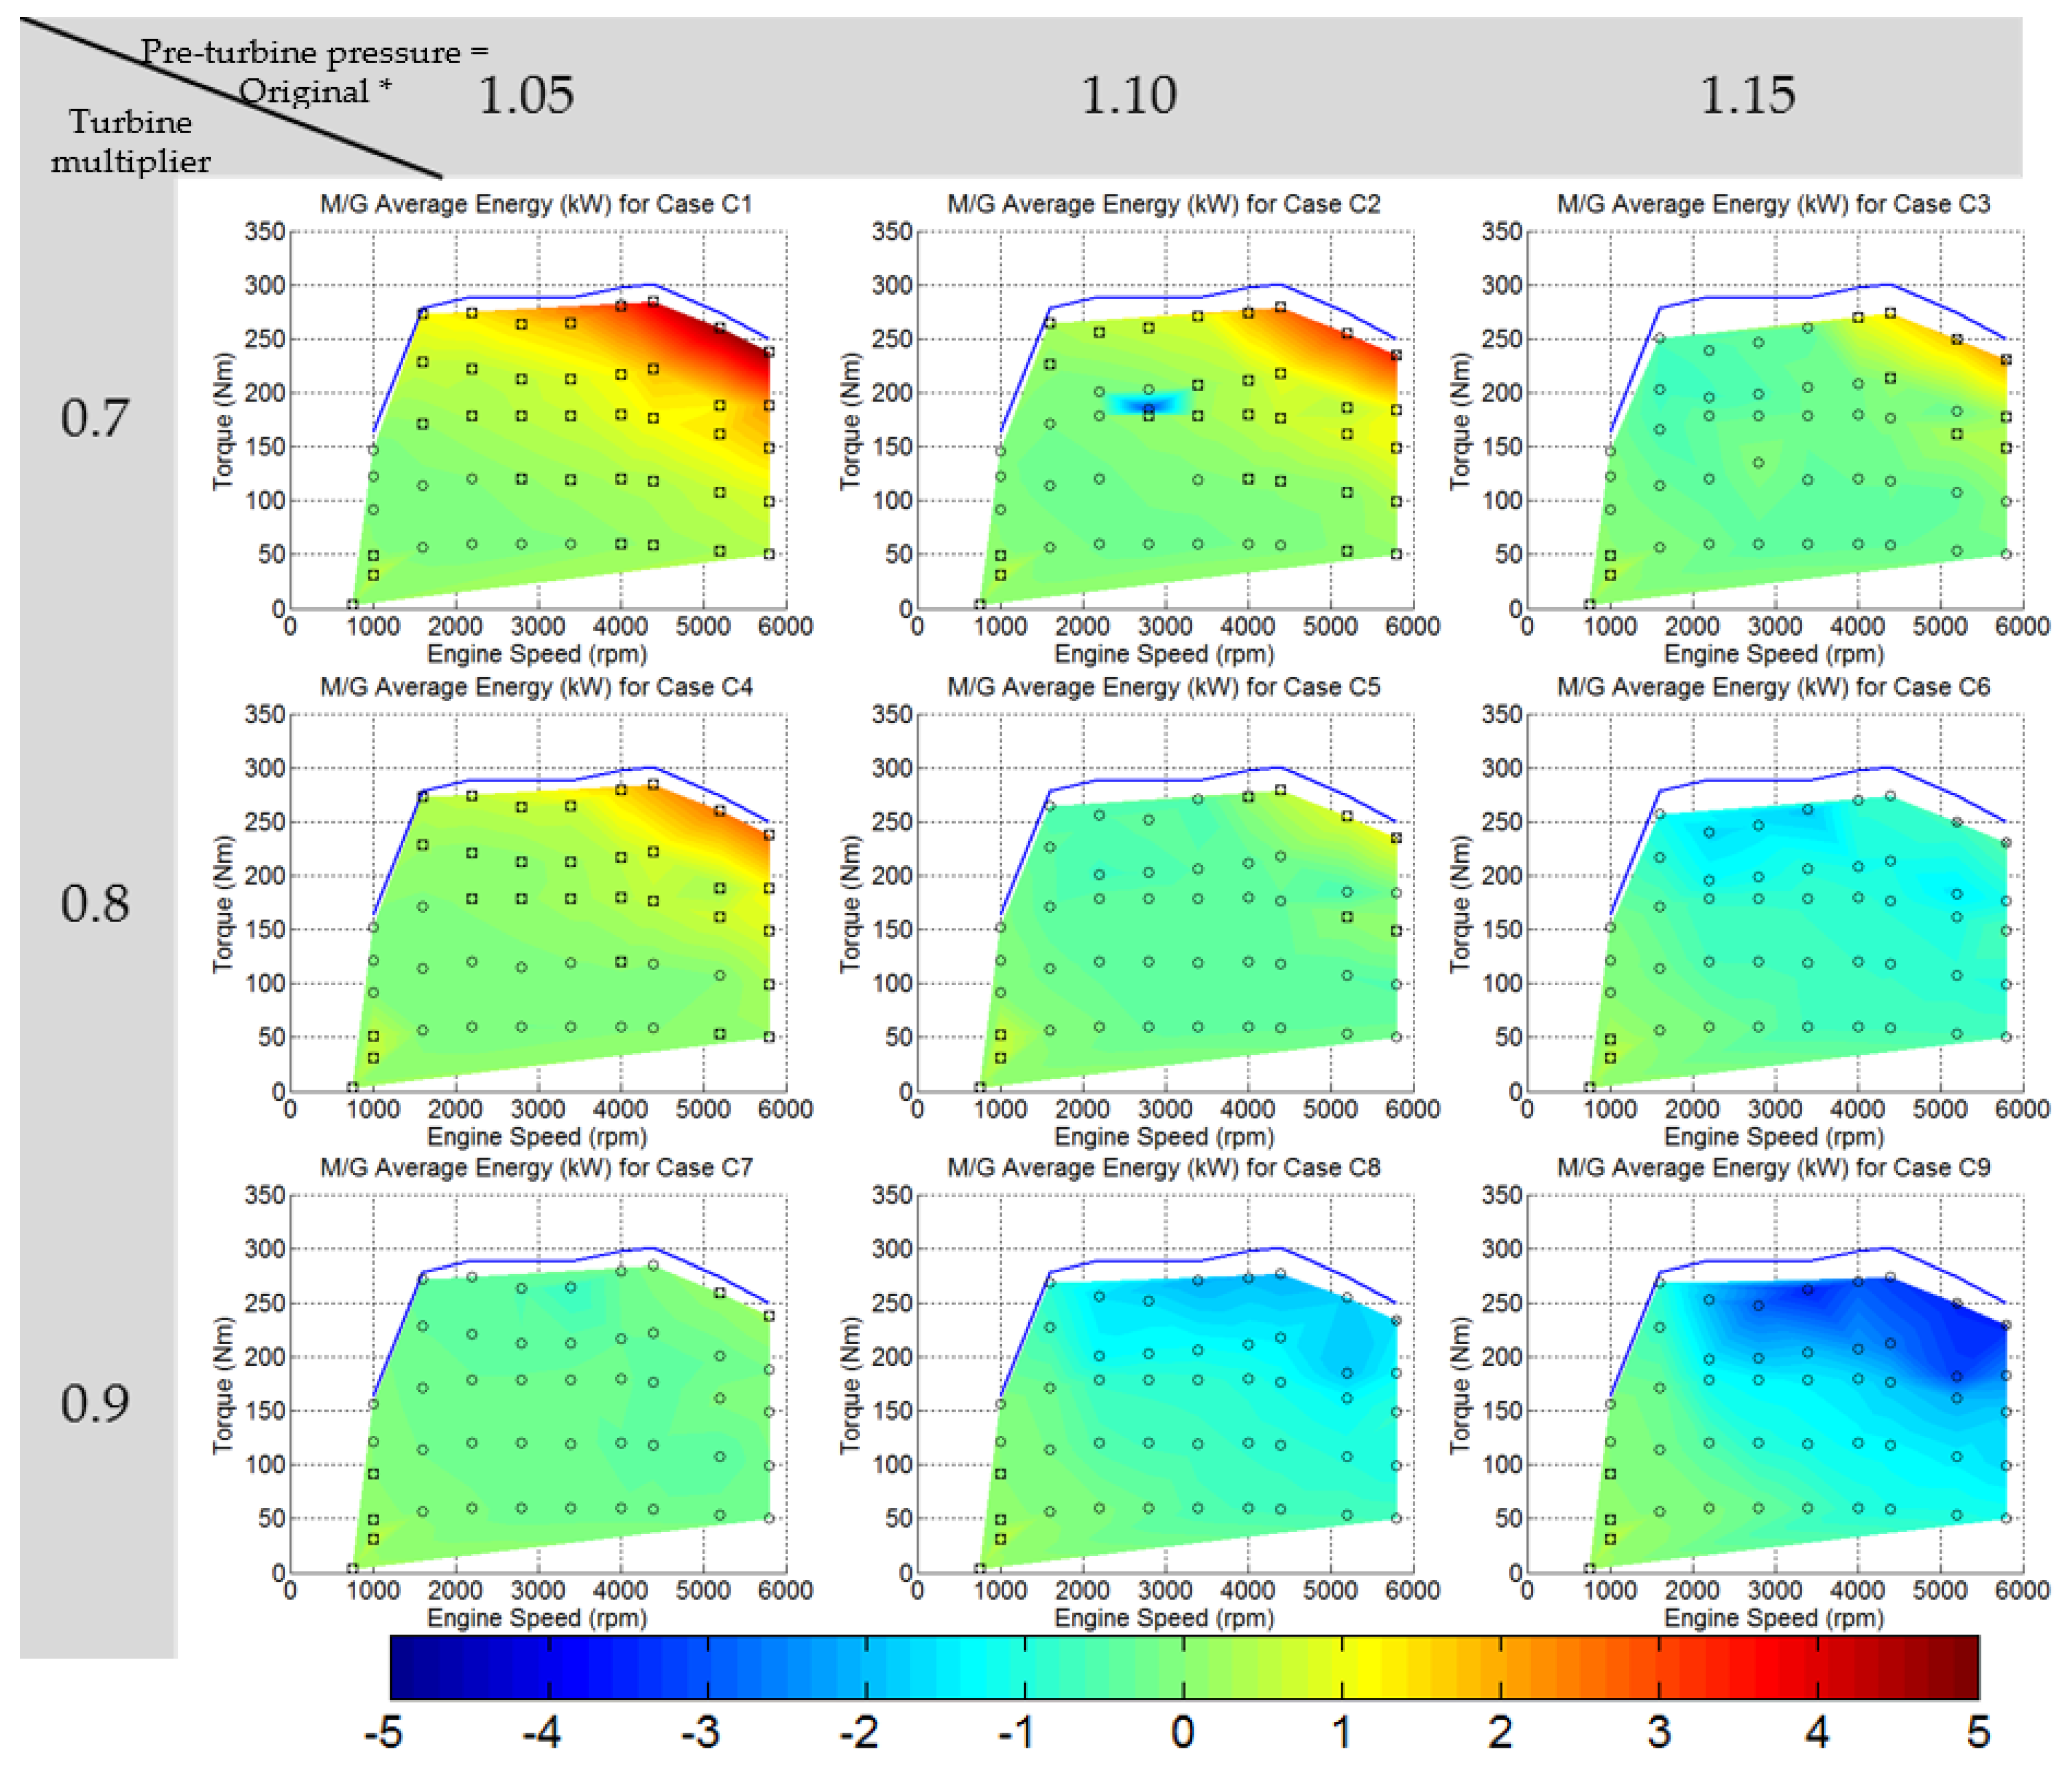
Figure 18.
Phase 3: DoE analysis of the motor-generator average energy for different turbine sizes and pre-turbine pressures; negative values indicate energy harvesting; positive values indicate the need for energy provision; the blue line represents the maximum torque line of the baseline engine’s model as provided by the manufacturer (λ < 1); the ⨂ symbol indicates limit violation; ⌼ indicates energy provision area.
Figure 19.
Effect of pre-turbine pressure % change on: (a) engine’s torque at full load; (b) M/G performance at full load; negative values indicate energy harvesting.
Figure 19.
Effect of pre-turbine pressure % change on: (a) engine’s torque at full load; (b) M/G performance at full load; negative values indicate energy harvesting.
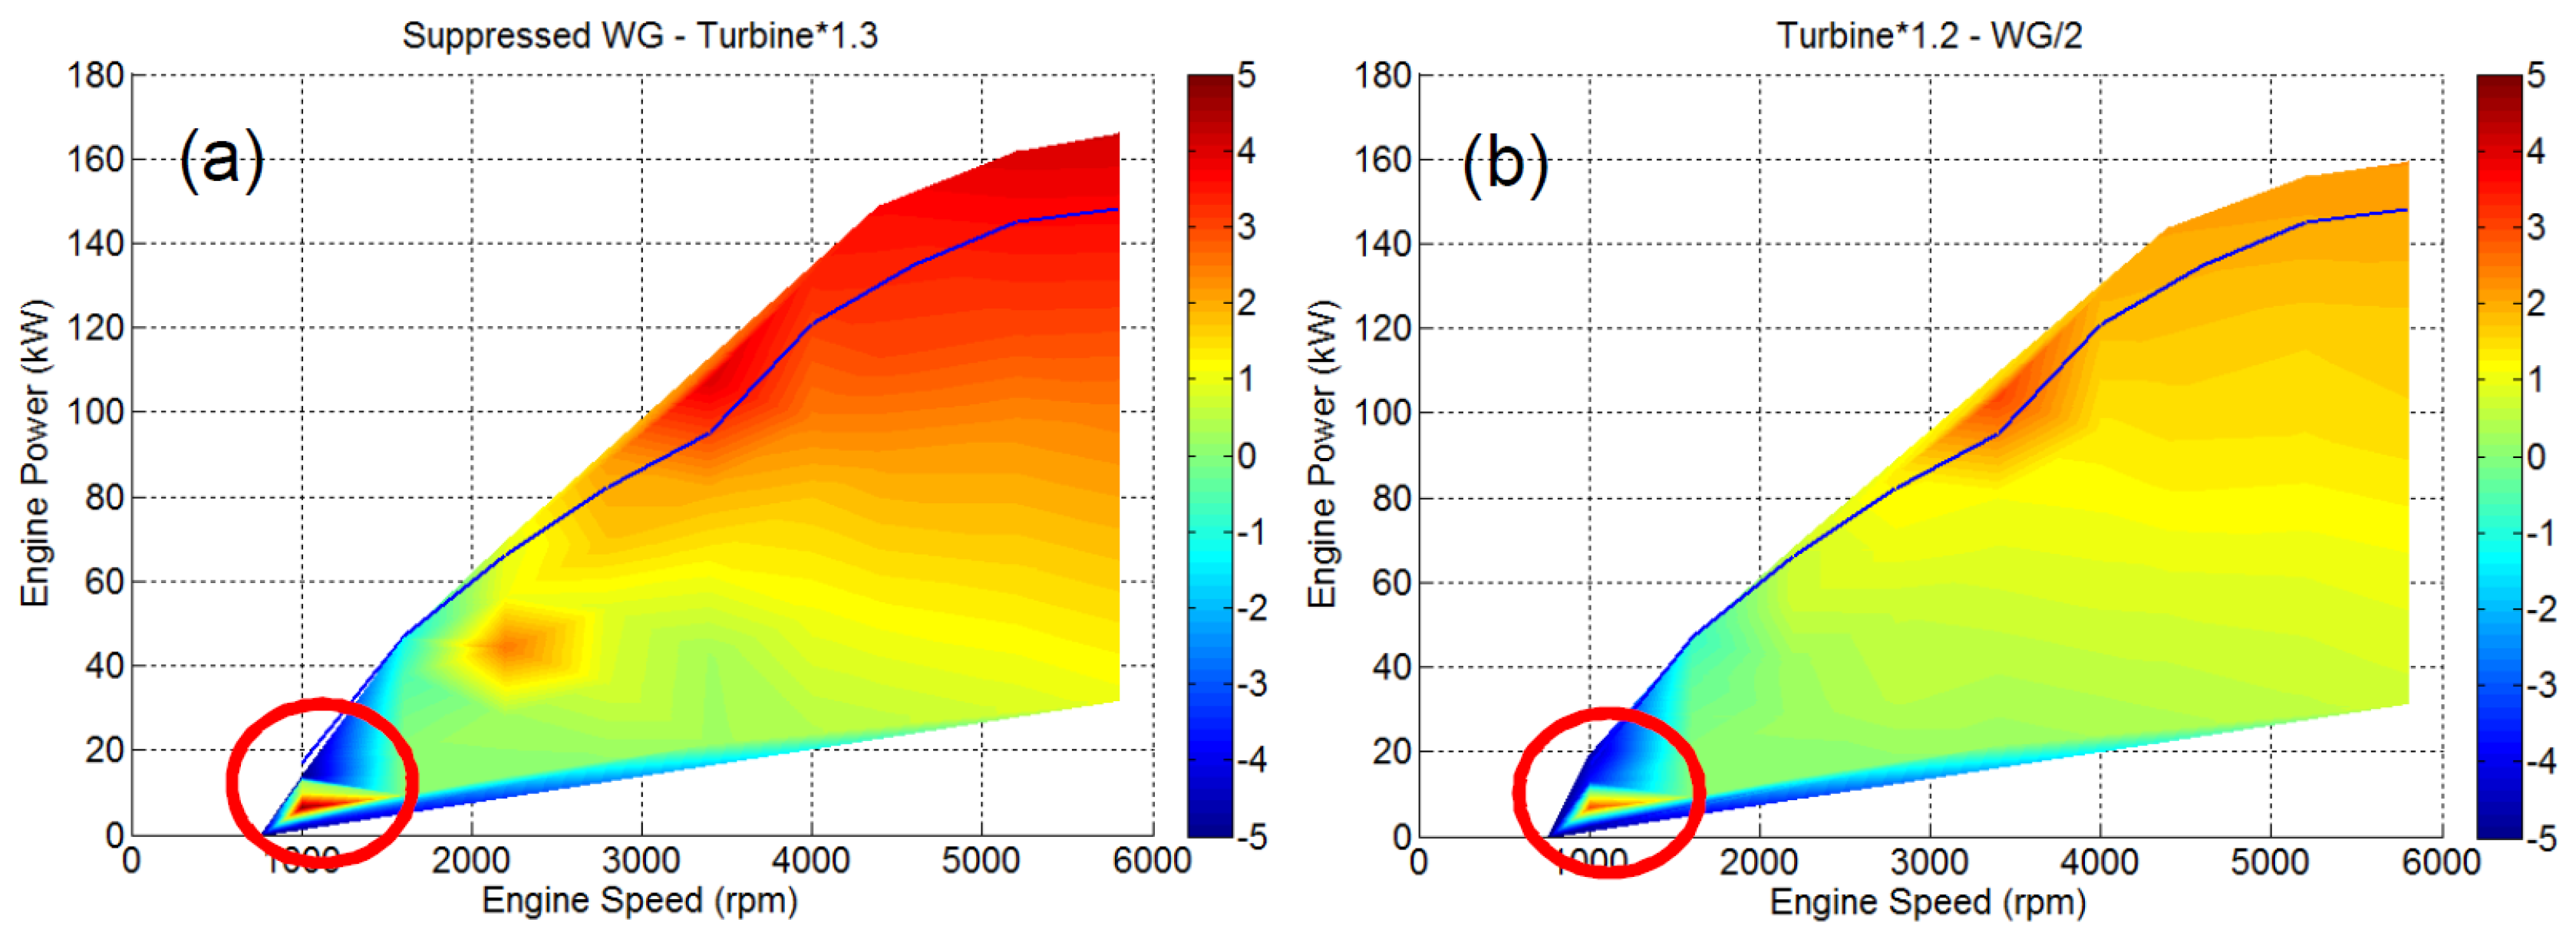
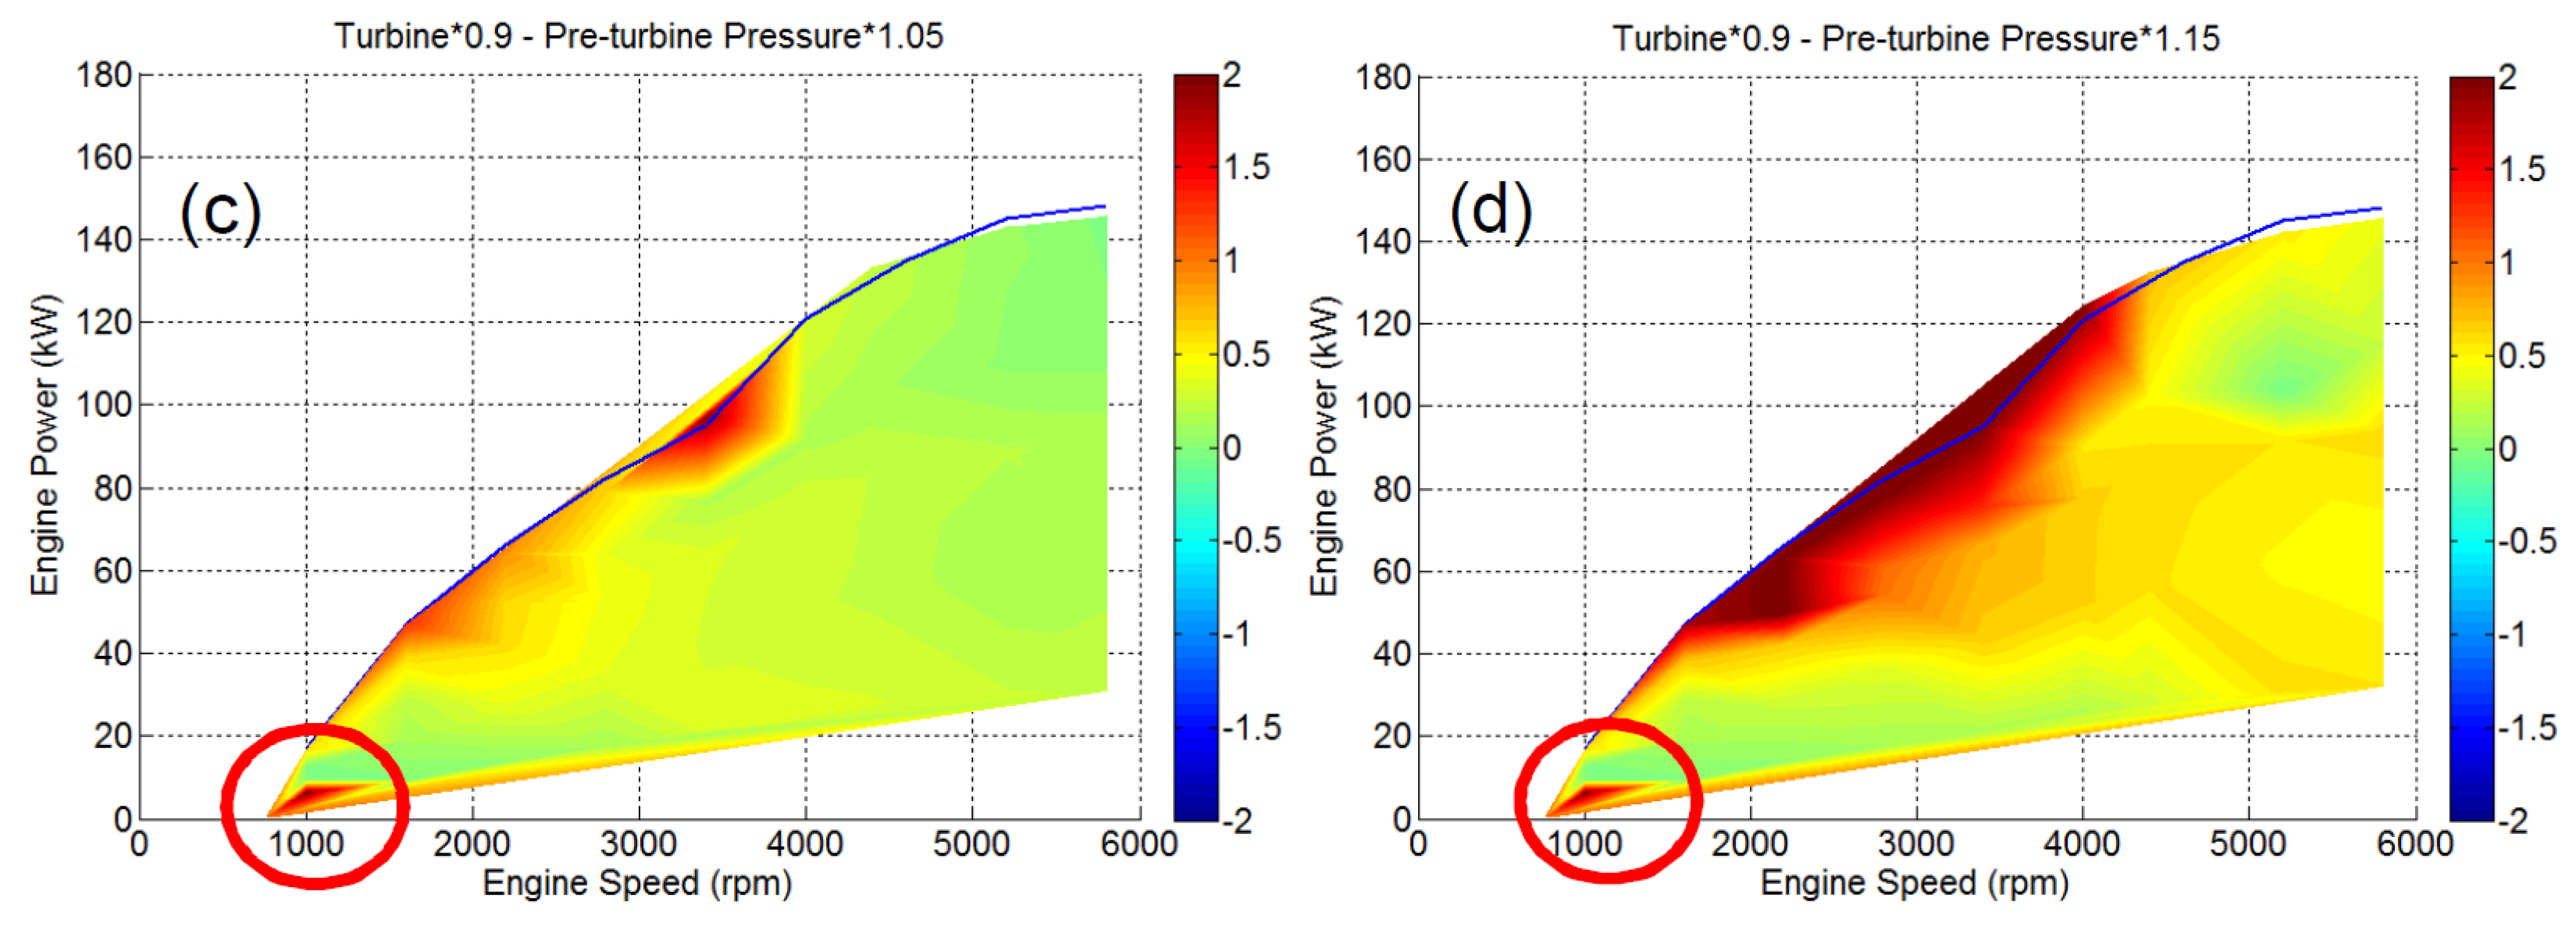
Figure 20.
Absolute difference in overall efficiency between four different e-turbo configurations and the baseline engine; negative values indicate efficiency loss; positive values indicate efficiency gain; the area in red circle indicates non-convergence of the model: (a) model with 30% larger turbine and WG completely shut; (b) model with 20% larger turbine and WG half opened compared to the baseline engine; (c) model with 10% smaller turbine and 5% increased pre-turbine pressure compared to the baseline engine; (d) model with 10% smaller turbine and 15% increased pre-turbine pressure compared to the baseline engine.
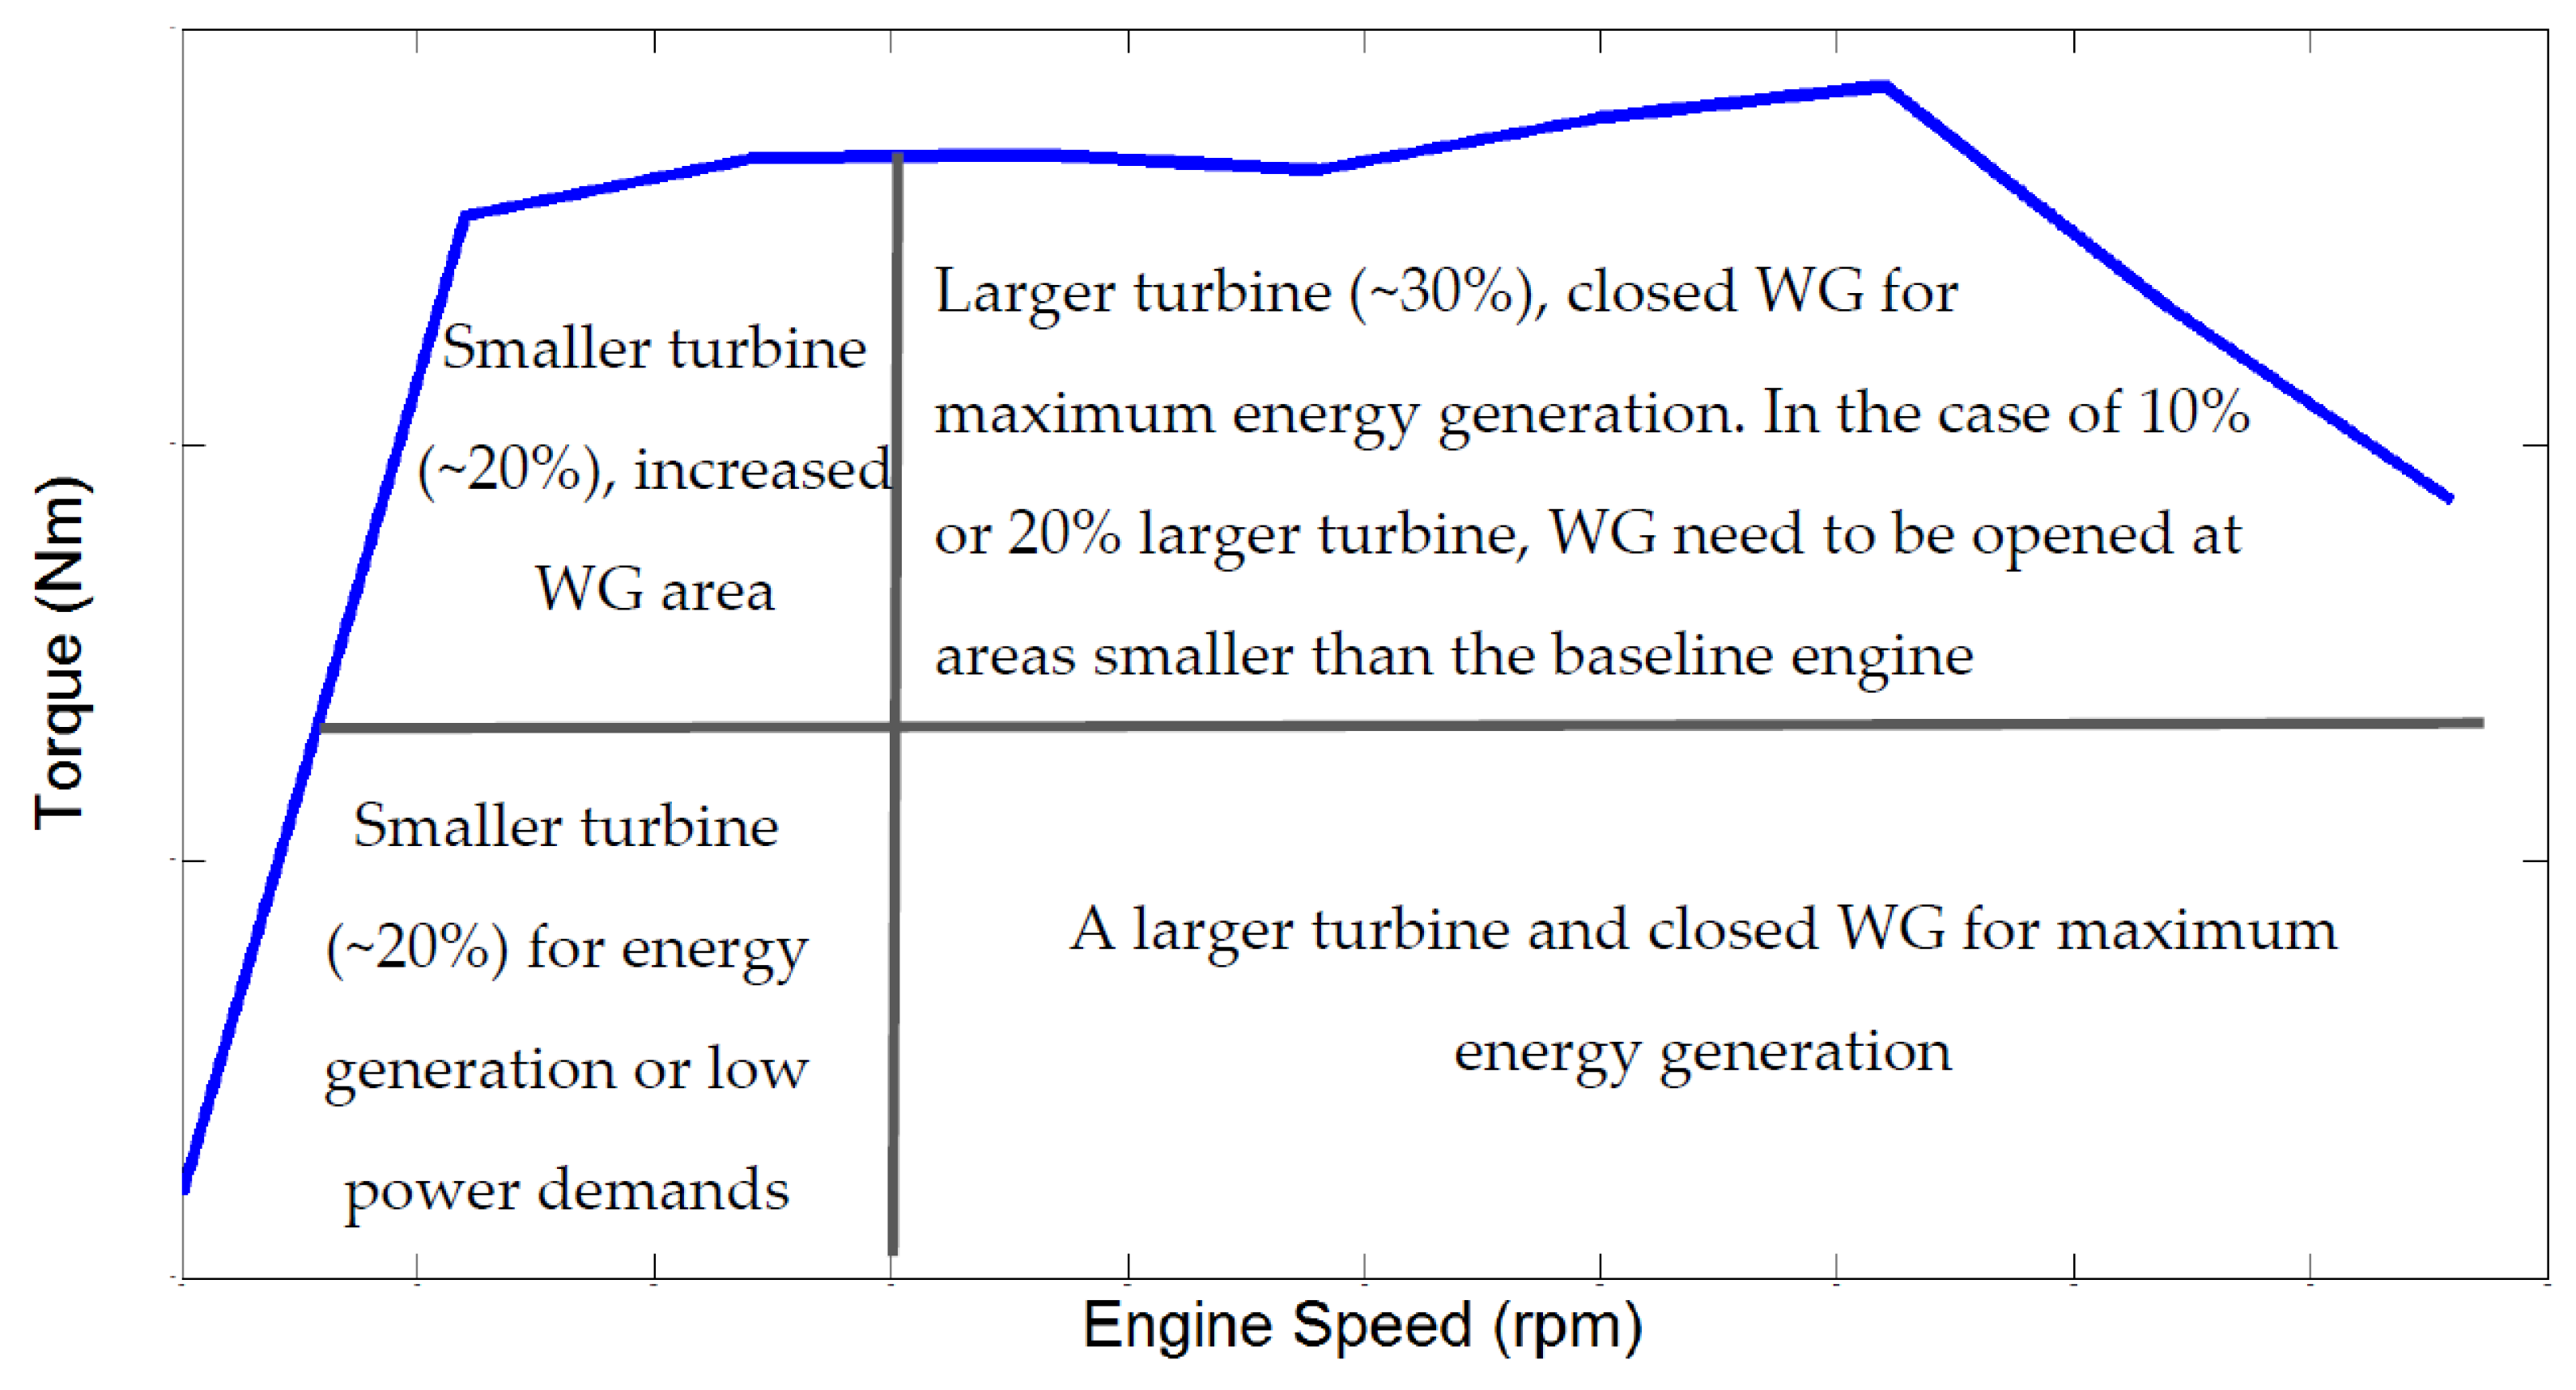
Figure 21.
Ideal component sizing for maximum power and energy harvesting.
Figure 21.
Ideal component sizing for maximum power and energy harvesting.
Figure 22.
Limits and level of power provided to the compressor during tip-in transient: (a) 1600 rpm; (b) 1100 rpm.
Figure 22.
Limits and level of power provided to the compressor during tip-in transient: (a) 1600 rpm; (b) 1100 rpm.
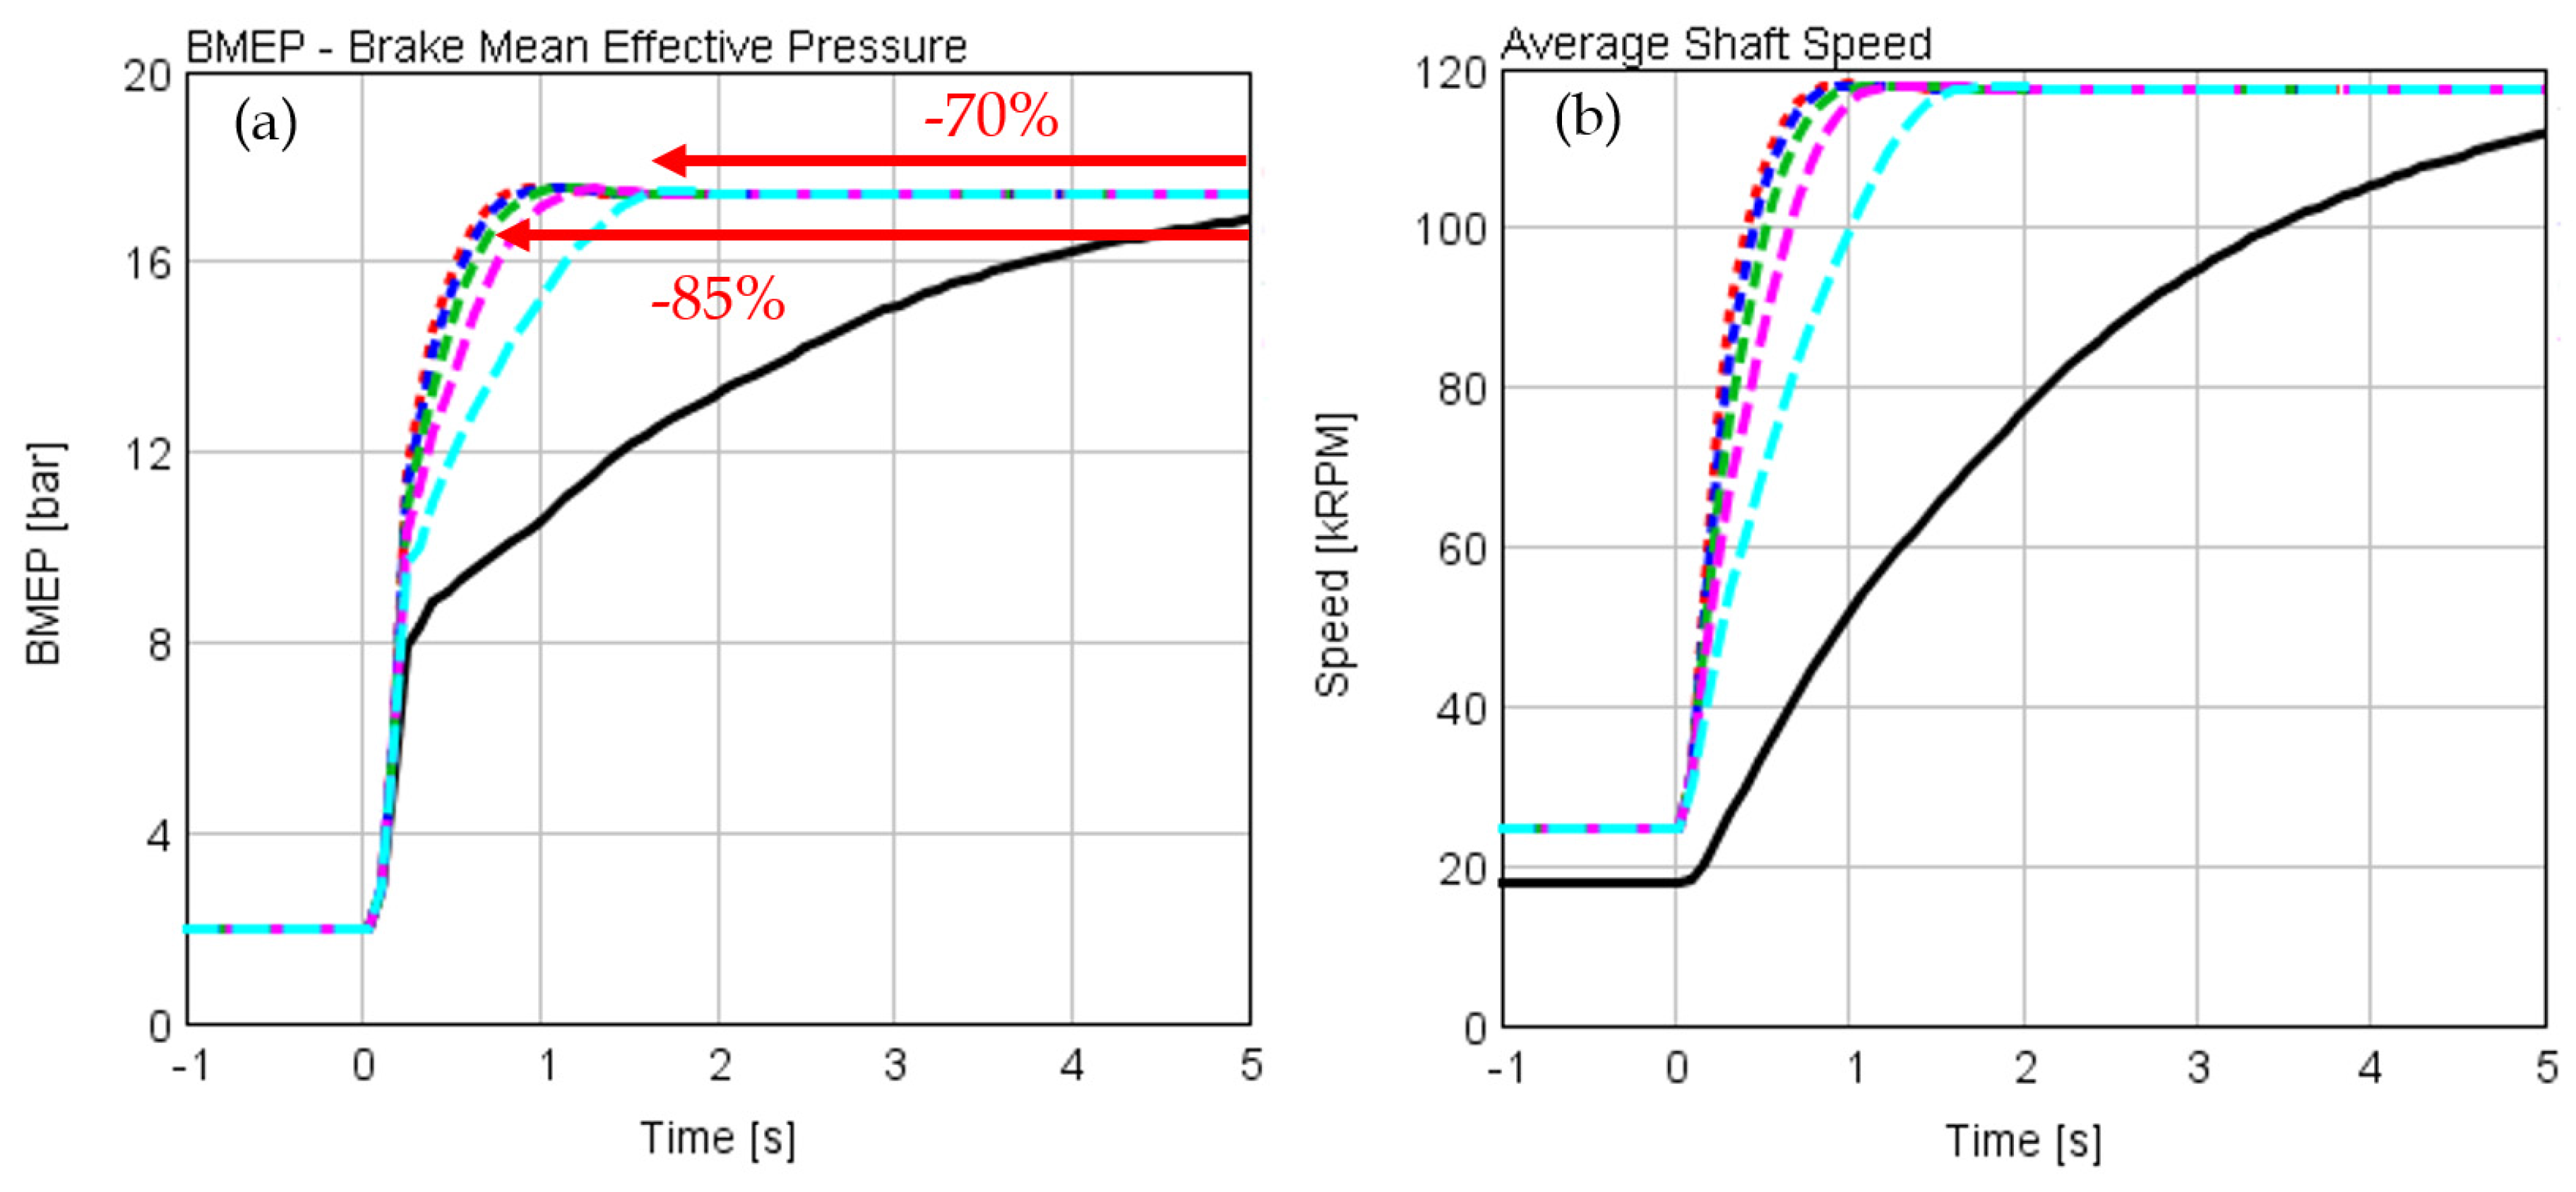
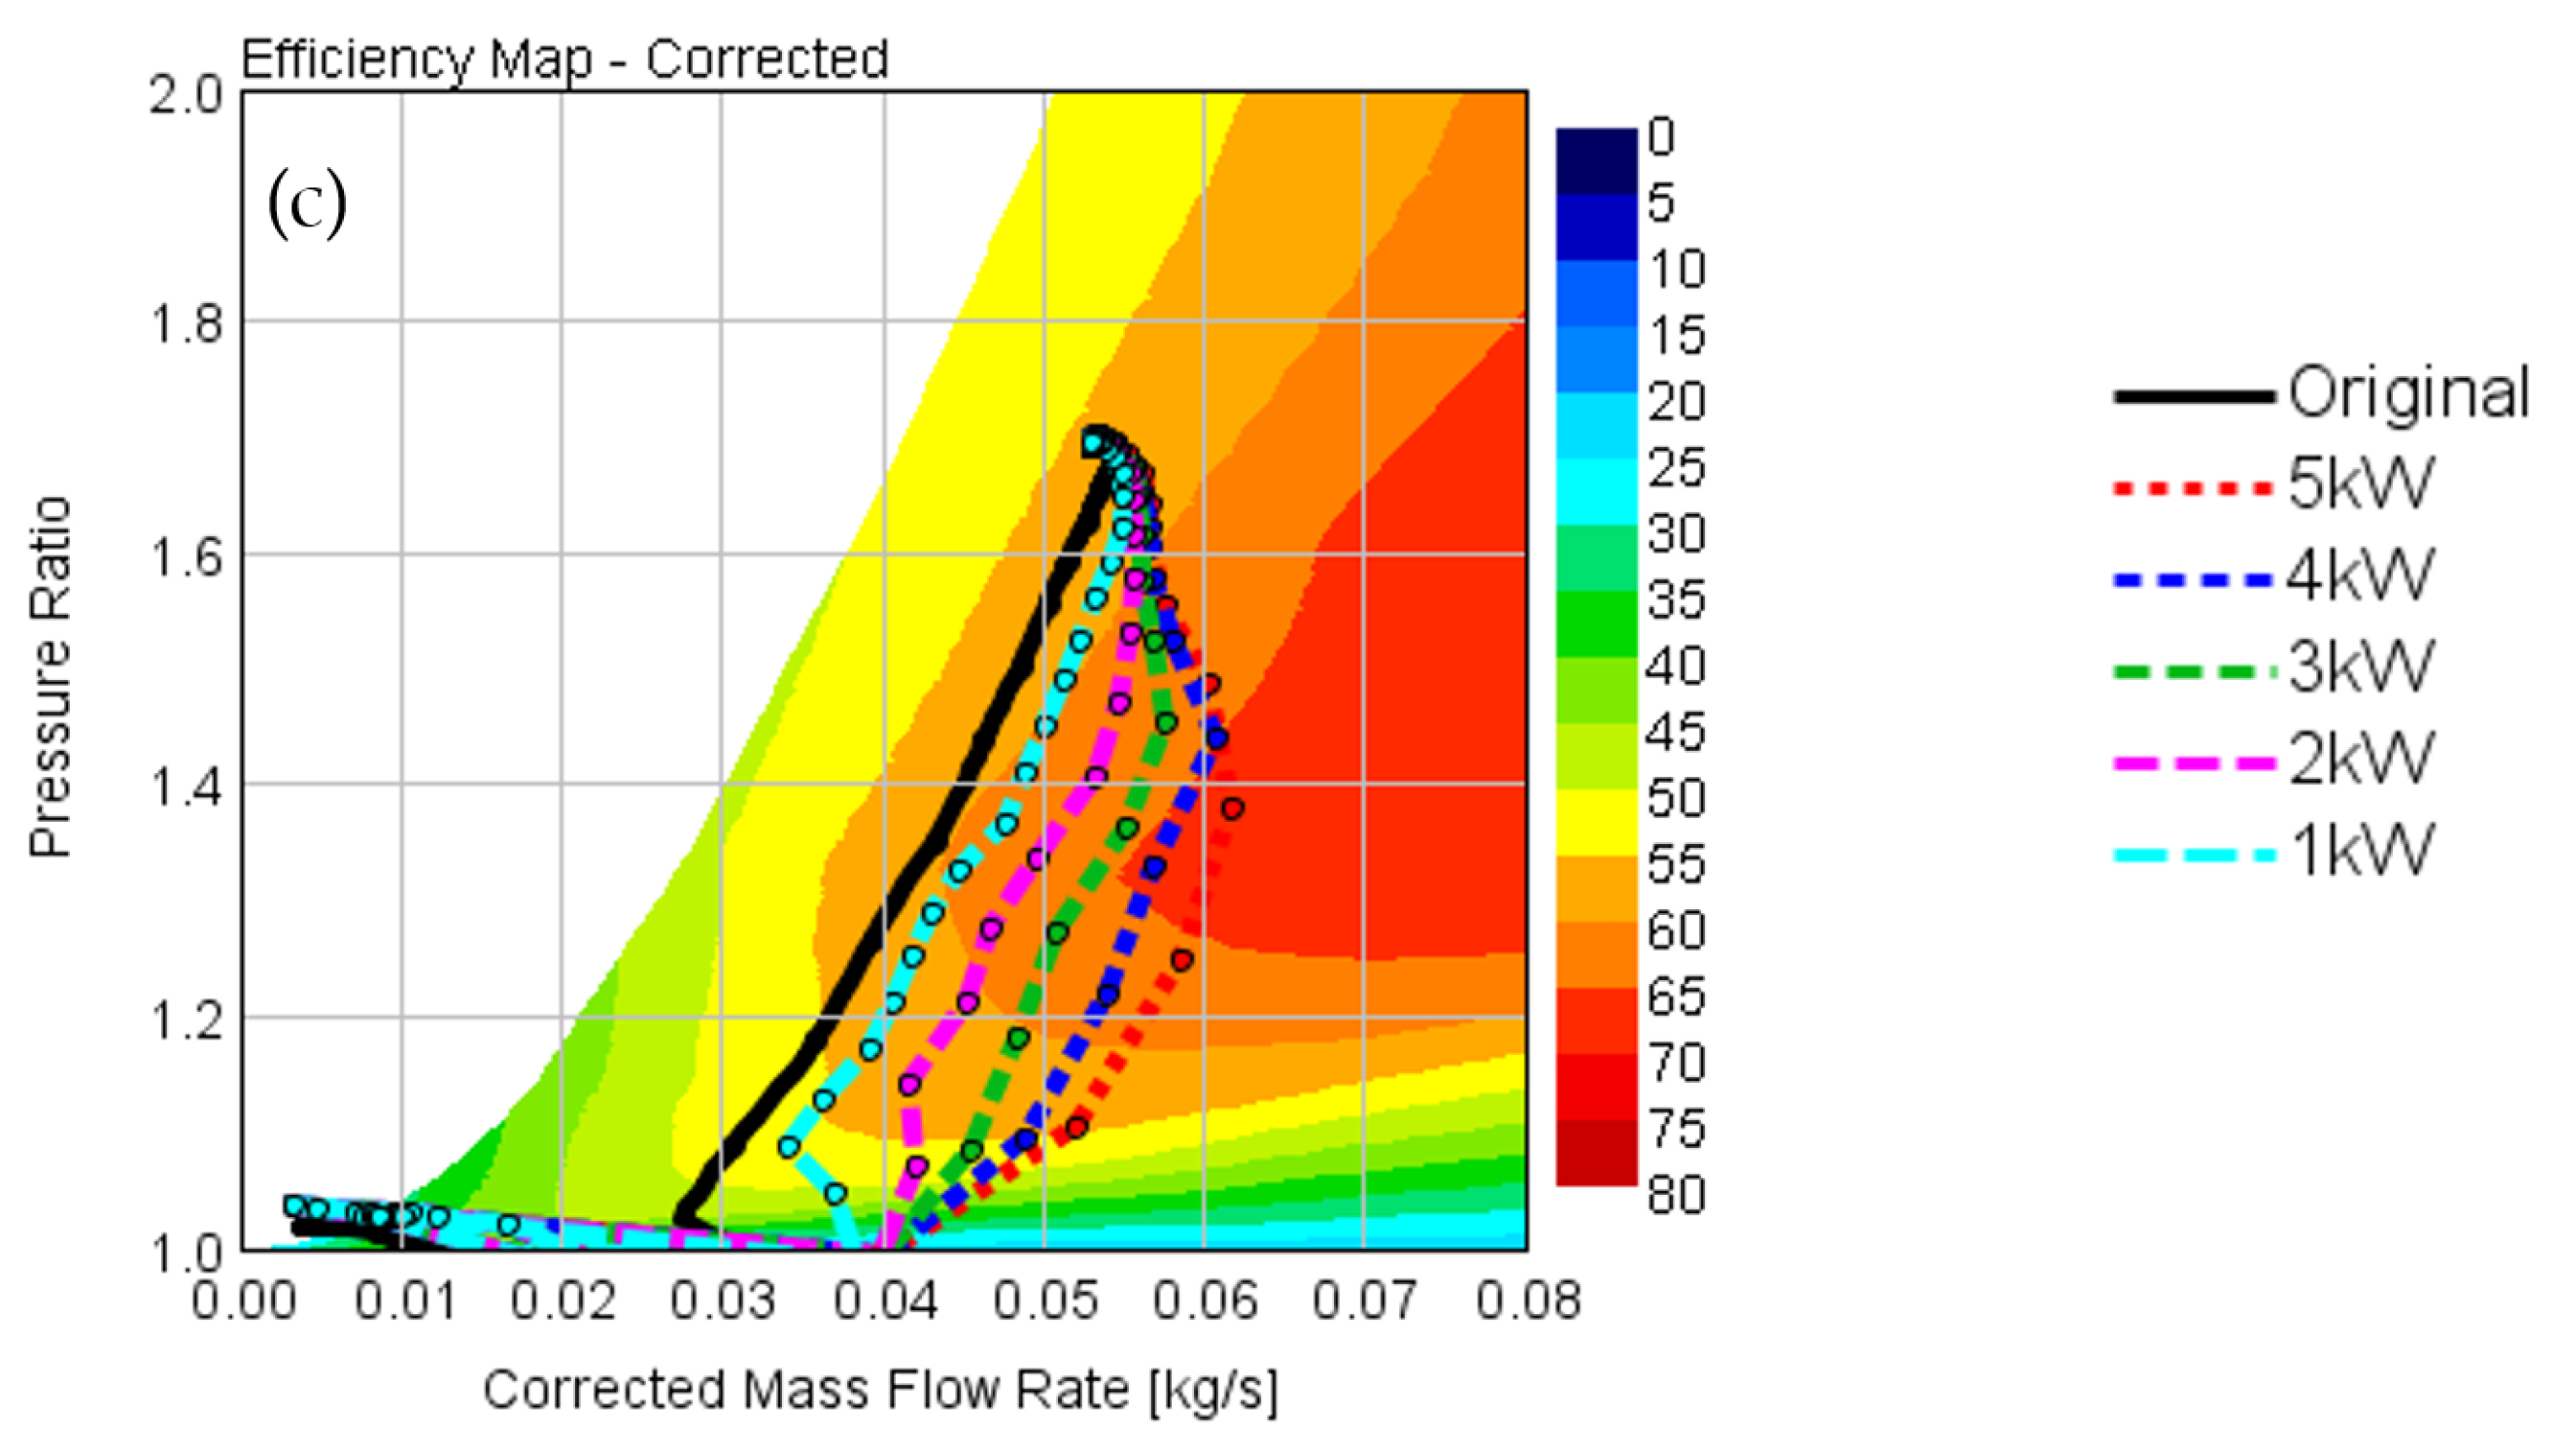
Figure 23.
Load tip-in results at 1600 rpm engine speed: (a) BMEP response time; (b) turbocharger speed response time; (c) compressor performance.
Figure 23.
Load tip-in results at 1600 rpm engine speed: (a) BMEP response time; (b) turbocharger speed response time; (c) compressor performance.
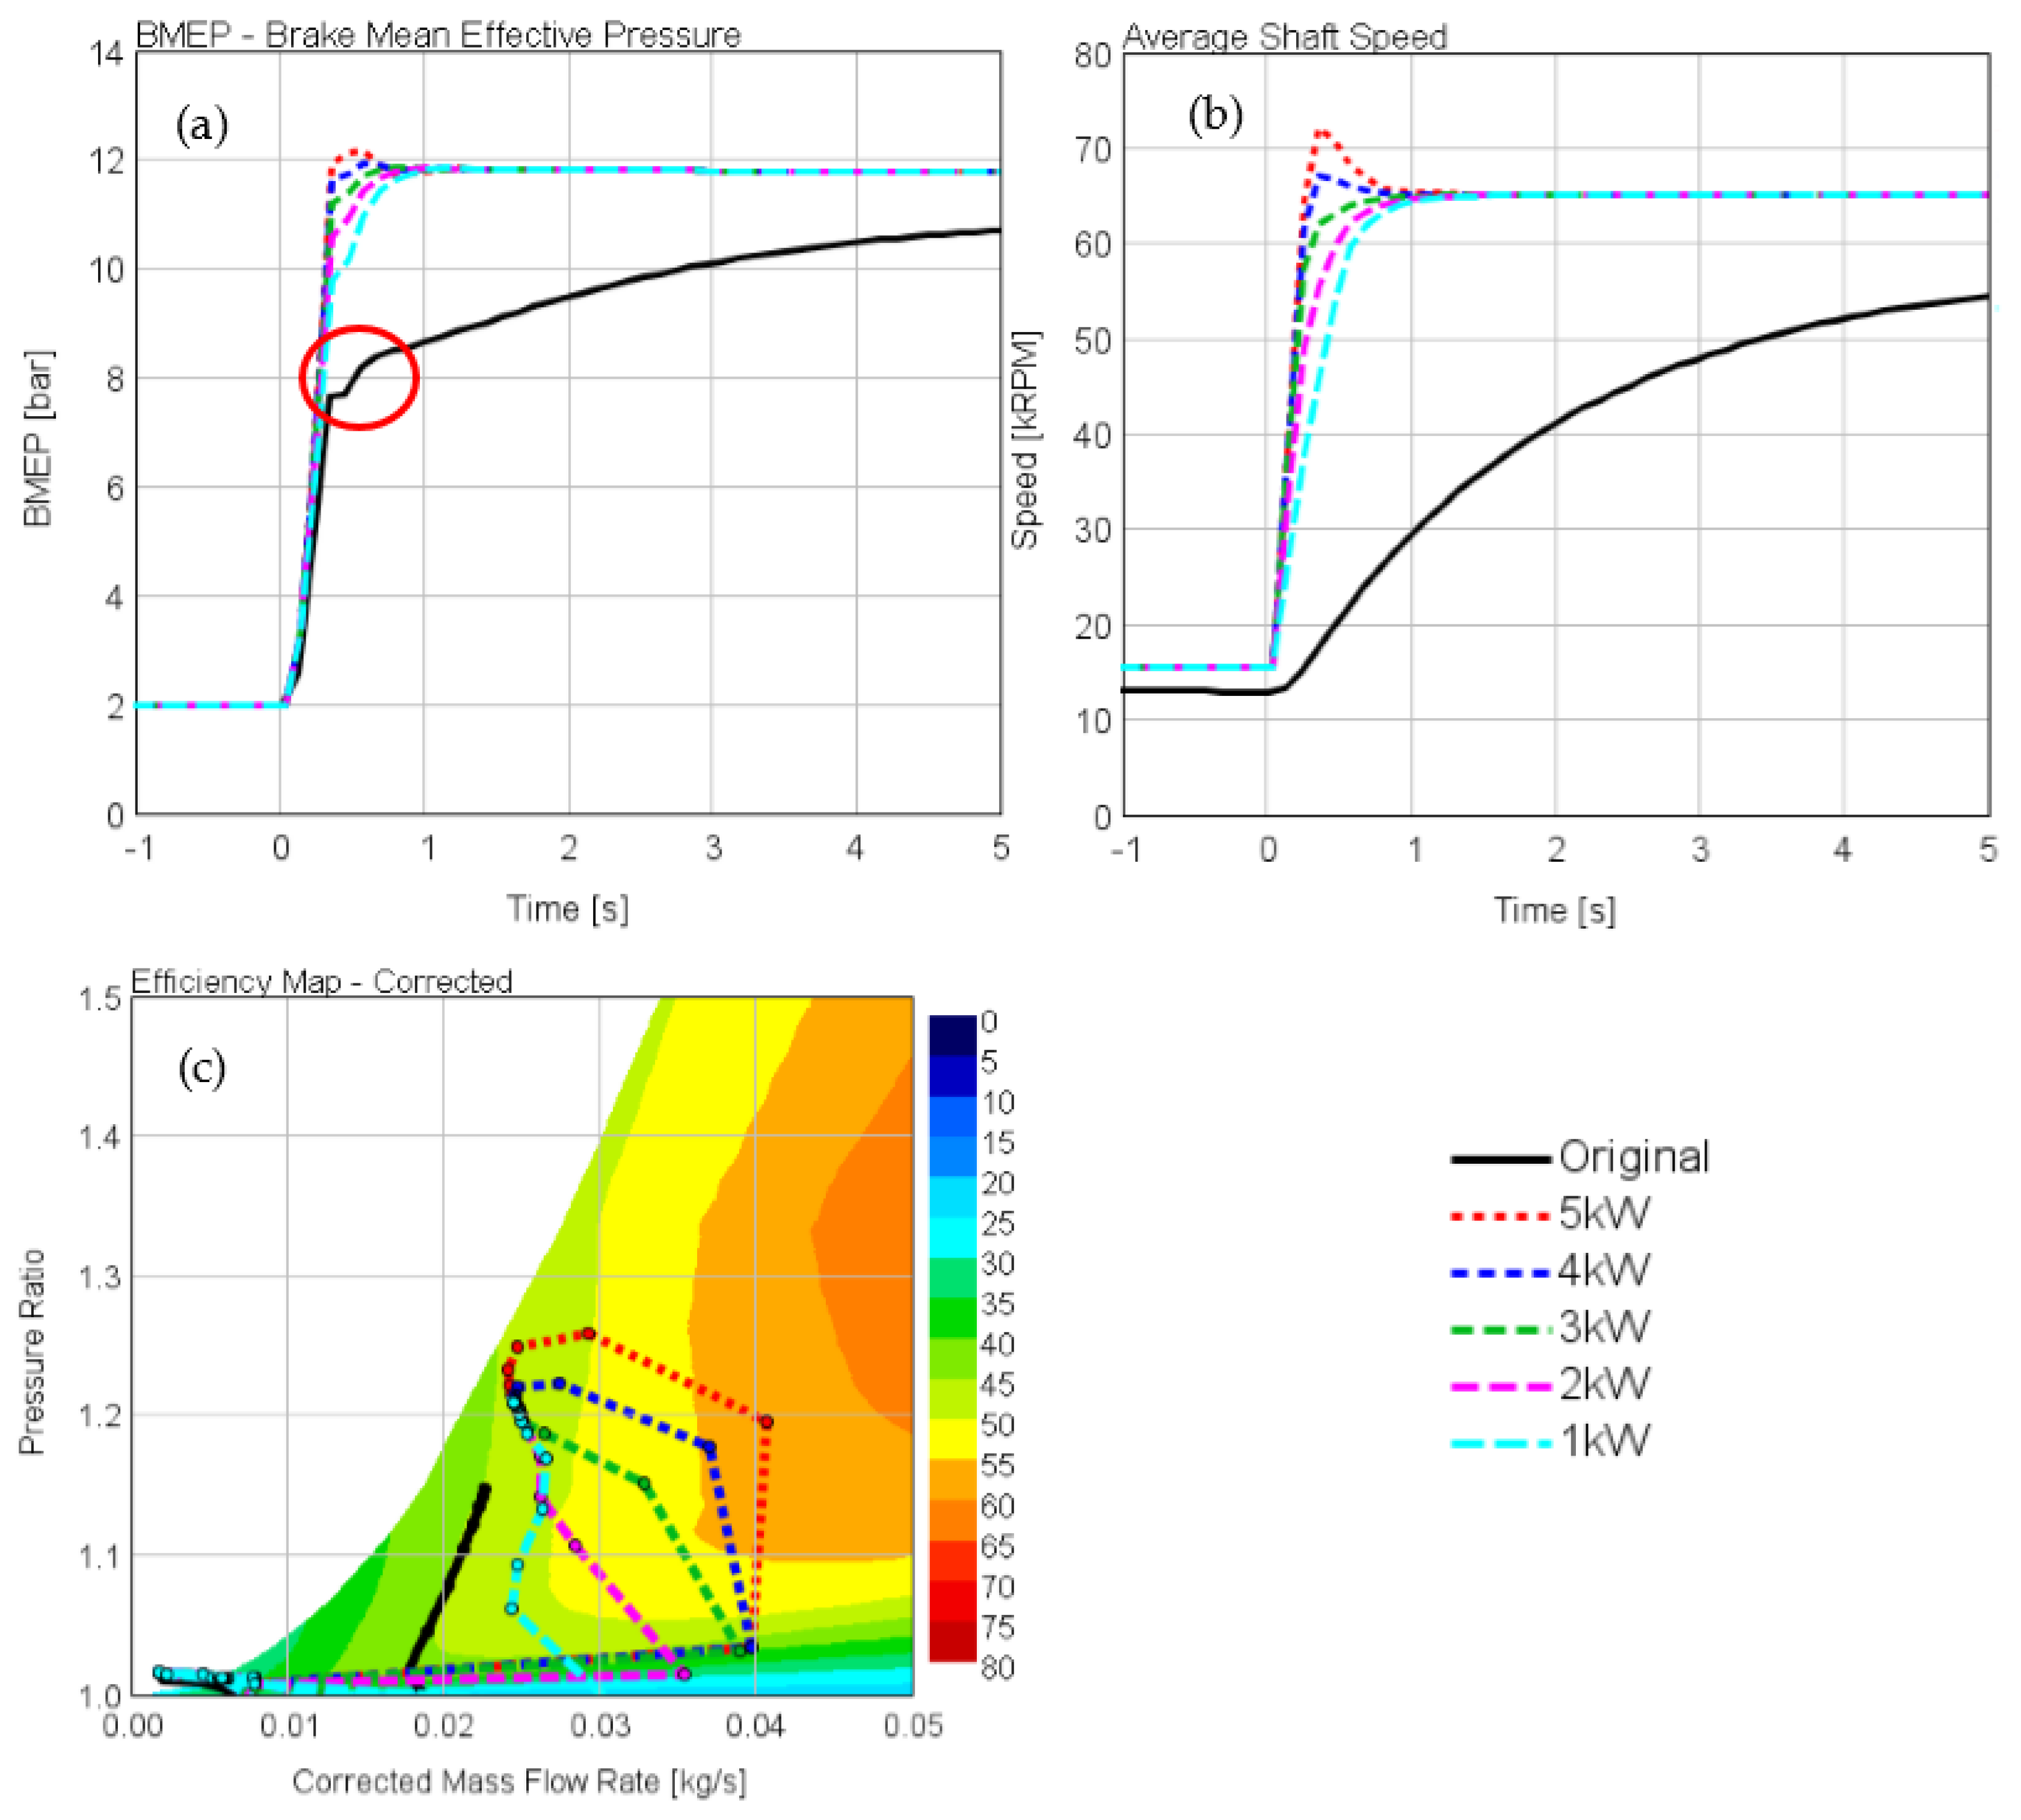
Figure 24.
Load tip-in results at 1100 rpm engine speed; the two peaks highlighted in the red circle are a result of the mass flow rate fluctuation when the throttle valve opens: (a) BMEP response time; (b) turbocharger speed response time; (c) compressor performance.
Figure 24.
Load tip-in results at 1100 rpm engine speed; the two peaks highlighted in the red circle are a result of the mass flow rate fluctuation when the throttle valve opens: (a) BMEP response time; (b) turbocharger speed response time; (c) compressor performance.
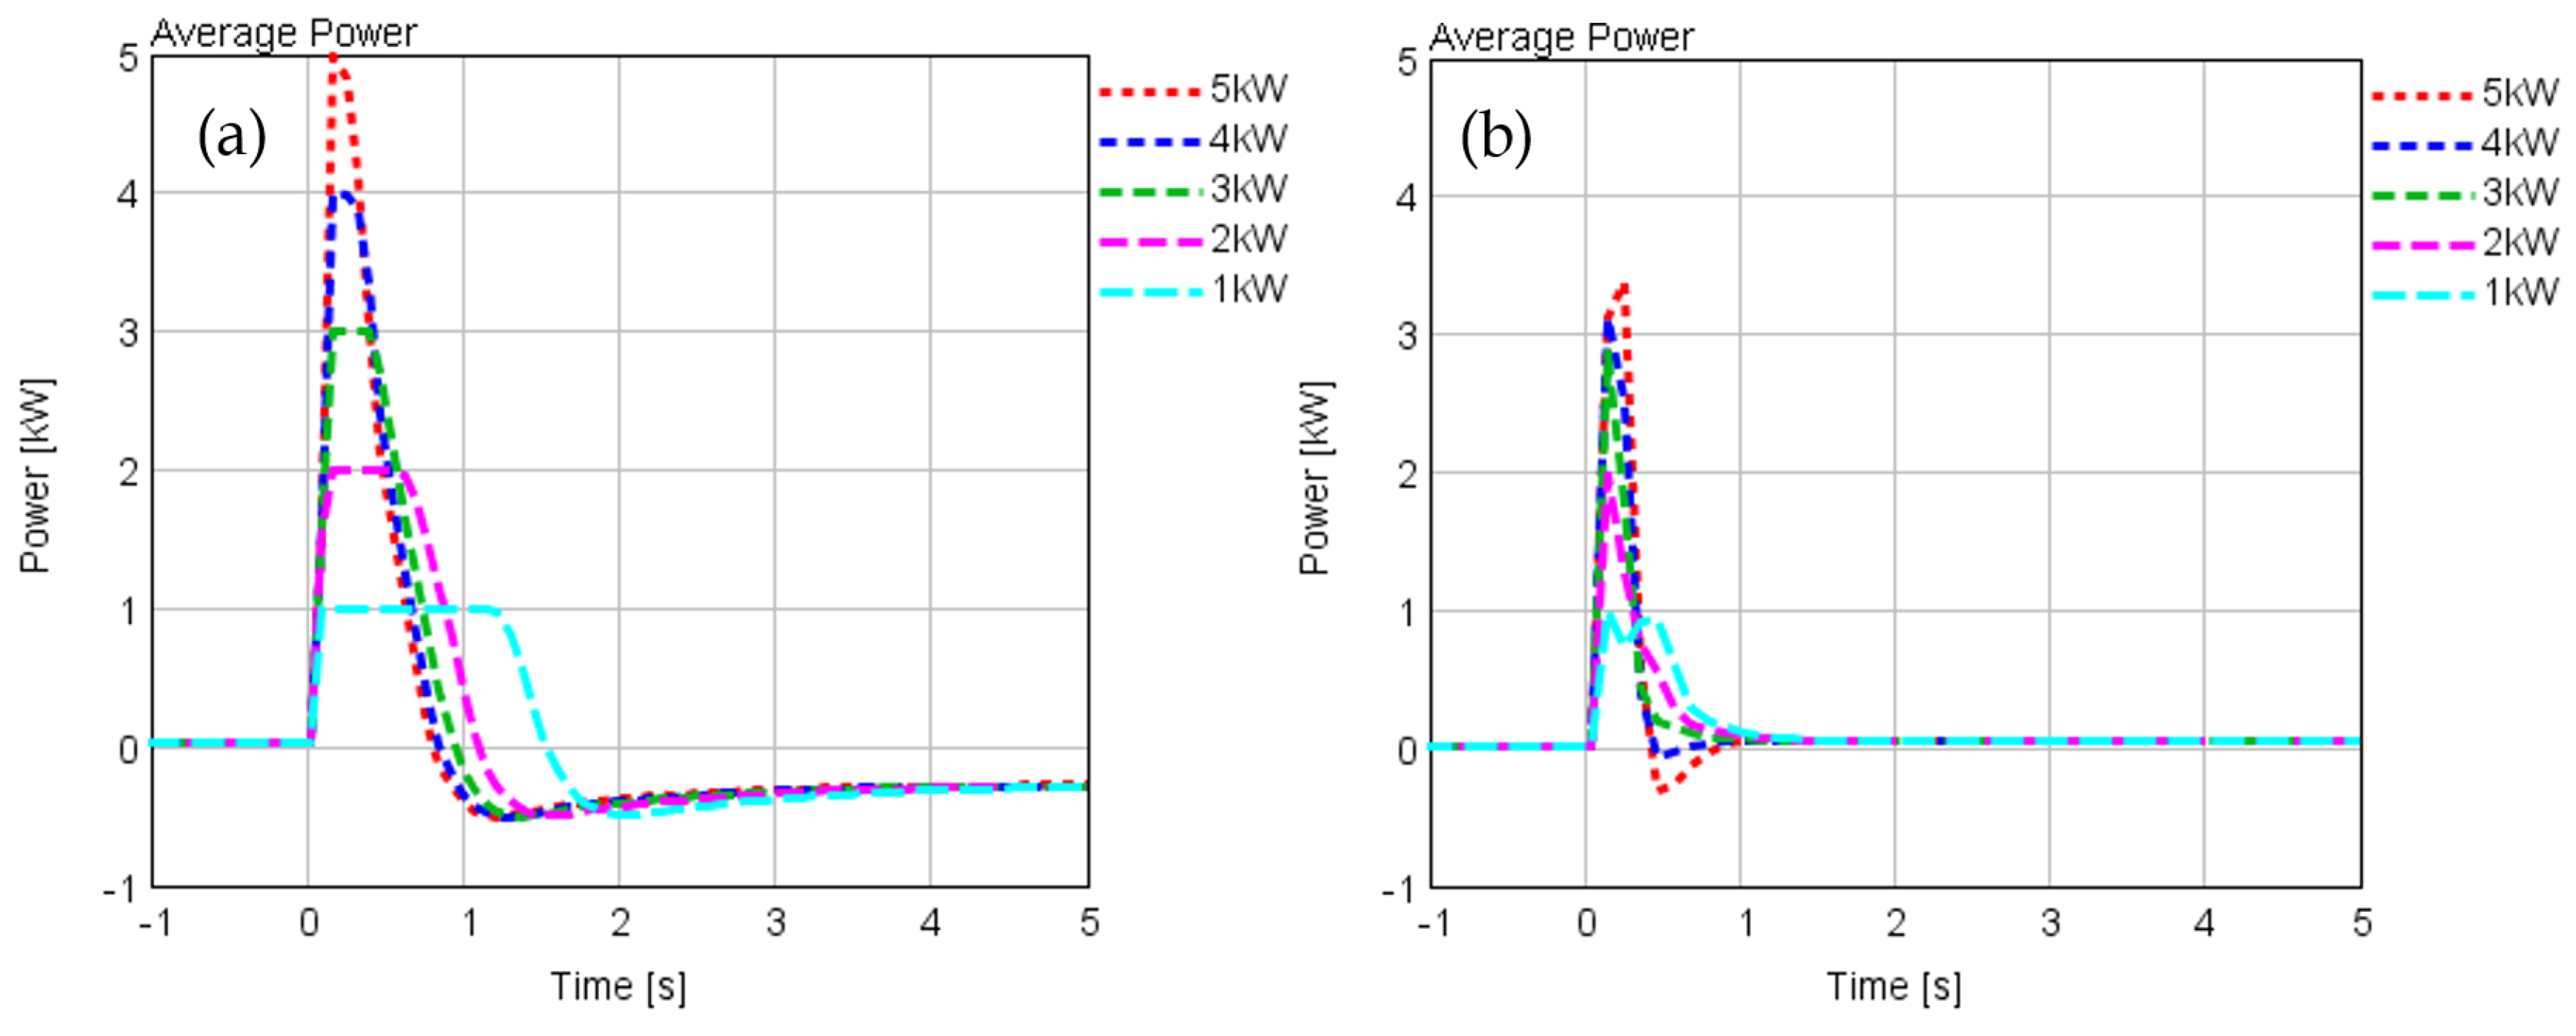
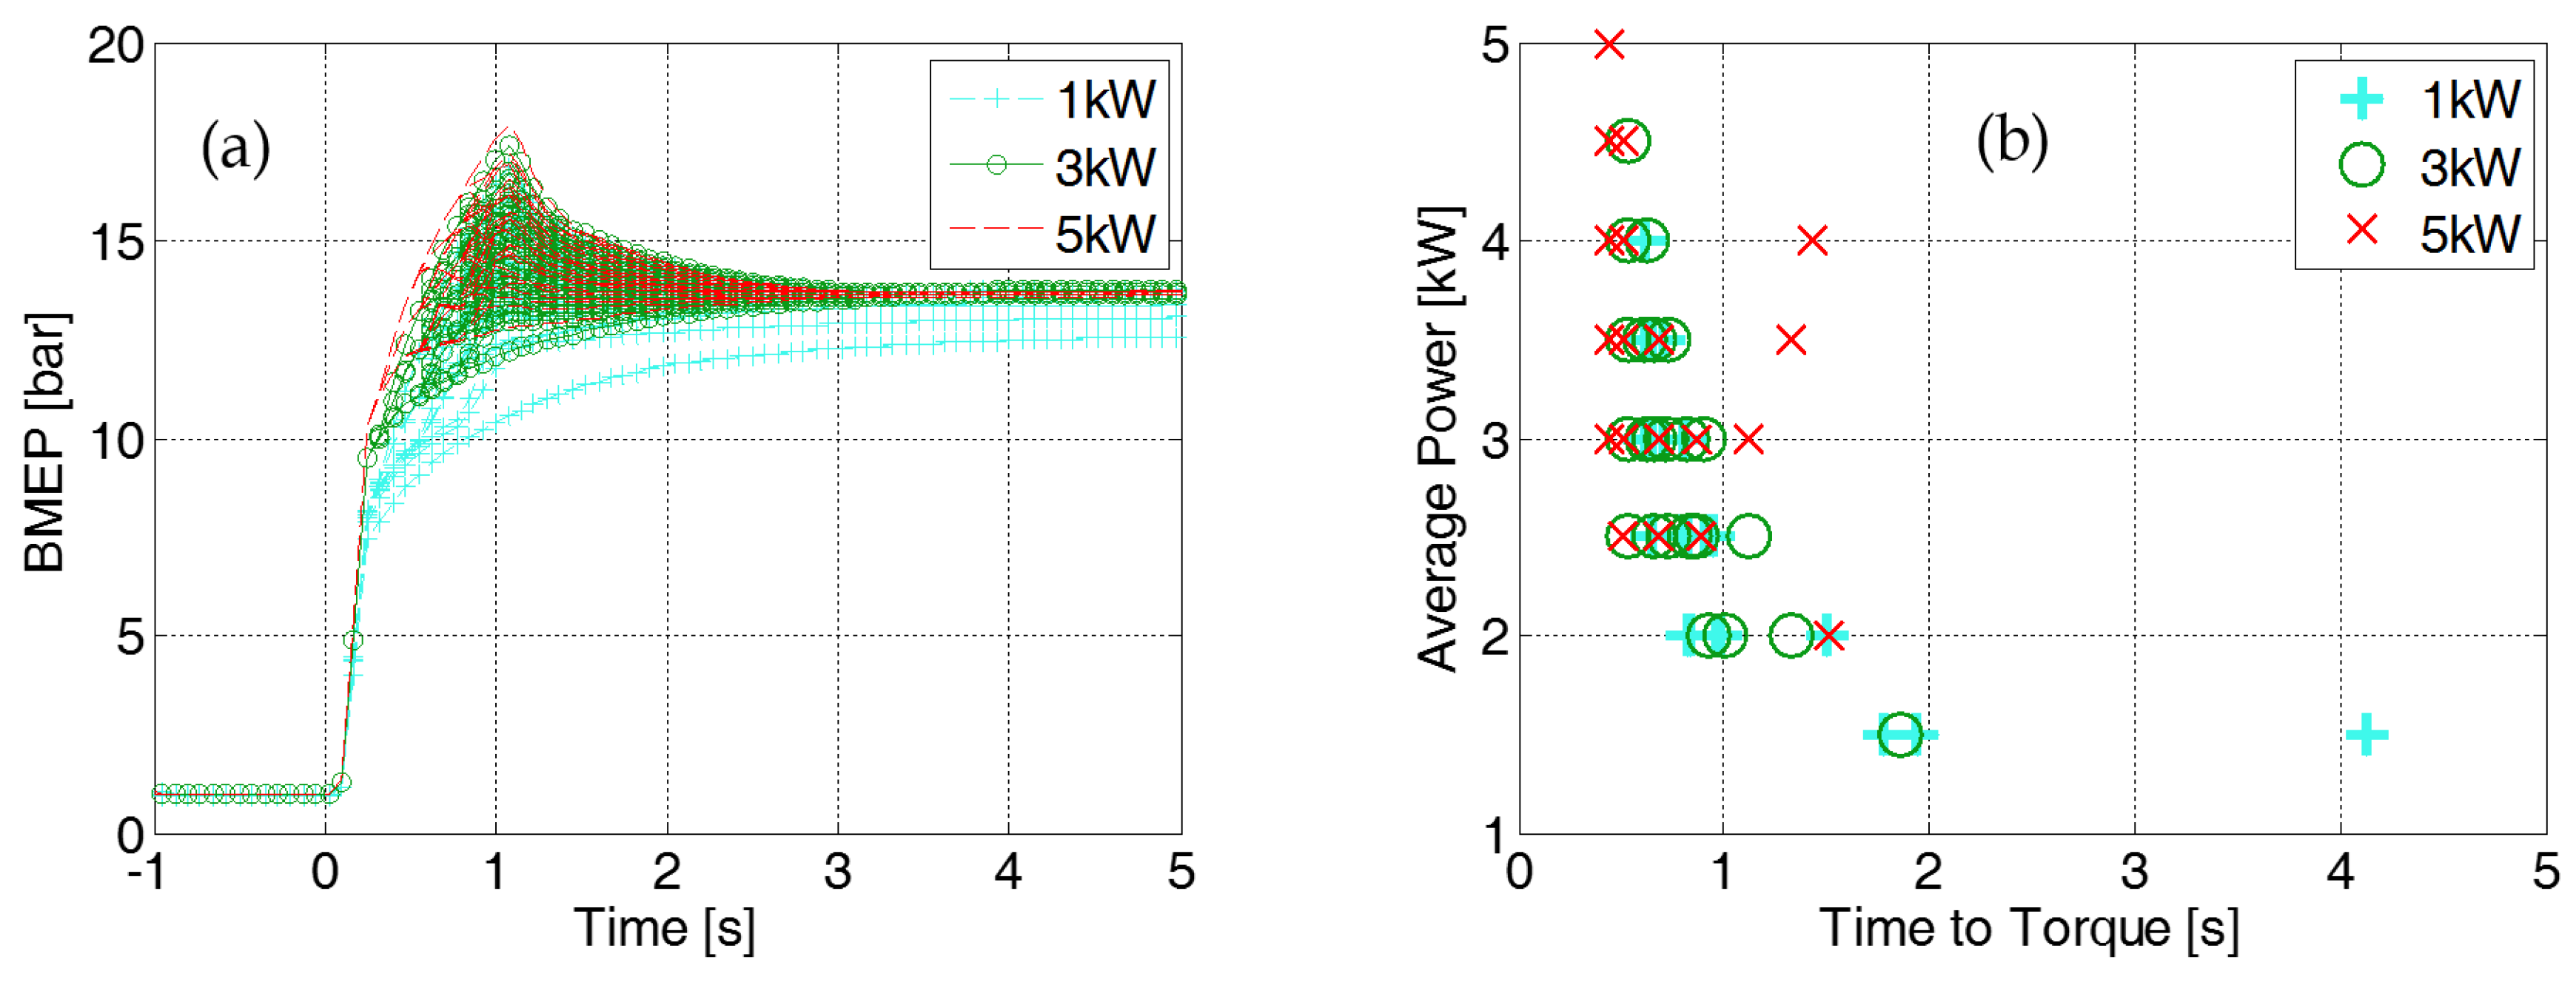
Figure 25.
Open-loop load tip-in results at 1600 rpm engine speed: (a) BMEP vs. time; (b) average power vs. time to torque; colour and symbol categorization indicates the amount of power provided during the first section.
Figure 25.
Open-loop load tip-in results at 1600 rpm engine speed: (a) BMEP vs. time; (b) average power vs. time to torque; colour and symbol categorization indicates the amount of power provided during the first section.
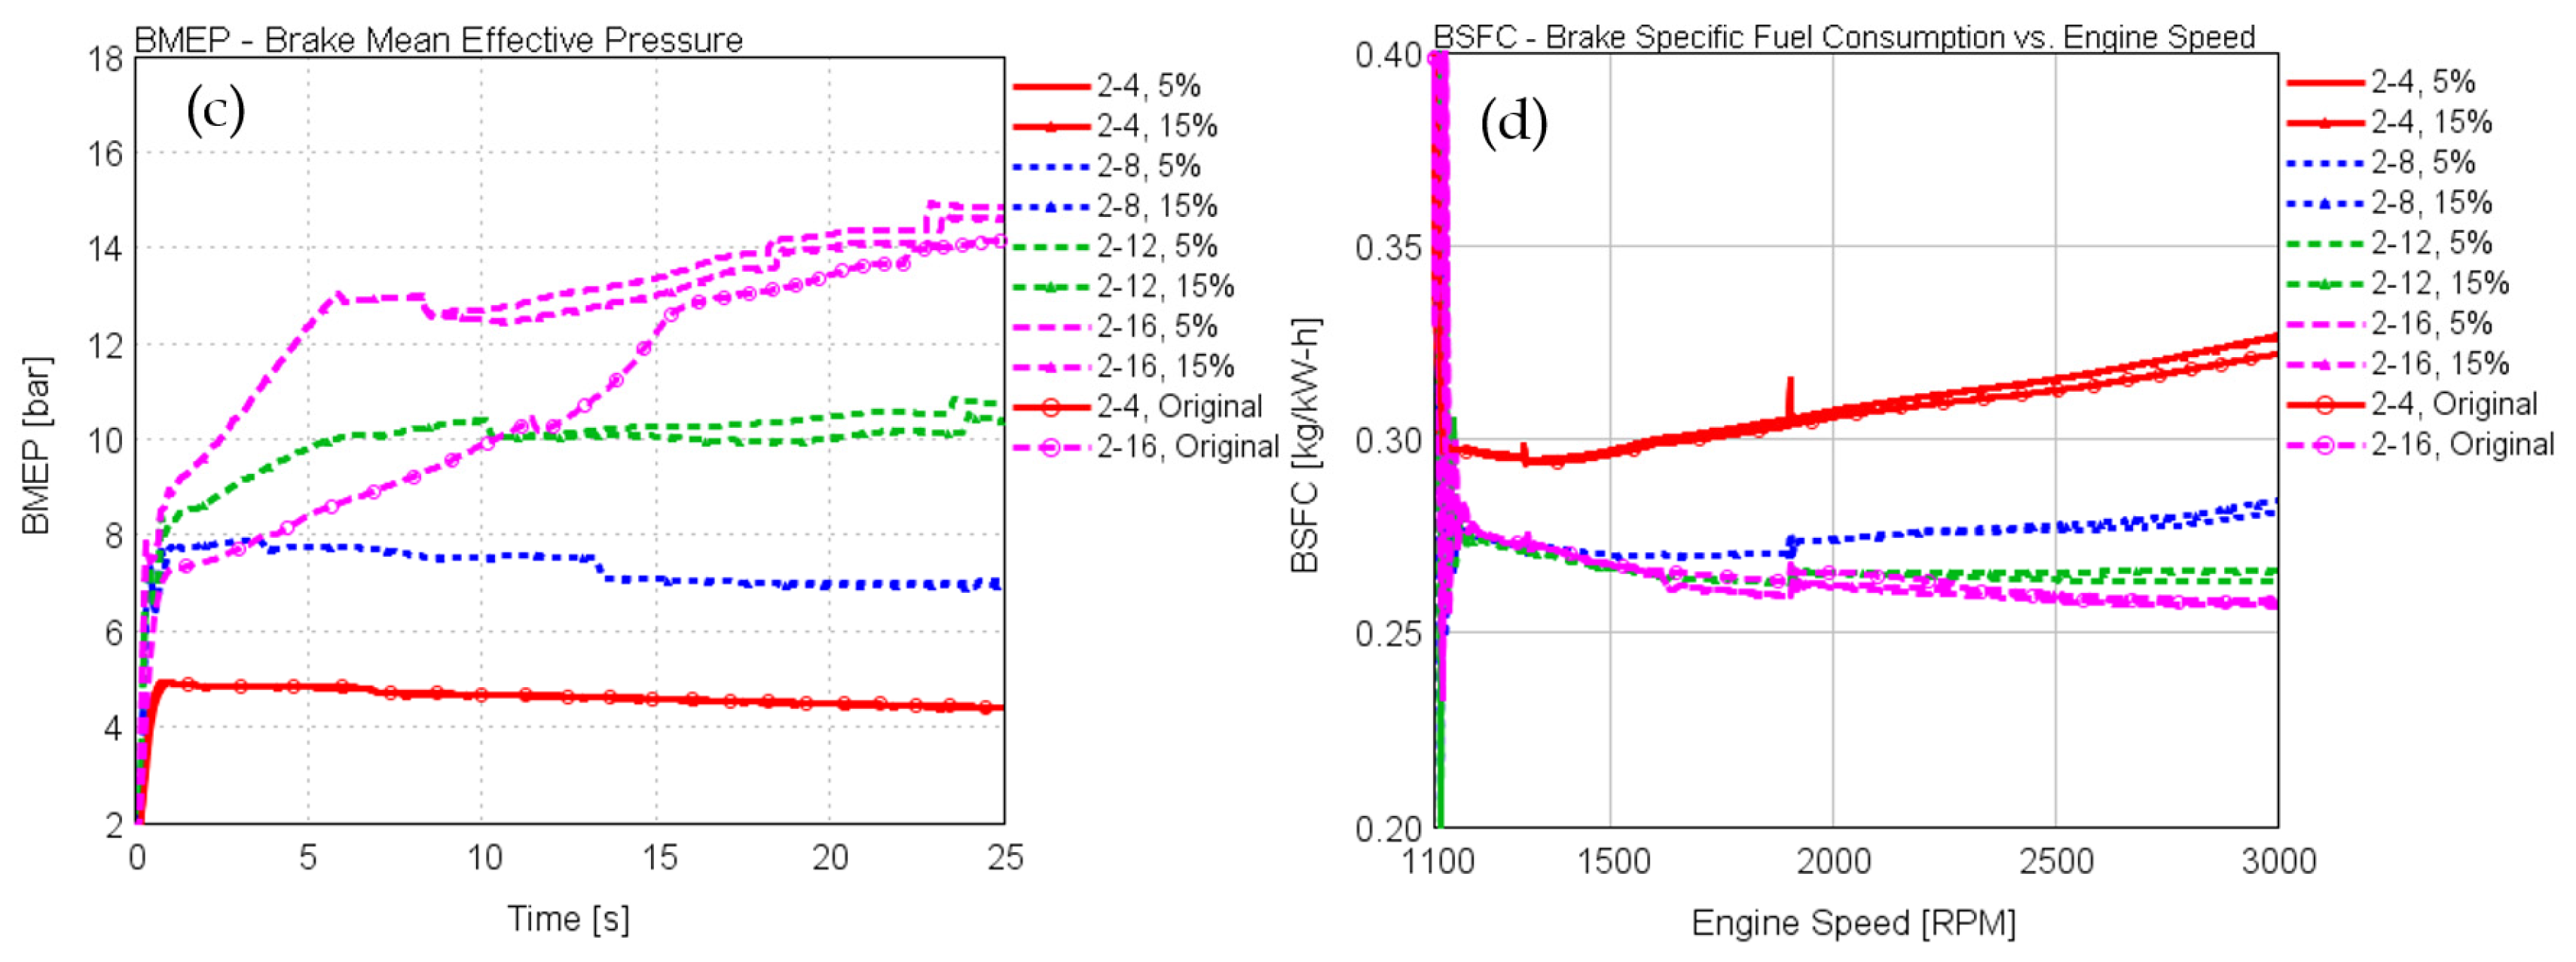
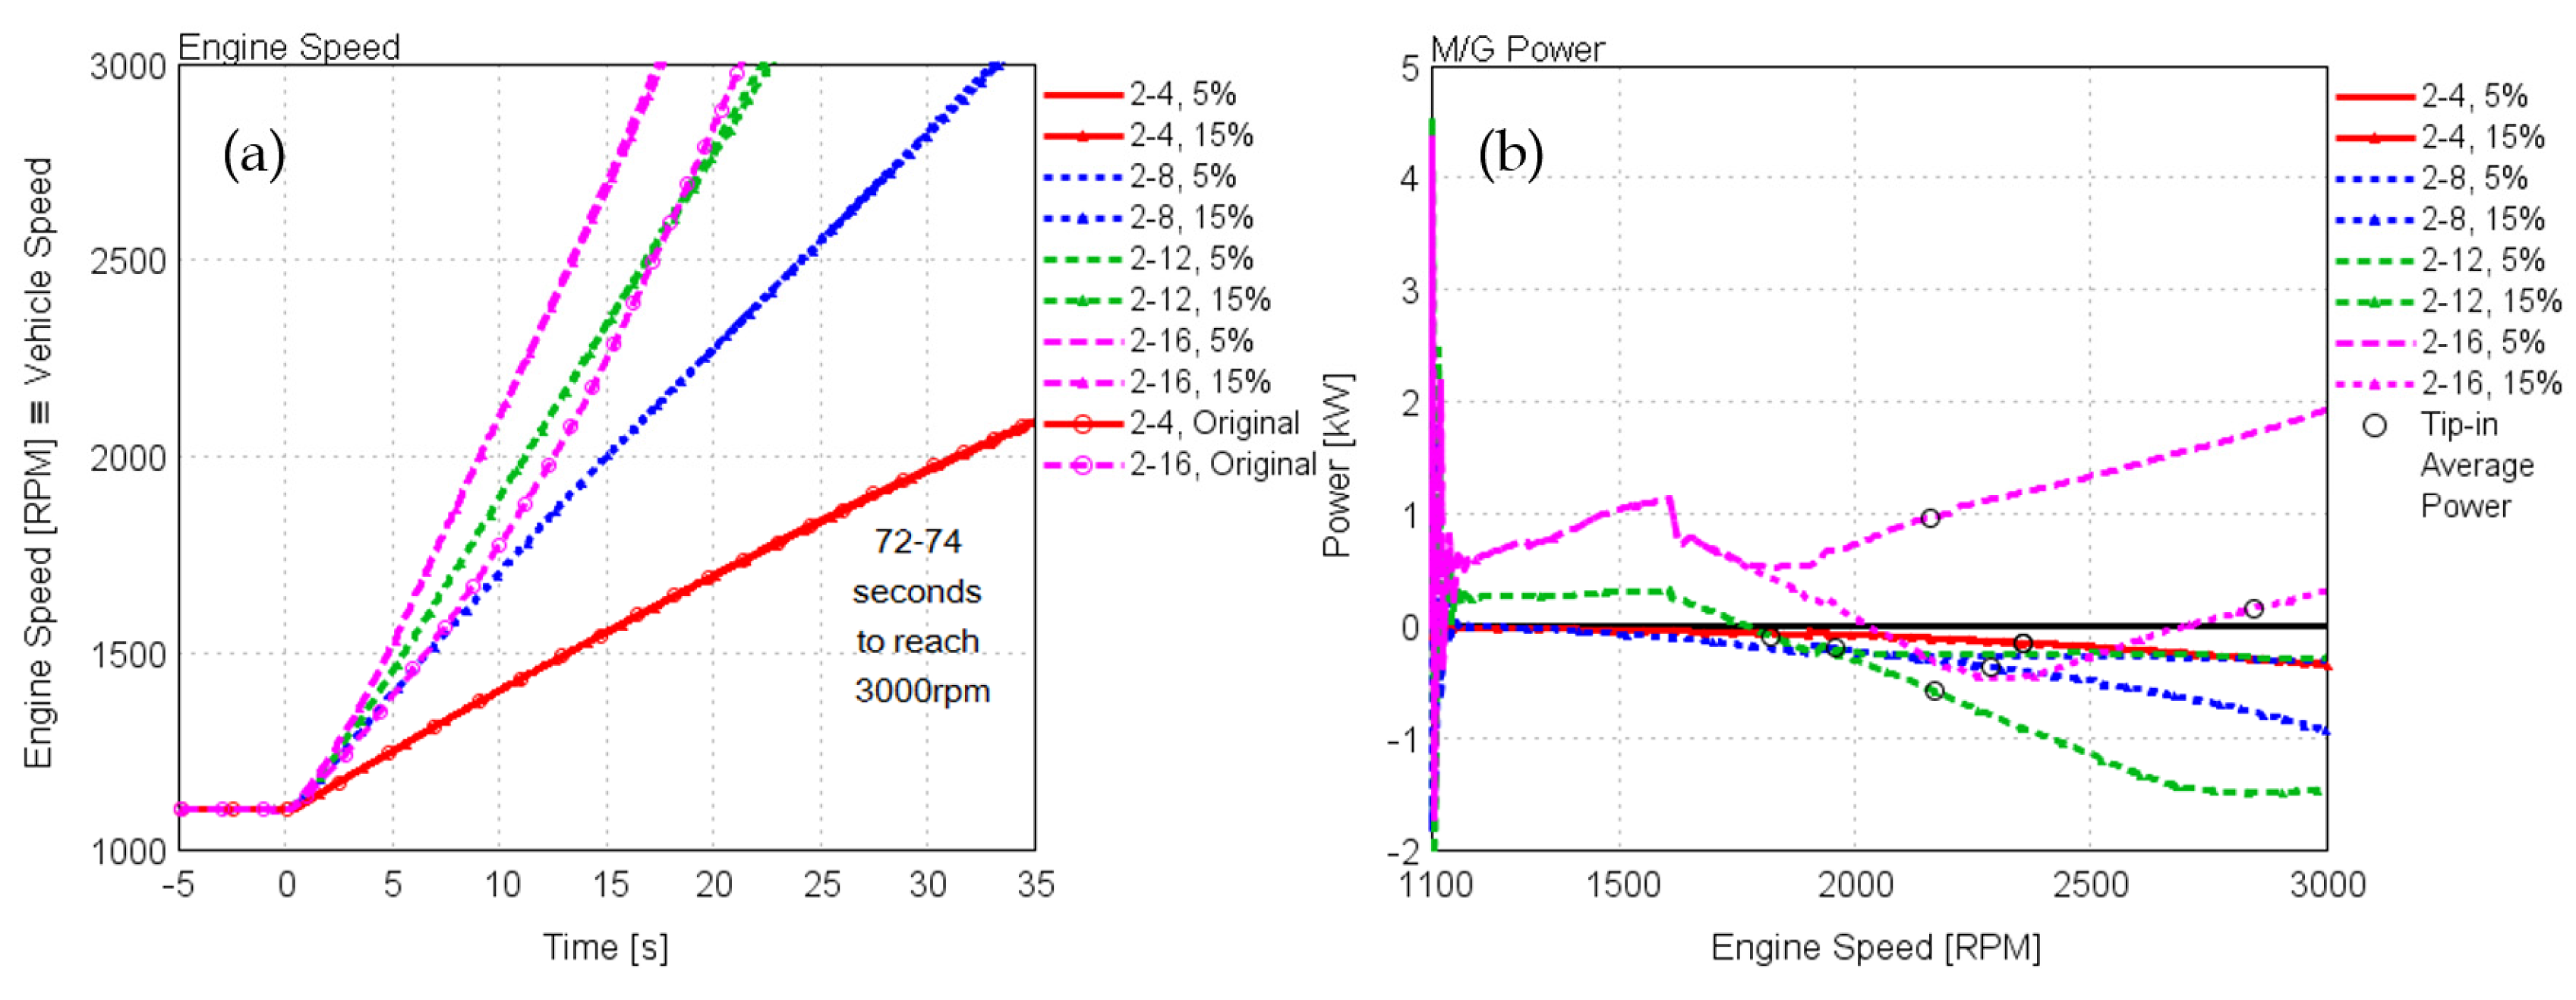
Figure 26.
Fixed gear vehicle speed transient results; % values represent pre-turbine pressure increase compared to the baseline engine: (a) engine speed vs. time; (b) motor-generator power vs. engine speed; (c) BMEP vs. time; (d) Brake-Specific Fuel Consumption (BSFC) vs. engine speed.
Figure 26.
Fixed gear vehicle speed transient results; % values represent pre-turbine pressure increase compared to the baseline engine: (a) engine speed vs. time; (b) motor-generator power vs. engine speed; (c) BMEP vs. time; (d) Brake-Specific Fuel Consumption (BSFC) vs. engine speed.
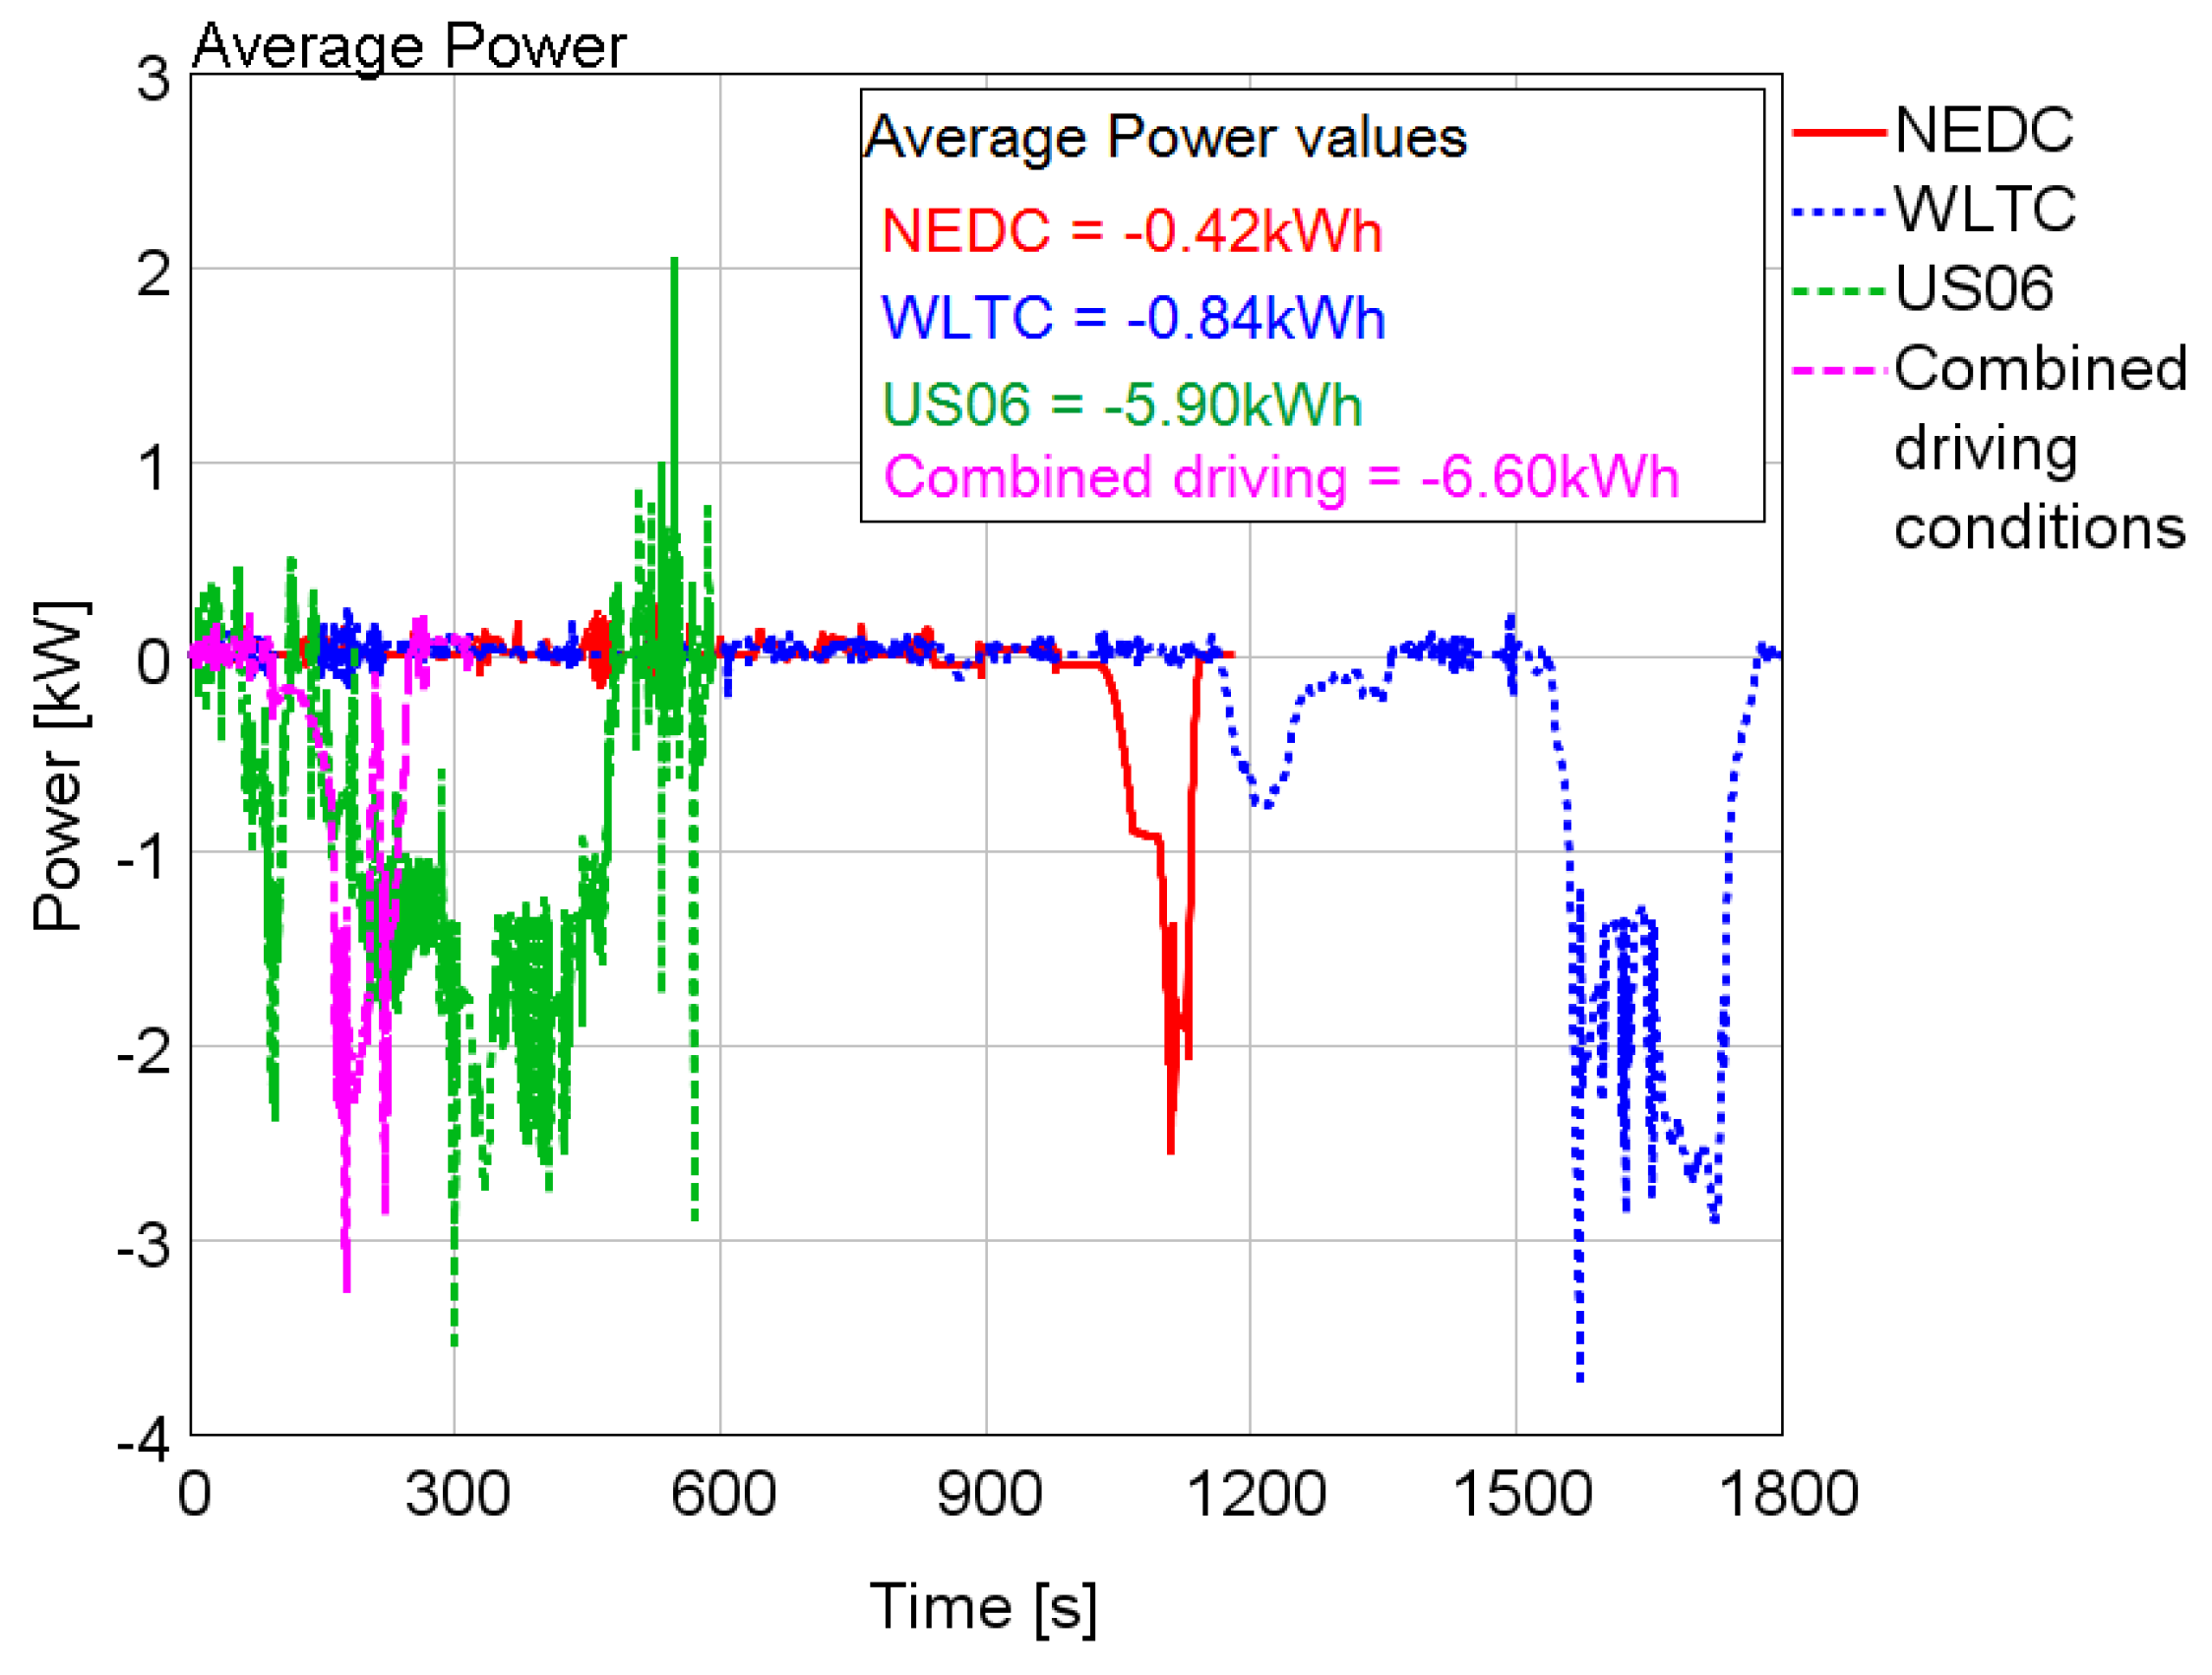
Figure 27.
Average power provided/harvested by the motor-generator; negative values indicate energy harvesting.
Figure 27.
Average power provided/harvested by the motor-generator; negative values indicate energy harvesting.
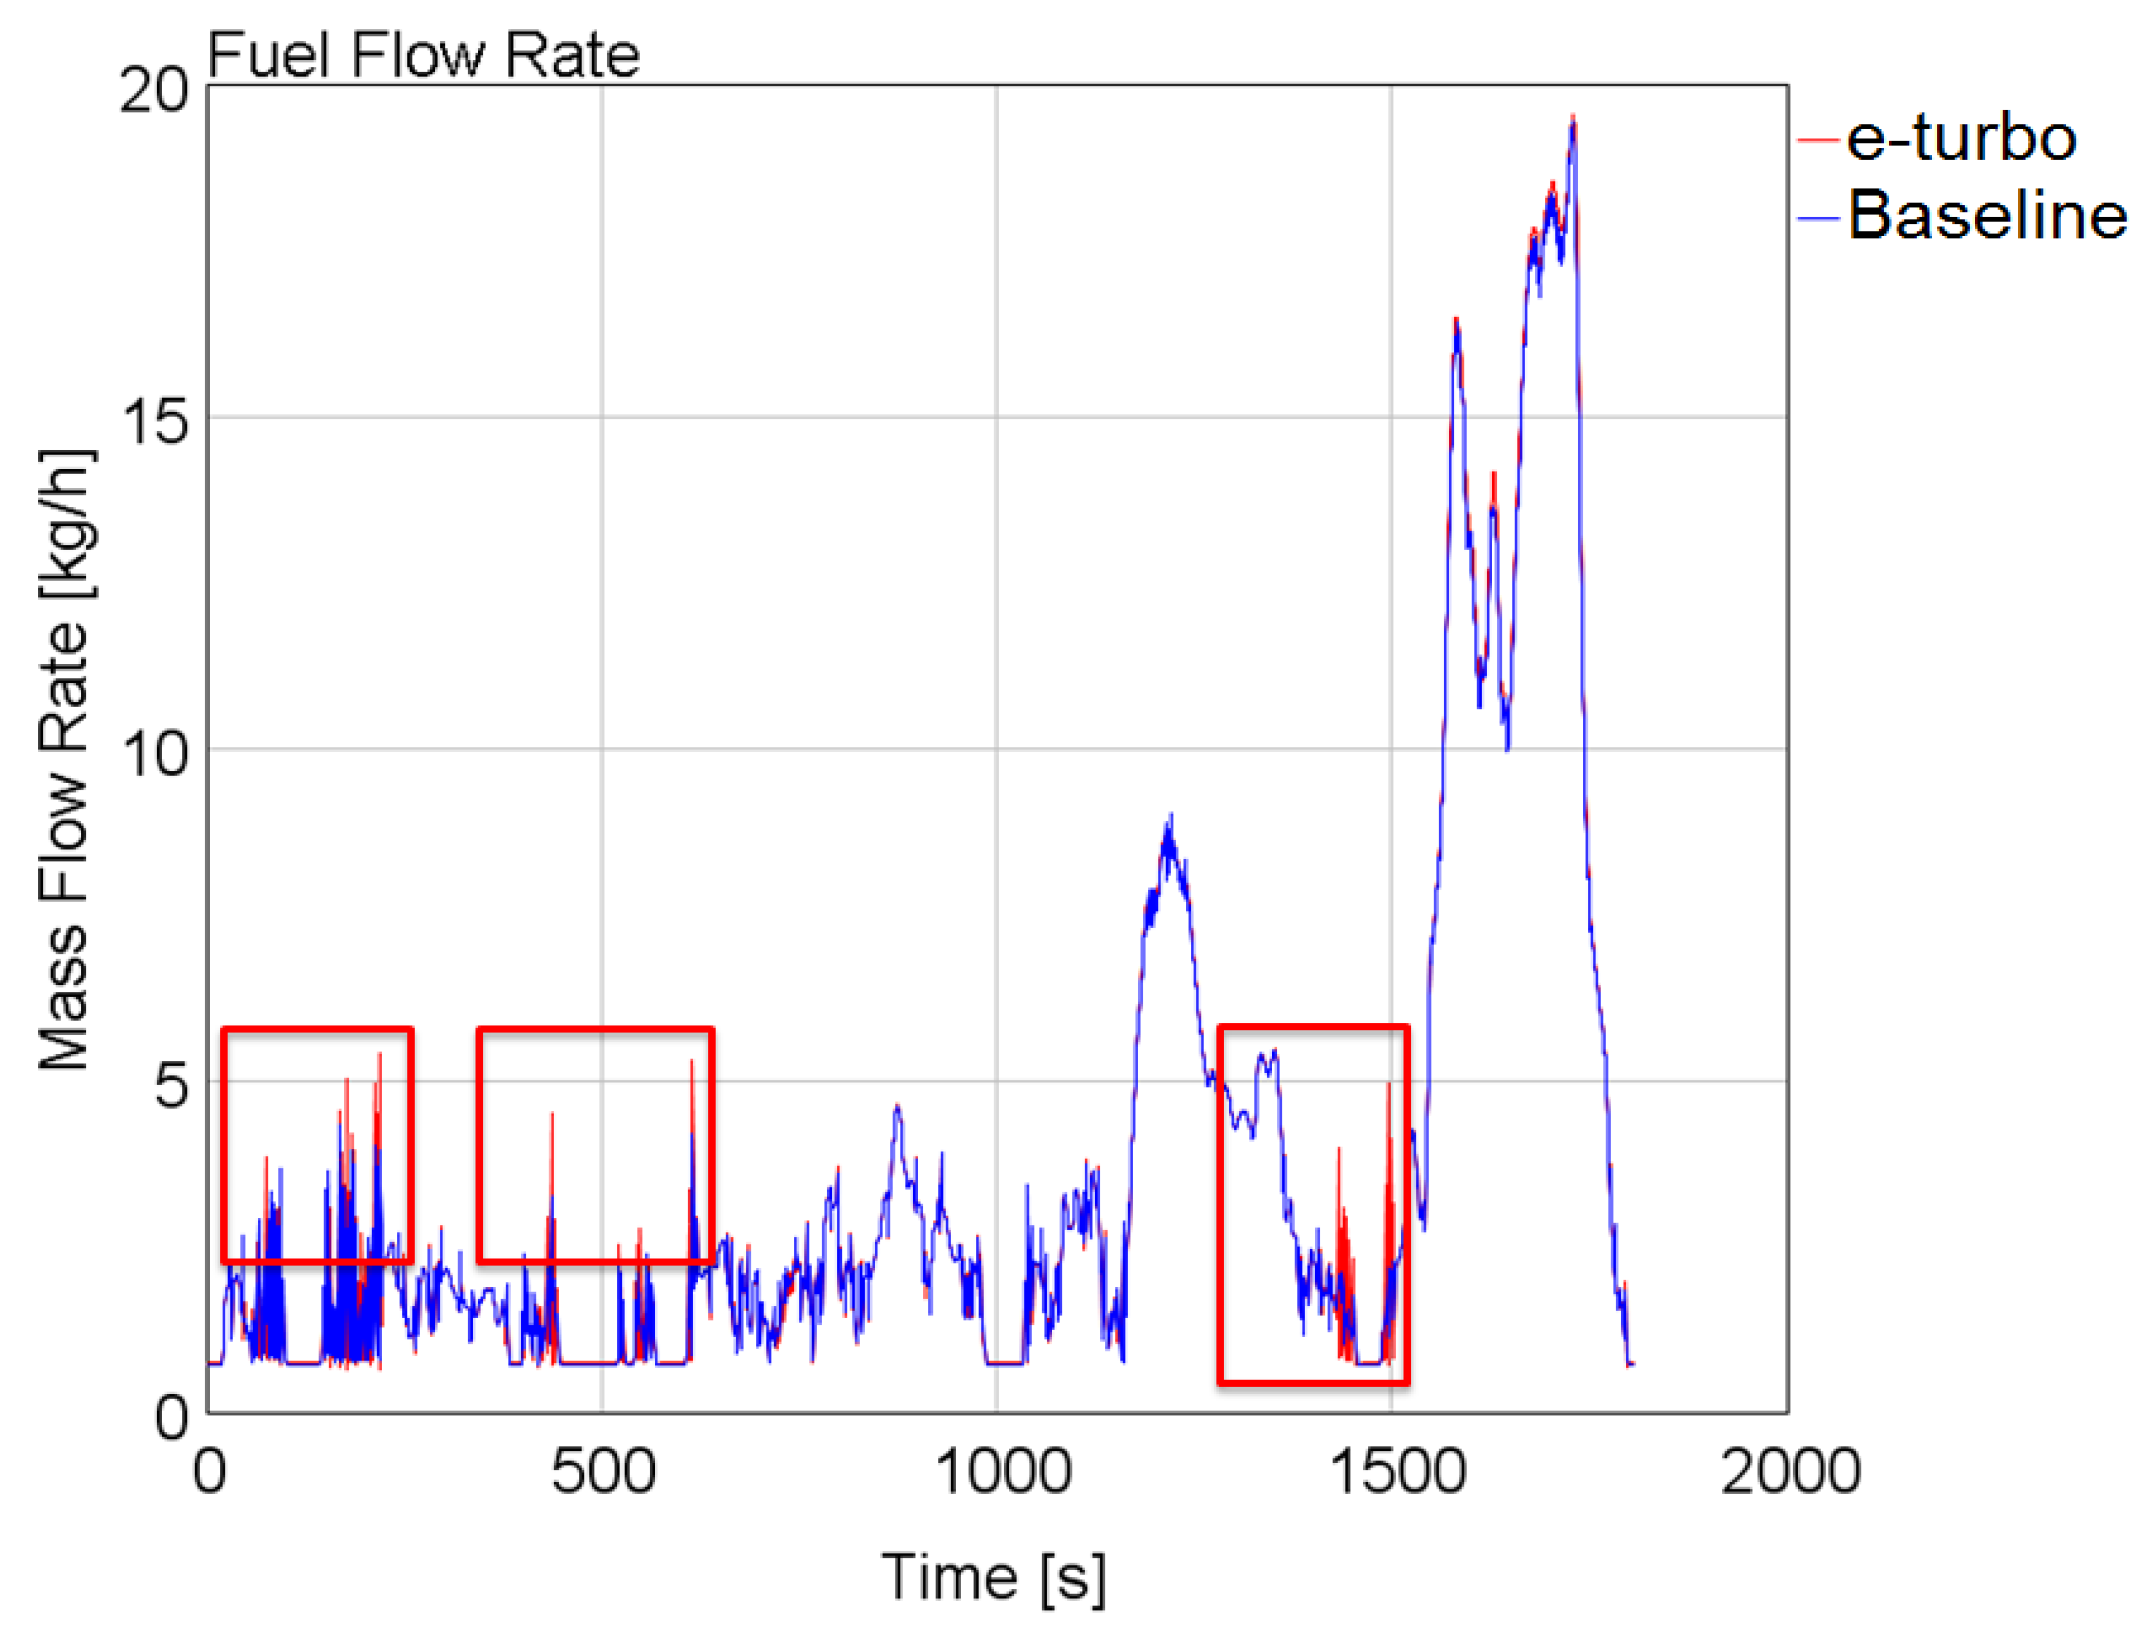
Figure 28.
Fuel flow mass flow rate comparison between e-turbo and baseline model for the WLTC cycle; highlighted area indicates the disturbance of PID tuning on the accuracy of the results.
Figure 28.
Fuel flow mass flow rate comparison between e-turbo and baseline model for the WLTC cycle; highlighted area indicates the disturbance of PID tuning on the accuracy of the results.
Table 1.
Maximum limits set for the parametric studies.
Table 1.
Maximum limits set for the parametric studies.
| Parameter | Unit | Value |
|---|
| Engine torque | (Nm) | 304 |
| Turbine inlet temperature | (°C) | 1000 |
| Turbocharger speed | (krpm) | 200 |
| Pre-turbine pressure | (bar) | 3 |
| Post-compressor temperature | (°C) | 200 |
Table 2.
Measured data and simulation results at full loads. IMEP, indicated mean effective pressure.
Table 2.
Measured data and simulation results at full loads. IMEP, indicated mean effective pressure.
| Attribute Value | Cylinder 1 | Cylinder 2 | Cylinder 3 | Cylinder 4 |
|---|
| Measured total mass air flow (kg/h) | 258.69 |
| Simulated total mass air flow (kg/h) | 263.65 |
| Error in total mass air flow (%) | 1.92 |
| Measured net IMEP (bar) | 20.71 | 21.19 | 20.75 | 18.29 |
| Simulated net IMEP (bar) | 20.44 | 20.76 | 20.30 | 18.02 |
| Absolute error in net IMEP prediction (bar) | 0.39 | 0.43 | 0.45 | 0.27 |
| Error in net IMEP prediction (%) | 1.87 | 2.05 | 2.15 | 1.47 |
| Averaged absolute error in net IMEP (bar) | 0.36 |
| Averaged error in net IMEP (%) | 1.89 |
Table 3.
Summary of combustion model validation at 2000 rpm.
Table 3.
Summary of combustion model validation at 2000 rpm.
| Attribute Value | Low-Load | Medium-Load | Full-Load |
|---|
| Error in total mass air flow prediction (%) | 0.69 | 3.26 | 1.92 |
| Averaged error in net IMEP prediction (bar) (Cylinder 1) | 0.19 | 0.39 | 0.39 |
| Averaged error in net IMEP prediction (%) (Cylinder 1) | 7.39 | 2.56 | 1.87 |
Table 4.
Phase 1: Design of Experiment (DoE) analysis for different compressor and turbine sizes.
Table 4.
Phase 1: Design of Experiment (DoE) analysis for different compressor and turbine sizes.
| Case | Turbine Size Multiplier | Compressor Size Multiplier |
|---|
| 1 | 0.7 | 0.7 |
| 2 | 0.7 | 0.85 |
| 3 | 0.7 | 1 |
| 4 | 0.85 | 0.7 |
| 5 | 0.85 | 0.85 |
| 6 | 0.85 | 1 |
| 7 | 1 | 0.7 |
| 8 | 1 | 0.85 |
| 9 | 1 | 1 |
Table 5.
Control of basic process parameters for the model with proportional-integral-derivative (PID) controllers and the open-loop model. BMEP, brake mean effective pressure; M/G, motor/generator.
Table 5.
Control of basic process parameters for the model with proportional-integral-derivative (PID) controllers and the open-loop model. BMEP, brake mean effective pressure; M/G, motor/generator.
| Process Parameter | Model with PIDs (Control Variables) | Open-Loop Model |
|---|
| M/G Power | - | Provided power profiles |
| Boost pressure | M/G power | Speed/load look-up table |
| Throttle position | Engine speed/BMEP | Speed/load look-up table |
| Pre-turbine pressure | WG position | WG position (PID) |
Table 6.
Phase 3: DoE analysis for different turbine sizes and WG areas.
Table 6.
Phase 3: DoE analysis for different turbine sizes and WG areas.
| Case | Turbine Size Compared to the Original Model | WG Area Compared to the Original Model |
|---|
| Turb1.1–WG/2 | 10% larger | 50% smaller |
| Turb1.1–WG/3 | 10% larger | 67% smaller |
| Turb1.2–WG/2 | 20% larger | 50% smaller |
| Turb1.2–WG/3 | 20% larger | 67% smaller |
Table 7.
Fuel consumption difference between baseline and e-turbo models for various cycles; energy gain = average power values − heat loss (Q) due to increased fuel consumption, Q (kJ) = Calorific value of fuel (CV) (kJ/kg) × fuel (kg), CV of gasoline = 47,300 kJ/kg; * considering the increased fuel consumption.
| Cycle | Difference (g/h) | Difference (%) | Energy Gain * (kWh) |
|---|
| NEDC | −3.7 | −0.12 | +0.37 |
| WLTC | −66.4 | −1.34 | −0.03 |
| US06 | −161.3 | −1.80 | +3.78 |
| Combined driving | −81.8 | −1.26 | +5.52 |


