Article

A Neural Parametric Singing Synthesizer Modeling Timbre and Expression from Natural Songs †

Music Technology Group, Universitat Pompeu Fabra, 08012 Barcelona, Spain
*
Author to whom correspondence should be addressed.
This paper is an extended version of our paper published in Blaauw, M.; Bonada, J. A neural parametric singing synthesizer. In Proceedings of the 18th Annual Conference of the International Speech Communication Association (Interspeech), Stockholm, Sweden, 20–24 August 2017.
These authors contributed equally to this work.
Appl. Sci. 2017, 7(12), 1313; https://doi.org/10.3390/app7121313
Submission received: 3 November 2017 / Revised: 30 November 2017 / Accepted: 12 December 2017 / Published: 18 December 2017
(This article belongs to the Special Issue Sound and Music Computing)

Abstract

:
We recently presented a new model for singing synthesis based on a modified version of the WaveNet architecture. Instead of modeling raw waveform, we model features produced by a parametric vocoder that separates the influence of pitch and timbre. This allows conveniently modifying pitch to match any target melody, facilitates training on more modest dataset sizes, and significantly reduces training and generation times. Nonetheless, compared to modeling waveform directly, ways of effectively handling higher-dimensional outputs, multiple feature streams and regularization become more important with our approach. In this work, we extend our proposed system to include additional components for predicting F0 and phonetic timings from a musical score with lyrics. These expression-related features are learned together with timbrical features from a single set of natural songs. We compare our method to existing statistical parametric, concatenative, and neural network-based approaches using quantitative metrics as well as listening tests.

1. Introduction

Many of today’s more successful singing synthesizers are based on concatenative methods [1,2]. That is, they transform and concatenate short waveform units selected from an inventory of recordings of a singer. While such systems are able to achieve good sound quality and naturalness in certain settings, they tend to be limited in terms of flexibility, and can be difficult to extend or significantly improve upon. One notable limitation is that jointly sampling musical and phonetic contexts usually is not feasible, forcing timbre and expression to be modeled disjointly, from separate, specialized corpora. Machine learning approaches, such as statistical parametric methods [3,4], are much less rigid and do allow for things such as combining data from multiple speakers, model adaptation using small amounts of training data, and joint modeling of timbre and expression from a single corpus of natural songs. However, until recently, these approaches have been unable to match the sound quality of concatenative methods, in particular suffering from oversmoothing in frequency and time.
Recent advances in generative models for Text-to-Speech Synthesis (TTS) using Deep Neural Networks (DNNs), in particular the WaveNet model [5], showed that model-based approaches can achieve sound quality on-par or even beyond that of concatenative systems. This model’s ability to accurately generate raw speech waveform sample-by-sample, clearly shows that oversmoothing is not an issue. Recently, we presented a model for singing synthesis based on the WaveNet model [6], with an important difference being that we model vocoder features rather than raw waveform. While a vocoder unavoidably introduces some degradation in sound quality, we consider the degradation introduced by current models to still be the dominant factor. Thus, if we can improve the quality of the generative model, we should be able to achieve a quality closer to the upper bound the vocoder can provide, i.e., round-trip vocoder analysis-synthesis without modification. Additionally, by decomposing the signal into phonetic and pitch components, we are able to conveniently synthesize any melody with any lyrics, and require less training data to sufficiently cover the entire pitch-timbre space.
Our previously presented system only generated timbrical features, and did not generate features related to musical expression, such as F0 and phonetic timings. Additionally, the corpora used to train the models were specialized recordings similar to those used for building concatenative voices. In this work, we extend our previously presented system to also include F0 and phonetic timing prediction, and train the entire system from a single corpus of natural singing. We feel that this is an important step forward towards capturing all aspects of a singer’s voice in a natural setting. Finally, we provide detailed quantitative and qualitative experiments and results.

2. Proposed System

2.1. Overview

The task of singing synthesis mimics the task of a singer during a studio recording, that is, interpret a musical score with lyrics to produce a singing waveform signal. The goal of our system is to model a specific singer’s voice and a specific style of singing. To achieve this, we first record a singer singing a set of musical scores. From these recording, acoustic features are extracted using the analysis part of a vocoder. Additionally, the recordings are phonetically transcribed and segmented. Note level transcription and segmentation can be generally obtained from the musical scores, as long as the singer did not excessively deviate from the written score.
During training, our model learns to produce acoustic features given phonetic and musical input sequences, including the begin and end time of each segment. However, during generation, we only have access to the note begin and end times, and phoneme sequence corresponding to each note (generally a syllable). As we do not have access to the begin and end times of each phoneme, these must be predicted using a phonetic timing model. The next step is to predict F0 from the timed musical and phonetic information, using a pitch model. The predicted phonetic timings and F0 are then used by the timbre model to generate the remaining acoustic features such as the harmonic spectral envelope, aperiodicity envelope and voiced/unvoiced (V/UV) decision. Finally, the synthesis part of the vocoder is used to generate the waveform signal from the acoustic features. An overview of the entire system is depicted in Figure 1.

2.2. Modified WaveNet Architecture

The main building block of our system is based on the WaveNet model and architecture. A key aspect of this model is that it is autoregressive. That is, the prediction at each timestep depends on (a window of) predictions of past timesteps. In our case, a timestep corresponds to a single frame of acoustic features. Additionally, the model is probabilistic, meaning that the prediction is a probability distribution rather than a single value. In order to control the prediction, e.g., by phonetic and musical inputs, the predicted distribution is not only conditioned on past predictions, but also on control inputs. This model is implemented using a powerful, yet efficient neural network architecture.
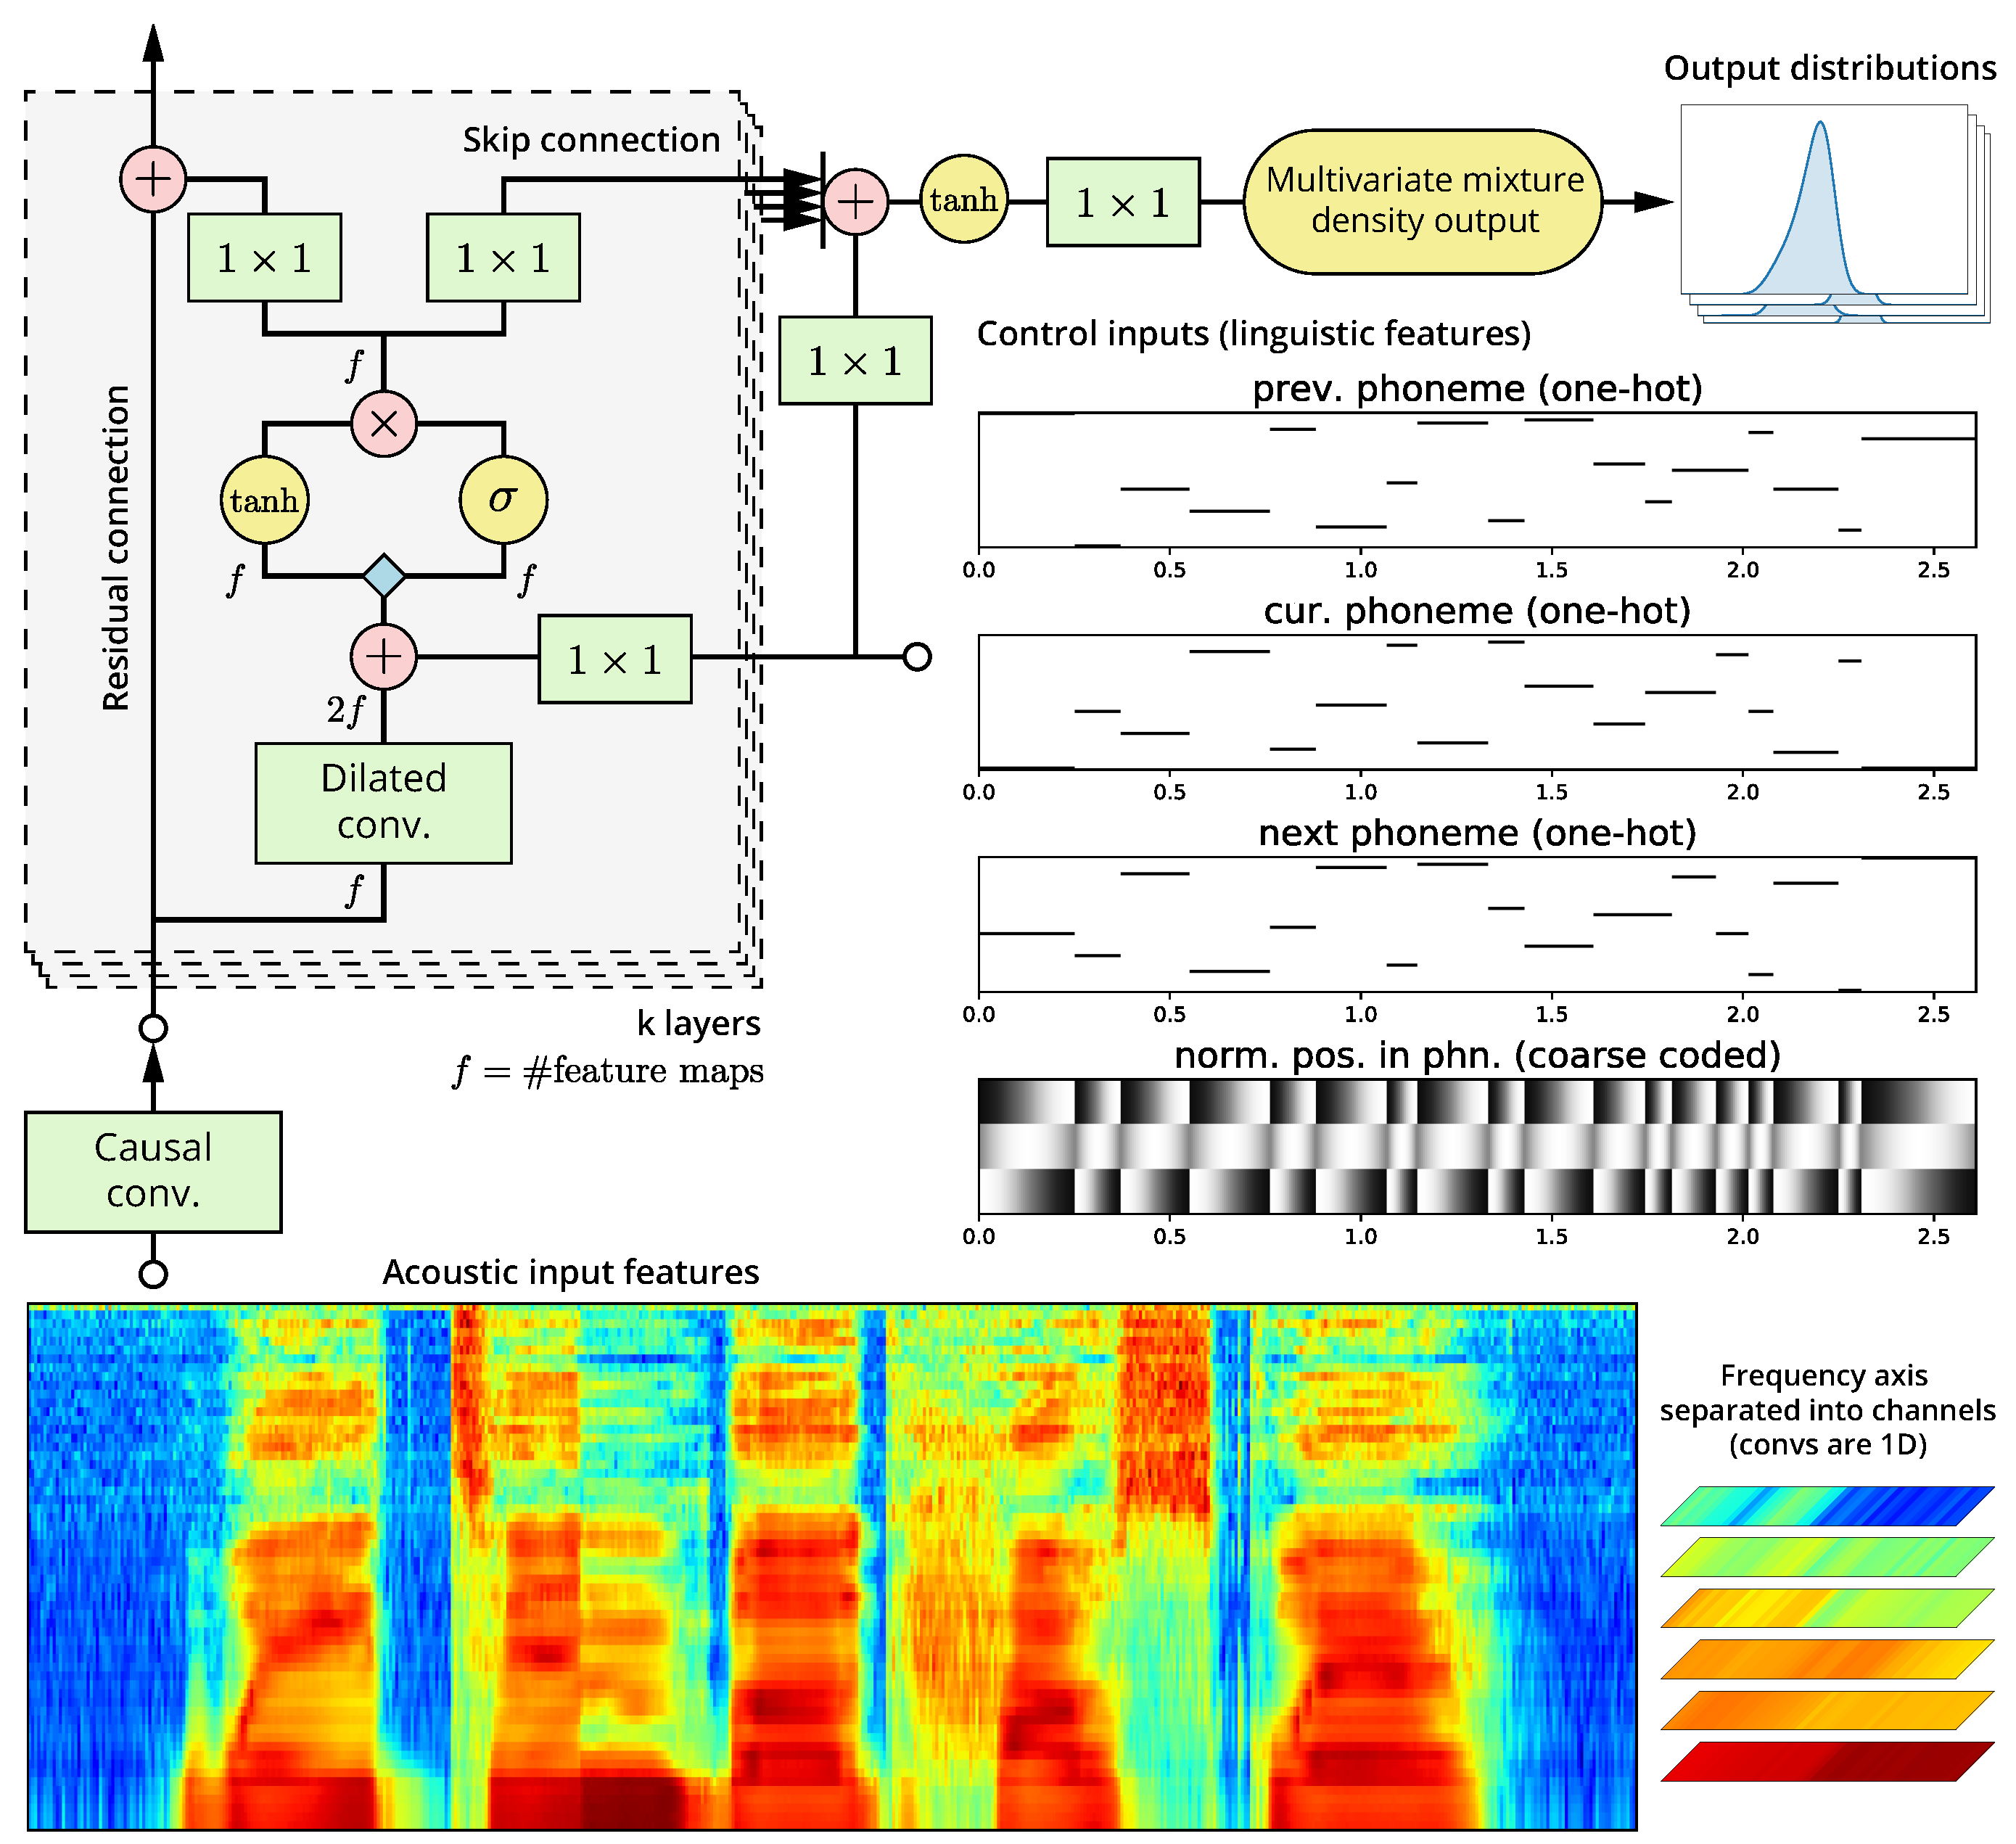
The network we propose, depicted in Figure 2, shares most of its architecture with WaveNet. Like this model we use gated convolutional units instead of gated recurrent units, such as Long Short-Term Memory (LSTM) units, to speed up training. The input is fed through an initial causal convolution which is then followed by stacks of 2 × 1 dilated convolutions [7] where the dilation factor is doubled for each layer. This allows exponentially growing the model’s receptive field, while linearly increasing the number of required parameters. To increase the total nonlinearity of the model without excessively growing its receptive field, the dilation factor is increased up to a limit and then the sequence is repeated. We use residual and skip connections to facilitate training deeper networks [8]. As we wish to control the synthesizer by inputting notes and lyrics, we use a conditional version of the model. At every layer, before the gated nonlinearity, feature maps derived from control inputs are summed to the feature maps from the layer’s main convolution. In our case, we do the same thing at the output stack, similar to [9].
The underlying idea of this model is that joint probability over all timesteps can be formulated as a product of conditional probabilities for a single timestep with some causal ordering. The conditional probability distributions are predicted by a neural network trained to maximize likelihood of a observation given past observations. To synthesize, predictions are made by sampling the predicted distribution conditioned on past predictions, that is, in a sequential, autoregressive manner. However, while models on which we base our model like WaveNet, or PixelCNN [10] and PixelRNN [11] before it, perform this factorization for univariate variables (e.g., individual waveform samples or pixel channels), we do so for multivariate vectors corresponding to a single frame,
p x 1 , , x T c = t = 1 T p x t x < t , c ,
where x t is an N-dimensional vector of acoustic features x t , 1 , , x t , N , c is an T-by-M-dimensional matrix of control inputs, and T is the length of the signal. In our case, we consider the variables within a frame to be conditionally independent,
p x t x < t , c = i = 1 N p x t , i x < t , c .
In other words, a single neural network predicts the parameters of a multivariate conditional distribution with diagonal covariance, corresponding to the acoustic features of a single frame.
The main reason for choosing this model is that, unlike raw audio waveform, features produced by a parametric vocoder have two dimensions, similar to (single channel) images. However, unlike images, these two dimensions are not both spatial dimensions, but rather time-frequency dimensions. The translation invariance that 2D convolutions offer is an undesirable property for the frequency (or cepstral quefrency) dimension. Therefore, we model the features as 1D data with multiple channels. Note that these channels are only independent within the current frame; the prediction of each of the features in the current frame still depends on all of the features of all past frames within the receptive field (the range of input samples that affect a single output sample). This can be explained easily as all input channels of the initial causal convolution contribute to all resulting feature maps, and so on for the other convolutions.
Predicting all channels at once rather than one-by-one simplifies the models, as it avoids the need for masking channels and separating them in groups. This approach is similar to [12], where all three RGB channels of a pixel in an image are predicted at once, although in our work we do not incorporate additional linear dependencies between channel means.

2.2.1. Constrained Mixture Density Output

Many of the architectures on which we base our model predict categorical distributions, using a softmax output. The advantage of this nonparametric approach is that no a priori assumptions have to be made about the (conditional) distribution of the data, allowing things such as skewed or truncated distributions, multiple modes, and so on. Drawbacks of this approach include an increase in model parameters, values are no longer ordinal, and the need to discretize data which is not naturally discrete or has high bitdepth.
Because our model predicts an entire frame at once, the issue of increased parameter count is aggravated. Instead, we opted to use a mixture density output similar to [12]. This decision was partially motivated because in earlier versions of our model with softmax output [13], we noted the predicted distributions were generally quite close to Gaussian or skewed Gaussian. In our model we use a mixture of four continuous Gaussian components, constrained in such a way that there are only four free parameters (location, scale, skewness and a shape parameter). Figure 3 shows some of the typical distributions that the contraints imposed by this parameter mapping allow. We found such constraints to be useful to avoid certain pathological distributions, and in our case explicitly not allowing multimodal distributions was helpful to improve results. We also found this approach speeds up convergence compared to using categorical output. See Appendix A for details.

2.2.2. Regularization

While the generation process is autoregressive, during training rather than using past predictions, groundtruth past samples are used. This is a practical necessity as it allows the computations to be parallelized. However this also causes a number of issues. One issue, known as exposure bias [14], results in the model becoming biased to the groundtruth data it is exposed to during training, and causing errors to accumulate at each autoregressive generation step based on its own past predictions. In our case, such errors cause a degradation in synthesis quality, e.g., unnatural timbre shifts over time. Another notable issue is that as the model’s predictions are conditioned on both past timesteps and control inputs, the network may mostly only pay attention to past timesteps and ignore the control inputs [15]. In our case, this can result in the model occasionally changing certain lyrics rather than follow those dictated by its control inputs.
One way to reduce the exposure bias issue may be to increase the dataset size, so that the model is exposed to a wider range of data. However, we argue that the second problem is mostly a result of the inherent nature of the data modeled. Unlike raw waveform, vocoder features are relatively smooth over time, more so for singing where there are many sustained vowels. This means that, usually, the model will be able to make accurate predictions given the highly correlated past timesteps.
As a way around both these issues, we propose using a denoising objective to regularize the network,
L = log p x t x ˜ < t , c with x ˜ < t p x ˜ < t x < t ,
where p x ˜ x is a Gaussian corruption distribution,
p x ˜ x = N x ˜ ; x , λ I ,
with noise level λ 0 . That is, Gaussian noise is added to the input of the network, while the network is trained to predict the uncorrupted target.
When sufficiently large values of λ are used, this technique is very effective for solving the problems noted above. However, the generated output can also become noticeably more noisy. One way to reduce this undesirable side effect is to apply some post processing to the predicted output distribution, much in the same vein as the temperature softmax used in similar models (e.g., [9]).
We have also tried other regularization techniques, such as dropout, but found them to be ultimately inferior to simply injecting input noise.

2.3. Timbre Model

This model is responsible for generating acoustic features related to the timbre of the voice. It consists of a multistream variant of the modified WaveNet architecture. Control inputs are the sequence of timed phonemes and F0, predicted by the timing model and pitch model respectively. The predicted timbrical acoustic features can be combined with the predicted F0 to generate the final waveform using the synthesis stage of the vocoder.

2.3.1. Multistream Architecture

Most parametric vocoders separate the speech signal into several components. In our case, we use three feature streams; a harmonic spectral envelope, an aperiodicity envelope and a voiced/unvoiced decision (continuous pitch is predicted by the pitch model and given as a control input). These components are largely independent, but their coherence is important (e.g., synthesizing a harmonic component corresponding to a voiced frame as unvoiced will generally cause artifacts, and vice versa). Rather than jointly modeling all data streams with a single model, we decided to model these components using independent networks. This approach gives us more fine-grained control over each stream’s architecture, and also avoids the possibility of streams with lower perceptual importance interfering with streams of higher perceptual importance. For instance, the harmonic component is by far the most important, therefore we would not want any other jointly modeled stream potentially reducing model capacity dedicated to this component.
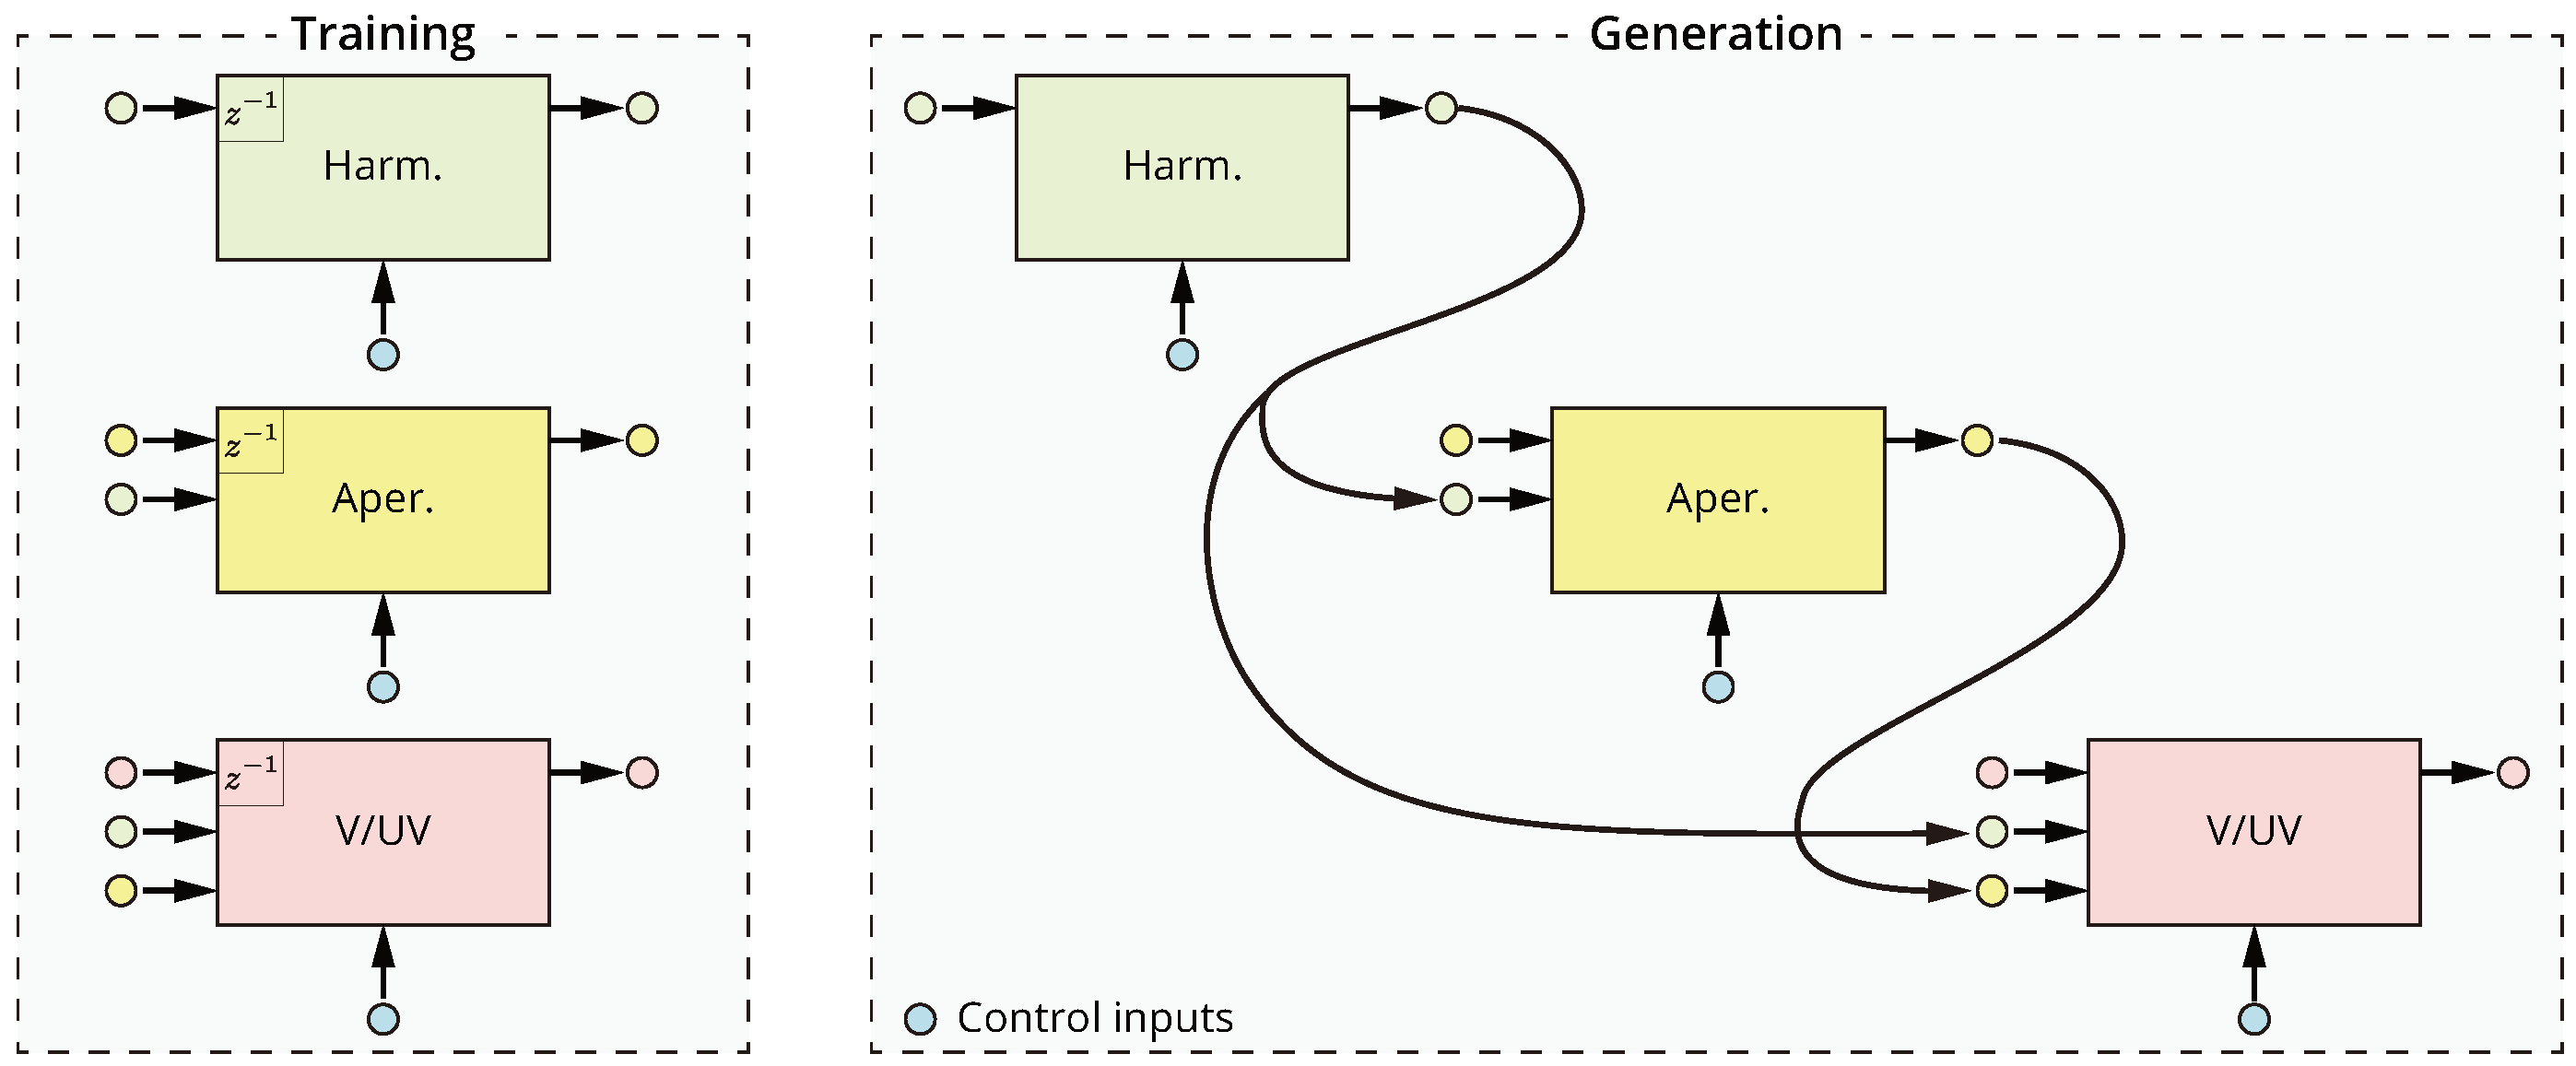
To encourage predictions to be coherent, we concatenate the predictions of one network to the input of another, as depicted in Figure 4. In our current system, the aperiodic component depends on the harmonic component, and the voiced/unvoiced decision depends on both harmonic and aperiodic components. All the networks are similar, but have slightly different hyperparameters (see Table A1 in Appendix C for details). The voiced/unvoiced decision network has a Bernoulli output distribution rather than a mixture density (see Section 2.2.1). While we found this approach to generally work well, we did not exhaustively investigate the many other alternative approaches.

2.3.2. Handling Long Notes

In most datasets, not all note durations will be exhaustively covered. In particular, the case of synthesizing notes significantly longer than the notes in the dataset can be problematic. This issue manifests itself mainly as a repetition in time of some of the transitions predicted by the timbre model, causing a kind of stutter. To reduce such artifacts, we compute the control feature corresponding to the frame position within the phoneme (see Section 2.6) with a nonlinear mapping depending on the length of the phoneme. The idea behind this is that the edges of a phoneme, where the transitions are likely to be, will maintain their original rate, while the more stable center parts will be expanded more.

2.4. Pitch Model

Generating expressive F0 contours for singing voice is quite challenging. Not only is this because of its importance to the overall results, but also because in singing voice there are many factors that simultaneously affect F0. There are a number of musical factors, including melody, various types of attacks, releases and transitions, phrasing, vibratos, and so on. Additionally, phonetics can also cause inflections in F0, so-called microprosody [16]. Some approaches try to decompose these factors to various degrees, for instance by separating vibratos [4] or using source material without consonants [1,17]. In our approach, however, we model the F0 contour as-is, without any decomposition. As such, F0 is predicted from both musical and phonetic control inputs, using a modified WaveNet architecture (see Table A1 in Appendix C for details).

2.4.1. Data Augmentation

One issue with modeling pitch, is that obtaining a dataset that sufficiently covers all notes in a singer’s register can be challenging. Assuming that pitch gestures are largely independent of absolute pitch, we apply data augmentation by pitch shifting the training data, similar to [18]. While training, we first draw a pitch shift in semitones from a discrete uniform random distribution, for each sample in the minibatch,
pshift U pshift m i n , pshift m a x
pshift m i n = pitch m i n singer pitch m a x sample
pshift m a x = pitch m a x singer pitch m i n sample ,
where pshift m i n and pshift m a x define the maximum range of pitch shift applied to each sample. These ensure that all notes of the melody within a sample can occur at any note within the singer’s register. Finally, this pitch shift is applied to both the pitch used as a control input and the target output pitch,
pitch ^ cond = pitch cond + pshift
f ^ 0 = f 0 2 1 12 pshift .

2.4.2. Tuning Postprocessing

For pitch in singing voice, one particular concern is ensuring that the predicted F0 contour is in tune. The model described above does not enforce this constraint, and in fact we observed predicted pitch to sometimes be slightly out of tune. If we define “out of tune” as simply deviating a certain amount from the note pitch, it is quite normal for F0 to be out of tune for some notes in expressive singing, without perceptually sounding out of tune. One reason why our model sometimes sounds slightly out of tune may be that such notes are reproduced in different musical context where they do sound out of tune. We speculate that one way to combat this is may be use a more extensive dataset.
We improve tuning of our system by applying a moderate postprocessing of predicted F0. For each note (or segment within a long note), the perceived pitch is estimated using F0 and its derivative. The smoothed difference between this pitch and the score note pitch is used to correct the final pitch used to generate the waveform. Appendix B discusses the algorithm in detail.

2.5. Timing Model

The timing model is used to predict the duration of each phoneme in the sequence to synthesize. Unlike with TTS systems where phoneme durations are generally predicted in a freerunning manner, in singing synthesis, the phoneme durations are heavily constrained by the musical score. In our proposed system we enforce this constraint using a multistep prediction. First, the note timing model predicts the deviations of note (and rest) onsets with respect to nominal onsets in the musical score. At the same time phoneme durations are predicted by the phoneme duration model. Finally, a simple fitting heuristic is used to ensure the predicted phoneme durations fit within the available note duration, after adjusting timing. This approach is somewhat similar to the approach taken by [19].

2.5.1. Note Timing Model

Most singers will not follow the timing of a musical score exactly. Slightly advancing or delaying notes is part of normal expressive singing, and is the result of the given musical and linguistic context and the style of the singer. Additionally, there may be a small truly random component, simply because most singers cannot sing with exact timing.
Note onset deviations are computed from a musical score and phonetic segmentation of the corresponding utterance by the singer. We define a note onset deviation as the difference between the onset of the first syllabic nucleus in a note and that note’s nominal onset as written in the musical score. These deviations are also computed for rest notes, or equivalently, note offsets before a rest.
We use a neural network to predict these deviations from note-level musical and linguistic input features. These input features are designed by hand, in part because using note-level data means we have relatively few samples compared to phoneme or frame-level data. We assume that these features contain most or all contextual information relevant to computing note time deviations, therefore we can use a simple feedforward neural network, without the need for a recurrent or convolutional architecture. To avoid making any assumptions about the (conditional) probability distribution of the note onset deviations, we use a nonparametric approach by using a softmax output and discretizing the deviations to multiples of the hoptime. Details of the input features and network architecture are available in Table A2 (Appendix C).

2.5.2. Phoneme Duration Model

Phoneme durations are obtained in a similar way. They are first computed from the given phonetic segmentation, and then discretized on a log scale, similar to [20]. A neural network is used to predict the phoneme durations from phoneme-level musical and linguistic input features. Unlike the note timing model, in this case we do require some local context information, so we use a convolutional architecture. Here we assume the range of context information affecting the duration of a phoneme to be limited by the musical score and the linguistic constraints on the number of possible onset and coda consonants. Therefore, the limited receptive field of a convolutional neural net should not be a significant disadvantage over a recurrent neural net’s unbound receptive field. See Table A2 in Appendix C for details.

2.5.3. Fitting Heuristic

The fitting heuristic is used to conform the total of predicted phoneme durations to the available note duration predicted by the note timing model. The basic strategy is to expand or shrink the (principal) vowel, ensuring it is always at least some given percentage of the note duration, by also shrinking consonants if needed.
First, the sequence of phonemes to fit in the note duration is obtained by “shifting” onset consonants to the preceding note. The sequences will thus always start with a vowel (or silence for rests), followed by zero or more consonants formed by the note’s coda consonants and the next note’s onset consonants. In cases where a note contains multiple syllables, the secondary vowels are handled as if they were consonants. Then, the sequence of N predicted durations d 0 , d 1 , , d N 1 is fit into the available note duration d a ,
r = min 1 , d a ( 1 r 0 ) i = 1 N 1 d i ,
where r 0 is the minimum fraction of the note’s duration to be occupied by the primary syllabic nucleus.
d ^ i = d a r j = 1 N 1 d j for i = 0 r d i for i = 1 , 2 , , N 1 .

2.6. Acoustic and Control Frontend

We use an acoustic frontend based on the WORLD vocoder [21] (D4C edition [22]) with a 32 kHz sample rate and 5 ms hop time. The dimensionality of the harmonic component is reduced to 60 log Mel-Frequency Spectral Coefficients (MFSCs) by truncated frequency warping in the cepstral domain [23] with an all-pole filter with warping coefficient α = 0.45 . The dimensionality of the aperiodic component is reduced to four coefficients by exploiting WORLD’s inherently bandwise aperiodic analysis. All acoustic features are min/max normalized before feeding them to the neural network.
The control frontend produces linguistic and musical features that control the synthesizer. The linguistic features we use are relatively simple compared to most TTS systems as we omit most of the features that are principally used to predict prosody. The main linguistic features we use are previous, current and next phoneme identity encoded as one-hot vectors. We assume that the lyrics input is a phonetic rather than orthographic sequence. For datasets that do not already include aligned phonetic and acoustic features, we apply a forced alignment using a speaker-dependent Hidden Semi-Markov Model (HSMM) trained using deterministic annealing [24]. The most important musical features are note pitch and duration, as one-hot and 4-state coarse coded vectors respectively. Additionally, we include the normalized position of the current frame within the current phoneme and note as a 3-state coarse coded vectors, roughly corresponding to the probability of being in the beginning, middle or end of the phoneme or note respectively. See Table A1 in Appendix C for a complete listing of the control features used.

2.7. Audio Generation Speed

One special concern with autoregressive models, especially those generating raw waveform, is that the time required to generate a sequence can exceed several times the sequence’s duration. Our approach generating vocoder features has the advantage that timesteps have to be produced at a much lower rate, as well as requiring a significantly reduced network architecture to achieve a similar receptive field. However, even in this case, as autoregressive inference is inherently sequential, it cannot exploit massively parallel hardware such as modern GPUs. Therefore, naive implementations of the generation algorithm still tend to be relatively slow. By caching calculations between timesteps, we were able to implement a fast generation algorithm. While this algorithm was developed independently, it is essentially identical to those proposed in other works [25,26]. Using this algorithm, our model can achieve generation speeds of 10–15× real-time on CPU. Combined with low memory and disk footprints, these relatively fast generation speeds make the system competitive with most existing systems in terms of deployability.

3. Related Work

Our method is heavily based on a class of fully-visible probabilistic autoregressive generative models that use neural networks with similar architectures. This type of model was first proposed to model natural images (PixelCNN) [9,10,12], but was later also applied to modeling raw audio waveform (WaveNet) [5], video (Video Pixel Networks) [27] and text (ByteNet) [28].
Soon after WaveNet, there have been several other related works on text-to-speech. Deep Voice [26] obtains real-time inference by using a deeper, but narrower architecture, and heavily optimized generation algorithm. It also introduces a pipeline comprised of solely neural network-based building blocks, although these are independently trained and targets are still obtained in a traditional way, i.e., by using an F0 estimator, phonetic dictionary, and so on. Deep Voice 2 [20] improves the components of this pipeline, and explores multispeaker training which allows modeling hundreds of voices with less than half an hour of data per speaker. The SampleRNN [29] model proposes an alternative architecture for unconditional raw waveform generation based on multiscale hierarchical Recurrent Neural Networks (RNNs) rather than dilated Convolutional Neural Networks (CNNs). Char2Wav [30] uses a SampleRNN component as a neural vocoder for synthesizing predicted vocoder parameters. The vocoder parameters are predicted by an attention-based sequence-to-sequence (seq2seq) model, which allows for a fully end-to-end system, generating speech signals from unaligned orthographic or phonetic sequences. Another end-to-end system is Tacotron [31], which proposes a sophisticated seq2seq model able to predict magnitude spectrum frames from text.
More traditional neural parametric speech synthesizers tend to be based on feedforward architectures such as DNNs and Mixture Density Networks (MDNs) [32], or on recurrent architectures such as Long Short-Term Memory RNNs (LSTM-RNNs) [33]. Feedforward networks learn a framewise mapping between linguistic and acoustic features, thus potentially producing discontinuous output. This is often partly mitigated by predicting static, delta and delta-delta feature distributions combined with a parameter generation algorithm that maximizes output probability [34]. Recurrent architectures avoid this issue by propagating hidden states (and sometimes the output state) over time. In contrast, autoregressive architectures such as the one we propose make predictions based on predicted past acoustic features, allowing, among other things, to better model rapid modulations such as plosive and trill consonants.
There have been several works proposing different types of singing synthesizers. The more prominent of which are based on concatenative methods [1,2] and statistical parametric methods centered around Hidden Markov Models (HMMs) [3,4]. Similar to in this work, an important benefit of statistical models is that they allow joint modeling of timbre and musical expression from natural singing [18,35]. Many of the techniques developed for HMM-based TTS are also applicable to singing synthesis, e.g., speaker-adaptive training [36]. The main drawback of HMM-based approaches is that phonemes are modeled using a small number of discrete states and within each state statistics are constant. This causes excessive averaging, an overly static “buzzy” sound and noticeable state transitions in long sustained vowels in the case of singing. More recently, the work on HMM singing synthesis was extended to feedforward DNNs [37], albeit with a somewhat limited architecture.

4. Experiments

The goal of our experiments is mainly to compare our system against competing systems such as concatenative unit selection, HMM or DNN systems. We are also interested in having some indication of the absolute performance of our system, i.e., compared to a reference recording.
We conducted two sets of experiments; one set of experiments involve systems trained on a dataset of natural singing and the second set involve systems trained on a dataset of what we call pseudo singing. Pseudo singing are recordings of something in between speech and singing, using a constant cadence and one or more constant pitches. One limitation of pseudo singing is that it can only be used to train timbre models, as it does not contain musical expression. However, the reason for also conducting experiments with this kind of data is two-fold: first, we expect the performance of in particular unit selection systems to be notably better with pseudo singing datasets, as the more stable and coherent data is better suited for this type of system; and, second, we have access to a wider range of datasets of this kind, including more languages. As we only compare the performance of the timbre model of different systems when using pseudo singing, we generate sequences in a so-called performance driven manner, that is, F0 and phonetic timings that control the timbre model are obtained from a reference recording.
The webpage accompanying this article, http://www.dtic.upf.edu/~mblaauw/NPSS/, contains several demo songs synthesized by our system, after training on both kinds of data.

4.1. Datasets

For systems trained on natural singing, we use a public dataset published by the Nagoya Institute of Technology (Nitech), identified as NIT-SONG070-F001 (http://hts.sp.nitech.ac.jp/archives/2.3/HTS-demo_NIT-SONG070-F001.tar.bz2). This dataset consists of studio quality recordings of a female singer singing Japanese children songs. The original dataset consists of 70 songs, but the public version consists of a 31 song subset (approximately 31 min, including silences). Out of these 31 songs, we use 28 for training and 3 for testing (utterances 015, 029 and 040).
We use three proprietary datasets from training systems on pseudo singing; an English male voice (M1), an English female voice (F1) and Spanish female voice (F2). The studio quality recordings consist of short sentences which were sung at a single pitch and an approximately constant cadence. The sentences were selected to favor high diphone coverage. The Spanish dataset contains 123 sentences, while the English datasets contain 524 sentences (approximately 16 and 35 min respectively, including silences). A randomly selected 10% of sentences are used for testing.
Note that these datasets are small compared to the datasets typically used to train TTS systems. However, for natural singing, many-hour datasets would exceed the repertoire of most singers. For pseudo singing, as only timbre is captured in a very constrained setting, substantially larger datasets would likely yield diminishing returns.

4.2. Compared Systems

  • NPSS: Our system, which we call Neural Parametric Singing Synthesizer (NPSS), as described in Section 2.
  • IS16: A concatenative unit selection-based system [1], which was the highest rated system in the Interspeech 2016 Singing Synthesis Challenge.
  • Sinsy-HMM: A publicly accessible implementation of the Sinsy HMM-based synthesizer (http://www.sinsy.jp/). This system is described in [4,35], although the implementation may differ to some degree from any single publication, according to one of the authors in private correspondence. While the system was trained on the same NIT-SONG070-F001 dataset, it should be noted that the full 70 song dataset was used, including the 3 songs we use for testing.
  • Sinsy-DNN: A publicly accessible implementation of the Sinsy feedforward DNN-based synthesizer (http://www.sinsy.jp/) [37]. The same caveats as with Sinsy-HMM apply here. Additionally, the DNN voice is marked as “beta”, and thus should be considered still experimental. The prediction of timing and vibrato parameters in this system seems to be identical to Sinsy-HMM at the time of writing. Thus, only timbre and “baseline” F0 is predicted by the DNN system.
  • HTS: A HMM-based system, similar to Sinsy-HMM, but consisting of a timbre model only, and trained on pseudo singing. The standard demo recipe from the HTS toolkit (version 2.3) [38] was followed, except for a somewhat simplified context dependency (just the two previous and two following phonemes).

4.3. Methodology

We compare the different systems using a set of quantitative and qualitative tests. Finding perceptually relevant metrics to compare generative models quantitatively tends to be very challenging, as is the case with expressive singing voice. Although we pay special attention to the metrics we use, this should be kept in mind when comparing values. Qualitative tests tend to be more conclusive, but can also be challenging when evaluating multidimensional aspects such as “expression”. It should be noted that the quantitative metrics for the systems trained on pseudo singing are evaluated with respect to a pseudo singing reference. Therefore, these results might not directly correspond to our end goal, expressive singing, as evaluated in the listening tests and quantitative metrics for the systems trained on natural singing.

4.3.1. Quantitative Metrics

For all metrics, we apply a simple linear time mapping to reduce misalignments due to predicted timings possibly differing from reference timings.
  • Mel-Cepstral Distortion (MCD): Mel-Cepstral Distortion (MCD) is a common perceptually motivated metric for the quantitative evaluation of timbre models. In our case, some moderate modifications are made to improve robustness for singing voice; Mel-cepstral parameters are extracted from WORLD spectra, rather than STFT spectra, to better handle high pitches. To reduce the effect of pitch mismatches between reference and prediction, we filter pairs of frames with a pitch difference exceeding ±200 cents. Similarly, to increase robustness to small misalignments in time, frames with a modified z-score exceeding 3.5 are not considered [39]. MCD is computed for harmonic components, using 33 (0–13.6 kHz) coefficients.
  • Band Aperiodicity Distortion (BAPD): Identical to MCD, except computed over linearly spaced band aperiodicity coefficients. BAPD is computed for aperiodic components, using 4 (3–12 kHz) coefficients.
  • Modulation Spectrum (MS) for Mel-Generalized Coefficients (MGC): One issue with framewise metrics, like MCD, is that these do not consider the behavior of the predicted parameter sequences over time. In particular, the common issue of oversmoothing is typically not reflected in these metrics. A recently proposed metric, the Modulation Spectrum (MS) [40], allows visualizing the spectral content of predicted time sequences. For instance, showing oversmoothing as a rolloff of higher modulation frequencies. We are mainly interested in the lower band of the MS (e.g., <25 Hz), because the higher band of the reference (natural singing) can be overly affected by noise in the parameter estimation. To obtain a single scalar metric, we use the Modulation Spectrum Log Spectral Distortion (MS-LSD) between the modulation spectra of a predicted parameter sequence and a reference recording.
  • Voiced/unvoiced decision metrics: In singing voice, there is a notable imbalance between voiced and unvoiced frames due to having many long, sustained vowels. As both false positives (unvoiced frames predicted as voiced) and false negatives (voiced frames predicted as unvoiced) can result in highly noticeable artifacts, we list both False Positive Rate (FPR) and False Negative Rate (FPR) for this estimator. All silences are excluded.
  • Timing metrics: Metrics for the timing model are relatively straight forward, e.g., Mean Absolute Error (MAE), Root Mean Squared Error (RMSE) or Pearson correlation coefficient r between onsets or durations. We list errors for note onsets, offsets and consonant durations separately to ensure the fitting heuristic affects the results only minimally.
  • F0 metrics: Standard F0 metrics such as RMSE are given, but it should be noted that these metrics are often not very correlated to perceptual metrics in singing [41]. For instance, starting a vibrato slightly early or late compared to the reference may be equally valid musically, but can the cause the two F0 contours to become out of phase, resulting in high distances.
  • Modulation Spectrum (MS) for log F0: Similar to timbre, we use MS-based metrics to get a sense of how close the generated F0 contours are in terms of variability over time. The MS of F0 is computed by first segmenting the score into sequences of continuous notes, without rests. Then, for each sequence, the remaining unvoiced regions in the log F0 curve are filled using cubic spline interpolation. We apply a Tukey window corresponding to a 50 frame fade in and fade out, and subtract the per-sequence mean. Then, the modulation spectra are computed using a Discrete Fourier Transform (DFT) size 4096, and averaged over all sequences.

4.3.2. Listening Tests

For the listening tests, all stimuli were downsampled to 32 kHz, which is the lowest common denominator between the different systems.
  • Mean Opinion Score (MOS): For the systems trained on natural singing, we conducted a MUSHRA [42] style listening test. The 40 participants, of which 8 indicated native or good knowledge of Japanese, were asked to rate different versions of the same audio excerpt compared to a reference. The test consisted to 2 short excerpts (<10 s) for each of the 3 validation set songs, in 7 versions (reference, hidden reference, anchor and 4 systems), for a total of 42 stimuli. The scale used as 0–100, divided into 5 segments corresponding to a 5-scale MOS test. The anchor consisted of a distorted version of the NPSS synthesis, applying the following transformations: 2D Gaussian smoothing ( σ = 10 ) of harmonic, aperiodic and F0 parameters, linearly expanding the spectral envelope by 5.2%, random pitch offset ( ± 100 cents every 250 ms, interpolated by cubic spline), and randomly “flipping” 2% of the voiced/unvoiced decisions. We excluded 59 of the total 240 tests performed, as these had a hidden reference rated below 80 (ideally the rating should be 100). We speculate that these cases could be due to the relative difficulty of the listening test for untrained listeners.
  • Preference Test: For the systems trained on pseudo singing, we conducted an AB preference test. The 18 participants were asked for their preference between two different stimuli, or indicate no preference. The stimuli consisted of two short excerpts (<10 s) of one song per voice/language. Versions with and without background music were presented. We perform pairwise comparisons between our system and two other systems, resulting in a total of 24 stimuli.

5. Results

5.1. Quantitative Results

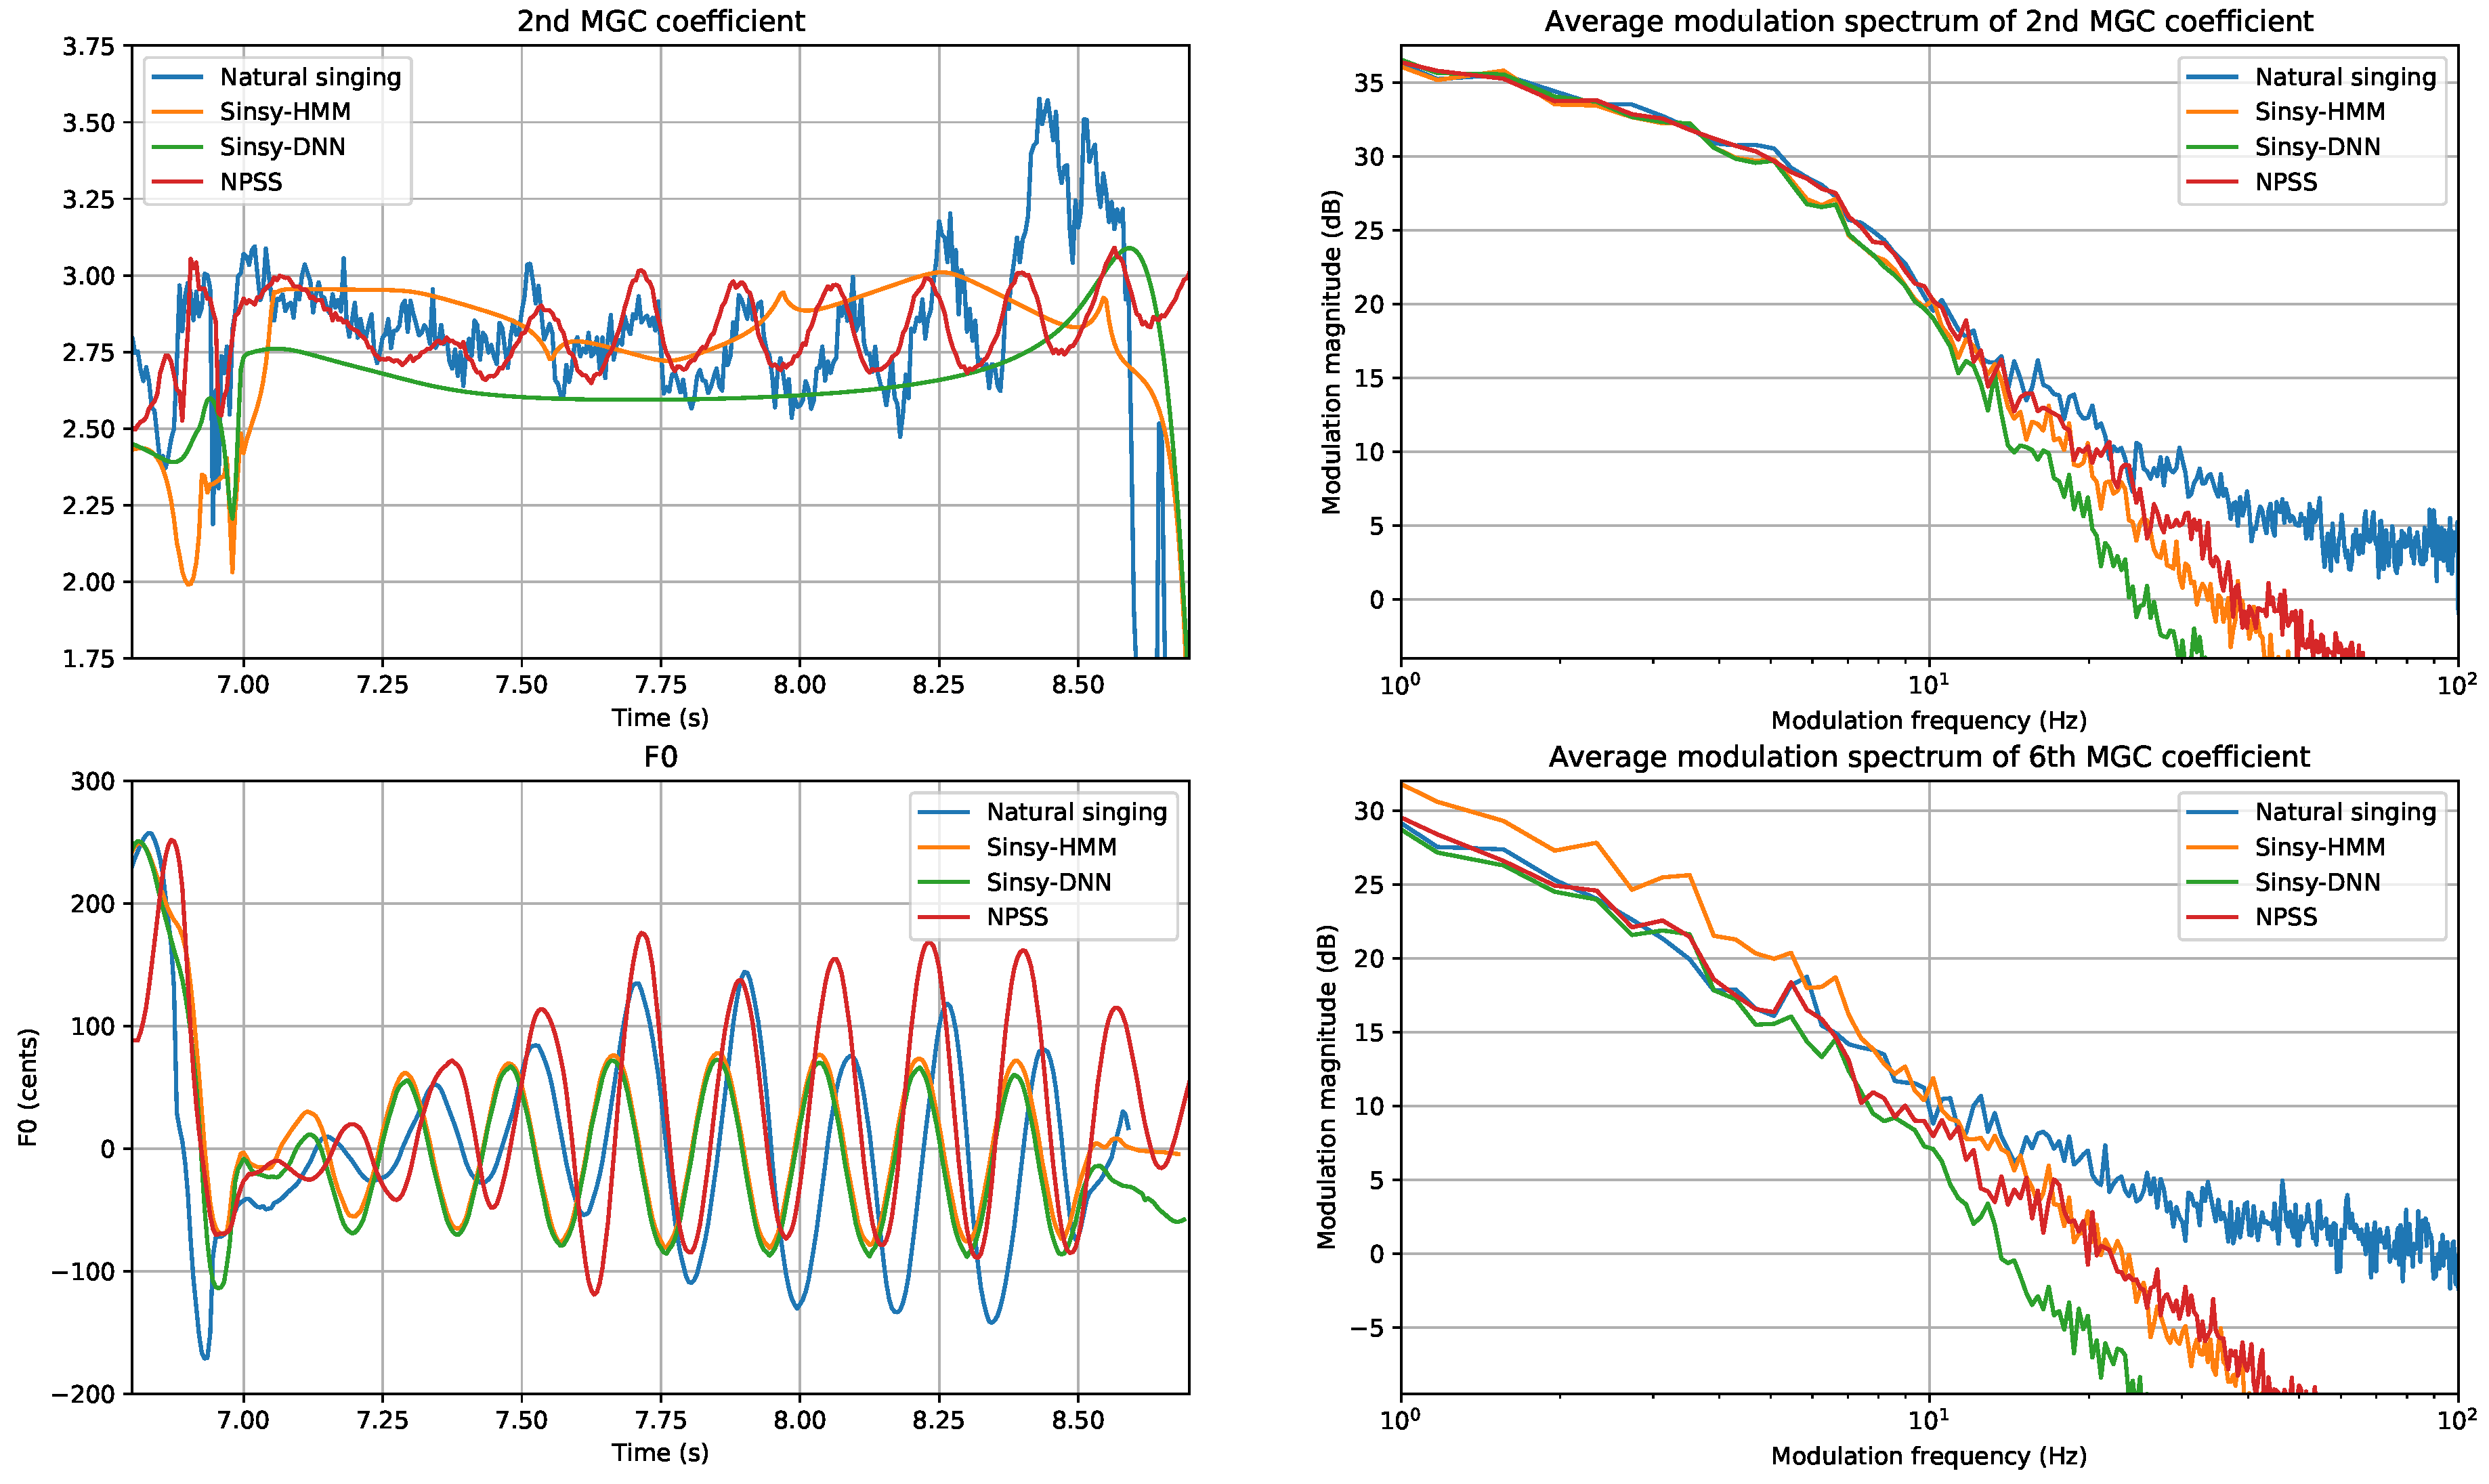
For systems trained on natural singing, Table 1, Table 2 and Table 3 list quantitative metrics related to timbre, timing and pitch models respectively. Examples of different modulation spectra for timbre and pitch are shown in Figure 5 and Figure 6. For systems trained on pseudo singing, Table 4 lists quantitative metrics related to timbre models.
These metrics show that, for some of the framewise metrics, such as harmonic MCD, our system is slightly behind. For some other metrics, such as the timing errors or aperiodic BAPD, our system is slightly ahead. For systems trained on pseudo singing the differences tend to be a little bigger, we argue that this is due that predicting averages for this kind of data results in good results for these kind of metrics. However, in all metrics based on the modulation spectrum, which considers variations in time, NPSS shows an improvement over the other systems.
When we compare an example of generated harmonic parameters during a vibrato in the left two subplots of Figure 5, we notice the features predicted by NPSS having more detail than Sinsy-HMM and Sinsy-DNN. In particular the framewise conditioning of harmonic features on F0 in NPSS, causes the harmonic features to modulate along the vibrato, similar to what happens in the reference recording. In the modulation spectrum analysis on the right-hand side of Figure 5, we can see that overall NPSS tends to follow the modulation spectrum of the reference recording a little closer than Sinsy-HMM and Sinsy-DNN in lower modulation frequencies. Compared to especially Sinsy-DNN, NPSS has less rolloff in higher modulation frequencies, indicating less oversmoothing over time. However, all systems have less high frequency modulation spectrum content than the reference recording, indicating none of the systems are able to reproduce all the details of the original signal.
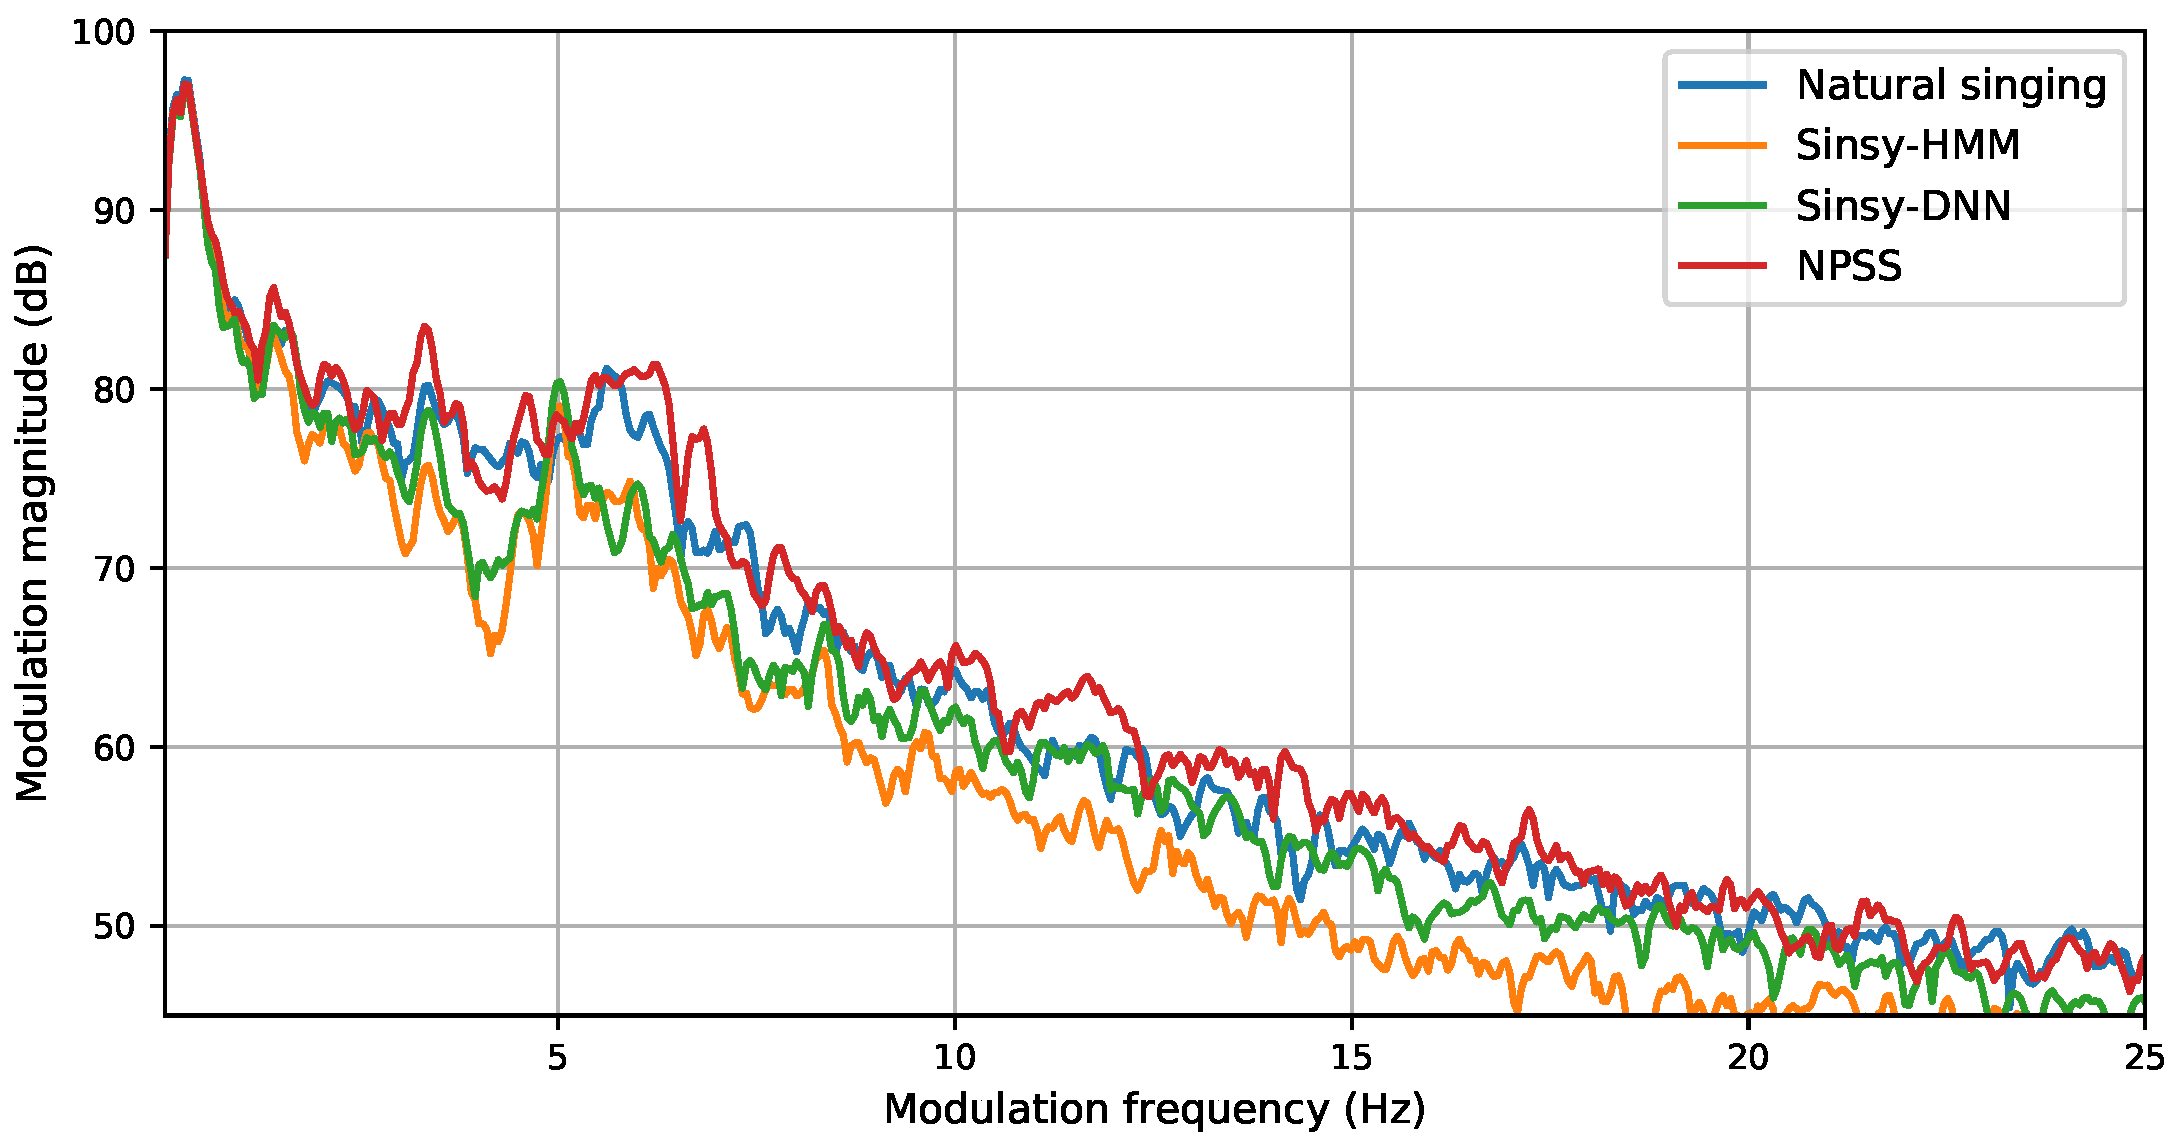
The analysis of the modulation spectrum of the log F0 predicted by different systems is shown in Figure 6. We can see that overall NPSS matches the modulation spectrum of the reference recording similarly or slightly better than Sinsy-HMM, but notably better than Sinsy-DNN. When we focus our attention to the range of modulation frequencies corresponding to vibratos in this voice, 5–7 Hz, we see that Sinsy-HMM and Sinsy-DNN have a sharp peak at 5 Hz, whereas for NPSS this whole range has increased energy, similar to the reference. This may indicate that NPSS produces a wider range of vibrato rates, similar to a real singer. In Sinsy-HMM and Sinsy-DNN vibrato parameters (rate and depth) are modeled separately from the base F0, which may explain their tendency to produce very controlled, regular vibratos.

5.2. Qualitative Results

Results of the listening tests comparing different systems trained on natural singing are listed in Table 5. For systems trained on pseudo singing, results of the preference listening test are shown in Figure 7.
In the listening tests, NPSS is clearly ahead of competing systems. In the MOS test for systems trained on natural singing, NPSS is around a third between the second best rated system (Sinsy-HMM) and the reference. Here, it should be noted that the concatenative system, IS16, performs worst, showing that this kind of system is poorly suited for this kind of data. In contrast, the preference test for systems trained on pseudo singing, shows a strong preference for NPSS over the HTS system, and a moderate preference over the IS16 system, which was designed for this kind of data. The correlation between the qualitative results and the quantitative metrics based on the modulation spectrum indicate that this may be a metric with higher perceptual relevance than the framewise metrics such as MCD.
In our experience NPSS, HMM and DNN systems all produce quite coherent timbres. The concatenative system in contrast tends to produce more discontinuous timbres, especially when using a dataset of natural singing, or other artifacts at concatenation boundaries, e.g., in fast singing or when phonetic segmentation is not perfect. We found NPSS to generally produce less static features over time, and less coloring of timbre. Compared to HMM and DNN systems, the autoregressive generation of NPSS seems to help in reproducing rapidly varying consonants, although these can occasionally sound better still in the concatenative system. In terms of expression, the HMM system produces very coherent behavior, which while perhaps a little less human, tends to generally sound quite pleasant. NPSS on the other hand, seems to be more varied, but this also means that results are sometimes better than other times. One notable quality of NPSS is that the framewise conditioning of timbre on pitch means that vibratos produce natural, synchronized modulations in both pitch and timbre (see, e.g., Figure 5), unlike in the other systems which condition on note pitch.

6. Conclusions

We presented a singing synthesizer based on neural networks, which can generate synthetic singing voice given a musical score with lyrics. From a single set of relatively few songs, the system is able to learn both timbre and expression. Separate, but interconnected models learn phonetic timing, pitch and timbre. The core building block of the system is a variant of the WaveNet architecture, modified to allow generating features obtained from a parametric vocoder. This autoregressive approach offers improved reproduction of consonants and a more natural variation of predicted parameters over time, compared to competing approaches such as statistical parametric systems. Compared to concatenative approaches, our model allows for greater flexibility and is more robust to small misalignments between phonetic and acoustic features in the training data. In listening test our system was rated to reduce the gap between the second best system and the reference recording by about a third. While correlating this with quantitative metrics is challenging, metrics that take into account variations over time, such as the modulation spectrum, do seem to corroborate this. The relatively small CPU, memory and disk footprint allows for many practical applications of our system. We hope that in the near future we can evaluate our model trained on natural singing for a wider range of languages and datasets. Further exploring the flexibility offered by this neural approach, such as the area of multispeaker training is also promising, as it might help to overcome the issue of limited dataset sizes typical of singing voice.

Acknowledgments

We gratefully acknowledge the support of NVIDIA Corporation with the donation of the Titan X Pascal GPU used for this research. We thank Nagoya Institute of Technology for providing the NIT-SONG070-F001 dataset (licensed under CC BY 3.0), Zya for providing the English datasets, and Voctro Labs for providing the Spanish dataset and the implementation of the fast generation algorithm. This work is partially supported by the Spanish Ministry of Economy and Competitiveness under the CASAS project (TIN2015-70816-R).

Author Contributions

Jordi Bonada and Merlijn Blaauw designed and implemented the proposed system; Jordi Bonada implemented the fast generation algorithm; Jordi Bonada and Merlijn Blaauw designed the experiments; and Merlijn Blaauw performed the experiments and wrote the paper.

Conflicts of Interest

The authors declare no conflict of interest.

Appendix A. Details Constrained Gaussian Mixture

The output mixture density we call Constrained Gaussian Mixture (CGM), is a mixture of K = 4 Gaussians,
p ( x ) = k = 0 K 1 w k N ( x ; μ k , σ k 2 ) .
The 12 mixture parameters w k , μ k , σ k for k = 0 , 1 , , K 1 are computed from four free parameters: location ξ , scale ω , skewness α and shape β (see Figure 3 for some example distributions). Assuming the network predicts four outputs with linear activations, a 0 , a 1 , a 2 , a 3 , we apply some nonlinearities to obtain the free parameters in suitable ranges,
ξ = 2 sigm ( a 0 ) 1 range 1 , 1
ω = 2 255 e 4 sigm ( a 1 ) range 2 255 , 2 e 4 255
α = 2 sigm ( a 2 ) 1 range 1 , 1
β = 2 sigm ( a 3 ) range 0 , 2 .
Then, we map predicted location ξ , scale ω , skewness α and shape β to Gaussian mixture parameters μ k , σ k , w k for k = 0 , 1 , , K 1 ,
σ k = ω e α γ s 1 k
μ k = ξ + i = 0 k 1 σ k γ u α
w k = α 2 k β k γ w k i = 0 K 1 α 2 i β i γ w i ,
where γ u , γ s and γ w are constants tuned by hand,
γ u = 1.6
γ s = 1.1
γ w = 1 1.75 .
A temperature control is achieved by first shifting component means towards their global weighted average,
μ ¯ = k = 0 K 1 μ k w k
μ ^ k = μ k + ( μ ¯ μ k ) ( 1 τ ) ,
where 0 < τ 1 is the temperature. Then, the component variances are scaled by the temperature,
σ ^ k = σ k τ .

Appendix B. Details Tuning Postprocessing

The principal idea behind the tuning correction postprocessing is simple; apply the difference between the perceived pitch of a note, given its predicted F0 contour, and the pitch of the corresponding note in the score. However, robustly estimating the perceived pitch of a note from the corresponding F0 contour is nontrivial. In singing voice there are many factors that affect F0, but may not influence the perceived note pitch. These factors include vibratos, scoops, releases, transitions, microprosody due to consonants and so on. Therefore, simple estimators, such as directly taking the mean of the framewise F0 over the note duration, will typically yield poor results.
To obtain a more robust estimate of the perceived note pitch, F 0 ¯ , we compute a weighted average of the predicted F0 over the note’s duration,
F 0 ¯ = i F 0 i w i i w i ,
where F 0 i and w i correspond to the i-th frame within a given note of the predicted F0 vector and weighting vector respectively. To simplify notation, throughout this section “F0” refers to log F0 in semitones. The weighting vector in Equation (A15) is composed of a number of different factors that correspond to different heuristics designed to make the estimate more robust,
w = w e w d w p w t .
The first of these factors, w e , is a weighting to reduce the influence of the edges of the note, where most of the transition effects will typically be located. We compute w e as a Tukey window with α = 0.5 . That is, we apply a cosine-taper weighting along the first and last 25% of the note duration.
The second factor, w d , is a weighting depending on the derivative of the F0 contour. The idea is that the portion of the note where F0 is mostly flat will contribute more to the perceived pitch than portions where F0 fluctuates due to transitions or microprosody. We first estimate the derivative by convolving the signal with a 3rd order 1st derivative Savitzky-Golay FIR filter, s d , with a length of 11 frames (55 milliseconds),
d F 0 = F 0 s d ,
where ⊛ denotes the convolution operator. Then, we compute the weighting factor, w d , as follows,
w d , i = 1 min ( 1 + 27 | d F 0 i | , 15 ) ,
where the constants were obtained empirically.
The third factor, w p , is a weighting depending on the phoneme corresponding to each frame p i ,
w p , i = 2 , for p i { vowel , syllabic   consonant } 0 , for p i { silence , pause , breath } 1 , otherwise .
The idea is that frames corresponding to vowels typically contribute more to the perceived pitch than consonants, which often contain microprosody effects.
The last factor, w t , is a weighting depending on the distance from the target pitch, based on the assumption that detuning in the perceived pitch will typically be caused by relatively small deviations. Other factors, such as scoops or microprosody, may cause relatively big deviations, but these tend not to contribute to the perceived detuning. We use a pitch deviation of ± 1 semitone as a threshold,
w t , i = 1 , for | F 0 tar F 0 i | 1 1 / | F 0 tar F 0 i | , otherwise .
Finally, the required amount of pitch correction, c F 0 , is computed for each frame in a note as follows,
c F 0 i = F 0 tar F 0 ¯ ,
where F 0 tar is the note’s target pitch, as is written in the score. For rests, we do not apply any correction, c F 0 i = 0 . These framewise correction vectors are then concatenated for all notes and rests in the sequence. As the resulting vector may be discontinuous, we smooth it by zero-phase filtering with a Gaussian window with a length of 30 frames (150 milliseconds).
As the above method computes a notewise correction, it is based on the assumption that the detuning will be approximately constant along a note. However, this is not always the case, especially for longer notes. There can for instance be a pitch trend along a note’s duration, which may sound like the singer is slowly trying to reach the correct pitch. To reduce this kind of detuning, we divide longer notes in smaller sub-note segments, and compute the per-segment correction as described above. However, prior to the final smoothing step, instead of a constant correction per segment, we obtain the framewise correction by linearly interpolating each segment’s correction at its center.

Appendix C. Model Hyperparameters

Table A1 lists the hyperparameters for the timbre model and pitch model, which both use the same modified WaveNet architecture. Table A2 list the hyperparameters for timing models, which use a simpler architecture. All models are trained using the Adam optimizer [43] with standard parameters β 1 = 0.9 , β 2 = 0.999 , ϵ = 1 × 10 8 ; initial learning rates and inverse time decays are listed in the tables. Training a complete system takes around 10 h on a single Titan X Pascal GPU. While we found these settings to work well experimentally, they have not been exhaustively optimized.
Table A1. Hyperparameters for networks based on WaveNet architecture.
HyperparameterTimbre ModelPitch Model
HarmonicAperiodicV/UVF0
Feature dimensionality60411
Additional inputs (dim.)-harmonic (60)harmonic (60)-
aperiodic (4)
Control inputs prev. phn. class (one-hot)
cur. phn. class (one-hot)
next phn. class (one-hot)
prev. phn. identity (one-hot)pos.-in-phn. (coarse)
cur. phn. identity (one-hot)prev. note pitch (one-hot)
next phn. identity (one-hot)cur. note pitch (one-hot)
pos.-in-phn. (coarse)next note pitch (one-hot)
F0 (coarse)prev. note dur. (coarse)
cur. note dur. (coarse)
next note dur. (coarse)
pos.-in-note (coarse)
Input noise level λ 0.40.40.40.4
Generation temperature τ piecewise linear0.01-0.01
(0,0.05; 3,0.05;
8,0.5; 60,0.5)
Initial causal convolution 10 × 1 10 × 1 10 × 1 20 × 1
Residual channels1302020100
Dilated convolutions 2 × 1 2 × 1 2 × 1 2 × 1
Num. layers55513
Num. layers per stage3337
Dilation factors1, 2, 4, 1, 21, 2, 4, 1, 21, 2, 4, 1, 21, 2, 4, 8, 16, 32, 64,
1, 2, 4, 8, 16, 32
Receptive field (ms)1001001001050
Skip channels240164100
Output stagetanh → 1 × 1 tanh → 1 × 1 tanh → 1 × 1 tanh → 1 × 1
60 × CGM K = 4 4 × CGM K = 4 1 × sigmoid 1 × CGM K = 4
Batch size32323264
Num. valid out timesteps210210210105
Learning rate5 × 10−4,5 × 10−4,5 × 10−4,1 × 10⁻³,
(initial, decay, interval)1 × 10⁻⁵, 11 × 10−5, 11 × 10−5, 1-
Num. epochs (updates)1650 (82,500)1650 (82,500)1650 (82,500)235 (11,750)
Table A2. Hyperparameters for timing networks.
HyperparameterNote TimingPhoneme Duration
Input featuresnote duration (one-hot)phoneme identity (one-hot)
prev. note duration (one-hot)phoneme class (one-hot)
1st phoneme class (one-hot)phoneme is vowel
note position in bar (normalized)phoneme kind (onset/nucleus/coda/inner)
note is restnote duration (one-hot)
num. coda consonants prev. noteprev. note duration (one-hot)
prev. note is restnext note duration (one-hot)
Target range (frames)[−15,14], [−30,29] for rests[5, 538]
Target discretization30 bins, linear50 bins, log scale
Architectureinput → dropout (0.81)
1 × 1 256 × ReLU → dropout (0.9)
1 × 1 64 × ReLU → dropout (0.9)
1 × 1 32 × ReLU → dropout (0.81)
1 × 1 → 30-way softmax
input → dropout (0.8)
3 × 1 256 × gated tanh → dropout (0.8)
3 × 1 (dilation = 2) → 64 × gated tanh
→ dropout (0.8)
1 × 1 32 × gated tanh → dropout (0.64)
1 × 1 → 50-way softmax
Batch size3216
Learning rate2 × 10−42 × 10−4
Number of epochs140210

References

  1. Bonada, J.; Umbert, M.; Blaauw, M. Expressive singing synthesis based on unit selection for the singing synthesis challenge 2016. In Proceedings of the 17th Annual Conference of the International Speech Communication Association (Interspeech), San Francisco, CA, USA, 8–12 September 2016; pp. 1230–1234. [Google Scholar]
  2. Bonada, J.; Serra, X. Synthesis of the Singing Voice by Performance Sampling and Spectral Models. IEEE Signal Process. Mag. 2007, 24, 67–79. [Google Scholar] [CrossRef]
  3. Saino, K.; Zen, H.; Nankaku, Y.; Lee, A.; Tokuda, K. An HMM-based singing voice synthesis system. In Proceedings of the 9th International Conference on Spoken Language Processing (ICSLP—Interspeech), Pittsburgh, PA, USA, 17–21 September 2006; pp. 2274–2277. [Google Scholar]
  4. Oura, K.; Mase, A.; Yamada, T.; Muto, S.; Nankaku, Y.; Tokuda, K. Recent development of the HMM-based singing voice synthesis system—Sinsy. In Proceedings of the 7th ISCA Workshop on Speech Synthesis (SSW7), Kyoto, Japan, 22–24 September 2010; pp. 211–216. [Google Scholar]
  5. Van den Oord, A.; Dieleman, S.; Zen, H.; Simonyan, K.; Vinyals, O.; Graves, A.; Kalchbrenner, N.; Senior, A.W.; Kavukcuoglu, K. WaveNet: A generative model for raw audio. CoRR arXiv 2016, arXiv:1609.03499. [Google Scholar]
  6. Blaauw, M.; Bonada, J. A neural parametric singing synthesizer. In Proceedings of the 18th Annual Conference of the International Speech Communication Association (Interspeech), Stockholm, Sweden, 20–24 August 2017; pp. 1230–1234. [Google Scholar]
  7. Yu, F.; Koltun, V. Multi-Scale Context Aggregation by Dilated Convolutions. In Proceedings of the 4th International Conference on Learning Representations (ICLR), San Juan, Puerto Rico, 2–4 May 2016. [Google Scholar]
  8. He, K.; Zhang, X.; Ren, S.; Sun, J. Deep residual learning for image recognition. In Proceedings of the 34th IEEE Conference on Computer Vision and Pattern Recognition (CVPR), Las Vegas, NV, USA, 27–30 June 2016; pp. 770–778. [Google Scholar]
  9. Reed, S.; van den Oord, A.; Kalchbrenner, N.; Bapst, V.; Botvinick, M.; de Freitas, N. Generating Interpretable Images with Controllable Structure; Technical Report; Google DeepMind: London, UK, 2016. [Google Scholar]
  10. Van den Oord, A.; Kalchbrenner, N.; Vinyals, O.; Espeholt, L.; Graves, A.; Kavukcuoglu, K. Conditional image generation with PixelCNN decoders. In Proceedings of the Advances in Neural Information Processing Systems 29 (NIPS), Barcelona, Spain, 5–10 December 2016; pp. 4790–4798. [Google Scholar]
  11. Van den Oord, A.; Kalchbrenner, N.; Kavukcuoglu, K. Pixel recurrent neural networks. In Proceedings of the 33rd International Conference on Machine Learning (ICML), New York, NY, USA, 19–24 June 2016; Volume 48, pp. 1747–1756. [Google Scholar]
  12. Salimans, T.; Karpathy, A.; Chen, X.; Kingma, D.P. PixelCNN++: Improving the PixelCNN with discretized logistic mixture likelihood and other modifications. In Proceedings of the 5th International Conference on Learning Representations (ICLR), Toulon, France, 24–26 April 2017. [Google Scholar]
  13. Blaauw, M.; Bonada, J. A Singing Synthesizer Based on PixelCNN. Presented at the María de Maeztu Seminar on Music Knowledge Extraction Using Machine Learning (Collocated with NIPS). Available online: http://www.dtic.upf.edu/~mblaauw/MdM_NIPS_seminar/ (accessed on 1 October 2017).
  14. Ranzato, M.; Chopra, S.; Auli, M.; Zaremba, W. Sequence level training with recurrent neural networks. In Proceedings of the 4th International Conference on Learning Representations (ICLR), San Juan, Puerto Rico, 2–4 May 2016. [Google Scholar]
  15. Wang, X.; Takaki, S.; Yamagishi, J. A RNN-based quantized F0 model with multi-tier feedback links for text-to-speech synthesis. In Proceedings of the 18th Annual Conference of the International Speech Communication Association (Interspeech), Stockholm, Sweden, 20–24 August 2017; pp. 1059–1063. [Google Scholar]
  16. Taylor, P. Text-to-Speech Synthesis; Cambridge University Press: Cambridge, UK, 2009; Chapter 9.1.4; p. 229. [Google Scholar]
  17. Umbert, M.; Bonada, J.; Blaauw, M. Generating singing voice expression contours based on unit selection. In Proceedings of the 4th Stockholm Music Acoustics Conference (SMAC), Stockholm, Sweden, 30 July–3 August 2013; pp. 315–320. [Google Scholar]
  18. Mase, A.; Oura, K.; Nankaku, Y.; Tokuda, K. HMM-based singing voice synthesis system using pitch-shifted pseudo training data. In Proceedings of the 11th Annual Conference of the International Speech Communication Association (Interspeech), Makuhari, Chiba, Japan, 26–30 September 2010; pp. 845–848. [Google Scholar]
  19. Nakamura, K.; Oura, K.; Nankaku, Y.; Tokuda, K. HMM-based singing voice synthesis and its application to Japanese and English. In Proceedings of the 39th IEEE International Conference on Acoustics, Speech and Signal Processing (ICASSP), Florence, Italy, 4–9 May 2014; pp. 265–269. [Google Scholar]
  20. Arik, S.Ö.; Diamos, G.; Gibiansky, A.; Miller, J.; Peng, K.; Ping, W.; Raiman, J.; Zhou, Y. Deep voice 2: Multi-speaker neural text-to-speech. In Proceedings of the Advances in Neural Information Processing Systems 30 (NIPS), Long Beach, CA, USA, 4–9 December 2017. [Google Scholar]
  21. Morise, M.; Yokomori, F.; Ozawa, K. WORLD: A vocoder-based high-quality speech synthesis system for real-time applications. IEICE Trans. Inf. Syst. 2016, 99, 1877–1884. [Google Scholar] [CrossRef]
  22. Morise, M. D4C, a band-aperiodicity estimator for high-quality speech synthesis. Speech Commun. 2016, 84, 57–65. [Google Scholar] [CrossRef]
  23. Tokuda, K.; Kobayashi, T.; Masuko, T.; Imai, S. Mel-generalized cepstral analysis—A unified approach to speech spectral estimation. In Proceedings of the 3rd International Conference on Spoken Language Processing (ICSLP), Yokohama, Japan, 18–22 September 1994. [Google Scholar]
  24. Ueda, N.; Nakano, R. Deterministic annealing EM algorithm. Neural Netw. 1998, 11, 271–282. [Google Scholar] [CrossRef]
  25. Ramachandran, P.; Paine, T.L.; Khorrami, P.; Babaeizadeh, M.; Chang, S.; Zhang, Y.; Hasegawa-Johnson, M.; Campbell, R.; Huang, T. Fast generation for convolutional autoregressive models. In Proceedings of the 5th International Conference on Learning Representations (ICLR), Toulon, France, 24–26 April 2017. [Google Scholar]
  26. Arik, S.Ö.; Chrzanowski, M.; Coates, A.; Diamos, G.; Gibiansky, A.; Kang, Y.; Li, X.; Miller, J.; Raiman, J.; Sengupta, S.; et al. Deep voice: Real-time neural text-to-speech. In Proceedings of the 34th International Conference on Machine Learning (ICML), Stockholm, Sweden, 10–15 July 2017; pp. 195–204. [Google Scholar]
  27. Kalchbrenner, N.; van den Oord, A.; Simonyan, K.; Danihelka, I.; Vinyals, O.; Graves, A.; Kavukcuoglu, K. Video pixel networks. CoRR arXiv 2016, arXiv:1610.00527. [Google Scholar]
  28. Kalchbrenner, N.; Espeholt, L.; Simonyan, K.; van den Oord, A.; Graves, A.; Kavukcuoglu, K. Neural machine translation in linear time. CoRR arXiv 2016, arXiv:1610.10099. [Google Scholar]
  29. Mehri, S.; Kumar, K.; Gulrajani, I.; Kumar, R.; Jain, S.; Sotelo, J.; Courville, A.C.; Bengio, Y. SampleRNN: An unconditional end-to-end neural audio generation model. In Proceedings of the 5th International Conference on Learning Representations (ICLR), Toulon, France, 24–26 April 2017. [Google Scholar]
  30. Sotelo, J.; Mehri, S.; Kumar, K.; Santos, J.F.; Kastner, K.; Courville, A.; Bengio, Y. Char2Wav: End-to-End speech synthesis. In Proceedings of the 5th International Conference on Learning Representations (ICLR), Toulon, France, 24–26 April 2017. [Google Scholar]
  31. Wang, Y.; Skerry-Ryan, R.J.; Stanton, D.; Wu, Y.; Weiss, R.J.; Jaitly, N.; Yang, Z.; Xiao, Y.; Chen, Z.; Bengio, S.; et al. Tacotron: A fully end-to-end text-to-speech synthesis model. In Proceedings of the 18th Annual Conference of the International Speech Communication Association (Interspeech), Stockholm, Sweden, 20–24 August 2017; pp. 4006–4010. [Google Scholar]
  32. Zen, H.; Senior, A. Deep mixture density networks for acoustic modeling in statistical parametric speech synthesis. In Proceedings of the 39th IEEE International Conference on Acoustics, Speech, and Signal Processing (ICASSP), Florence, Italy, 4–9 May 2014; pp. 3872–3876. [Google Scholar]
  33. Zen, H.; Sak, H. Unidirectional long short-term memory recurrent neural network with recurrent output layer for low-latency speech synthesis. In Proceedings of the 40th IEEE International Conference on Acoustics, Speech, and Signal Processing (ICASSP), South Brisbane, QLD, Australia, 19–24 April 2015; pp. 4470–4474. [Google Scholar]
  34. Tokuda, K.; Yoshimura, T.; Masuko, T.; Kobayashi, T.; Kitamura, T. Speech parameter generation algorithms for HMM-based speech synthesis. In Proceedings of the 25th IEEE International Conference on Acoustics, Speech, and Signal Processing (ICASSP), Istanbul, Turkey, 5–9 June 2000; Volume 3, pp. 1315–1318. [Google Scholar]
  35. Oura, K.; Mase, A.; Nankaku, Y.; Tokuda, K. Pitch adaptive training for HMM-based singing voice synthesis. In Proceedings of the 37th IEEE International Conference on Acoustics, Speech and Signal Processing (ICASSP), Kyoto, Japan, 25–30 March 2012; pp. 5377–5380. [Google Scholar]
  36. Shirota, K.; Nakamura, K.; Hashimoto, K.; Oura, K.; Nankaku, Y.; Tokuda, K. Integration of speaker and pitch adaptive training for HMM-based singing voice synthesis. In Proceedings of the 39th IEEE International Conference on Acoustics, Speech and Signal Processing (ICASSP), Florence, Italy, 4–9 May 2014; pp. 2559–2563. [Google Scholar]
  37. Nishimura, M.; Hashimoto, K.; Oura, K.; Nankaku, Y.; Tokuda, K. Singing voice synthesis based on deep neural networks. In Proceedings of the 17th Annual Conference of the International Speech Communication Association (Interspeech), San Francisco, CA, USA, 8–12 September 2016; pp. 2478–2482. [Google Scholar]
  38. Zen, H.; Nose, T.; Yamagishi, J.; Sako, S.; Masuko, T.; Black, A.W.; Tokuda, K. The HMM-based speech synthesis system (HTS) version 2.0. In Proceedings of the 6th ISCA Workshop on Speech Synthesis (SSW6), Bonn, Germany, 22–24 August 2007; pp. 294–299. [Google Scholar]
  39. Iglewicz, B.; Hoaglin, D.C. How to Detect and Handle Outliers; ASQC Basic References in Quality Control; ASQC Quality Press: Milwaukee, WI, USA, 1993. [Google Scholar]
  40. Takamichi, S.; Toda, T.; Black, A.W.; Neubig, G.; Sakti, S.; Nakamura, S. Postfilters to modify the modulation spectrum for statistical parametric speech synthesis. IEEE/ACM Trans. Audio Speech Lang. Process. 2016, 24, 755–767. [Google Scholar] [CrossRef]
  41. Umbert, M.; Bonada, J.; Goto, M.; Nakano, T.; Sundberg, J. Expression control in singing voice synthesis: Features, approaches, evaluation, and challenges. IEEE Signal Process. Mag. 2015, 32, 55–73. [Google Scholar] [CrossRef]
  42. ITU-R Recommendation BS.1534-3. Method for the Subjective Assessment of Intermediate Quality Levels of Coding Systems; Technical Report; International Telecommunication Union: Geneva, Switzerland, 2015. [Google Scholar]
  43. Kingma, D.P.; Ba, J.L. Adam: A method for stochastic optimization. In Proceedings of the 3rd International Conference on Learning Representations (ICLR), San Diego, CA, USA, 7–9 May 2015. [Google Scholar]
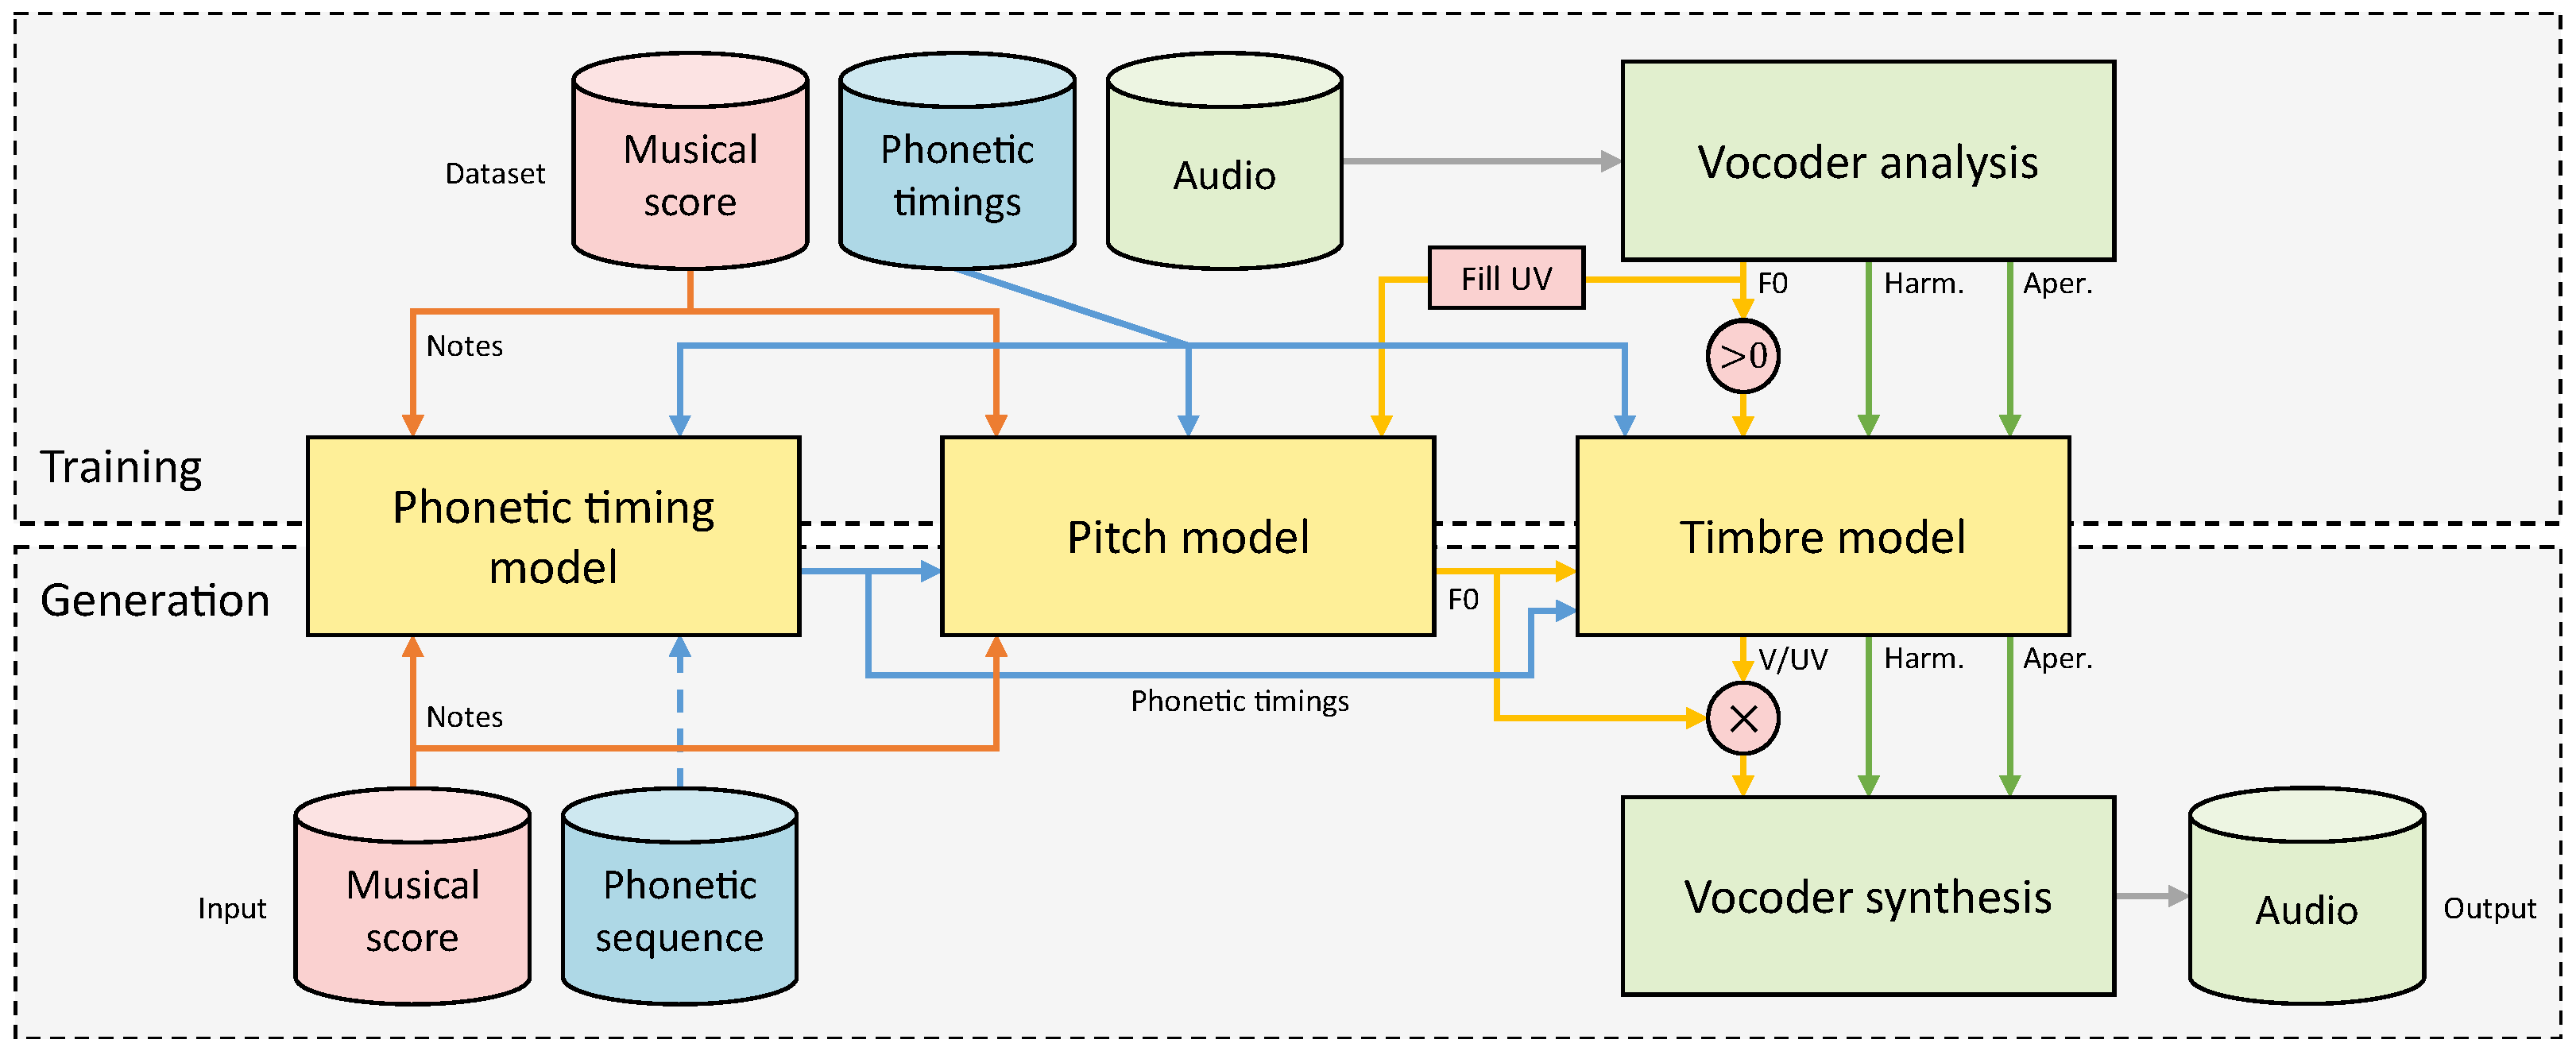
Figure 1. Diagram depicting an overview of the system with its different components. Here, V/UV is the predicted voice/unvoiced decision, and the Fill UV block fills unvoiced isegments by interpolation.
Applsci 07 01313 g001
Figure 2. Overview of the modified WaveNet network architecture. In this case, the network depicted predicts harmonic spectral envelope features (top-right and bottom), given control inputs (mid-right).
Applsci 07 01313 g002
Figure 3. Example distributions of the constrained mixture density output. All subplots use location ξ = 0 and scale ω = 6 × 10 2 , but varying skewness α and shape β . The plots show the resulting mixture distributions (solid) and the four underlying Gaussian components (dashed).
Applsci 07 01313 g003
Figure 4. Diagram depicting the cascaded multistream architecture for training and generation phases. The “ z 1 ” blocks represent unit delays. The upward inputs represent control inputs, shared between all streams. Autoregressive connections in generation phase are not shown.
Applsci 07 01313 g004
Figure 5. Comparing the average modulation spectrum of harmonic Mel-Generalized Coefficient (MGC) features. In the plotted excerpt, the relation between pitch and timbre during vibratos can be observed.
Applsci 07 01313 g005
Figure 6. Comparing the average modulation spectrum of log F0 contours predicted by various systems and natural singing.
Applsci 07 01313 g006
Figure 7. Results of the preference test for systems trained on pseudo singing. The Sinsy-HMM and Sinsy-DNN systems were excluded from this comparison, as the only available models are trained on natural singing.
Applsci 07 01313 g007
Table 1. Quantitative results for the timbre models trained on natural singing. Note that for the IS16 system the Modulation Spectrum Log Spectral Distortion (MS-LSD) and Voiced/Unvoiced (V/UV) metrics are omitted as it does not use predicted harmonic features (MS-LSD is computed from predicted features, not analyzed features) or V/UV decision. The HTS system is only considered when comparing systems trained on pseudo singing, but should be roughly equivalent to Sinsy-HMM.
SystemHarmonicAperiodicV/UV
MCD (dB)MS-LSD (<25 Hz/Full, dB)BAPD (dB)FPR (%)FNR (%)
IS166.94-3.84-
Sinsy-HMM7.018.09/18.504.0915.900.68
Sinsy-DNN5.4113.76/29.875.0213.750.63
NPSS5.547.60/11.653.4416.320.64
Table 2. Quantitative results for the timing models trained on natural singing. The table lists Mean Absolute Error (MAE) and Root Mean Squared Error (RMSE), both in 5 ms frames, and Pearson correlation coefficient r. Note that the Sinsy-DNN system uses the same HMM-based duration model as the Sinsy-HMM system, so it is excluded from the comparison. The IS16 system used durations predicted by the NPSS system. The HTS system is only considered when comparing systems trained on pseudo singing, but should be roughly equivalent to Sinsy-HMM.
SystemNote Onset DeviationsNote Offset DeviationsConsonant Durations
MAERMSErMAERMSErMAERMSEr
Sinsy-HMM7.1079.0270.37913.80017.7550.6994.0225.2620.589
NPSS6.1288.3830.41912.10018.6450.7133.7194.9790.632
Table 3. Quantitative results of pitch models trained on natural singing. Table shows log F0 Modulation Spectrum Log Spectral Distortion (MS-LSD) in dB. The F0 Root Mean Squared Error (RMSE) in cents and Pearson correlation coefficient r are also given for reference. The IS16 and HTS systems are excluded from this comparison because they are not suitable for modeling F0 from natural singing.
SystemMS-LSD (<25 Hz, dB)RSME (Cents)r
Sinsy-HMM5.05281.7950.977
Sinsy-DNN2.85883.7060.976
NPSS2.008105.9800.963
Table 4. Quantitative results for the timbre models trained on pseudo singing, separated by voice/language. The IS16 system is excluded from the quantitative metrics because removing utterances from the dataset to use for testing would mean missing diphones would have to be replaced. The Sinsy-HMM and Sinsy-DNN systems were excluded from this comparison, as the only available models are trained on natural singing. The listed metrics are Mel-Cepstral Distortion (MCD) and Modulation Spectrum Log Spectral Distortion (MS-LSD) for harmonic features, Band Aperiodicity Distortion (BAPD) for aperiodic features, and False Positive Rate (FPR) and False Negative Rate (FNR) for voiced/unvoiced (V/UV) features.
Voice (Language)SystemHarmonicAperiodicV/UV
MCD (dB)MS-LSD (<25 Hz/Full, dB)BAPD (dB)FPR (%)FNR (%)
M1 (Eng.)HTS4.9511.09/22.442.7216.102.46
NPSS5.147.79/8.182.4411.222.65
F1 (Eng.)HTS4.7510.25/22.094.0715.601.01
NPSS4.955.68/9.043.8315.790.56
F2 (Spa.)HTS4.8811.07/22.283.621.852.21
NPSS5.278.02/6.593.381.403.20
Table 5. Mean opinion scores for systems trained on natural singing, displayed on a 1–5 scale with their respective 95% confidence intervals. The HTS system is only considered when comparing systems trained on pseudo singing, but should be roughly equivalent to Sinsy-HMM.
SystemMean Opinion Score
Hidden reference4.76 ± 0.04
IS162.36 ± 0.11
Sinsy-HMM2.98 ± 0.10
Sinsy-DNN2.77 ± 0.10
NPSS3.43 ± 0.11