Article

Performance of Time Reversal Based Underwater Target Detection in Shallow Water

1
School of Electronic Engineering, Soongsil University, Seoul 06978, Korea
2
Agency of Defences and Developments, Jinhae 51678, Korea
*
Author to whom correspondence should be addressed.
These authors contributed equally to this work.
Appl. Sci. 2017, 7(11), 1180; https://doi.org/10.3390/app7111180
Submission received: 30 September 2017 / Accepted: 13 November 2017 / Published: 16 November 2017
(This article belongs to the Section Acoustics and Vibrations)

Abstract

:
In this paper, a scheme based on the time reversal technique is proposed to improve the detection performance for detecting a cylindrical object bottoming at the seafloor in shallow water. When the time reversal technique is applied to the response of the clutter with the strong time-varying characteristic of shallow water, it is difficult to obtain a high peak response. However, in the case where a cylindrical object is placed on the seafloor because the time-invariant property of the target response is stronger than the time-varying property of the reverberation by the clutters, the time reversal technique can be applied to enhance the target signal. In this paper, it is demonstrated that the peak due to the target that is contacted at the seabed becomes higher when applying the time reversal technique. The performance is investigated by using numerical computation of the probability of detection for various probabilities of false alarm and computer simulation.

1. Introduction

Detection of objects bottoming at the sea floor in shallow water is a very important problem. It is also essential in underwater exploration for protecting the underwater environment, and is a critical technology in the field of military detection.
A side scan sonar is mainly applied in conventional methods to obtain images within detection fields, and studies have been performed to recognize cylindrical targets by using image signal processing [1,2,3,4,5]. The sonar images used in this process are composed of the intensities of sound waves scattered on the seabed surface or on the target. The resolution of these images is very low, and owing to severe noise it is impossible to detect objects during real-time processing. In addition, since frequencies higher than 100 kHz are used, the detection distance is very short, and the sonar sensors must be towed at very low speed to obtain clean images in which the detection field is relatively narrow. Meanwhile, mid-frequencies are currently used to detect sea mines at the bottom of the seabed in shallow seas. The Applied Physics Lab (APL) at the University of Washington in the United States of America conducted research on the scattering of sound waves from a 1∼2 m-long target [6,7]. In the study, frequencies of 1∼30 kHz are used to conduct comparative research between actual test data and simulation data on the scattering of sound waves in various cylindrical objects. Research is performed on the signal intensity reflected from the target rather than the images of the target, and characteristics on the seabed in contact with the target are modeled.
In shallow water environments with fast current such as the Yellow Sea in Korea, the detection problem is more difficult. Note that the average speed of 74.0 cm/s with the maximum speed of 172.6 cm/s has been observed near the Taean Peninsula in the Yellow Sea [8], and its sediment consists of 85% gravel and 15% sand on average [9]. This is a very complicated area that includes coastal fronts and swirls, substantial tides and currents, abundant sea life, and high ship traffic. These factors are changing temporally and/or spatially, and combine to create a difficult detection problem [10,11]. When detecting a target via active sonar, the received signal includes not only the target response but also the clutter response due to surrounding objects. Furthermore, the effect of clutter becomes stronger in the shallow water environment. It is not easy to model the channels of the clutters because of their time-varying characteristics. Studies on channel modeling in shallow water have been actively conducted [12]. Clutter is the factor that interferes with the detection of targets [13]. Intensive studies on reducing the influence of clutter or identifying objects and clutter have been done in various ways [14]. In the sonar system, as the complexity of the channel structure increases, detection performance deteriorates exponentially.
Since M. Fink and his group proposed the time reversal techniques in acoustics [15,16,17], research has been carried out in a variety of fields, from electromagnetism to underwater acoustics. Significant theoretical and experimental efforts have been made to improve the detection and imaging algorithms in a considerable scattering environment [18,19,20,21]. The time reversal technique requires that targets are in uniform background media [22] in order to obtain clean images. In terms of detection, the target signal is usually covered or disturbed by the clutter signal. By capturing the received wave which radiated from the source and retransmitting the time-reversed waveform of the captured signal to the channel for reception, the energy of the wave can be focused at a specific position [23,24]. Note that retransmitting the time reversal signal from the received signal is a kind of matched filtering for the time-invariant components, while it is a kind of energy spreading for the time-varying components [25]. The time domain correlation analysis according to distance and frequency shows that the time-varying characteristics of the shallow water channel become stronger as the distance becomes longer and as the frequency increases [26]. For this reason, the time reversal technique can achieve good performance even if the scattering environment is complicated. As the time-varying property of the clutter signal becomes stronger, the detection performance improves because the time coherence of the clutter signal is decreasing while the target signal is time-invariant.
In this paper, a method is proposed to improve the detection performance using the time reversal technique in the situation where the clutter is mixed in the shallow water. By using the wave focusing effect of the time reversal technique, the peak response of the target can appear prominently. In this work, it is considered that the cylindrical object is resting on the sea floor. In this case the sea floor consists of soft sediment and there are gravel, sand, and seaweed in the current, whose scattering can cover target scattering to mask detection via active sonar. It is assumed that these clutters are time-varying and K-distributed. Therefore, when the time reversal technique is applied to the received signal from the clutter with time-varying characteristics, it is difficult to obtain a high peak response. However, for the scattering waveform of the cylindrical object considered in this work, because the time-varying characteristic of the target response is weaker than that of the reverberation by the clutter, the time reversal technique can increase the peak of the target signal.
The paper is organized as follows. The peak enhancement using the time reversal technique and the proposed method are described and the probability of detection is numerically evaluated in Section 2. Section 3 presents the cylindrical target model and the clutter model. Section 4 presents the performance evaluation through computer simulation. Finally, Section 5 concludes the paper.

2. Target Peak Enhancement Using Time Reversal Processing

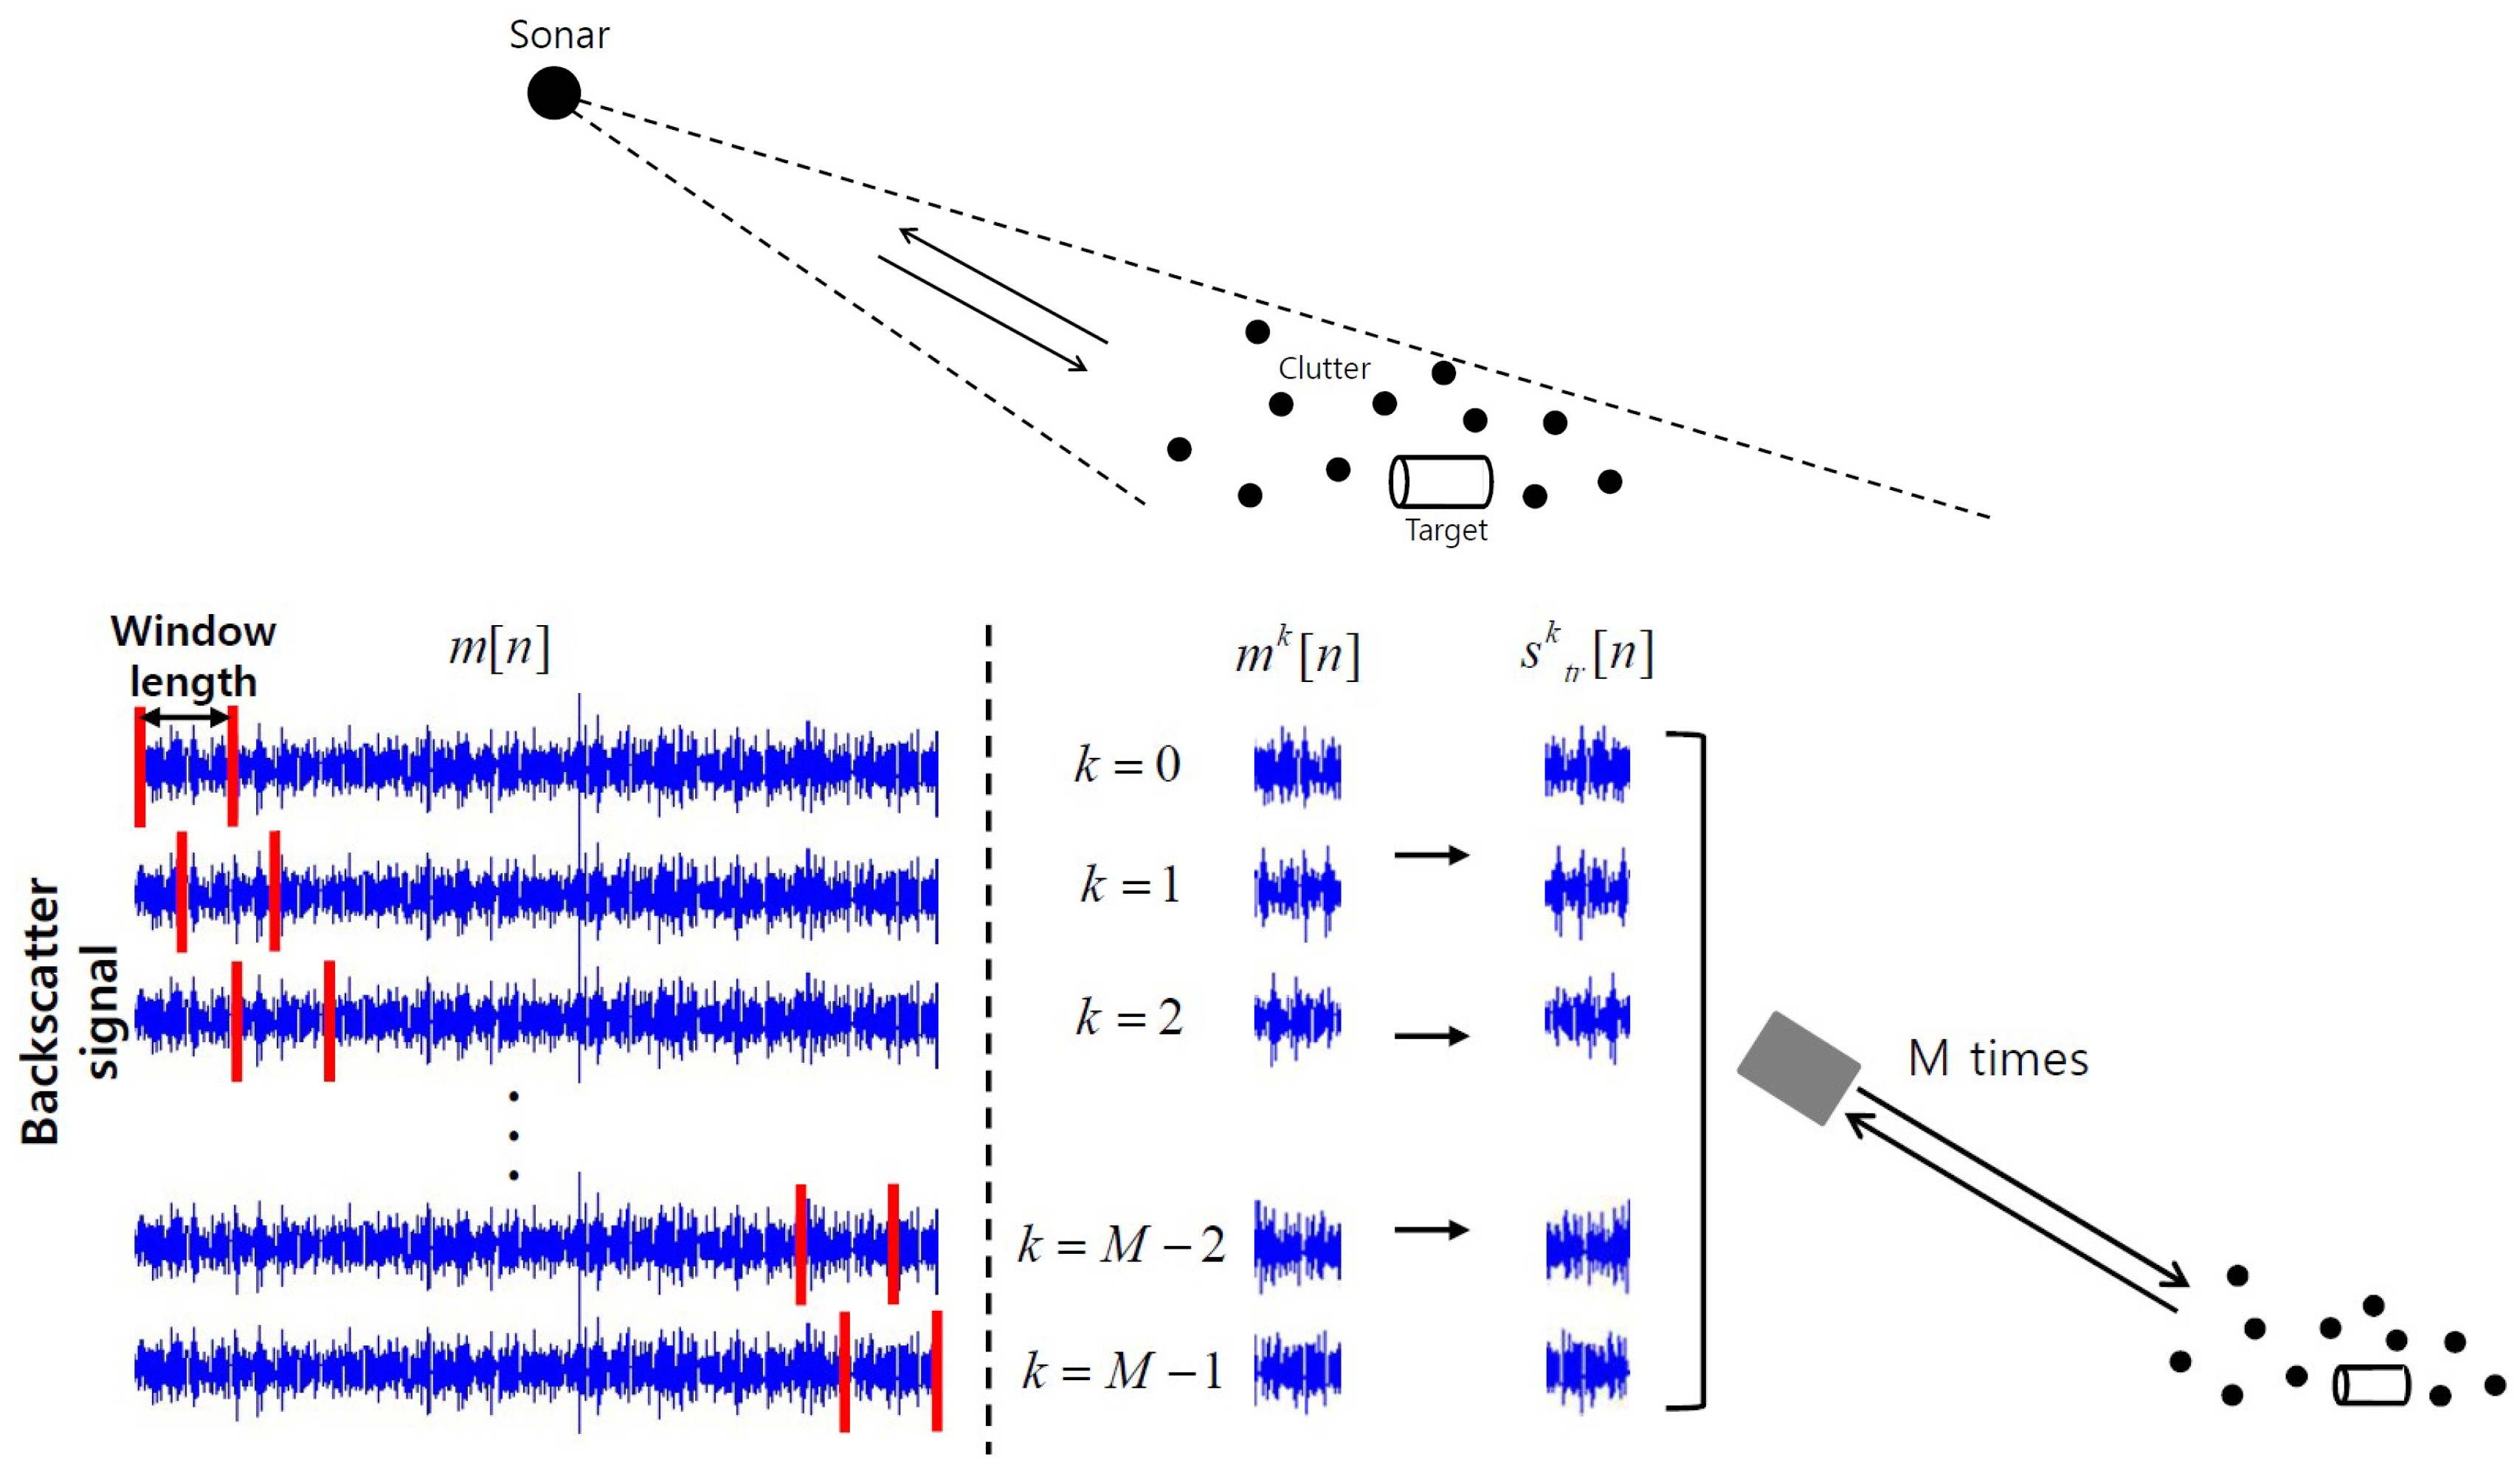
2.1. Concept of the Time Reversal Scheme

In this section, the idea of the time reversal processing is introduced under the time-varying channel h ( t , τ ) . This channel represents the signal traveling path from the source to resolution cell of the sonar and back to the receiver of the sonar. This channel can be assumed to be time-varying since the channel is affected by the clutter in the resolution cell. Furthermore, for the case where the target is placed in the resolution cell, the channel is a superposition of the time-varying component due to the clutter and the time-invariant one from the target. Time reversal processing has the spatial-temporal focusing property by retransmitting a time-reversed waveform of the received signal [27]. This process can be conceptually described as follows.
The Fourier transform R ( t , ω ) of the received signal r ( t , τ ) through the channel with its impulse response h ( t , τ ) = F 1 { H ( t , ω ) } at time t is given by
R ( t , ω ) = H ( t , ω ) S ( ω ) ,
where S ( ω ) is the Fourier transform of a transmission signal s ( τ ) . Then, the time-reversed transmission signal S t r ( t , ω ) at time t is given by
S t r ( t , ω ) = [ R ( t , ω ) S * ( ω ) ] * = R * ( t , ω ) S ( ω ) ,
where the superscript ∗ denotes complex conjugation. The received signal R t r ( t o , ω ) for the time-reversed transmission signal S t r ( t , ω ) at time t o t is as follows:
R t r ( t o , ω ) = H ( t o , ω ) S t r ( t , ω ) = H ( t o , ω ) R * ( t , ω ) S ( ω ) = H ( t o , ω ) H * ( t , ω ) S * ( ω ) S ( ω ) = H ( t o , ω ) H * ( t , ω ) | S ( ω ) | 2 .
This shows that the waveform R t r ( t o , ω ) contains the time varying spectrum of H ( t o , ω ) H * ( t , ω ) . When the channel is time-invariant H ( t o , ω ) = H ( t , ω ) , the received signal R t r ( t o , ω ) contains the power spectrum H ( t , ω ) 2 , t = t o , which means a peak.
In this work, the case of detecting a cylindrical object bottoming at seafloor in shallow water is considered as shown in Figure 1. A test of two hypotheses can be applied to this investigation. In the null hypothesis, H 0 , the channel of shallow water is characterized only by clutter. In the alternative hypothesis H 1 , a cylindrical target is also present. This problem can be written as follows:
H 0 : H ( t , ω ) = H c ( t , ω ) H 1 : H ( t , ω ) = H c ( t , ω ) + H t g ( t , ω ) ,
where H c ( t , ω ) represents the time-varying component due to the clutter while H t g ( t , ω ) represents the component due to the target. Note that the time-varying characteristics of the clutter and target channels are different in shallow water since the target is bottoming at the seabed. The reverberation by clutter in shallow water has the time-varying power level [12], but the scattering by a cylindrical object is dependent on the size of the cylinder and its angles with respect to the source because the target is stationary. Therefore, the target channel H t g ( t , ω ) is independent of time t. That is, H t g ( t , ω ) = H t g ( ω ) , which allows the hypotheses in Equation (4) to be rewritten as follows:
H 0 : R t r ( t o , ω ) = H c ( t o , ω ) H c * ( t , ω ) | S ( ω ) | 2 H 1 : R t r ( t o , ω ) = { H c ( t o , ω ) + H t g ( ω ) } { H c ( t , ω ) + H t g ( ω ) } * | S ( ω ) | 2 .
According to the time-varying property of the clutter channel, that is, H c ( t o , ω ) H c ( t , ω ) for t o t , in case of H 0 , the expectation of R t r ( t o , ω ) may be a small value, while in case of H 1 , the expectation of R t r ( t o , ω ) may have a high value due to the time-invariance of the target channel. When the time reversal technique is applied to the signal scattered by the clutter, the focusing of the waveform does not perform well due to the time-varying characteristics. However, in the case that the time reversal technique is applied to the section where the target exists, the pulse can be focused at the target position and it has a higher value than that without the time reversal technique.

2.2. Time-Reversed Signal Implementation

The sampled signal m [ n ] is given by matched filtering the received signal r ( t , τ ) at time t. The time-reversed retransmitted signal s t r k [ n ] , k = 0 , , K 1 , n = 0 , , N 1 is given by
s t r k [ n ] = m k [ N 1 n ] m k [ n ] = m [ n ] { u [ n k L ] u [ n k L N + 1 ] } ,
where N is pulse length, L is sample interval, and u [ n ] is the unit step function. Thus, a total of K time reversed transmission signals are used. Figure 1 describes this implementation in Equation (6).

2.3. Detection Performance Comparison

In this section, the proposed method is compared to the conventional matched filtering with a threshold in terms of detection probability. Since the detection problem is a binary hypothesis testing problem, the likelihood ratio test is employed. For this, the probability density function of the received signal is required. In this development, the clutter signal has the K-distribution while the target signal has a constant intensity P t . A sketch of the derivation for the following probability density function (pdf) is presented in the Appendix.

2.3.1. Conventional Matched Filtering

After matched filtering, the clutter signal intensity x has the K-distribution. Thus, the conditional pdf (probability density function) under the null hypothesis H 0 is given by
p ( x H 0 ) = 4 λ Γ ( α ) x λ α K α 1 2 x λ ,
while the pdf under the alternative hypothesis H 1 is
p ( x H 1 ) = 4 λ Γ ( α ) ( x P t ) λ α K α 1 2 ( x P t ) λ ,
where λ and α are the scale and shape parameters, which are dependent on the average size of the clutter and the number of the scatter in the resolution cell of the sonar, respectively. Γ ( · ) represents the gamma function.
The likelihood ratio test with threshold γ can be expressed as follows:
Select H 1 if p ( x H 1 ) p ( x H 0 ) = 1 P t x α K α 1 2 ( x P t ) λ K α 1 2 x λ > γ .
Then, the corresponding probability of detection is described by
P D = γ 4 λ Γ ( α ) ( x P t ) λ α K α 1 2 ( x P t ) λ d x ,
with the false alarm probability
γ 4 λ Γ ( α ) x λ α K α 1 2 x λ d x = P F A .

2.3.2. Time Reversal-Based Detection

It is difficult to obtain the pdf of the received signal for the retransmitted time-reversed signal in closed form. Thus, the probability of detection and the probability of false alarm are obtained by using the numerical method.
As mentioned in the earlier section, the initial return signal has the K-distributed intensity after matched filtering. Therefore, the retransmitted signal s t r k has the K-distribution. If the time-varying property of the channel is weak, passing the retransmitted signal through the channel results in the autocorrelation of the channel. However, the real channel is time-varying while the properties do not change suddenly compared to the previous channel [12,28]. This deviation is modeled by Gaussian noise. Therefore, the pdf of the current channel becomes the convolution between the previous channel’s K-distributed pdf f K 1 ( x ) and the Gaussian pdf f G ( x ) , where RV K 1 represents the intensity of the previously received signal (i.e., the previous clutter channel) and RV G is the deviation. Thus, the intensity of the received signal R 2 for the retransmitted signal is the correlation of K 2 = K 1 + G and K 1 , that is, R 2 = K 2 K 1 * , which implies the case that there is no target, the null hypothesis H 0 . For the case that a target exists, the alternative hypothesis H 1 , the intensity of the received signal includes the target signal intensity P t .
Figure 2 shows the probabilities of detection for the conventional and proposed schemes for various false alarm probabilities when the target-to-clutter ratio (TCR) varies from 15 dB to 10 dB. Note that the shape parameter α = 1 and the scale parameter λ = 1 . As observed in the figure, the proposed method is better than the conventional one by about 5 dB at a probability of detection of 0.9. TCR is measured by power spectral densities of the clutter and target signals, and is defined as follows:
T C R = B W H t g ( ω ) 2 B W H c ( ω ) 2 ,
where B W represents the band width that contains significant power.
In order to investigate the effect of the shape parameter α on the probability of detection, the probability of detection is numerically estimated as a function of the normalized target signal power with respect to the scale parameter; that is, S 0 = P t / λ for the probability of false alarm P F A = 0 . 005 . The shape parameter α is set to 1, 5, 10 and 20 while λ = 1 . Figure 3a,b demonstrate the probabilities of detection for the time reversal-based detection and the conventional detection, respectively. As observed in the figures, the probability of detection becomes worse as the shape parameter becomes larger ( α = 20 ), which converges to the Rayleigh distribution.

3. Target and Clutter Channel Modeling

The objective of this study is to detect a cylindrical object that is bottoming at the seabed as shown in Figure 1. For computer simulation and analysis, the target and clutter channel models are required, and the models employed in this study are presented in this section.

3.1. Cylindrical Target Channel Modeling

A model for the scattering of the cylindrical object in this study is based on the model proposed by Z. Ye [29]. This model assumes a closed cylinder with finite length and computes the scattering of body and end parts of the cylinder. This is developed by applying Kirchhoff’s scalar scattering theory to the problem of finite cylinders. The model describes the body and end scatterings of the object separately by dividing the surface area of the object into the cylindrical body and the flat end, respectively. In this study, the scattering of a cylinder of enclosed finite length is induced by combining the scattering of the body part and scattering from its ends [30,31].

3.2. Clutter Channel Modeling

Since the clutters, where scattering occurs, are randomly distributed underwater, the Rayleigh distribution is applied based on the central limit theorem (CLT), assuming that there are sufficient scatters in the resolution cell. However, recent advances in technology have made it possible for high-resolution active sonar systems to reduce the number of reverberant components that affect the given resolution cell. Therefore, if there are not many scatters in the resolution cell, the CLT cannot be applied, and non-Rayleigh distribution is applied. Furthermore, since the simulation in this paper assumes a shallow water environment of 100 m depth, the width of the resolution cell is not large, and non-Rayleigh distribution is applied considering finite scatters. D. A. Abraham and A. P. Lyons derived the reverberation signal using the K-distribution instead of the Rayleigh distribution under this assumption [28]. A time-varying finite impulse response filter was developed for the clutter channel in shallow water [12].

4. Simulation

The envelope of the received signal from the finite scatters forms the K-distribution, the shape parameter of the K-distribution is related to the number of scatters, and the scale parameter is determined by the average size of scatters. The K-distribution can be a good approximation because it is easy to apply to various environments and situations depending on shape parameters and scale parameters. Therefore, since the two parameters of the K-distribution can be a physical model of the submarine environment, a clutter channel with a K-distribution is applied by setting shape parameters and scale parameters according to the simulation environment.

4.1. Simulation Condition

In order to verify the performance of the proposed scheme by simulation, the target and clutter channels were modeled and Gaussian signals were added to the existing channel every time to simulate the time-varying characteristics of the shallow water acoustic channel. As the initial transmission signal, an LFM (linear frequency modulated) waveform having a bandwidth of 6–20 kHz was employed, and the sampling frequency was set to 44 kHz. An 18 degree beam covering a bottom distance of 100–200 m with a depth of 100 m below the sea surface was employed. The target signal was generated by Ye’s model with a length of 20 m and a radius of 2 m.

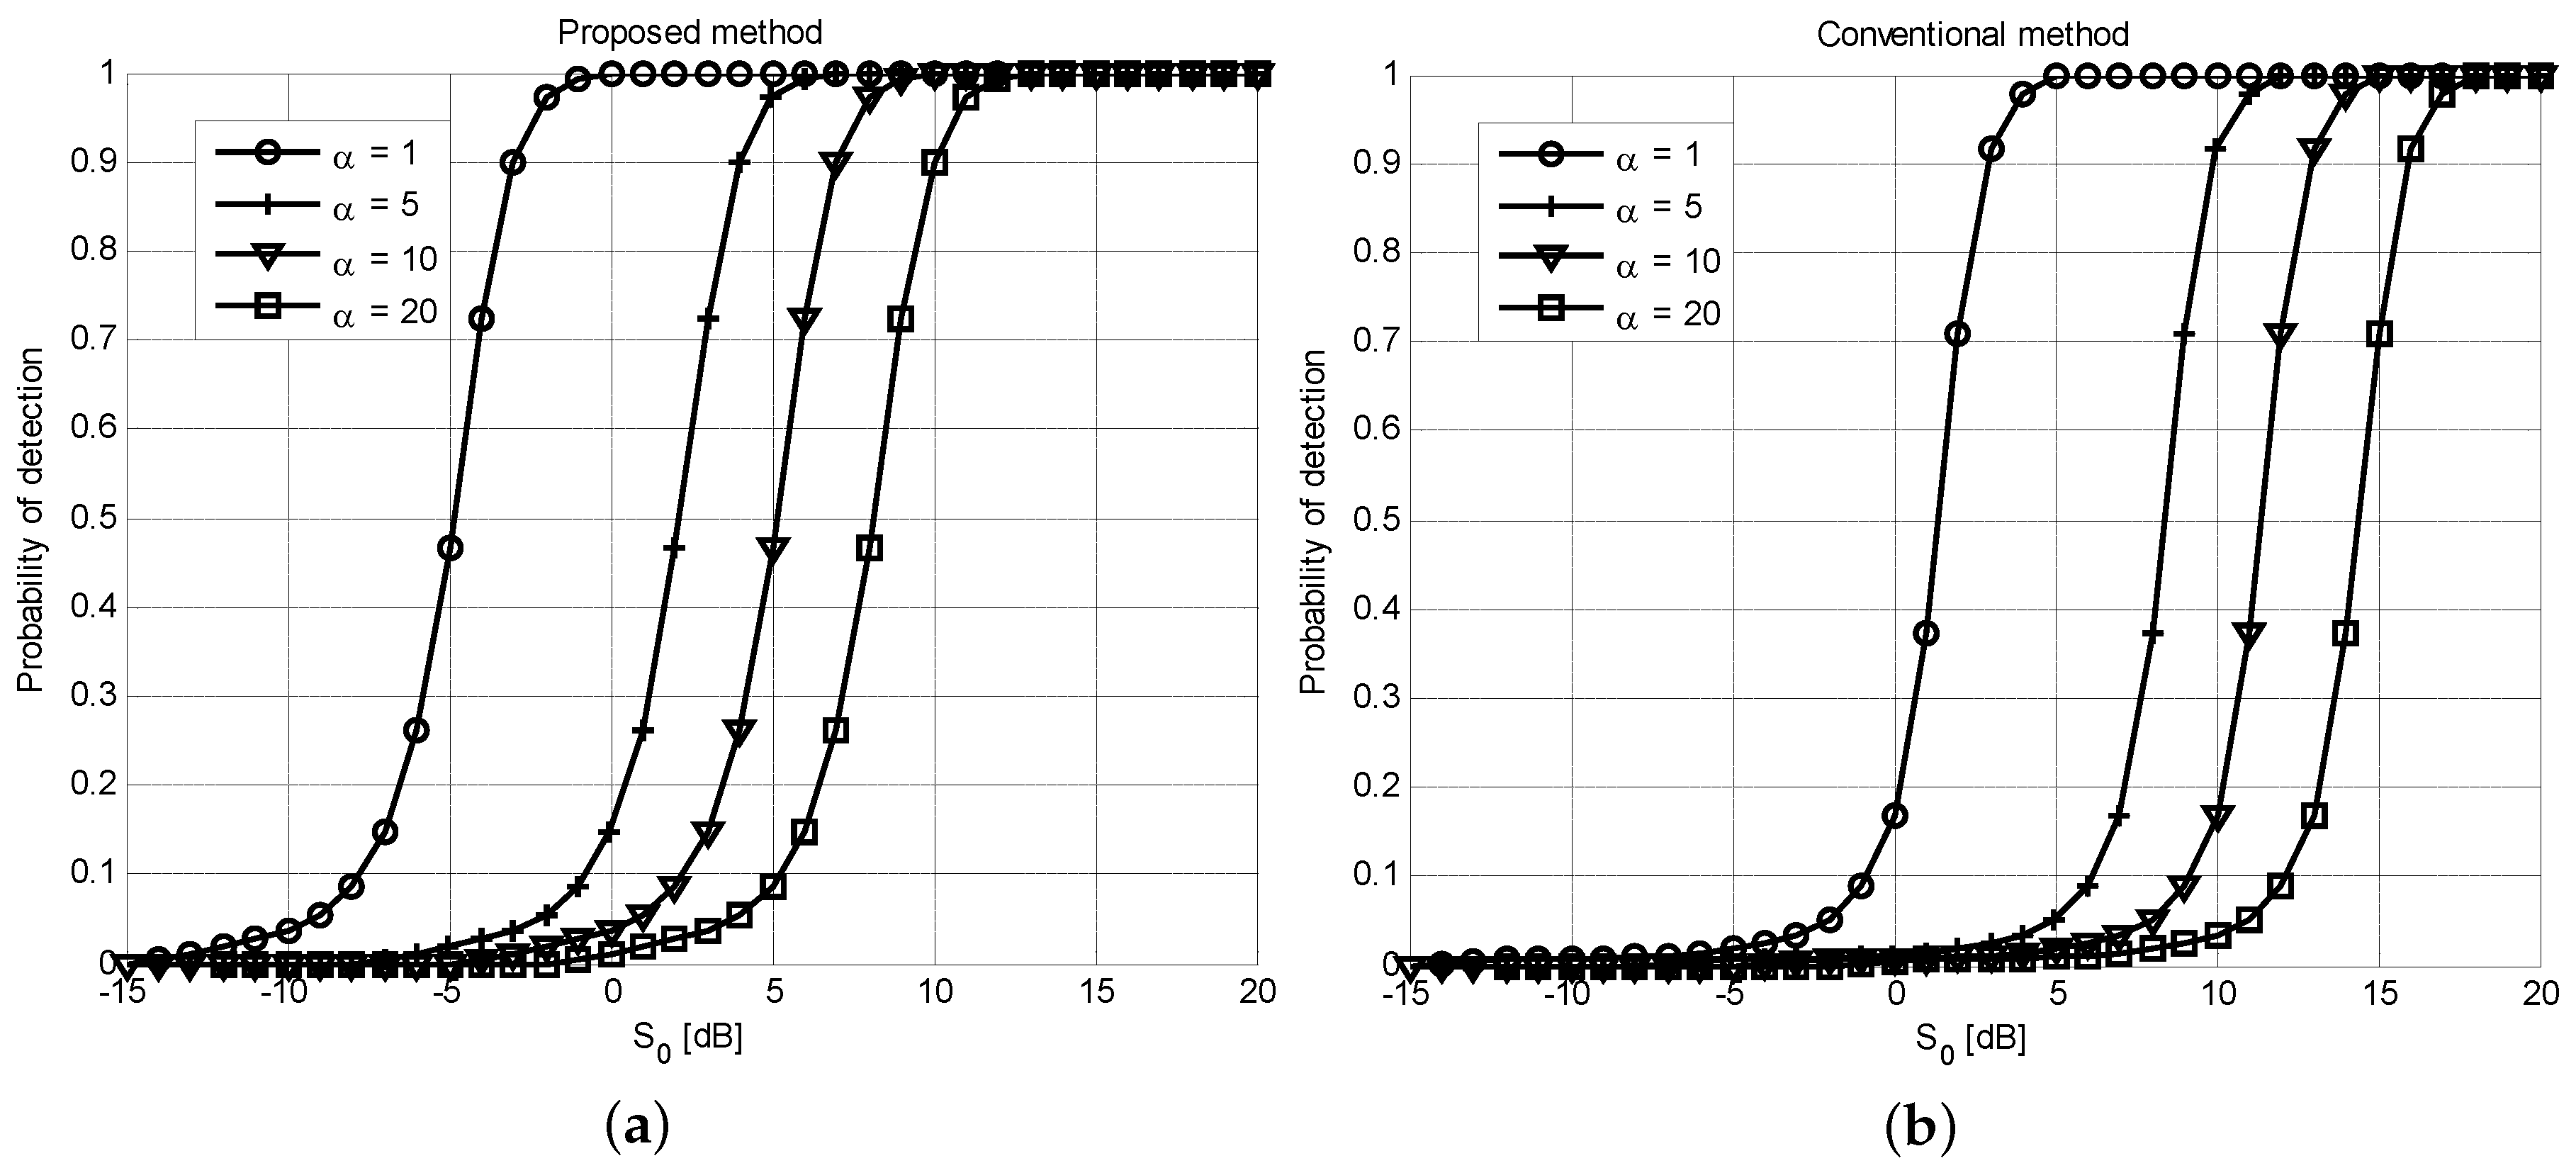
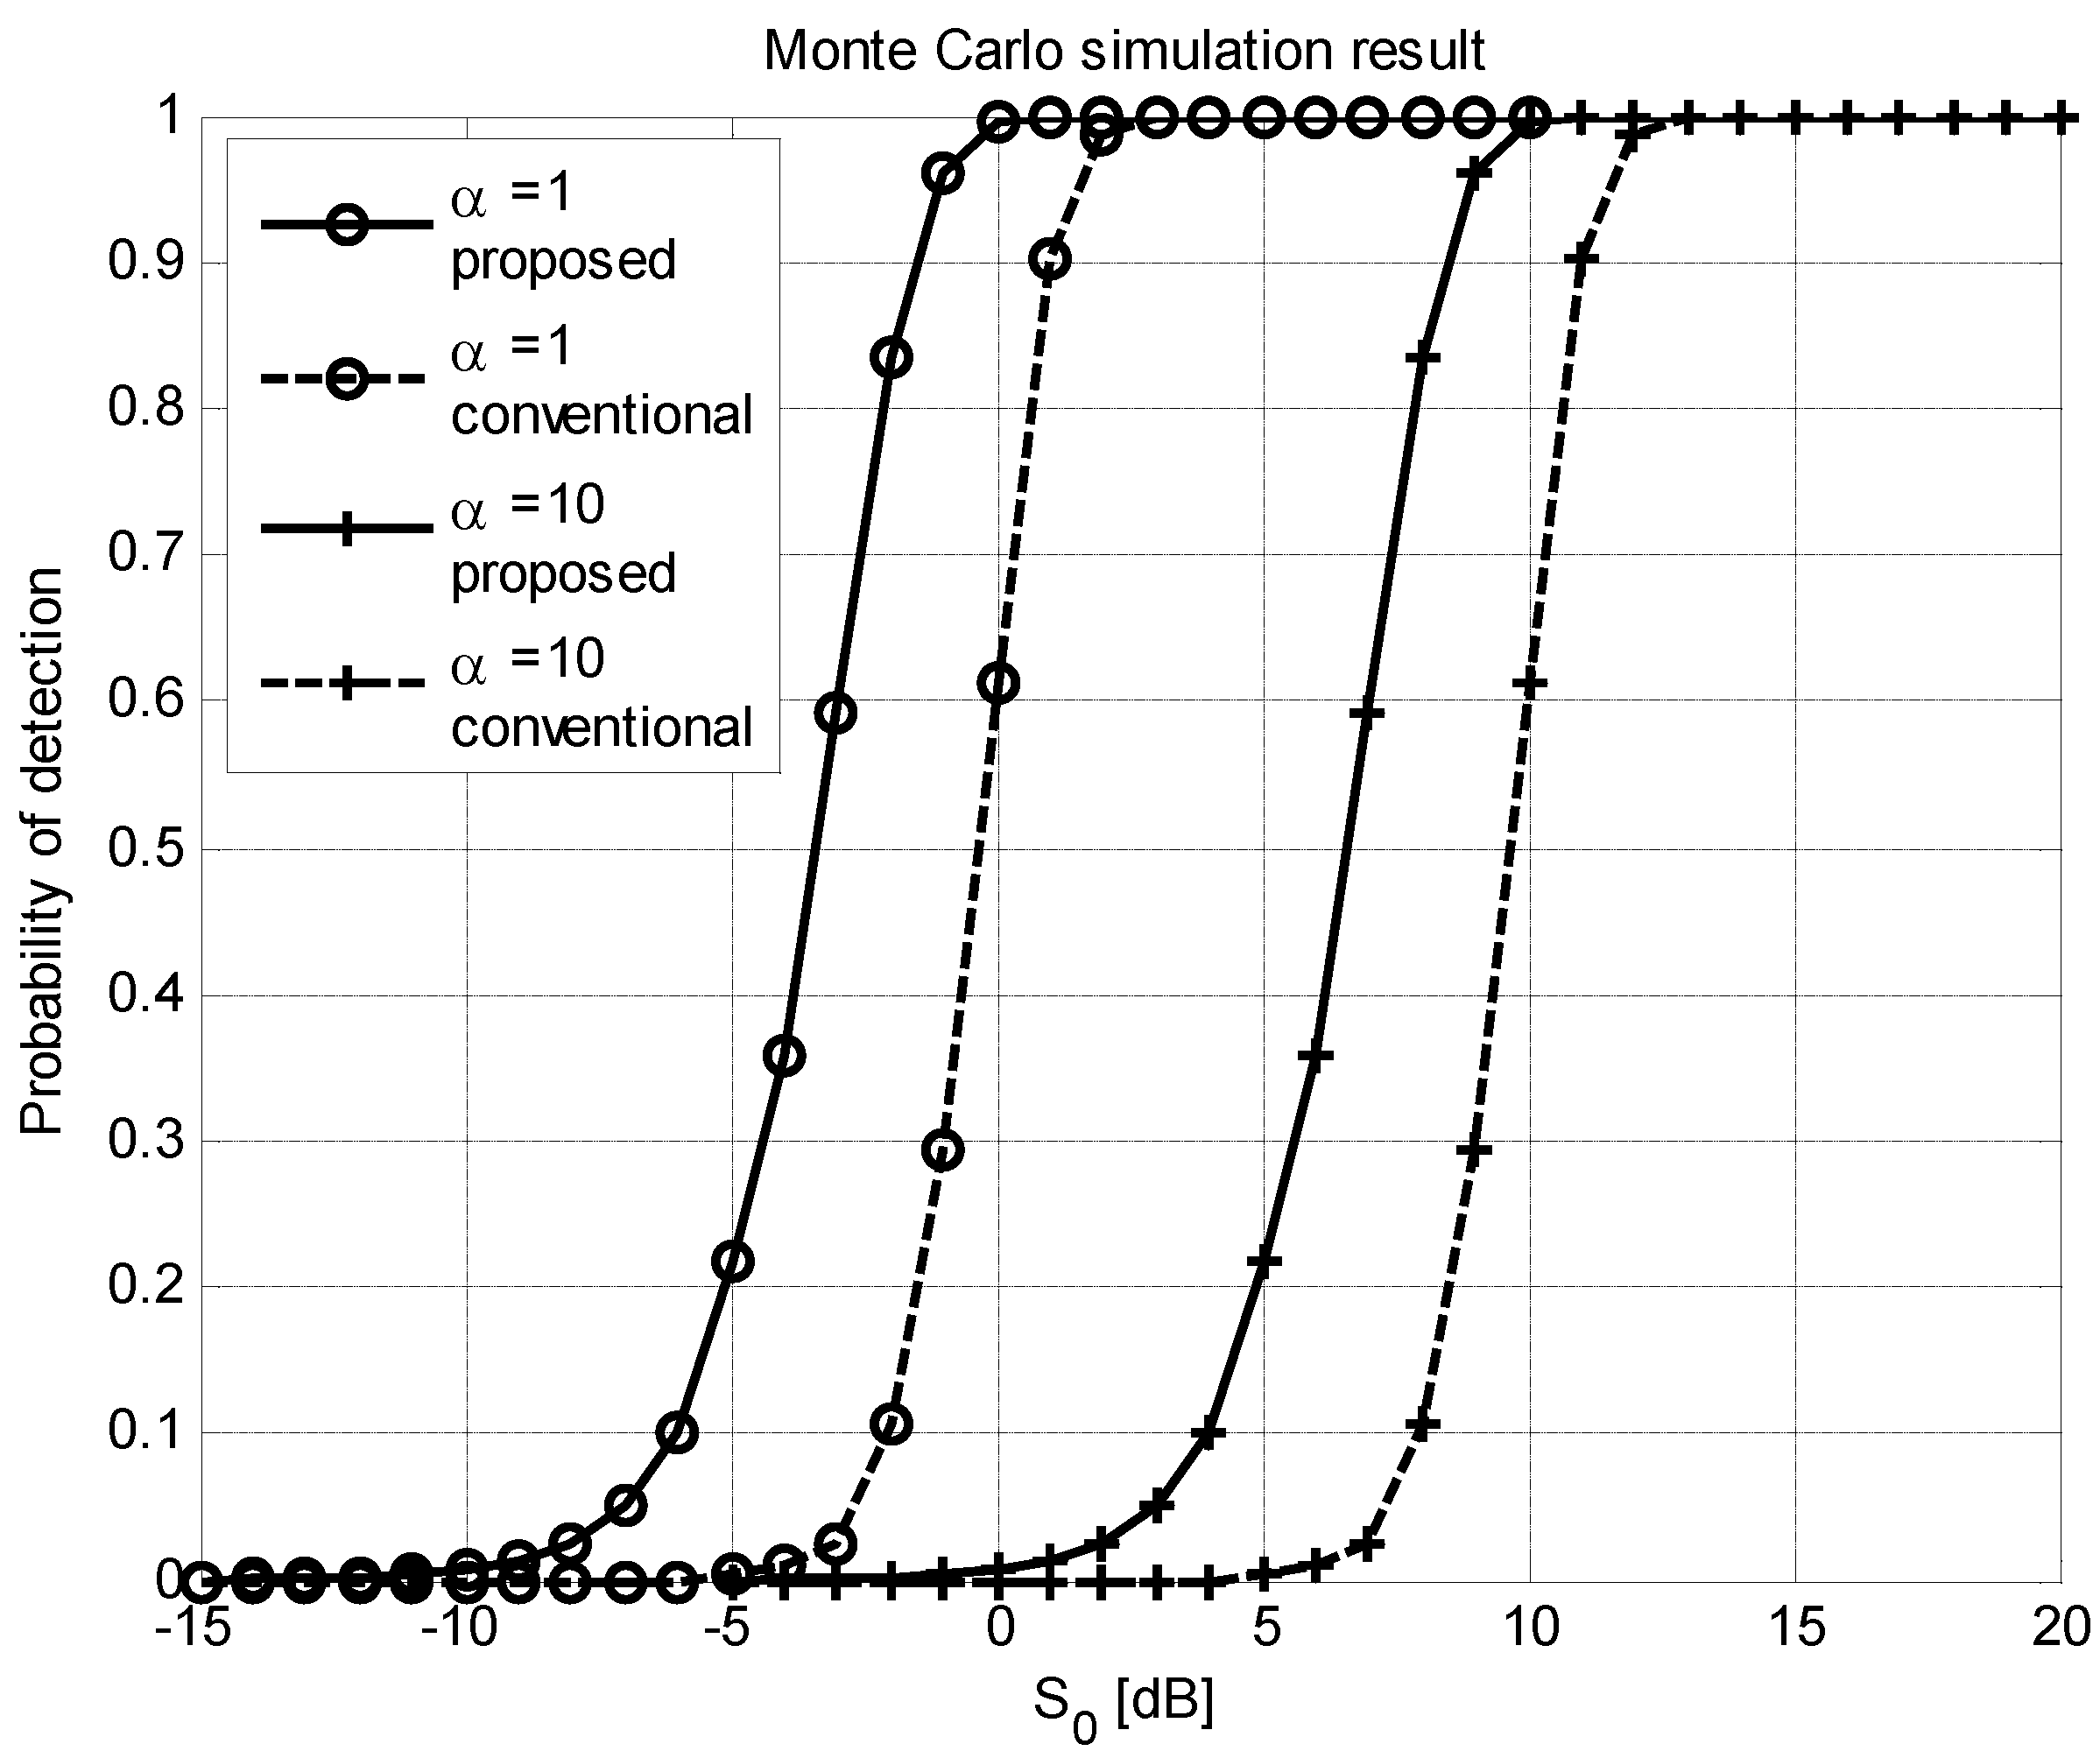
4.2. Simulation Results

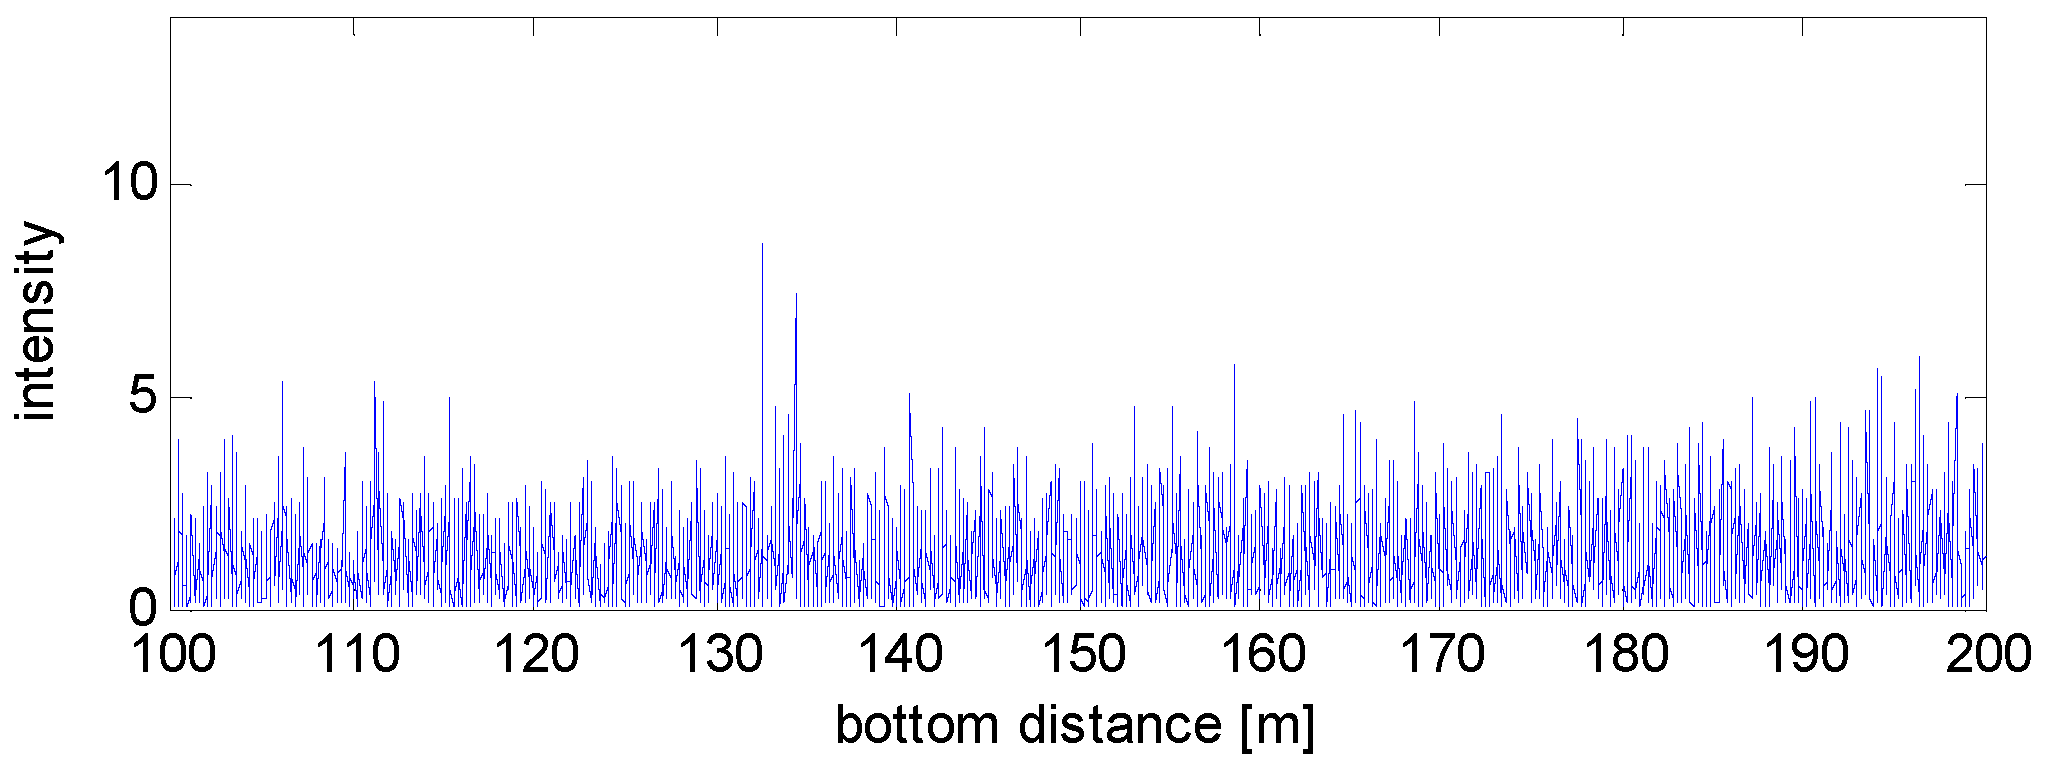
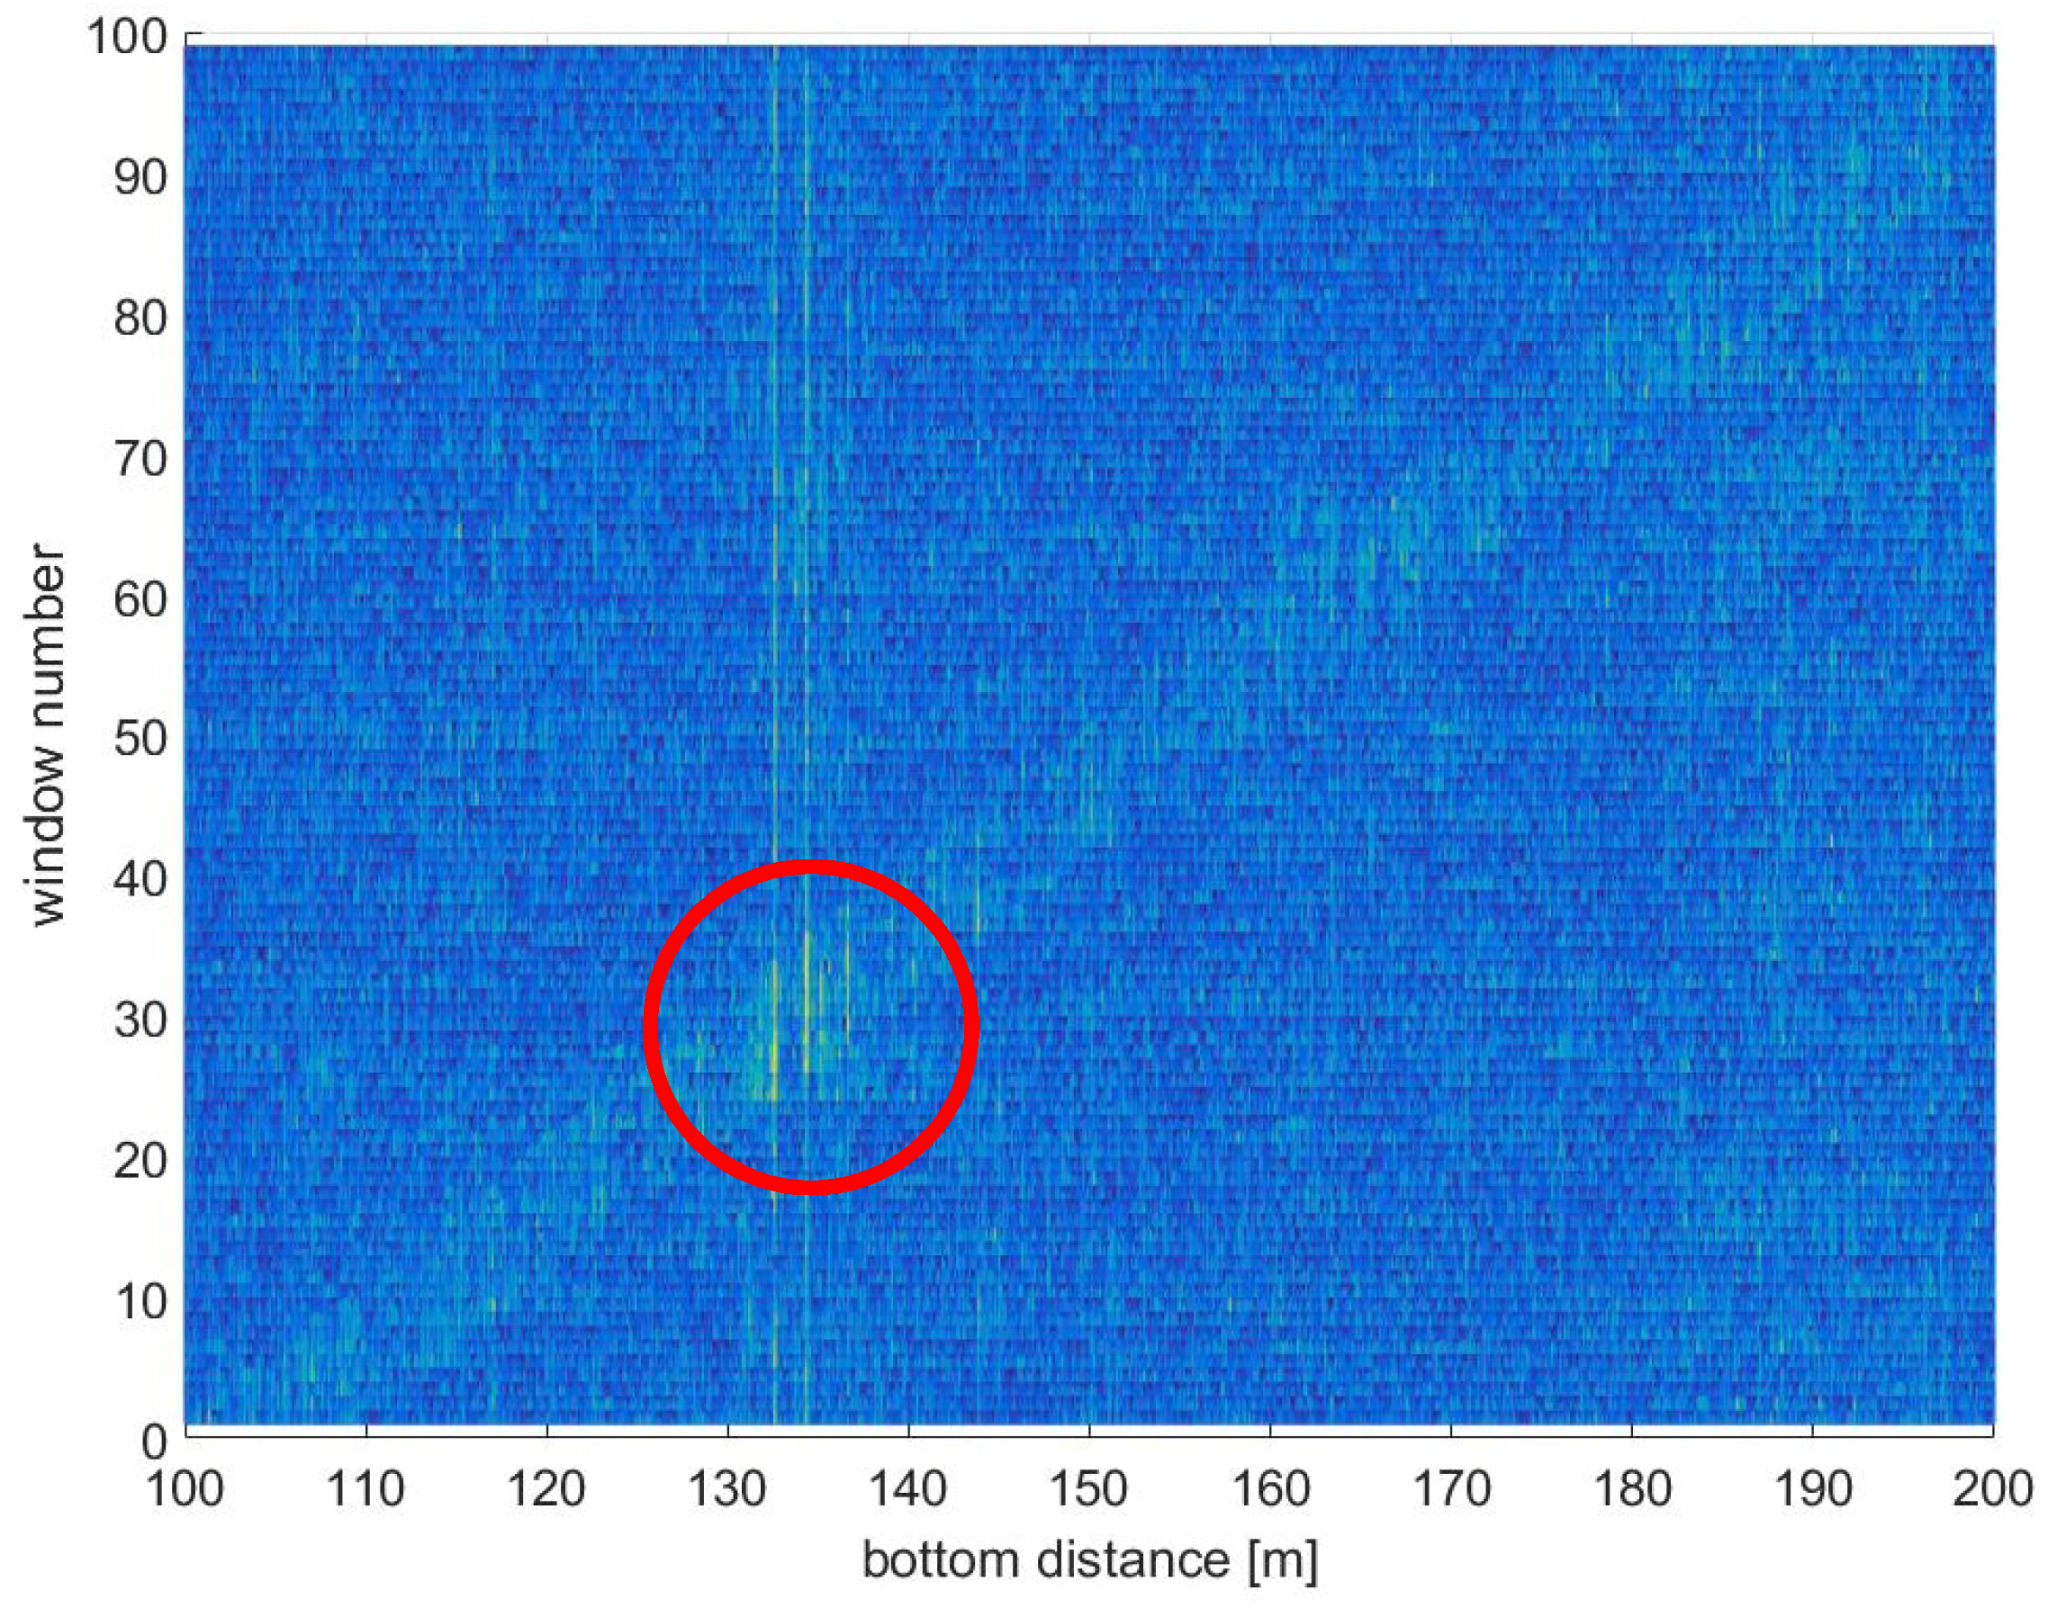
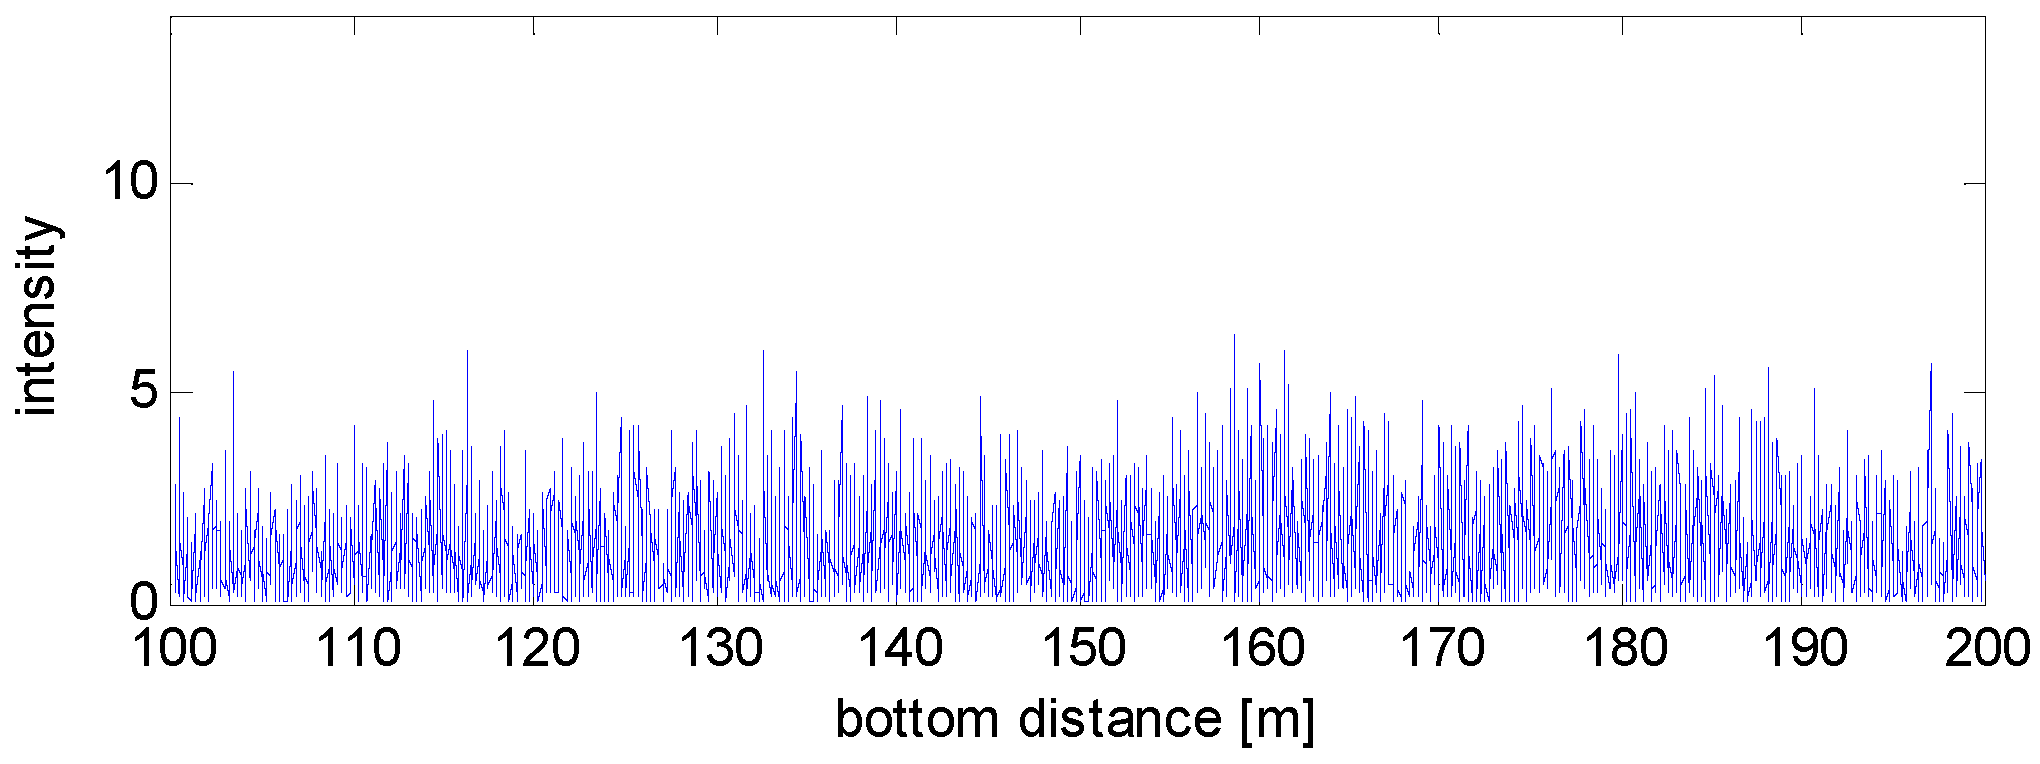
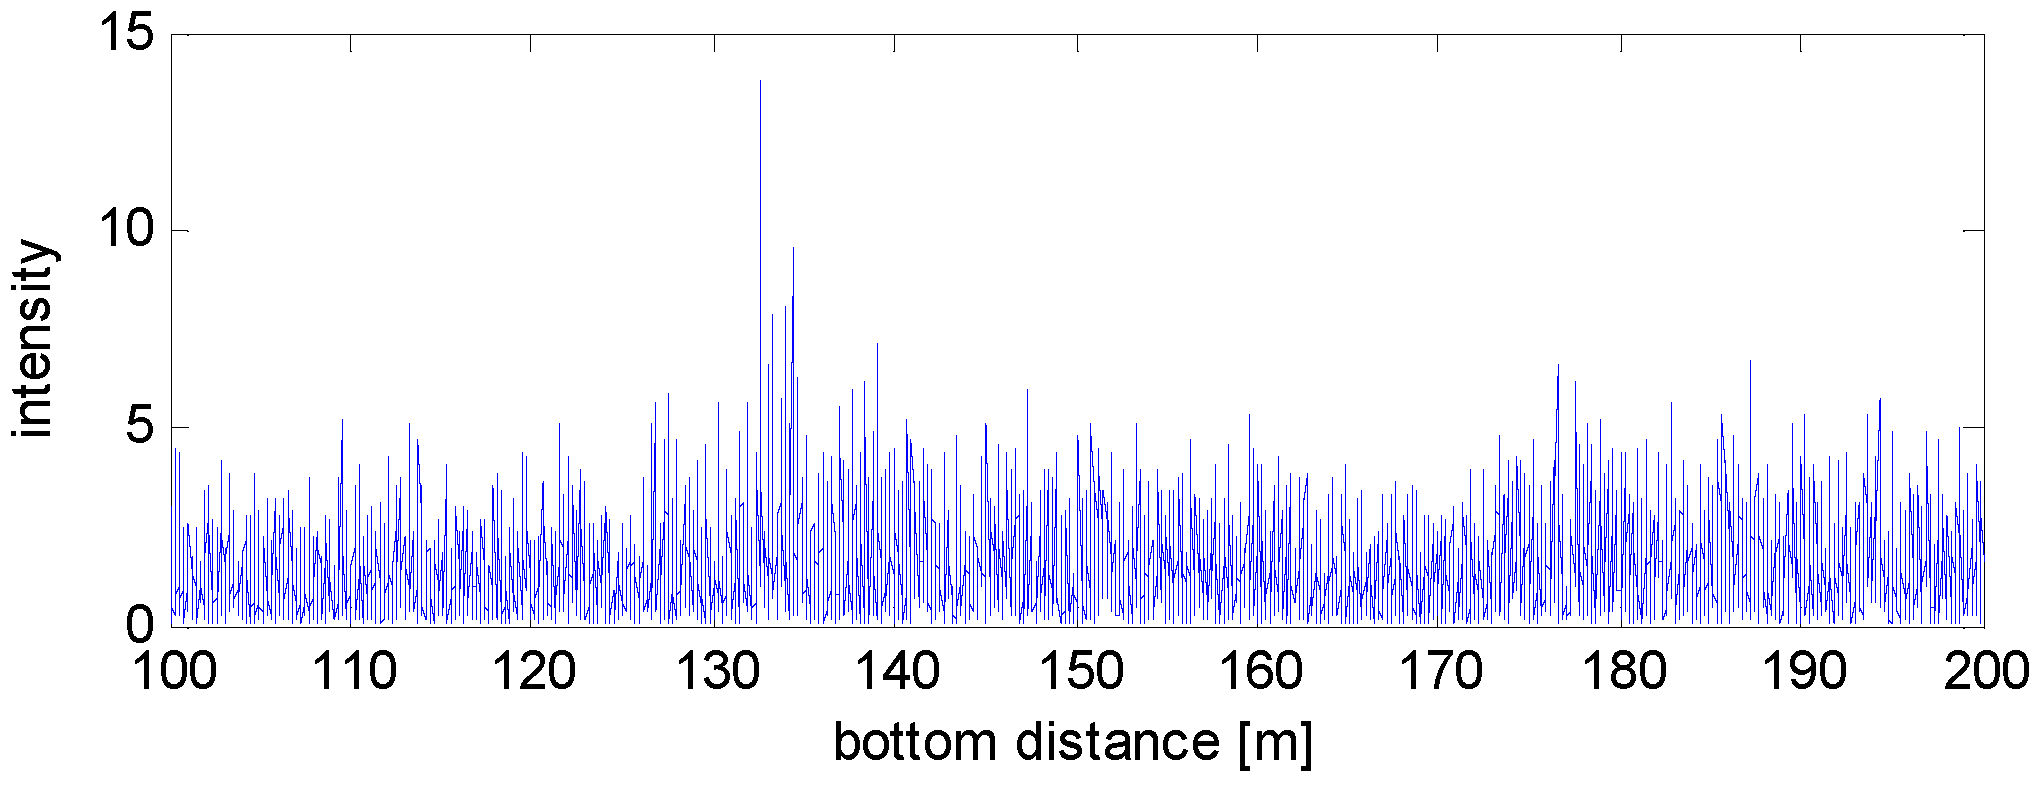
4.2.1. Target Peak Enhancement

Figure 4 shows the 2D plot of the outputs obtained by matched filtering the received signals after radiating time-reversed signals while changing a transmission waveform section. Even with the time-varying characteristics, it is observed that the energy was focused weakly according to the transmission waveform section since the structural characteristics of the seabed itself are maintained with a small degree. The section with a target shows a relatively strong peak.
Figure 5 and Figure 6 display the matched filtering outputs obtained by using the time-reversal techniques without and with a target, respectively. For the sections where only the seabed scattering exists, each matched filtered output was not focused well because of the time-varying characteristics of the channel. In contrast, for the section where the target exists, the pulse was well focused and the peak is easily observed. The results using matched filtering alone without the time reversal technique are shown in Figure 7. In this figure, it is difficult to determine the peak due to the target signal. In Figure 4, Figure 5, Figure 6 and Figure 7, the shape parameter α is 1 and the scale parameter λ is 1.

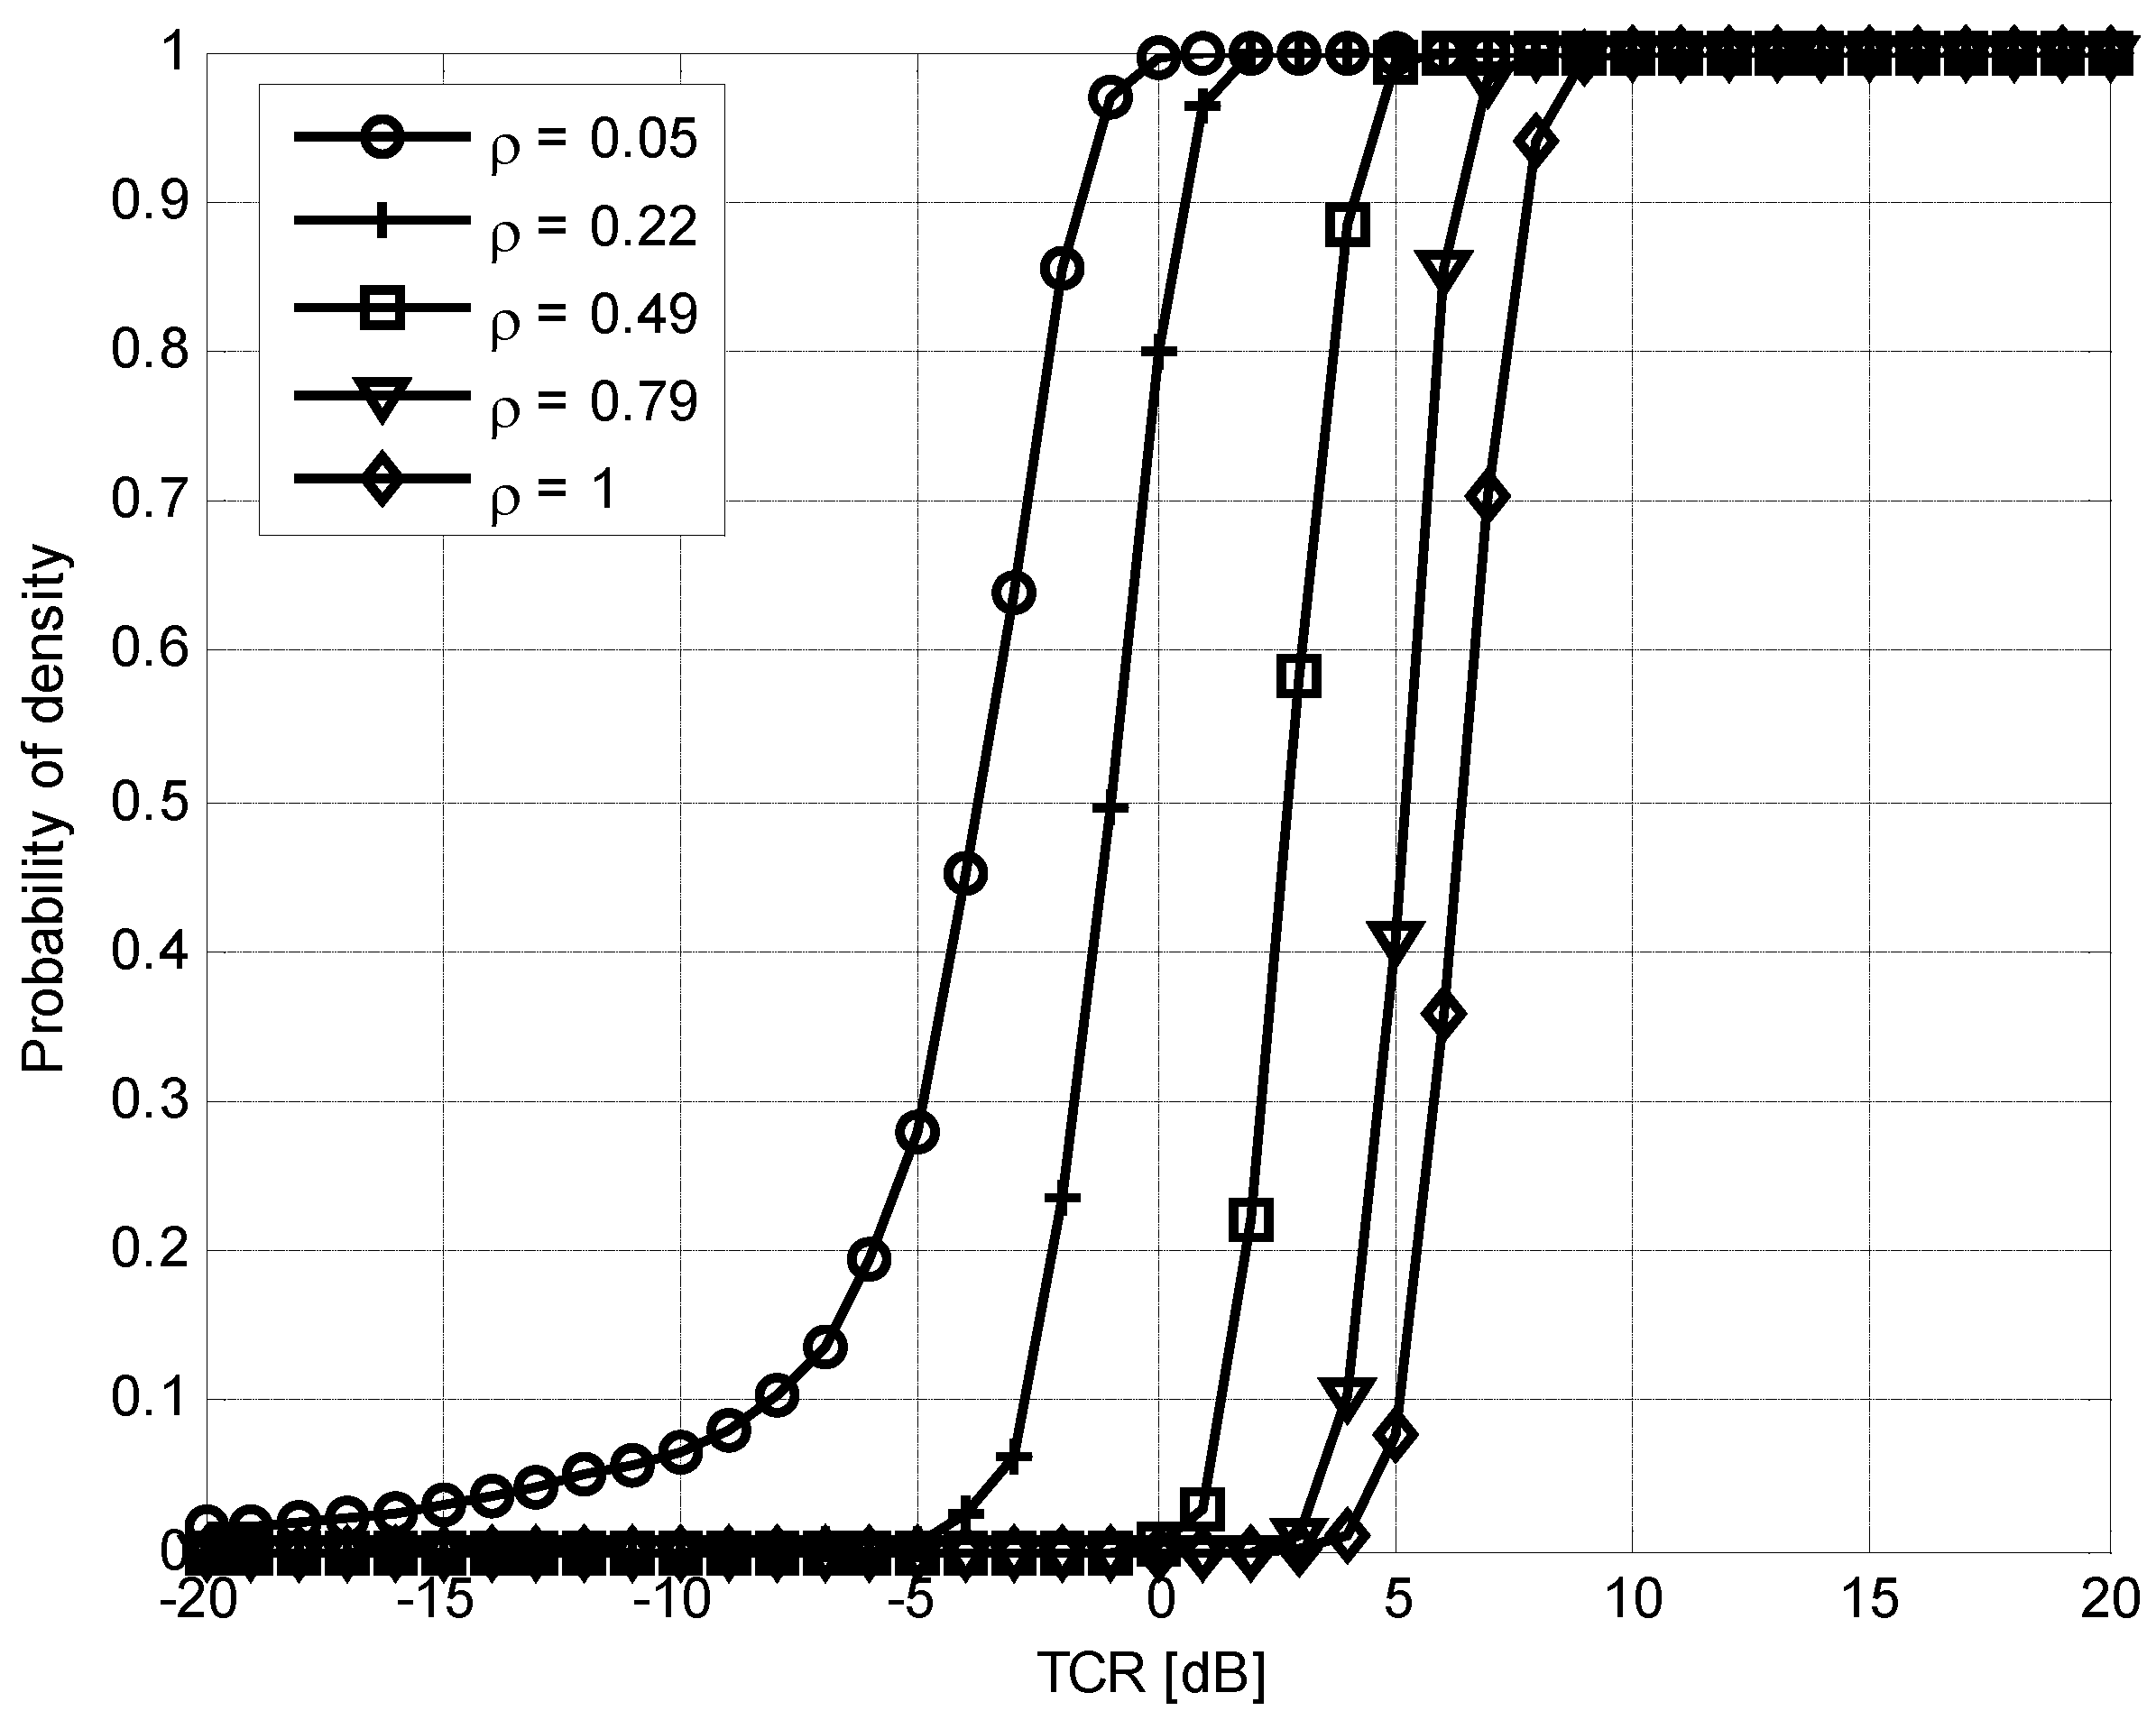
4.2.2. Parameters of the K-Distribution

Figure 8 shows the probabilities of detection according to the normalized target signal power S 0 , which are measured by using the proposed and conventional methods with Monte Carlo simulation. Note that the conventional method just uses matched filtering and threshold detection. For 5 dB signal-to-noise ratio (SNR) Gaussian noise, simulation was carried out 1000 times while changing the normalized target power S 0 from 15 dB to 20 dB with 1 dB interval. In this simulation, it was assumed that a target is randomly located in the range of 100 m to 200 m with uniform distribution. The threshold was fixed to a constant to observe the performance difference between the conventional and proposed methods under the same simulation environment. In this simulation, the shape parameters α = 1 and 10 were applied. It is observed that the proposed one improved the detection performance by about 3 dB compared to the conventional one. However, this is smaller than that of the numerical comparison in Figure 2 because the threshold is not optimized. The performance improvement was achieved because the energy was focused on the target by using the time reversal technique and the peak was raised as shown in Figure 6. Furthermore, as observed in Figure 3, the larger shape parameter deteriorated the performance in Figure 8.

4.2.3. Temporal Coherence

This simulation investigated the relationship between the coherence of the clutter channel [26] and the detection probability of the proposed approach for TCR varying from 20 dB to 20 dB. The false alarm probability P F A was set to 10 4 and the threshold was adjusted according to the coherence values. The results were obtained by 1000 simulations for each TCR according to coherence values ρ = 0.05 , 0.22 , 0.49 , 0.79 , 1 , which are depicted in Figure 9. Note that ρ = 1 means that the clutter channel is time-invariant while it becomes more decorrelated as ρ goes to zero. As observed in the figure, for ρ = 1, the clutter signal is also enhanced by the time reversal; therefore, the detection probability degrades while for ρ = 0.05, indicating that the time-variance of the clutter is relatively high, the approach achieves a better performance.

5. Conclusions

When seabed clutter exists in the received signal, the scattering signal by the target is buried in the clutter signals, which makes accurate detection difficult. In this paper, a method using the time reversal technique is proposed to improve detection performance when the clutter environment is in shallow water. Using the wave focusing effect of the time reversal technique, the peak of the target signal can be enhanced. It is confirmed that the peak of the target buried in the clutter becomes higher when applying the time reversal technique by exploiting the time-varying characteristics of the seabed clutter. The numerical computation of the probability of detection and the false alarm probability demonstrates the improvement of the proposed method over the conventional approach. Furthermore, Monte Carlo simulation results also indicated that the proposed approach is better than the conventional one. In addition, the performance of the proposed approach was investigated in terms of the parameter of the K-distribution and the temporal coherence of the clutter channel. For a strong K-distributed channel and for a highly time-varying channel, the proposed approach shows a better probability of detection. In this study, it was observed that the time-reversal technique can improve the observability of the target peak in shallow water. Note that the kinds of time-varying clutter considered in this study were gravel, sand, and seaweed in the high-speed current. For further study, the strategy for reducing the computational complexity should be investigated for successful real-time applications.

Acknowledgments

The authors gratefully acknowledge the financial support provided by Defense Acquisition Program Administration and Agency for Defense Development under the contract (UD140004DD).

Author Contributions

Sungbin Im conceived and designed the experiments; Baeksan On performed the signal modeling and the simulation; Iksu Seo provided the discussion on the target detection problem in the shallow water. Baeksan On and Sungbin Im wrote the paper.

Conflicts of Interest

The authors declare no conflict of interest.

Appendix A

For the complex reverberation from j scatters, the distribution of the signal is obtained by the exponential and normal distributions [28,32].
K = Z Y
Z = i = 1 j X i
where random variable (RV) X i has the exponential distribution and is independent of X k for all k i while RV Y is normal distributed. The pdf of RV Z can be computed by the convolution of pdf’s while the pdf of RV K is obtained by using the following relationship [33] for independent RV’s A and B
f C ( y ) = 0 1 x f A ( x / y ) f B ( x ) d x , with C = A B
Then the pdf of the magnitude R = ( R e { K } ) 2 + ( I m { K } ) 2 = | K | can be computed using this relationship f R ( z ) = ( 2 π z ) f R e { K } , I m { K } ( z , 0 ) with the circularly symmetry condition [33]. For the case that there is no target in the resolution cell, the distribution becomes the K-distribution. When a target exists, the pdf of the complex reverberation can be determined by shifting the pdf of the complex reverberation by the target signal power.

References

  1. Johnson, S.G.; Deaett, M.A. The application of automated recognition techniques to side-scan sonar imagery. IEEE J. Ocean. Eng. 1994, 19, 138–144. [Google Scholar] [CrossRef]
  2. Reed, S.; Petillot, Y.; Bell, J. Automated approach to classification of mine-like objects in sidescan sonar using highlight and shadow information. IEEE Proceed.-Radar Sonar Navig. 2004, 151, 48–56. [Google Scholar] [CrossRef]
  3. Jeong, E.; Shim, T.; Kim, J. Underwater Acoustic Image Classification of a Cylindrical object using the Hough Transformation and Nth Degree Polynomial Interpolation. J. Inst. Electron. Inf. Eng. 2013, 50, 193–200. [Google Scholar] [CrossRef]
  4. Lee, J.E.; Shim, T.B. Research on Segmentation for Sidescan Sonar Image by Morphological Method. J. Inst. Electron. Eng. Korea 2012, 49, 143–148. [Google Scholar]
  5. Kumar, N.; Mitra, U.; Narayanan, S.S. Robust object classification in underwater sidescan sonar images by using reliability-aware fusion of shadow features. IEEE J. Ocean. Eng. 2015, 40, 592–606. [Google Scholar] [CrossRef]
  6. Williams, K.L.; Kargl, S.G.; Thorsos, E.I.; Burnett, D.S.; Lopes, J.L.; Zampolli, M.; Marston, P.L. Acoustic scattering from a solid aluminum cylinder in contact with a sand sediment: Measurements, modeling, and interpretation. J. Acoust. Soc. Am. 2010, 127, 3356–3371. [Google Scholar] [CrossRef] [PubMed]
  7. Zampolli, M.; Espana, A.L.; Williams, K.L.; Kargl, S.G.; Thorsos, E.I.; Lopes, J.L.; Kennedy, J.L.; Marston, P.L. Low-to mid-frequency scattering from elastic objects on a sand sea floor: Simulation of frequency and aspect dependent structural echoes. J. Comput. Acoust. 2012, 20, 1240007. [Google Scholar] [CrossRef]
  8. Shin, H.R. The Characteristics of Coastal Currents to the Northwest of the Taean Peninsula in the Yellow Sea. Ocean Polar Res. 2005, 27, 433–441. [Google Scholar]
  9. Son, W.; Son, S.U.; Choi, J.W.; Cho, S.; Jung, S.K. Measurements of Monostatic Bottom Backscattering Strengths in Shallow Water of the Yellow Sea. J. Acoust. Soc. Korea 2015, 34, 444–454. [Google Scholar] [CrossRef]
  10. Howell, H.R.G. Inferring Bottom Acoustic Properties from AN/SQQ-32 Sonar Reverberation Data; Naval Postgraduate School: Monterey, CA, USA, 2000. [Google Scholar]
  11. Van Walree, P. Channel Sounding for Acoustic Communications: Techniques and Shallow-Water Examples; FFI-Rapport; Norwegian Defence Research Establishment: Kjeller, Norway, 2011; Volume 7, pp. 1–58. [Google Scholar]
  12. Abraham, D.A.; Lyons, A.P. Simulation of non-Rayleigh reverberation and clutter. IEEE J. Ocean. Eng. 2004, 29, 347–362. [Google Scholar] [CrossRef]
  13. Vego, M.N. Joint Operational Warfare: Theory and Practice; Government Printing Office: Washington, DC, USA, 2009.
  14. Abraham, D.A. Distributed active sonar detection in dependent K-distributed clutter. IEEE J. Ocean. Eng. 2009, 34, 343–357. [Google Scholar] [CrossRef]
  15. Fink, M.; Cassereau, D.; Derode, A.; Prada, C.; Roux, P.; Tanter, M.; Thomas, J.L.; Wu, F. Time-reversed acoustics. Rep. Prog. Phys. 2000, 63, 1933. [Google Scholar] [CrossRef]
  16. Fink, M.; Prada, C. Acoustic time-reversal mirrors. Inverse Probl. 2001, 17, R1. [Google Scholar] [CrossRef]
  17. Fink, M. Time-reversal acoustics. J. Phys. Conf. Ser. 2008, 118, 012001. [Google Scholar] [CrossRef]
  18. Yavuz, M.E.; Teixeira, F.L. Ultrawideband Microwave Sensing and Imaging Using Time-Reversal Techniques: A Review. Remote Sens. 2009, 1, 466–495. [Google Scholar] [CrossRef]
  19. Berryman, J.G.; Borcea, L.; Papanicolaou, G.C.; Tsogka, C. Statistically stable ultrasonic imaging in random media. J. Acous. Soc. Am. 2002, 112, 1509–1522. [Google Scholar] [CrossRef]
  20. Fouda, A.E.; Teixeira, F.L. Imaging and tracking of targets in clutter using differential time-reversal techniques. Waves Random Complex Media 2012, 22, 66–108. [Google Scholar] [CrossRef]
  21. Santos, V.R.N.; Teixeira, F.L. Study of time-reversal-based signal processing applied to polarimetric GPR detection of elongated targets. J. Appl. Geophys. 2017, 139, 257–268. [Google Scholar] [CrossRef]
  22. Fouda, A.E.; Teixeira, F.L. Statistical Stability of Ultrawideband Time-Reversal Imaging in Random Media. IEEE Trans. Geosci. Remote Sens. 2014, 52, 870–879. [Google Scholar] [CrossRef]
  23. Li, J.; Pan, X.; Zhao, H. Buried target detection based on time reversal focusing with a probe source. Appl. Acoust. 2009, 70, 473–478. [Google Scholar] [CrossRef]
  24. Moura, J.M.; Jin, Y. Detection by time reversal: Single antenna. IEEE Trans. Signal Process. 2007, 55, 187–201. [Google Scholar] [CrossRef]
  25. Simon, M.K.; Omura, J.K.; Scholtz, R.A.; Levitt, B.K. Spread Spectrum Communications Handbook; Access Engineering: McGraw-Hill, NY, USA, 2002; Volume 2. [Google Scholar]
  26. Yang, T. Measurements of temporal coherence of sound transmissions through shallow water. J. Acoust. Soc. Am. 2006, 120, 2595–2614. [Google Scholar] [CrossRef]
  27. O’Donoughue, N.; Moura, J.M. Gaussian target detection in multipath clutter with single-antenna time reversal. IEEE Trans. Signal Process. 2013, 61, 3733–3744. [Google Scholar] [CrossRef]
  28. Abraham, D.A.; Lyons, A.P. Novel physical interpretations of K-distributed reverberation. IEEE J. Ocean. Eng. 2002, 27, 800–813. [Google Scholar] [CrossRef]
  29. Ye, Z. A novel approach to sound scattering by cylinders of finite length. J. Acoust. Soc. Am. 1997, 102, 877–884. [Google Scholar] [CrossRef]
  30. Kargl, S.G.; Williams, K.L.; Thorsos, E.I. Synthetic Aperture Sonar Imaging of Simple Finite Targets. IEEE J. Ocean. Eng. 2012, 37, 516–532. [Google Scholar] [CrossRef]
  31. Kargl, S.G.; Shim, T.; Williams, K.L.; Im, S. Scattering from a finite cylindrical target in a waveguide. In OCEANS 2016 MTS/IEEE Monterey; IEEE Oceanic Engineering Society: Piscataway, NJ, USA, 2016; pp. 1–5. [Google Scholar] [CrossRef]
  32. Abraham, D.A.; Lyons, A.P. Reverberation envelope statistics and their dependence on sonar bandwidth and scattering patch size. IEEE J. Ocean. Eng. 2004, 29, 126–137. [Google Scholar] [CrossRef]
  33. Papoulis, A.; Pillai, S. Probability, Random Variables, and Stochastic Processes; McGraw-Hill Series in Electrical Engineering: Communications and Signal Processing, Tata; McGraw-Hill Education: New York, NY, USA, 2002. [Google Scholar]
Figure 1. Schematic diagram of the implementation of the time-reversed retransmission signal.
Applsci 07 01180 g001
Figure 2. Probabilities of detection numerically obtained by the proposed and conventional methods for P F A = 0.1 , 0.05, 0.01, and 0.005 with α = 1 and λ = 1 . (a) P F A = 0.1 ; (b) P F A = 0.05 ; (c) P F A = 0.01 ; (d) P F A = 0.005 . P F A : false alarm probability ; TCR: target-to-clutter ratio.
Applsci 07 01180 g002
Figure 3. Numerically obtained probabilities of detection for α = 1 , 5, 10, and 20 when λ = 1 and P F A = 0.005 . (a) Time-reversal-based detection; (b) Conventional detection.
Applsci 07 01180 g003
Figure 4. 2D plot obtained by matched filtering the received signals after radiating time reversed signals while changing a transmission waveform section. The target peak is marked with the red circle.
Applsci 07 01180 g004
Figure 5. Matched filtering outputs when the time reversal technique is applied to the section where only the seabed scattering exists.
Applsci 07 01180 g005
Figure 6. Matched filtering outputs when the time reversal technique is applied to the section with a target.
Applsci 07 01180 g006
Figure 7. Matched filtering outputs obtained by the conventional approach without applying the time reversal technique.
Applsci 07 01180 g007
Figure 8. The probability of detection by computer simulation for the proposed and conventional methods with the same threshold for α = 1 and 10 with λ = 1.
Applsci 07 01180 g008
Figure 9. The probability of detection of the proposed approach for several coherence values when P F A = 10 4 and α = 1.
Applsci 07 01180 g009

