1. Introduction
In the field of image sensor applications for optical remote sensing, the complementary metal-oxide-semiconductor (CMOS) has been widely used by virtue of its simple circuit structure, low power consumption, and low cost. However, restricted by the structure of active pixel sensors (APS), electric charges cannot be transferred across pixels in the CMOS [
1,
2,
3]. Therefore, for the pushbroom imaging cameras in a low Earth orbit, the CMOS cannot complete multi-stage signal superposition in the charge domain as with time delay integration charge coupled device (TDI CCD). In recent years, the Skysat series [
4] and Jilin-1 [
5] satellites have used digital TDI technology to achieve pushbroom imaging with array CMOSs, which significantly reduced manufacturing costs and shortened the development cycle. With special design and compensation algorithms, digital TDI CMOSs approximate TDI CCDs in terms of sensitivity, ground sampling distance, and other measures of performance. However, the superposition of multi-stage images in the digital domain multiplies the read noise and dark noise. Thus, the details of dark or low-contrast targets are usually drowned out, making the imaging dynamic range a significant shortcoming of the digital TDI CMOS.
Researchers have always pursued high-dynamic-range imaging (HDRI) of the remote sensing camera, regardless of using CCDs or CMOSs as the image sensors [
6,
7,
8,
9,
10,
11,
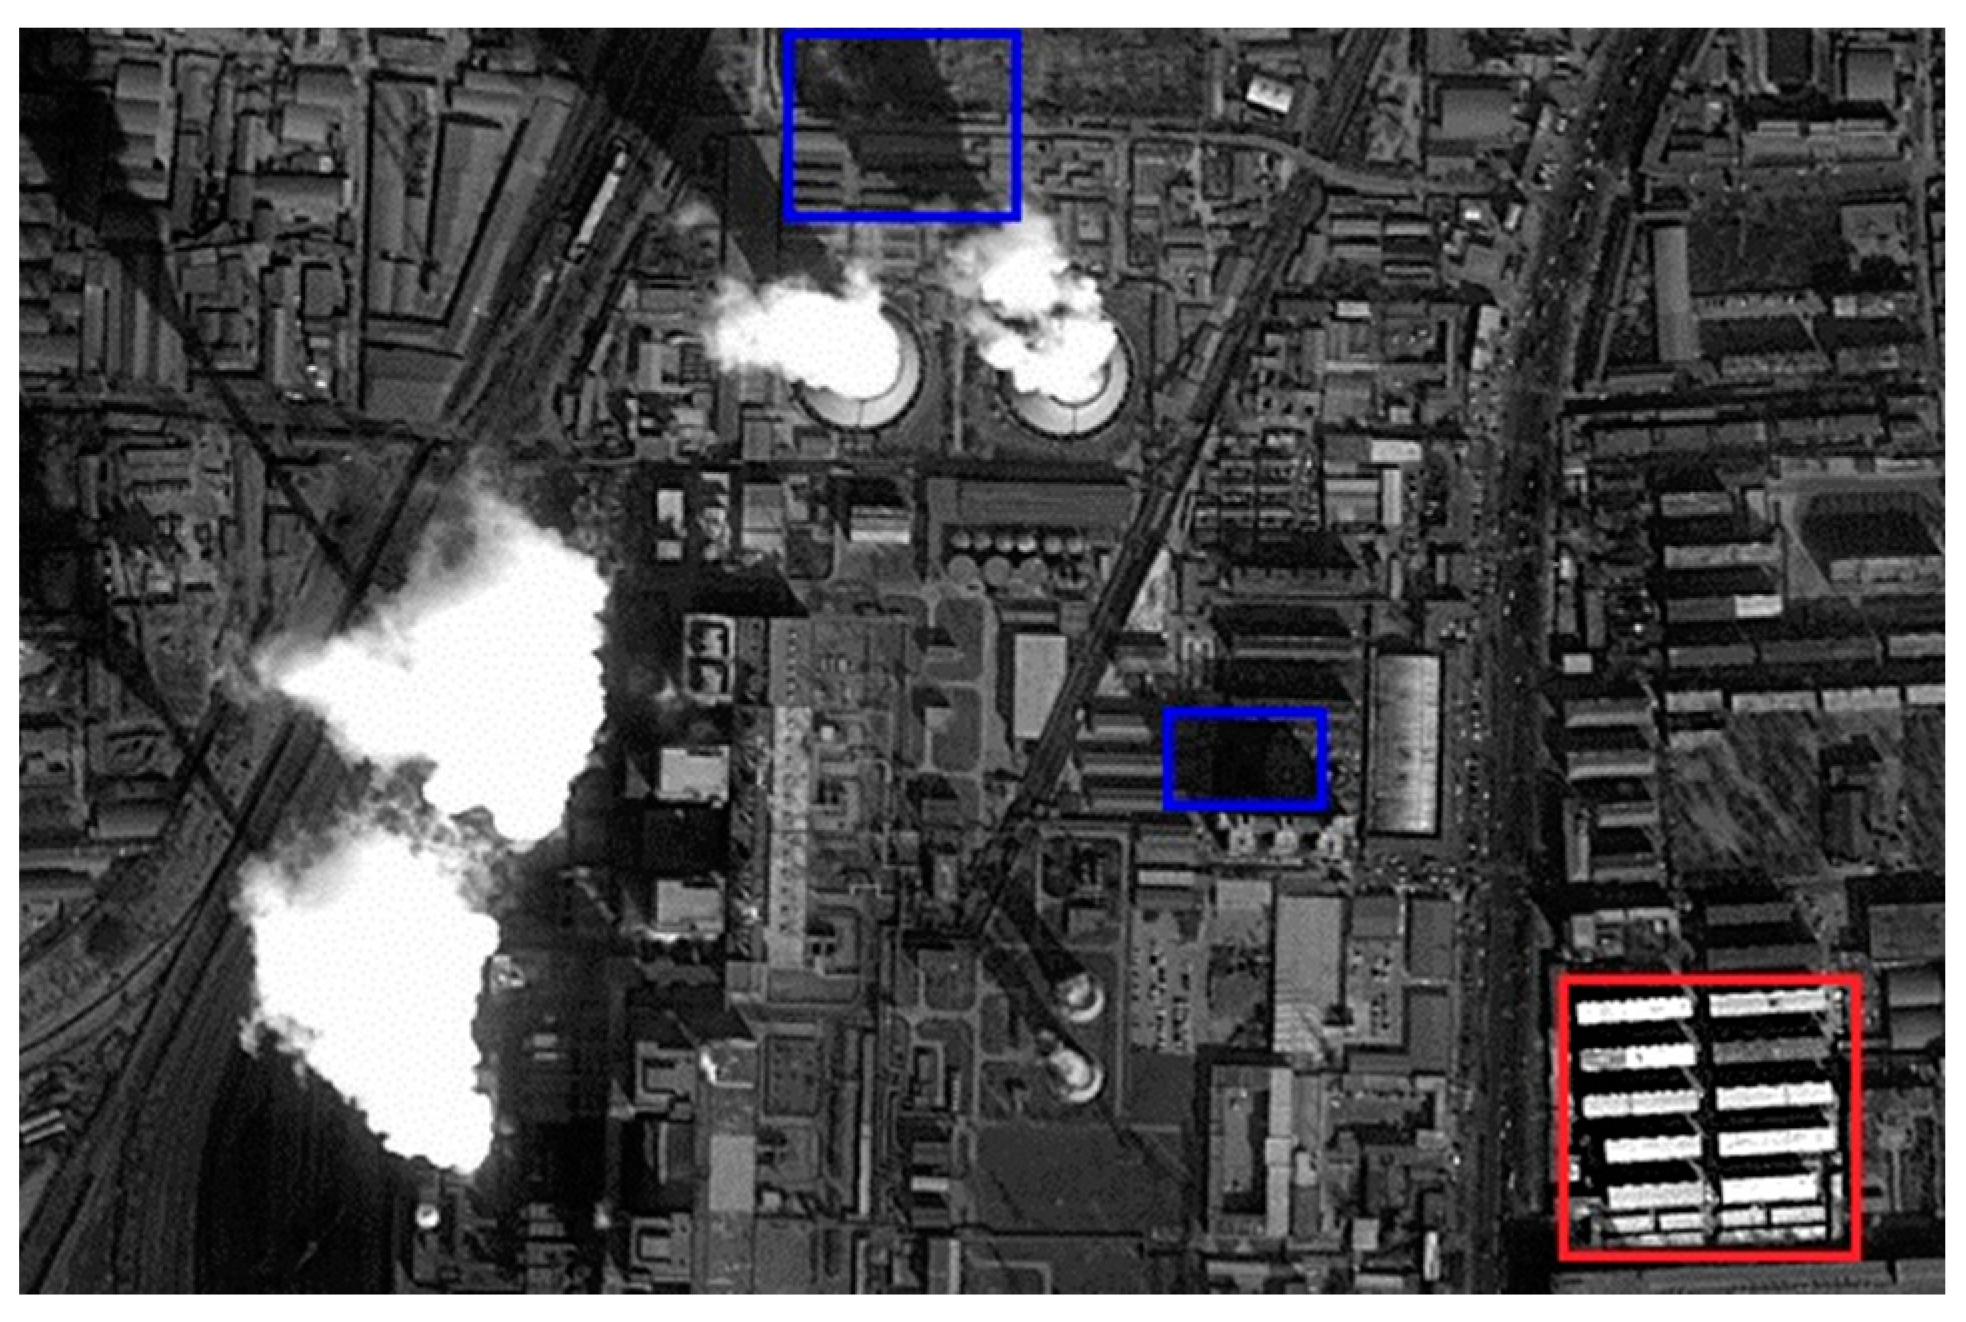
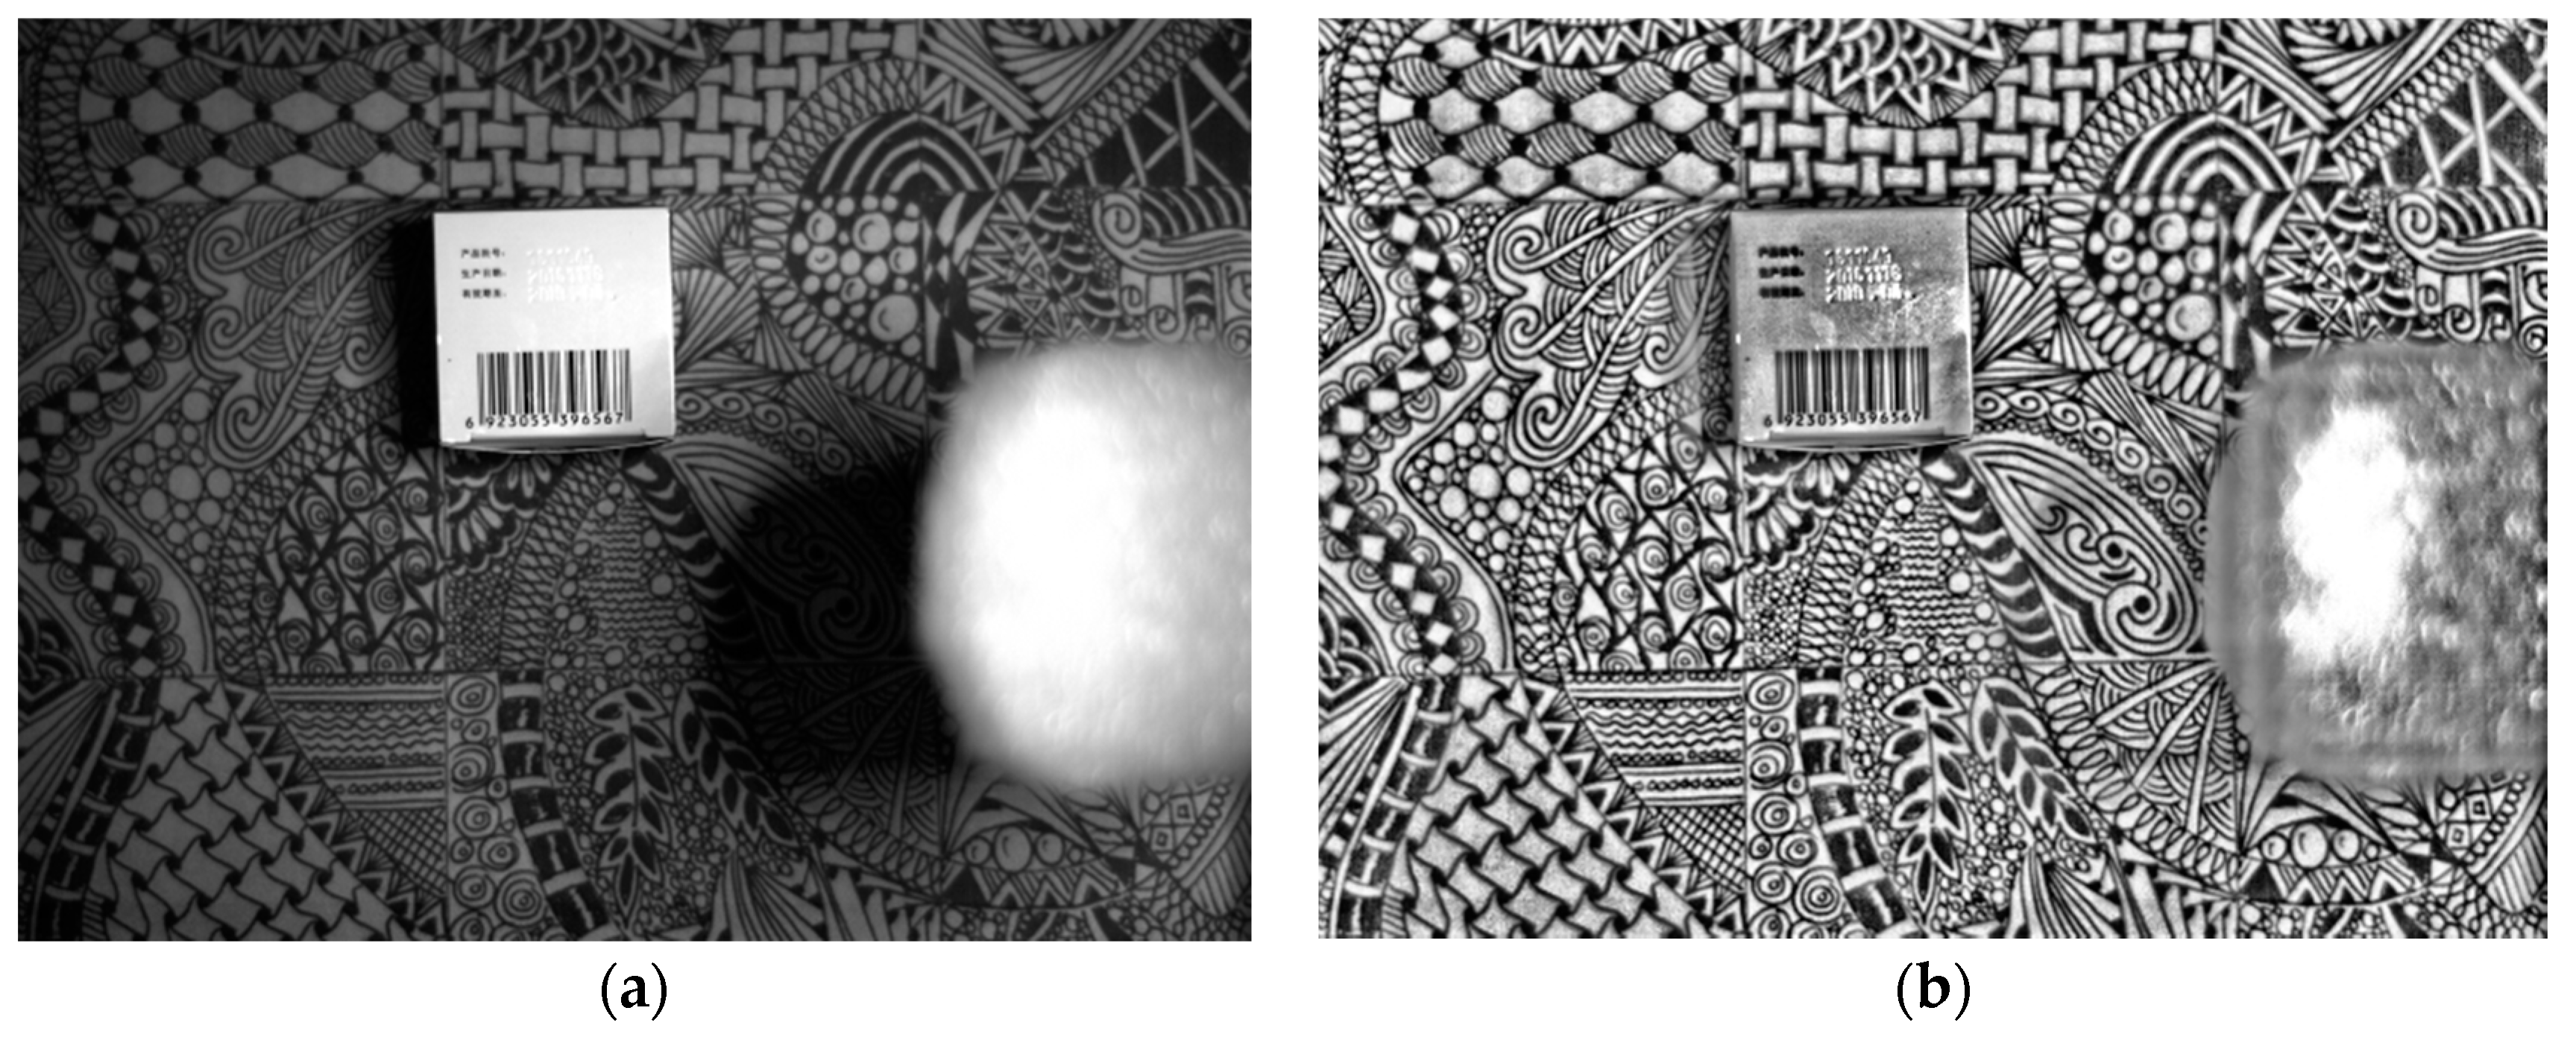
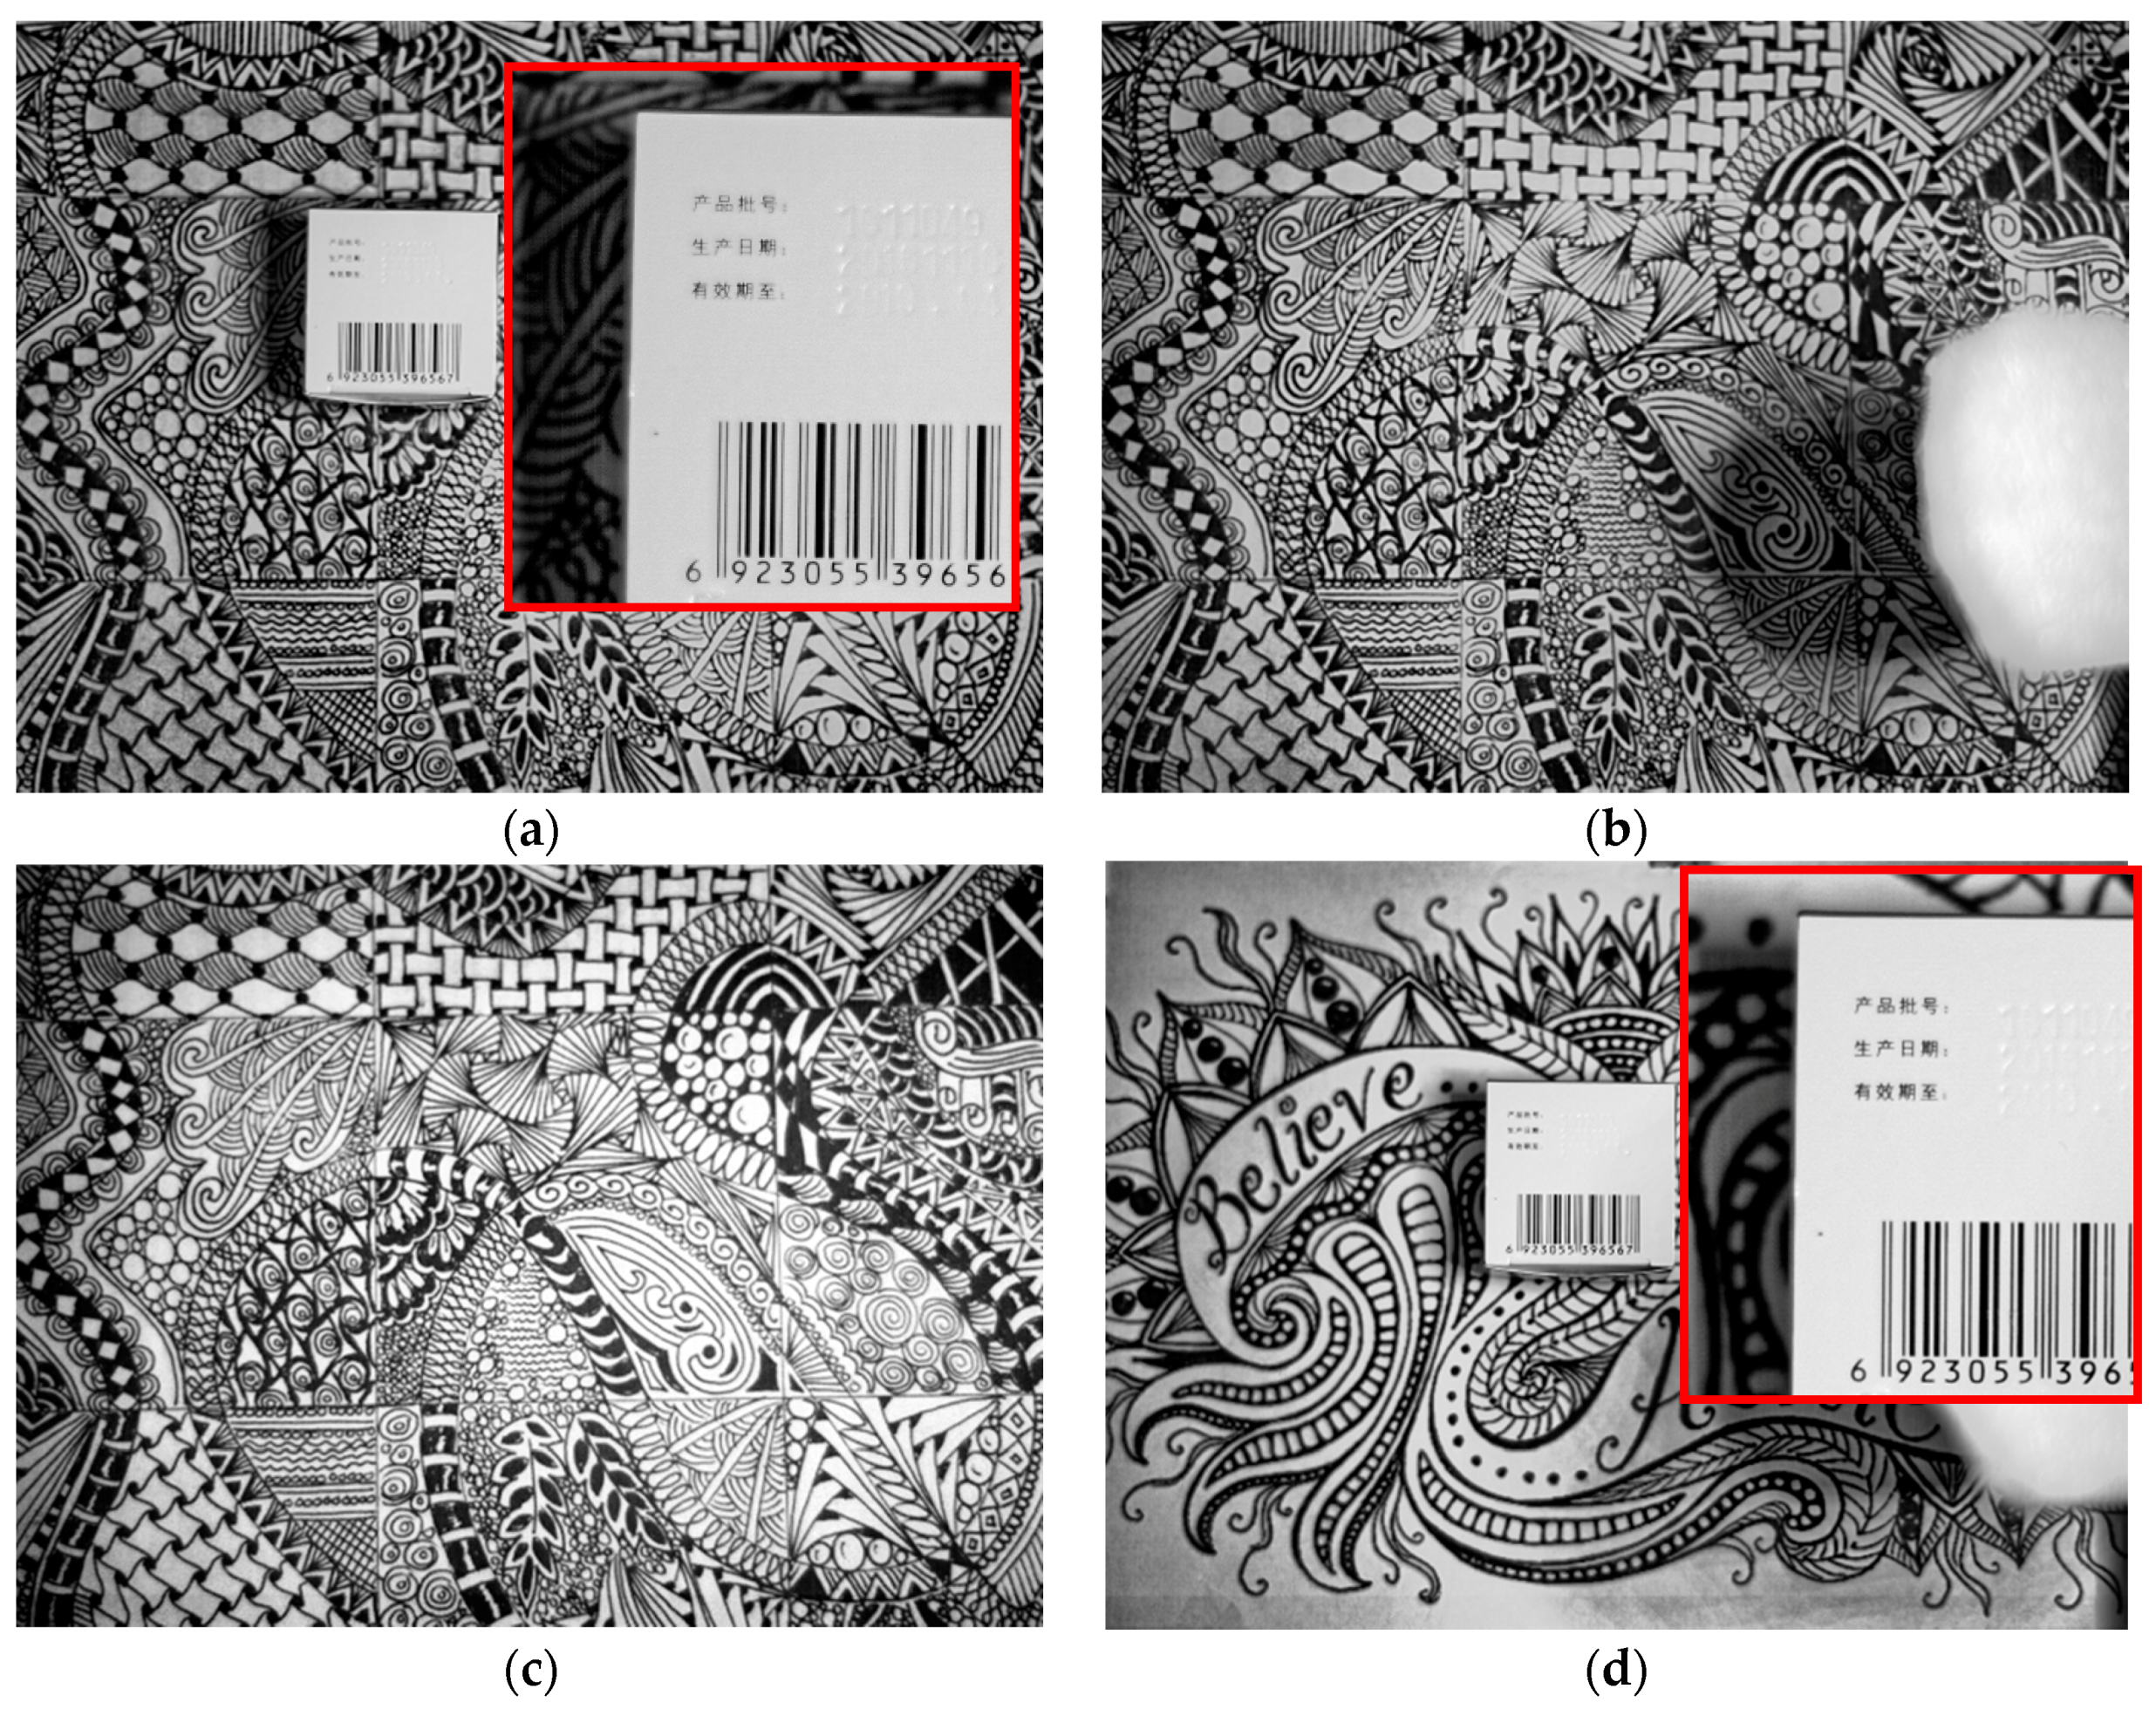
12]. The reason is that the reflectivity of different targets on the ground varies greatly. For example, the strong contrast between the roof and the shadow-covered area of a high building may cause the irradiance span to surpass the dynamic range of camera. This may cause the low brightness targets to be drowned out by noise. The high brightness targets may make the corresponding pixels reach saturation or even overflow. An example is shown in
Figure 1. The roofs in the red rectangle have reached saturation, while the shadowed targets in the blue rectangles are still too dark to be seen clearly. Thus, to apply the digital TDI CMOS in remote sensing, we should perform an in-depth analysis of its information transmission model, and explore the point of penetration at which to perform effective improved methods. If handled well, these methods can help to achieve the goal of HDRI, which is of great significance.
From the perspective of definition, to improve the imaging dynamic range of the camera, the direct measures can be divided into two aspects. One aspect is based on increasing the full well capacity of the pixels, and the other is to reduce the noise. However, restricted by the current manufacturing level of the CMOS, it is difficult for these two parameters to meet higher requirements [
7]. Therefore, we must explore other methods beyond the sensor itself. As is introduced in the second part of this paper, before delivering the final image, the digital TDI CMOS allows us to obtain and process the intermediate images of all of the different TDI stages, which are not available in TDI CCD. Among measures to improve the dynamic range in image processing, image enhancement and multi-exposure image fusion are typical and effective methods.
In traditional image enhancement methods, such as histogram equalization (HE) [
8] and gamma correction [
9], non-linear gray value mapping is used to adjust the histogram of image globally. This actually changes the gray distribution so as to reveal the hidden information, which cannot be seen by the human eye. Celik [
10] proposed a variant of HE using Gaussian mixture modeling to achieve automatic image equalization. However, these global operators do not contain the subdomain information of images, so that their effect is limited, especially for targets with a low illumination level or low contrast in the high-contrast scenes. To cope with this problem, researchers have proposed some adaptive regional gray-scale adjustment methods. Abdullah-Al-Wadud [
11] divided the image histogram and assigned specific gray level ranges for each partition before equalizing them separately. In this method, some critical points need to be chosen from the histogram as precondition, which determine the results of enhancement. But this is difficult in automatic image processing. Similarly, Pierre [
12] introduced variational models for both the enhancement of gray-scale images and color images, which cannot automatically select the proper parameters either. Guo [
13] proposed an approach for low-light image based on illumination map estimation. But the method is not available for high dynamic range images because it may excessively enhance the bright targets. This paper presents an entropy-maximized adaptive histogram equalization (EMAHE) algorithm. By analyzing the specific characteristics of the source images, this algorithm can automatically select the best conversion parameters in order to achieve the optimal enhancement effect.
The multi-exposure fusion method uses different imaging parameters to obtain numerous images of the scene, attempting to record more details of the targets under different illumination conditions in the respective images. Then, using a specific algorithm it integrates the effective characteristics of these images into one image in order to show targets clearly together. Song [
14] proposed a method that firstly calculates the brightness, contrast, and gradient. Then, he used the probability model to fuse the different exposure images. This method can preserve the information of different brightness targets in each image and suppress the inversion effect of the luminance gradient, but it ignores the preservation of entropy and average gradient. Hafner [
15] proposed a direct fusion method, which is independent of the exposure times or the response function. But four parameters should be set properly when we use this method, and this brings some uncertainties. Li [
16] firstly calculated the grey value and the regional contrast of images to obtain the initial fusion weight. Afterwards he applies the recursive filtering to optimize the weight. This algorithm is relatively simple. However, when smoothing the weight map, it cannot completely retain the useful information of the original image, and the edge retention is not so good. The pyramid decomposition of image is a multi-scale and multi-resolution decomposition method [
17,
18,
19], which can highlight the important features and details of the image on different scales and spatial resolutions when used in image fusion. The common decomposition models include the Laplacian pyramid [
17], contrast pyramid [
18], gradient pyramid [
19], and so on. Among them, the gradient pyramid decomposition can provide the sub-images in different directions of each dissociation layers, obtaining numerous edge characteristics. It can effectively combine the characteristics and details of source images together with further processing of the sub-images through different fusion operators, and it has good stability and noise immunity.
After numerous contrast experiments, we find that if only one method of image enhancement or multiple exposure fusion is used, it is difficult to achieve the desired imaging results for the complex scenes with large contrast. In fact, the multi-exposure fusion algorithm has two key factors that determine the final effect. One is the acquisition and effective preprocessing of high-quality source images. The other is the selection of a reasonable fusion strategy and fusion operator. The quality of the source images directly determines the amount of valuable information that can be used in the fusion process. The fusion factors determine the extraction of the details from different images. In this paper, the entropy and average gradient are selected as clues in image enhancement when selecting and preprocessing the source images. Besides, the entropy value is introduced into the setting of the fusion weight, which can effectively extract the detailed information from the enhanced images, improve the fusion effect, and achieve HDRI for complex scenes with high contrast.
The remainder of this paper is organized as follows.
Section 2 provides a comprehensive analysis of the digital TDI imaging model. According to its particularity, we build the proper experimental system and carry out a preliminary experiment to discover the change laws of image features as the TDI stages increase. All of these form the foundation for further studies. In
Section 3, we put forward the EMAHE algorithm for maximizing the image information content, which is proved by relevant experiments. In
Section 4, an image fusion method based on gradient pyramid decomposition and entropy weighting is proposed. The comprehensive experimental results are delivered in
Section 5. Consequently, conclusions are drawn in
Section 6.
2. The Digital TDI Imaging Model and Analysis of Its Features
Then we discuss the particularity of digital TDI CMOS by comparative analysis and experimentation with the TDI CCD. The digital TDI CMOS completes the shifting accumulation of images in the form of digital signals within the register, while the TDI CCD completes the accumulation in the form of electric charges within the sensor. This is the essential difference between them. We assume that the TDI stage is set as . During the process of digital TDI pushbroom imaging, the image of the scene produced by the optical lens rapidly moves on the surface of image sensor. At one point, the CMOS closes the electronic shutter after one-time exposure and obtains an image of lines; when the image of the scene moves the displacement of one pixel, the CMOS obtains another image of lines, and then repeats the above process. Hence, each point of the scene is shot times and recorded in different rows of the consecutive images. Afterwards, we perform row-by-row shifting accumulation of the images, which can correct the motion-blurring and obtain the digital TDI image of the scene.
In order to simplify experimental conditions while not going against the basic purpose and principle to verify the HDRI method, we choose to image the still scenes rather than the moving scenes. There are two advantages in doing so. First, we can use the same CMOS camera to simulate the digital TDI and TDI CCD imaging process, which excludes the interference of other factors except the imaging method. Specifically, the simulative digital TDI CMOS obtains images in the same exposure time and adds them up to obtain the integration image. The simulative TDI CCD uses the -fold exposure time to get the equivalent integration image in the charge domain. Second, it greatly simplifies the experiments, and helps to simulate the complex scenes with targets that have low illumination or low contrast.
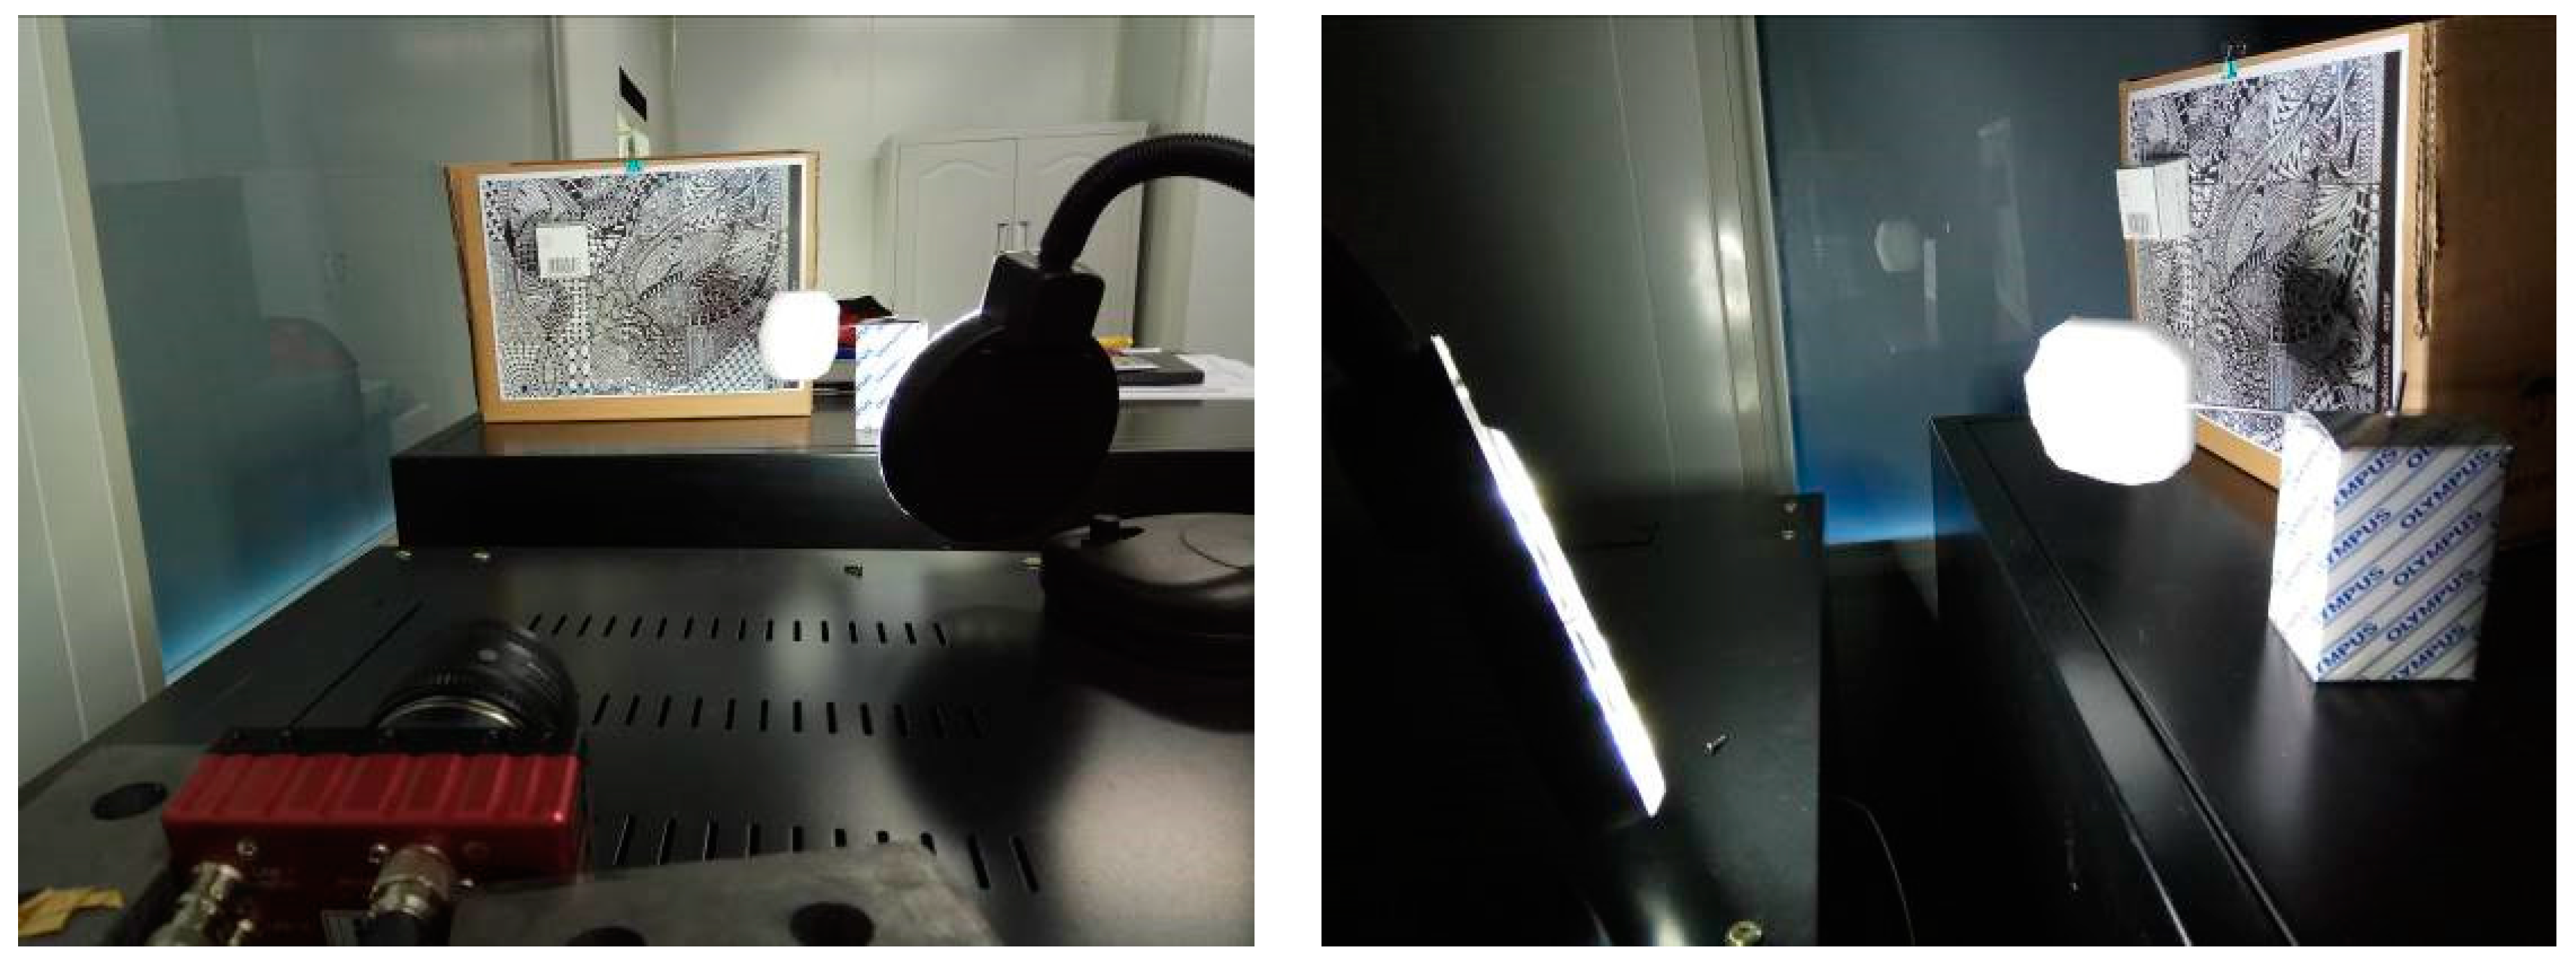
The experimental arrangement is shown in
Figure 2. The scene includes a simulated cloud and simulated building with elevated bright roofs and dark shadows. The experiment setup can simulate the typical remote sensing scene with high contrast. By adjusting the luminance of the light source and the environment, we can set different conditions of contrast to check the efficiency of the algorithms.
In the process of simulative digital TDI imaging, the exposure time of each image is set as 0.5 ms and the
-stage (TDI stage =
) image is the superposition result of
images. The simulation result of
-stage TDI CCD is the image obtained with an exposure time of (0.5 ×
) ms. When
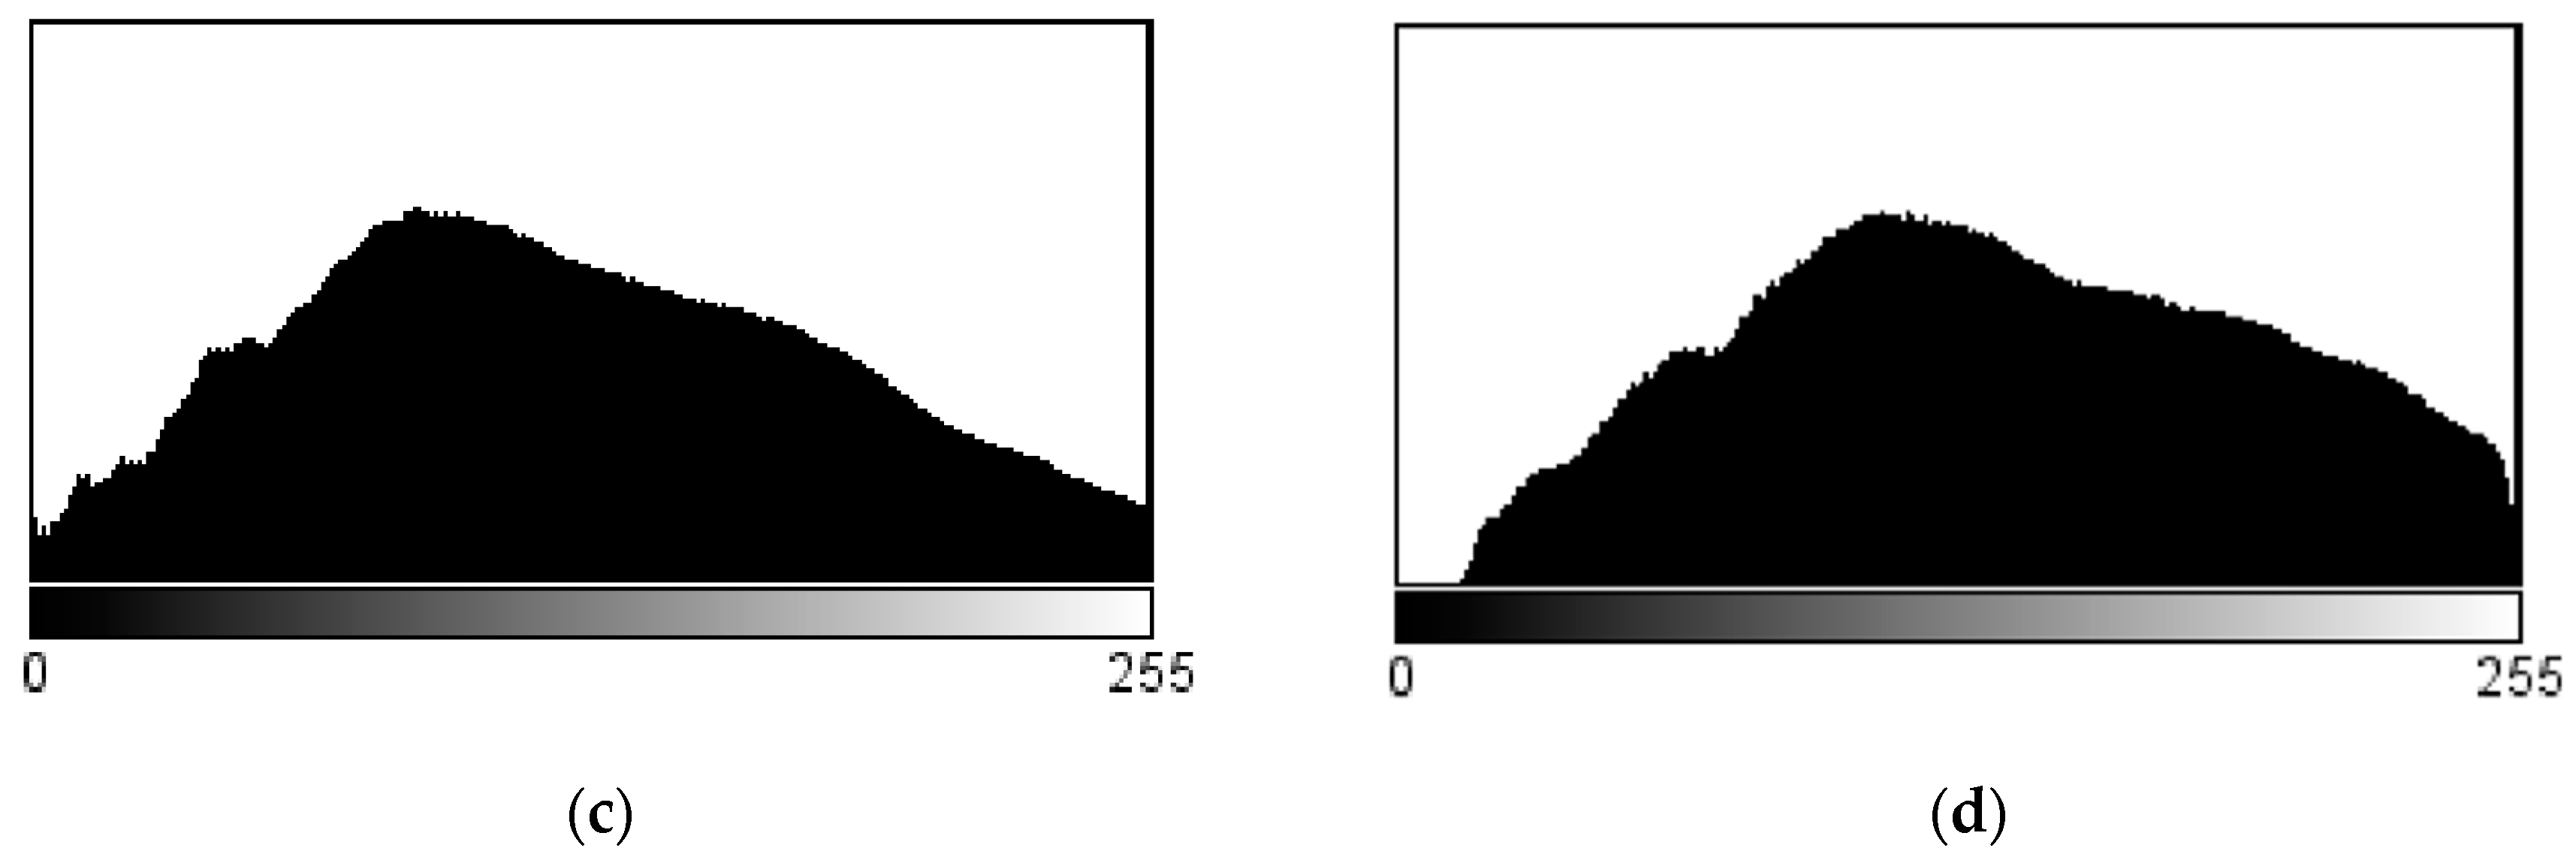
= 10, for example, the obtained images of the two methods and their histograms are shown in
Figure 3.
It can be seen that it is difficult to discern the shadow-covered area in the image obtained by TDI CCD clearly. In comparison, the digital TDI CMOS has a worse effect, because the targets in the shadow have low illumination and low contrast, so they are easily drowned out by cumulative read noise and dark noise. On the other hand, owing to the fact that the pixels formed by digital value accumulation will only saturate but never overflow for the highlighted target, the digital TDI obtains an extraordinary advantage, as the details of targets on the ‘roof’ are clearer. This can also be verified in the low gray-scale area of the histograms.
Most significantly, the digital TDI CMOS has a unique advantage over the TDI CCD. That is, the imaging process of digital TDI generates different exposure degree images from the 1 to TDI stage in the register. Different exposure degrees mean different features of histograms and different expression capabilities of target details. Taking these images as material, this paper aims to achieve HDRI ability for complex scenes by using the method of image processing before producing the final acquired image.
In order to develop the adaptive enhancement and fusion algorithm according to the specific characteristics of the source images, it is an essential condition to have an objective and accurate image quality evaluation method [
20]. Non-reference evaluation indicators usually include contrast, entropy, average gradient, and others [
21,
22].
Entropy characterizes the gray scale distribution of image from the perspective of statistics. The larger the entropy is, the more abundant information will be contained in the image, and the better the visual effect will be [
21]. Assuming that the probability of gray values
is
, the entropy of the image is defined as follows:
The average gradient is the rate at which the image gray value changes in both horizontal and vertical directions. It represents the relative clarity of image, and the ability to express the details [
22]. The average gradient of is defined as follows:
where
m and
n are the numbers of rows and columns of image, and
is the gray value of the pixel in row
i and column
j.
For the processing of image enhancement and fusion, ensuring the source images have balanced gray scale distribution and clear texture details is very important. Therefore, this paper takes the entropy and the average gradient as the main indices of evaluation.
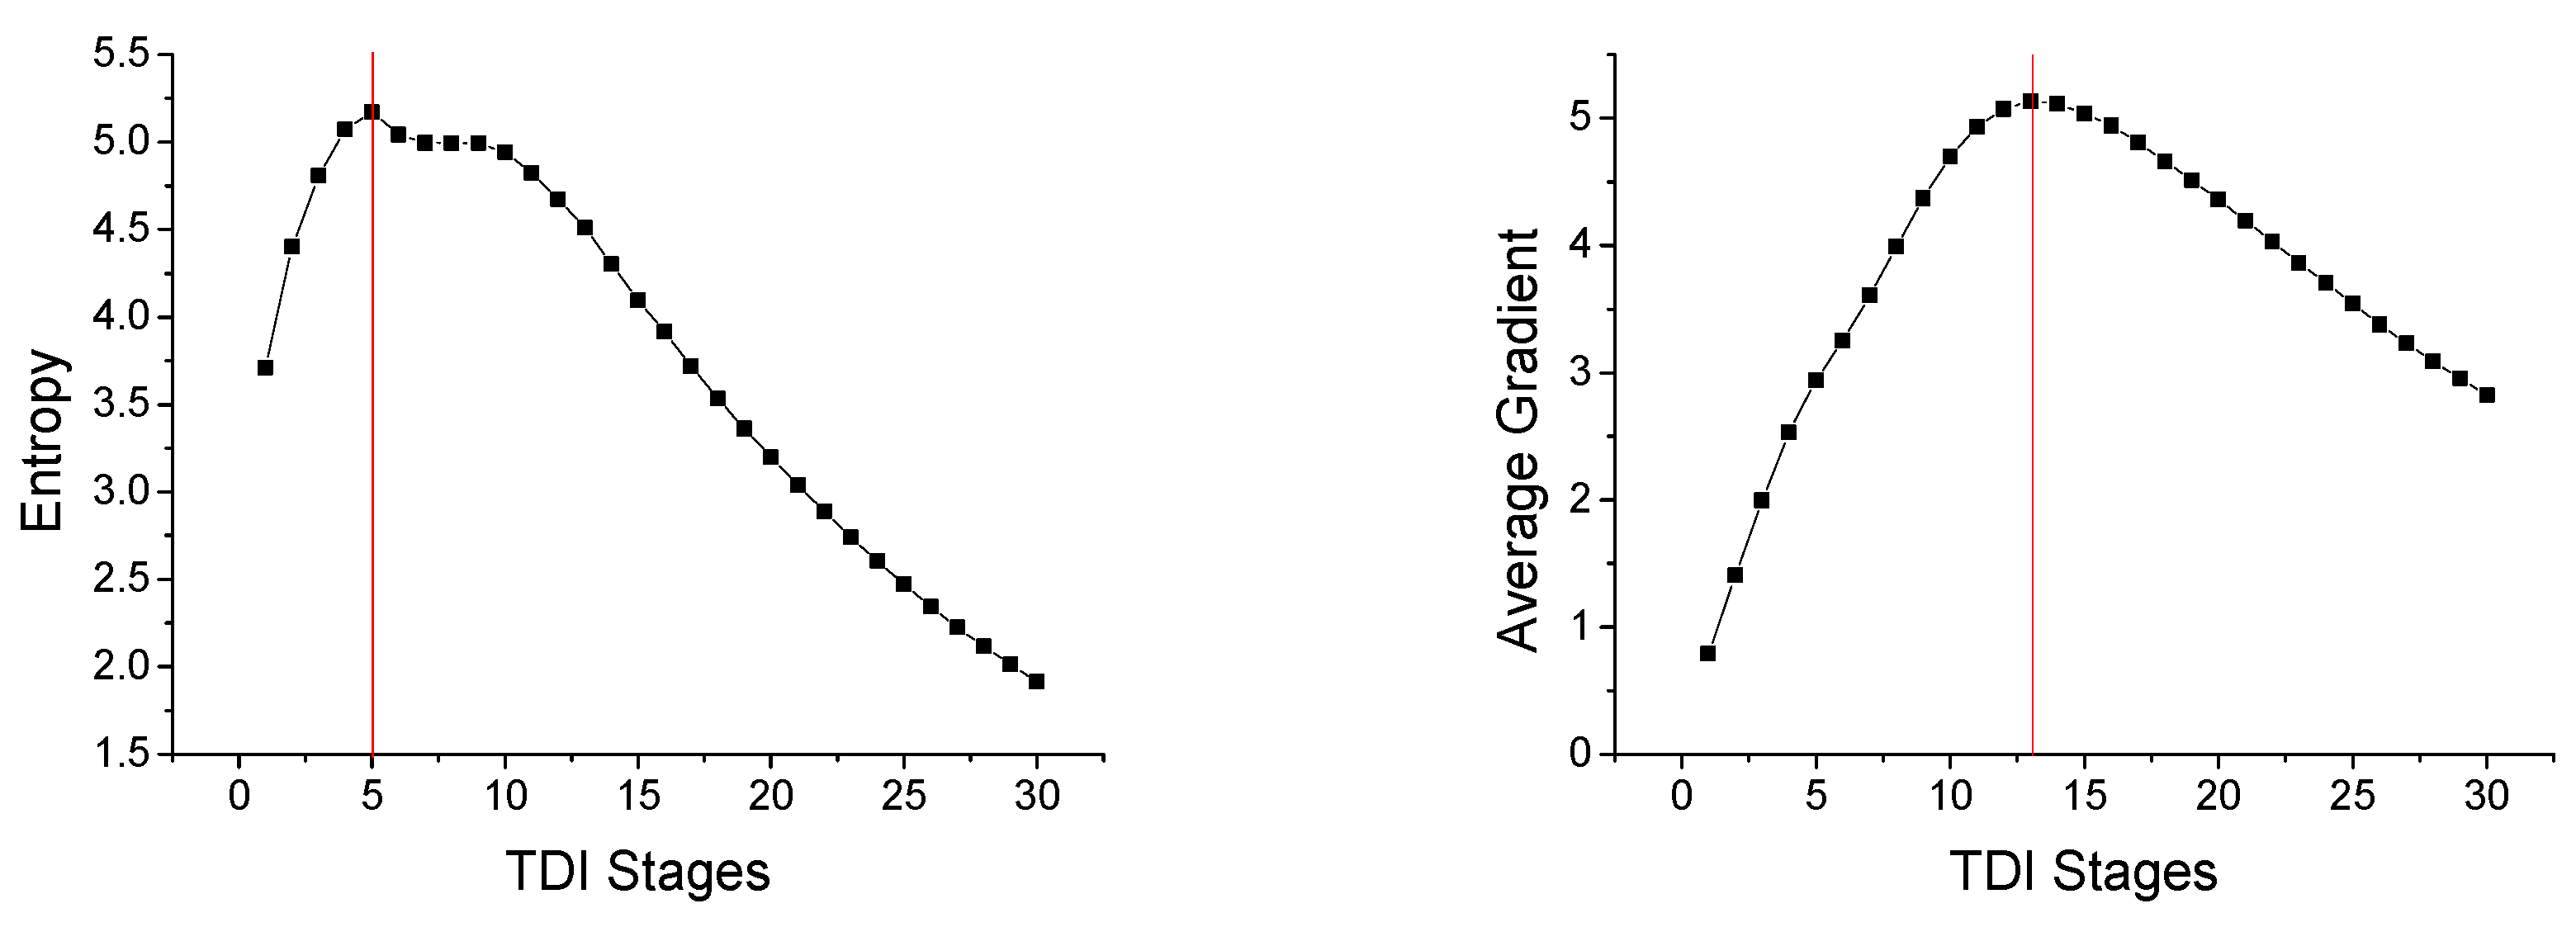
Figure 4 shows the changing trend of entropy and average gradient as the TDI stage increases from 1 to
It can be seen that as the TDI stage increases, the entropy and the average gradient increase to a certain value at first and then decrease. When the TDI stage is at 5 in the case of entropy and 13 for the average gradient, the measures reach their peaks. That is, the two images represent the highest level of detailed information and clarity, respectively. Selecting them as the processing materials and taking the maximum entropy and average gradient as the goal can maintain the valuable characteristic of the multi-stage images of digital TDI CMOS, and provide a powerful guarantee for the optimization of imaging effects.
3. Image Enhancement Algorithm of Entropy-Maximized Adaptive Histogram Equalization (EMAHE)
As a local contrast enhancement method, adaptive histogram equalization (AHE) shows a significant improvement over global operators by calculating the histogram of the subdomain of the image and redistributing the grey value [
8]. However, AHE has the shortcoming of excessively amplifying the noise, which may result in image distortion. Contrast-limited adaptive histogram equalization (CLAHE) can solve this problem by limiting the slope of grey value mapping function of the HE process in each subdomain [
23]. The relationship between the mapping function
T(
i) and the cumulative distribution function (
CDF) is:
where
M is the highest gray value, and
is the number of pixels. Thus, limiting the slope of the mapping function is equivalent to limiting the slope of the
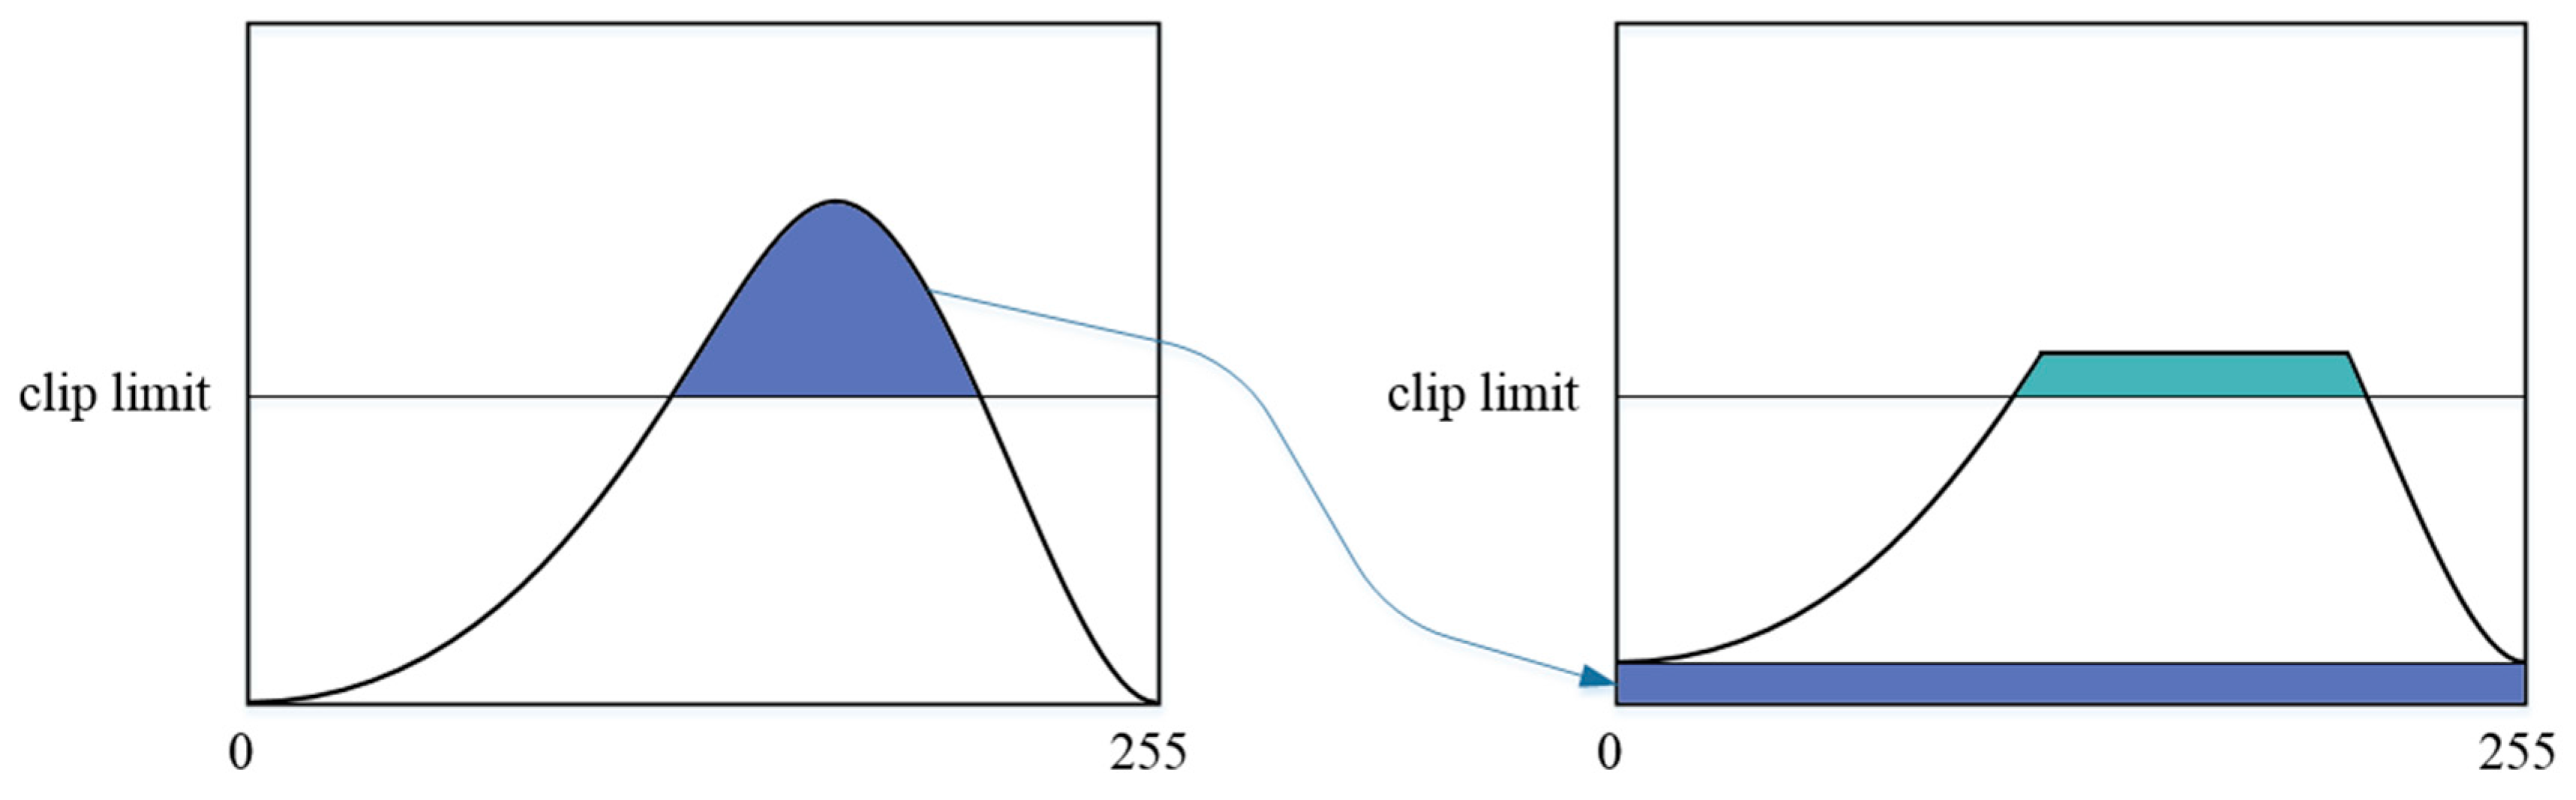
CDF, and further equivalent to limiting the magnitude of the histogram. CLAHE cuts the maximum amplitude of the histogram with a predefined threshold before calculating the
CDF to achieve the purpose of limiting the magnification. The clipped portion is evenly distributed to the histogram, as shown in
Figure 5. In order to eliminate the block effect, the value of each pixel is obtained by bilinear interpolation (and linear interpolation for the edge pixels) of the mapping function of four (and two for the edge pixels) subdomains around it.
However, the enhancement effect of CLAHE is heavily dependent on blocks (expressed as
×
) in both the horizontal and vertical directions, and the clip limit (0~1) of the histogram. If chosen improperly, the parameters not only cannot achieve the desired enhancement effect, but also make the image quality even worse. For example, we performed CLAHE on the 5-stage image with blocks = 30 × 30 and clip limit = 0.3. The obtained image is shown in
Figure 6. It can be seen that although the targets in shadow-covered area are effectively enhanced, the noise has been magnified greatly. Therefore, in order to achieve intelligent automatic enhancement to images of different TDI stages, the traditional CLAHE is not qualified. Besides, image enhancement should maintain or even increase the entropy of image to achieve the optimization of image quality, otherwise it may result in the failure of visual improvement.
We now explain the algorithm policy of EMAHE by analyzing the influence of the two parameters on enhancement effects. Setting the clip limit = 0, flattens the histogram of the subdomain. The mapping function curve becomes a straight line with slope of 1. That is, there is no non-linear gray mapping at all; the result of the enhancement is still the original image itself. As the clip limit increases, the enhancement effect becomes apparent, and the entropy and average gradient increase. As the clip limit increases further until it exceeds the maximum amplitude of the histogram, CLAHE equals AHE, and the noise of the image becomes very obvious. In this case, although the average gradient always increases, the entropy reaches a peak and gradually decreases.
The larger the number of blocks is, the more blocks the original image will be cut into, and the smaller the subdomain will be. Hence, the probability of the targets of the approximate gray value aggregating in a subdomain is larger, including that of low illumination or low contrast. The regional HE will map the gray distribution of the subdomain to the entire gray scale (taking the 8-bit image as an example, the gray scale is from 0 to 255). Hence, in the above case, an excessively concentrated gray value will cause the slope of CDF to be too large, which will lead to excessive shear of the histogram. Although this can improve the contrast of the image as a whole, especially in the shadow-covered area, the negative impact of over-amplifying the noise of the subdomains is fairly serious.
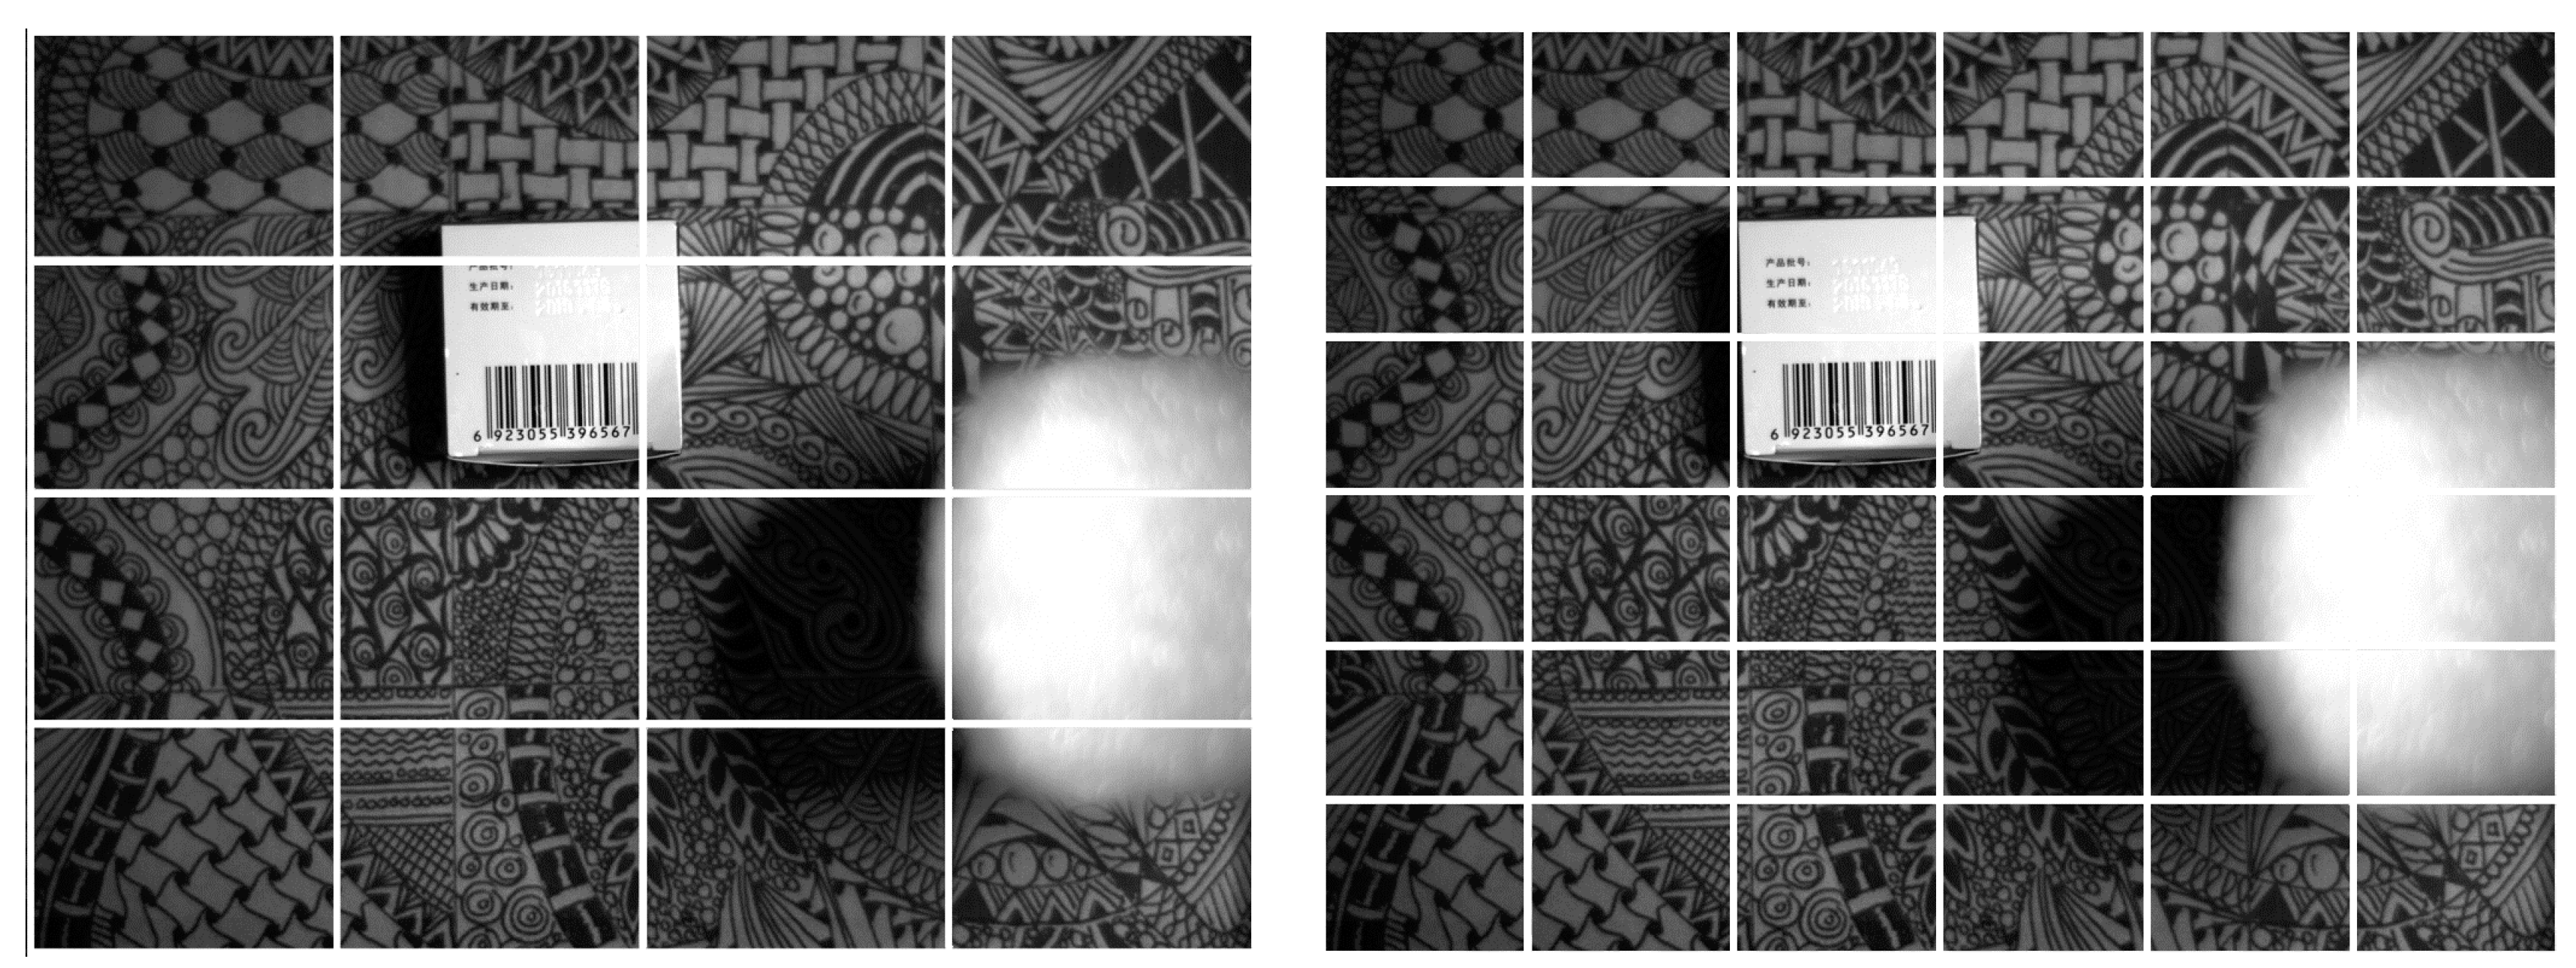
However, there is no definite changing principle for the value of entropy with the block increase, because it has an important relationship with the spatial distribution of the gray values. The reason is that for the same image, using different a block method may result in the same target falling into different sub-blocks, as shown in
Figure 7. The result of regional HE is strongly dependent on the actual gray distribution of the subdomain. Therefore, for the same image, as the number of blocks increases, it will have uncertain subdomain gray distributions and HE results, and of course, an uncertain variation trend of entropy. Further, for different images it is important to adaptively find the best value of blocks according to the maximum entropy strategy.
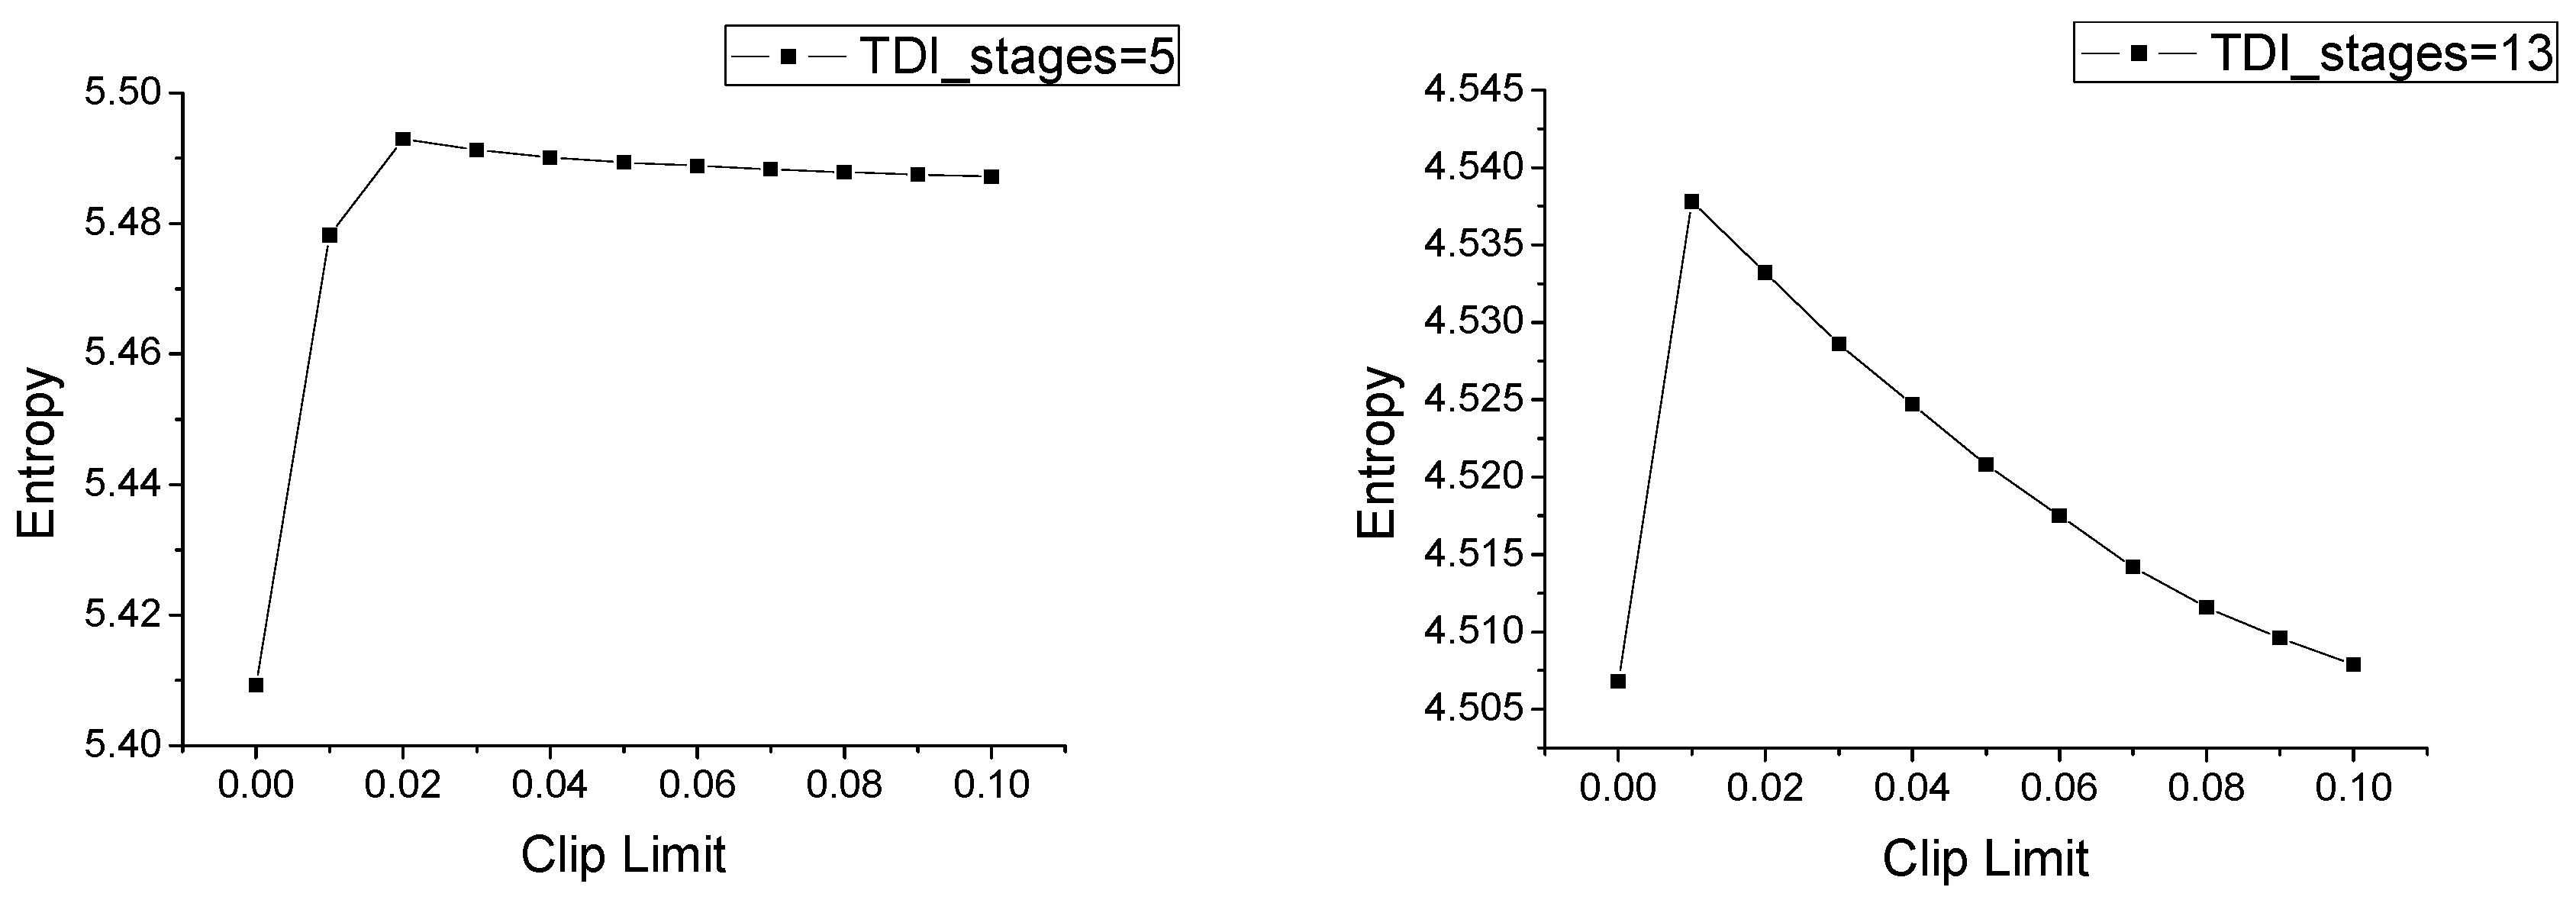
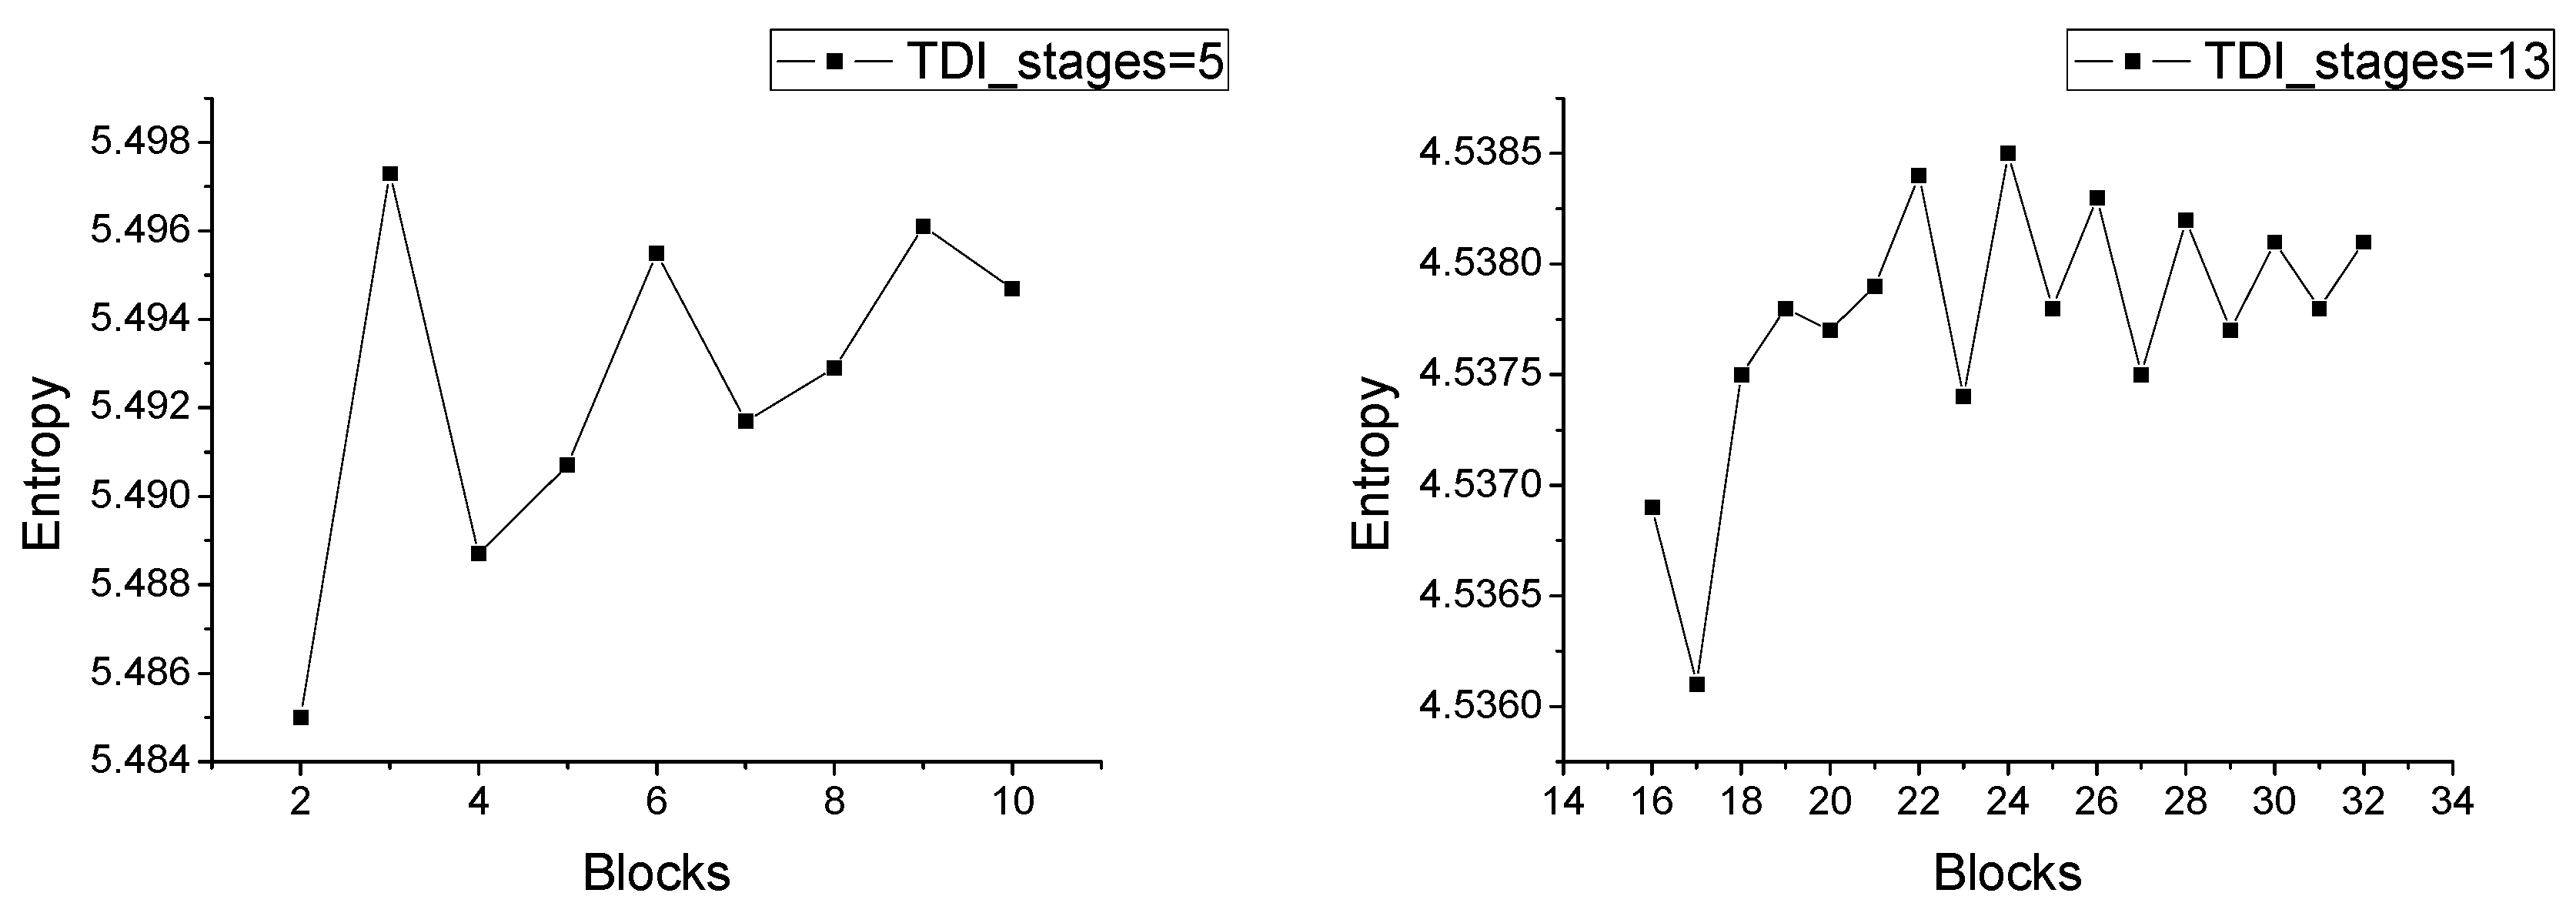
Through experiments with different images, we come to the conclusion that the typical value of blocks can be set as 8 × 8, and the reasonable range of the clip limit is from 0.01 to 0.1. Because there is a certain relationship between the entropy and the clip limit, we firstly keep the blocks fixed and increase the clip limit from 0 by a specified step (here, the step is set as 0.01). As shown in
Figure 8, the entropy increases gradually and then decreases. The best clip limit exists where there is the largest entropy on the curve. Then, based on the best clip limit, the number of blocks increases from 2 × 2 step by step (here the step is set as 1 × 1). In this process, the change of entropy has no clear regularity, as is shown in
Figure 9. However, the location of the maximum entropy has a certain law. That is, if we divide the 5-stage image, whose grey level is medium and gray value distribution is relatively concentrated, with an overly large value of blocks, the noise will be excessively amplified. In fact, the ranges from 2 × 2 to 10 × 10 could be reasonable in this condition. For the 13-stage image of high grey level, the maximum entropy usually appears near the block value of 20 × 20. Hence, we can directly find the optimal blocks from 16 × 16 to 30 × 30. The parameter selection strategy as above can reduce the computational complexity and improve the efficiency of the algorithm.
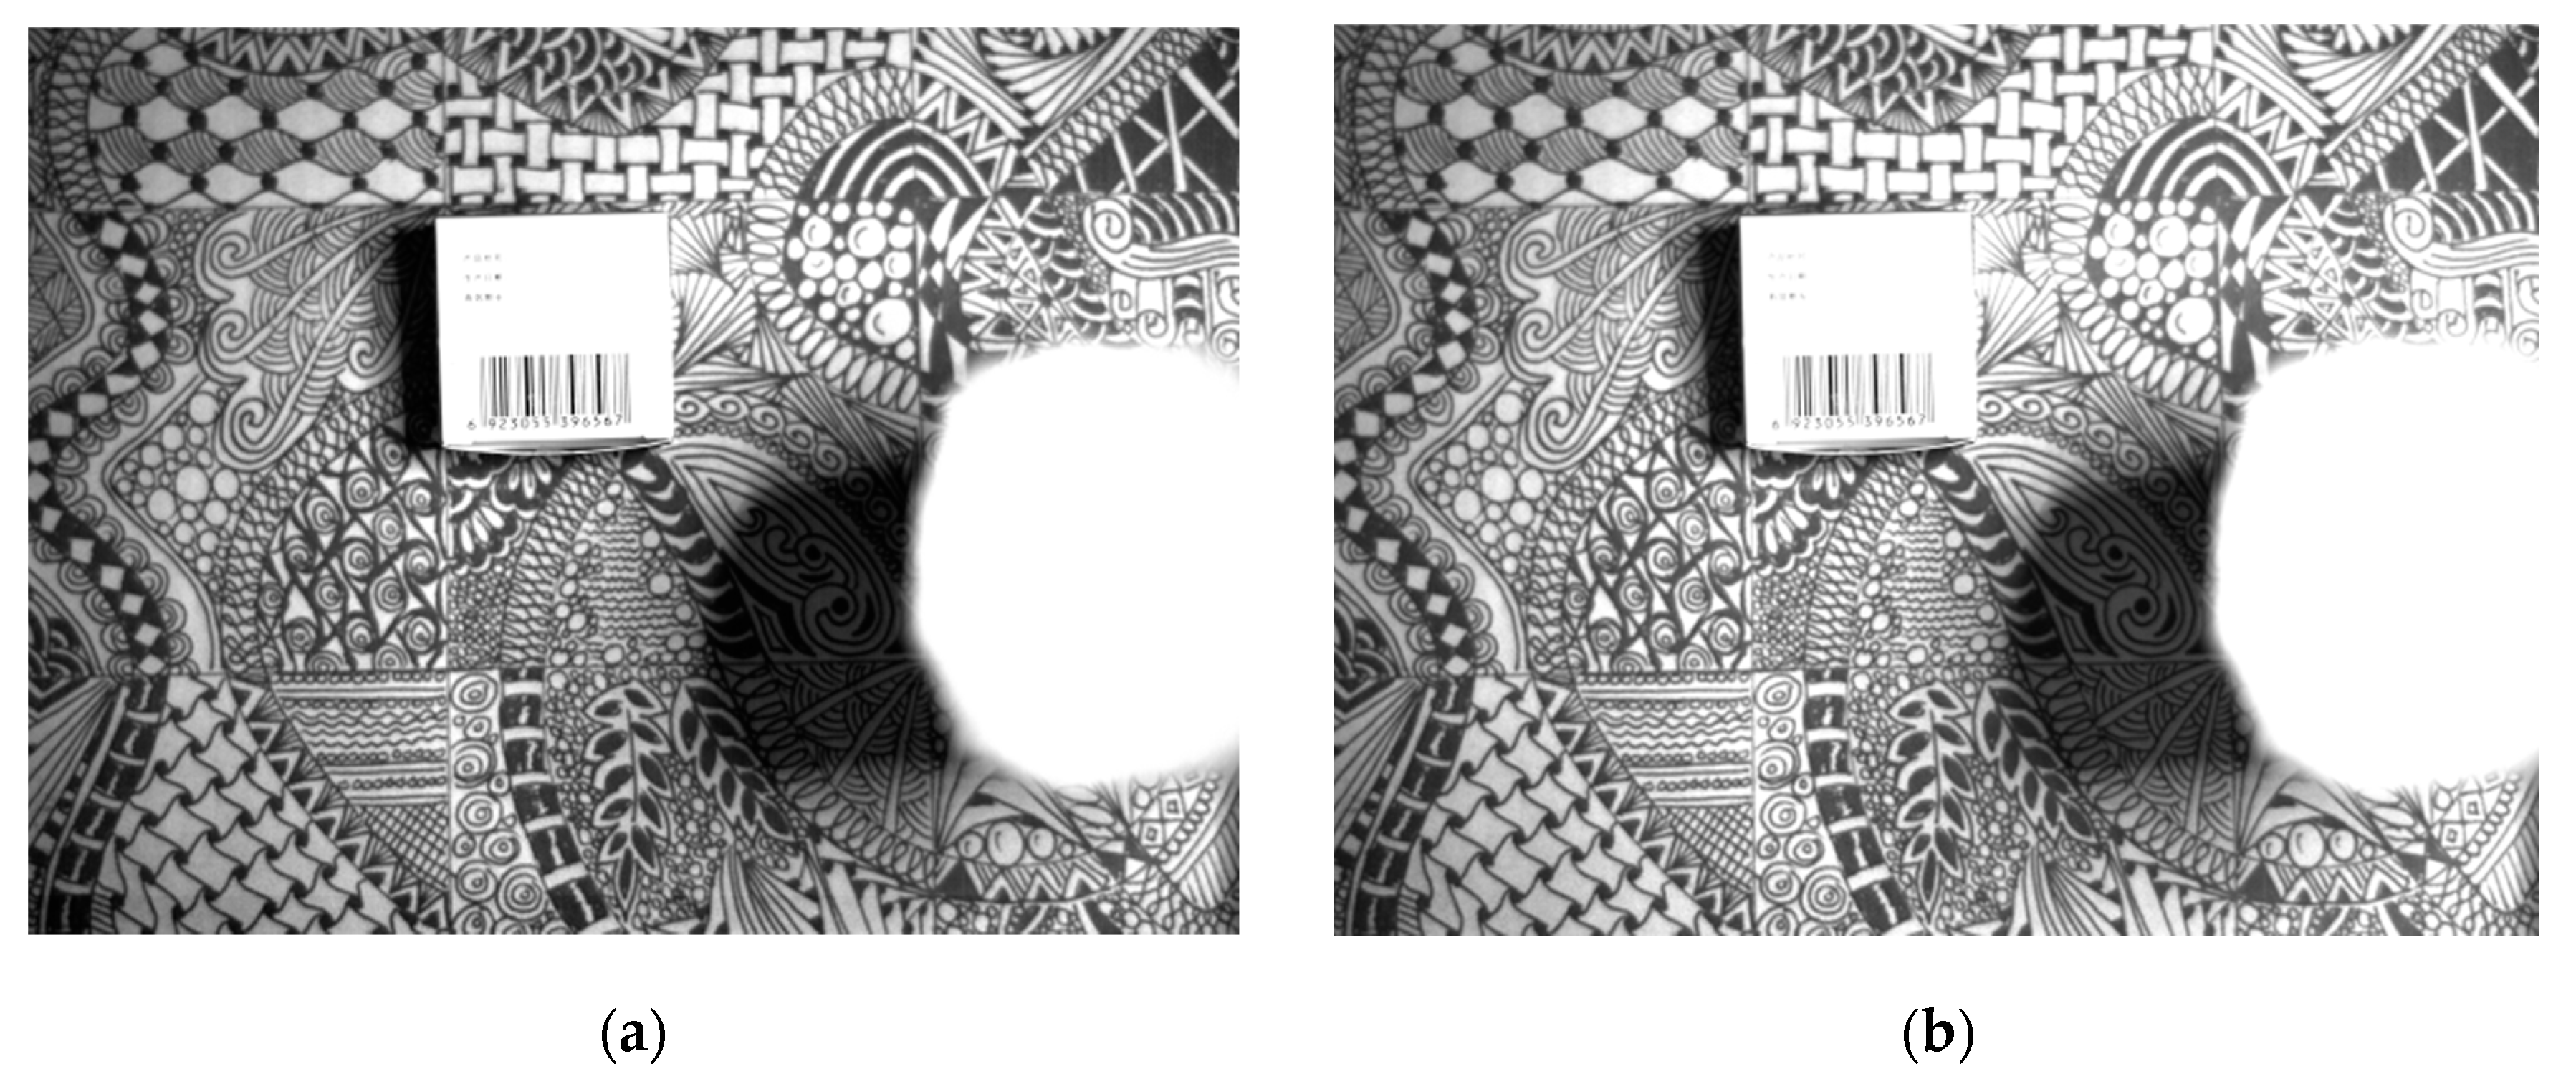
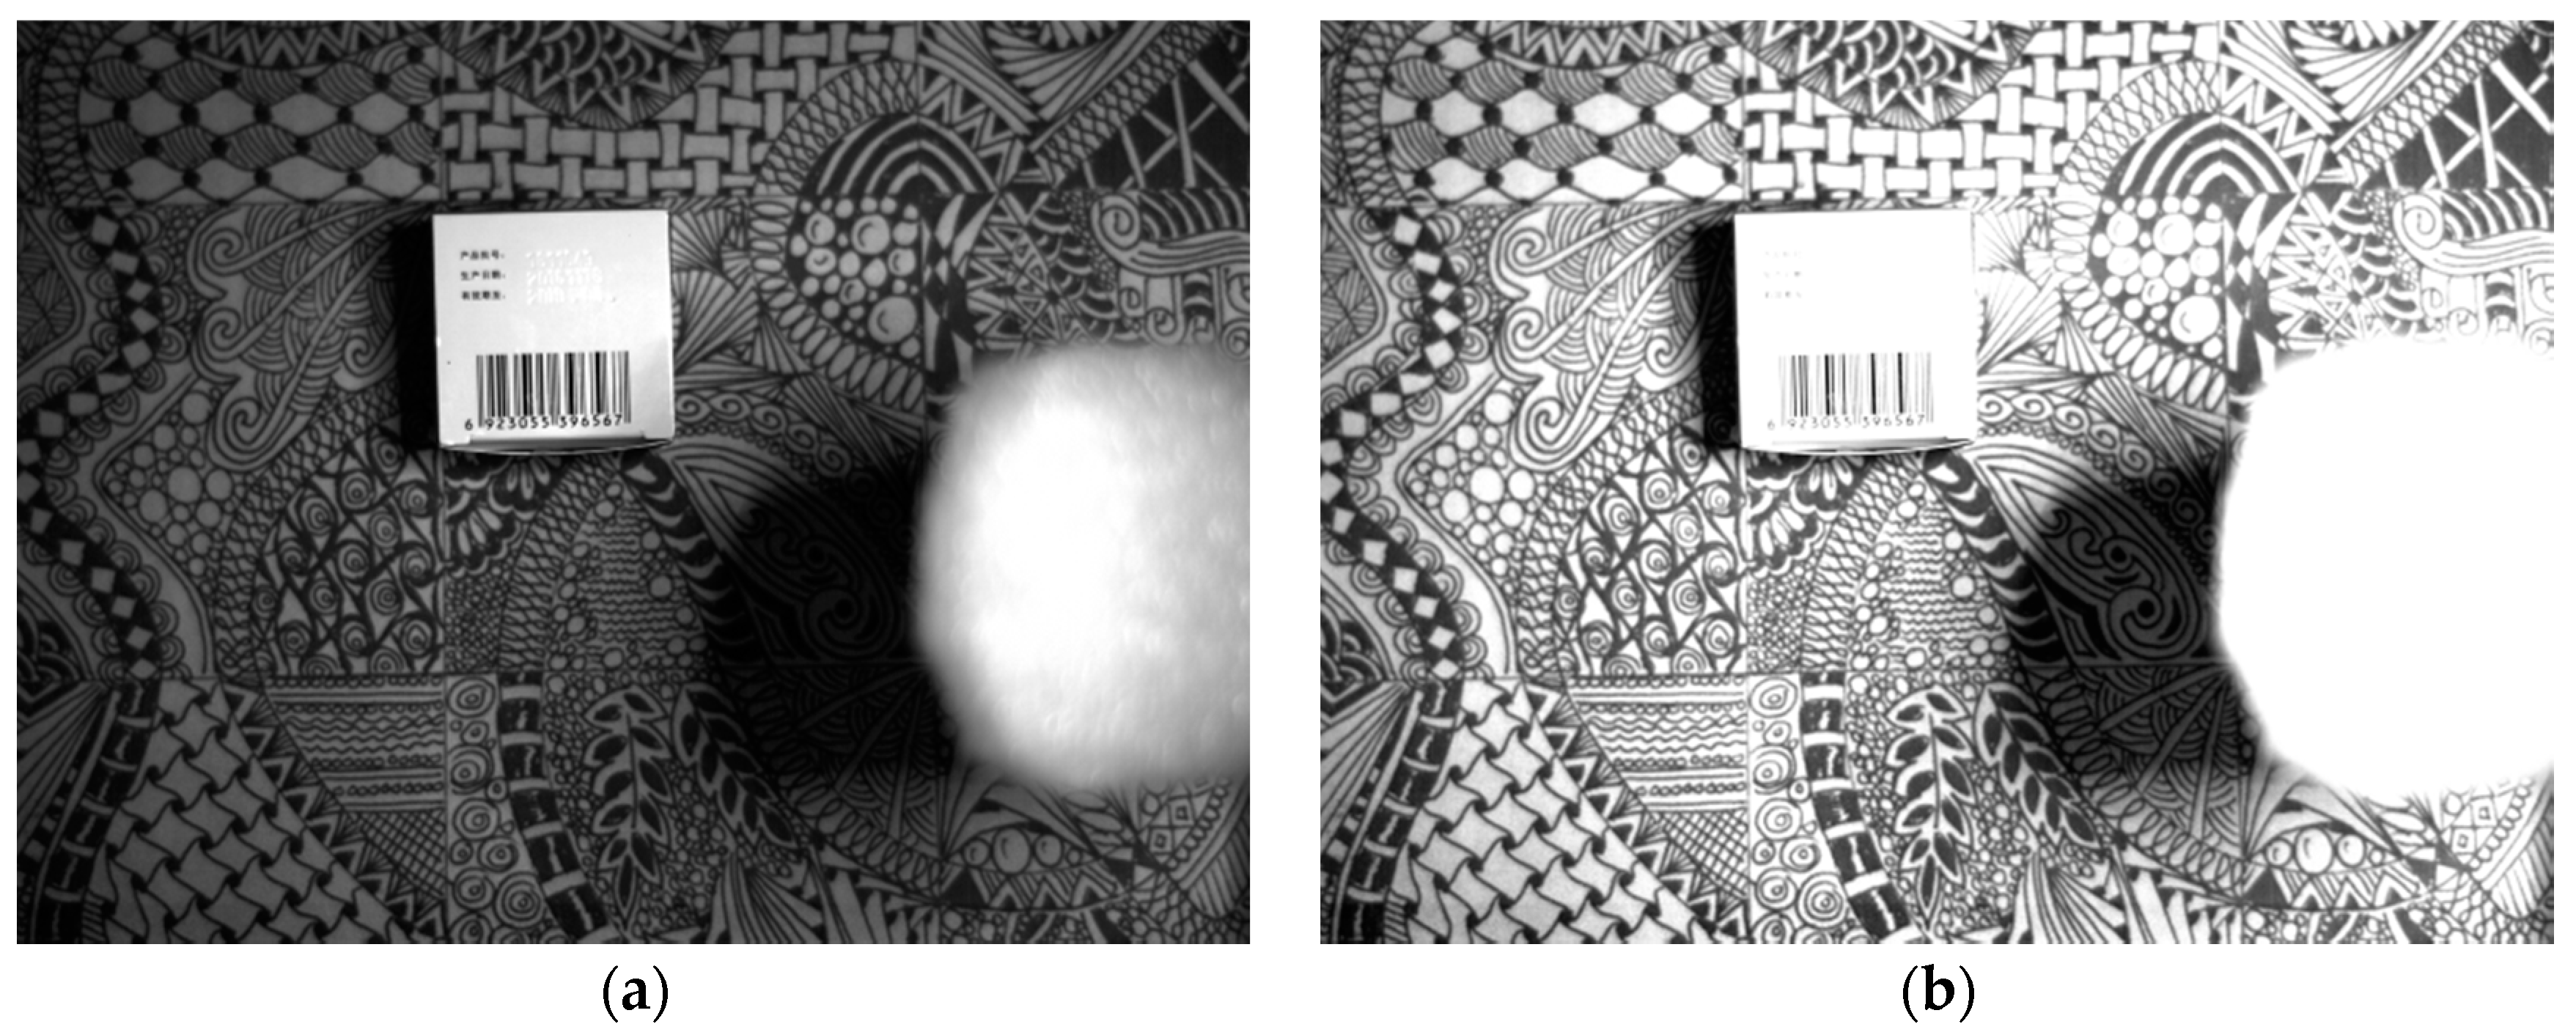
The original 5-stage and 13-stage images are shown in
Figure 10. Their enhanced results by the algorithms of the reference [
11,
12], and EMAHE are shown in
Figure 11. The enhanced 5-stage image by EMAHE contains a large number of details with respect to the medium illumination targets, but the contrast enhancement of the shadow covered area is still not sufficient. Meanwhile, the enhanced 13-stage image shows a great improvement of the grey level and contrast of shadow-covered area, while keeping most of the details of the image as a whole.
In addition, the entropy and average gradient of the enhanced images are shown in
Table 1. Experimental data show that the EMAHE can improve the entropy to some extent while increasing the average gradient of the image. These positive effects lay an important foundation for further image fusion.
4. Image Fusion Based on Gradient Pyramid Decomposition and Entropy Weighting
In the process of image fusion, the selection of fusion strategy and operator is the key factor. The fusion method based on gradient pyramid decomposition has the inherent advantage in increasing the average gradient of the image, but it is slightly weak in terms of improving the entropy. This is because the method itself has no evaluation and maintenance mechanism for the information content of the source images, and the fusion process is aimless to some extent.
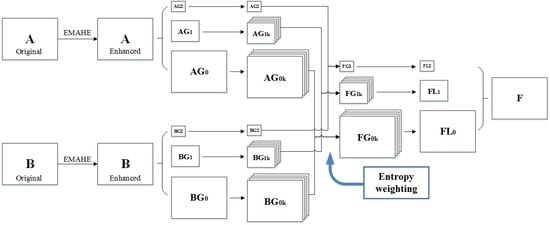
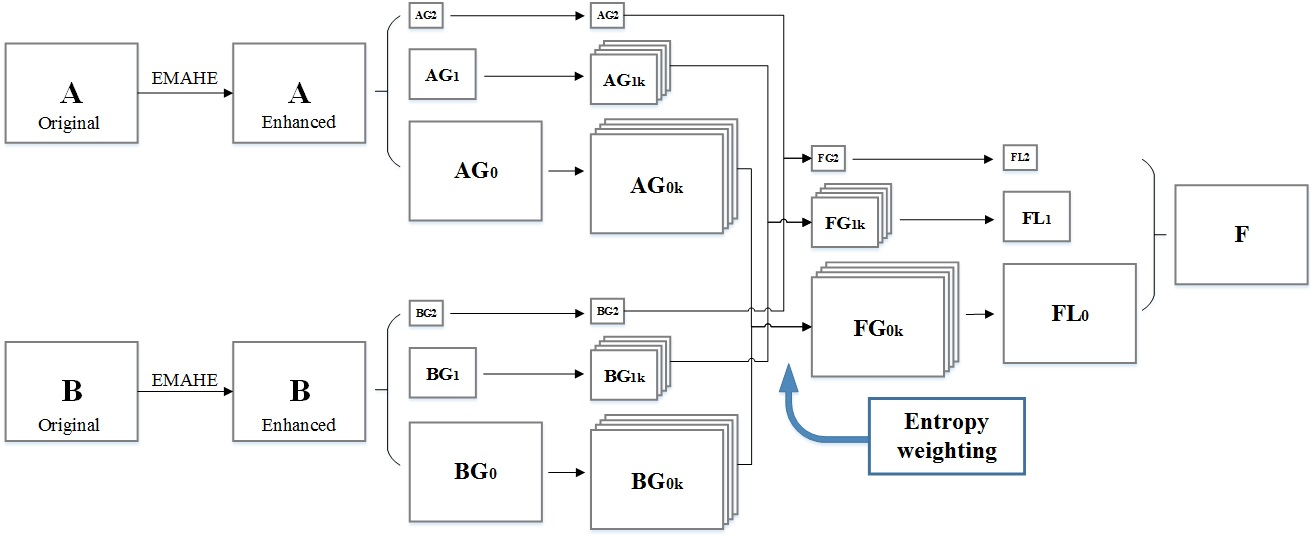
This paper takes the entropy as the weighting factor to fuse the gradient pyramids, which can effectively improve the entropy of the obtained image and increase its information content. In the process of fusion, the entropy of sub-images in each direction on each decomposing layer of image pyramids is calculated, and used as the weight for weighted average calculation of each of the two corresponding sub-images. With this method, a higher entropy and average gradient of the obtained image can be provided by relatively simple calculation, so as to make it more suitable for personal eye observation in terms of clarity and gray-scale details. The image fusion process can be summarized as follows:
- (1)
perform Gaussian tower decomposition on the source images and , respectively, and obtain the image pyramids {} and {}, where l represents the number of layers;
- (2)
perform gradient filtering on the images of each decomposing layer (except the highest layer) of {
} and {
} in horizontal, vertical and two diagonal directions, and, respectively, obtain four images with details and edge information of each layer in each direction. Then, form the gradient pyramids {
} and {
}, where
k = 1, 2, 3, 4, which represents four directions. The computational formula is:
among them,
,
,
,
,
.
- (3)
use the entropy of sub-images in each direction on each decomposing layer to calculate with Equation (1) and name
and
, as the weight in order to obtain the fused gradient pyramid {
}. The subimage on the
l layer and in the
k direction of the fused pyramid is calculated as:
- (4)
transform the gradient pyramid {
} into the Laplace pyramid {
} with Formula (6), and then perform reverse pyramid calculation to obtain the fused image.
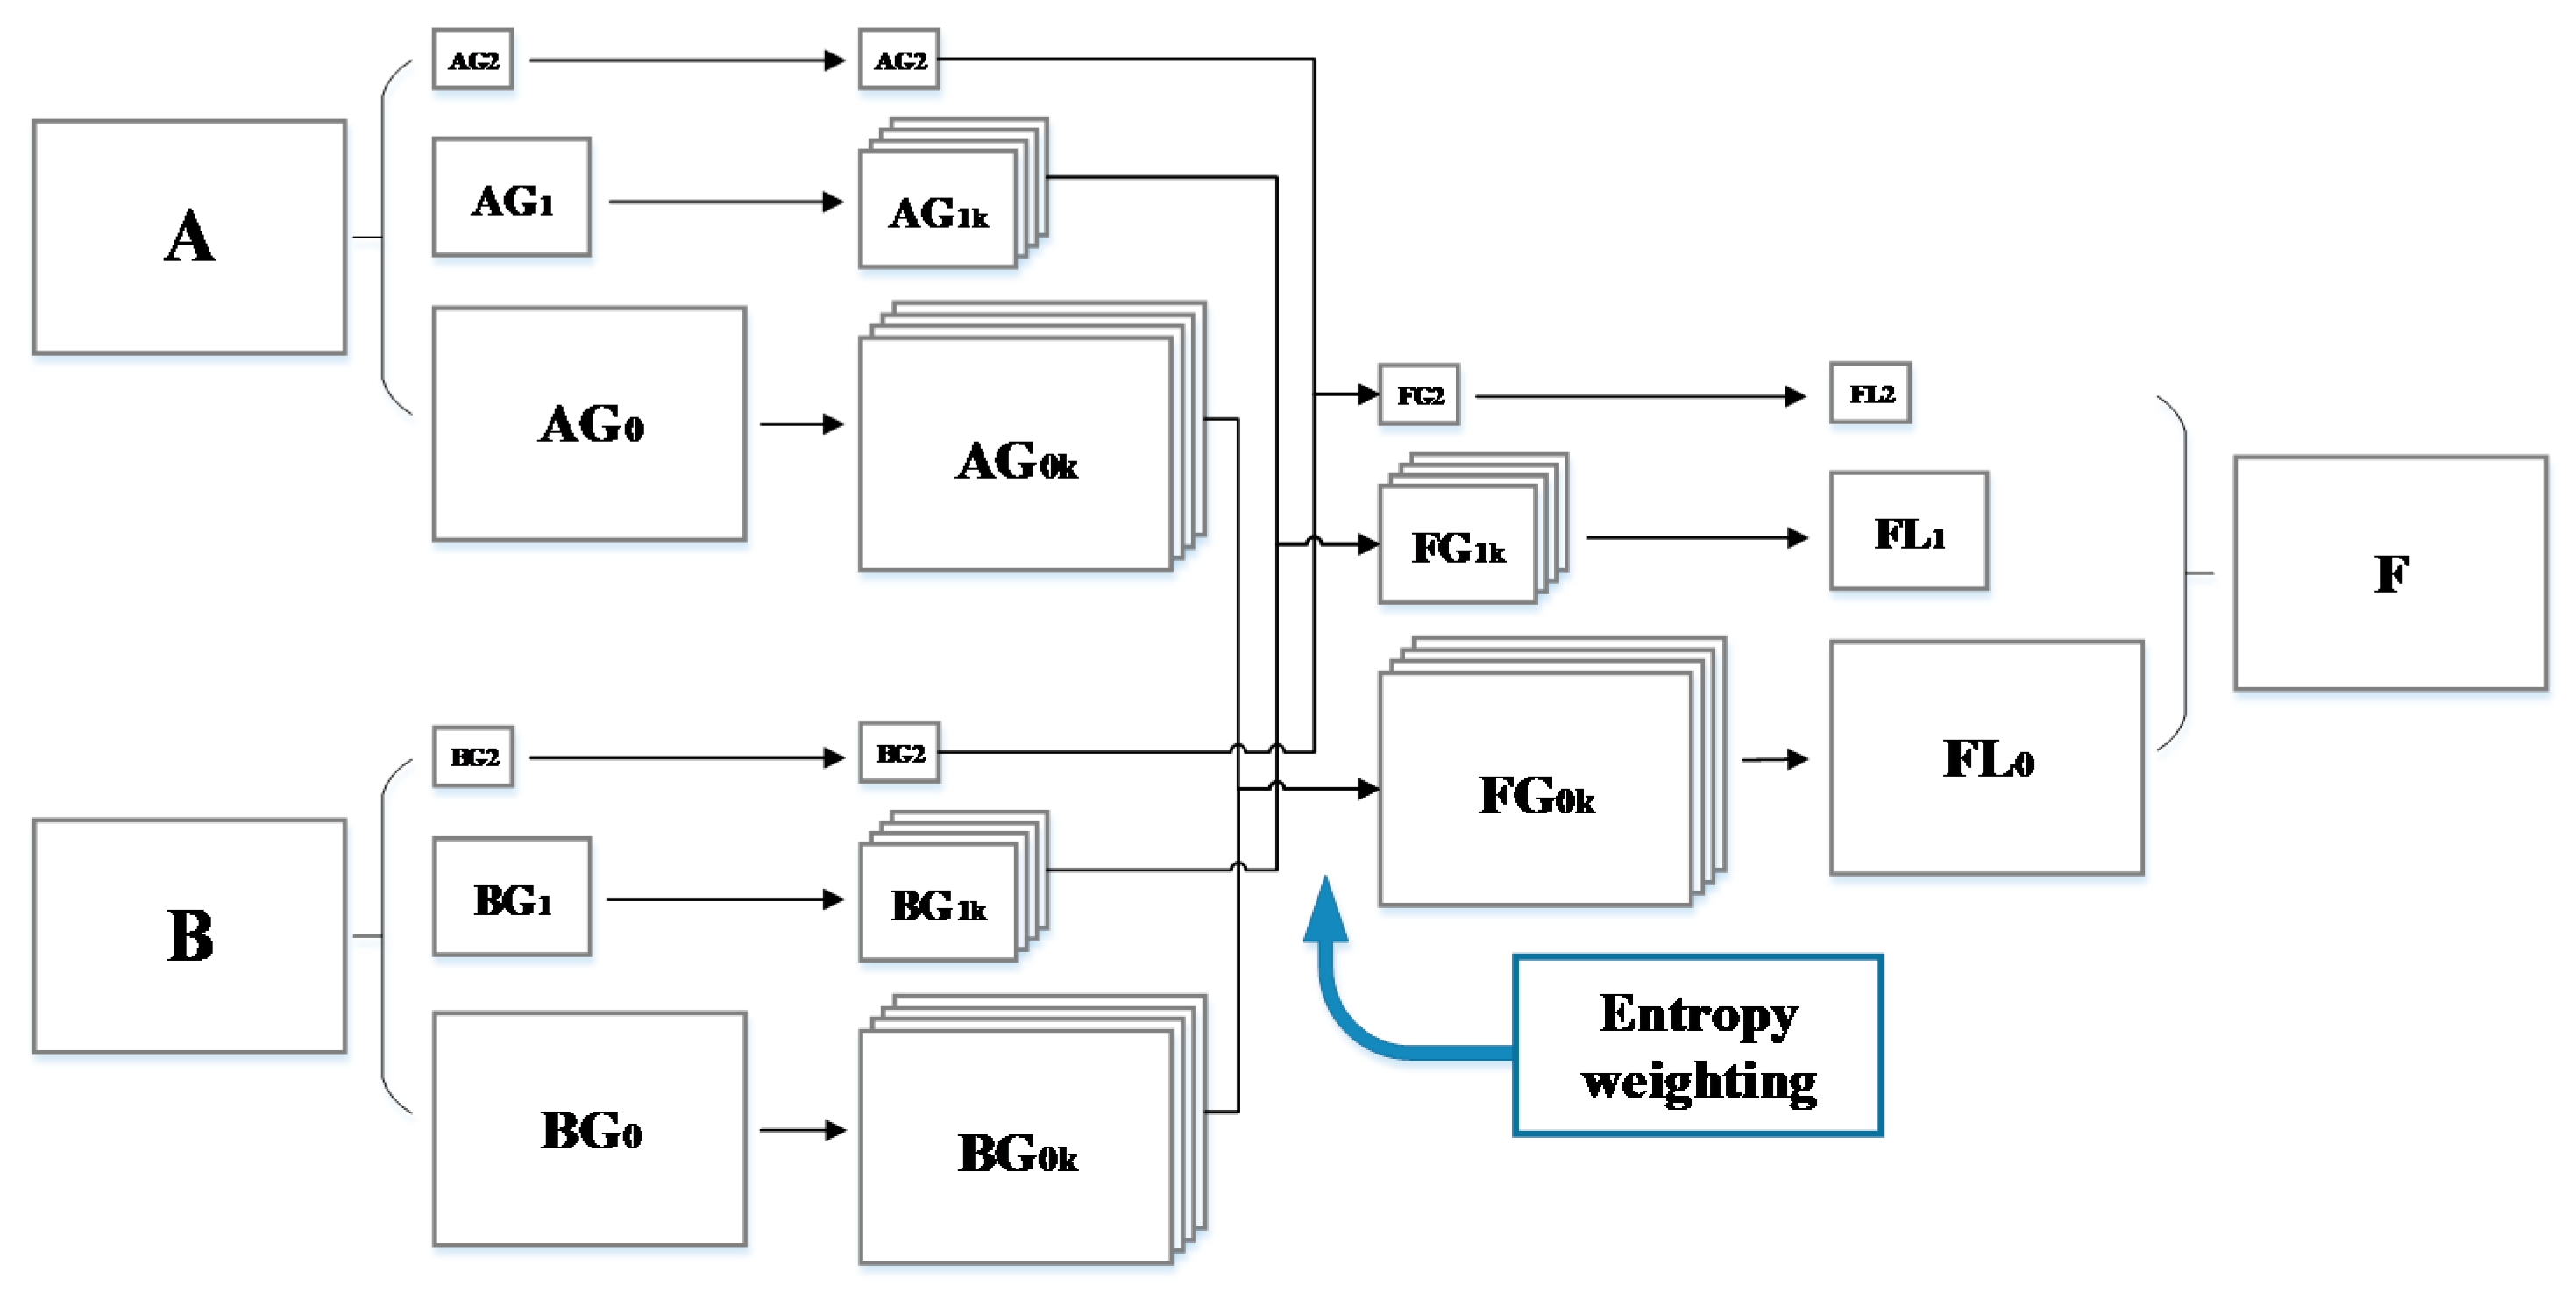
Taking the trilaminar pyramid decomposition as an example, the above process can be described in
Figure 12.
5. Experiment and Data
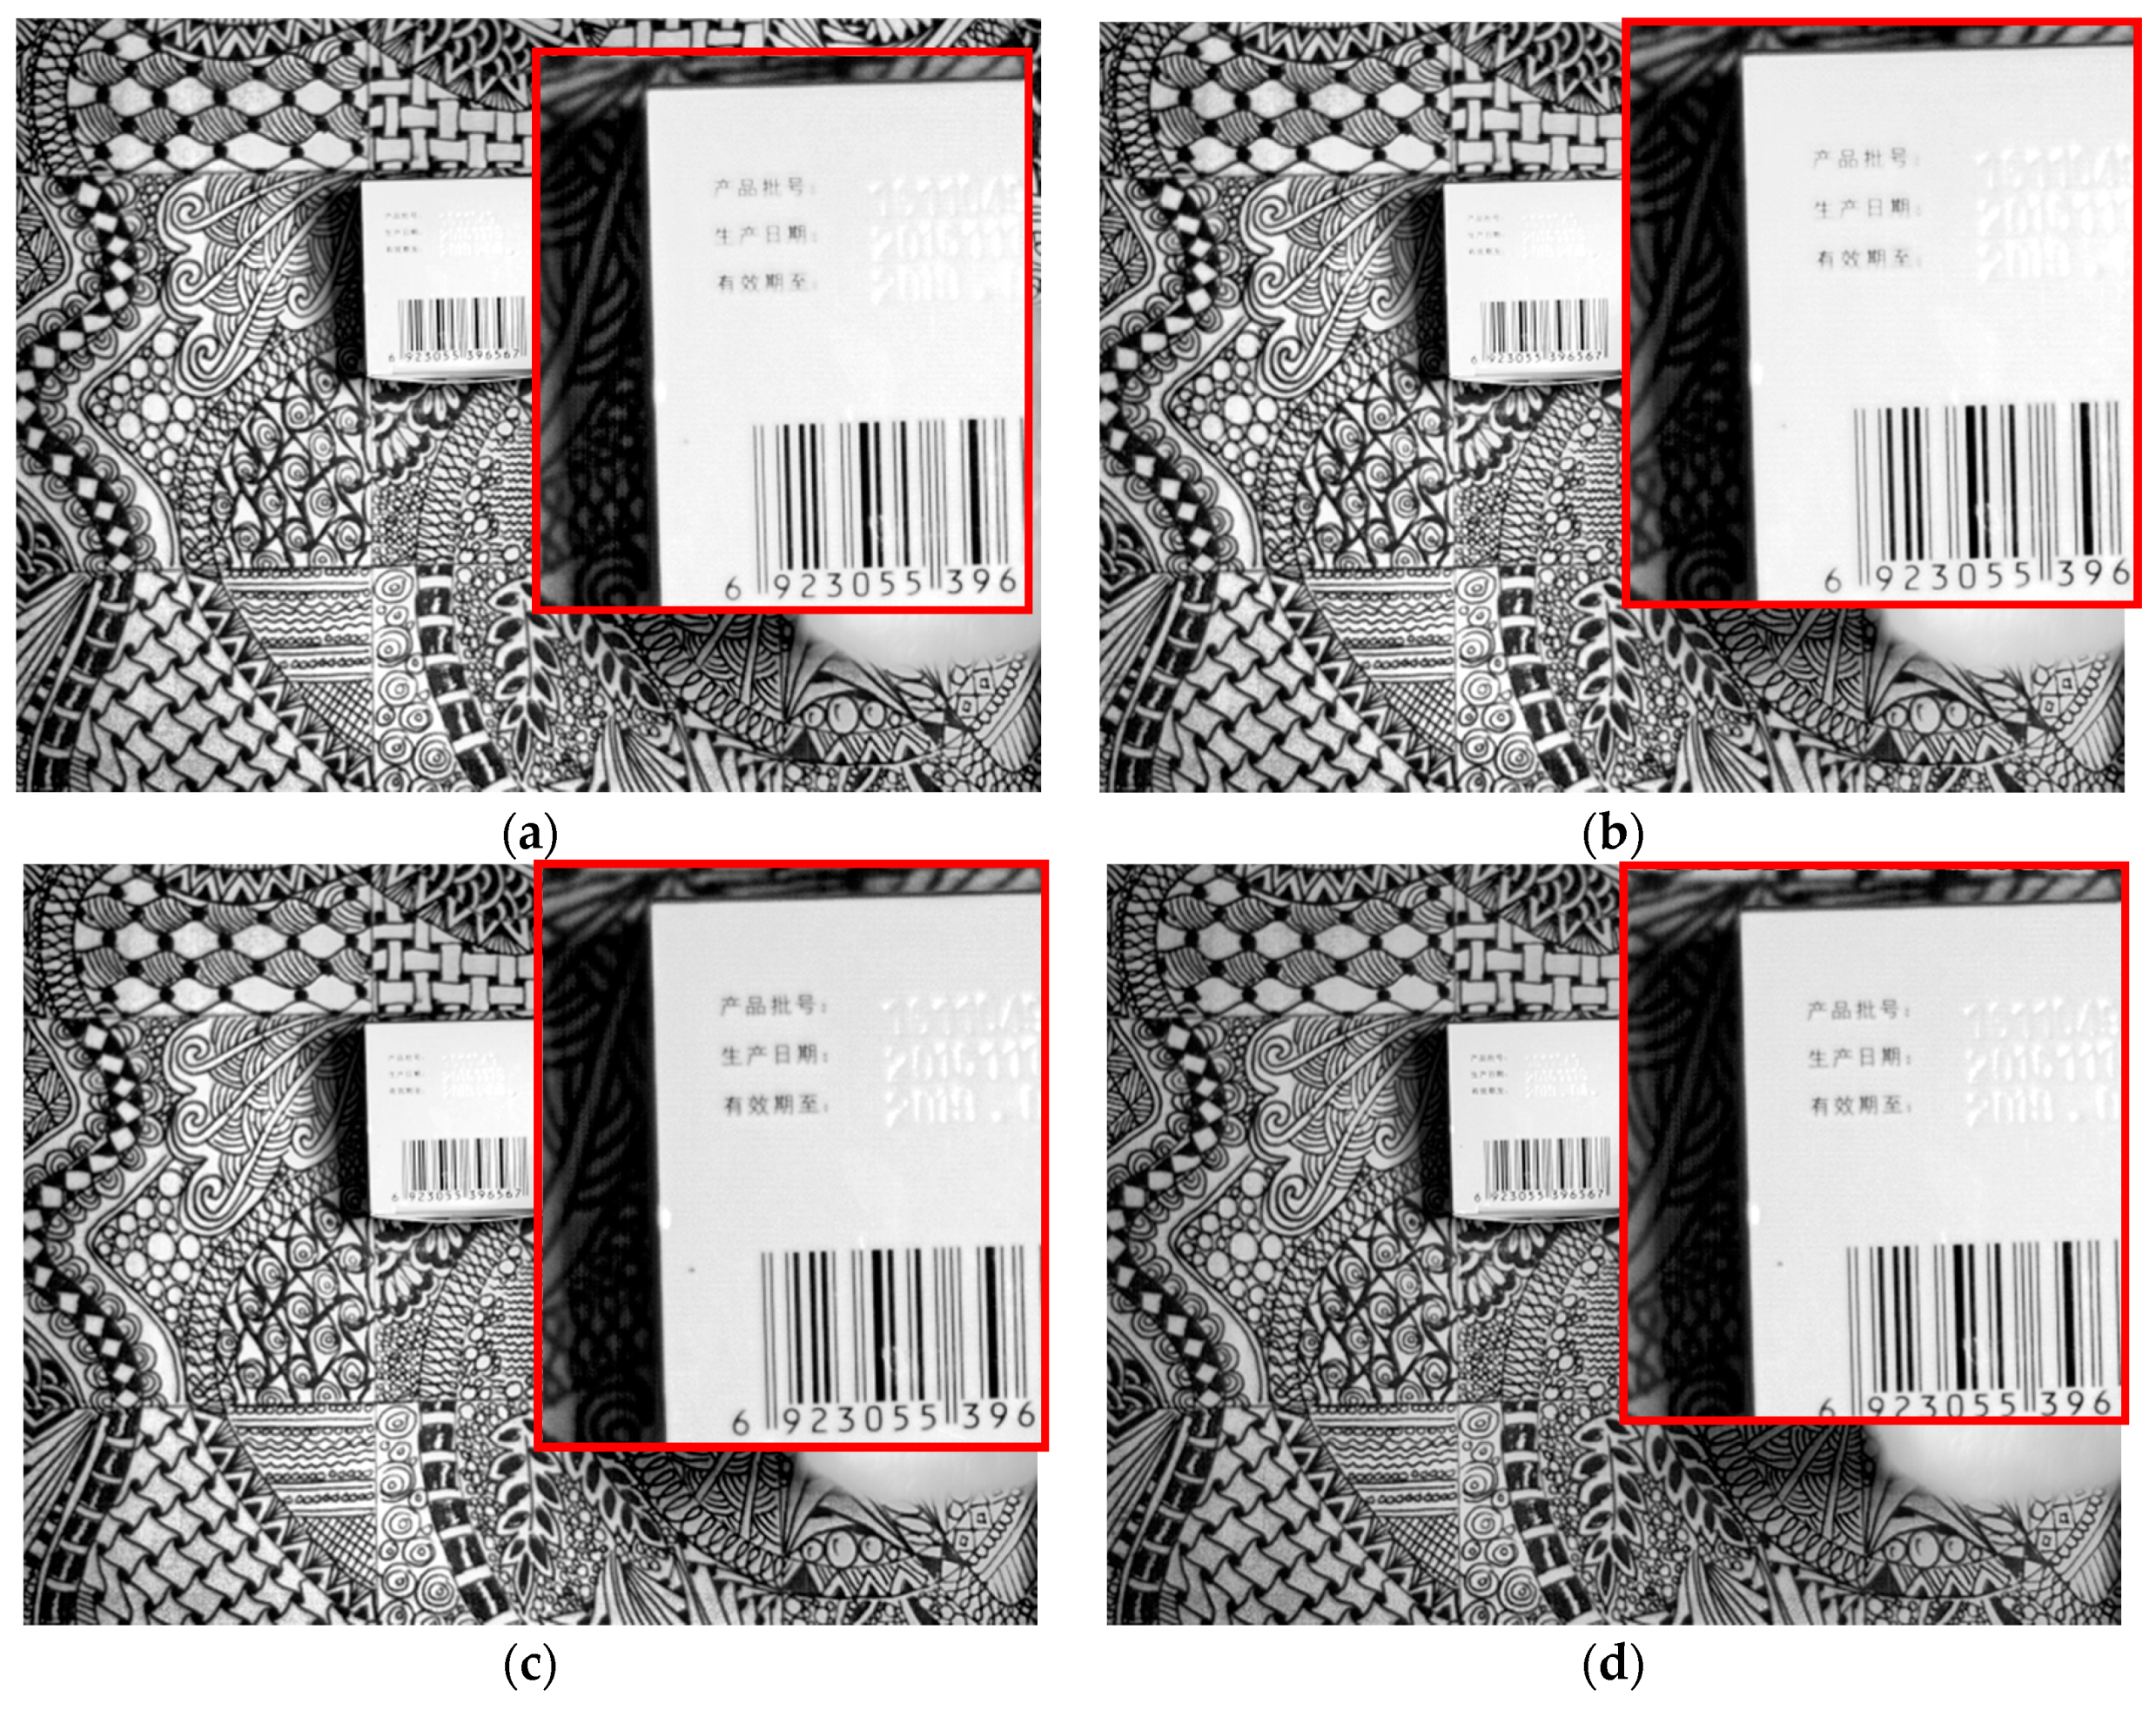
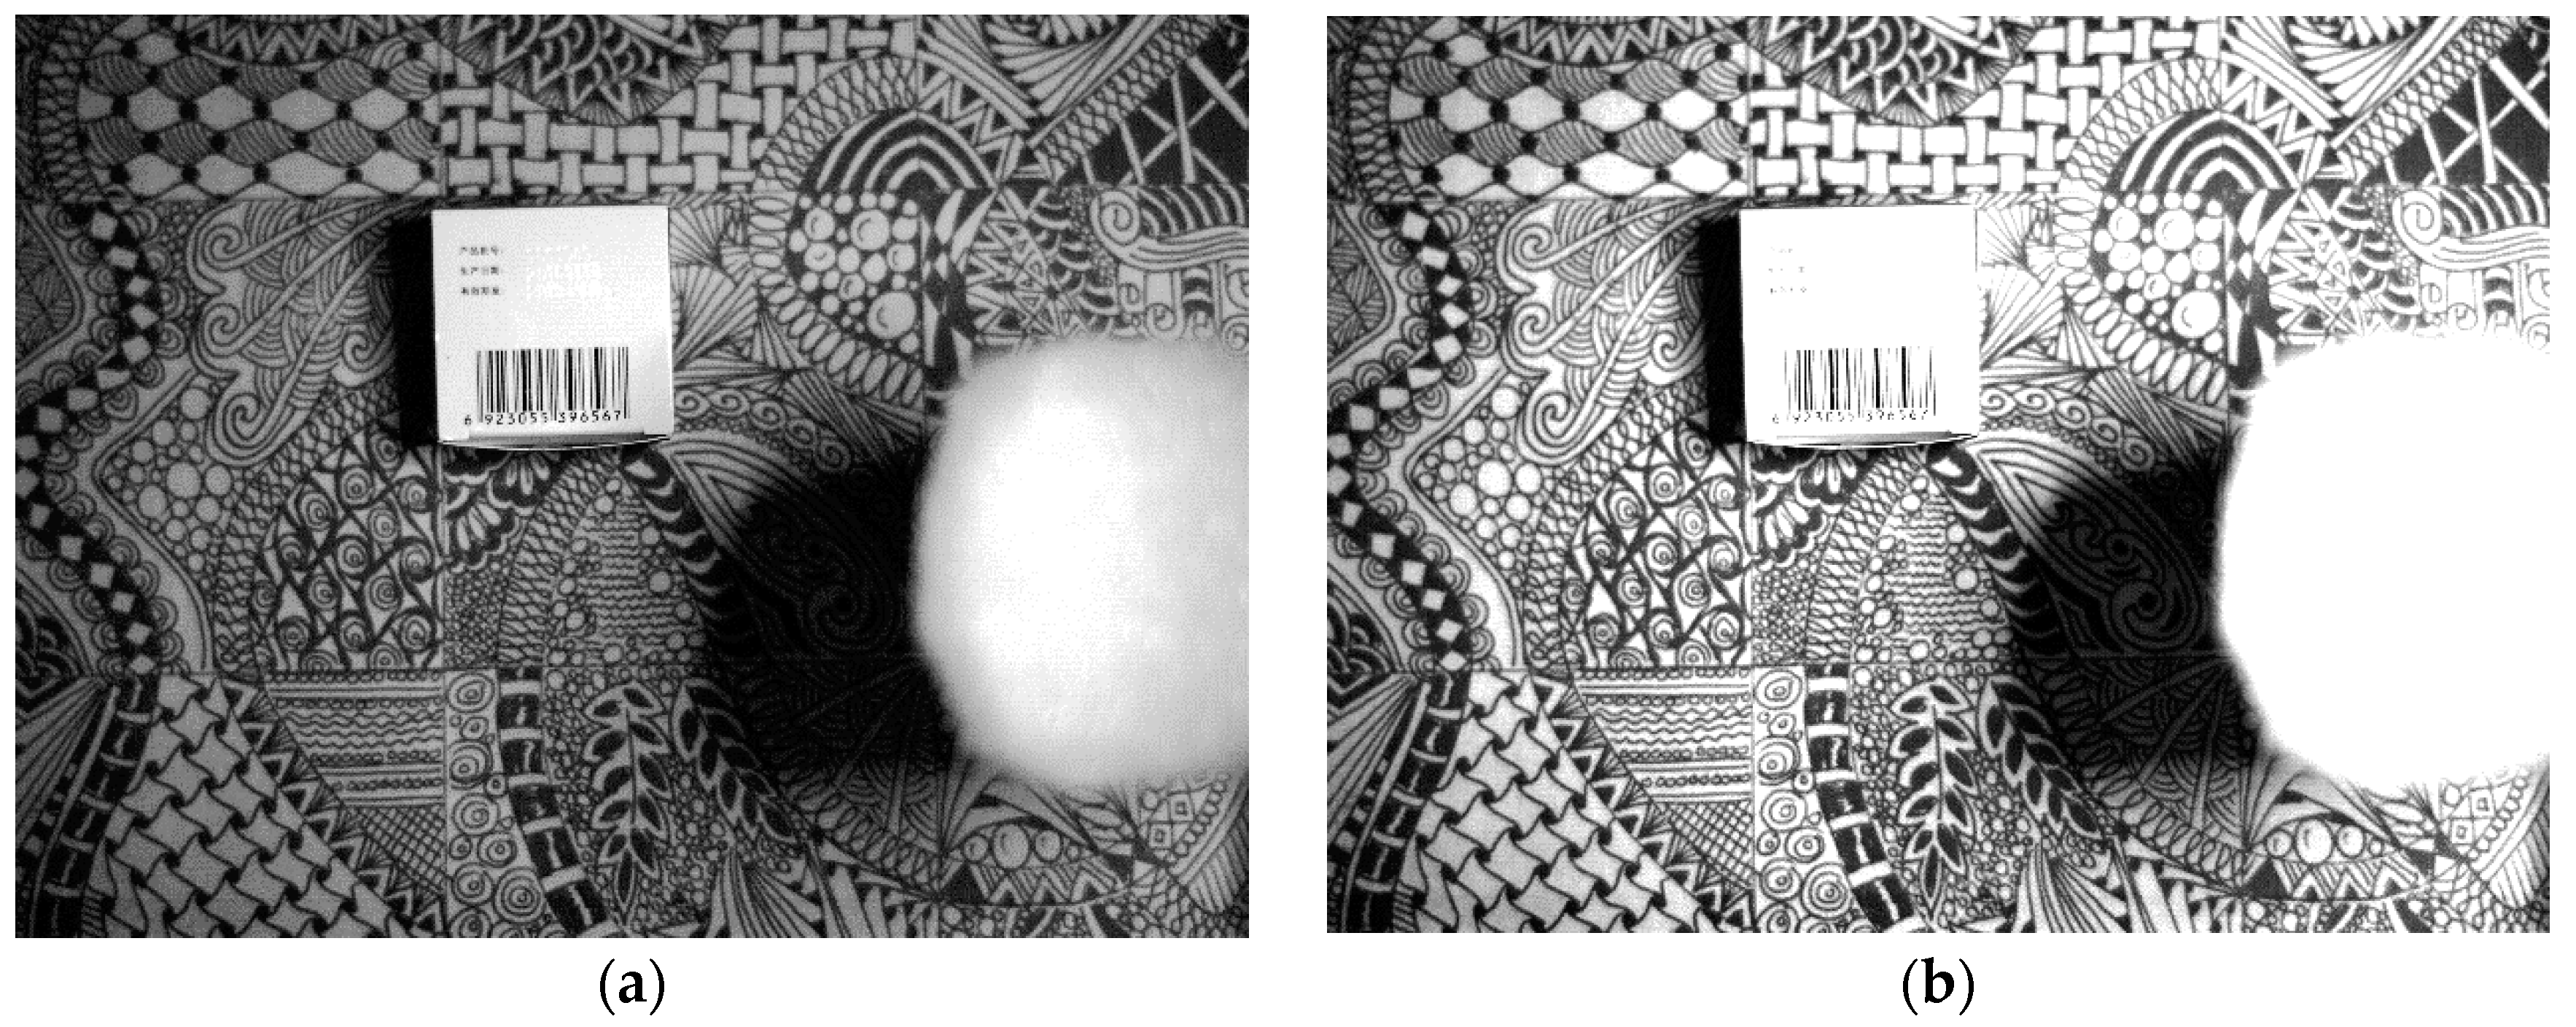
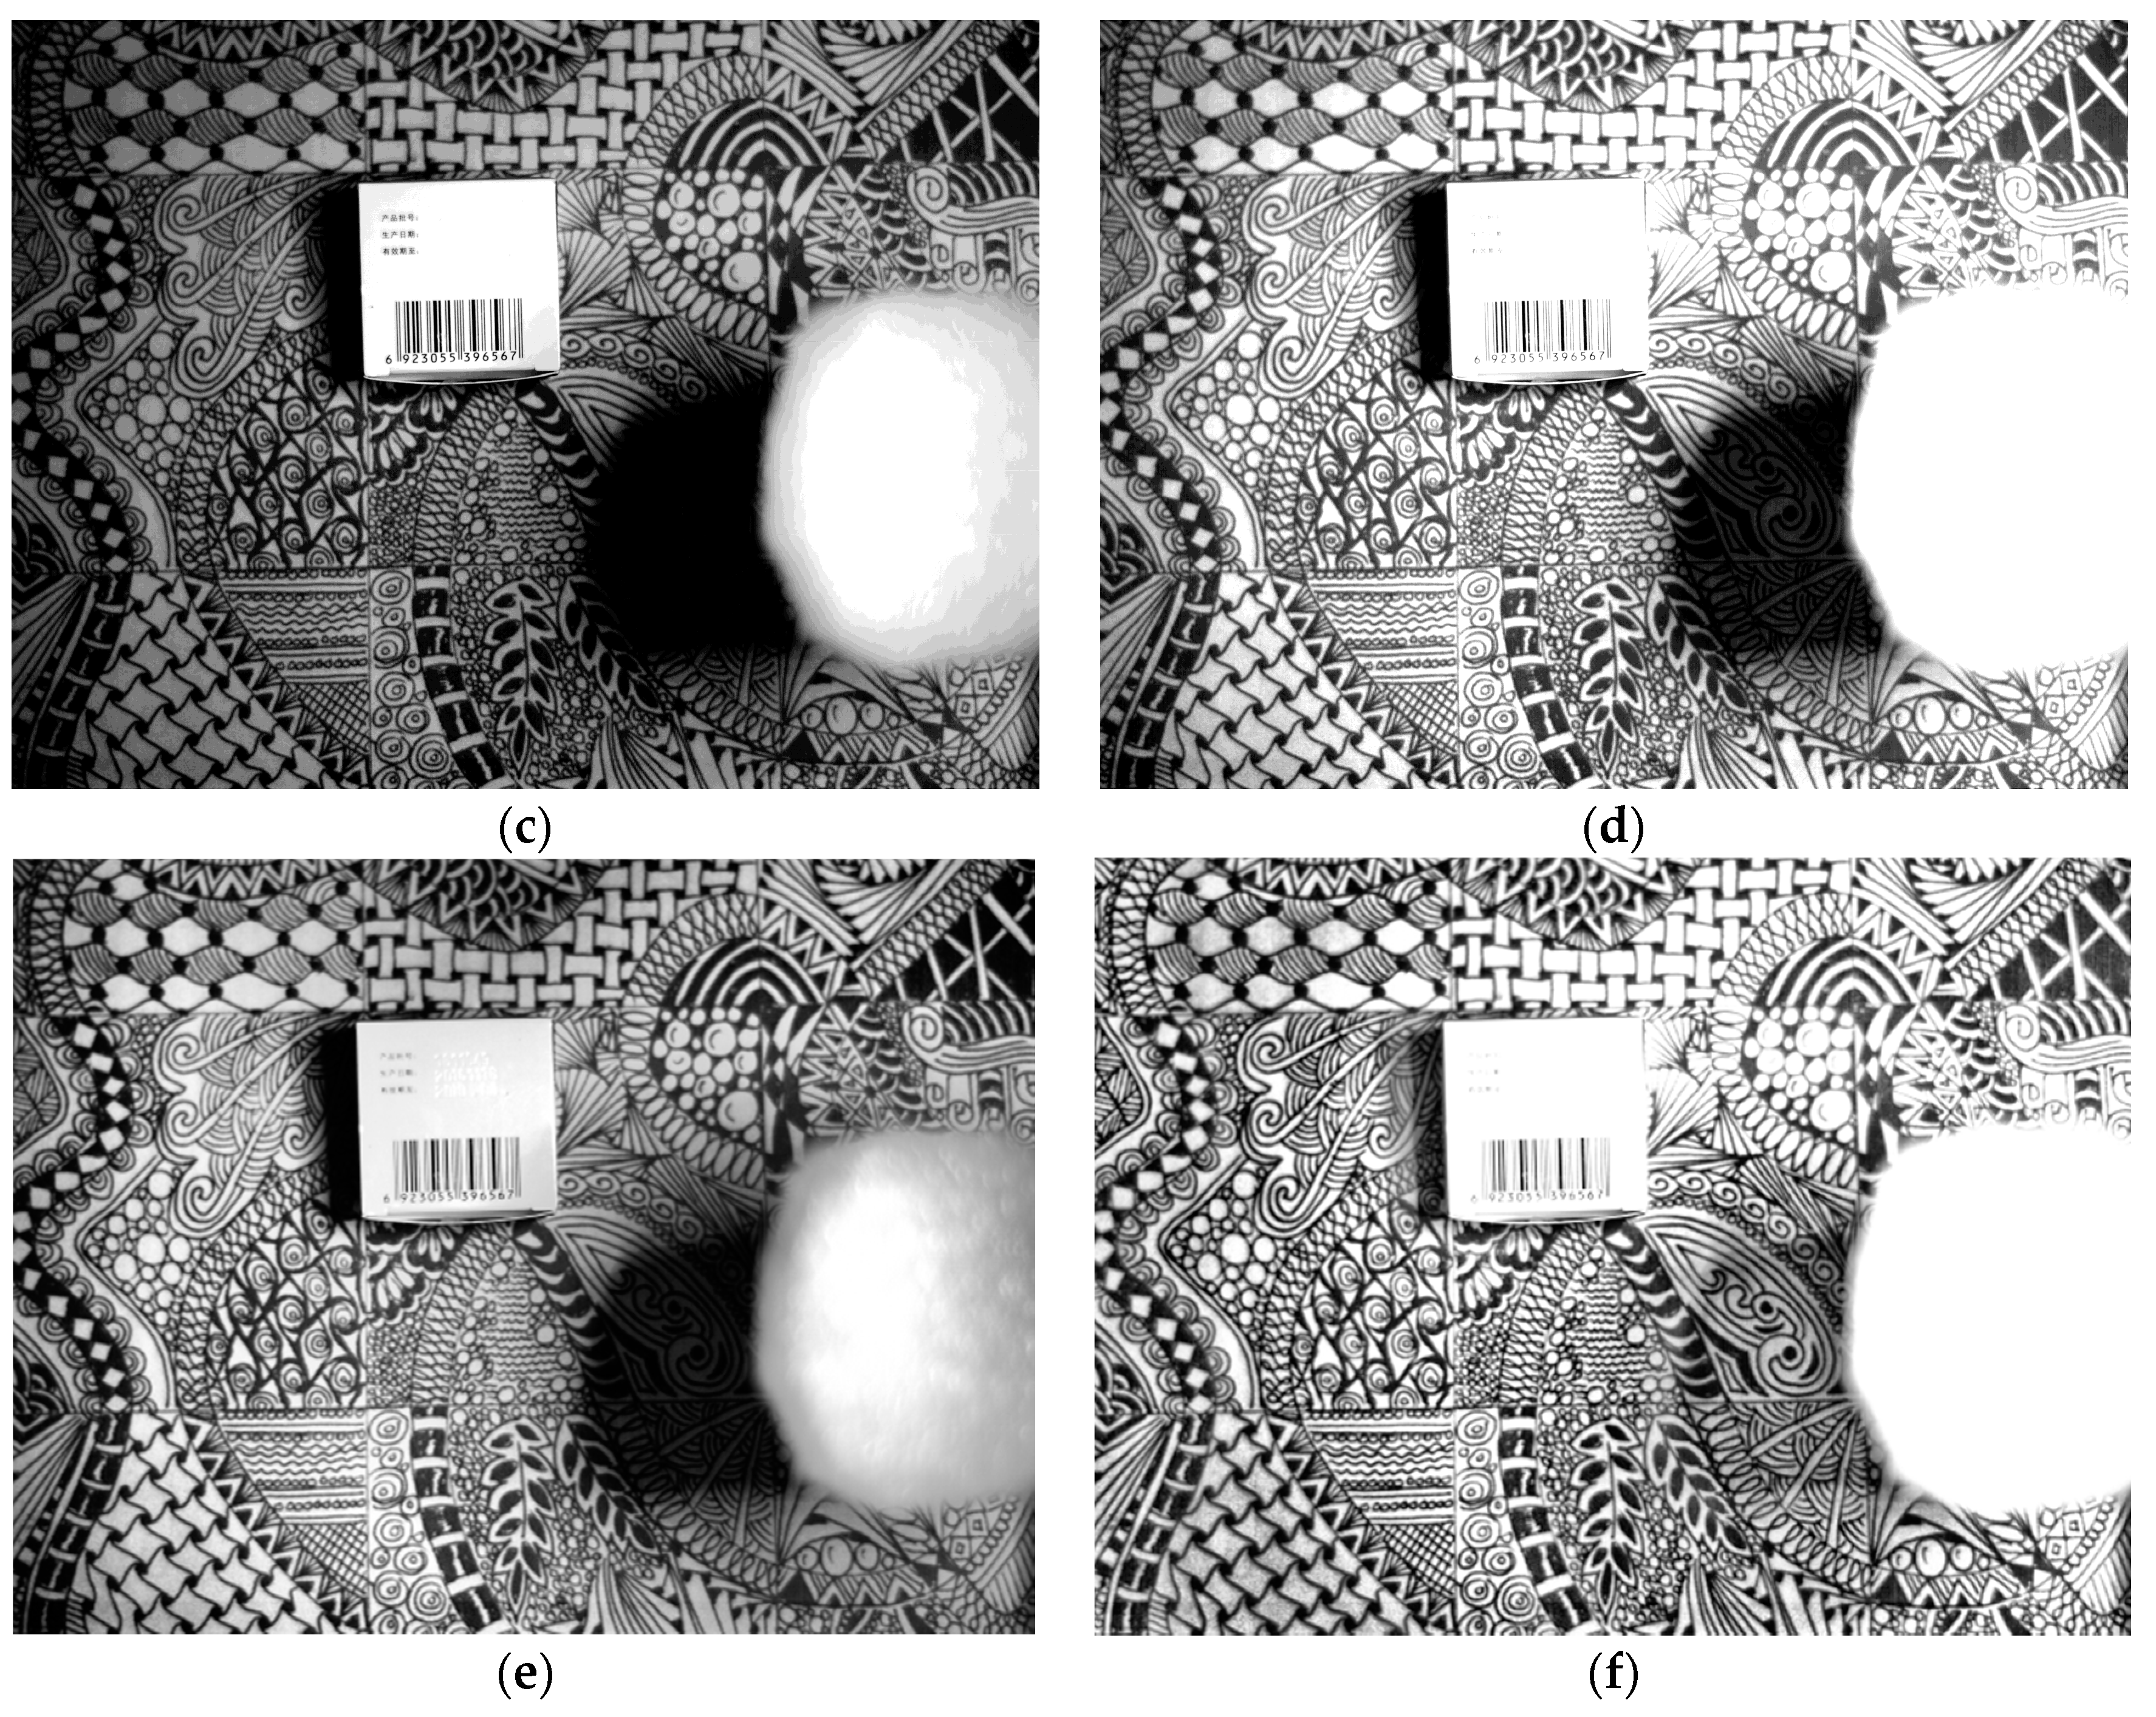
In order to verify the effectiveness of the image fusion method based on gradient pyramid decomposition and entropy weighting, the 5-stage and 13-stage images enhanced by EMAHE are used as source images, and perform the comparison experiment, as shown in
Figure 13. Their entropy and average gradient are figured out as follows: (a) Entropy = 5.46, average gradient = 7.04; (b) Entropy = 5.42, average gradient = 7.55; (c) Entropy = 5.47, average gradient = 7.23; and, (d) Entropy = 5.49, average gradient = 8.45.
It can be seen from the experimental results that the fused image based on gradient pyramid decomposition and entropy weighting has an obvious advantage in terms of entropy and average gradient.
Further, in order to verify the validity and universal applicability of the proposed method, several typical scenes are selected for testing. We collected the digital TDI image sequences of the scenes. Then, we selected two of them which have the largest entropy or the largest average gradient as the source images. Enhanced and fused by the proposed method, the obtained images are shown in
Figure 14. It can be seen that the proposed methods are adapted to different typical scenes, and can present good visual effect.
Moreover, we fuse the original images and their enhanced images by HE/EMAHE with the proposed method. In addition, we fuse the EMAHE enhanced images with Laplace pyramid decomposition and entropy weight. The value of entropy and average gradient of the obtained images is shown in
Table 2.
It can be seen from the table that, for different scenes, the EMAHE enhancement and the proposed fusion algorithm provides the processed images an obvious advantage in terms of entropy and average gradient.


