Article

Shallow Landslide Susceptibility Modeling Using the Data Mining Models Artificial Neural Network and Boosted Tree

1
Department of Geological Hazards, Korea Institute of Geoscience and Mineral Resources (KIGAM), 124, Gwahang-ro, Yuseong-gu, Daejeon 34132, Korea
2
Geological Research Division, Korea Institute of Geoscience and Mineral Resources (KIGAM), 124, Gwahak-ro, Yuseong-gu, Daejeon 34132, Korea
3
Korea University of Science and Technology, 217 Gajeong-ro Yuseong-gu, Daejeon 305-350, Korea
*
Author to whom correspondence should be addressed.
Appl. Sci. 2017, 7(10), 1000; https://doi.org/10.3390/app7101000
Submission received: 18 July 2017 / Revised: 14 September 2017 / Accepted: 21 September 2017 / Published: 28 September 2017
(This article belongs to the Special Issue Application of Artificial Neural Networks in Geoinformatics)

Abstract

:
The main purpose of this paper is to present some potential applications of sophisticated data mining techniques, such as artificial neural network (ANN) and boosted tree (BT), for landslide susceptibility modeling in the Yongin area, Korea. Initially, landslide inventory was detected from visual interpretation using digital aerial photographic maps with a high resolution of 50 cm taken before and after the occurrence of landslides. The debris flows were randomly divided into two groups: training and validation sets with a 50:50 proportion. Additionally, 18 environmental factors related to landslide occurrence were derived from the topography, soil, and forest maps. Subsequently, the data mining techniques were applied to identify the influence of environmental factors on landslide occurrence of the training set and assess landslide susceptibility. Finally, the landslide susceptibility indexes from ANN and BT were compared with a validation set using a receiver operating characteristics curve. The slope gradient, topographic wetness index, and timber age appear to be important factors in landslide occurrence from both models. The validation result of ANN and BT showed 82.25% and 90.79%, which had reasonably good performance. The study shows the benefit of selecting optimal data mining techniques in landslide susceptibility modeling. This approach could be used as a guideline for choosing environmental factors on landslide occurrence and add influencing factors into landslide monitoring systems. Furthermore, this method can rank landslide susceptibility in urban areas, thus providing helpful information when selecting a landslide monitoring site and planning land-use.

Graphical Abstract

1. Introduction

The mountainous area of Korea covers approximately 70% of the total land. Areas with landslide susceptibility in Korea have been reported in the steep slopes of mountainous areas consisting of granite or gneiss [1]. These conditions, in addition to low strengths of weathered soil and unstable slopes, are considered vulnerable to particularly shallow landslides when intense rainfall occurs during the summer rainy season. There is a tendency that suggests that the risk of landslides is increasing due to frequent localized heavy rain in Korea resulting from recent climate change [1,2]. In addition, earlier landslides that developed in the upper mountainous areas extend to debris flows in the valley area, and affect property damage and loss of human life in living areas which are developing and expanding [3]. Therefore, landslides are viewed as hazards for human life and artificial structures in Korea.
The damage caused by landslides is the same worldwide. To minimize the damage to people and property due to landslides, many efforts over the past few decades have been made to understand how to control landslides and predict their spatial and temporal distribution [4,5,6,7,8,9,10,11,12,13]. Most approaches have been applied on the Geographic Information System (GIS)-based landslide susceptibility assessment representing predicted landslide risks. The classification of these approaches (e.g., heuristic, statistical, probability, and deterministic approaches) are well documented in van Westen et al., 2006.
In particular, statistical and probability application models have been widely applied by several studies to predict landslide susceptibility using a past landslide inventory and their environmental factors. The models include frequency ratio [14,15], weight of evidence [16], logistic regression [17], and fuzzy logic [18]. Recently, data mining techniques have been developed and are extremely popular [19,20] when dealing with a variety of nonlinear issues. Techniques applied in landslide susceptibility modeling include: artificial neural network, decision tree, boosted tree, neuro fuzzy, Bayesian network, support vector machine, and random forest [21,22,23,24,25,26,27,28,29,30].
When using these approaches to predict landslide-susceptible areas, it is assumed that past landslide occurrence conditions are similar to the conditions for future landslide occurrence [12]. Therefore, it is necessary to train and explore the relationship between past landslide locations and environmental factors (e.g., topographic, hydrologic, soil, and forest data) when using these approaches to predict landslide-vulnerable areas. To do so, it is important to prepare accurate landslide maps and to select environmental variables that affect landslide occurrence to apply to models [31].
Although several different models have been compared in previous studies [22,26], this study analyzed landslide susceptibility based on artificial neural networks (ANN) and boosted tree (BT) models that have not been applied simultaneously in other studies. Furthermore, as various topographic and hydrologic factors have been calculated from a digital elevation model (DEM) using a System for Automated Geoscientific Analyses (SAGA) GIS Module, and landslide occurrences have accurately been detected from digital aerial photos, the contribution of these factors were evaluated from these models. Therefore, this research aimed to: (i) investigate and compare the performance of data mining-based ANN and BT models, (ii) prepare accurate landslide maps using digital aerial photographs with high resolution, and (iii) determine the contribution of the environmental factors.
The preparation of the landslide susceptibility model was accomplished in three major steps.
(1)
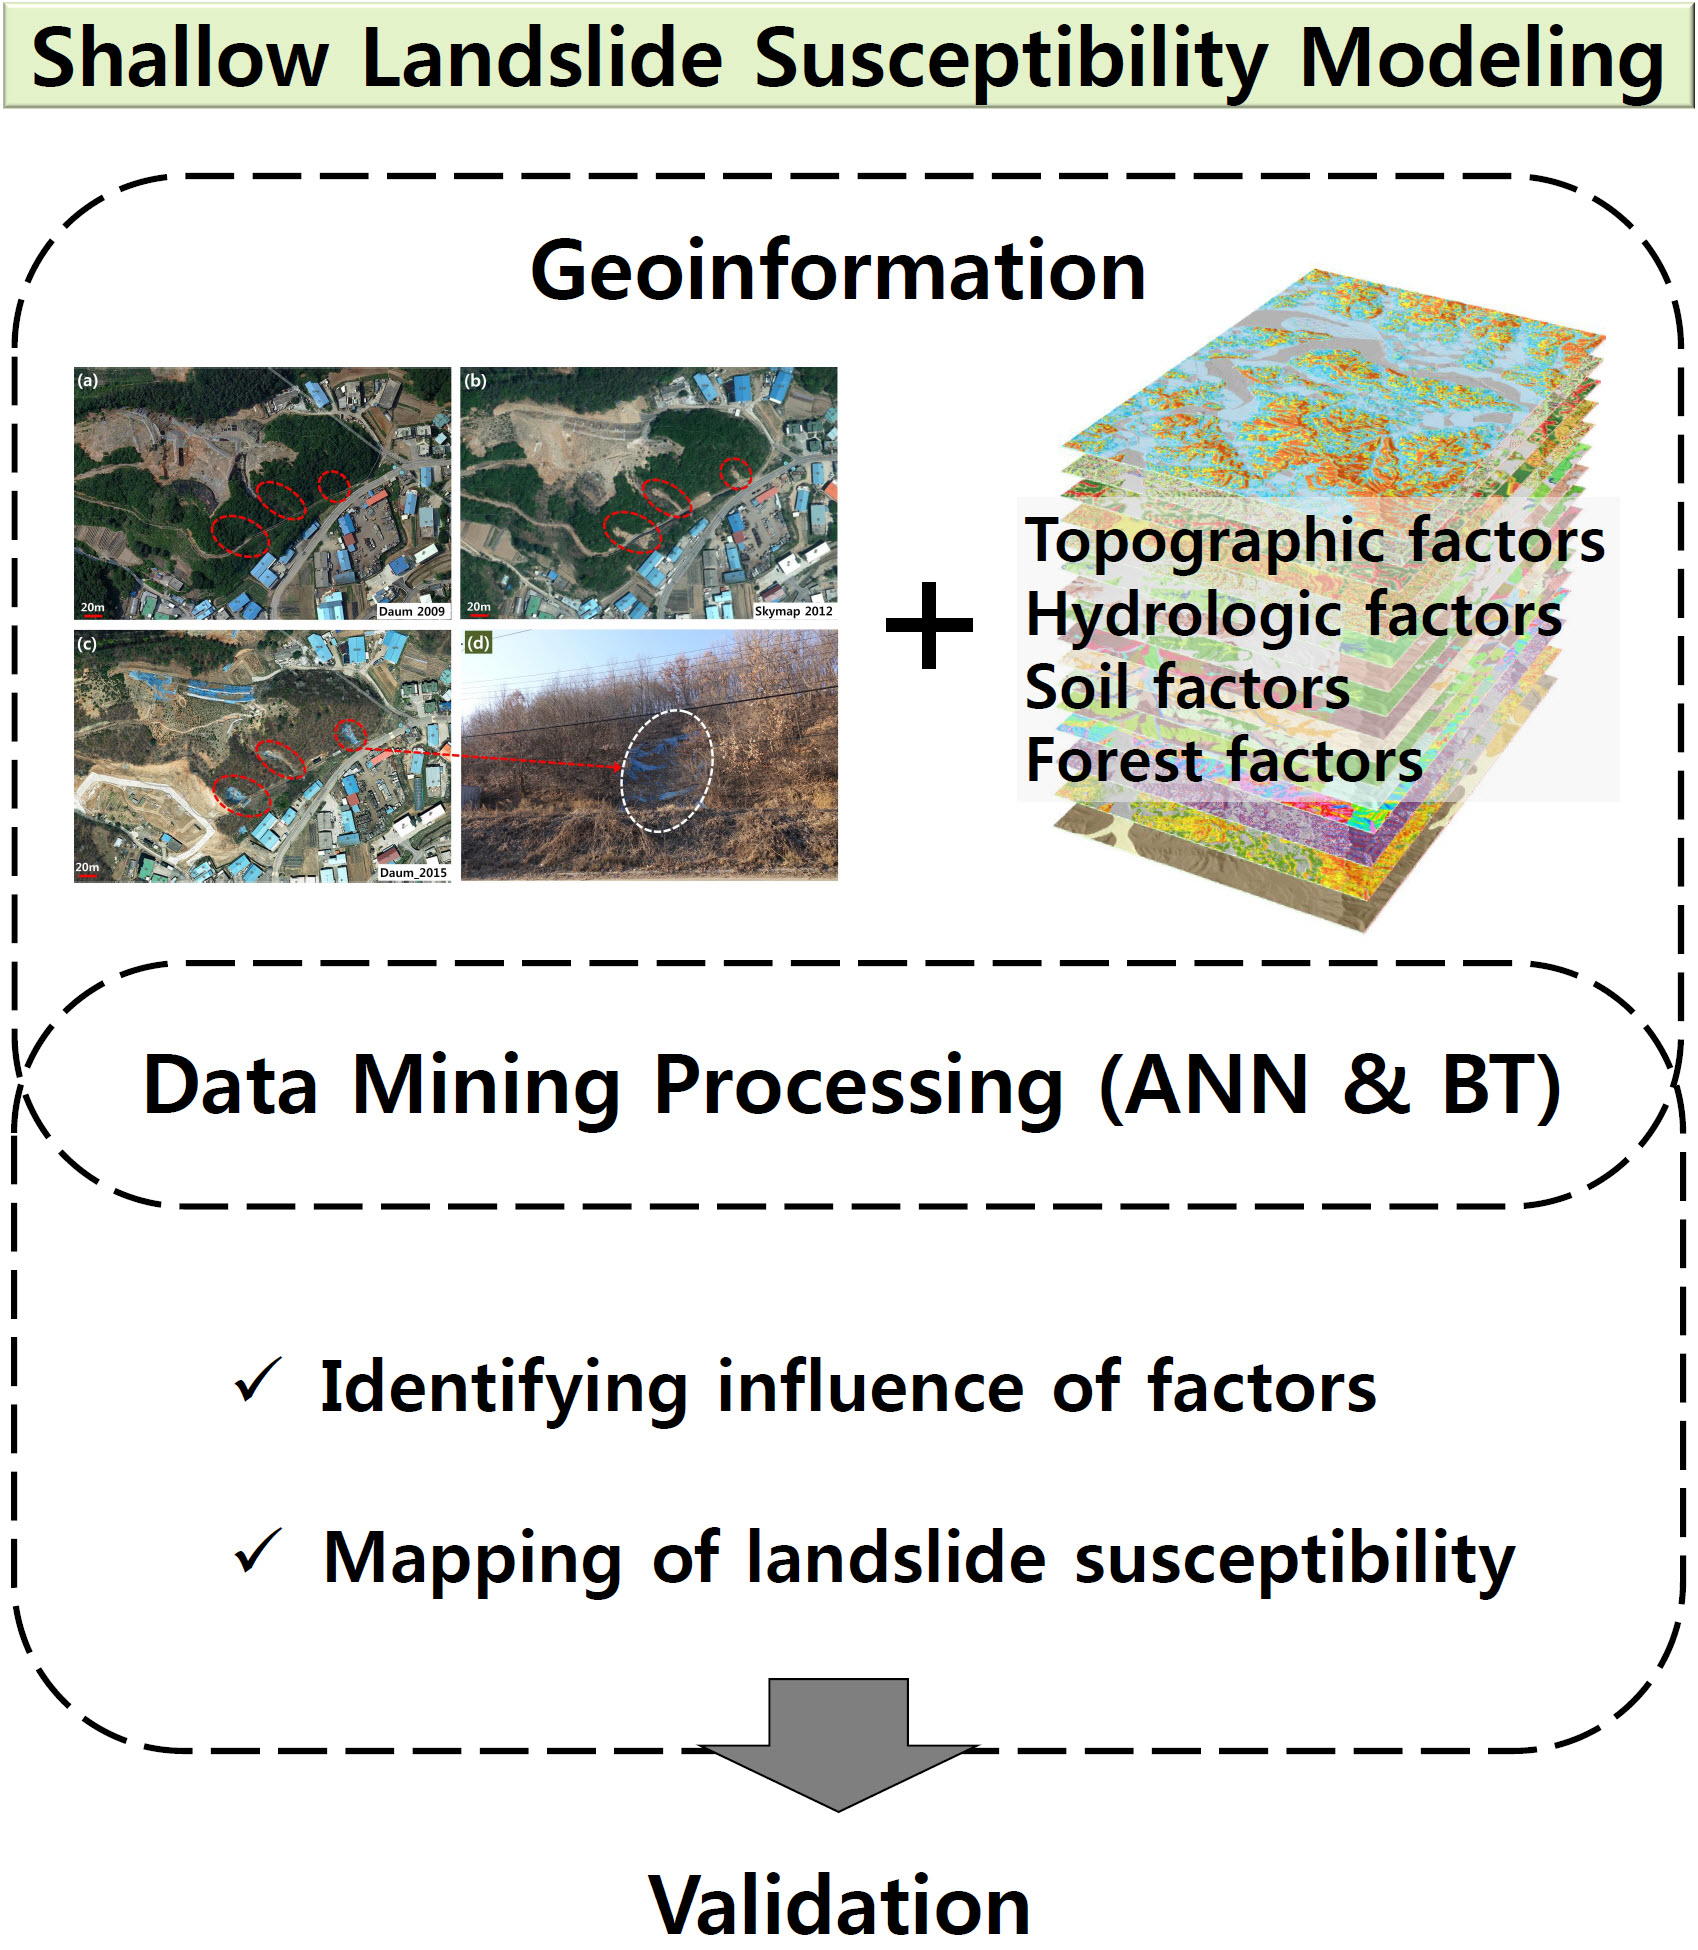
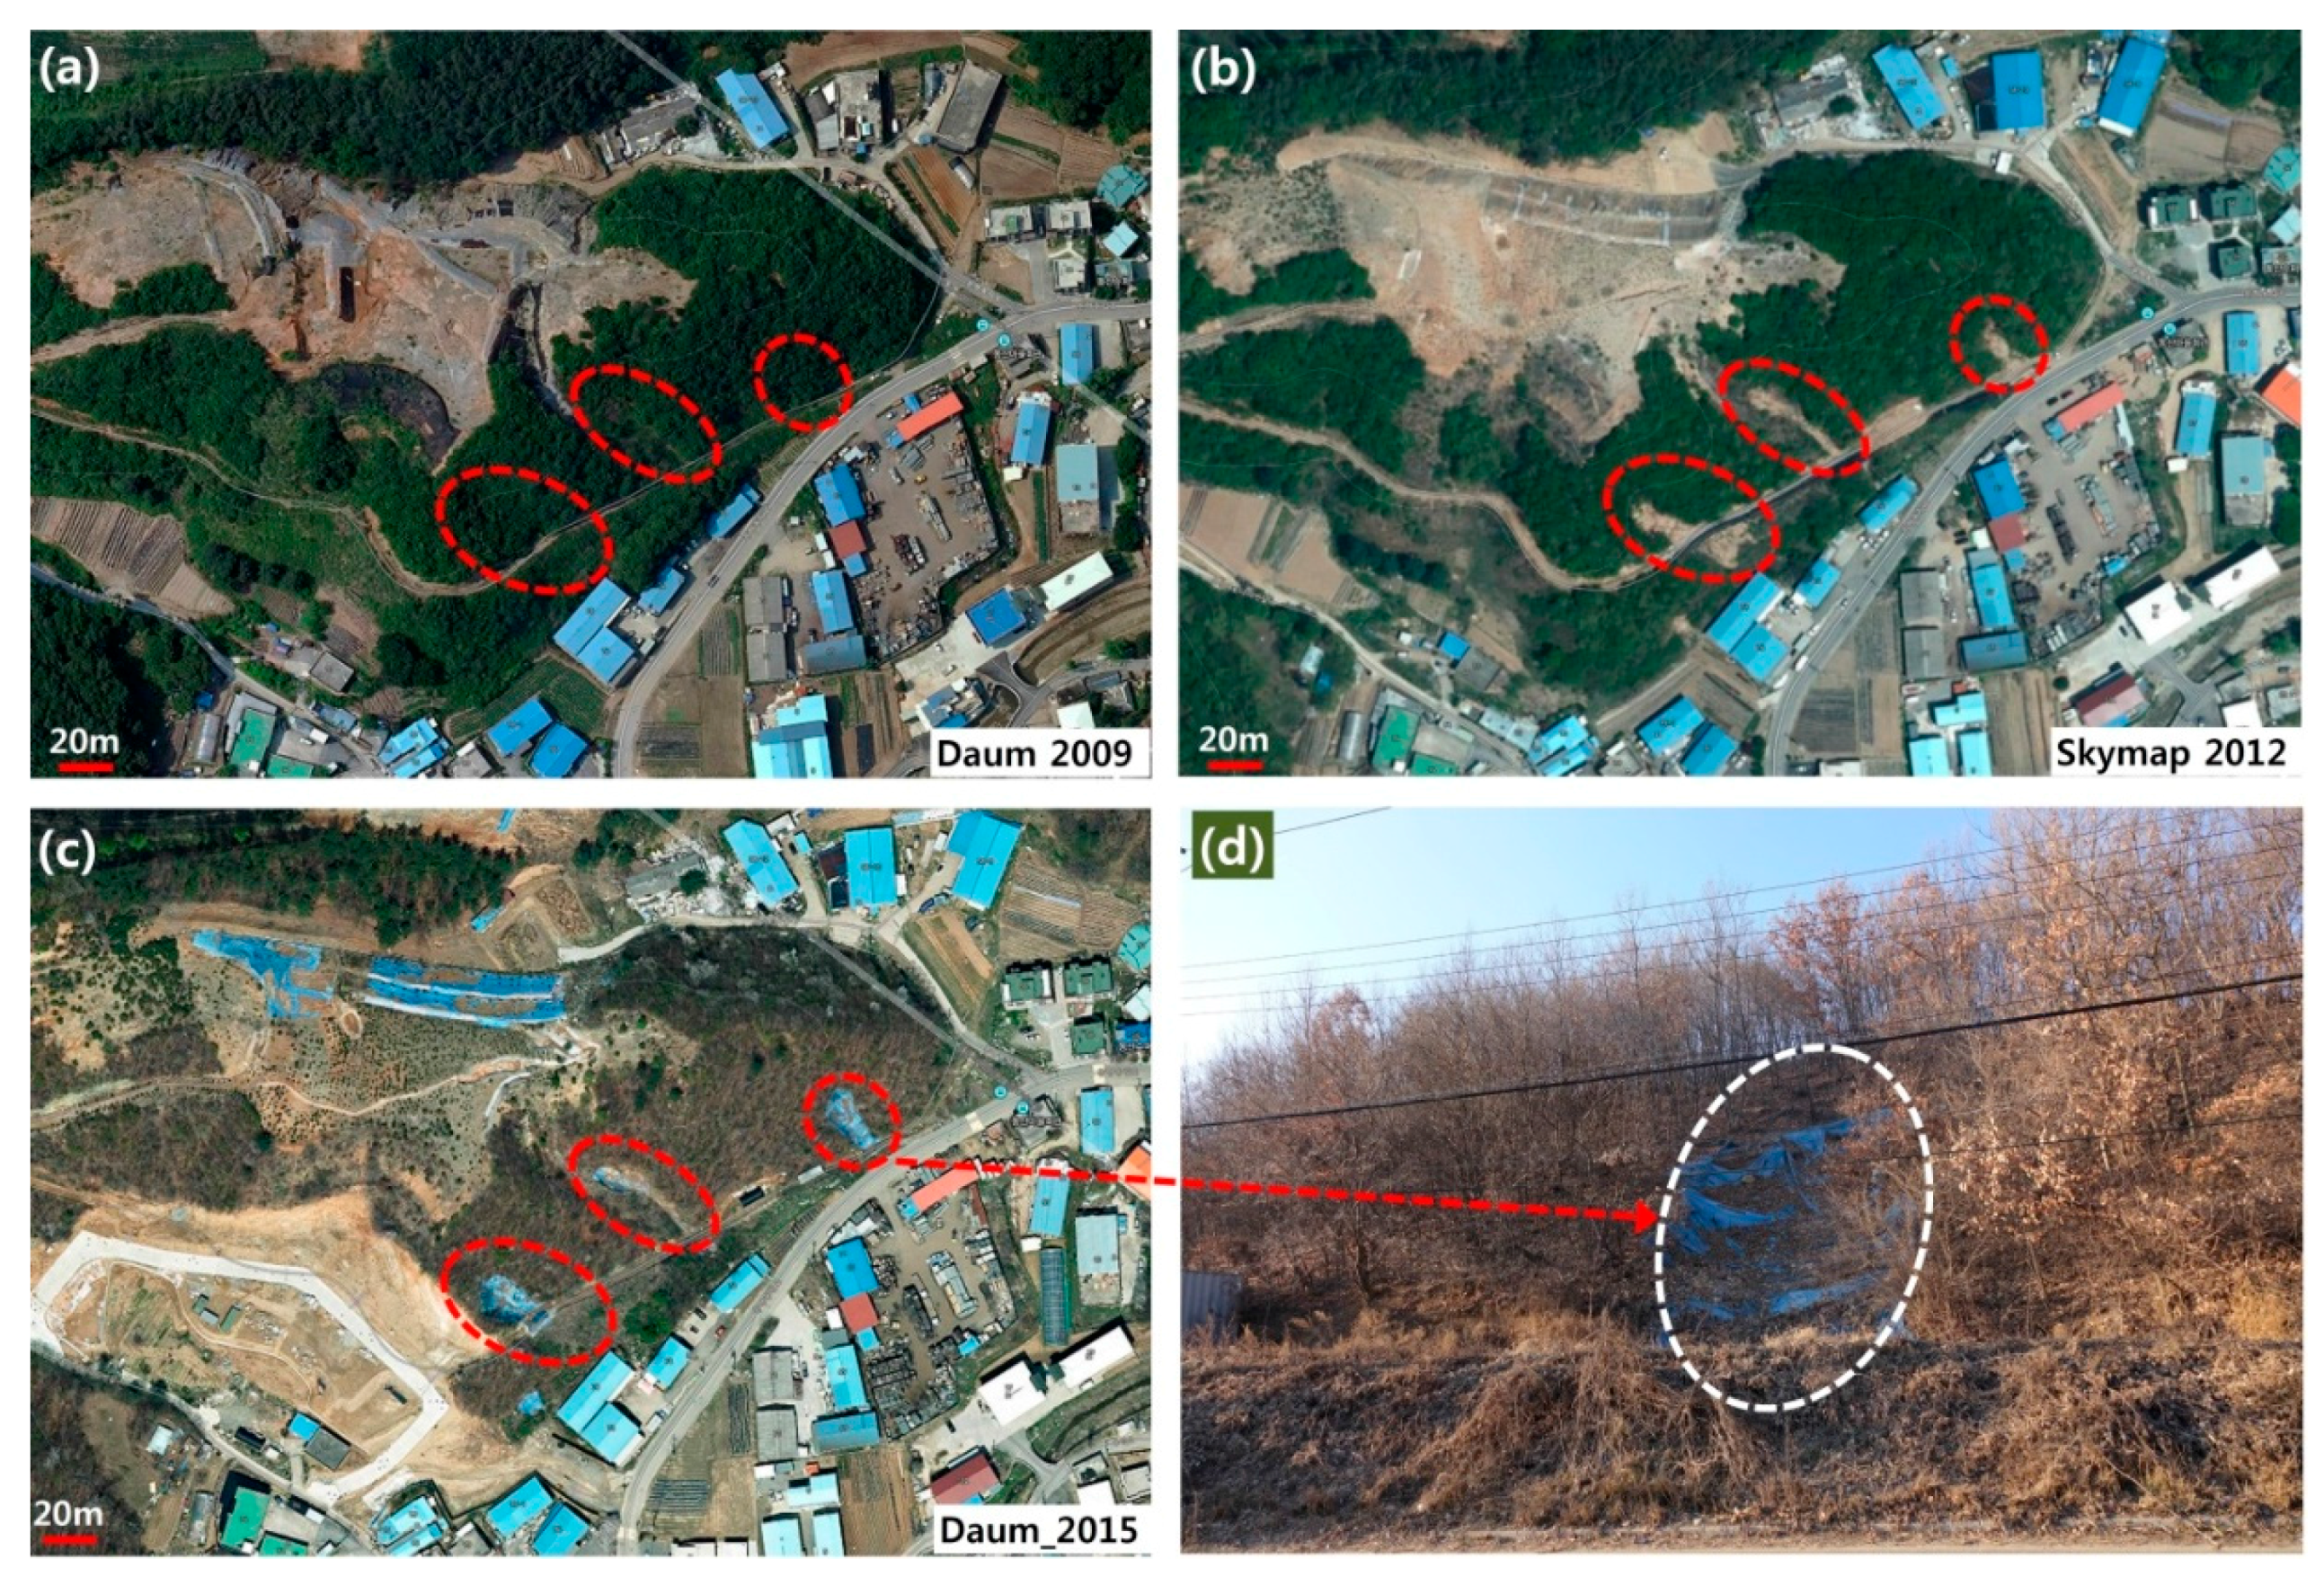
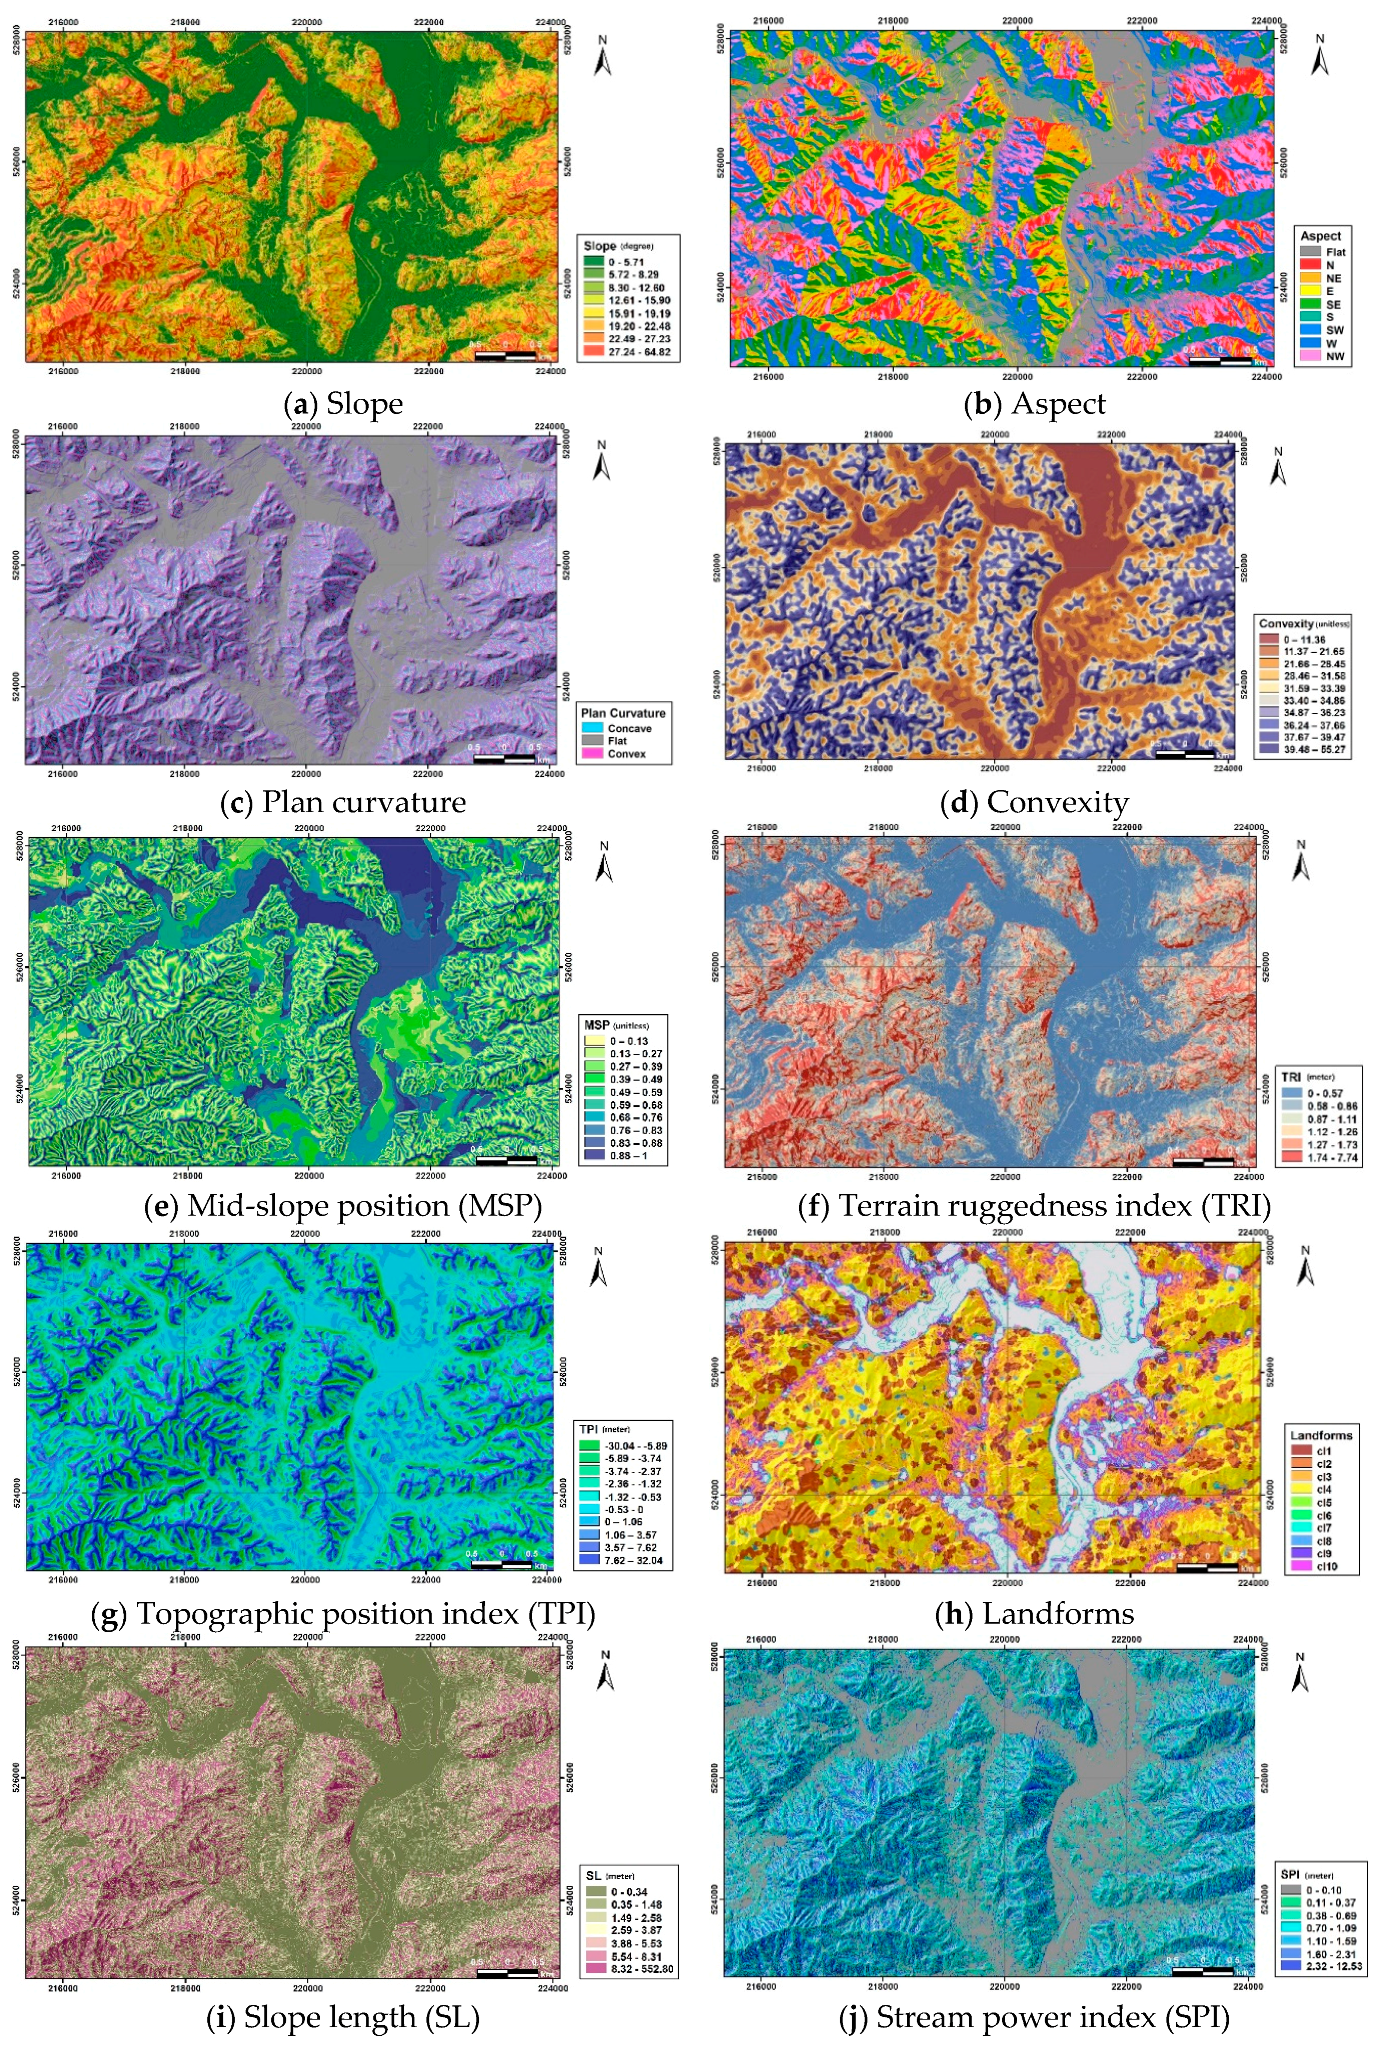
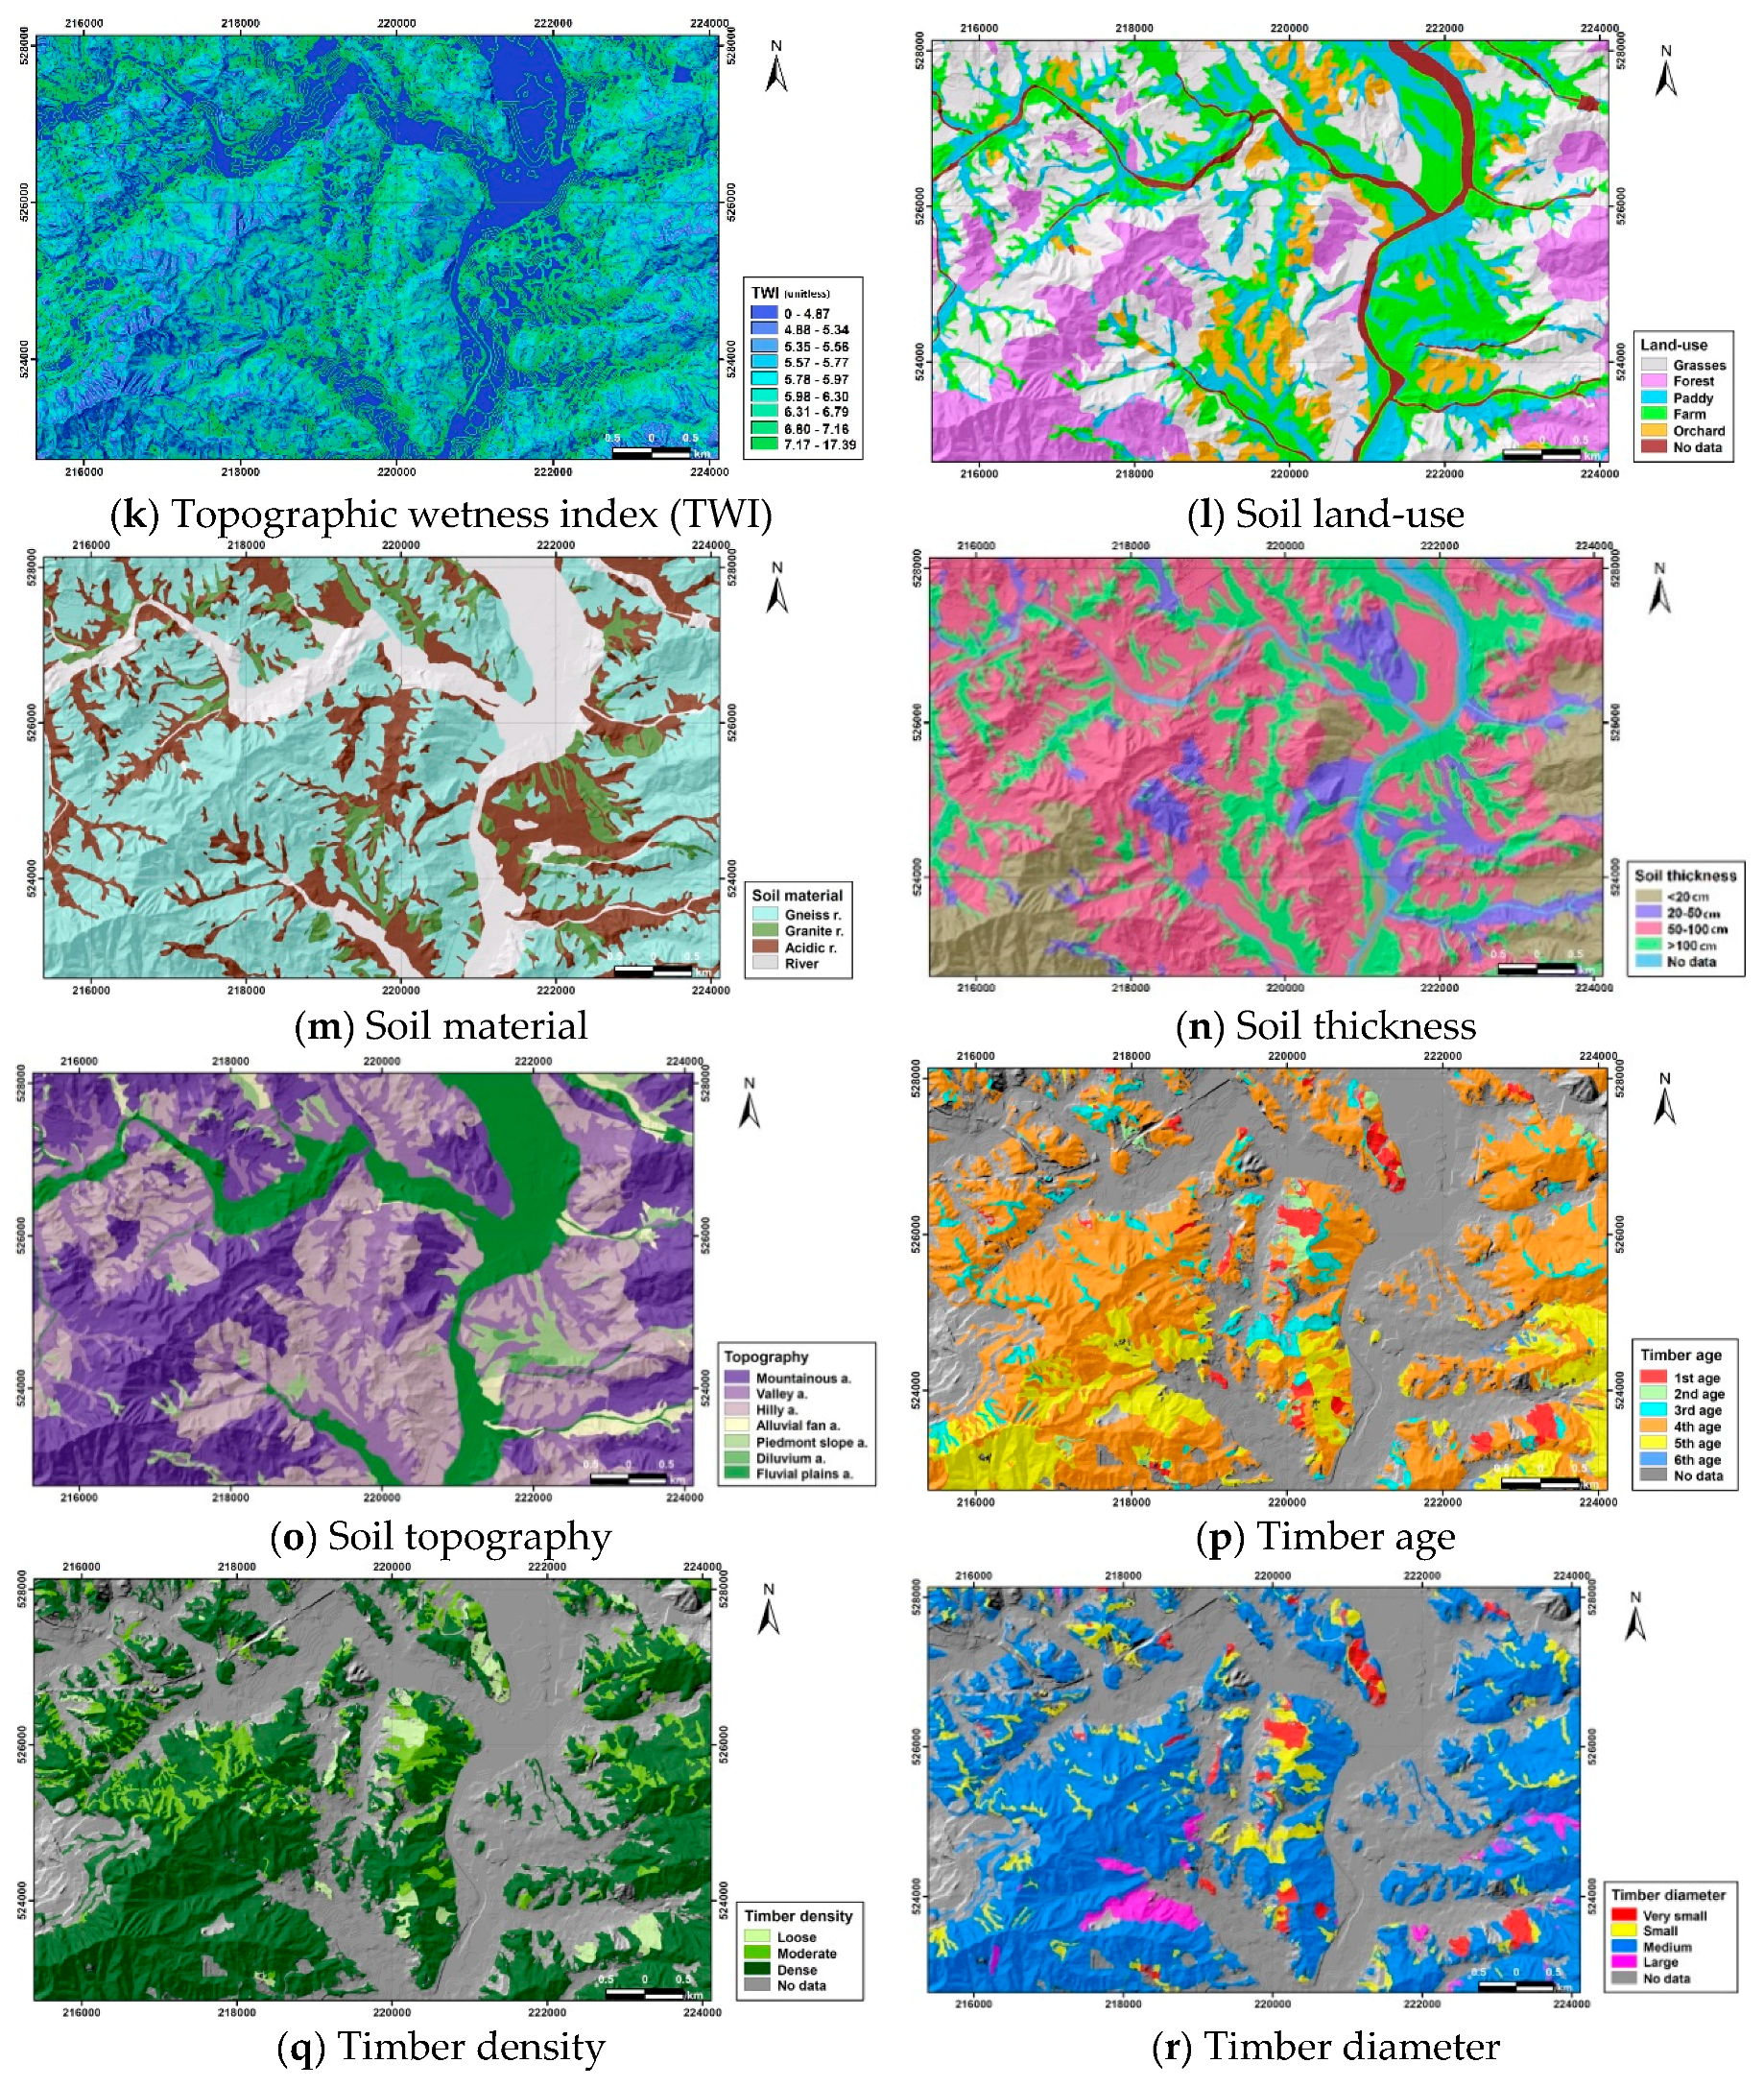
Compilation of a spatial database. A total of 82 debris flows were detected by visual interpretation of aerial photographs with a 50 cm resolution before and after landslide events. The environmental factors were constructed into a spatial database including eight topographic factors: slope gradient, aspect, plan curvature, convexity, mid-slope position (MSP), terrain ruggedness index (TRI), topographic position index (TPI), and landforms; three hydrologic factors: slope length (SL), stream power index (SPI), and topographic wetness index (TWI); four soil factors: land-use, material, thickness, and topography; and three timber factors: age, density, and diameter.
(2)
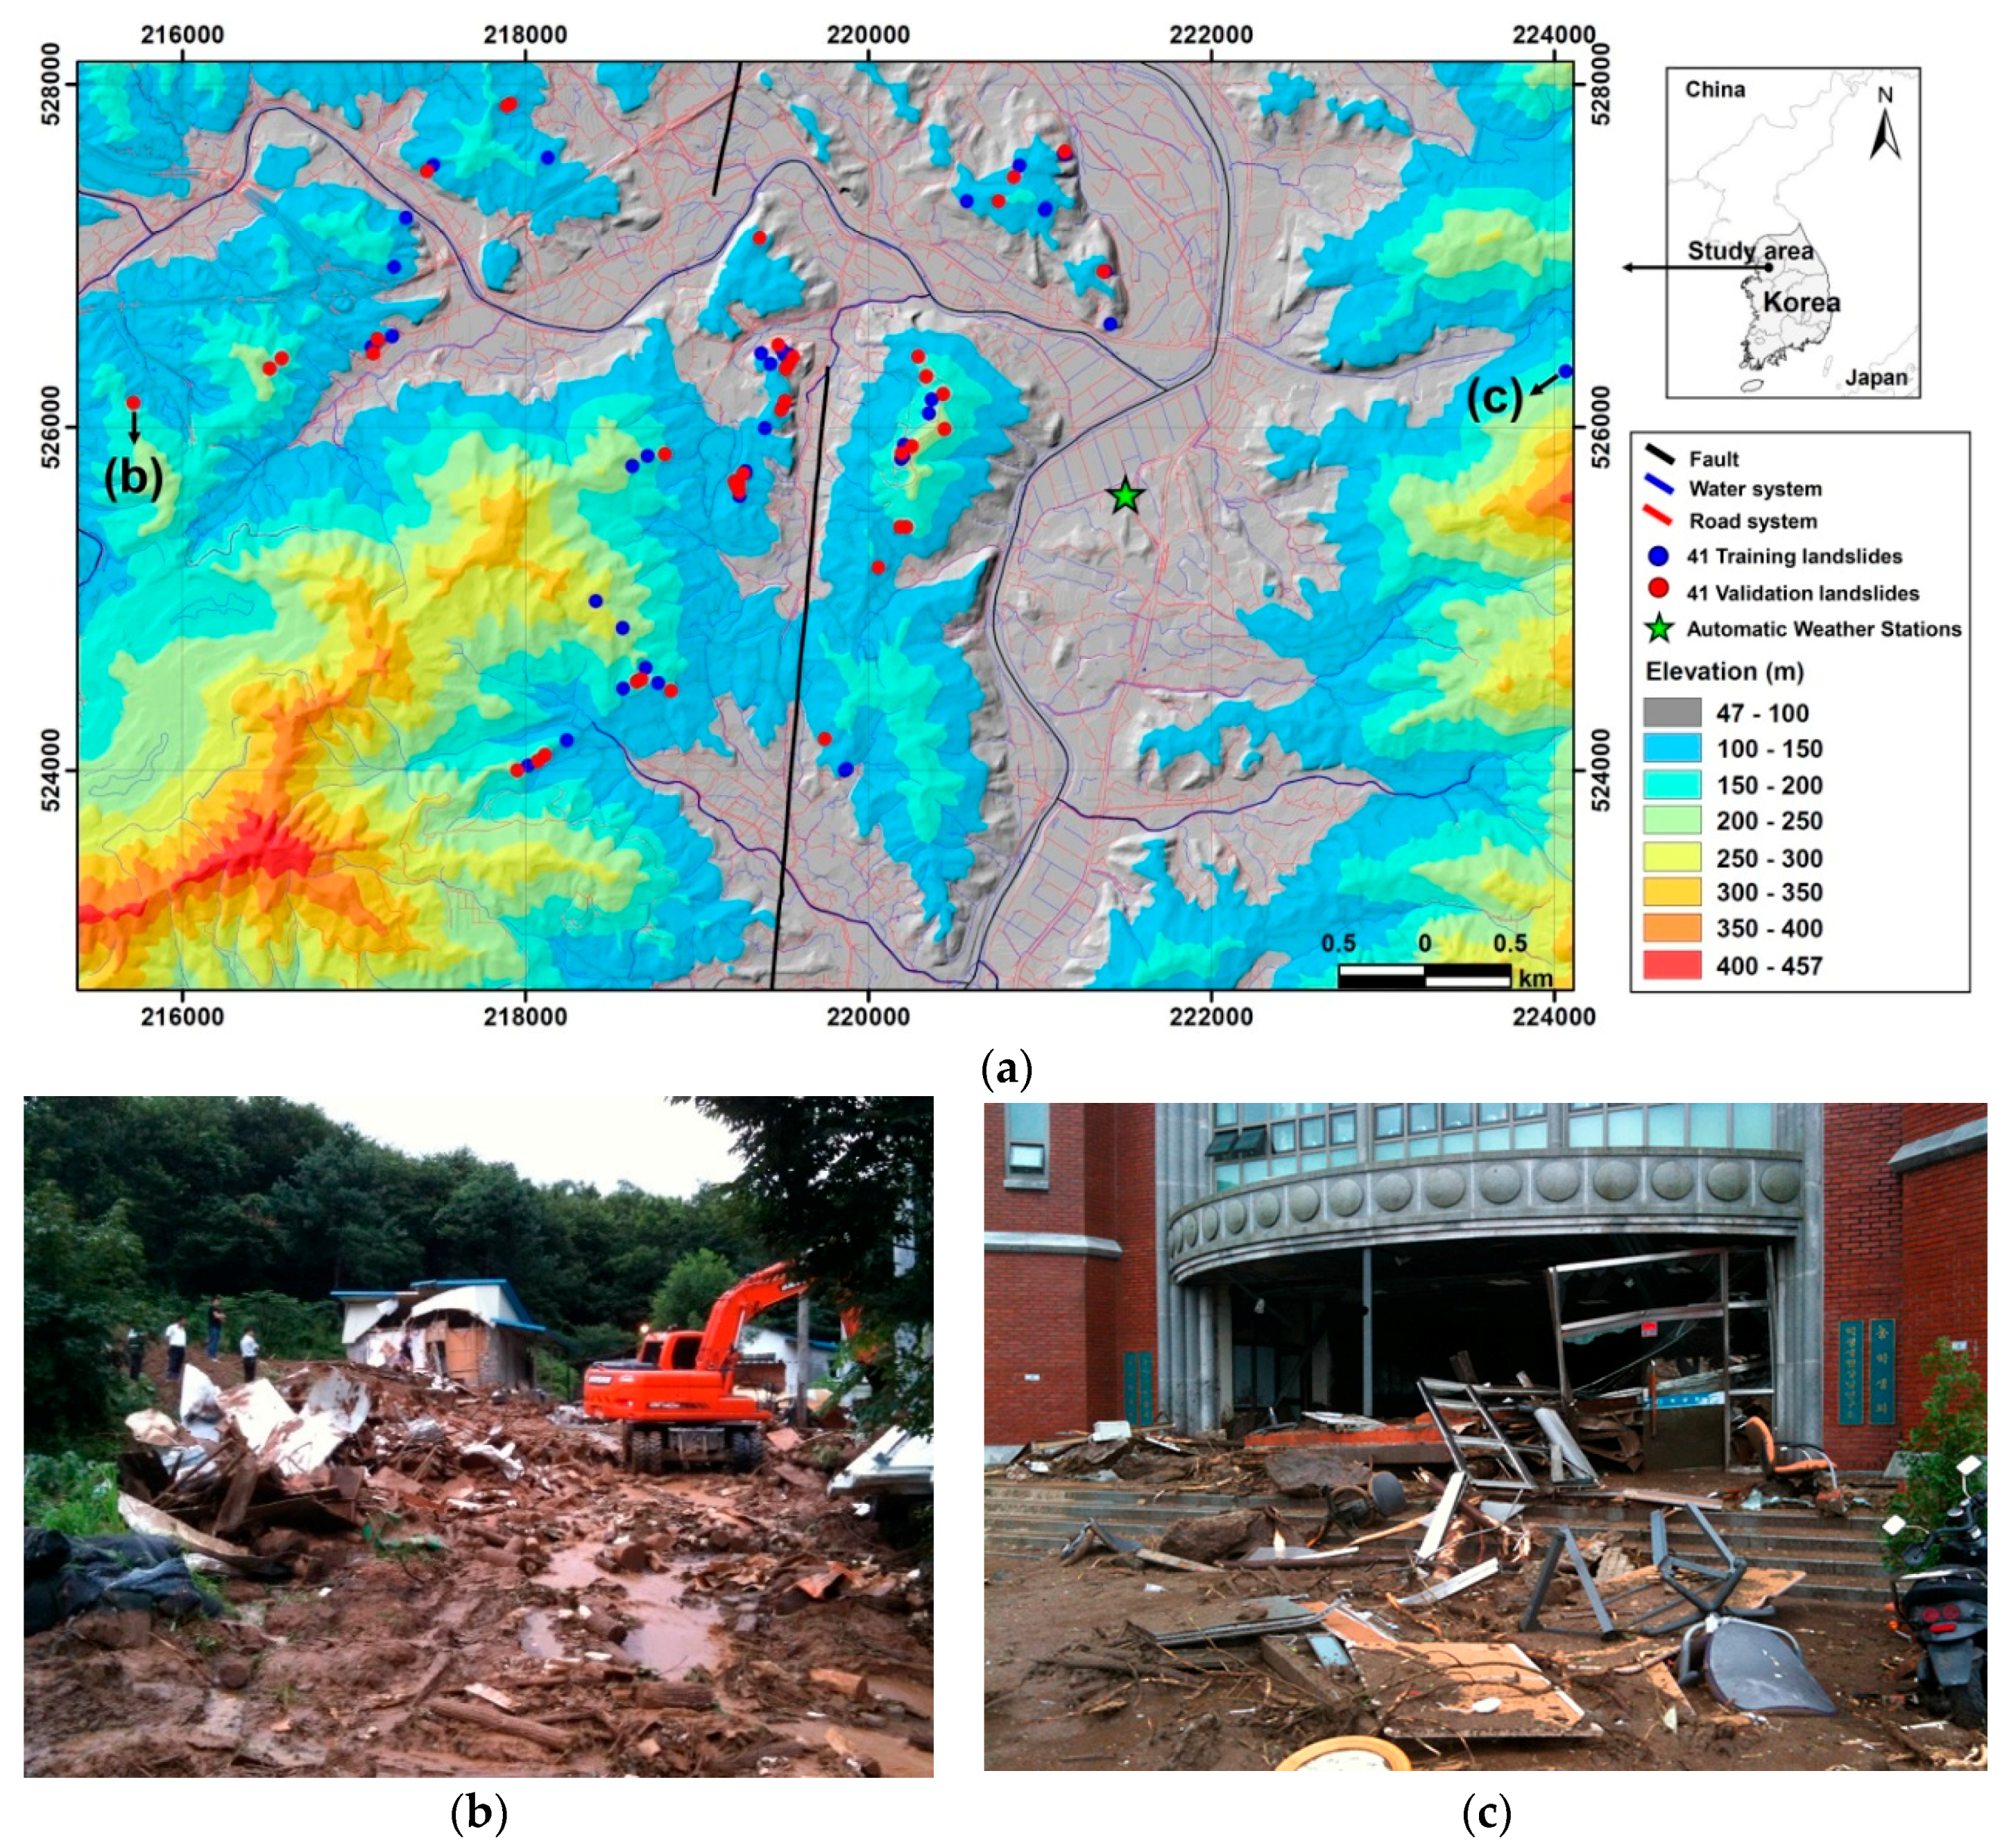
Processing the data from the database. The number of debris flows were randomly divided into training (50%) and validation (50%) data for landslide susceptibility analysis using ANN and BT models.
(3)
The influence of environmental factors on landslide occurrences as the training set was calculated as the weight of the factor using both models.
(4)
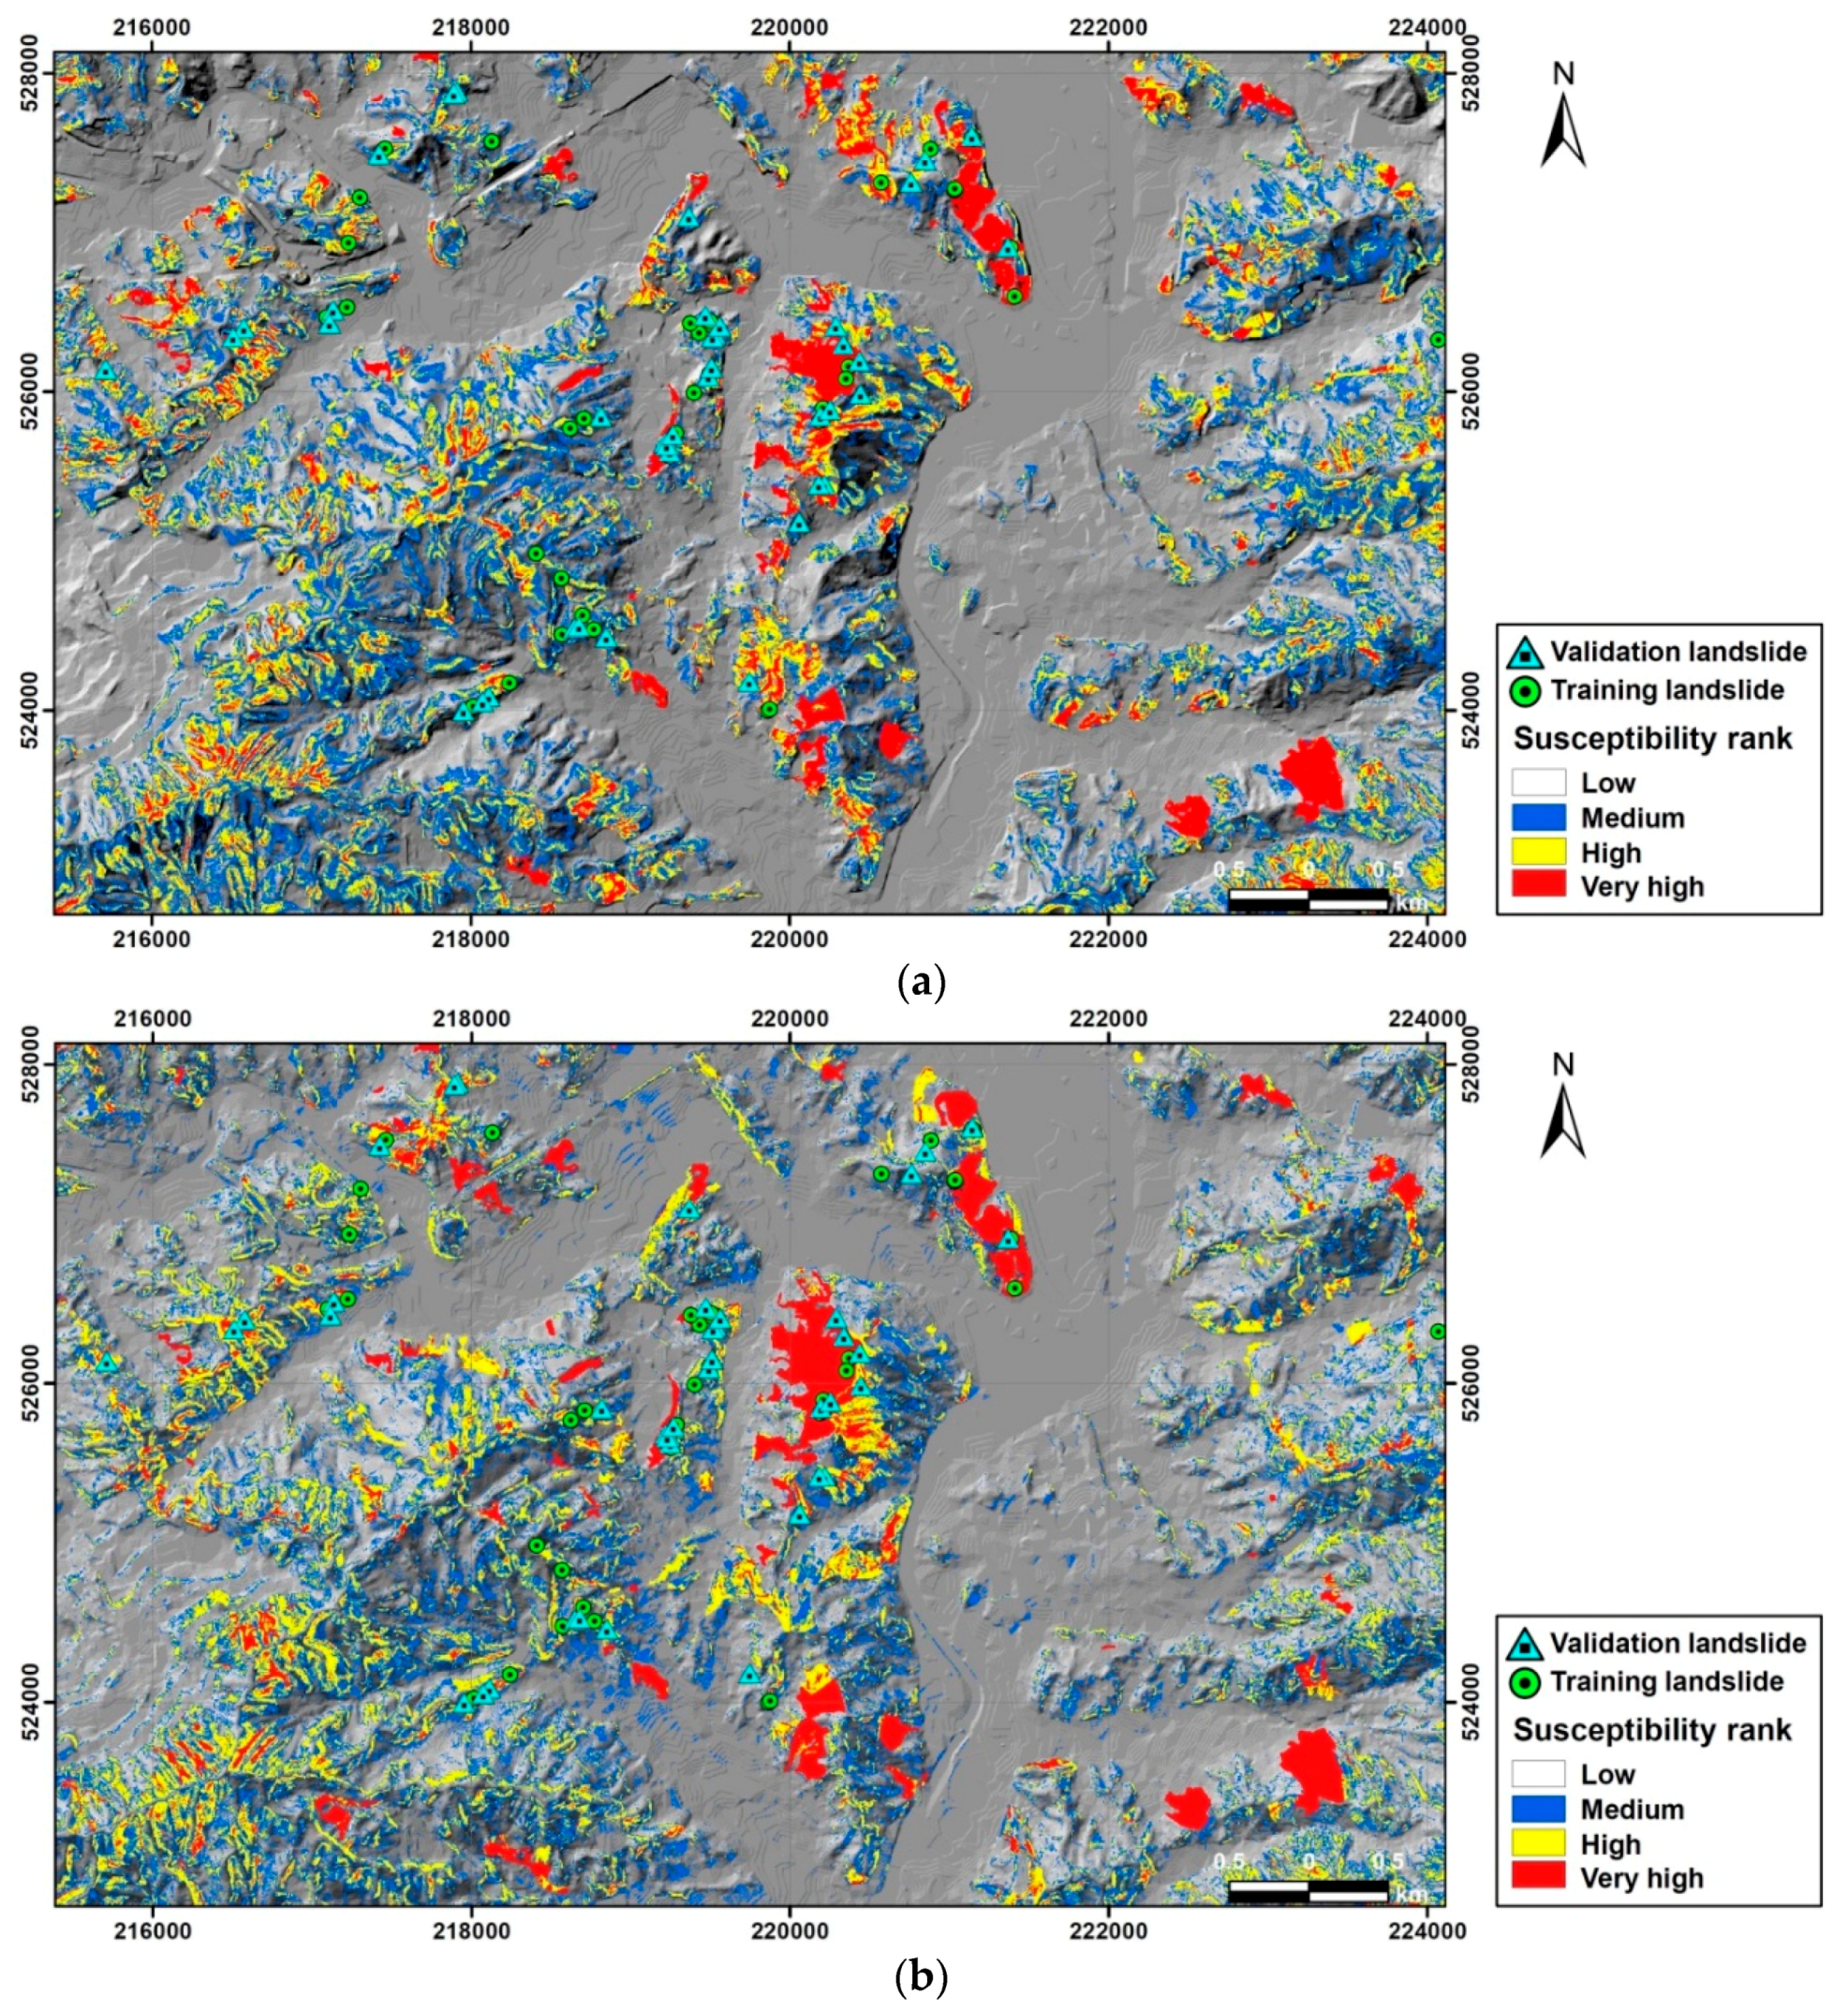
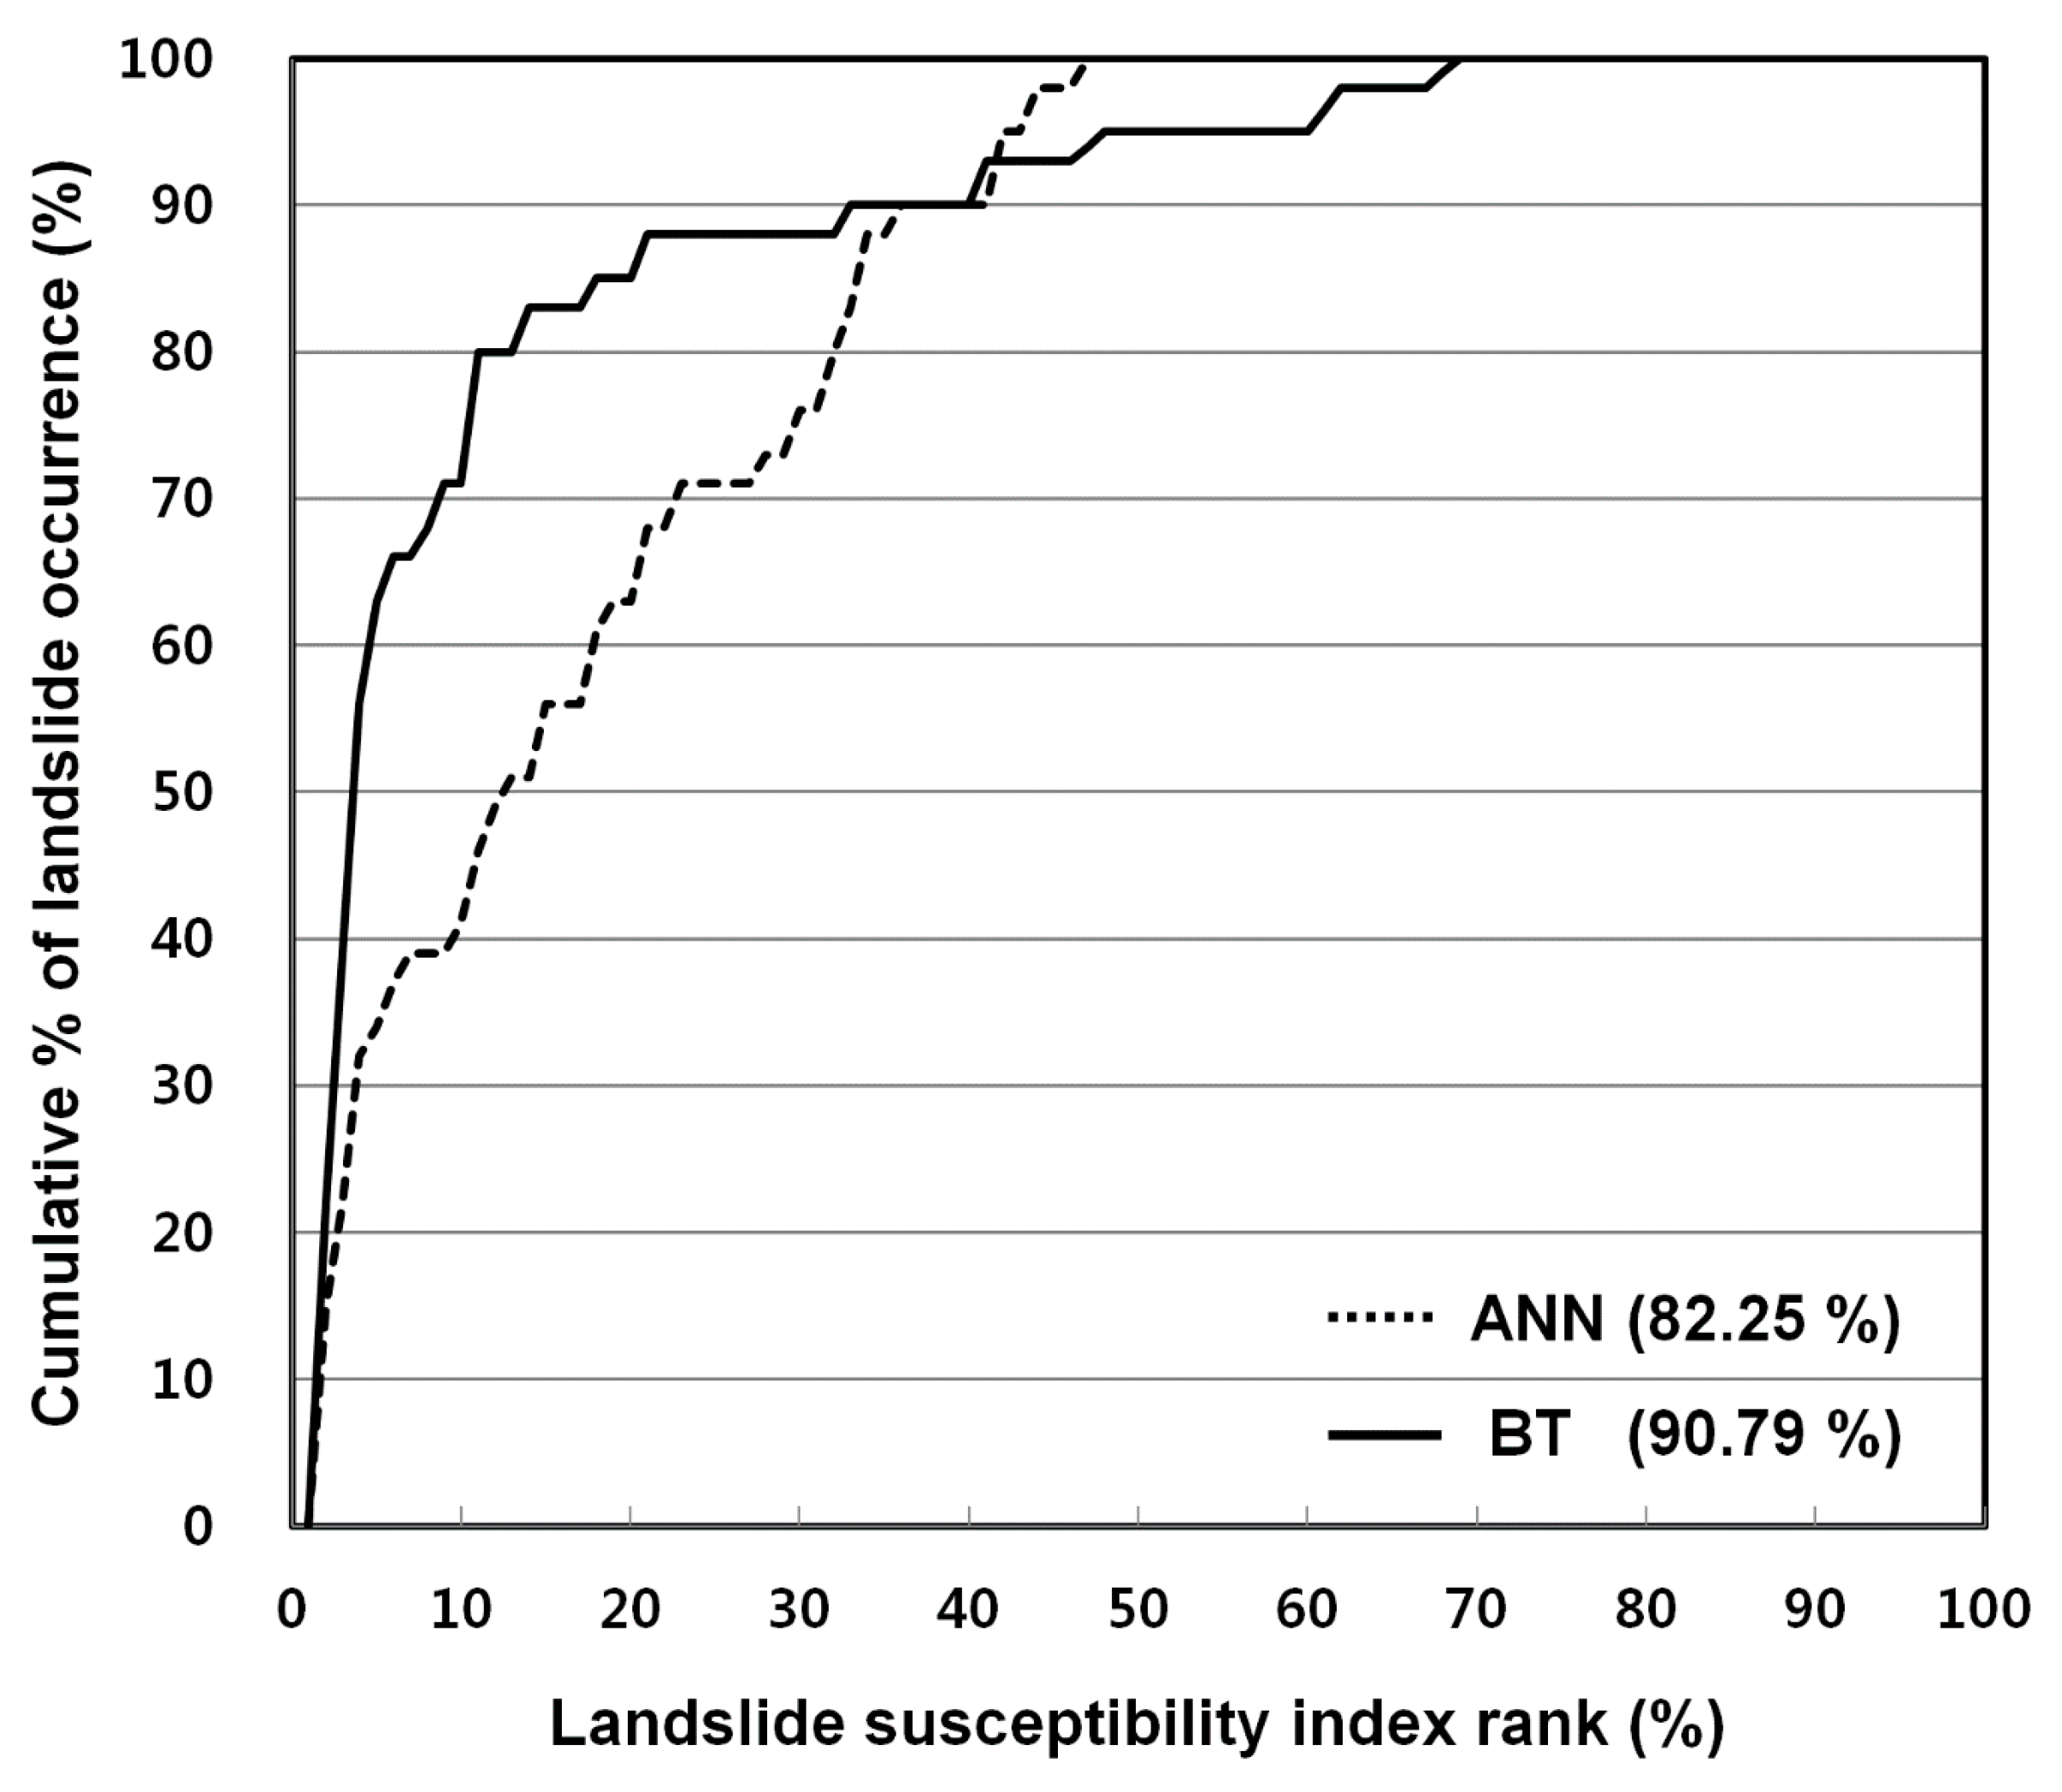
Mapping landslide susceptibility using ANN and BT, and assessing both maps using known landslide occurrences as a validation set.

2. Study Area and Materials

The study area, Yongin City, recorded over 350 mm of cumulative rainfall on 27 July 2011, and a shallow landslide occurred due to intense rainfall. Next, the debris flows collapsed houses and parts of buildings, and resulted in loss of life and property (Figure 1). In this paper, the landslide inventory was mapped from digital aerial photographs with a high resolution of 50 cm. The 82 landslides were detected from visual interpretation of before and after photos of landslide events in the study area. The altitude of the study area ranges from 47 m to 457 m with 140 m of average and 79 m of standard deviation. The landslide occurred at an altitude of 70 m~267 m. Specifically, 80% of total landslides occurred between 100 m and 200 m. Biotite gneiss and alluvium are composed of about 65% and 20% of the study area, respectively. Almost all landslides occurred in biotite gneiss. There are two fault lines from the geological map in the study areas.
Topographic and hydrologic factors were constructed from DEM using the terrain analysis of the SAGA GIS module (Table 1). The soil and timber factors were extracted from soil and forest maps. The locations of landslides and environmental factors were denoted by pixels of 5 m by 5 m, and the dimension of the study area had a total number of 1,918,400 cells with 1760 columns by 1090 rows.

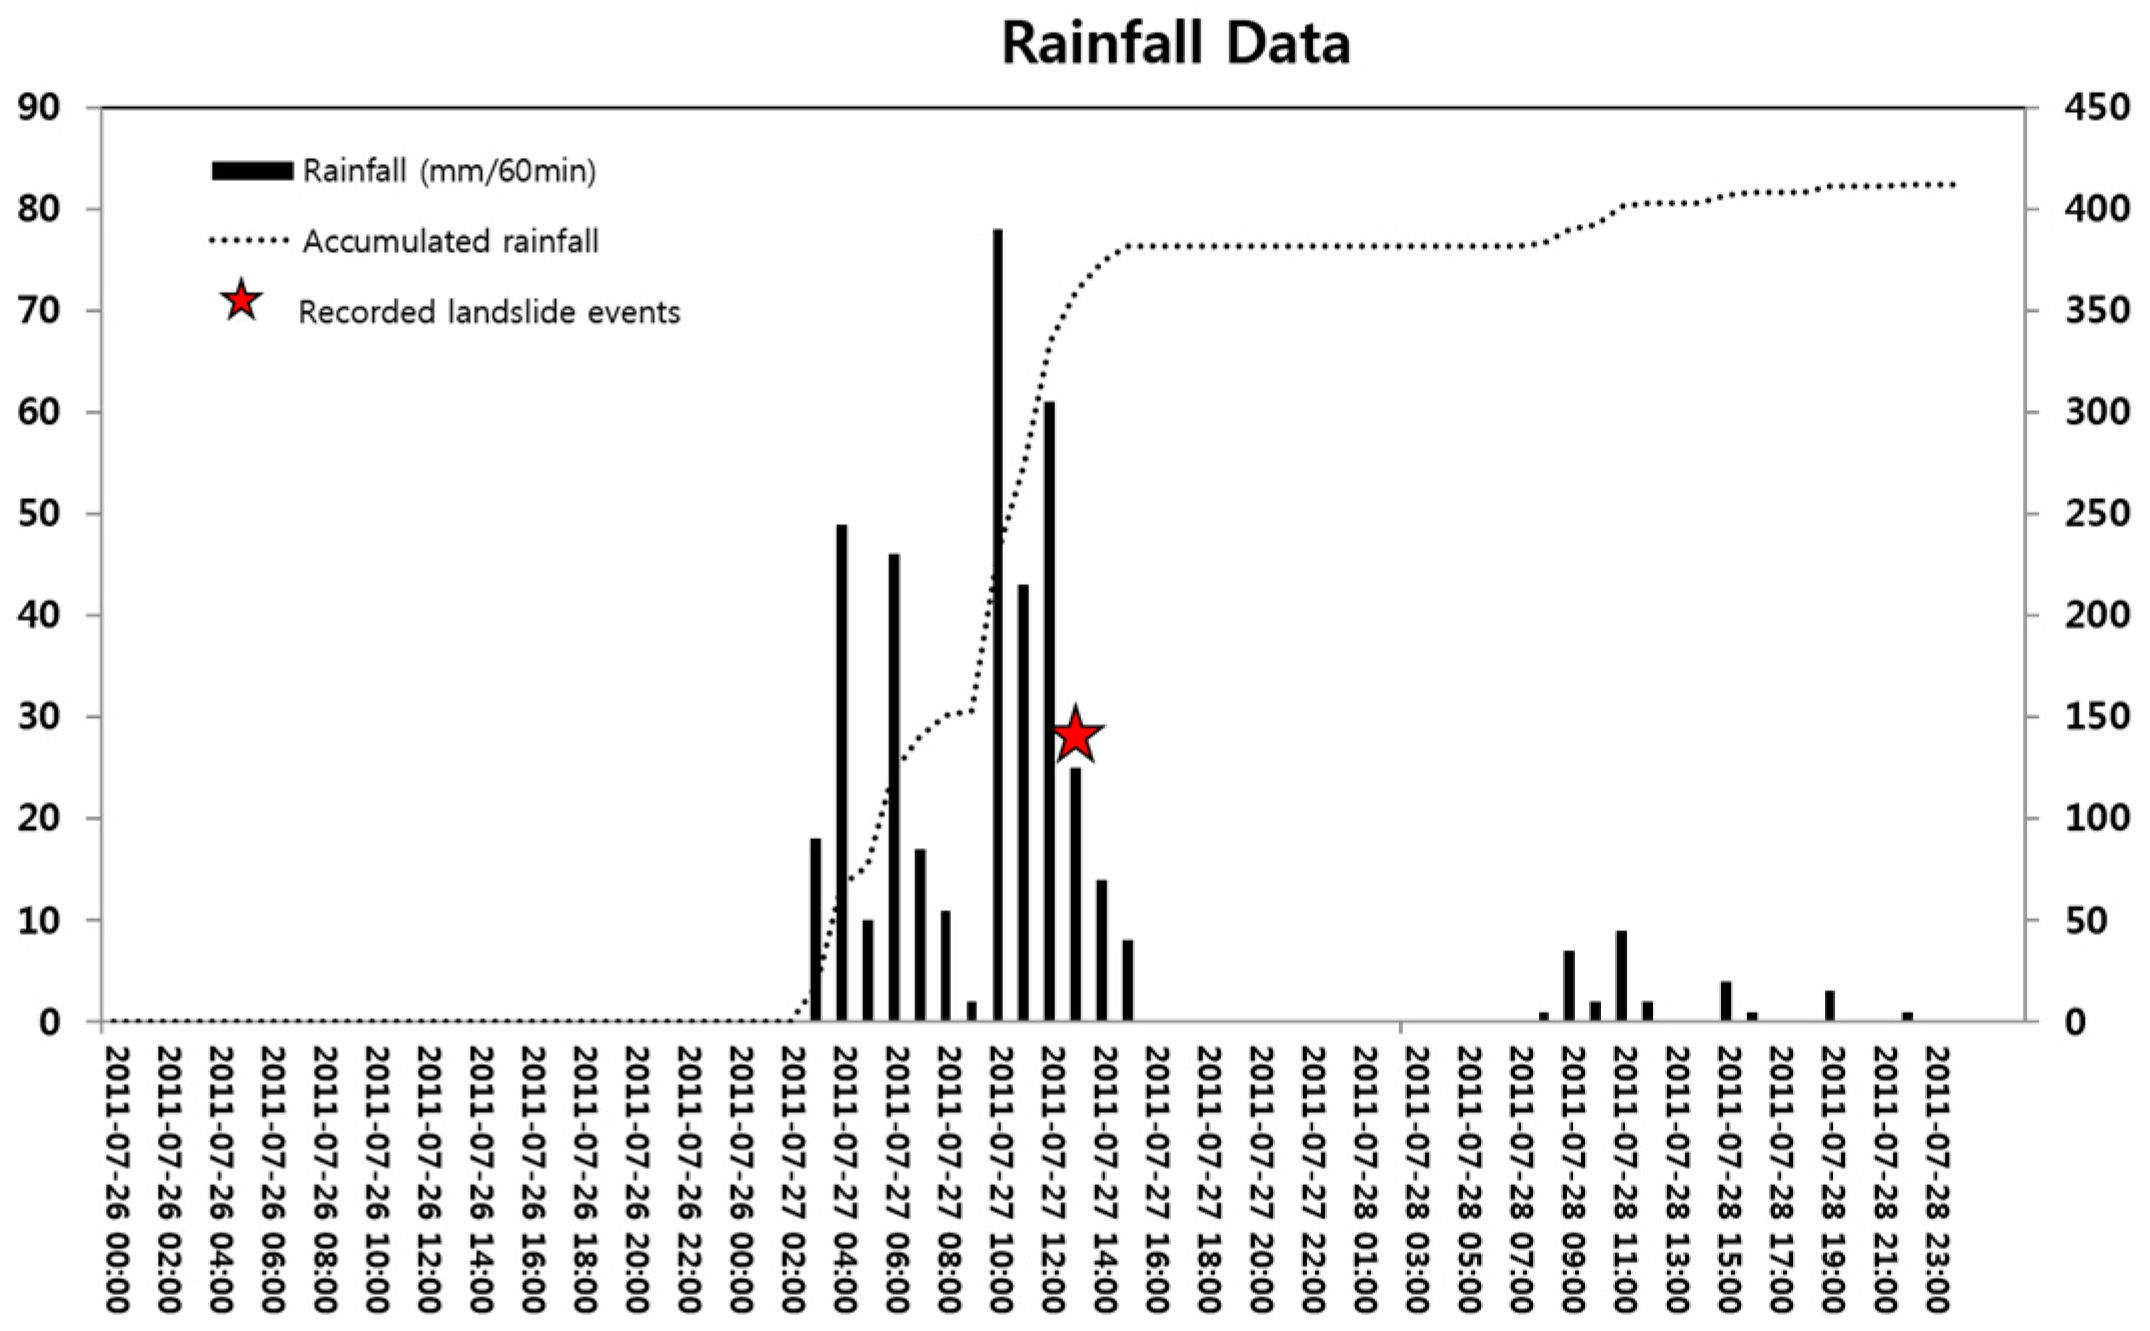
2.1. Precipitation Characteristics

Rainfall affects the slope stability by means of its influence on run-off and pore water pressure [32]. Specifically, high intensity rainfall usually relates to a high concentration of landslide events in time and space [33]. In this study, rainfall characteristics were analyzed over the period 26–28 July 2011, which affected landslide occurrences. Hourly rainfall data were collected from one automatic weather station (AWS) in the study area (Figure 2). Figure 2 shows the amount of hourly rainfall and its accumulative rainfall. It was reported in articles that the landslides occurred around 1:00 p.m. on 27 July 2011. Before the landslide event, the rain fell for 10 h from 3:00 a.m. that day. The highest hourly rainfall recorded was 78 mm at 10:00 a.m. The second highest recorded hourly rainfall was 68 mm at 12:00 a.m. before the landslide events at 1:00 p.m. The volume of rainfall accumulation at the time of the landslide events was recorded at 385 mm in the study area. The different seven AWS sites outside the study area showed a value of 205 mm, 282 mm, 188 mm, 182 mm, 178 mm, 222 mm, and 130 mm. The study area has the highest volume of rainfall accumulation when compared to the accumulated volume of rainfall in the surrounding area.

2.2. Landslide Inventory

A landslide map is based on important information to determine the quantitative zoning of landslide susceptibility, hazards, and risk [34,35]. In this study, a visual interpretation of digital aerial photographs with a high resolution of 50 cm was used for accurate landslide mapping. Although visual interpretation is a classical method [34], it is very useful in detecting accurate landslide locations and scars using high resolution photographs, as landslide scars are similar to tombs and their surrounding area in the study area.
These types of photographs without ground control points (GCPs) can be freely obtained at portal sites such as DAUM [36] and Skymap [37] (“Skymap”) in Korea [38]. The eighteen photos (taken before and after the landslide events) were selected from each region of landslide occurrences and five GCPs were applied to each photo from digital topographic features using ArcMap 10.2. Three out of the 82 landslides detected from the visual interpretation of the photos are shown in Figure 3. The photos taken before and after landslide occurrences are shown in Figure 3a–c, respectively. Figure 3c,d shows the blue plastic-covered area to prevent soil flow after landslides, and Figure 3d was taken by field survey. Most of the intensive rainfall-triggered debris flows were approximately 10–70 m in length, 3–20 m in width range, and less than one m in depth.

2.3. Environmental Factors

Intensive rainfall-triggered debris flows are controlled by the interaction of various factors including topography, hydrology, soil, and forests [39]. Topography and hydrology influence debris flow initiation through the effect of gradient on slope stability with rainfall. These factors also determine the concentration and dispersion of the material and the material balance on the slope associated with the slope stability. In addition, soil and timber factors on the slope affect the spatial distribution of debris flows. These factors are significant controls, and can be represented as spatial distribution from digital elevation models (DEM) and soil and forest maps. Geology and faults were not considered as environmental factors in this study because shallow soil failure was mainly related to positive pore water pressure in saturated soils by intensive rainfall [39,40,41]. In this study, 18 environmental factors were considered for landslide susceptibility modeling based on ANN and BT (Table 1, Figure 4).
Topographic and hydrologic factors were extracted from the DEM for determining the relationship between these factors and debris flow using SAGA GIS modules [42]. A DEM with a 5 × 5 m grid format was generated from a triangulated irregular network (TIN) derived from a digital elevation contour with 5 m interval lines in ArcGIS 10.2. Soil and forest factors were also extracted from soil and forest maps with a scale of 1:5000.
The extracted topographic factors were slope, aspect, plan curvature, convexity, topographic position index (TPI), terrain ruggedness index (TRI), min-slope position (MSP), and landforms (Figure 4a–h). The considered hydrologic factors were slope length (SL), stream power index (SPI), and topographic wetness index (TWI) (Figure 4i–k). Slope indicated the steepness of a hill, and aspect was the steepest downhill direction. Plan curvature was perpendicular to the slope and affects the divergence and convergence of flow across the surface. Terrain surface convexity was described as positive surface curvature and represented the percentage of convex-upward cells [43]. TPI was the difference between the elevation of each cell and the mean elevation for a neighborhood of cells [44]. Negative values represented lower features than surrounding features, values near zero were flat areas, and positive values represented features typically higher. TRI were absolute values obtained by squaring the difference between the value of a cell and neighbor cells, and convex and concave areas could have similar values. MSP were assigned a 0 value, while maximum vertical distances to the mid-slope in crest or valley directions were assigned a 1 value. Landform classification (cl 1: deeply incised streams, cl 2: shallow valleys, cl 3: upland drainages, cl 4: U-shape valleys, cl 5: plains, cl 6: open slopes, cl 7: upper slopes, cl8: local ridges, cl 9: mid-slope ridges, and cl 10: high ridges) was derived by ranges of TPI values [45]. SL was based on specific catchment areas and slope, with the former used as a substitute for slope length. SPI represented the erosive power of a water flow [46]. TWI indicated the effect of topography on the location of the saturated area size of runoff generation [46]. In general, higher SL and SPI, and lower TPI, represented a higher landslide susceptibility.
The attribute columns in the digital soil map (Table 1) included land-use, material, thickness, and topographical values (Figure 4l–o). Land-use was classified into natural grasses, forests, paddy fields, and farm orchard areas. Soil material included three classes: gneiss, acidic residuum, and granite residuum. The class of soil thickness from the soil maps was divided into four classes: very shallow (<20 cm), shallow (20–50 cm), moderate (50–100 cm), and deep (>100 cm). Topography was classified into mountainous areas, fluvial plains, valley areas, hilly areas, alluvial fan areas, piedmont slope areas, and diluvium areas.
Timber factors from the digital forest map (Table 1) included timber age, density, and diameter (Figure 4p–r). Timber age was grouped into the 1st to 6th ages; over 50% of the timber in the study area belonged to the 1st age (less than 10 years), and the rest were classed as either the 2nd age (11–20 years), 3rd age (21–30 years), 4th age (31–40 years), 5th age (41–50 years), or 6th age (51–60 years). Timber density was divided into three classes: loose (less than 50% of a covered area), moderate (51–70%), and dense (over 71%). Timber diameter was divided into four classes: very small (over 51% of area with <6 cm), small (over 51% of area with <18 cm), medium (over 51% of area with <30 cm), and large (over 51% of area with >30 cm).

3. Application of Artificial Neural Network (ANN) and Boosted Tree (BT) Models for Landslide Susceptibility Mapping

3.1. Artificial Neural Network (ANN)

The ANN is an abstract mathematical model based on the knowledge of the human brain and its activities. The scope of possible applications of ANN is practically unlimited in fields such as pattern recognition (also known as classification), decision making, automatic control systems, and many others. Thus, ANN can be applied to the classification of landslide susceptibility by solving the non-linear relationship between landslides and their spatial environmental factors [47].
A feedforward ANN model called a multilayer perceptron (MLP) maps a set of input values onto a set of suitable outputs. The MLP comprises of an input and an output with one or more hidden layers of nonlinearly-activating nodes. Each node in one layer is connected with a certain weight to every node in the next layer. MLP utilizes a backpropagation algorithm for training the network. The algorithm trains the network until some goal minimal error is reached between the anticipated and actual output values of the network. At the end of this training step, the neural network produces a model that should be able to calculate a target value from a given input value [48].
It is important to select training data, such as landslide- and non-landslide locations, to be used as input to the ANN’s learning algorithm [49]. In this study, areas with zero slope value were assigned as areas not prone to landslides, and areas with known landslides were assigned as areas prone to landslide in the training set. Both groups had 41 datasets. The values of the 18 landslide-related environmental factors were normalized to a range of 0.1–0.9 as input data. The backpropagation algorithm, as one of the most popular training algorithms, was used in this study. The three layered feed-forward network based on the framework provided by [50] was applied using the MATLAB software package as 18 (input layer) × 36 (hidden layer) × 2 (output layer). A log-sigmoid transfer function was used in the hidden layer and the output layer.
The flow of data processing was as follows. First, feedforward sent the input data to the neural network, and then the cost function with weight and bias were calculated. Many iterations of training satisfactorily minimized errors in updating optimized weight and bias for the training data. The relative influence indexes of the variables were calculated as the maximum repetitive number before reaching the targeted error of 2000, the learning rate of 0.01, and root mean square error (RMSE) of 0.001 using MATLAB. If the RMSE value of 0.001 was not achieved, then the maximum number of iterations was terminated at 2000 epochs. When the latter case occurred, then the maximum RMSE value was <0.1. As the calculated weights were granted to each factor (Table 2), landslide susceptibility for the whole study area was classified.

3.2. Boosted Tree (BT)

The boosted-tree technique has emerged as one of the most-influential methods for predictive data mining over the past few years. The boost-tree algorithm stems from one of the general computational approaches of stochastic-gradient boosting, also known as TreeNet (TM Salford Systems, Inc., 9685 Via Excelencia, Suite 208, San Diego, CA 92126, USA). These potent algorithms can effectively be used for regression as well as classification with continuous and categorical predictors. Boosted trees can ultimately produce a more-effective fit of the prediction values to the observation values, despite its complex relationship with the predictor and dependent variables, such as a nonlinear relationship; therefore, the boosted-tree algorithm can serve as a reliable machine-learning algorithm by fitting a weighted additive expansion of simple trees.
The training set in the BT model was the same as the training set in ANN. In the BT model in STATISTICA 10.0 [51], where the learning rate = 0.01, the tree complexity = 5, and the bag fraction = 0.5, the optimal number of trees was reached/selected at 262. The relative influence indexes of the variables were calculated summing the contribution of each variable (Table 2).

4. Landslide Susceptibility Mapping and Validation

The probability for landslide susceptibility was predicted by reflecting the relative influence indexes of predictor variables calculated in the ANN and BT models. The predicted landslide susceptibility index was classified into four classes based on area for simple and visual interpretation: very high, high, medium, and low index ranges in 5%, 10%, 15%, and 70% of the study area, respectively (Figure 5a,b).
Susceptibility maps were verified and compared by using known 41 actual landslide events as a validation set that were not used in the ANN and BT training to evaluate whether they could effectively reflect future landslide hazard areas. The landslide susceptibility indexes were sorted in descending order, and divided by 100 classes with cumulative 1% intervals. The cumulative distributions of landslide occurrence were compared with receiver operating characteristics (ROC) curves in 100 classes [52]. The ANN and BT models had a reasonable performance of 82.25% and 90.79% as percentage of area under ROC curves, respectively (Figure 6).

5. Discussion and Conclusions

Digital aerial photographs of high resolution are very useful in constructing detailed landslide inventory maps, as it is difficult to separate the similar shapes of landslide scar areas and surrounding tombs in the study area using satellite images or panchromatic aerial photographs. Therefore, both shapes could be easily interpreted visually in high-resolution aerial photographs taken in a high-vegetation season. Using aerial photographs could also save time and costs in field surveying to identify damage from natural disasters.
In Korea, debris flows occur randomly in several slope regions due to intensive rainfall per day. Therefore, it is necessary to select factors related to landslide occurrence and analyze the landslide susceptibility using pattern classification by looking at the relationship between the various factors and landslide location. However, it is not possible to know quantitatively how the environmental factors relate to the occurrence of landslides. ANN and BT models, which are used in many fields as sophisticated modeling techniques, were applied in identifying the influence of environmental factors to landslide occurrence and in mapping landslide susceptibility.
The training and validation sets, which were used in the ANN and BT models, were the same: 50% and 50% of a total of 82 landslide occurrences, respectively. ANN modeling was performed while changing the number of hidden layers (18 to 36), the value of learning rate (0.1 to 0.01), and RMSE (0.01~0.001). A sigmoid function for a backpropagation network was used as one of the more popular activation functions. The result of ANN modeling was best in 36 hidden layers, with 0.01 of learning rate and 0.001 of RMSE. BT modeling was performed at 0.01 of learning rate, 5 of tree complexity, and 0.5 of bag fraction. The optimal number of trees was reached at 262.
The weights of all factors from the ANN and BT models were normalized from 0 to 1. The factors’ weights were divided into three groups: high, medium, and low influence groups from the ANN and BT models. The high group of ANN and BT included three factors: timber age, TWI, and slope gradient. The medium group of both models had three factors: TPI, soil land-use, and SPI. The low group had four factors: MSP, soil topography, plan curvature, and soil thickness. Although it was difficult to identify the influence ranking of the environmental factor (i.e., topographic, hydrologic, soil, forest, etc.) to landslide occurrence because of these intersections from intensive rainfall, the common factors in each ANN and BT group could be identified and can be used as a guideline for selecting environmental factors affecting landslide occurrence in other study areas in Korea.
ANNs are capable of handling complex and robustly nonlinear processes without previously assuming the relationships between the input and output variables (Lollino et al., 2014). Boosted tree has all of the strengths of decision trees, including the advantage of being able to handle both continuous and categorical variables (Krauss et al., 2017). In this study, the validation result of the ANN and BT models was 82.25% and 90.79%, respectively, which demonstrated reasonably good performance. In particular, the BT model had a higher accuracy (about 8%) than the ANN model. In other fields (using both models) [53,54], BT reported a better performance than ANN. The results of this study demonstrate the benefits of selecting optimal data mining techniques in landslide susceptibility modeling.
For future study, it is necessary to generalize the regularized relationships between the classes of each factor and landslide occurrence, and to combine the influence score of factors and factor classes. This approach could be used as a guideline to apply threshold values to a landslide monitoring system in the Korean rainy season. In addition, it could rank landslide susceptibility in urban areas, making this information helpful in selecting landslide monitoring sites and planning land-use.

Acknowledgments

This research was conducted by the Basic Research Project of the Korea Institute of Geoscience and Mineral Resources (KIGAM) funded by the Ministry of Science, ICT. This research (NRF- 2016K1A3A1A09915721) was supported by Science and Technology Internationalization Project through National Research Foundation of Korea (NRF) grant funded by the Ministry of Science and ICT.

Author Contributions

Hyun-Joo Oh organized the paperwork, constructed the input database, and performed the experiments; Saro Lee suggested the idea, collected the data, and performed the experiments. All authors contributed to the writing of each part.

Conflicts of Interest

The authors declare no conflict of interest.

References

  1. Kim, K.S.; Song, Y.S. Geometrical and geotechnical characteristics of landslides in Korea under various geological conditions. J. Mt. Sci. 2015, 12, 1267–1280. [Google Scholar] [CrossRef]
  2. Jeong, S.; Kim, Y.; Lee, J.K.; Kim, J. The 27 July 2011 debris flows at Umyeonsan, Seoul, Korea. Landslides 2015, 12, 799–813. [Google Scholar] [CrossRef]
  3. Ro, K.S.; Jeon, B.J.; Jeon, K.W. Induction wall influence review by debris flow’s impact force. J. Korean Soc. Hazard Mitig. 2015, 15, 159–164. [Google Scholar] [CrossRef]
  4. Aleotti, P.; Chowdhury, R. Landslide hazard assessment: Summary review and new perspectives. Bull. Eng. Geol. Environ. 1999, 58, 21–44. [Google Scholar] [CrossRef]
  5. Carrara, A.; Cardinali, M.; Guzzetti, F.; Reichenbach, P. GIS technology in mapping landslide hazard. In Geographical Information Systems in Assessing Natural Hazards; Springer: Dordrecht, The Netherlands, 1995; pp. 135–175. [Google Scholar]
  6. Carrara, A.; Guzzetti, F.; Cardinali, M.; Reichenbach, P. Use of GIS technology in the prediction and monitoring of landslide hazard. Nat. Hazards 1999, 20, 117–135. [Google Scholar] [CrossRef]
  7. Carrara, A.; Pugliese-Carratelli, E.; Merenda, L. Computer-based data bank and statistical analysis of slope instability phenomena. Z. Geomorphol. N. F. 1977, 21, 187–222. [Google Scholar]
  8. Guzzetti, F.; Carrara, A.; Cardinali, M.; Reichenbach, P. Landslide hazard evaluation: A review of current techniques and their application in a multi-scale study, Central Italy. Geomorphology 1999, 31, 181–216. [Google Scholar] [CrossRef]
  9. Soeters, R.; Van Westen, C.J. Slope instability recognition, analysis, and zonation. In Landslides: Investigation and Mitigation; National Academy Press: Washington, DC, USA, 1996; pp. 129–177. [Google Scholar]
  10. Van Westen, C.J.; Castellanos, E.; Kuriakose, S.L. Spatial data for landslide susceptibility, hazard, and vulnerability assessment: An overview. Eng. Geol. 2008, 102, 112–131. [Google Scholar] [CrossRef]
  11. Van Westen, C.J.; Soeters, R.; Sijmons, K. Digital geomorphological landslide hazard mapping of the Alpago area, Italy. ITC J. 2000, 2, 51–60. [Google Scholar] [CrossRef]
  12. Van Westen, C.J.; van Asch, T.W.J.; Soeters, R. Landslide hazard and risk zonation—Why is it still so difficult? Bull. Eng. Geol. Environ. 2006, 65, 167–184. [Google Scholar] [CrossRef]
  13. Varnes, D.J. Landslide Hazard Zonation: A Review of Principles and Practice; United Nations: New York, NY, USA, 1984; p. 63. [Google Scholar]
  14. Choi, J.; Oh, H.-J.; Lee, H.-J.; Lee, C.; Lee, S. Combining landslide susceptibility maps obtained from frequency ratio, logistic regression, and artificial neural network models using aster images and GIS. Eng. Geol. 2012, 124, 12–23. [Google Scholar] [CrossRef]
  15. Lee, M.-J.; Park, I.; Lee, S. Forecasting and validation of landslide susceptibility using an integration of frequency ratio and neuro-fuzzy models: A case study of Seorak mountain area in Korea. Environ. Earth Sci. 2015, 74, 413–429. [Google Scholar] [CrossRef]
  16. Armaş, I. Weights of evidence method for landslide susceptibility mapping. Prahova subcarpathians, romania. Nat. Hazards 2012, 60, 937–950. [Google Scholar] [CrossRef]
  17. Wang, L.-J.; Sawada, K.; Moriguchi, S. Landslide susceptibility analysis with logistic regression model based on FCM sampling strategy. Comput. Geosci. 2013, 57, 81–92. [Google Scholar] [CrossRef]
  18. Pradhan, B. Landslide susceptibility mapping of a catchment area using frequency ratio, fuzzy logic and multivariate logistic regression approaches. J. Indian Soc. Remote Sens. 2010, 38, 301–320. [Google Scholar] [CrossRef]
  19. Tsai, F.; Lai, J.-S.; Chen, W.W.; Lin, T.-H. Analysis of topographic and vegetative factors with data mining for landslide verification. Ecol. Eng. 2013, 61, 669–677. [Google Scholar] [CrossRef]
  20. Nefeslioglu, H.A.; Sezer, E.; Gokceoglu, C.; Bozkir, A.S.; Duman, T.Y. Assessment of landslide susceptibility by decision trees in the metropolitan area of Istanbul, Turkey. Math. Probl. Eng. 2010, 2010. [Google Scholar] [CrossRef]
  21. Kim, J.-C.; Lee, S.; Jung, H.-S.; Lee, S. Landslide susceptibility mapping using random forest and boosted tree models in Pyeong-Chang, Korea. Geocarto Int. 2017, 1–16. [Google Scholar] [CrossRef]
  22. Youssef, A.M.; Pourghasemi, H.R.; Pourtaghi, Z.S.; Al-Katheeri, M.M. Landslide susceptibility mapping using random forest, boosted regression tree, classification and regression tree, and general linear models and comparison of their performance at Wadi Tayyah Basin, Asir Region, Saudi Arabia. Landslides 2017, 13, 839–856. [Google Scholar] [CrossRef]
  23. Huang, F.; Yin, K.; Huang, J.; Gui, L.; Wang, P. Landslide susceptibility mapping based on self-organizing-map network and extreme learning machine. Eng. Geol. 2017, 223, 11–22. [Google Scholar] [CrossRef]
  24. Park, I.; Lee, S. Spatial prediction of landslide susceptibility using a decision tree approach: A case study of the Pyeongchang area, Korea. Int. J. Remote Sens. 2014, 35, 6089–6112. [Google Scholar] [CrossRef]
  25. Oh, H.-J.; Pradhan, B. Application of a neuro-fuzzy model to landslide-susceptibility mapping for shallow landslides in a tropical hilly area. Comput. Geosci. 2011, 37, 1264–1276. [Google Scholar] [CrossRef]
  26. Pradhan, B. A comparative study on the predictive ability of the decision tree, support vector machine and neuro-fuzzy models in landslide susceptibility mapping using GIS. Comput. Geosci. 2013, 51, 350–365. [Google Scholar] [CrossRef] [Green Version]
  27. Liang, W.-J.; Zhuang, D.-F.; Jiang, D.; Pan, J.-J.; Ren, H.-Y. Assessment of debris flow hazards using a bayesian network. Geomorphology 2012, 171–172, 94–100. [Google Scholar] [CrossRef]
  28. Song, Y.; Gong, J.; Gao, S.; Wang, D.; Cui, T.; Li, Y.; Wei, B. Susceptibility assessment of earthquake-induced landslides using bayesian network: A case study in Beichuan, China. Comput. Geosci. 2012, 42, 189–199. [Google Scholar] [CrossRef]
  29. Ballabio, C.; Sterlacchini, S. Support vector machines for landslide susceptibility mapping: The Staffora River Basin case study, Italy. Math. Geosci. 2012, 44, 47–70. [Google Scholar] [CrossRef]
  30. Lee, S.; Ryu, J.-H.; Kim, I.-S. Landslide susceptibility analysis and its verification using likelihood ratio, logistic regression, and artificial neural network models: Case study of Youngin, Korea. Landslides 2007, 4, 327–338. [Google Scholar] [CrossRef]
  31. Samodra, G.; Chen, G.; Sartohadi, J.; Kasama, K. Comparing data-driven landslide susceptibility models based on participatory landslide inventory mapping in Purwosari area, Yogyakarta, Java. Environ. Earth Sci. 2017, 76, 184. [Google Scholar] [CrossRef]
  32. Tsukamoto, Y.; Ohta, T. Runoff process on a steep forested slope. J. Hydrol. 1988, 102, 165–178. [Google Scholar] [CrossRef]
  33. Bui, D.T.; Lofman, O.; Revhaug, I.; Dick, O. Landslide susceptibility analysis in the Hoa Binh province of Vietnam using statistical index and logistic regression. Nat. Hazards 2011, 59, 1413. [Google Scholar] [CrossRef]
  34. Guzzetti, F.; Mondini, A.C.; Cardinali, M.; Fiorucci, F.; Santangelo, M.; Chang, K.-T. Landslide inventory maps: New tools for an old problem. Earth Sci. Rev. 2012, 112, 42–66. [Google Scholar] [CrossRef]
  35. Hervas, J.; Van Den Eeckhaut, M.; Legorreta, G.; Trigila, A. Landslide Science and Practice Volume 1: Landslide Inventory and Susceptibility and Hazard Zoning; Introduction; Springer: Berlin, Germany, 2013. [Google Scholar]
  36. Daum. Available online: http://map.daum.net/ (accessed on 2 March 2017).
  37. Skymap. Available online: http://www.skymaps.co.kr/ (accessed on 2 March 2017).
  38. Lee, S.; Song, K.-Y.; Oh, H.-J.; Choi, J. Detection of landslides using web-based aerial photographs and landslide susceptibility mapping using geospatial analysis. Int. J. Remote Sens. 2012, 33, 4937–4966. [Google Scholar] [CrossRef]
  39. Montgomery, D.R.; Dietrich, W.E. A physically based model for the topographic control on shallow landsliding. Water Resour. Res. 1994, 30, 1153–1171. [Google Scholar] [CrossRef]
  40. Baum, R.L.; Savage, W.Z.; Godt, J.W. TRIGRS-A Fortran Program for Transient Rainfall Infiltration and Grid-Based Regional Slope-Stability Analysis; US Geological Survey: Reston, VA, USA, 2002. [Google Scholar]
  41. Montrasio, L.; Valentino, R. A model for triggering mechanisms of shallow landslides. Nat. Hazards Earth Syst. Sci. 2008, 8, 1149–1159. [Google Scholar] [CrossRef]
  42. Conrad, O.; Bechtel, B.; Bock, M.; Dietrich, H.; Fischer, E.; Gerlitz, L.; Wehberg, J.; Wichmann, V.; Böhner, J. System for automated geoscientific analyses (SAGA) v. 2.1.4. Geosci. Model Dev. 2015, 8, 1991–2007. [Google Scholar] [CrossRef]
  43. Iwahashi, J.; Pike, R.J. Automated classifications of topography from DEMs by an unsupervised nested-means algorithm and a three-part geometric signature. Geomorphology 2007, 86, 409–440. [Google Scholar] [CrossRef]
  44. Guisan, A.; Weiss, S.B.; Weiss, A.D. Glm versus cca spatial modeling of plant species distribution. Plant Ecol. 1999, 143, 107–122. [Google Scholar] [CrossRef]
  45. Weiss, A.D. Topographic position and landforms analysis. In Proceedings of the Poster Presentation, ESRI User Conference, San Diego, CA, USA, 9–13 July 2001. [Google Scholar]
  46. Moore, I.D.; Grayson, R.B.; Ladson, A.R. Digital terrain modelling: A review of hydrological, geomorphological, and biological applications. Hydrol. Process. 1991, 5, 3–30. [Google Scholar] [CrossRef]
  47. Gómez, H.; Kavzoglu, T. Assessment of shallow landslide susceptibility using artificial neural networks in Jabonosa River Basin, Venezuela. Eng. Geol. 2005, 78, 11–27. [Google Scholar] [CrossRef]
  48. Pradhan, B.; Lee, S. Landslide susceptibility assessment and factor effect analysis: Backpropagation artificial neural networks and their comparison with frequency ratio and bivariate logistic regression modelling. Environ. Model. Softw. 2010, 25, 747–759. [Google Scholar] [CrossRef]
  49. Paola, J.D.; Schowengerdt, R.A. A detailed comparison of backpropagation neural network and maximum-likelihood classifiers for urban land use classification. IEEE Trans. Geosci. Remote Sens. 1995, 33, 981–996. [Google Scholar] [CrossRef]
  50. Hines, J.W.; Tsoukalas, L.H.; Uhrig, R.E. Matlab Supplement to Fuzzy and Neural Approaches in Engineering; John Wiley & Sons, Inc.: Hoboken, NJ, USA, 1997; p. 210. [Google Scholar]
  51. STATISTICA. Boosted Trees for Regression and Classification Overview (Stochastic Gradient Boosting)—Basic Ideas. Available online: http://documentation.statsoft.com/STATISTICAHelp.aspx?path=Gxx/Boosting/BoostingTreesforRegressionandClassificationOverviewStochasticGradientBoostingBasicIdeas (accessed on 1 July 2017).
  52. Deng, X.; Li, L.; Tan, Y. Validation of spatial prediction models for landslide susceptibility mapping by considering structural similarity. ISPRS Int. J. Geo-Inf. 2017, 6, 103. [Google Scholar] [CrossRef]
  53. Suleiman, A.; Tight, M.R.; Quinn, A.D. Hybrid neural networks and boosted regression tree models for predicting roadside particulate matter. Environ. Model. Assess. 2016, 21, 731–750. [Google Scholar] [CrossRef]
  54. Roe, B.P.; Yang, H.-J.; Zhu, J.; Liu, Y.; Stancu, I.; McGregor, G. Boosted decision trees as an alternative to artificial neural networks for particle identification. Nucl. Instrum. Methods Phys. Res. Sect. A 2005, 543, 577–584. [Google Scholar] [CrossRef]
Figure 1. Digital elevation model (DEM) and landslide occurrences in the study area: (a) collapsed houses; (b) building; and (c) debris flows in Neungwonri and Hankuk University of Foreign Studies located in Figure 1a, respectively.
Applsci 07 01000 g001
Figure 2. Hourly precipitation characteristics in the past led to landslide events in the study area.
Applsci 07 01000 g002
Figure 3. Digital aerial photographs of (a) pre-; (b,c) post-landslide occurrences; and (d) covered blue plastic at landslide scar after landslide occurrence in 2011.
Applsci 07 01000 g003
Figure 4. Spatial database of the landslide causative factors.
Applsci 07 01000 g004aApplsci 07 01000 g004b
Figure 5. Landslide susceptibility maps based on (a) ANN; and (b) BT approaches. The rank was divided into four classes based on area: very high, high, medium, and low index ranges in 5%, 10%, 15%, and 70% of the study area, respectively.
Applsci 07 01000 g005
Figure 6. Percentage of area under curves (AUCs) of the landslide susceptibility maps based on ANN and BT models.
Applsci 07 01000 g006
Table 1. Data layer related to the landslide of the study area.
CategoryFactorsData TypeScaleSource
DEMTopographic factorsSlopeGrid1:5000National Geographic Information Institute (NGII) in Korea
Aspect
Plan curvature
Convexity
Mid-slope position (MSP)
Terrain ruggedness index (TRI)
Topographic position index (TPI)
Landforms
Hydrologic factorsSlope length (SL)
Stream power index (SPI)
Topographic wetness index (TWI)
Soil map Land-usePolygon1:5000National Academy of Agricultural Science (NAAS) in Korea
Material
Thickness
Topography
Forest map Timber agePolygon1:5000Korea Forest Research Institute (KFRI)
Timber density
Timber diameter
Table 2. Summary of the influence weights of predictor variables for Artificial Neural Network (ANN) and Boosted Tree (BT).
Normalized Weights Based on ANNNormalized Weights Based on BT
Soil thickness0.00Soil material0.00
Plan curvature0.05Soil thickness0.11
Aspect0.14Plan curvature0.13
Slope length (SL)0.19Soil topography0.18
Mid-slope position (MSP)0.22Landforms0.21
Soil topography0.24Mid-slope position (MSP)0.27
Topographic position index (TPI)0.25Stream power index (SPI)0.33
Soil land-use0.30Soil land-use0.34
Timber diameter0.31Convexity0.36
Terrain ruggedness index (TRI)0.35Topographic position index (TPI)0.42
Soil material0.37Timber density0.43
Stream power index (SPI)0.39Aspect0.45
Timber age0.43Slope length (SL)0.65
Convexity0.45Slope gradient0.66
Landforms0.54Topographic wetness index (TWI)0.67
Timber density0.58Terrain ruggedness index (TRI)0.71
Slope gradient0.60Timber diameter0.73
Topographic wetness index (TWI)1.00Timber age1.00

