
Comparative Effectiveness of Different Phase Change Materials to Improve Cooling Performance of Heat Sinks for Electronic Devices


Abstract
:
1. Introduction
2. Materials and Methodology
2.1. Materials
2.2. Methodology
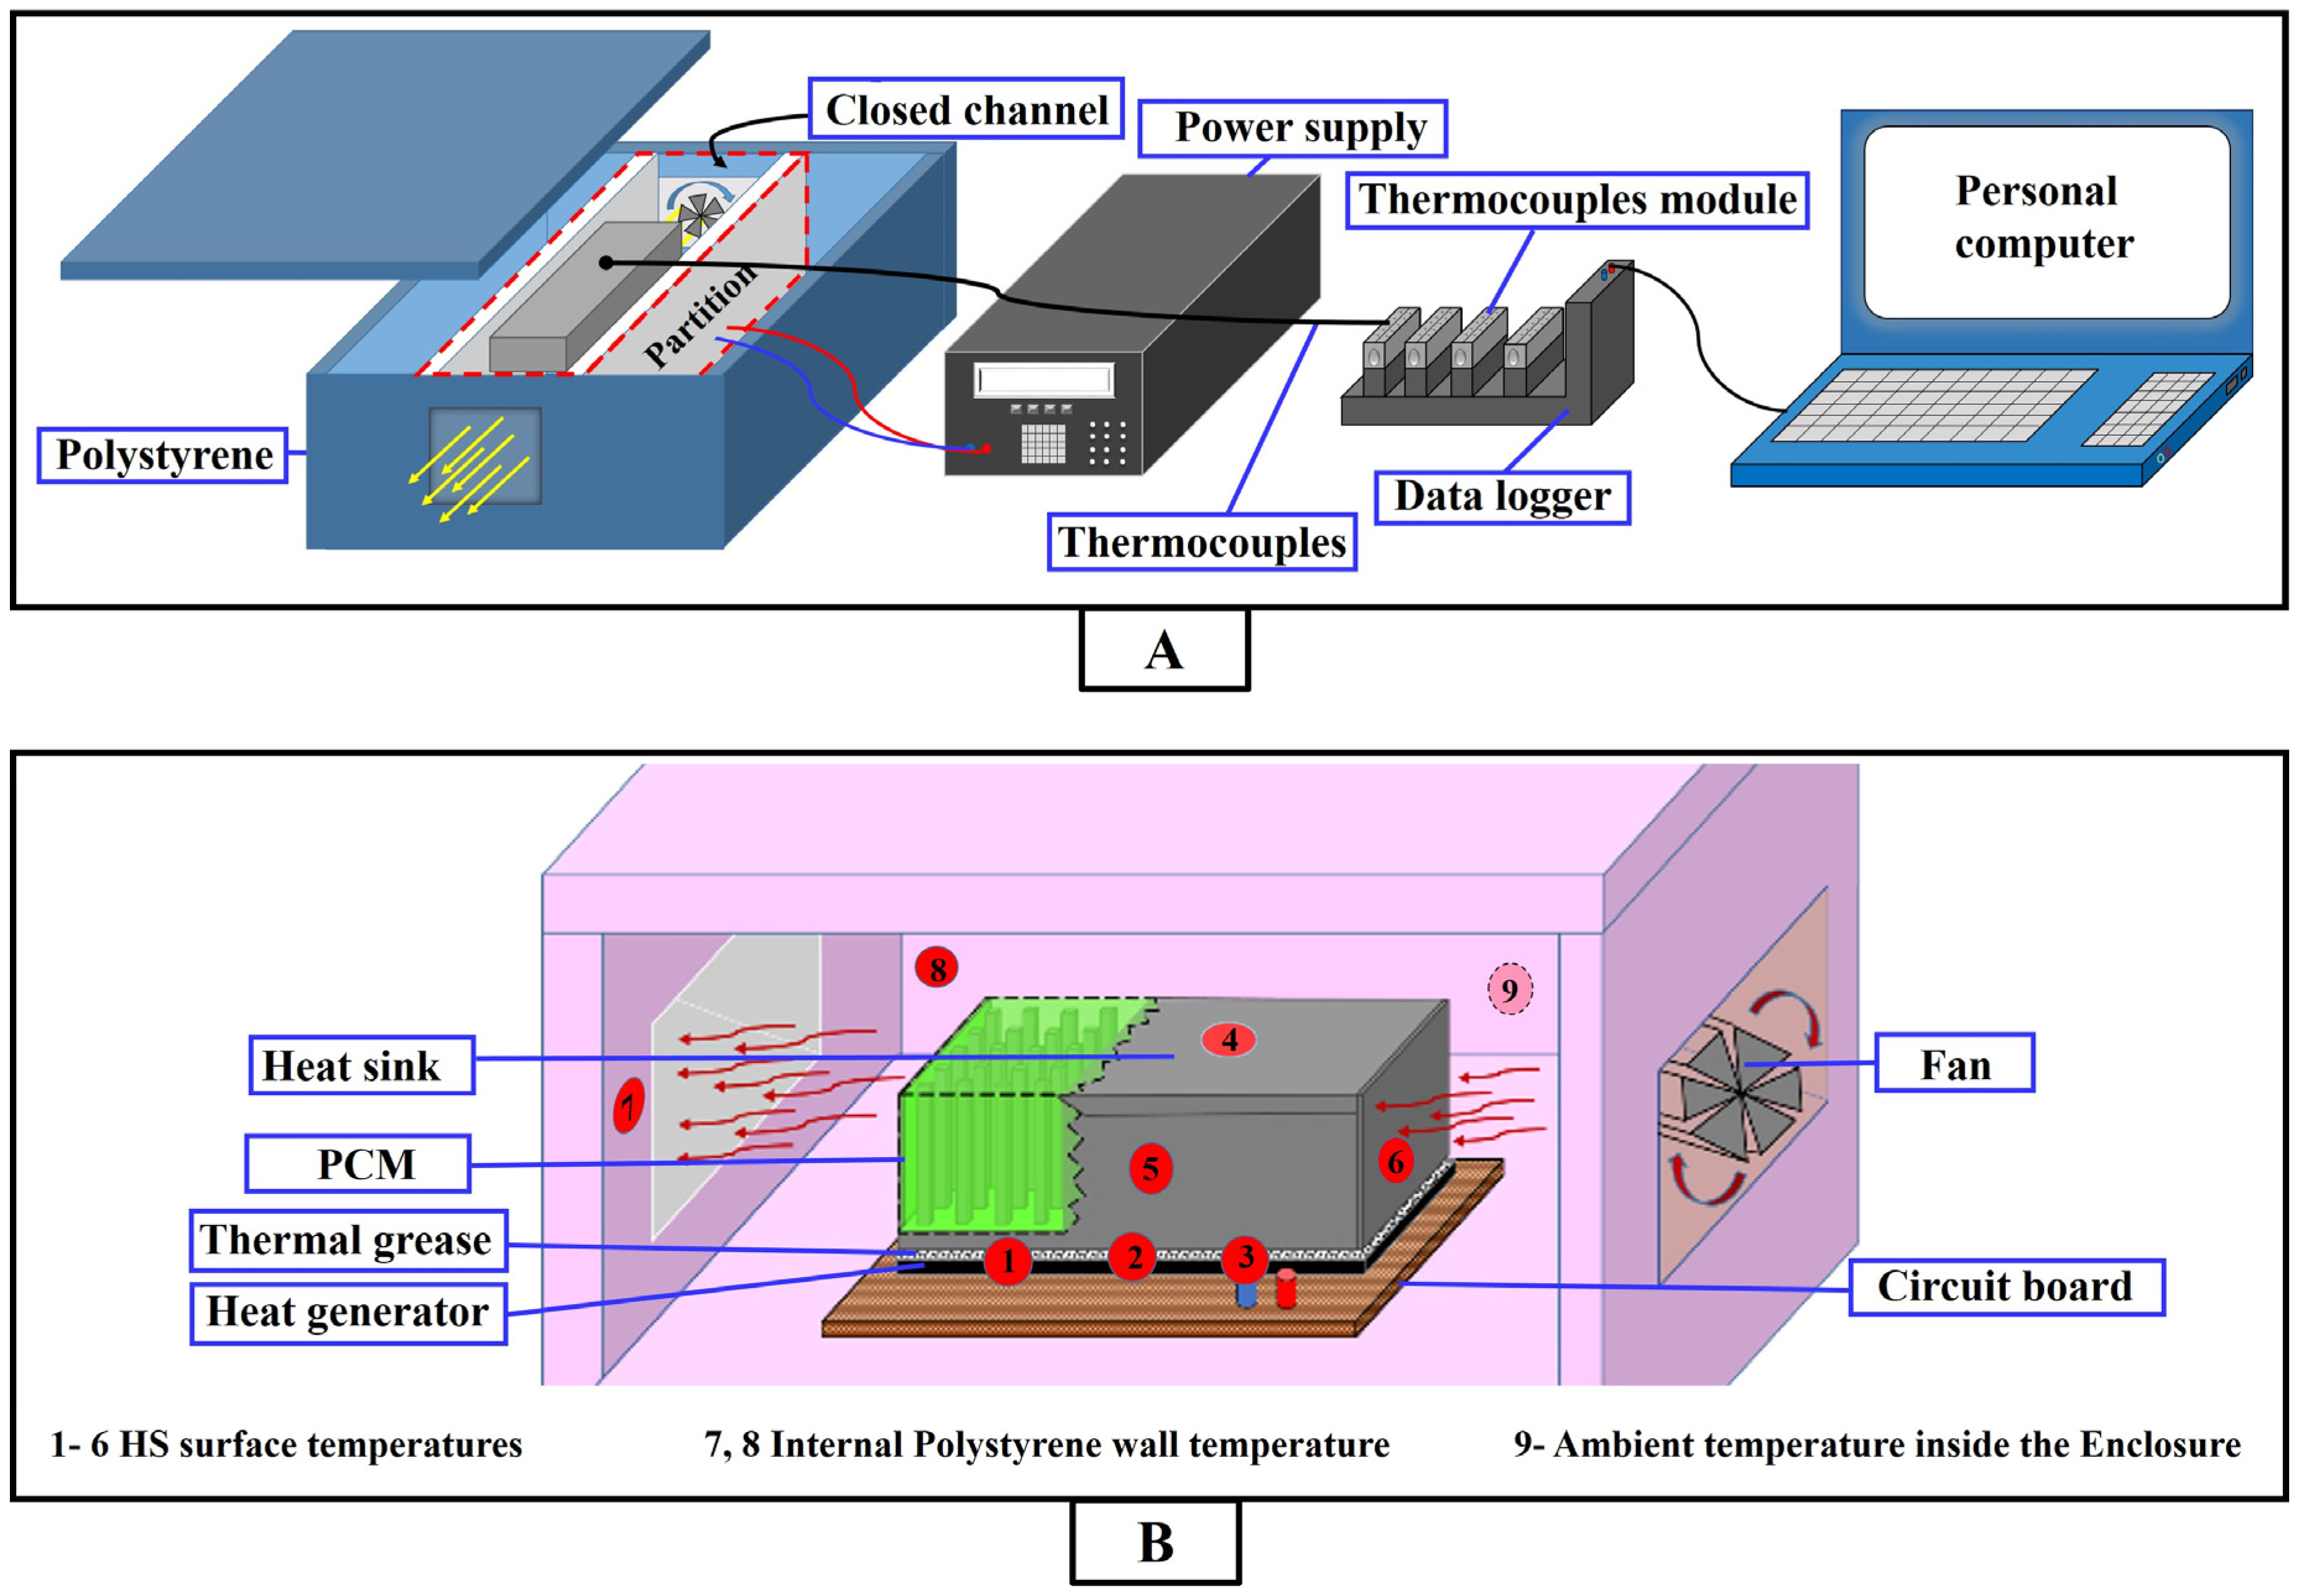
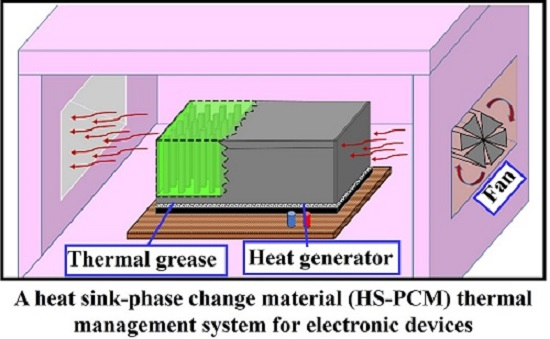
2.2.1. Experimental Setup
2.2.2. Experimental Procedure
2.2.3. Uncertainties of the Experimental Setup
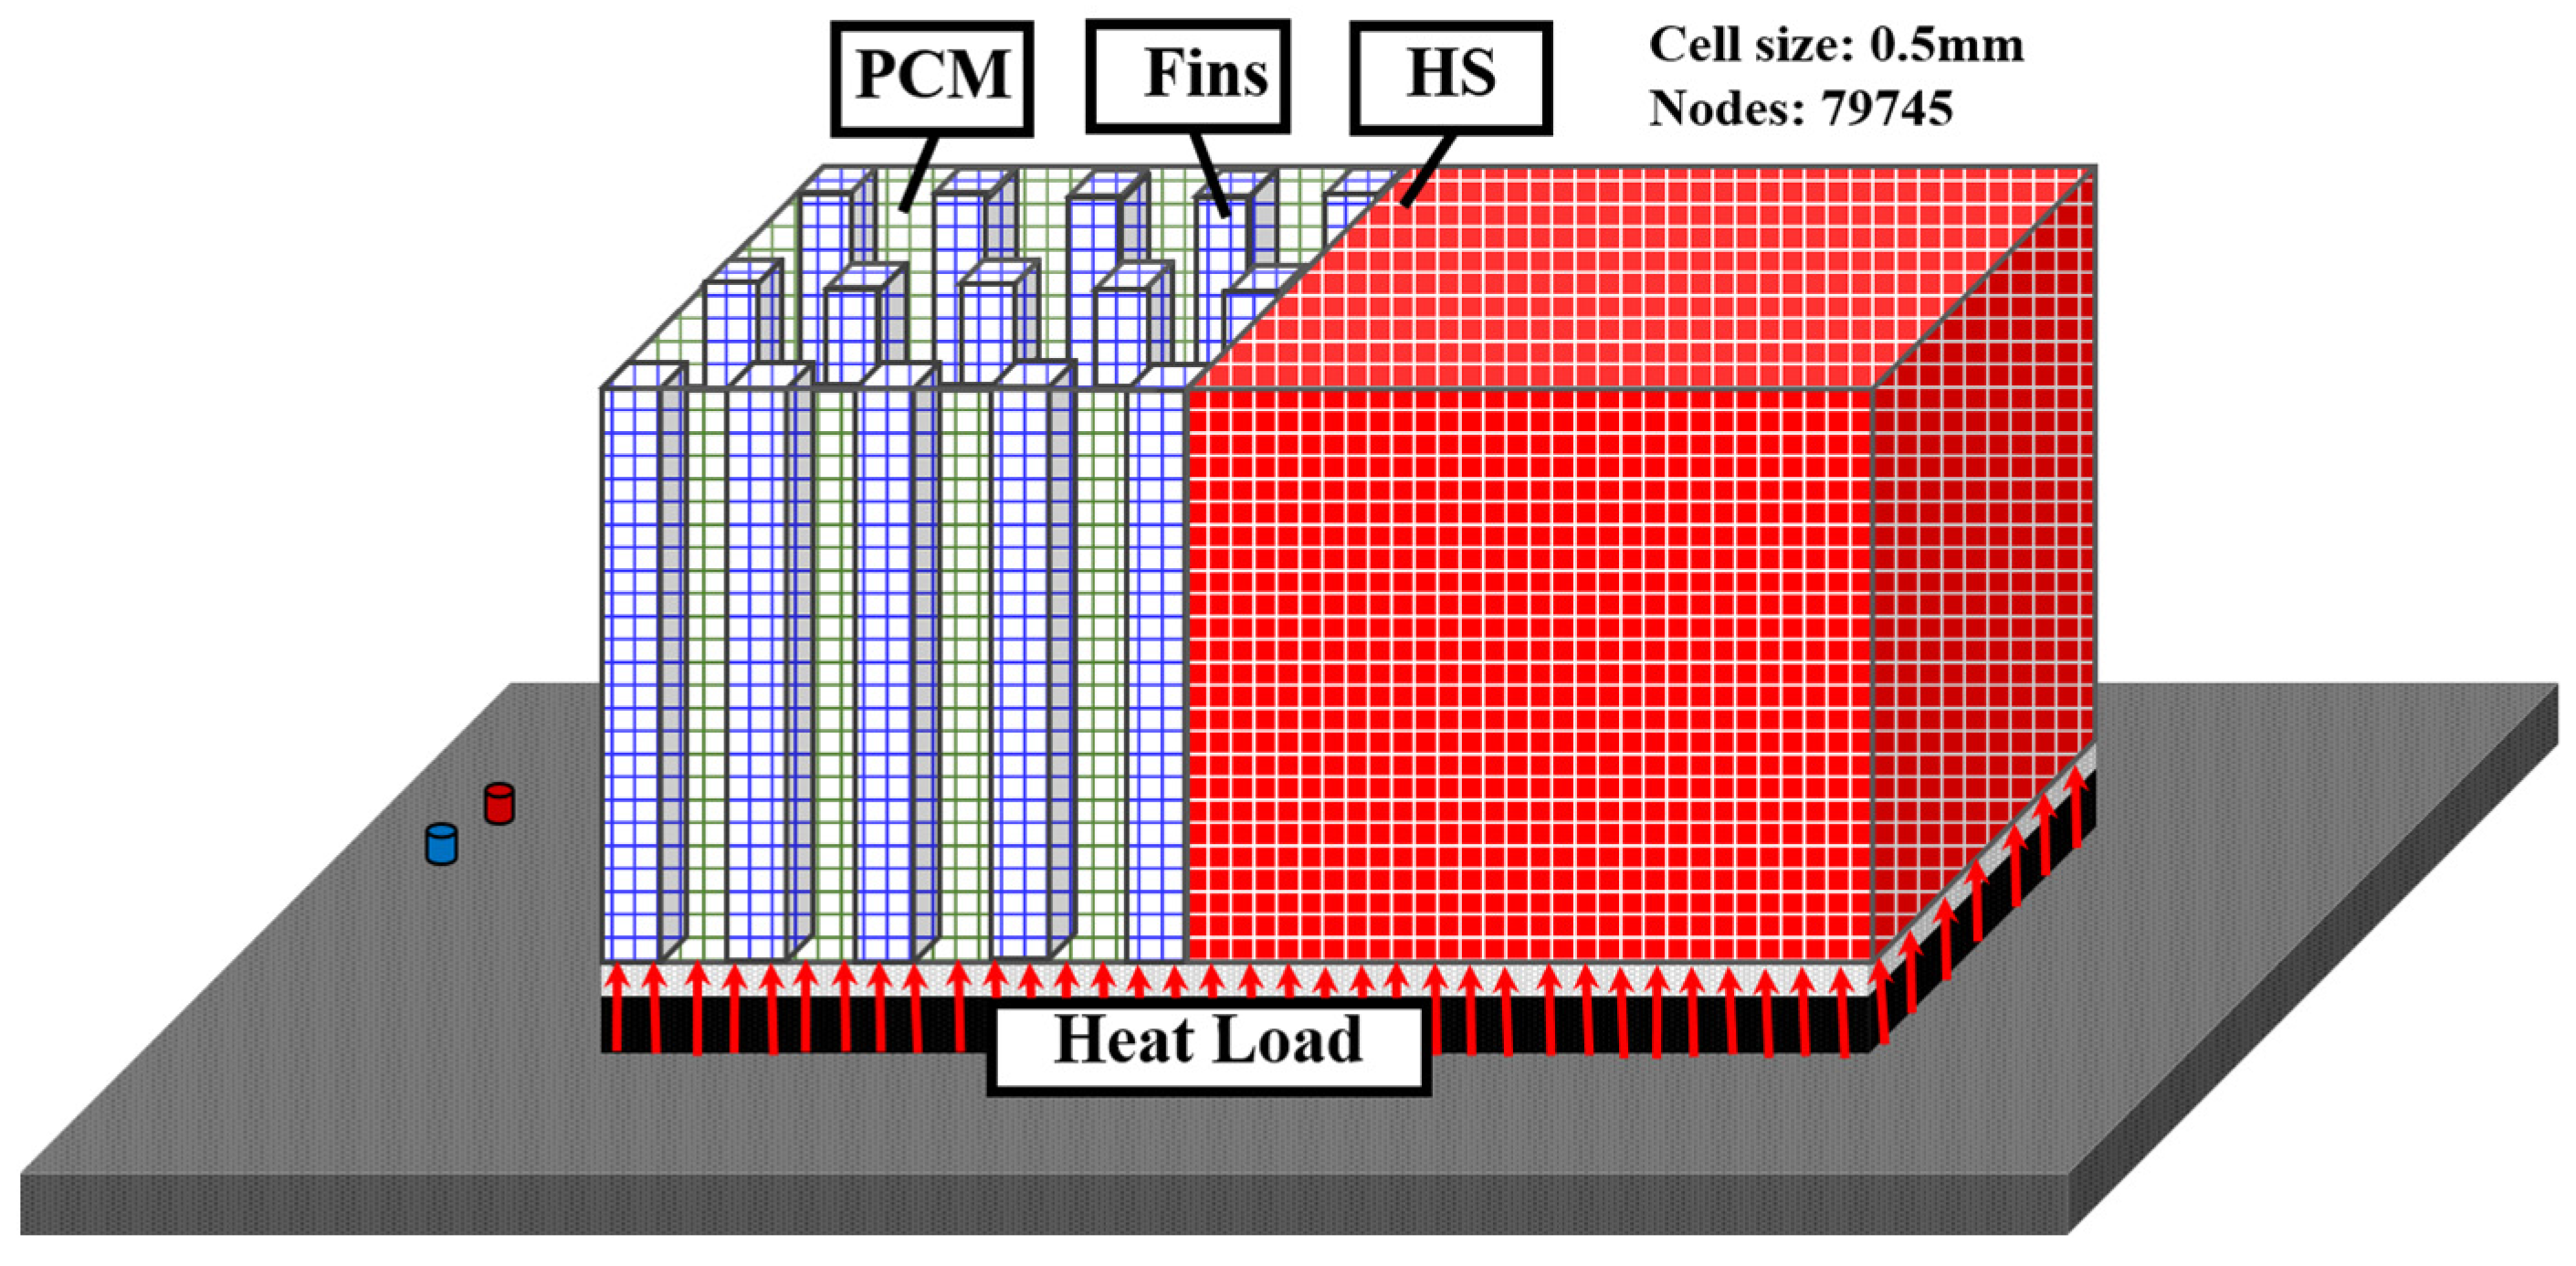
2.3. Numerical Simulation
2.3.1. Phase Change Modeling
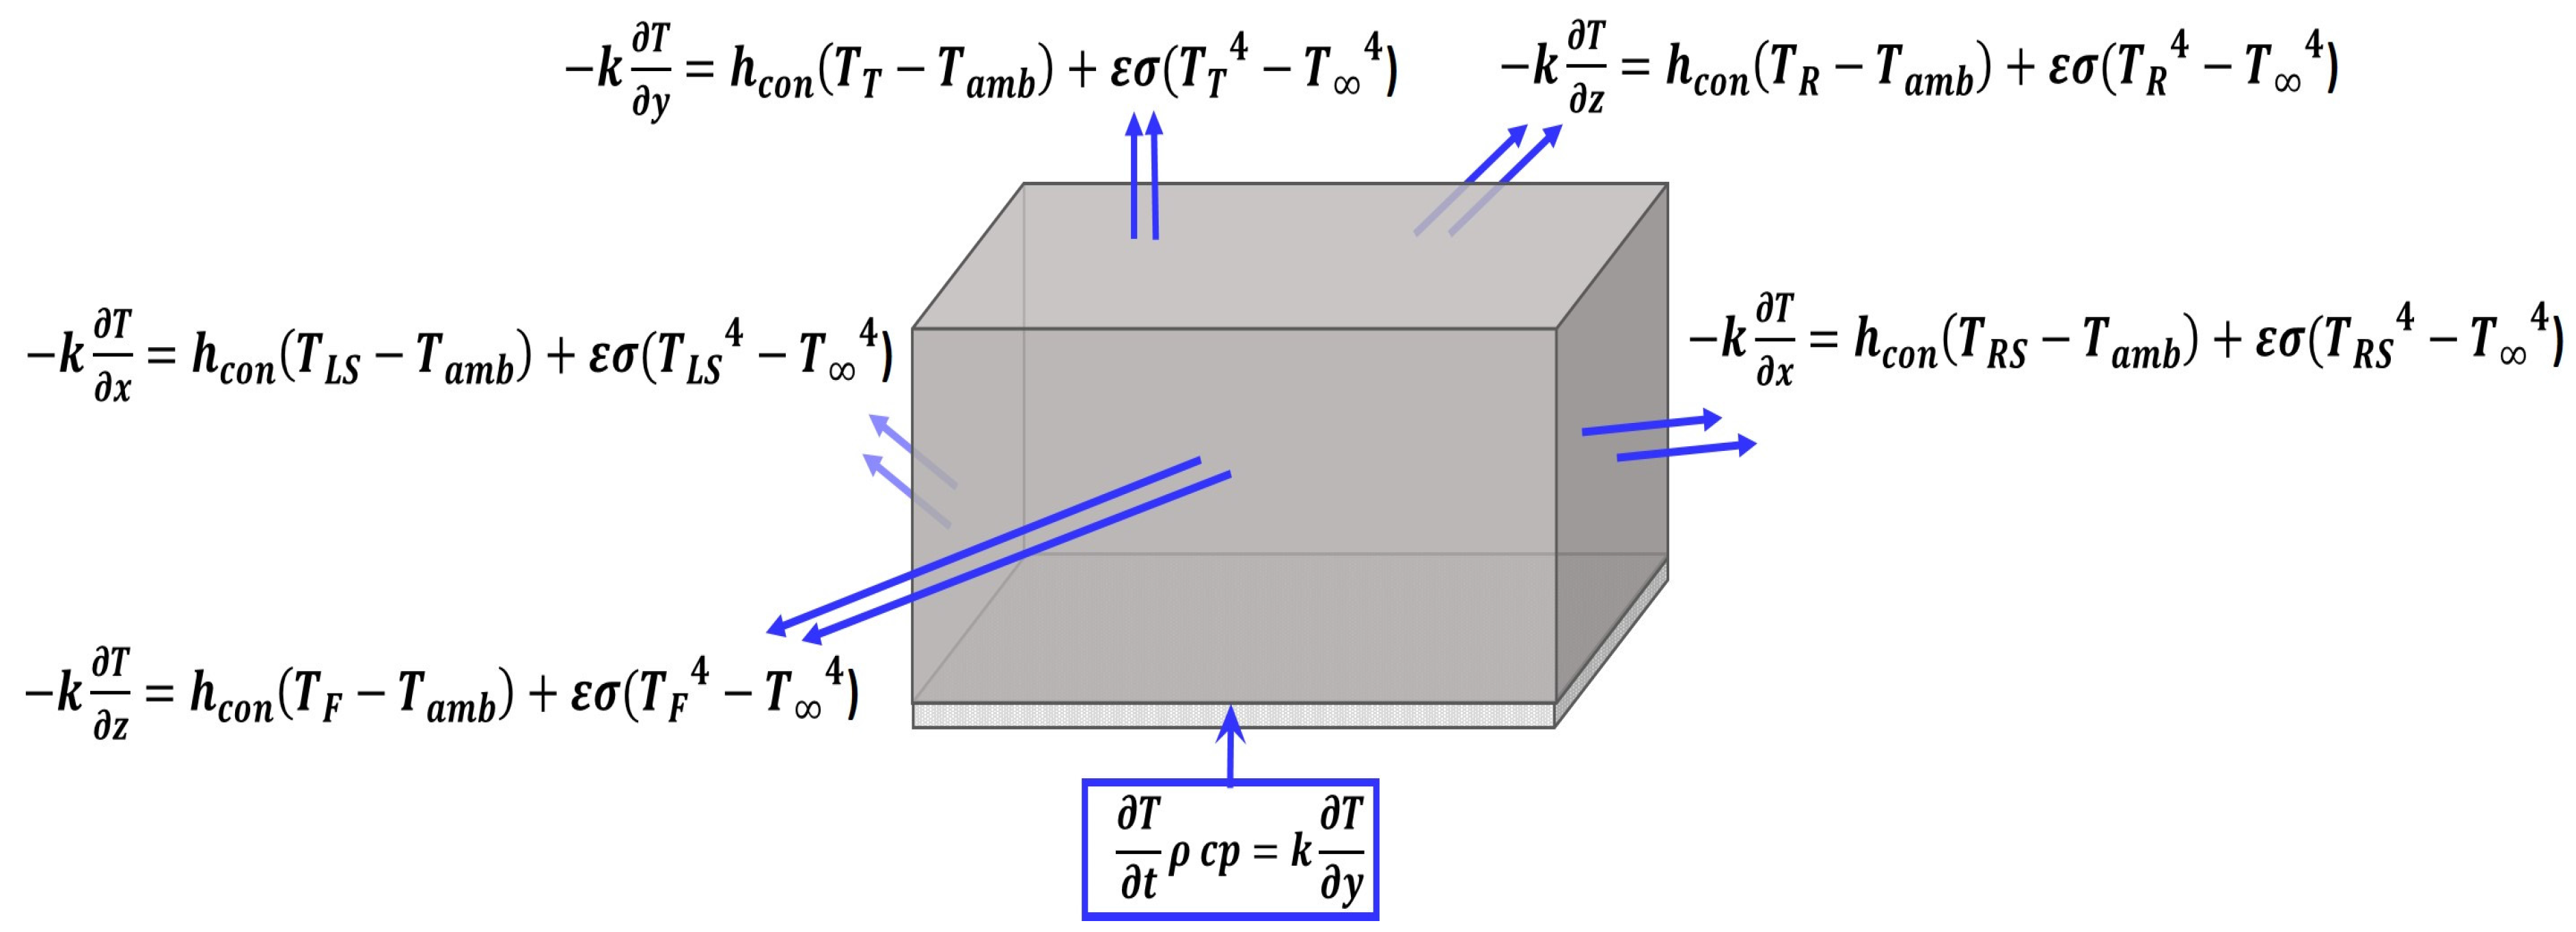
2.3.2. Thermal Boundary Conditions
3. Results and Discussion
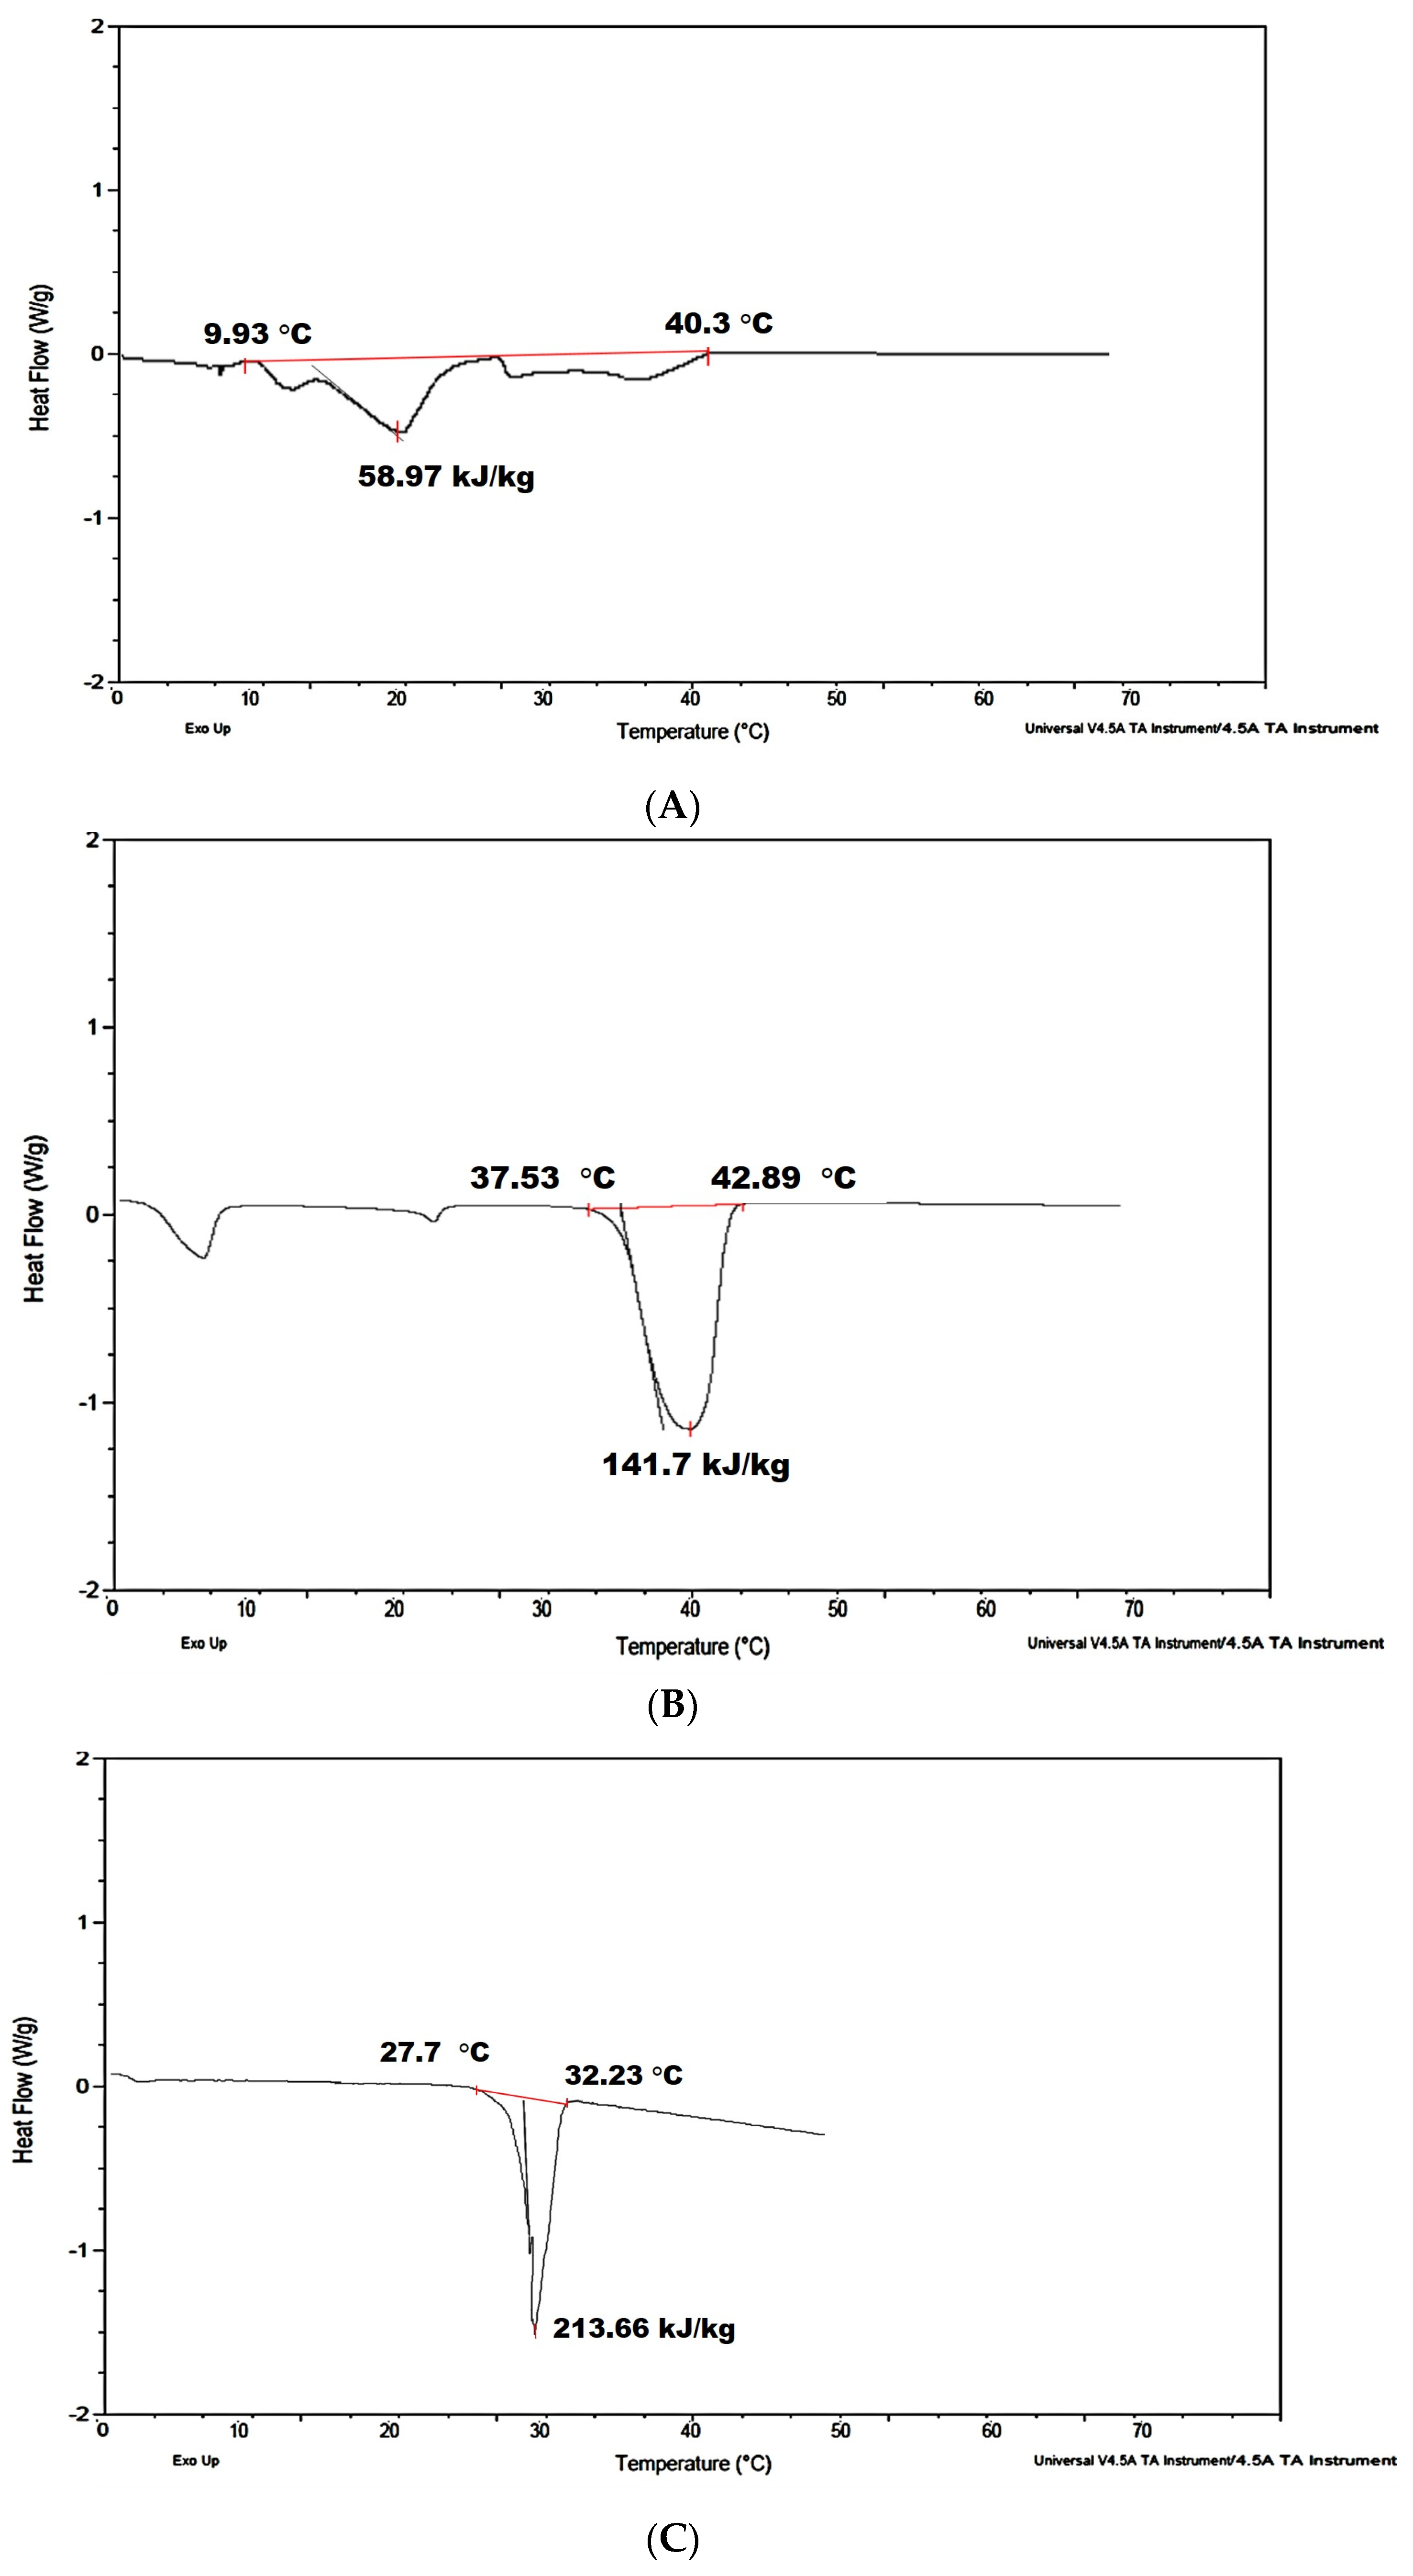
3.1. Material Thermo-Physical Characterization
3.2. Thermal Management Experiment
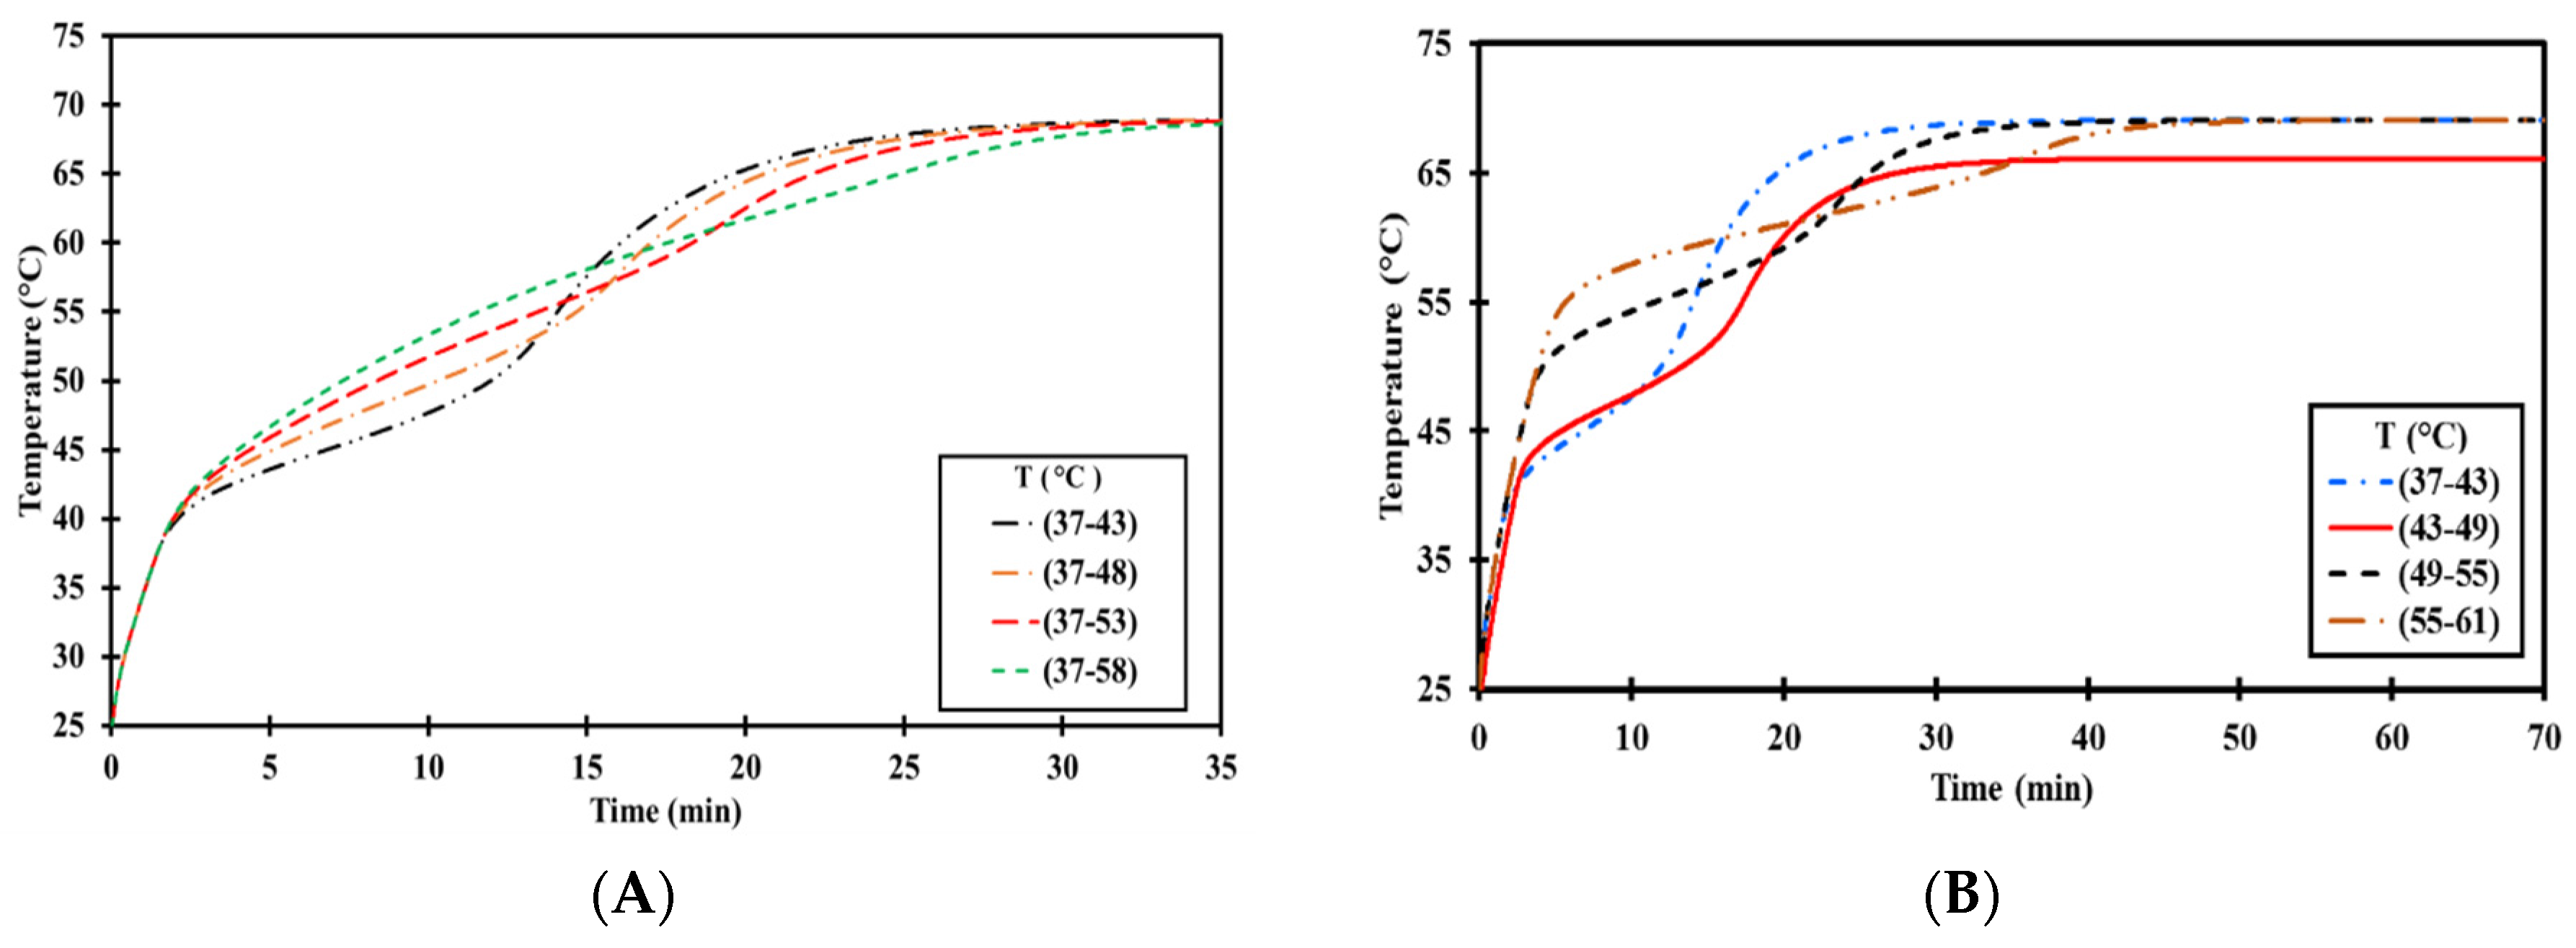
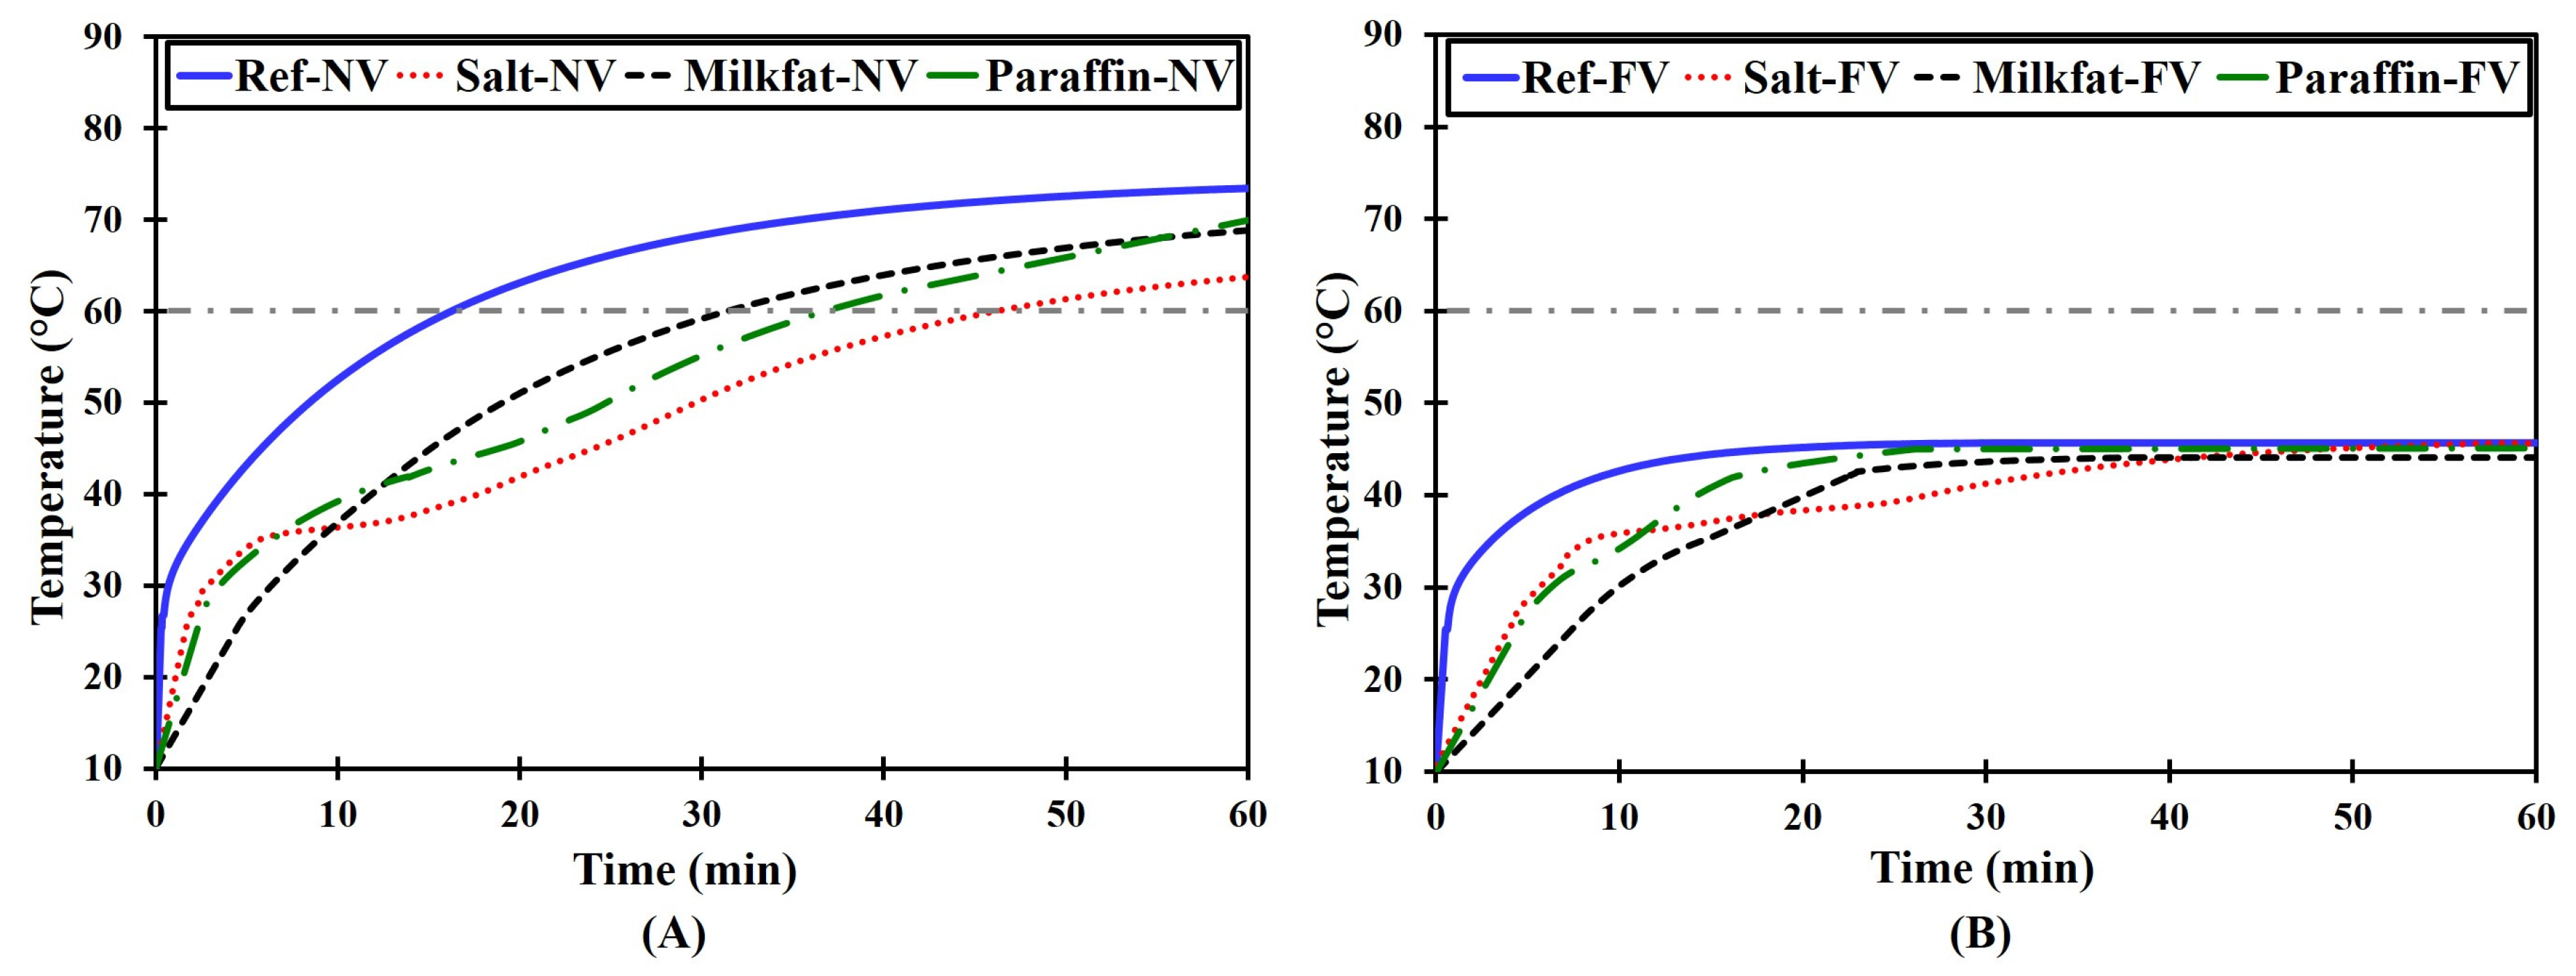
3.2.1. Heating Run
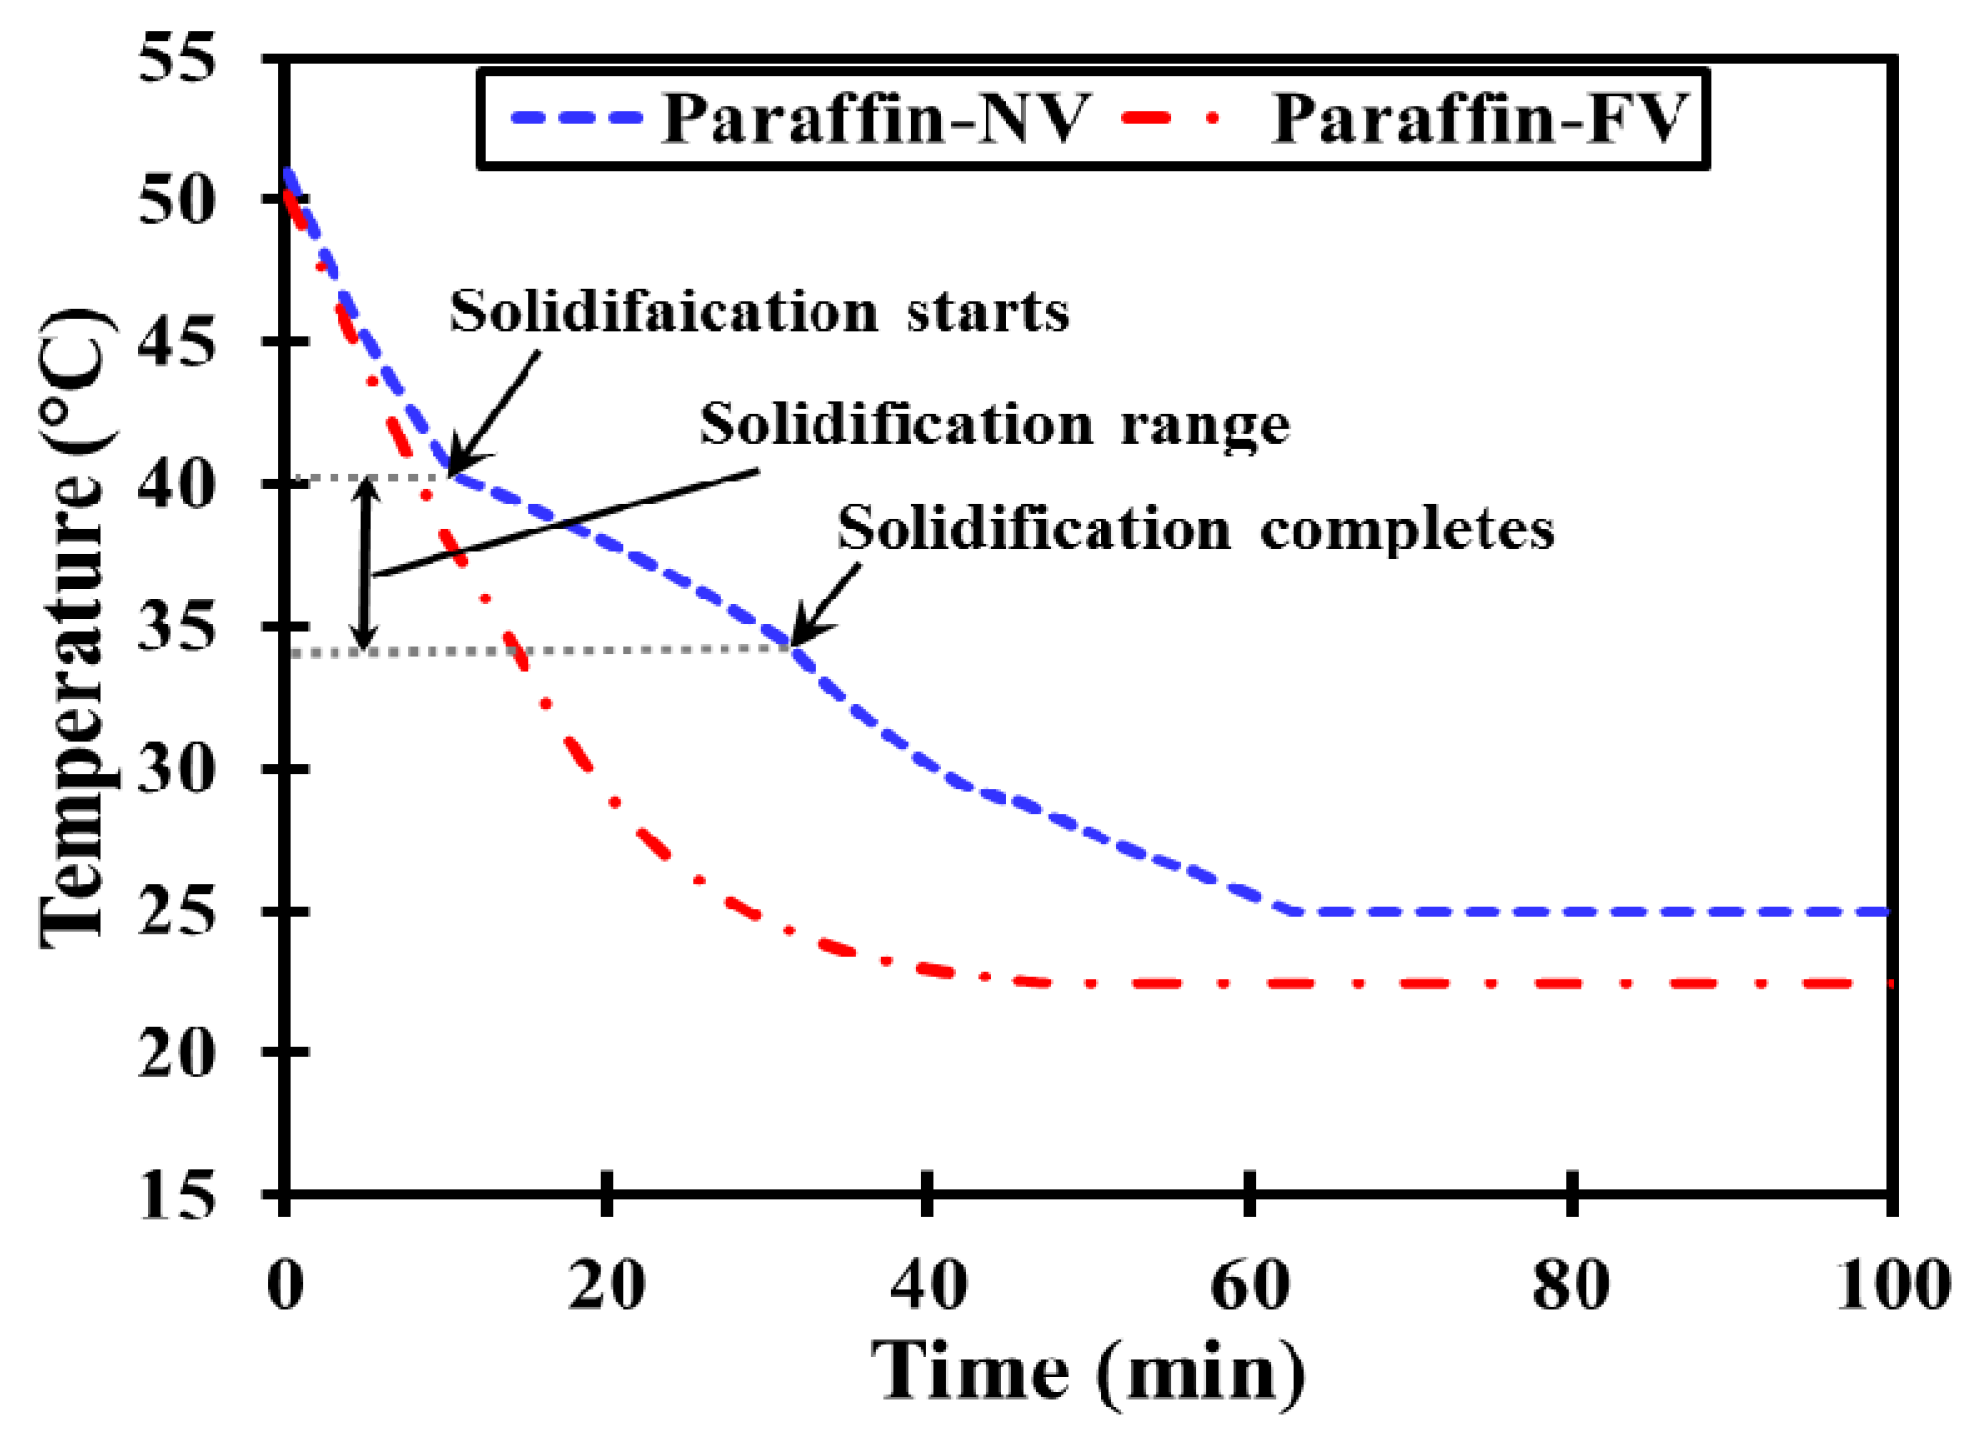
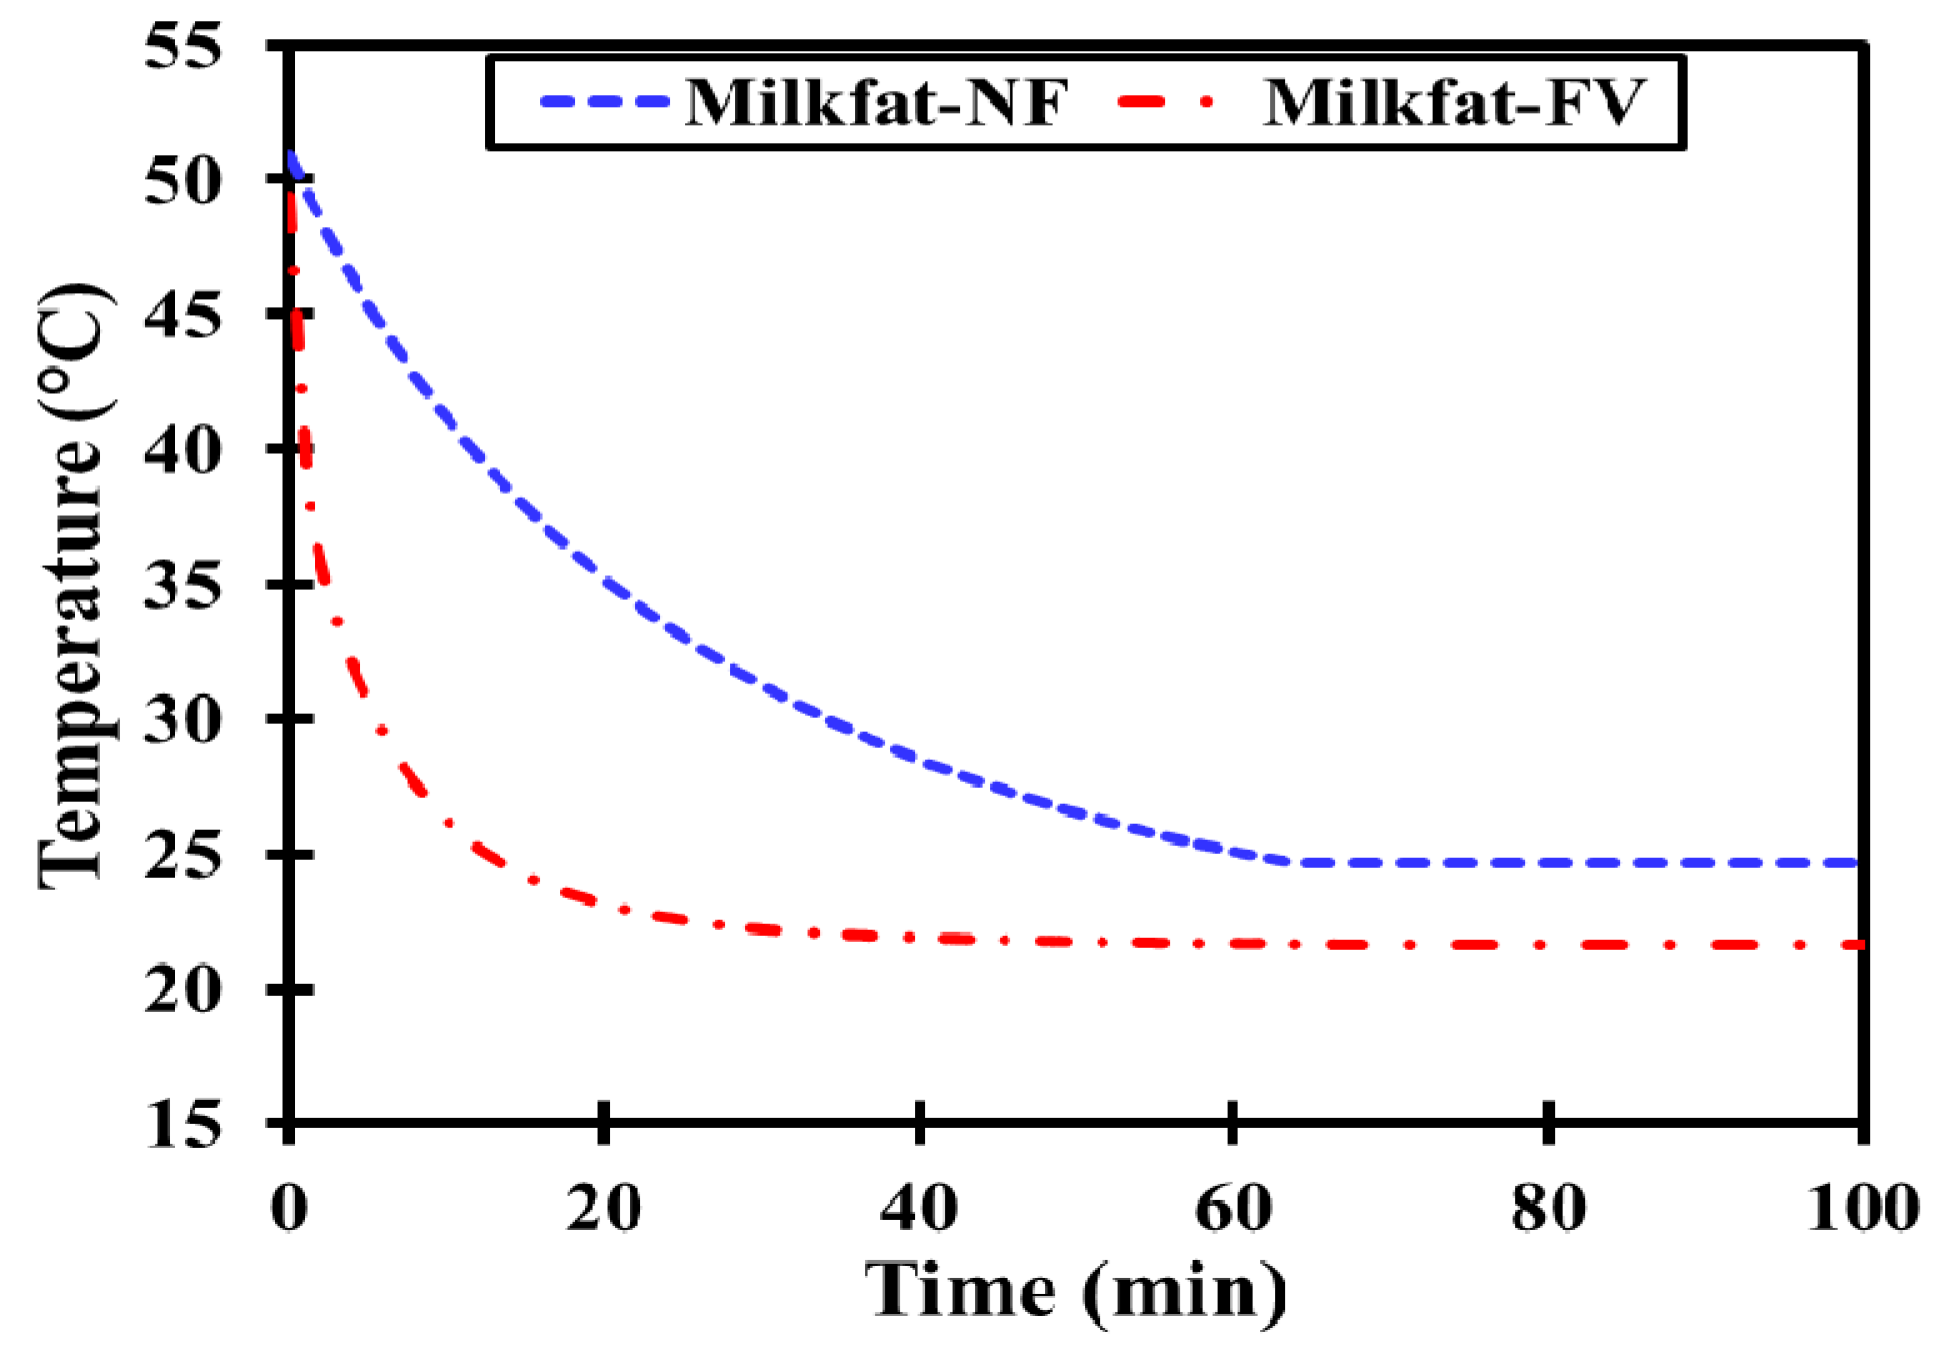
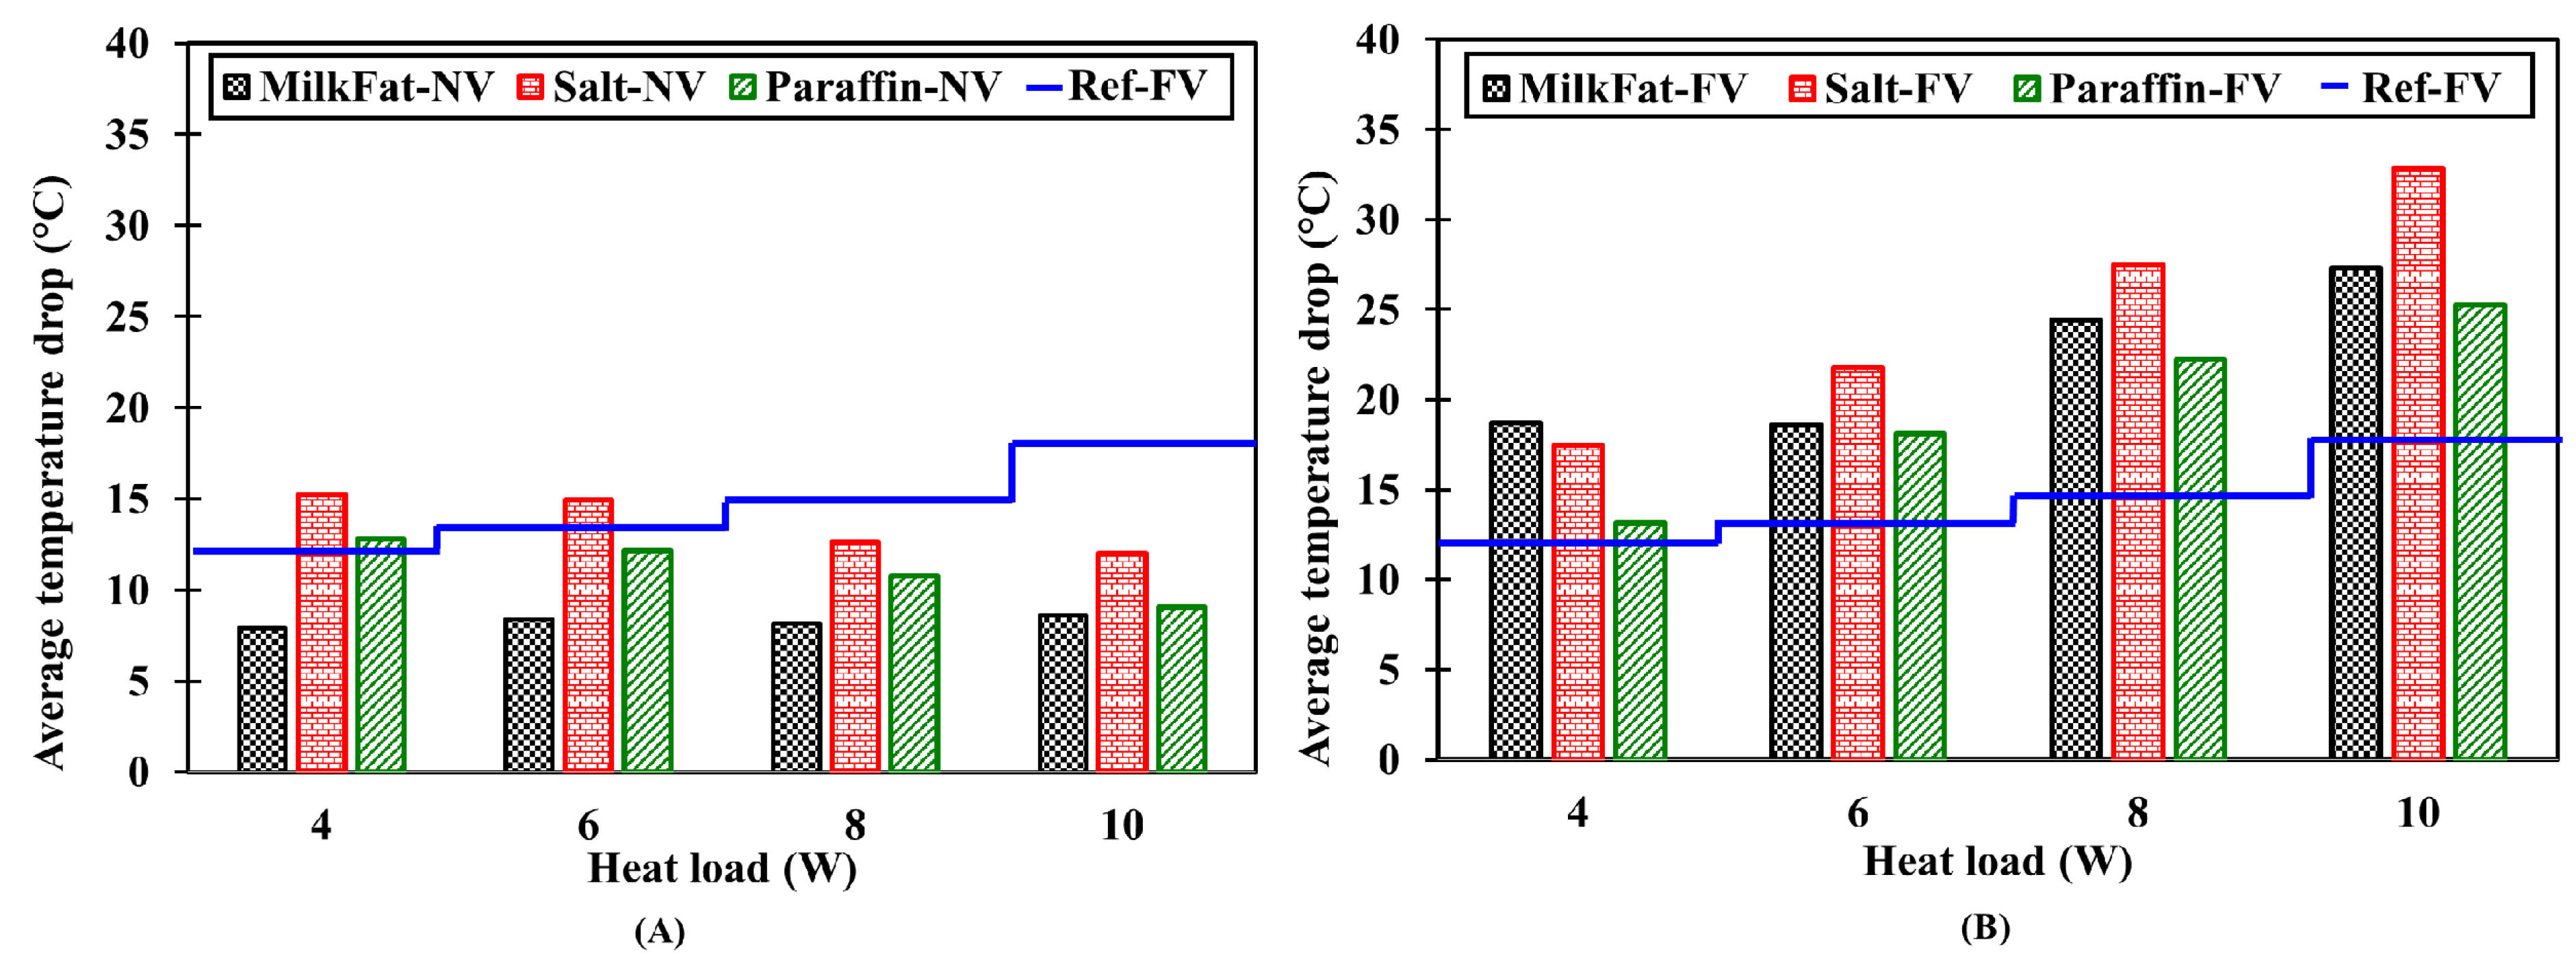
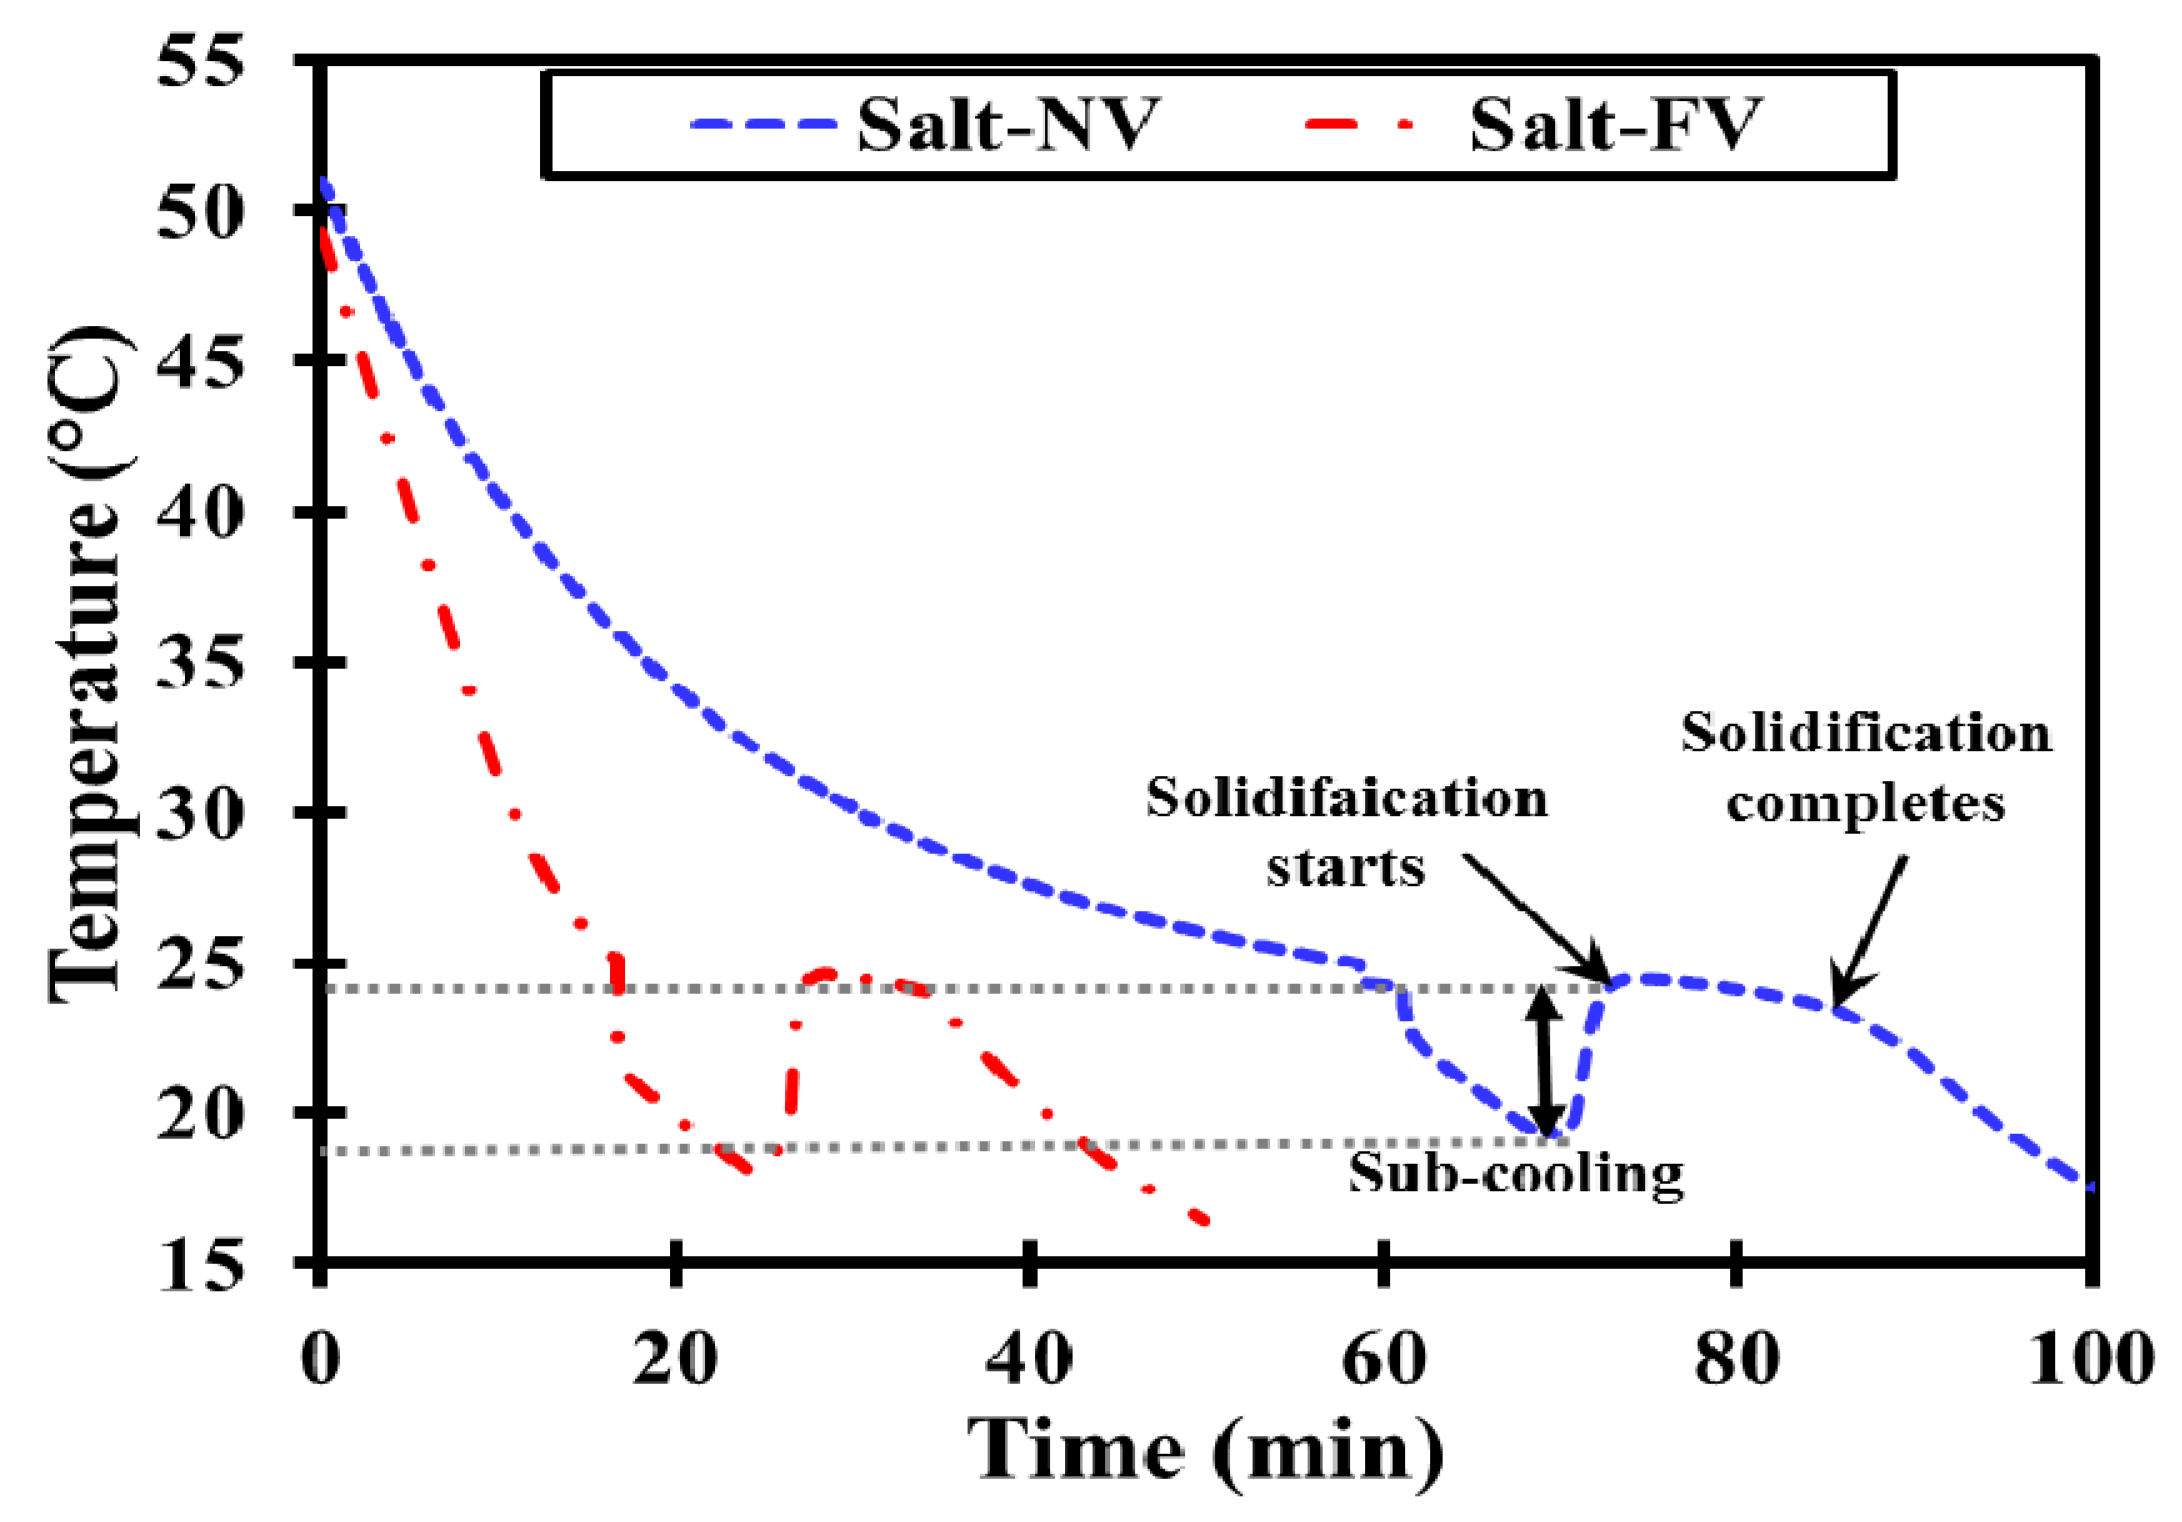
3.2.2. Cooling Run
3.3. Numerical Results
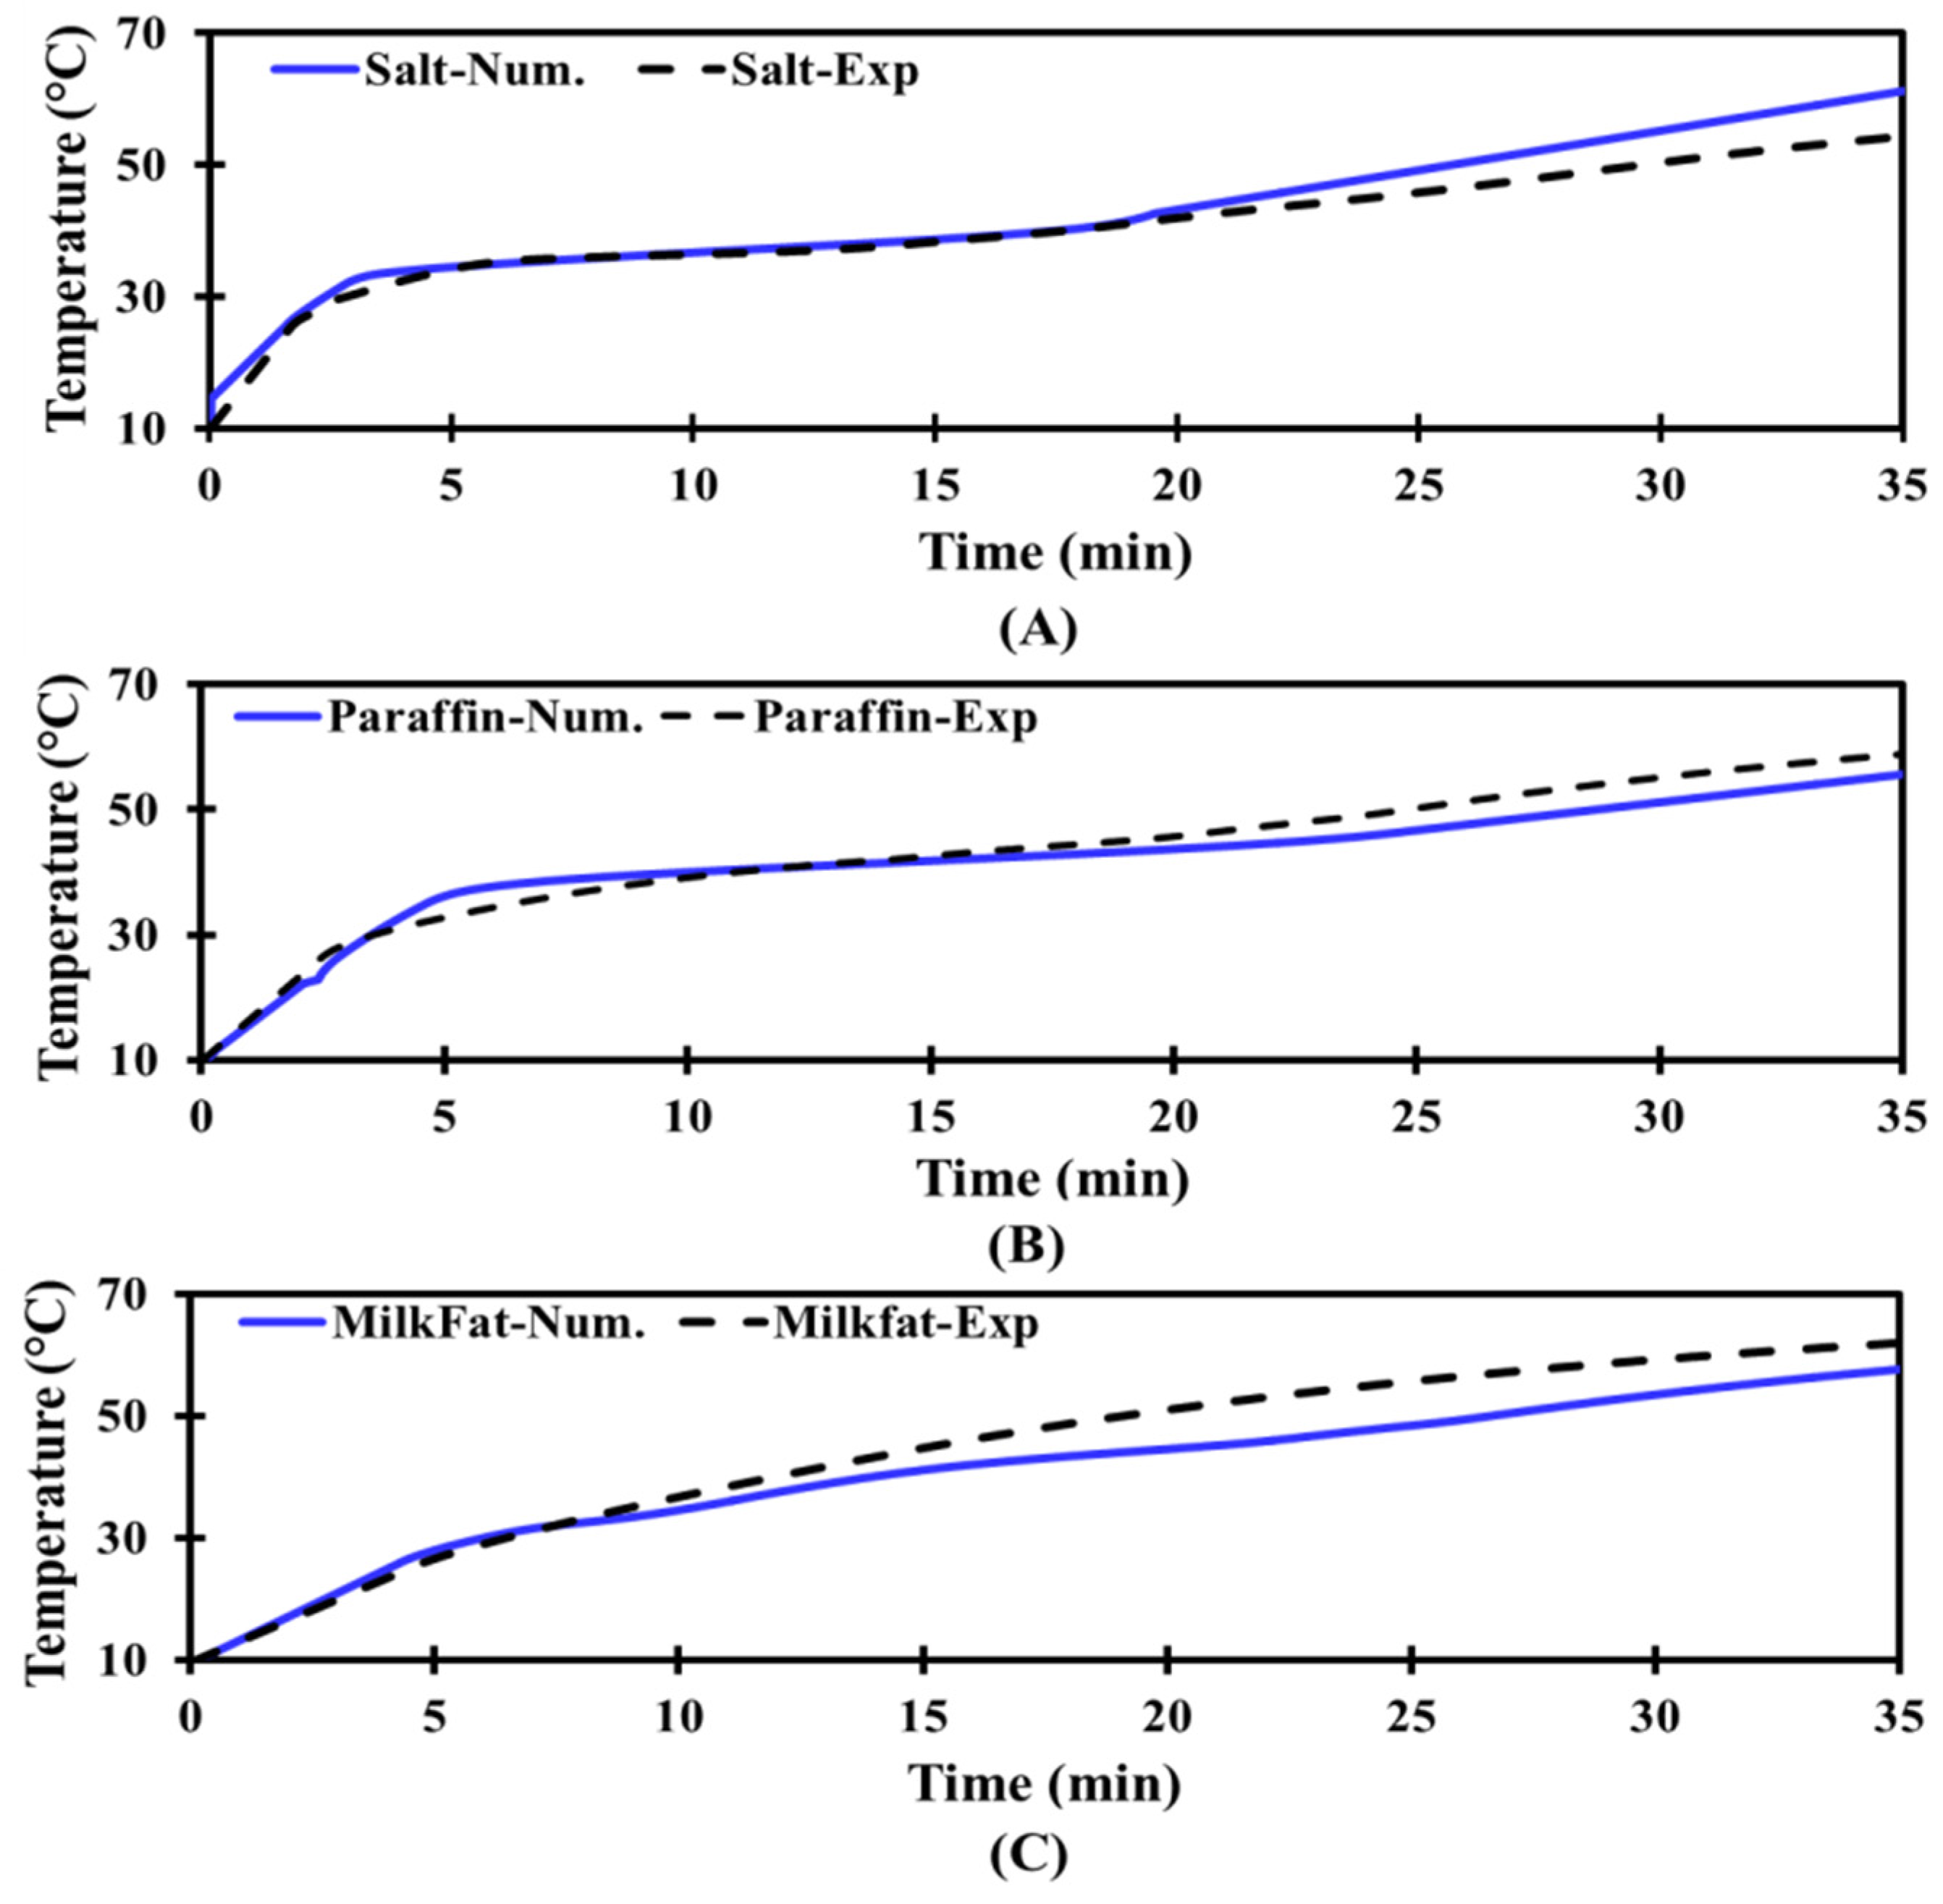
3.3.1. Numerical Validation
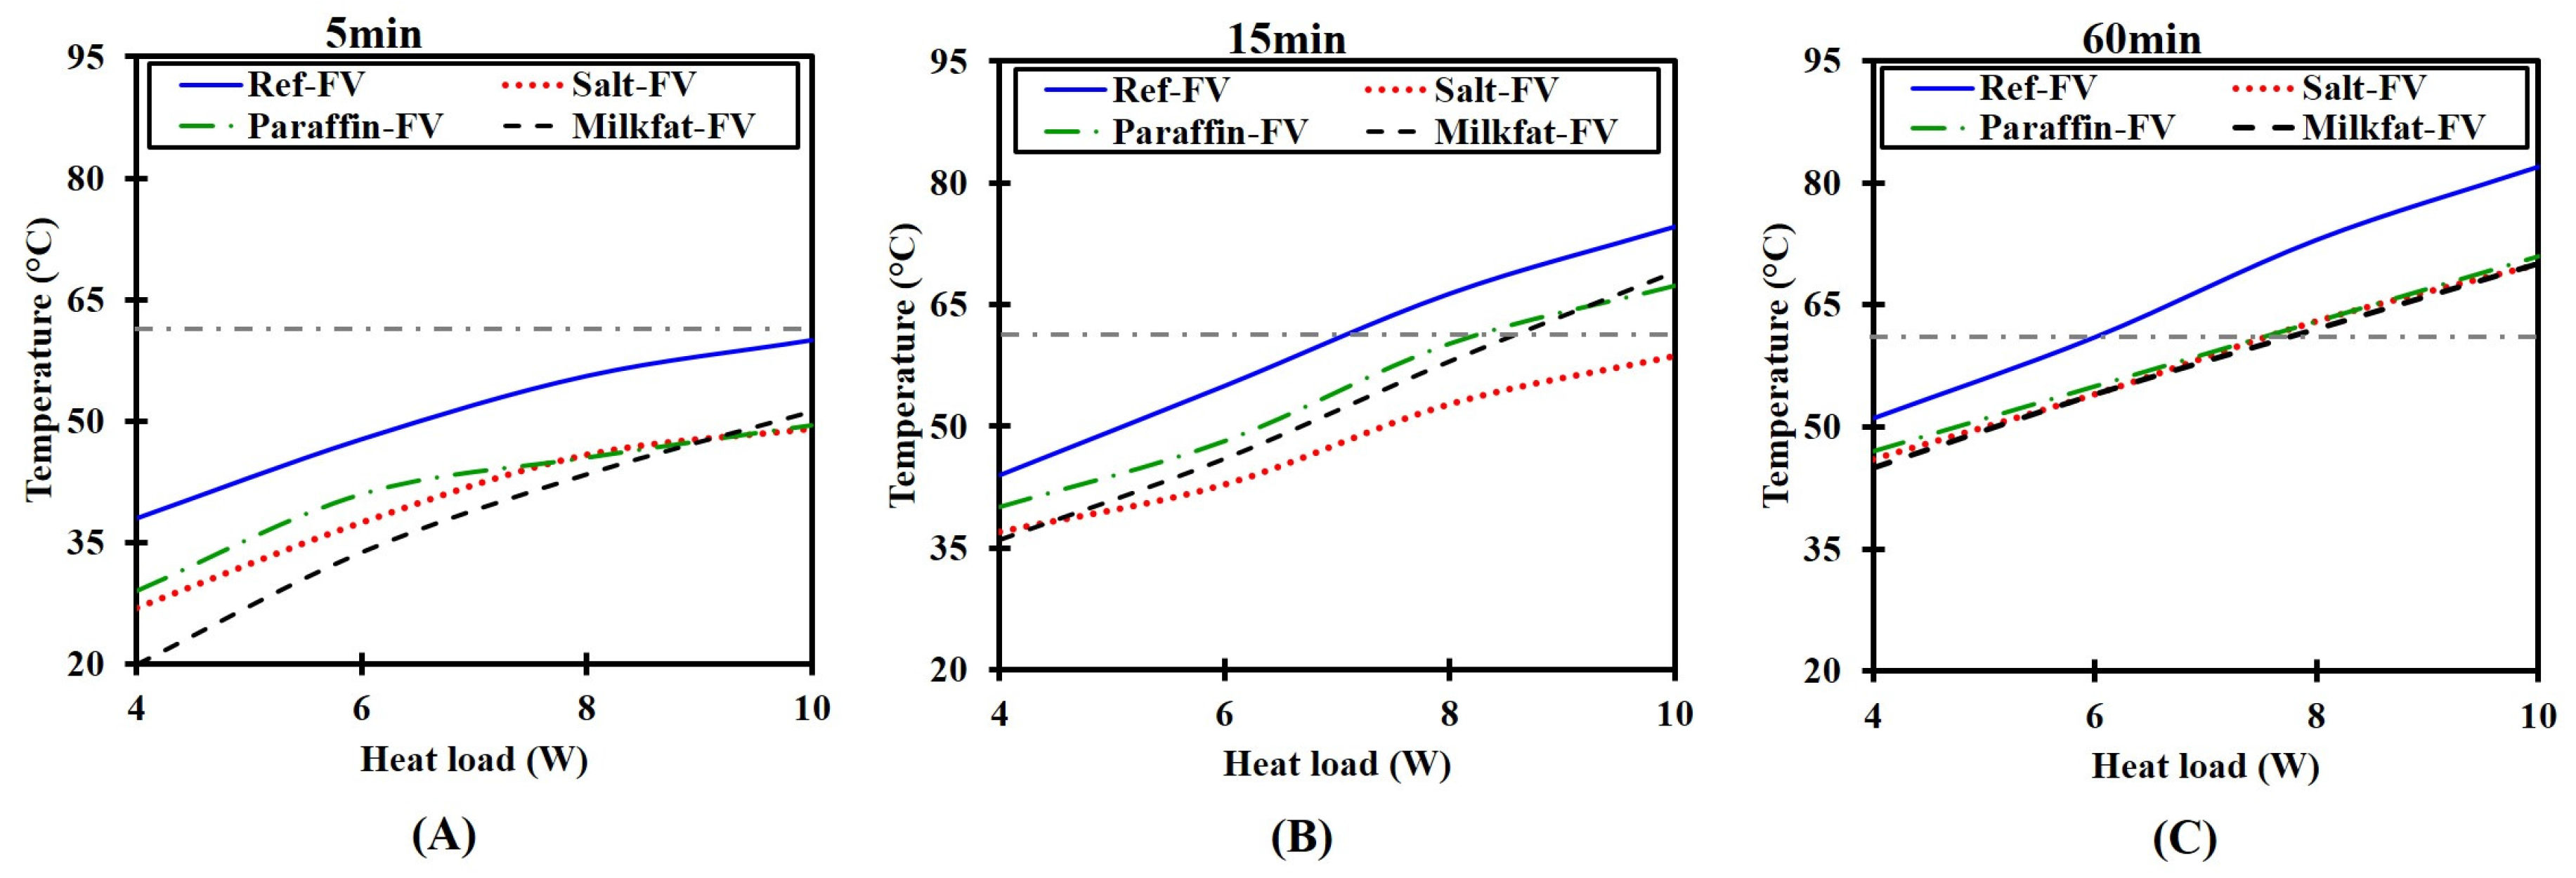
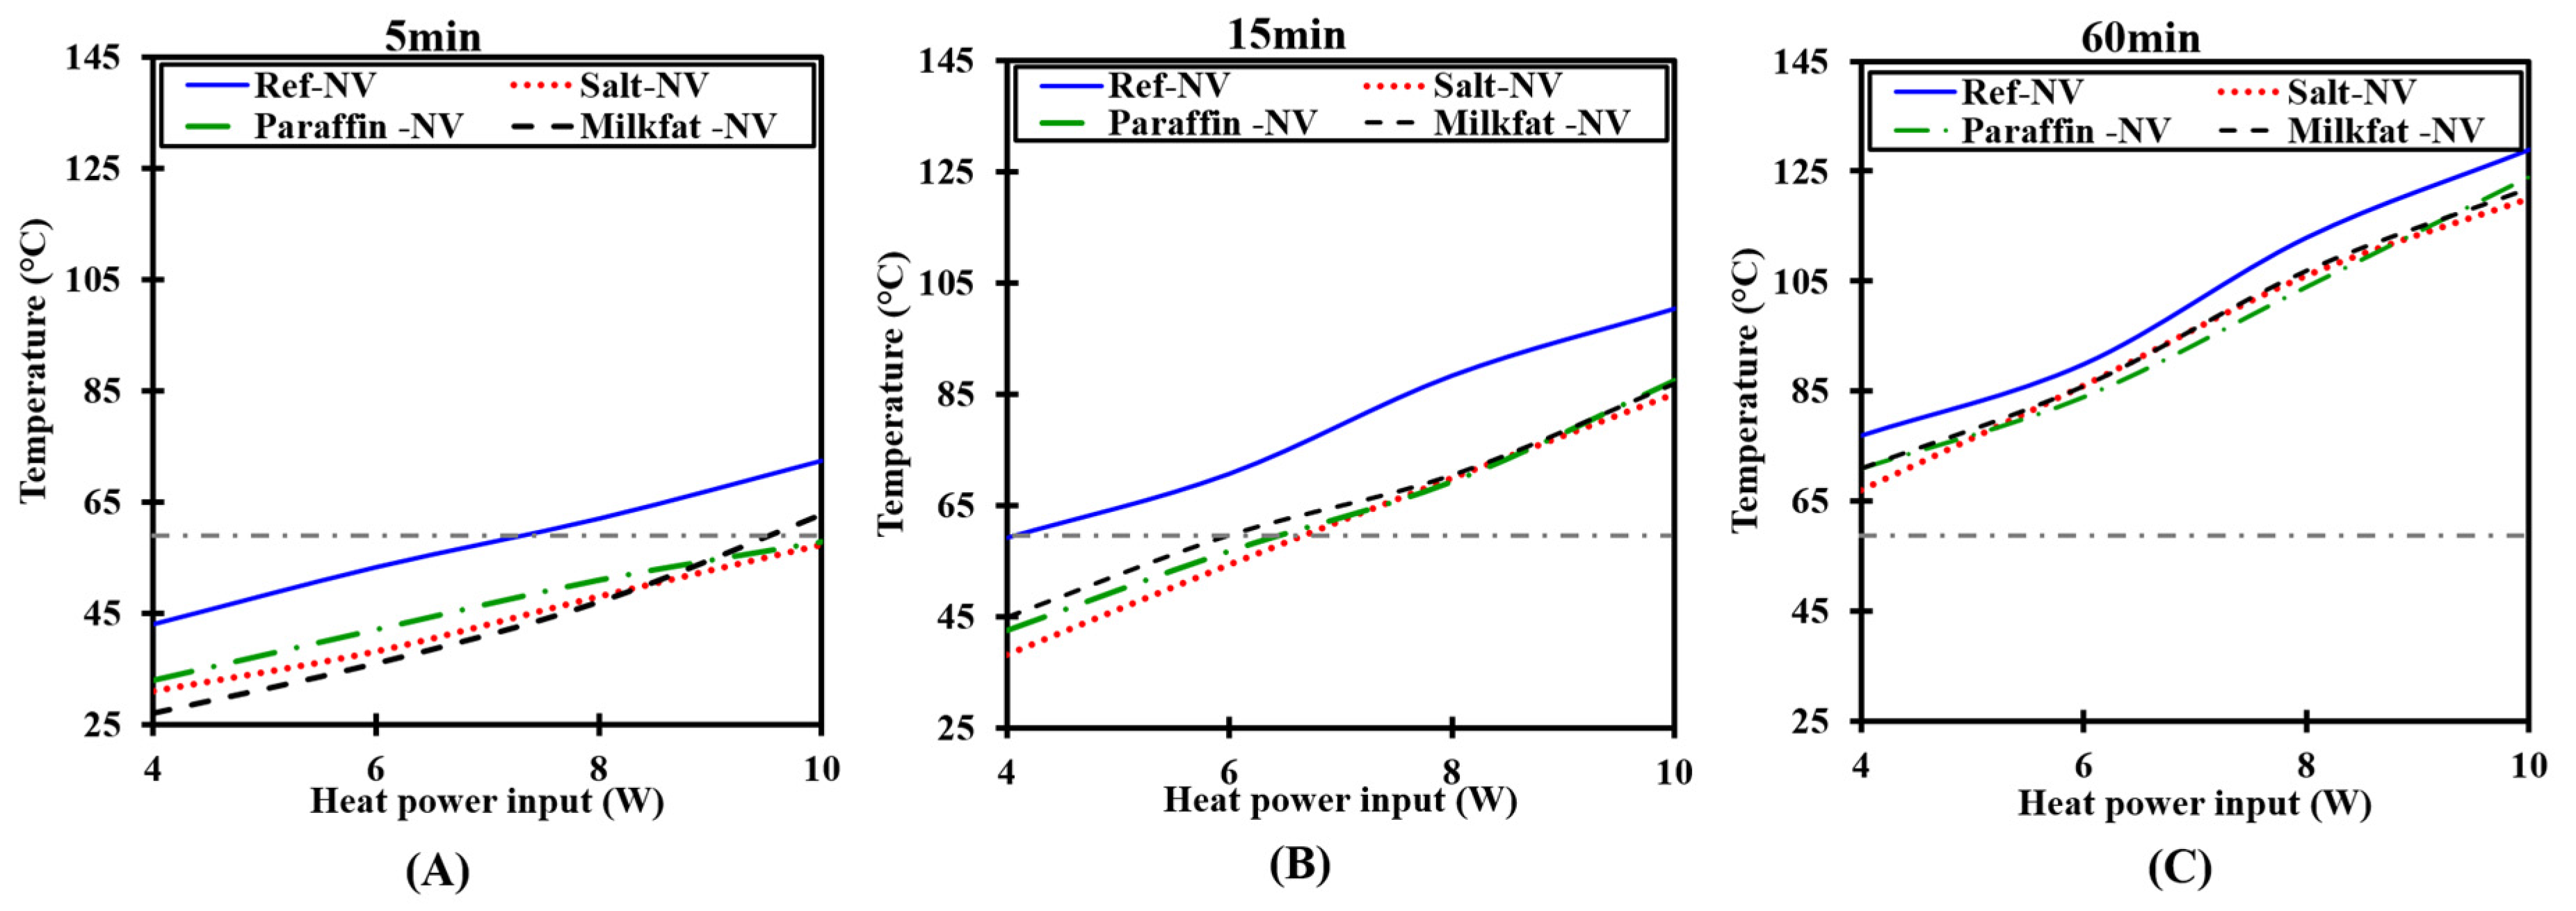
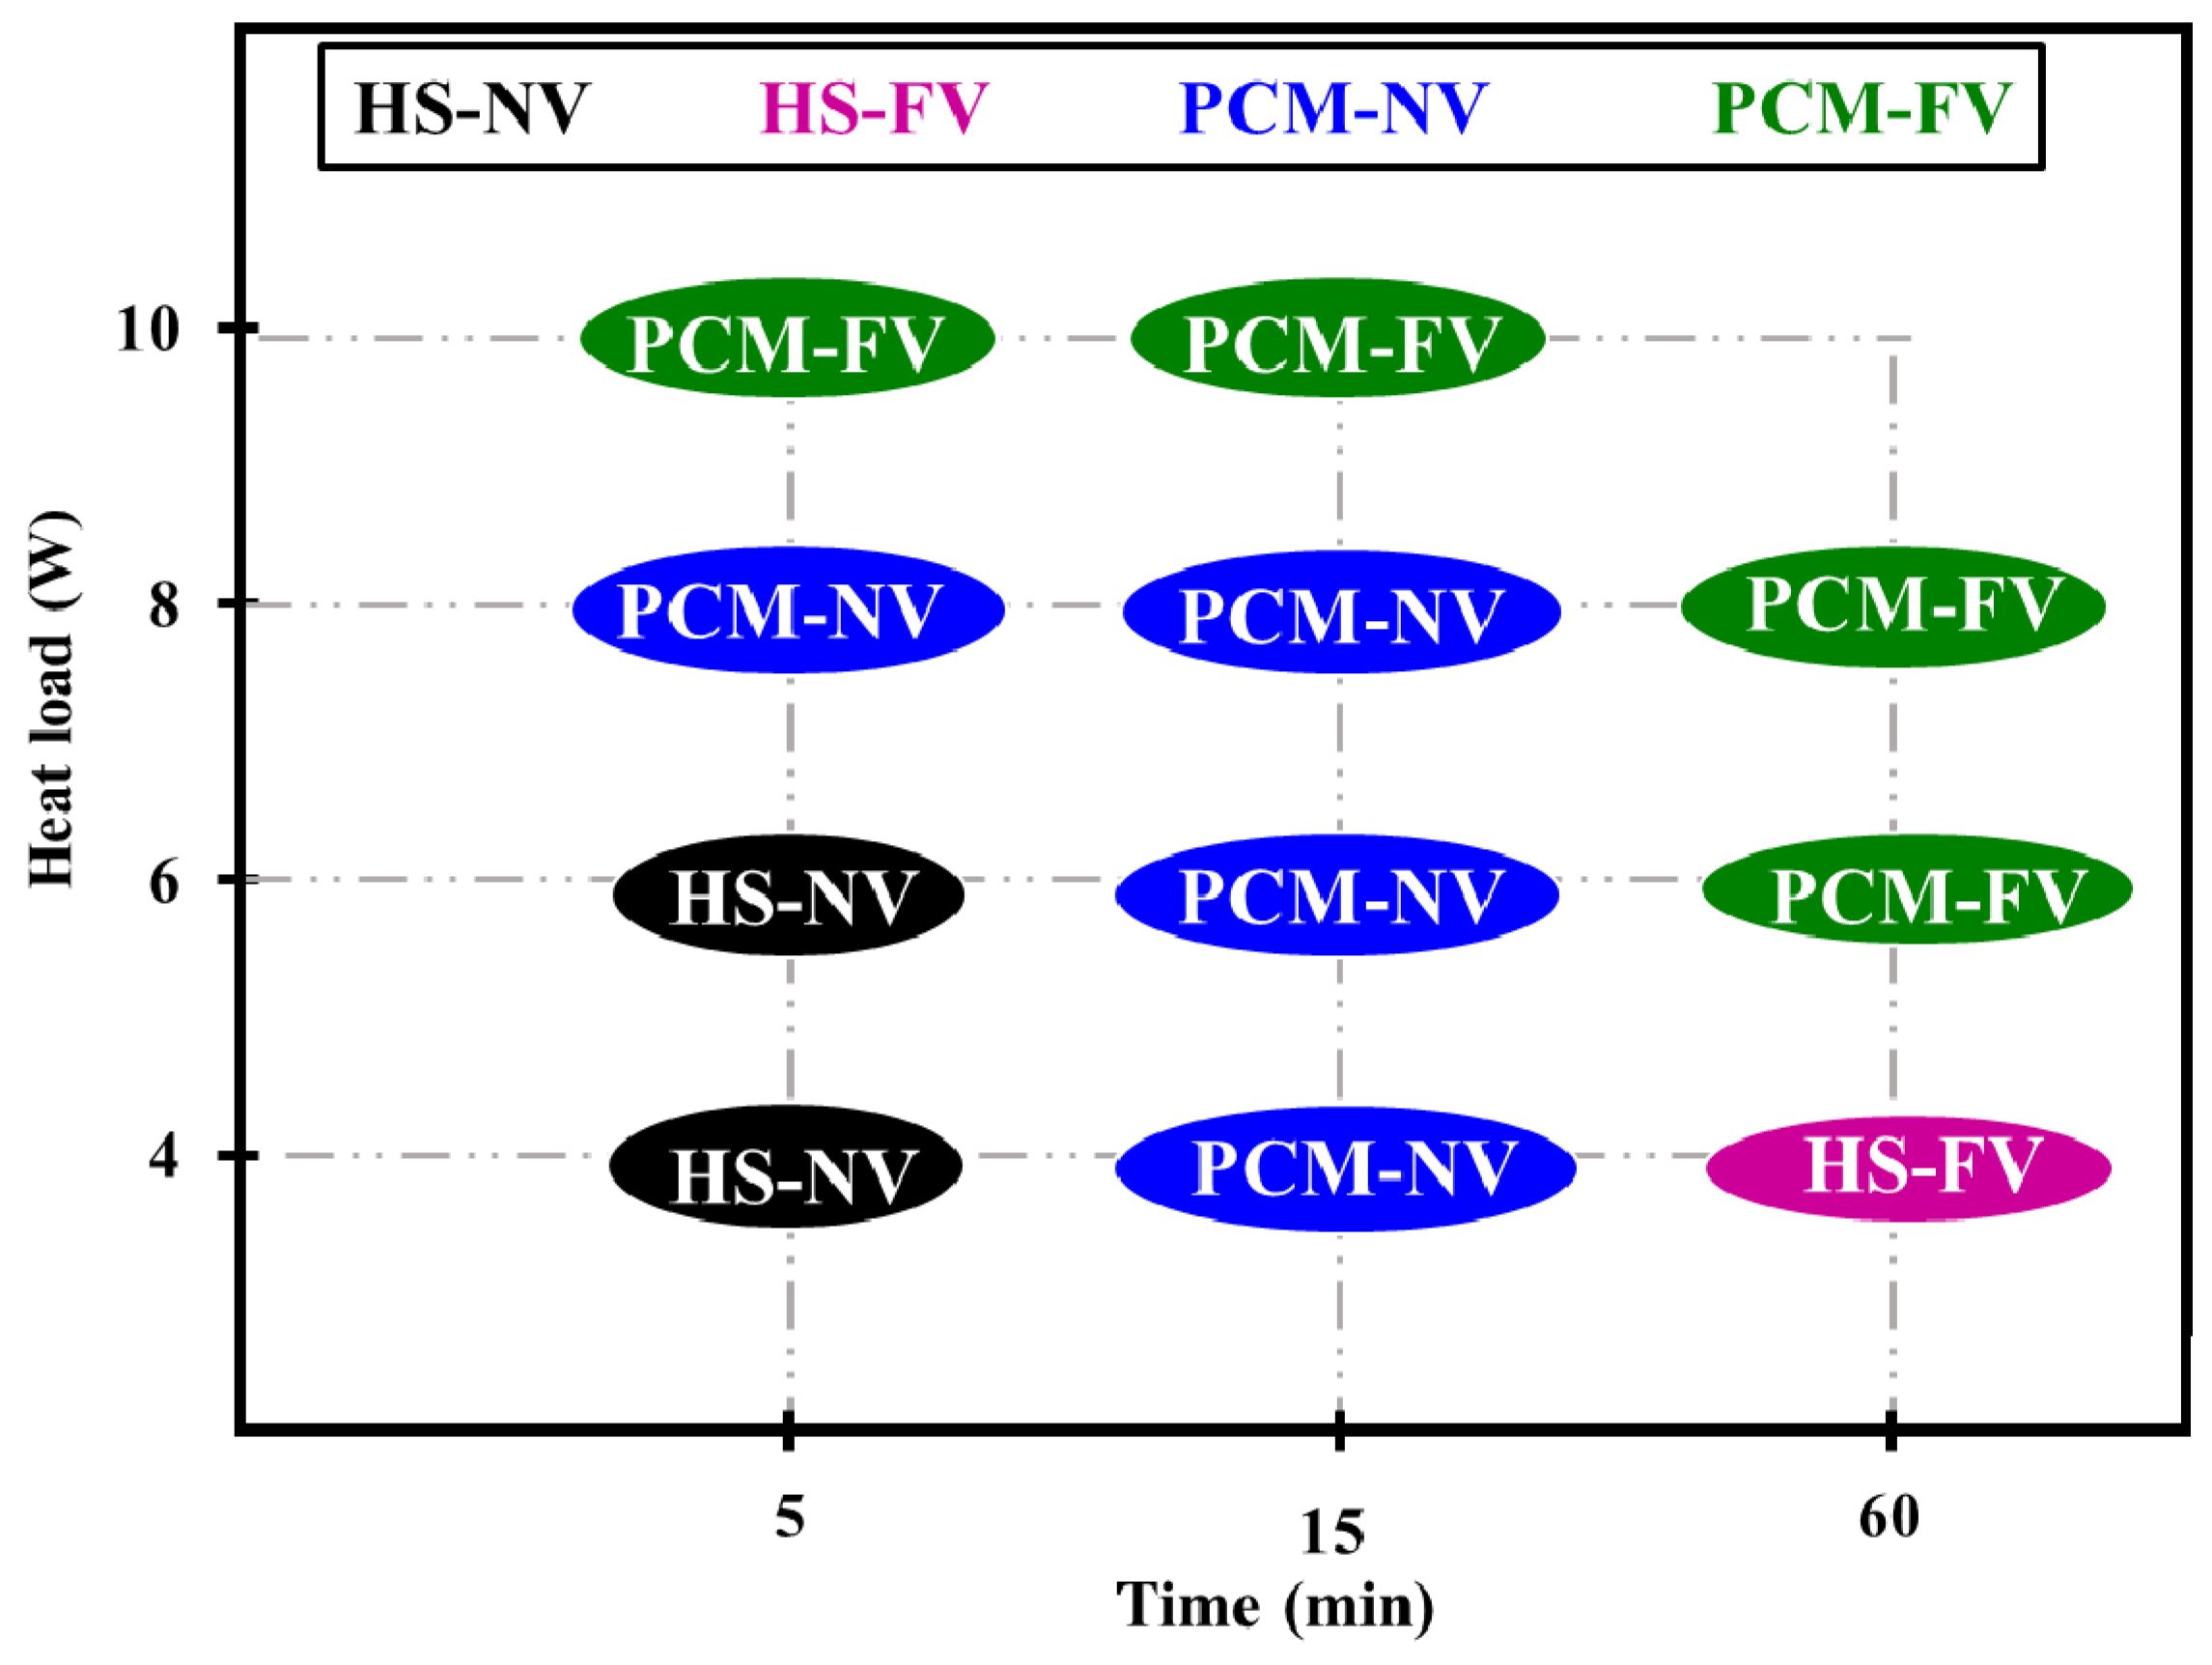
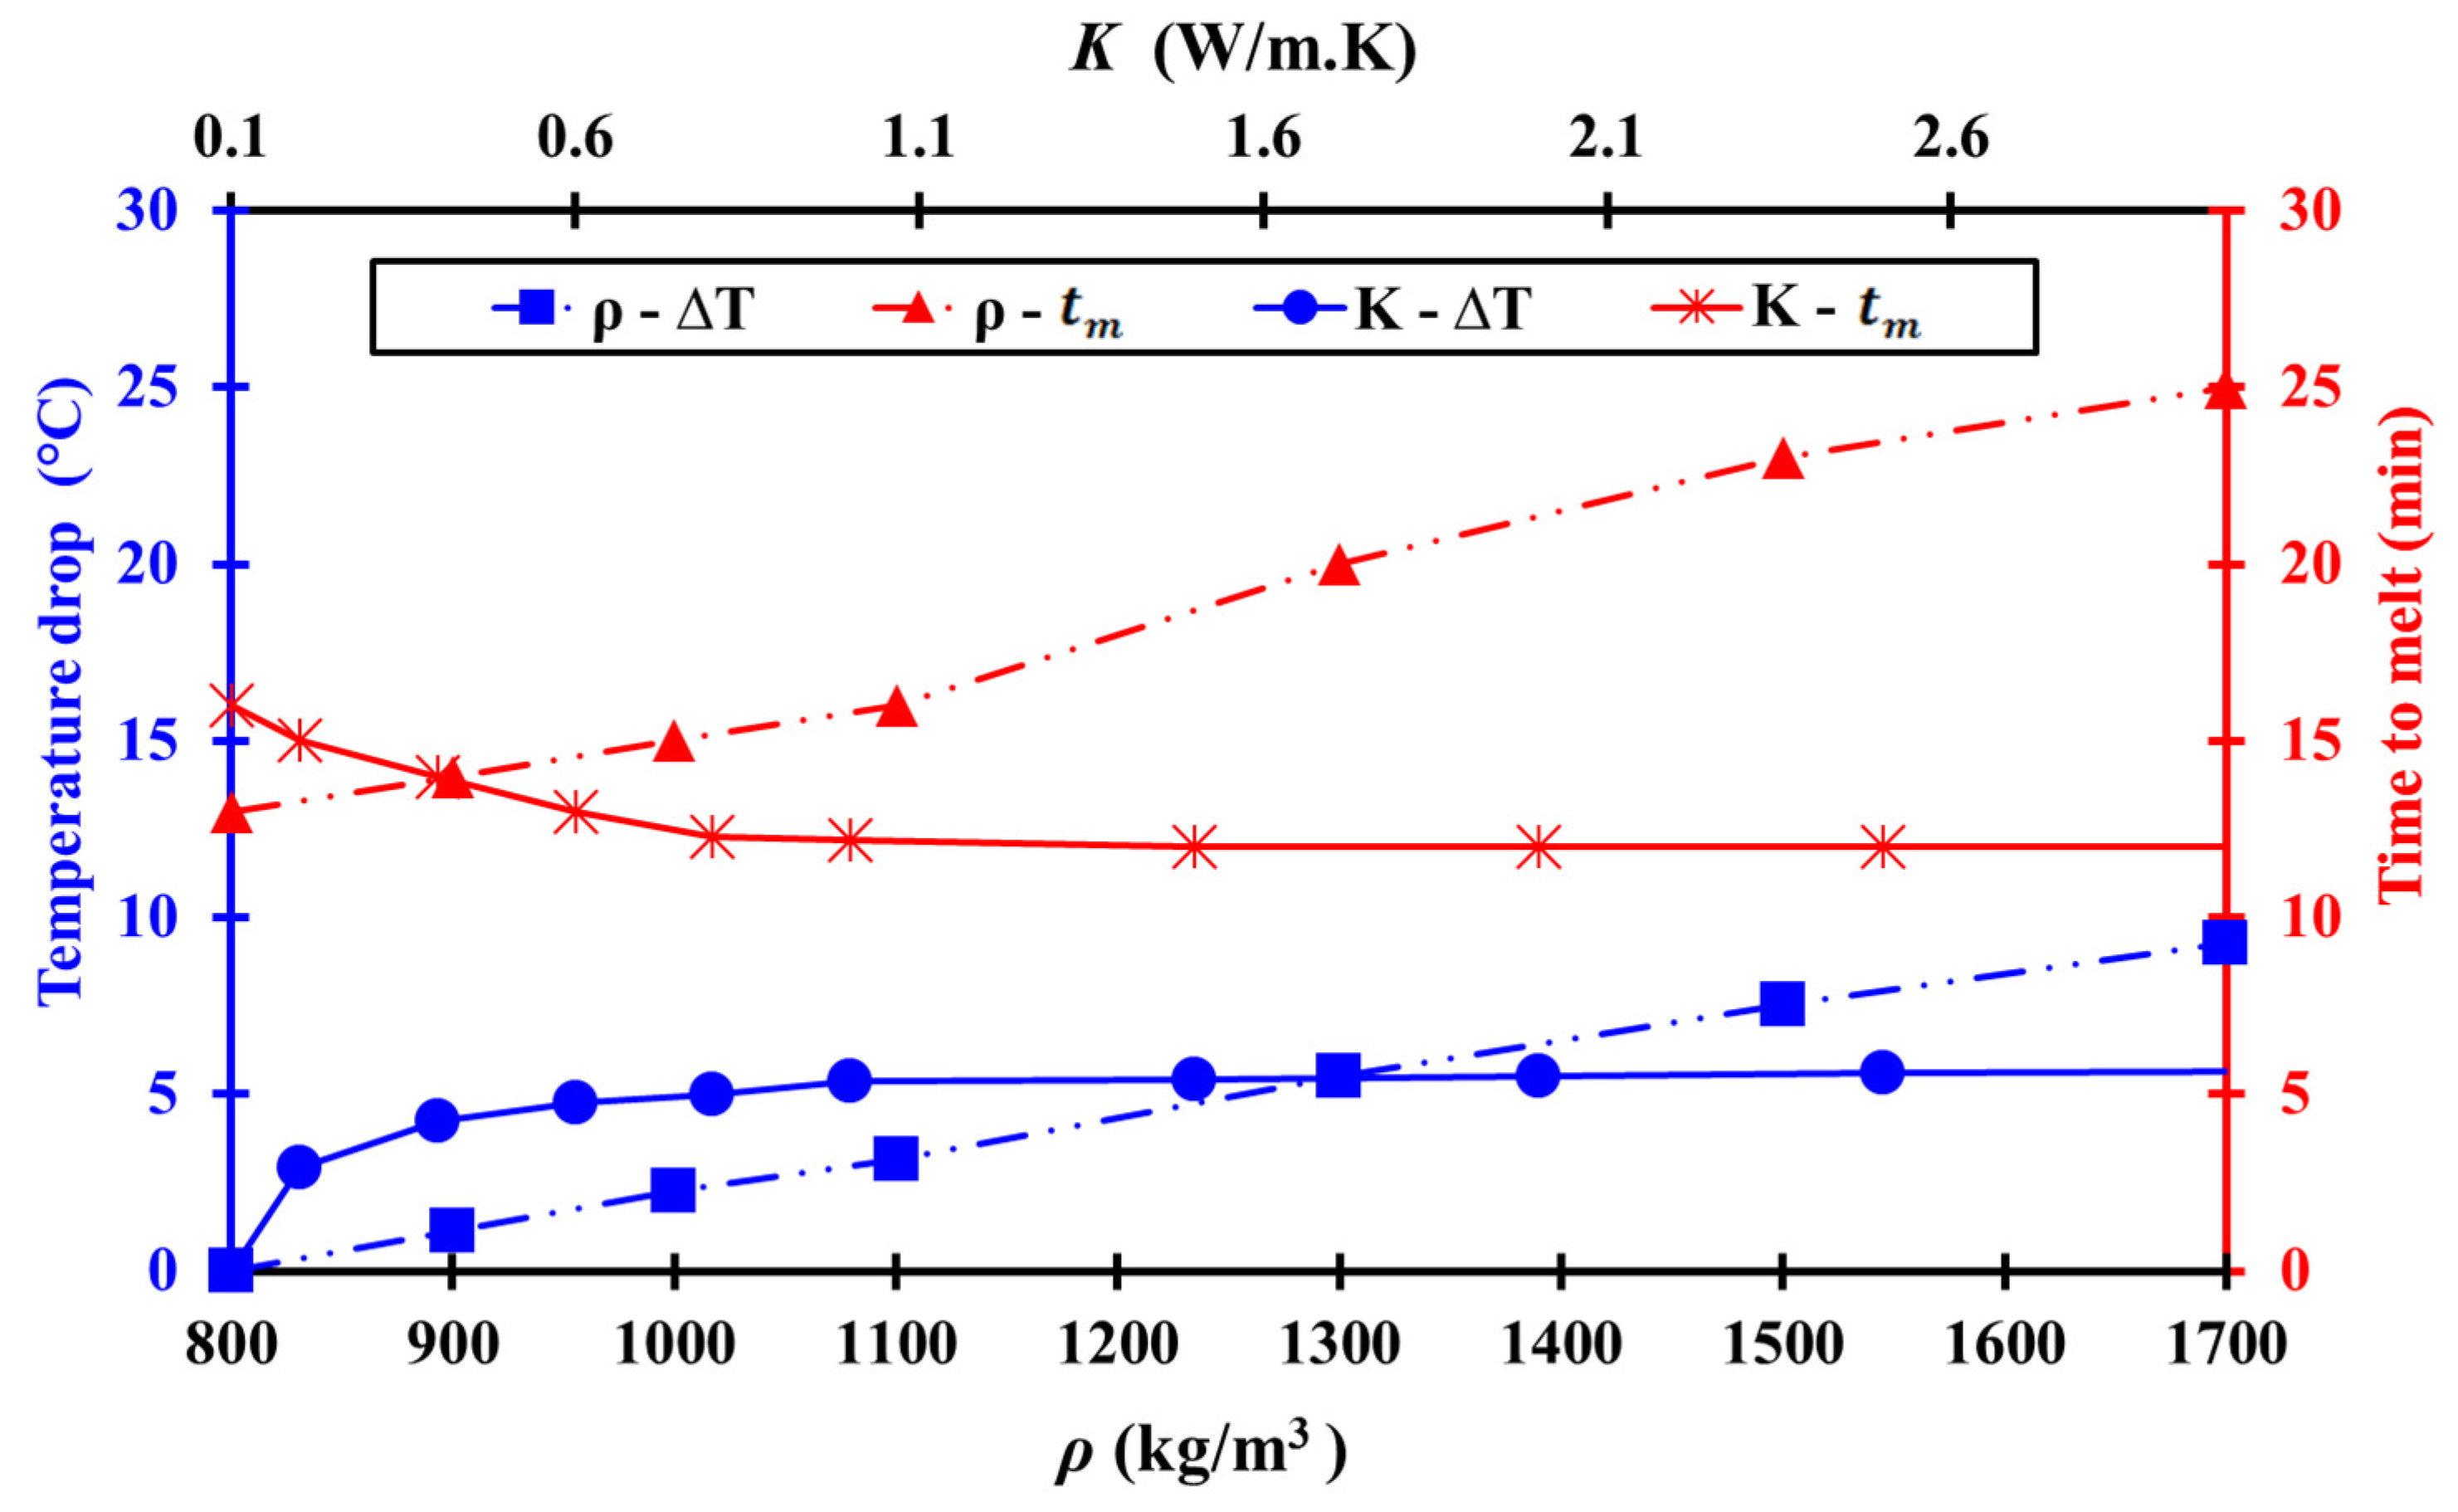
3.3.2. Parametric Influences on Thermal Management
4. Conclusions
- A time lag in temperature rise ensues due to increased heat absorption by PCMs.
- PCMs under both NV and FV achieve lower temperature than the HS-only at all tested heat loads.
- At higher heat fluxes, PCM melts faster implying that the effective time for temperature control is reduced. Consequently, an additional amount of PCM would be required for prolonged operation.
- No clear phase transition boundaries could be traced for milk fat due to its wider melting range contrary to salt hydrate and paraffin.
Acknowledgments
Author Contributions
Conflicts of Interest
Abbreviations
| d | Mesh cell size (mm) |
| Thermal conductivity (W/(m·K)) | |
| Temperature (°C) | |
| t | Time (s) |
| ρ | Density (kg/m3) |
| H | Enthalpy (kJ/kg) |
| uj | Velocity vector (m/s) |
| β | Liquid Fraction |
| cp | Specific heat capacity (J/(kg·K)) |
| L | Latent heat capacity (kJ/kg) |
| h | Heat transfer coefficient, (W/m2·K) |
| Sh | Source term due to melting (W/m3) |
| Nu | Nusselt number |
| Pr | Prandtl number |
| Re | Reynolds number |
| V | Velocity (m/s) |
| Viscosity (m2/s) | |
| Stephan–Boltzmann constant (5.67×10⁻⁸ (W/(m2K4)) | |
| Emissivity | |
| Temperature drop (°C) | |
| ATD | Average Temperature Difference |
| DAQ | Data Acquisition |
| DC | Direct Current |
| DSC | Differential Scanning Calorimetry |
| EPS | Expanded Polystyrene |
| FV | Forced Ventilation |
| HS | Heat Sink |
| LABVIEW | Laboratory Virtual Instrument Engineering Workbench |
| LHTMS | Latent Heat Thermal Management System |
| NV | Natural Ventilation |
| PCM | Phase Change Material |
| R2 | Coefficient of Determination |
| RMSE | Root-Mean-Square-Error |
| Liq | Liquidus |
| Sol | Solidus |
| ref | Reference |
| Infinity | |
| rad | Radiation |
| con | Convection |
| f | Film |
| amb | Ambient |
| m | Melt |
| sur | Surface |
| RS | Right side |
| LS | Left side |
| R | Rear |
| F | Front |
| T | Top |
| Vert | Vertical |
| Horiz | Horizontal |
Appendix

References
- Mondal, S. Phase change materials for smart textiles—An overview. Appl. Therm. Eng. 2008, 28, 1536–1550. [Google Scholar] [CrossRef]
- Bajaj, P. Thermally sensitive materials. In Smart Fibres, Fabrics and Clothing; Tao, X.M., Ed.; Woodhead Publishing Ltd.: Cambridge, England, 2001; pp. 58–82. [Google Scholar]
- Hamdan, M.; Al-Hinti, I. Analysis of heat transfer during the melting of a phase-change material. Appl. Therm. Eng. 2004, 24, 1935–1944. [Google Scholar] [CrossRef]
- Kim, S.; Drzal, L. High latent heat storage and high thermal conductive phase change materials using exfoliated graphite nano-platelets. Sol. Energy Mater. Sol. Cells 2009, 93, 136–142. [Google Scholar] [CrossRef]
- Khateeb, S.; Farid, M.; Selman, J.; Al-Hallaj, S. Design and simulation of a lithium-ion battery with a phase change material thermal management system for an electric scooter. J. Power Sources 2004, 128, 292–307. [Google Scholar] [CrossRef]
- Tan, F.L.; Fok, S.C. Thermal management of Mobile Phones Using Phase Change Materials. In Proceedings of the IEEE 9th Electronics Packaging Technology Conference, Singapore, Singapore, 10–12 December 2007; pp. 836–842.
- Kandasamy, R.; Wang, X.; Mujumdar, A. Transient cooling of electronics using phase change material (PCM)-based heat sinks. Appl. Therm. Eng. 2008, 28, 1047–1057. [Google Scholar] [CrossRef]
- Shatikian, V.; Ziskind, G.; Letan, R. Numerical investigation of a PCM-based heat sink with internal fins. Int. J. Heat Mass Trans. 2005, 48, 3689–3706. [Google Scholar] [CrossRef]
- Sharma, S.D.; Sagara, K. Latent heat storage materials and systems. Int. J. Green Energy 2005, 2, 1–56. [Google Scholar] [CrossRef]
- Marongiu, M.J. Thermal management of outdoor enclosures using phase change materials. Electron. Cool. 1998, 4, 26–29. [Google Scholar]
- Weng, Y.-C.; Cho, H.-P.; Chang, C.-C.; Chen, S.-L. Heat pipe with PCM for electronic cooling. Appl. Energy 2011, 88, 1825–1833. [Google Scholar] [CrossRef]
- Kandasamy, R.; Wang, X.; Mujumdar, A. Application of phase change materials in thermal management of electronics. Appl. Therm. Eng. 2007, 27, 2822–2832. [Google Scholar] [CrossRef]
- Sharma, A.; Tyagi, V.V.; Chen, C.R.; Buddhi, D. Review on thermal energy storage with phase change materials and applications. Renew. Sustain. Energy Rev. 2009, 13, 318–345. [Google Scholar] [CrossRef]
- Berroug, F.; Lakhal, E.K.; El Omari, M.; Faraji, M.; El Qarnia, H. Thermal performance of a greenhouse with a phase change material north wall. Energy Build. 2011, 43, 3027–3035. [Google Scholar] [CrossRef]
- Zhou, D.; Zhao, C.Y. Experimental investigations on heat transfer in phase change materials (PCMs) embedded in porous materials. Appl. Therm. Eng. 2011, 31, 970–977. [Google Scholar] [CrossRef]
- Veerappan, M.; Kalaiselvam, S.; Iniyan, S.; Goic, R. Phase change characteristic study of spherical PCMs in solar energy storage. Sol. Energy 2009, 83, 1245–1252. [Google Scholar] [CrossRef]
- N’Tsoukpoe, K.E.; Rammelberg, H.U.; Lele, A.F.; Korhammer, K.; Watts, B.A.; Schmidt, T.; Wolfgang, K.L. A review on the use of calcium chloride in applied thermal engineering. Appl. Thermal Eng. 2015, 75, 513–531. [Google Scholar] [CrossRef]
- Gawron, K.; Schröder, J. Properties of some salt hydrates for latent heat storage. Int. J. Energy Res. 1977, 1, 351–363. [Google Scholar] [CrossRef]
- Sharma, S.D.; Kitano, H.; Sagara, K. Phase change materials for low temperature solar thermal applications. Res. Rep. Fac. Eng. 2004, 29, 31–64. [Google Scholar]
- Gruszkiewicz, M.S.; Simonson, J.M. Vapor pressures and isopiestic molalities of concentrated CaCl2 (aq), CaBr2 (aq), and NaCl (aq). J. Chem. Thermodyn. 2005, 37, 906–993. [Google Scholar] [CrossRef]
- Kenisarin, M.; Mahkamov, K. Salt hydrates as latent heat storage materials: Thermophysical properties and costs. Solar Energy Mater. Sol. Cells 2016, 145, 255–286. [Google Scholar] [CrossRef]
- Tyagi, V.V.; Buddhi, D. Thermal cycle testing of calcium chloride hexahydrate as a possible PCM for latent heat storage. Sol. Energy Mater. Sol. Cells 2008, 92, 891–899. [Google Scholar] [CrossRef]
- Kaygusuz, K. Experimental and theoretical investigation of latent heat storage for water based solar heating systems. Energy Convers. Manag. 1995, 36, 315–323. [Google Scholar] [CrossRef]
- Cabeza, L.F.; Illa, J.; Roca, J.; Badia, F.; Mehling, H.; Hiebler, S. Middle term immersion corrosion tests on metal-salt hydrate pairs used for latent heat storage in the 32 to 36 °C temperature range. Mater. Corros. 2001, 52, 748–754. [Google Scholar] [CrossRef]
- Leoni, N.; Amon, C.H. Transient thermal design of wearable computers with embedded electronics using phase change materials. ASME-PUBLICATIONS-HTD 1997, 343, 49–56. [Google Scholar]
- Farid, M.M.; Khudhair, A.M.; Ali, K.S.; Al-Hallaj, R.S. A review on phase change energy storage: Materials and applications. Energy Convers. Manag. 2004, 45, 1597–1615. [Google Scholar] [CrossRef]
- Nayak, A.O.; Gowtham, M.R.; Vinod, R.; Ramkumar, G. Analysis of PCM Material in Thermal Energy Storage System. Int. J. Environ. Sci. Dev. 2011, 2, 437. [Google Scholar] [CrossRef]
- Freund, M.; Mózes, G.; Jakab, E. Paraffin Products: Properties, Technologies, Applications; Elsevier: Amsterdam, The Netherlands, 1982; Volume 121, pp. 444–997. [Google Scholar]
- Farid, M.; Mohamed, A. Effect of Natural Convection on the Process of Melting and Solidification of Paraffin Wax. Chem. Eng. Commun. 1987, 57, 297–316. [Google Scholar]
- Farid, M.; Kanzawa, A. Thermal Performance of a Heat Storage Module using PCM’s with Different Melting Temperatures: Mathematical Modeling. J. Sol. Energy Eng. 1989, 111, 152–157. [Google Scholar] [CrossRef]
- Elgafy, A.; Lafdi, K. Effect of carbon nanofiber additives on thermal behavior of phase change materials. Carbon 2005, 43, 3067–3074. [Google Scholar] [CrossRef]
- Fukai, J.; Hamada, Y.; Morozumi, Y.; Miyatake, O. Effect of carbon-fiber brushes on conductive heat transfer in phase change materials. Int. J. Heat Mass Transf. 2002, 45, 4781–4792. [Google Scholar] [CrossRef]
- Watson, E.L. Thermal properties of butter. Can. Agric. Eng. 1975, 17, 68–71. [Google Scholar]
- Alfa-Laval. Dairy Handbook; AB Publishing: London, UK, 1980. [Google Scholar]
- Finglas, P.M.; Toldra, F. Butter: Properties and Analysis. In Encyclopedia of Food and Health, 1st ed.; Elsevier: Amsterdam, Netherlands, 2016; Volume 1, pp. 540–544. [Google Scholar]
- Reyes, V.C. Homemade Butter. Available online: https://scienceandfooducla.wordpress.com/2013/05/28/homemade-butter/ (accessed on 6 August 2015).
- Rajeev, M. The Temperature Ratings Of Electronic Parts. Electron. Cool. 2004, 10, 20. [Google Scholar]
- Minges, M. Electronic Materials Handbook; ASM International: Materials Park, OH, USA, 1989; Volume 1. [Google Scholar]
- Tgrease-2500 (Thermal Grease). Available online: http://www.lairdtech.com/products/tgrease-2500 (accessed on 25 September 2015).
- Lu, T.J.; Evans, A.G.; Hutchinson, J.W. The effects of material properties on heat dissipation in high power electronics. J. Electron. Packag. 1998, 120, 280–289. [Google Scholar] [CrossRef]
- Lamberg, P.; Lehtiniemi, R.; Henell, A.M. Numerical and experimental investigation of melting and freezing processes in phase change material storage. Int. J. Therm. Sci. 2004, 43, 277–287. [Google Scholar] [CrossRef]
- Smith, W.F.; Hashemi, J. Foundations of Materials Science and Engineering, 4th ed.; McGraw-Hill: New York, NY, USA, 2006; pp. 318–320. [Google Scholar]
- Susman, G.; Dehouche, Z.; Cheechern, T.; Craig, S. Tests of prototype PCM ‘sails’ for office cooling. Appl. Therm. Eng. 2010, 31, 717–726. [Google Scholar] [CrossRef]
- Brent, A.D.; Voller, V.R.; Reid, K.J. Enthalpy porosity technique for mode1ing convection-diffision phase change. Numer. Transfer. 1988, 1, 97–318. [Google Scholar]
- Egolf, P.W.; Manz, H. Theory and modelling of phase change materials with and without mush regions. Int. J. Heat Mass Transfer. 1994, 37, 2917–2624. [Google Scholar] [CrossRef]
- Kuznik, F.; Virgone, J. Experimental investigation of wallboard containing phase change material: Data for validation of numerical modelling. Energy Build. 2009, 41, 561–570. [Google Scholar] [CrossRef]
- Cengel, Y. Heat and Mass Transfer: A Practical Approach, 3rd ed.; McGraw-Hill: Boston, MA, USA, 2007. [Google Scholar]
- SP-29 Data Sheet (Salt Hydrate Hexahedra). Available online: http://www.rubitherm.eu/media/products/datasheets/Techdata_-SP29Eu_EN_02062016.PDF (accessed on 27 August 2015).
- RT-42 Data Sheet (Paraffin Wax). Available online: http://www.rubitherm.eu/media/products/datasheets/Techdata_-RT42_EN_09052016.PDF (accessed on 6 August 2015).
- Glenn Elert. Density: The Physics Hyper Text Book. Available online: http://physics.info/density/ (accessed on 25 August 2015).
- Bürkle GmbH. Viscosity of Liquids. 2011. Available online: http://www.buerkle.de/media/files/Downloads/Viscosity_EN.pdf (accessed on 20 January 2016).


| Operation Mode | Description | |
|---|---|---|
| Natural ventilation | Ref-NV | Empty heat sink under natural ventilation |
| Salt-NV | Heat sink filled with salt hydrate under natural ventilation | |
| Paraffin-NV | Heat sink filled with paraffin under natural ventilation | |
| Milk fat-NV | Heat sink filled with milk fat under natural ventilation | |
| Forced ventilation | Ref-FV | Empty heat sink under forced ventilation |
| Salt-FV | Heat sink filled with salt hydrate under forced ventilation | |
| Paraffin-FV | Heat sink filled with paraffin heated under forced ventilation | |
| Milk fat-FV | Heat sink filled with milk fat under forced ventilation | |
| Equipment | Measurement Error |
|---|---|
| Thermocouples | ±0.05 °C |
| Data Logger Module | 0.02 °C |
| Power Supply | 10 mV, 1 mA |
| Thermal Grease | 0.000015 m2·°C/W |
| Anemometer | ±3% |
| Sizing Criteria | Description |
|---|---|
| Size function | Curvature |
| Relevance Center | Fine |
| Smoothing | High |
| Growth rate | 1.2 |
| Nodes | 79,745 |
| Materials | Salt Hydrate | Paraffin | Milk Fat | |
|---|---|---|---|---|
| Thermal conductivity (W/m·°C) | 0.60 [48] | 0.20 [49] | 0.29 [34] | |
| Specific heat capacity (kJ/kg·°C) | 2.0 [48] | 2.0 [49] | 2.3 [35] | |
| Density (kg/m3) | 1500 [48] | 802 [49] | 911 [50] | |
| Viscosity (kg/m·s) | 0.00184 [48] | 0.003 [49] | 0.045 [51] | |
| Solidus temperature (°C) | Catalogue | 27 [48] | 38 [49] | 10 [35] |
| DSC | 28 | 38 | 10 | |
| Liquidus temperature (°C) | Catalogue | 32 [48] | 43 [49] | 40 [35] |
| DSC | 32 | 43 | 40 | |
| Latent heat of fusion (kJ/kg) | Catalogue | 200 [48] | 140 [49] | - |
| DSC | 214 | 142 | 60 | |
| Material source | Rubitherm (SP-29) | Rubitherm (RT-42) | Kerry Gold | |
© 2016 by the authors; licensee MDPI, Basel, Switzerland. This article is an open access article distributed under the terms and conditions of the Creative Commons Attribution (CC-BY) license (http://creativecommons.org/licenses/by/4.0/).
Share and Cite
Hasan, A.; Hejase, H.; Abdelbaqi, S.; Assi, A.; Hamdan, M.O. Comparative Effectiveness of Different Phase Change Materials to Improve Cooling Performance of Heat Sinks for Electronic Devices. Appl. Sci. 2016, 6, 226. https://doi.org/10.3390/app6090226
Hasan A, Hejase H, Abdelbaqi S, Assi A, Hamdan MO. Comparative Effectiveness of Different Phase Change Materials to Improve Cooling Performance of Heat Sinks for Electronic Devices. Applied Sciences. 2016; 6(9):226. https://doi.org/10.3390/app6090226
Chicago/Turabian StyleHasan, Ahmad, Hassan Hejase, Shaimaa Abdelbaqi, Ali Assi, and Mohammed O. Hamdan. 2016. "Comparative Effectiveness of Different Phase Change Materials to Improve Cooling Performance of Heat Sinks for Electronic Devices" Applied Sciences 6, no. 9: 226. https://doi.org/10.3390/app6090226
APA StyleHasan, A., Hejase, H., Abdelbaqi, S., Assi, A., & Hamdan, M. O. (2016). Comparative Effectiveness of Different Phase Change Materials to Improve Cooling Performance of Heat Sinks for Electronic Devices. Applied Sciences, 6(9), 226. https://doi.org/10.3390/app6090226