Article

Information-Aided Smart Schemes for Vehicle Flow Detection Enhancements of Traffic Microwave Radar Detectors

1
Department of Electrical Engineering, Chung Yuan Christian University, 200 Chung-Pei Road, Chung-Li District, Taoyuan 32023, Taiwan
2
U & U Engineering Inc., No. 15, Gao-Yang South Road, Lung-Tan, Taoyuan 325, Taiwan
*
Author to whom correspondence should be addressed.
Appl. Sci. 2016, 6(7), 196; https://doi.org/10.3390/app6070196
Submission received: 30 May 2016 / Revised: 24 June 2016 / Accepted: 27 June 2016 / Published: 4 July 2016

Abstract

:
For satisfactory traffic management of an intelligent transport system, it is vital that traffic microwave radar detectors (TMRDs) can provide real-time traffic information with high accuracy. In this study, we develop several information-aided smart schemes for traffic detection improvements of TMRDs in multiple-lane environments. Specifically, we select appropriate thresholds not only for removing noise from fast Fourier transforms (FFTs) of regional lane contexts but also for reducing FFT side lobes within each lane. The resulting FFTs of reflected vehicle signals and those of clutter are distinguishable. We exploit FFT and lane-/or time stamp-related information for developing smart schemes, which mitigate adverse effects of lane-crossing FFT side lobes of a vehicle signal. As such, the proposed schemes can enhance the detection accuracy of both lane vehicle flow and directional traffic volume. On-site experimental results demonstrate the advantages and feasibility of the proposed methods, and suggest the best smart scheme.

Graphical Abstract

1. Introduction

Vehicle detection applications have been playing crucial roles in traffic management of an intelligent transport system (ITS). For those transportation operations, the inductive-loop detector and non-intrusive wired sensors are widely used [1] despite the emergence of wireless traffic sensors in [2,3]. In practice, non-intrusive traffic detectors are much preferred [1,4,5,6,7,8] owing to apparatus durability, functional diversity, and minimum adverse effect on road conditions when installed and maintained. The detection accuracies of non-intrusive sensors using video imaging, ultrasound, infrared, and microwave radar technologies have been evaluated under various conditions for vehicle classification and monitoring (e.g., [5,6,7,8]). It is noted that among non-intrusive sensors, the traffic microwave radar detectors (TMRDs) are highly likely to prevail as an integral part of an ITS. This is due to the advantages that the detection accuracy of the TMRD is unaffected by weather, air turbulence, temperature and light conditions, and the TMRD in sideway-looking mode can perform multi-lane traffic detection. Besides, the TMRD using the frequency modulated continuous waveform (FMCW) technique in [9,10] can have lower peak-to-average power ratio in transmission, and more advantages such as small size, light weight, and low cost. Technical applications of the FMCW TMRD include vehicle tracking [11], car classification [12,13], automobile detection [14], vehicle velocity estimation [12,14,15], and vehicle distance estimation [15], etc.
Unlike the aforementioned works [11,12,13,14,15], this paper is focused on traffic flow detection of the FMCW TMRD. In this aspect, the TMRD acquires the round-trip travel time of the FMCW from the TMRD to a vehicle within a lane. The time information can then be converted into an estimated distance between the TMRD and the fast Fourier transform (FFT) main lobe of the vehicle signal. We utilize the FFTs of vehicle signals, and develop several smart schemes for vehicle flow detection. The resulting methods aim to yield highly accurate real-time traffic information of highways, roads and bridges in urban areas. Satisfactory outcomes can help make appropriate policies and strategies (e.g., road construction, deployment and control of traffic lights) for increasing transportation efficiency (e.g., reduction of traffic congestions).
For vehicle flow estimation in a multiple-lane environment, the conventional approach first sets the same threshold for each lane to filter out noise (e.g., motorcycles and bicycles) from the FFTs of received signals. The resulting FFTs of vehicle signals and those of clutter (e.g., buildings) are distinguishable. This is because the latter are comparably large and constantly appear at fixed positions outside of road lanes. Next, the number of the resulting vehicle FFTs within a lane is assigned as the number of vehicles within the lane. However, the conventional method usually yields highly inaccurate traffic statistics caused by three undesirable situations. One is that the actual traffic within a lane can be wrongly estimated because of the inclusion of lane-crossing FFT side lobes from adjacent lanes. Another is that a vehicle may be counted twice for its previous and current lane if the vehicle makes and completes a lane change when it passes the detection zone. The other is that the reflected signal of a vehicle moving within a lane is missing due to the obstruction of a large bus moving within adjacent lanes. Accordingly, it is apparent that the first unfavorable situation is improvable while the second and the third situations seem too difficult to be rectified.
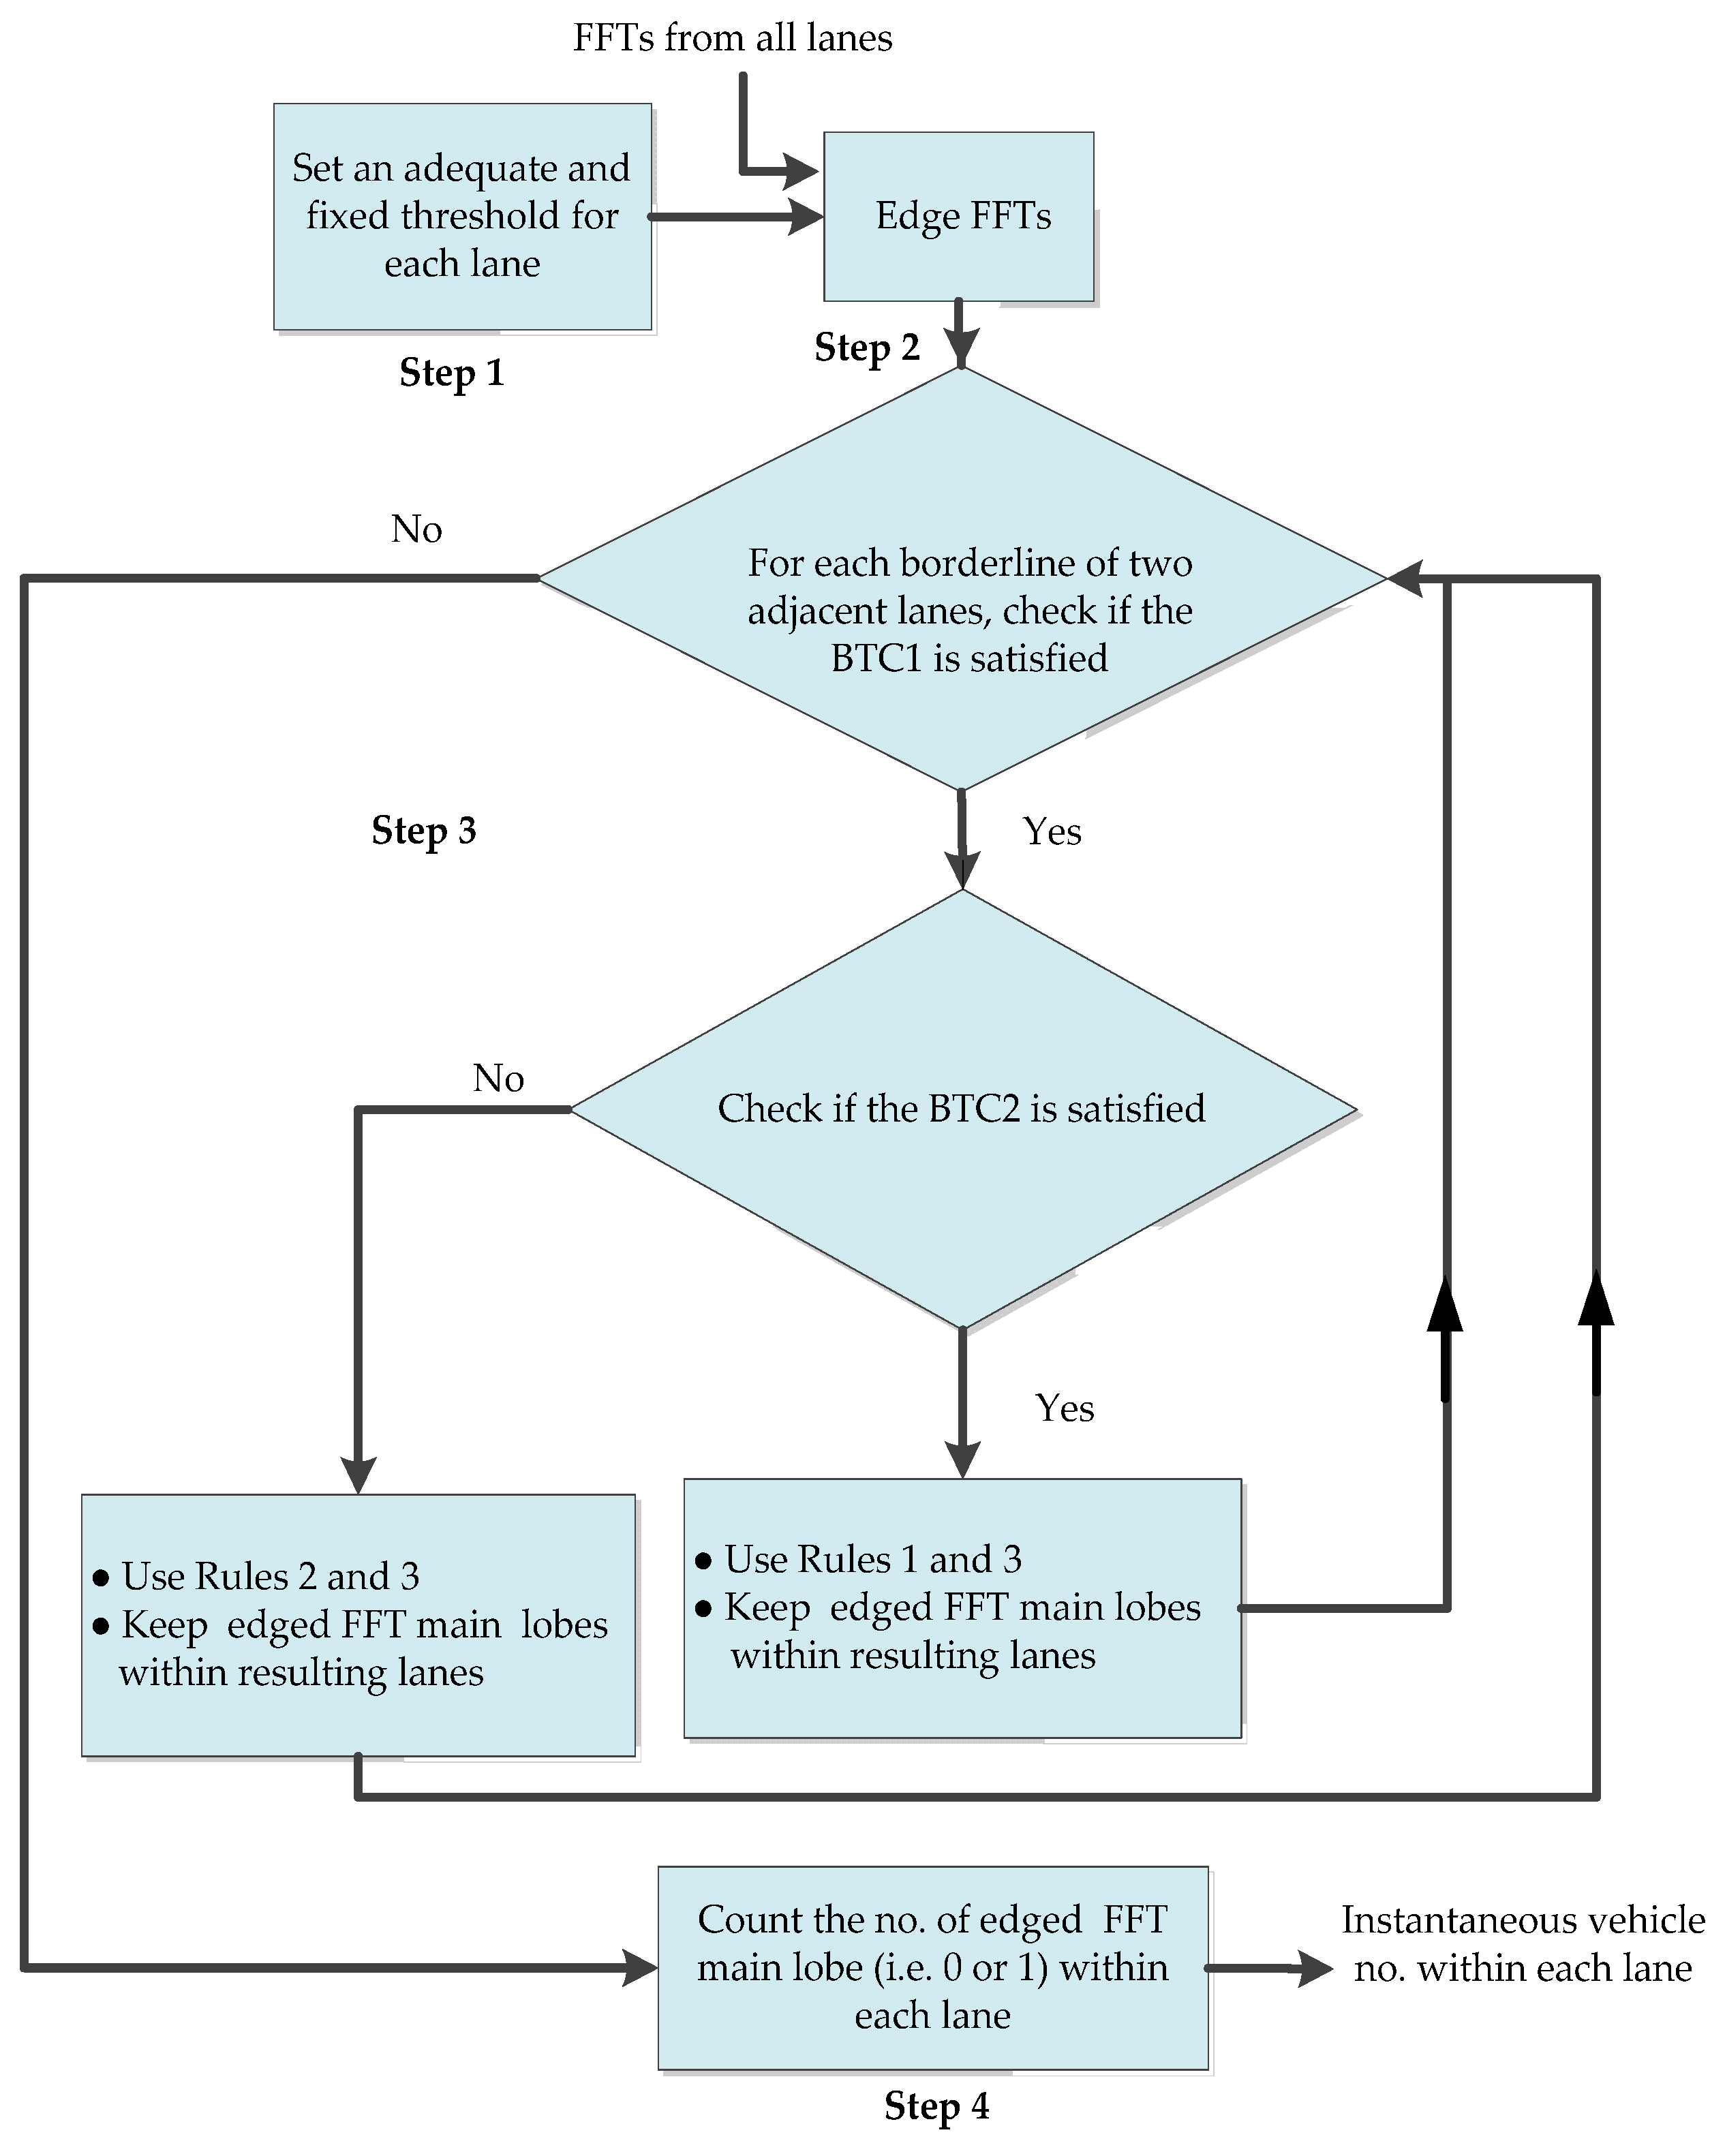
In this paper, the development of our smart schemes emphasizes how to ameliorate adverse effects of lane-crossing FFT side lobes from adjacent lanes. We first adjust and select an adequate threshold for each lane not only to remove noise but also to sensibly reduce edged FFT side lobes within each lane. Next, we utilize FFT and lane-/or time stamp-related information for proposing test criteria for identifying possible occurrences of lane-crossing edged FFT side lobes. Furthermore, we can give various plausible decisions for correctly identifying the lane on which a vehicle is moving. Those smart decisions, meanwhile, can disregard the effect of lane-crossing edged FFT side lobes. Compared with the conventional method, the proposed methods can reliably increase the detection accuracy of both the lane traffic flow and the directional vehicle volume.
The outline of this paper is given as follows. Section 2 introduces the TMRD system for vehicle detection and the FMCW principle. In Section 3, we describe the traffic detection problems of the conventional method. Section 4 presents the proposed information-aided smart schemes for detection performance enhancements, and gives performance analysis. On-site experimental setups are described in Section 5. In addition, experimental evaluations of the conventional approach and the proposed methods are provided. Conclusions are then given in Section 6.

2. FMCW TMRD System

The FMCW TMRD consists of several main parts: antenna, transmitter, receiver and digital signal processing (DSP) module. Its functional block diagram is depicted in Figure 1 in which Tx and Rx denote radar transmission signal and received vehicle return, respectively. The transmitter transmits FMCWs to vehicles on multiple road lanes, and the receiver receives reflected signals. The DSP module converts a received target signal into a FFT, and estimates the range/or velocity information of the target. The range from the TMRD to the target (i.e., the position of the FFT main lobe of the returned target signal) can be estimated by using the frequency analysis for the reflected target signal. This in turn estimates the lane on which the vehicle is located since the range between each lane and the TMRD is fixed and known. In addition, we can program and deploy our algorithms to the DSP module for vehicle flow detection.
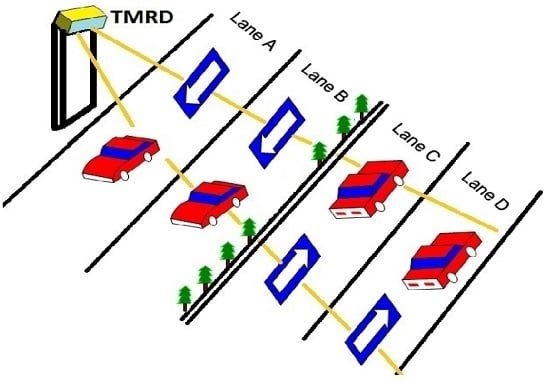
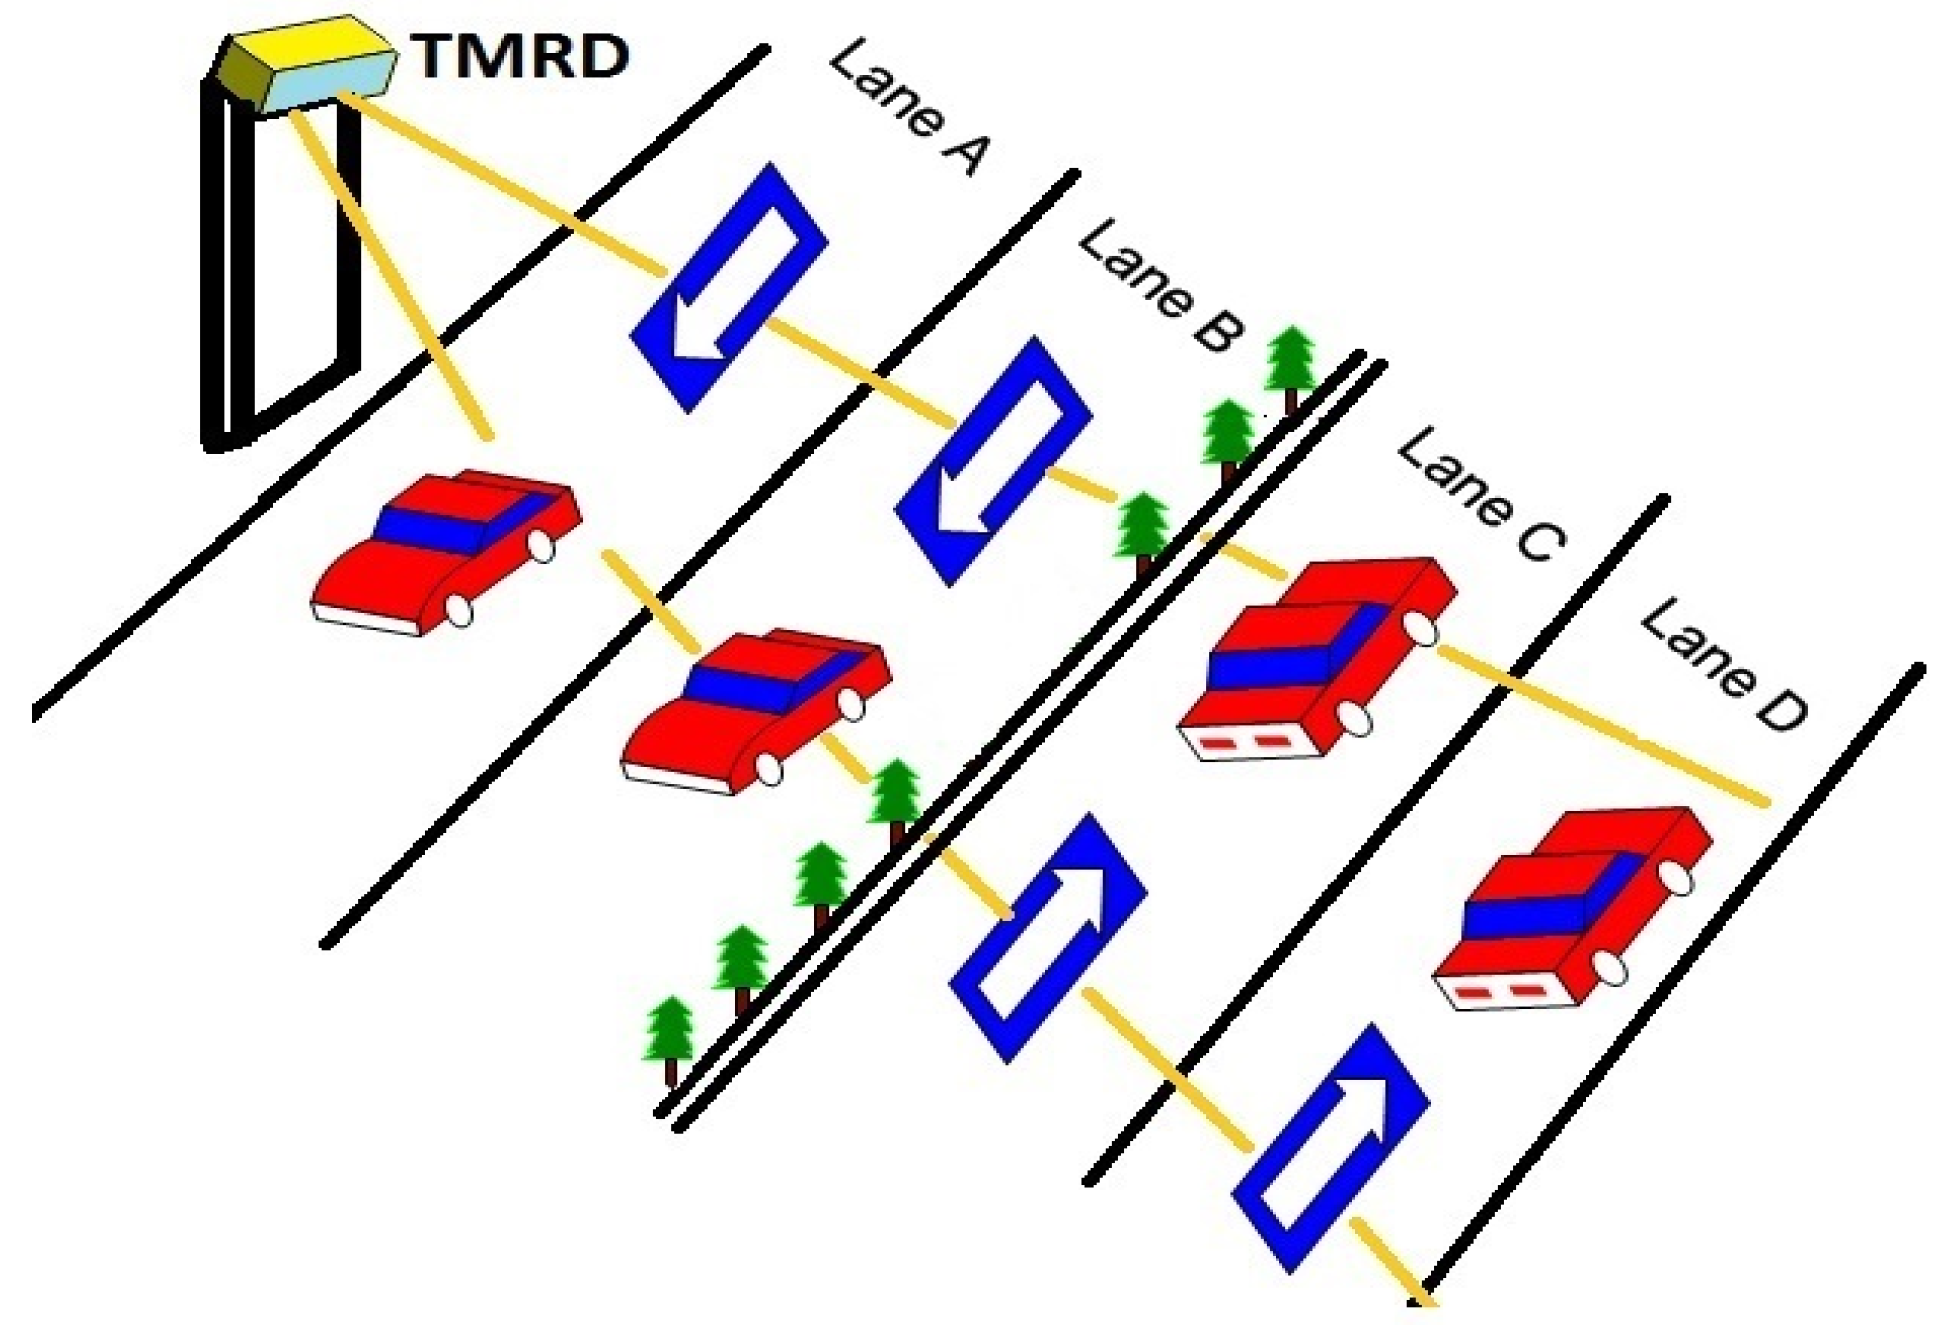
The FMCW TMRD is small in size and light in weight so that it can be conveniently mounted on a fixture. Unlike the forward-looking automotive radar sensing in [16], the sideway-looking vehicle detection of the TMRD in a multiple-lane environment is shown in Figure 2.
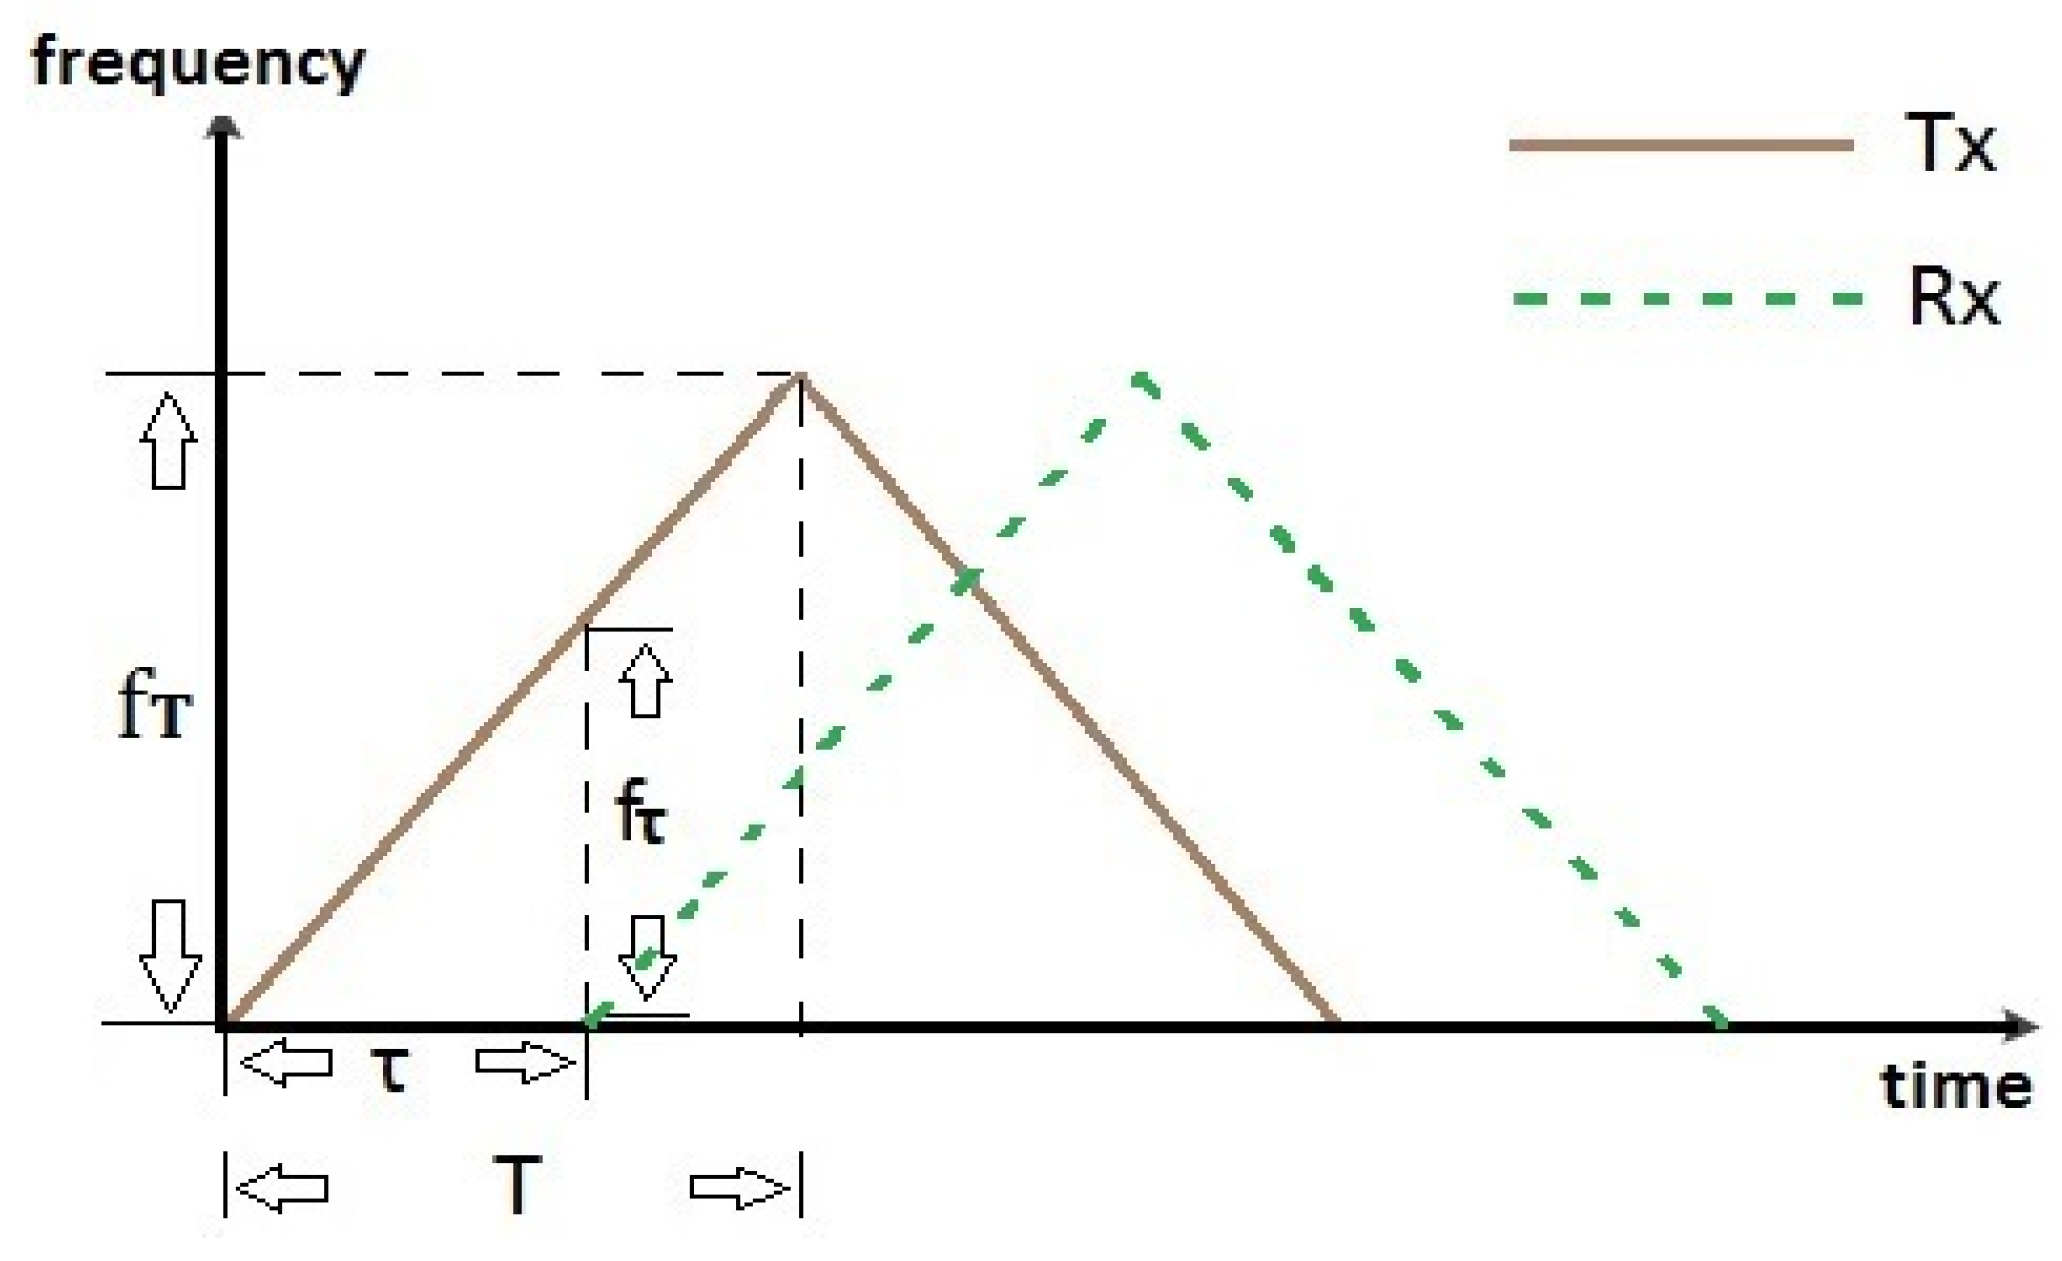
The operation of the FMCW TMRD system follows the linear FMCW radar principle in [9,10]. Assume a FMCW radar beam is transmitted and reflected on a vehicle. The receiver receives the return vehicle signal after a delay time τ . Then the distance d between the vehicle and the TMRD is obtained as
d = τ c 2
where c denotes the speed of the light. The frequency versus time characteristics for the linear FMCW is shown in Figure 3. Based on the similarity of two triangles in Figure 3, we directly obtain
τ T = f τ f T
i.e.,
τ = f τ T f T
where f T is the total frequency difference during the signal period T , and f τ is the beat frequency for the time delay τ . Putting Equation (3) into Equation (1) yields
d = f τ T c 2 f T
Equation (4) implies that the distance between the target and the TMRD is proportionally related to the beat frequency, which can be extracted by the DSP module. Hence, as the distance gets larger, so does the beat frequency. Accordingly, the FFTs of returned signals in the frequency-magnitude axis can be depicted in the distance-magnitude axis. Illustrations can be foundin Section 5.

3. Problem Description

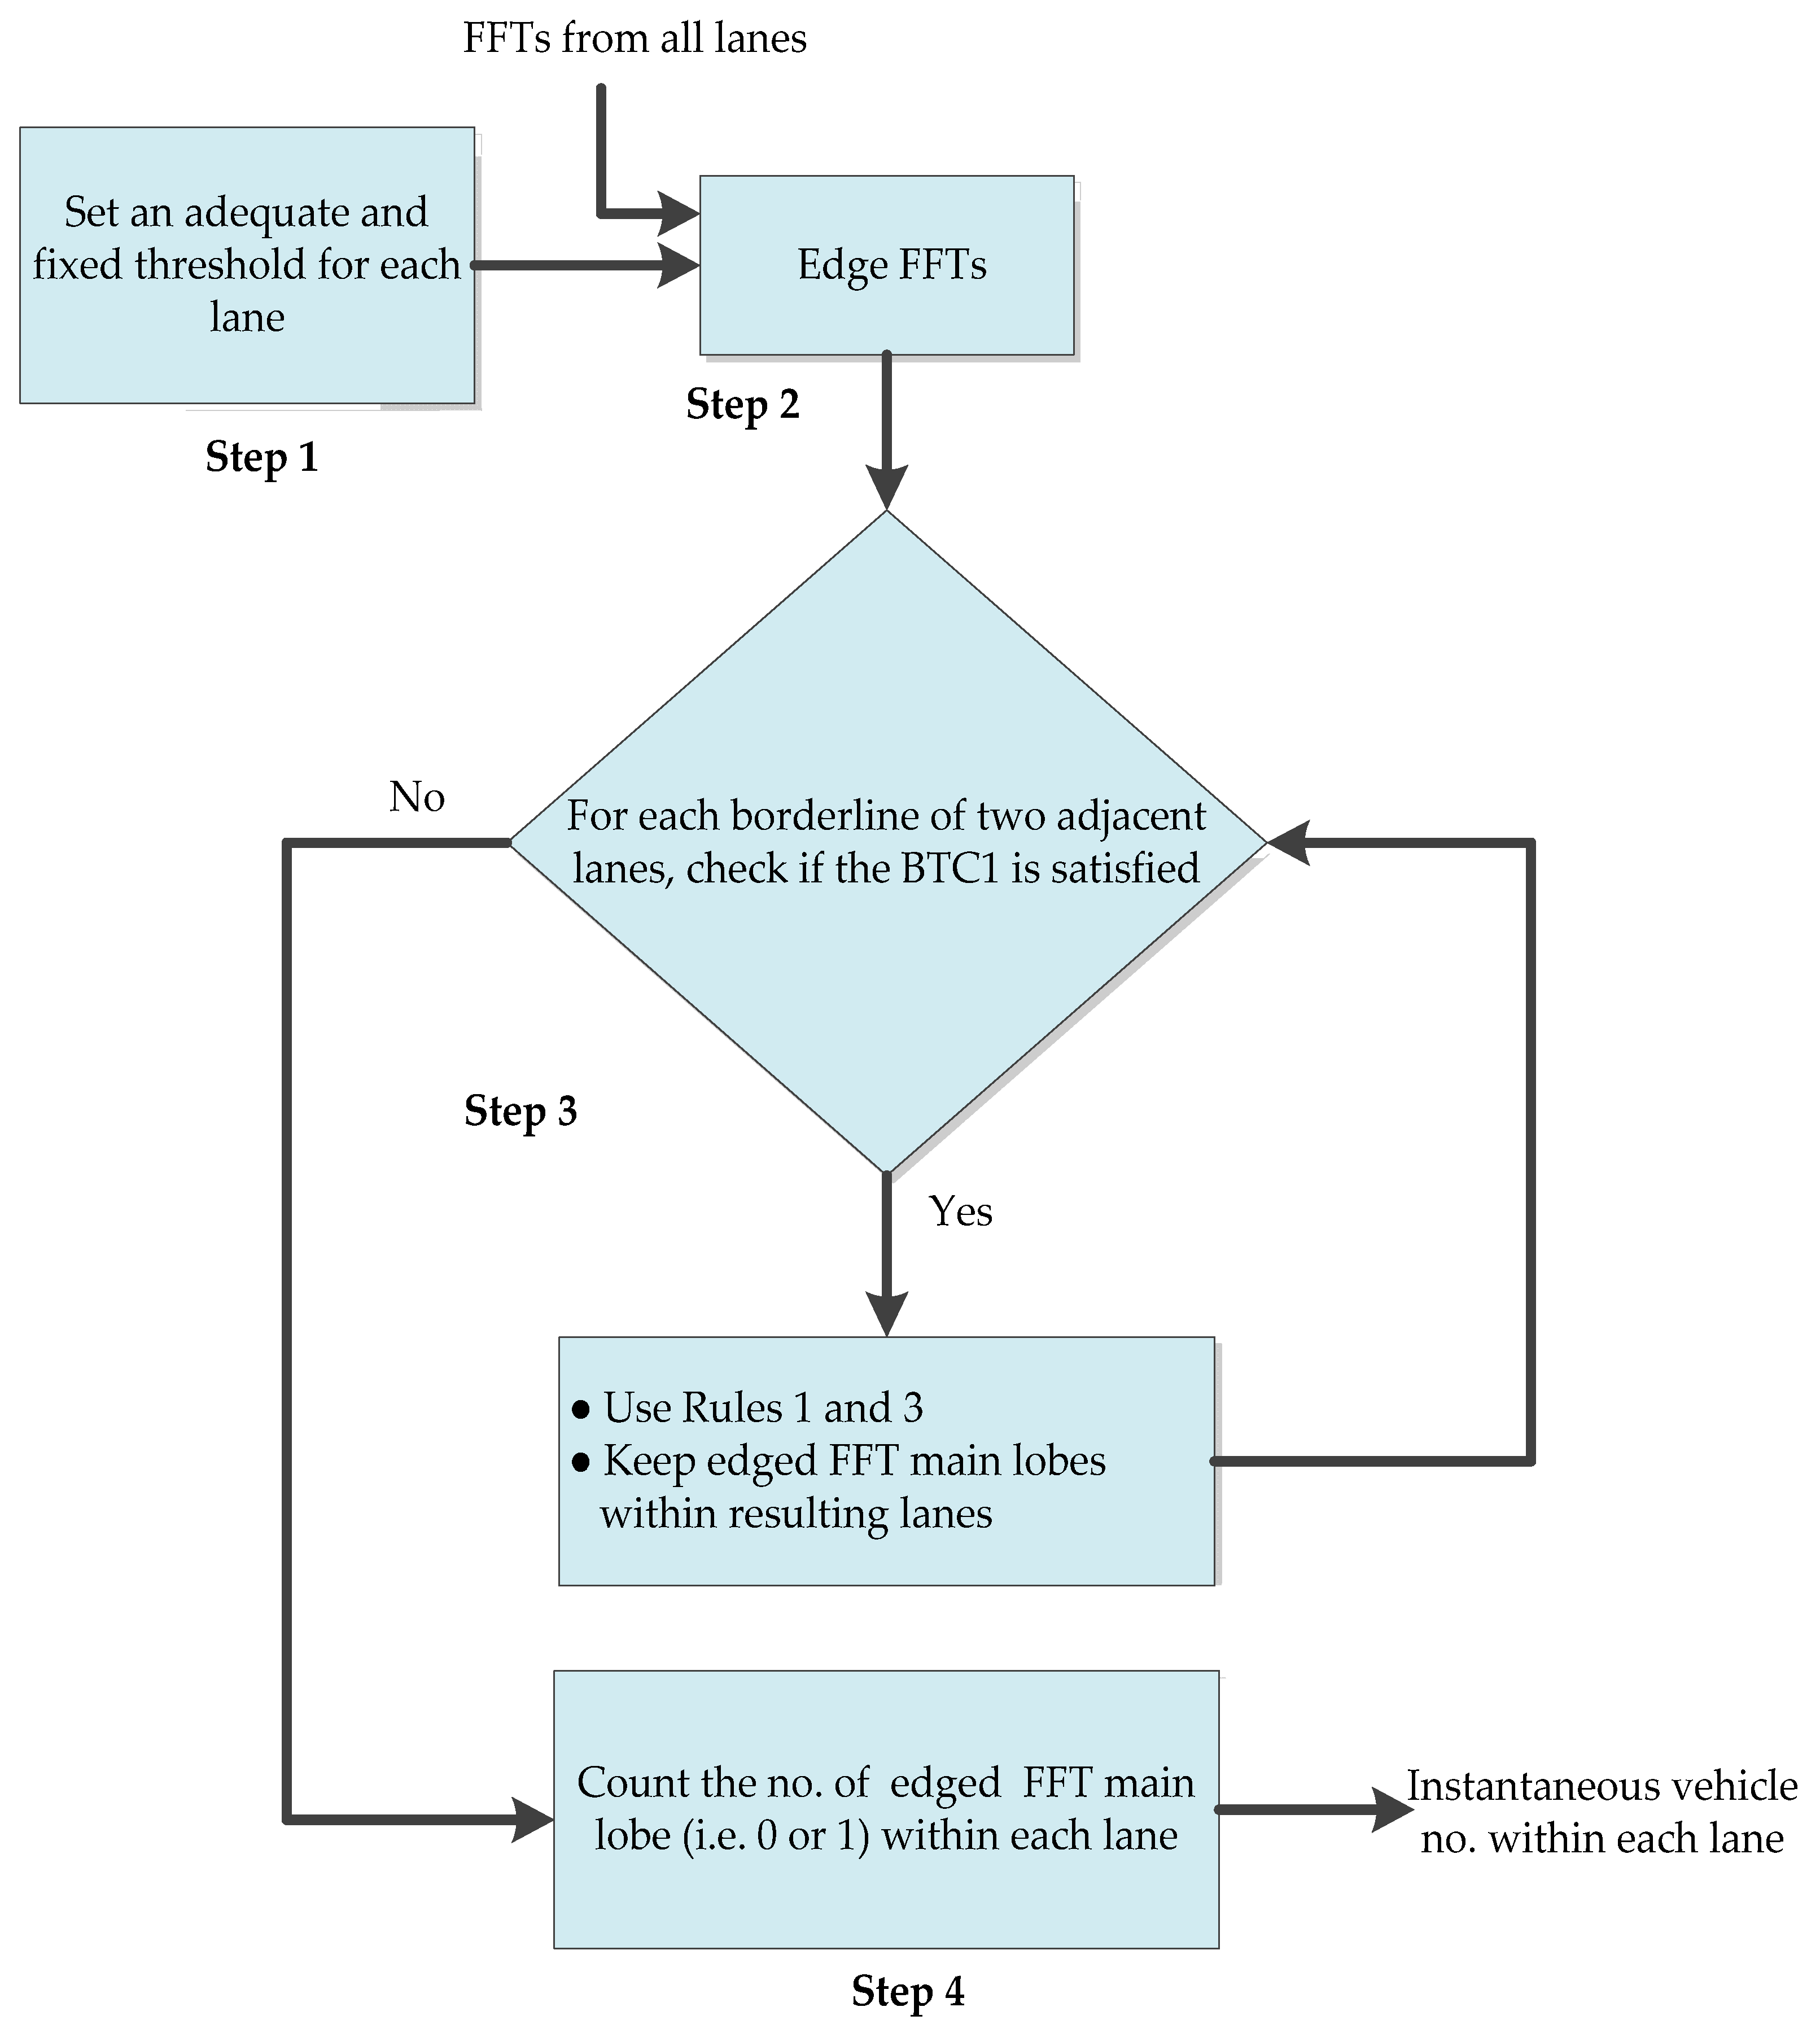
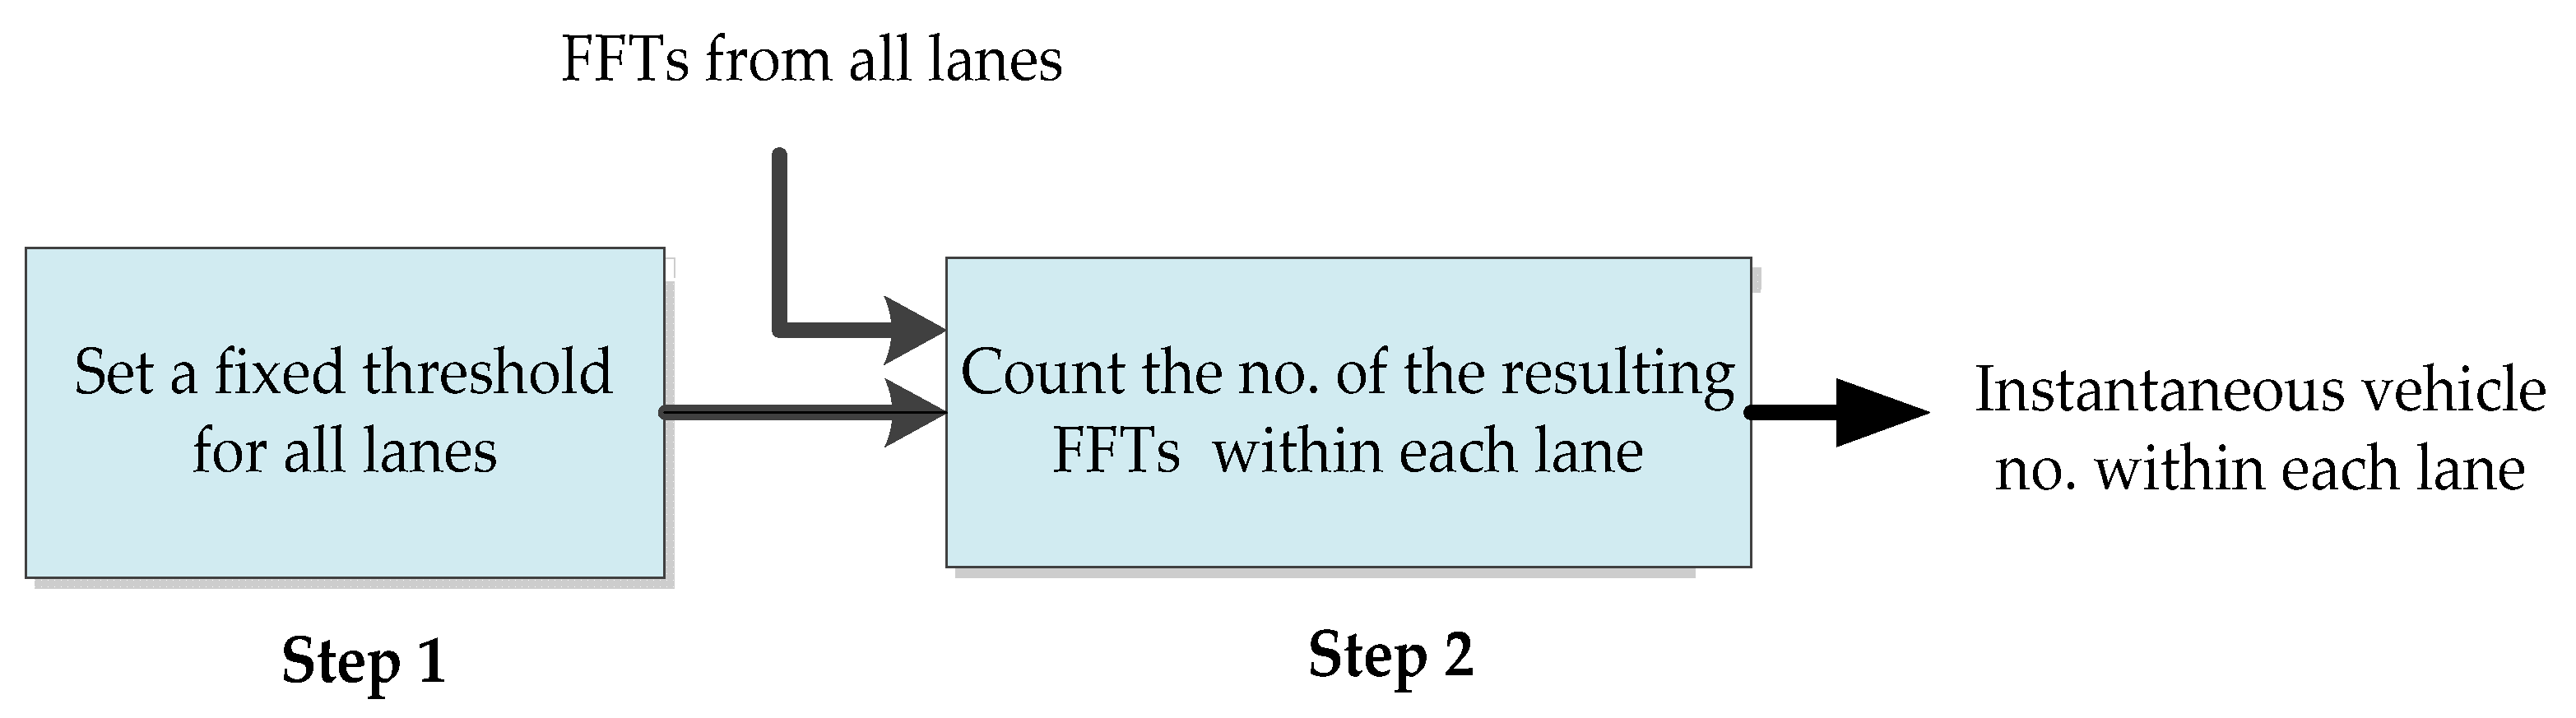
To perform vehicle flow detection for multiple lanes, a simple choice is the conventional method whose functional procedure is shown in 
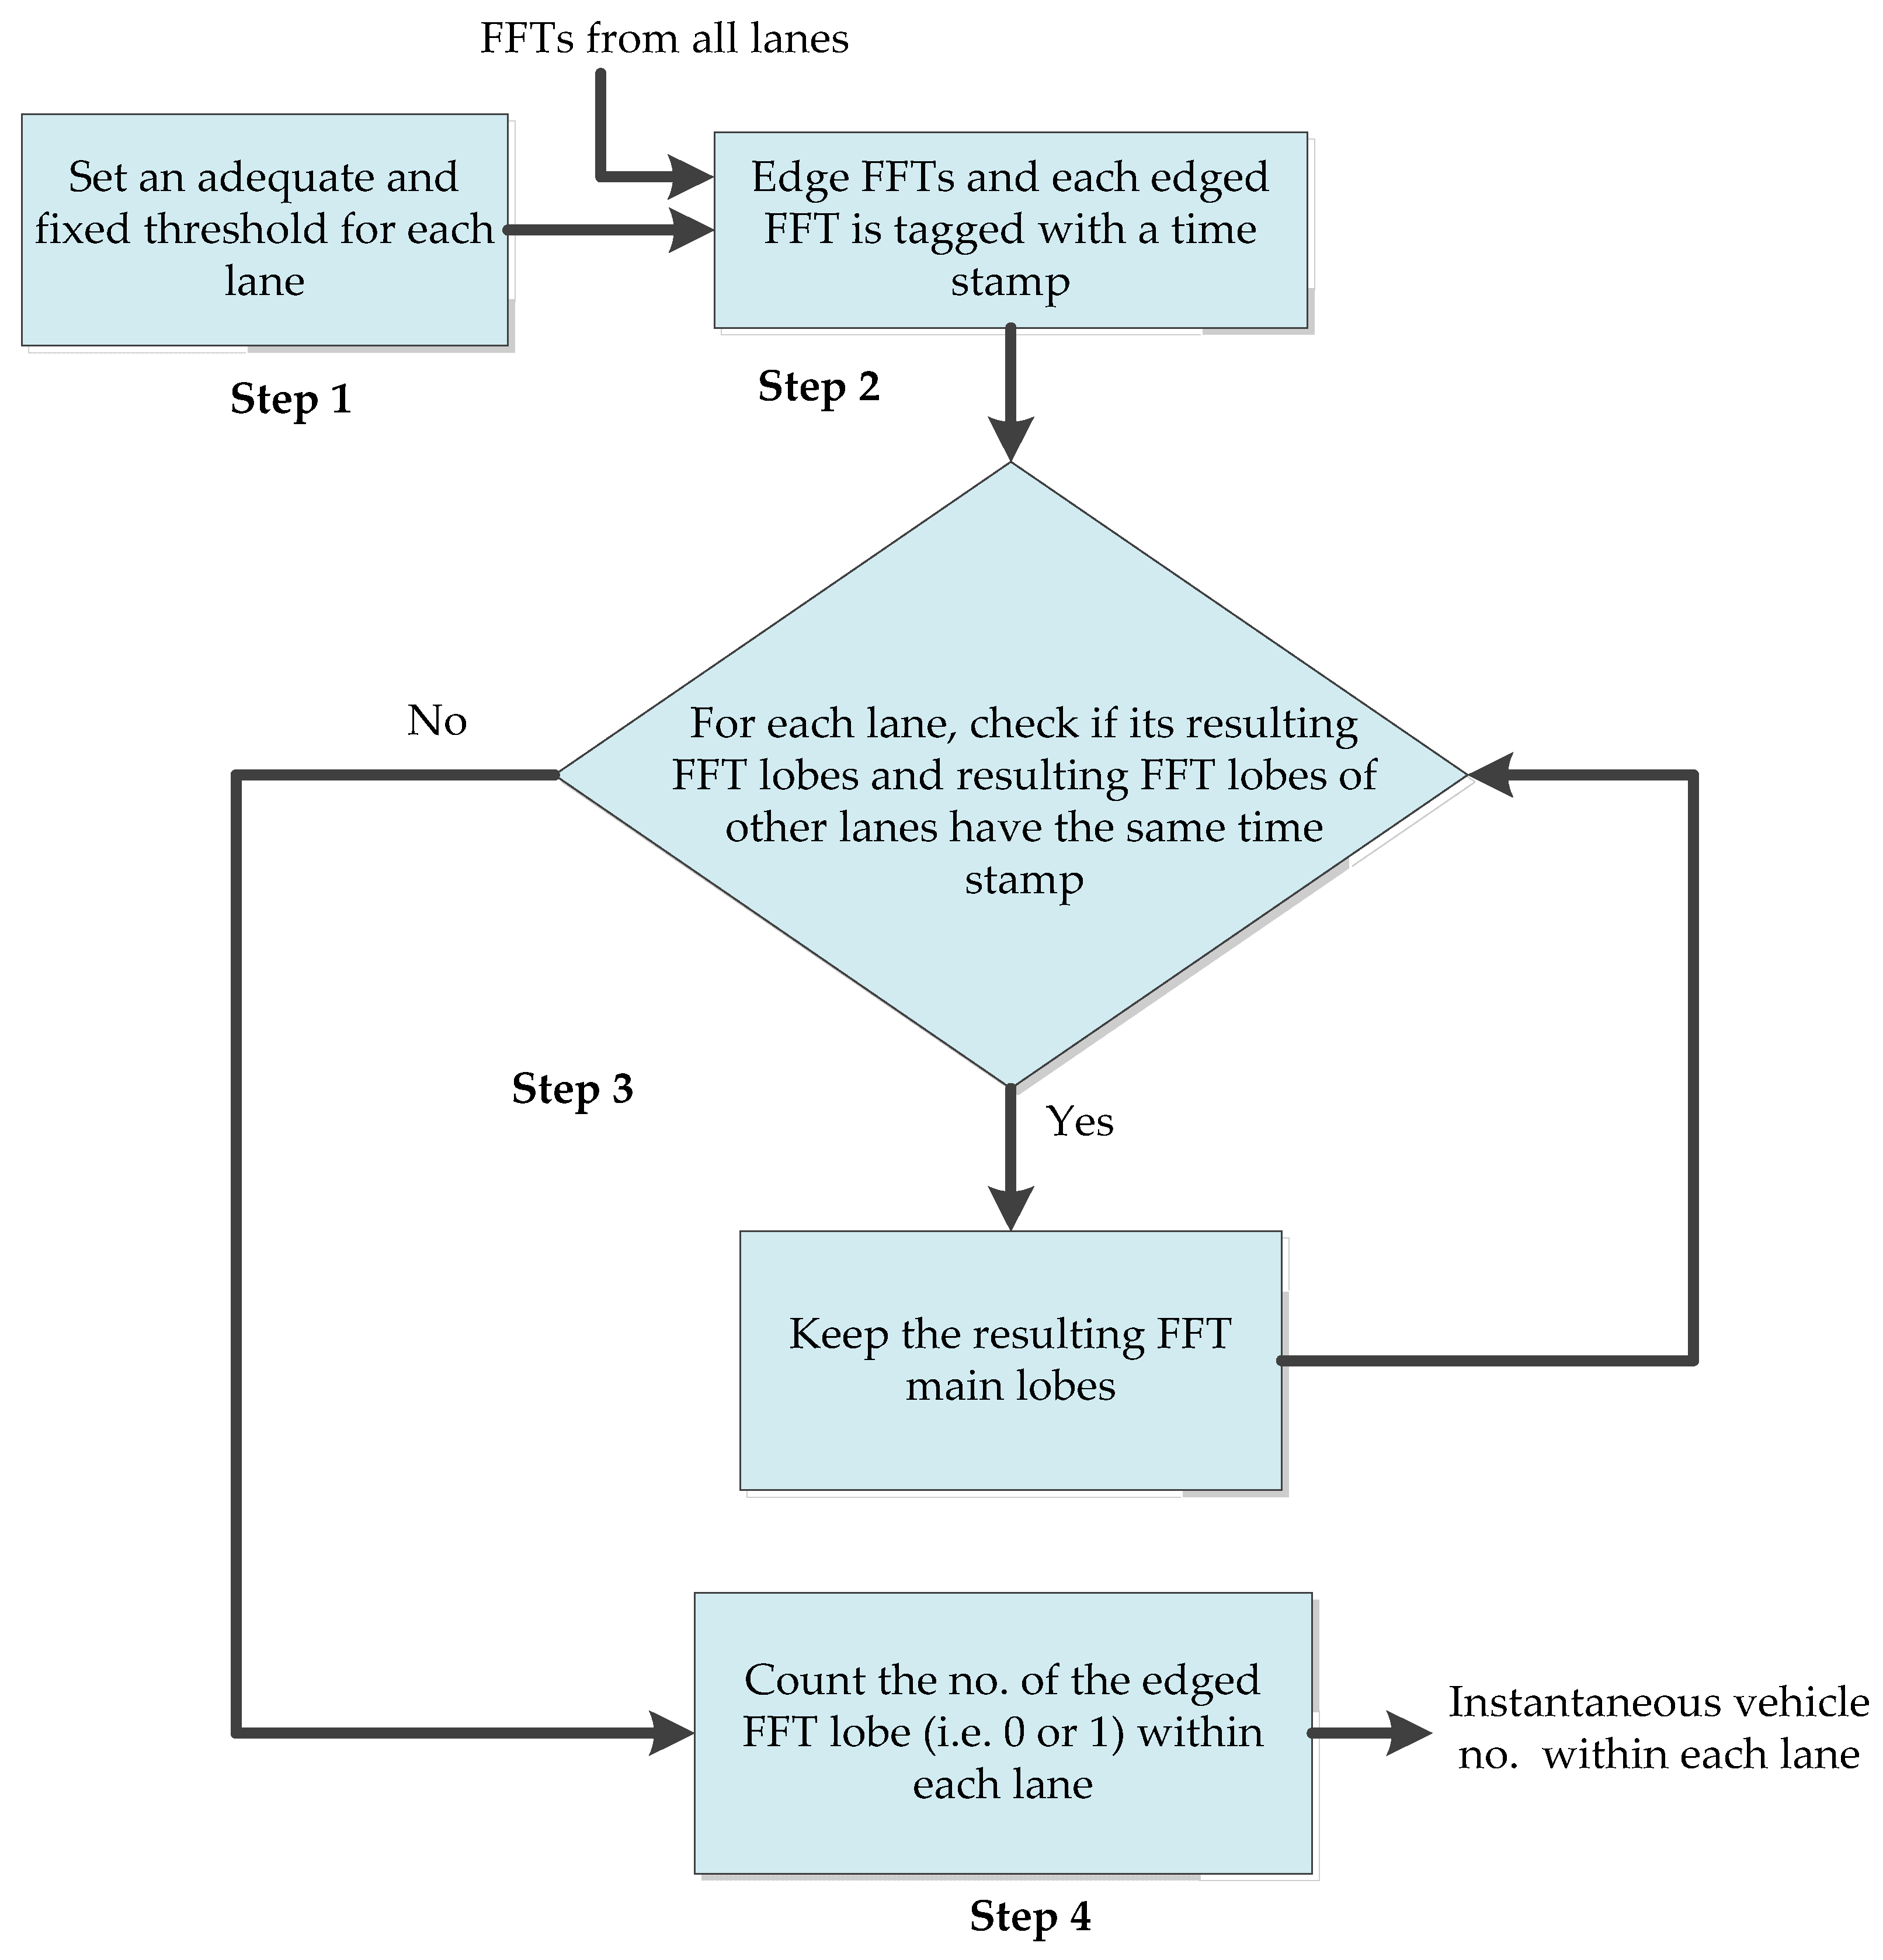
Figure 4. In step 1, based on the average FFT magnitudes of environmental noises observed at the road site, an appropriate and fixed threshold is pre-selected for removing noises (e.g., motorcycles and bicycles) from the FFTs of received return signals from all lanes. Moreover, the threshold has to be far below the FFT main lobe of a vehicle signal within each lane. Because the peaks of the FFTs of clutters (e.g., buildings) are usually large and appear at fixed positions, it is ensured that the FFT main lobes of reflected vehicle signals and those of clutters are distinguishable. Such a threshold selection can reduce the chance of noise being mistaken as side lobes, which in turn may minimize the vehicle counting errors. In step 2, FFTs of vehicle signals from all lanes are edged by the threshold to yield resulting FFTs. The number of the resulting FFT lobes within each lane is taken as the instantaneous vehicle number within each lane.
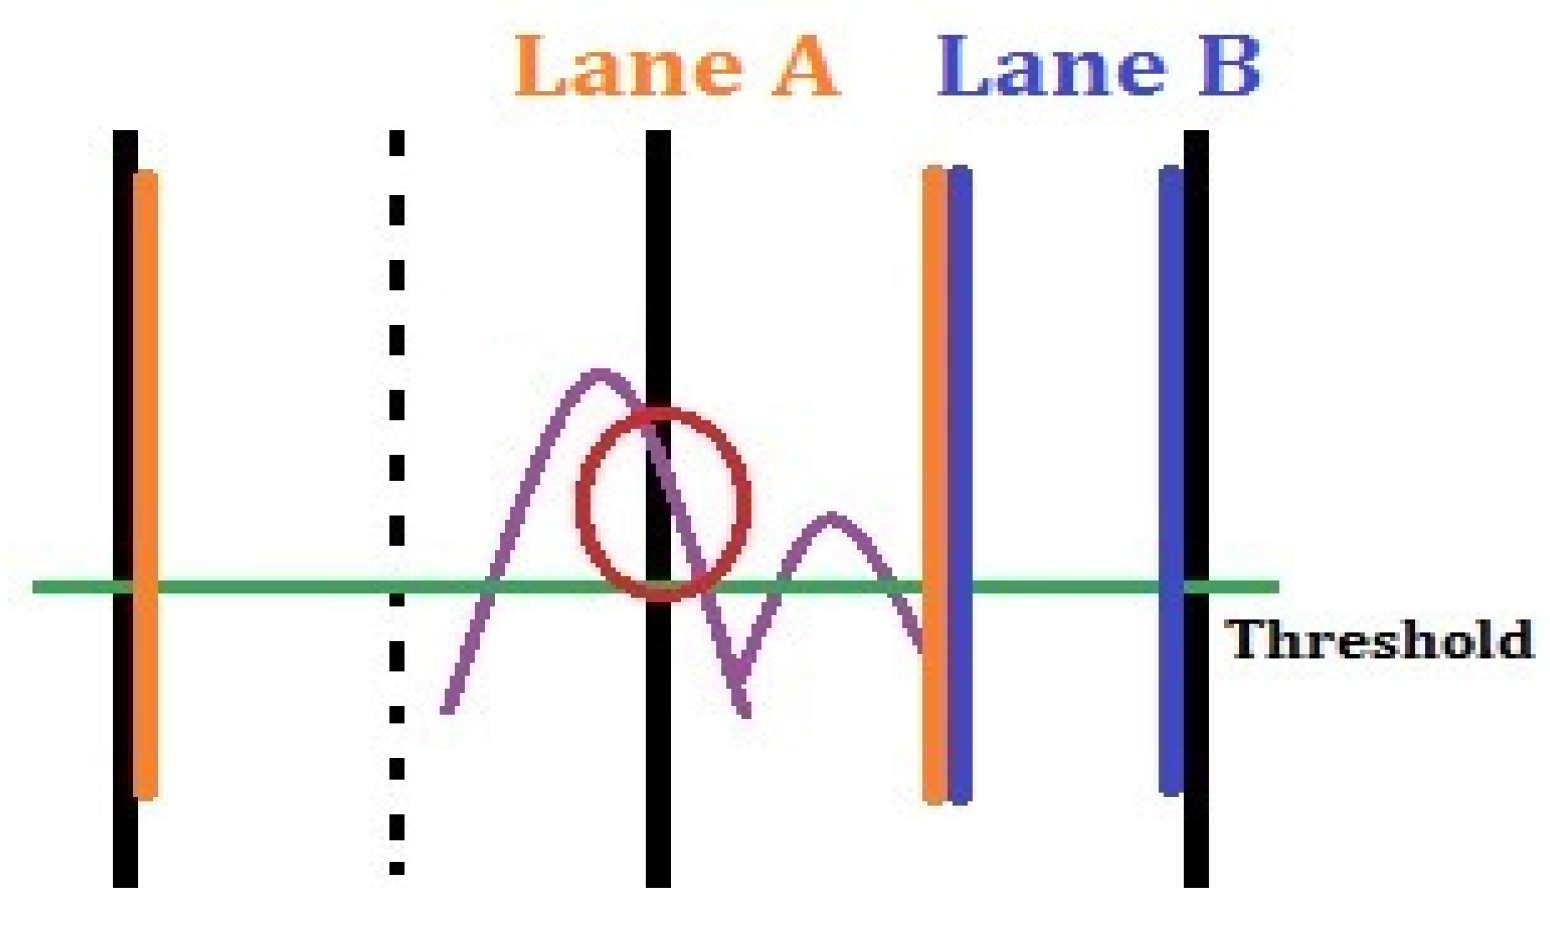
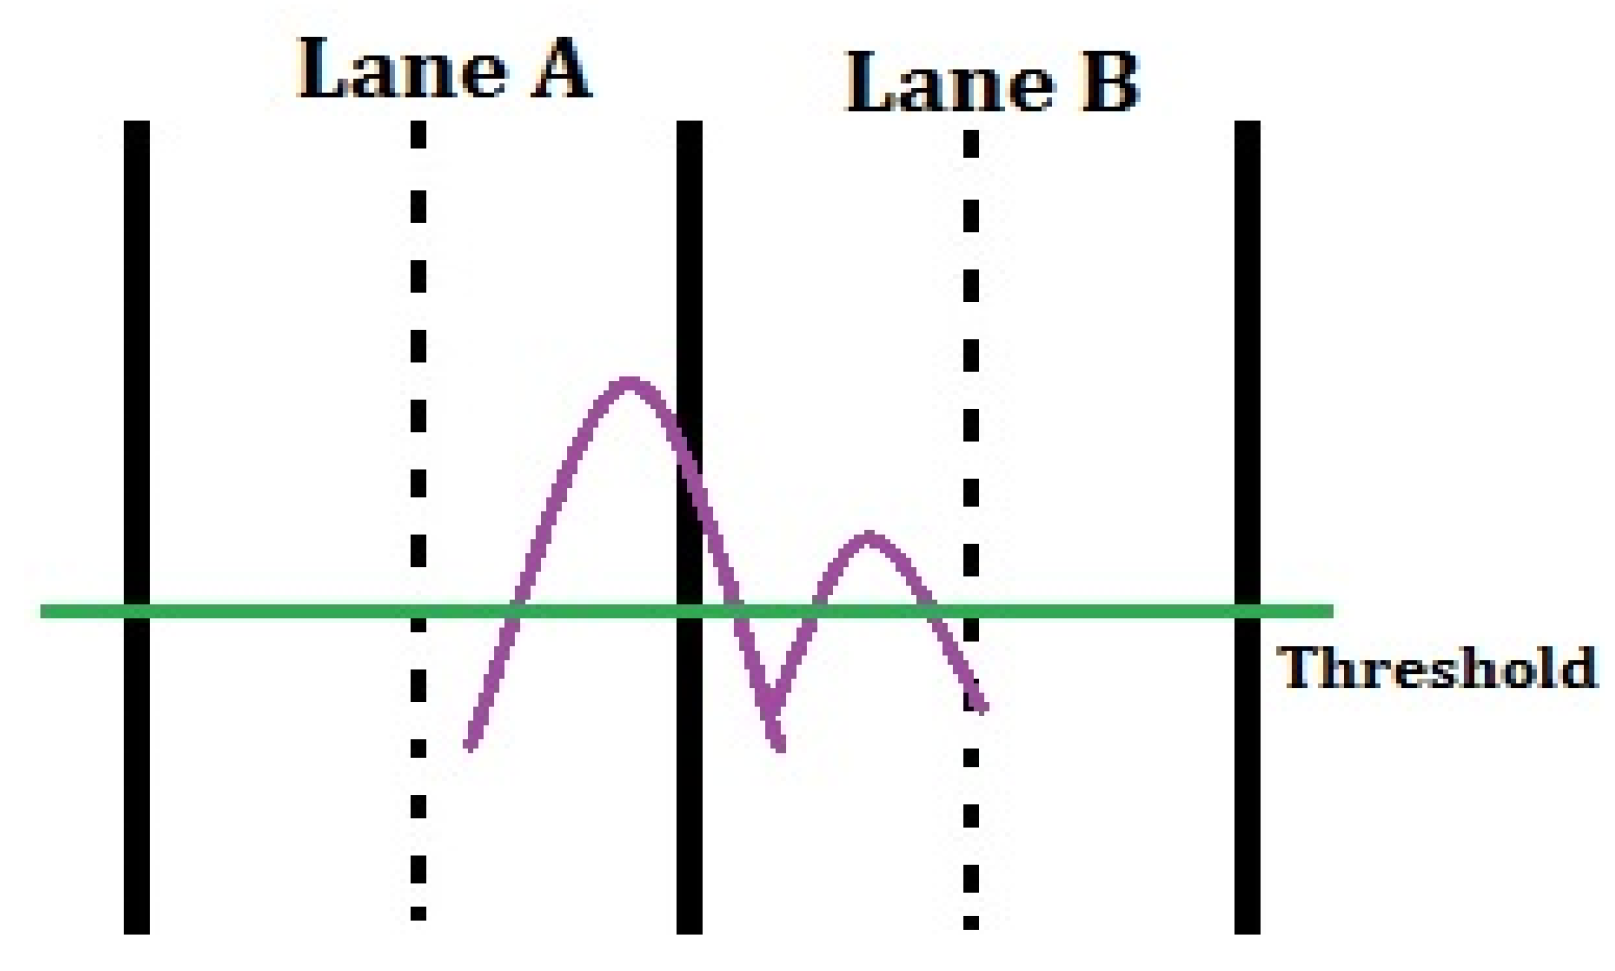
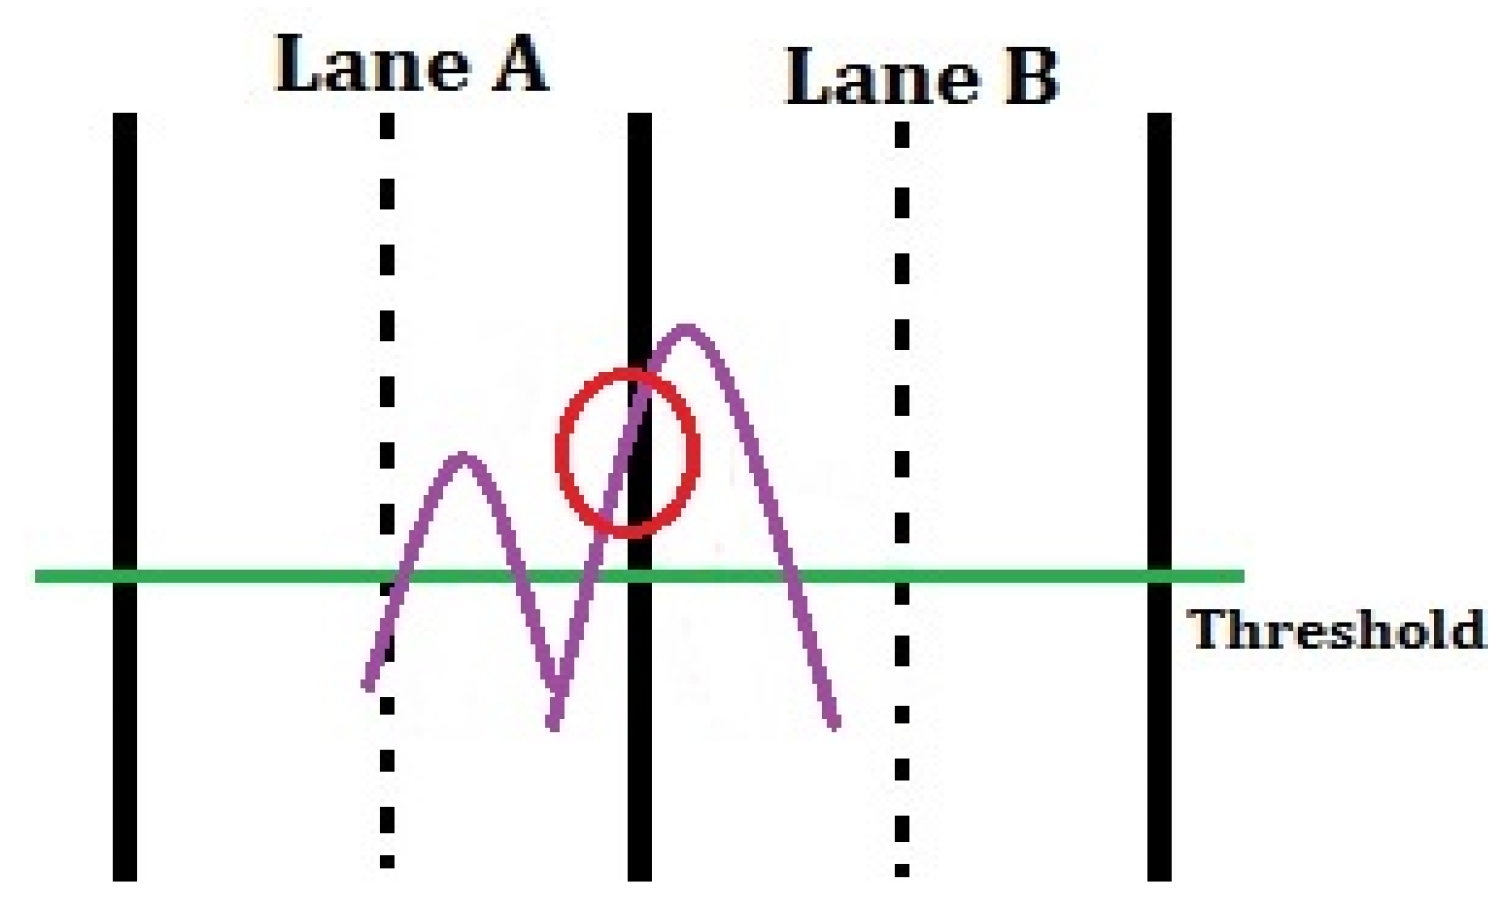
Accordingly, the conventional method utilizes no additional accessible information for refining edged FFTs to yield vehicle flow detection. In this way, the estimated traffic flow within a lane and the estimated directional traffic volume may be quite inaccurate. This mainly results from lane-crossing FFT side lobes from adjacent lanes. An example is shown in Figure 5 in which the edged FFT main lobe of a vehicle signal lies within Lane A while the edged FFT side lobe of the same vehicle signal lies within Lane B. The conventional scheme incorrectly assigns “1” as the instantaneous vehicle number within Lane B. Therefore, the foregoing unfavorable situation motivates us to develop smart methods for improving the accuracy of vehicle flow detection.

4. Proposed Smart Schemes

In this section, we present the proposed methods for enhancing the conventional approach and analyze their predicted performance.

4.1. Development of Algorithms

In the sequel, for each proposed method, we first adjust and select an appropriately fixed threshold for each lane. This is not only for removing noise but also for reducing the number of edged FFT side lobes within each lane. The edged FFT main lobe of a reflected vehicle signal within each lane is distinguishable from clutter, and is far above the threshold. The threshold for each lane is chosen adequately based on the average FFT magnitudes of environmental noises observed at the road site. More details about the threshold selection process can be found in Section 5.1.
It is observed that in a normal condition, the FFT main lobe of a vehicle signal lies within a lane since a car is normally driven within a lane. Moreover, the magnitude peak of each corresponding FFT side lobe crossing lanes is insignificant in comparison with that of any FFT main lobe so that it can be removed after being edged by an adequately selected threshold. However, when the edged FFT main lobe of the vehicle signal may partially lie on the borderline of the two adjacent lanes, it is very likely that lane-crossing edged FFT side lobes may occur, e.g., Figure 5. To mitigate some effects of lane-crossing FFT side lobes adverse to vehicle flow detection, we propose the following lane information-aided test criteria and rules for developing our methods. As such, the proposed methods consist of some combinations of the proposed criteria and rules.
  • Borderline Test Criterion 1 (BTC1): A portion of an edged FFT main lobe lies on the borderline of two adjacent lanes.
  • Borderline Test Criterion 2 (BTC2): The magnitude peak of an edged FFT main lobe satisfying the BTC1 lies on the left-hand side of the borderline.
  • Rule 1: Take the left lane width plus its adjacent 1/2 right lane width as the resulting left lane width and the remaining 1/2 right lane width as the resulting right lane width. This is to fictitiously expand the left lane, and at the same time reduce the right lane.
  • Rule 2: Use Rule 1 with “left” replaced by “right” and vice versa. This is to fictitiously increase the right lane, and at the same time decrease the left lane.
  • Rule 3: Set the portion of the edged FFT main lobe on the given borderline as zero. This is to avoid the repetitive satisfaction of BTC1 by the same given borderline.

4.1.1. Proposed Method 1

The functional procedure of the proposed method 1 is shown in Figure 6. Thus, whenever the BTC1 is met, it is supposed that an edged FFT main lobe lies within the resulting left lane. As such, the satisfaction of the BTC1 implies that one vehicle is moving within the resulting left lane, and therefore “1” is assigned as its vehicle number.

4.1.2. Proposed Method 2

The functional procedure of the proposed method 2 is depicted in Figure 7. The failure of the BTC1 implies that either an edged FFT main lobe or no edged FFT lobe lies within each resulting lane. However, if the BTC1 and BTC2 are satisfied, then it is ensured that an edged FFT main lobe lies within the resulting left lane. The satisfaction of the BTC1 and BTC2 implies that one vehicle is moving within the resulting left lane, and therefore “1” is assigned as the instantaneous vehicle number within the left lane. On the other hand, if the BTC1 is met and the BTC2 fails, then it is ensured that an edged FFT main lobe lies within the resulting right lane. In this case, one vehicle is moving within the resulting right lane, and therefore “1” is assigned as the instantaneous vehicle number within the right lane.
Unlike the proposed method 1 which can only apply Rule 1, the proposed method 2 can adaptively employ Rule 1 or 2. In this way, it is very likely to increase the accuracy of vehicle flow detection within each lane.

4.1.3. An Equivalent Alternative of Proposed Method 2

It is evident that the edged FFT of each received vehicle signal can be tagged with a distinct time stamp based on the received order of reflected vehicle signals. As such, we can employ the time stamp information for developing an equivalent alternative of the proposed method 2. The functional procedure of the proposed alternative can be found in [17] and is displayed in Figure 8.
In Figure 8, Step 2 indicates that the edged FFT of each reflected vehicle signal is tagged with a distinct time stamp. Therefore, the FFT main lobe and side lobes of the same vehicle signal have the same time stamp. Step 3 aims to reduce adverse effects of lane-crossing edged FFT side lobes. To achieve this, Step 3 disregards edged FFT side lobes having the same time stamp of the edged FFT main lobe.
The equivalence between the proposed alternative and the proposed method 2 is shown in the following section.

4.2. Predicted Performance Analysis

We show that the following three claims are true.
  • Claim 1: The accuracy of the vehicle flow detection of the proposed method 1 is better than that of the conventional method.
  • Claim 2: The accuracy of the vehicle flow detection of the proposed method 2 is better than that of the proposed method 1.
  • Claim 3: The proposed alternative and the proposed method 2 are equivalent; i.e., they yield the same result.
To show that Claim 1 is true, it suffices to demonstrate a case that the proposed method 1 yields a correct result whereas the conventional method fails. Let’s consider the case shown in Figure 5. For the proposed method 1, the BTC1 is satisfied so that Rules 1 is performed as shown in Figure 9. Consequently, the proposed method 1 yields the correct outcome that one vehicle is moving within the left lane while no car within the right lane. Therefore, the instantaneous vehicle number within the left lane is correctly given as “1”, and that within the right lane is “0”. However, the conventional method gives the incorrect result that one vehicle is moving within the left lane, and one within the right lane, too. Hence, the instantaneous vehicle number within the left lane is given as “1”, so is that within the right lane.
To show that Claim 2 is true, it suffices to illustrate a case that the proposed method 2 gives correct vehicle detection while the proposed method 1 fails. For the case shown in Figure 5, the proposed methods 1 and 2 give the same correct result. Let’s consider the case shown in Figure 10. For the proposed method 2, the BTC1 is satisfied but BTC2 fails so that Rule 2 is performed as shown in Figure 11a. Consequently, the proposed method 2 gives the detection result that one vehicle is moving within the right lane while no car within the left lane. Therefore, the instantaneous vehicle number within the left lane and that within the right lane are correctly given as “0” and “1”, respectively. Nonetheless, for the proposed method 1, the BTC1 is satisfied so that Rule 1 is performed as shown in Figure 11b. Thus, the proposed method 1 gives the incorrect outcome that one vehicle is moving within the left lane, and zero within the right lane. Therefore, the instantaneous vehicle number within the left lane and that within the right lane are incorrectly given as “1” and “0”, respectively.
To state that Claim 3 is true, it suffices to show that Step 3 of the proposed alternative is equivalent to that of the proposed method 2. Specifically, Step 3 of the proposed alternative carries out the following tasks. For each lane, we check if its resulting FFT lobes and any resulting FFT lobes of other lanes have the same time stamp (i.e., check whether they belong to the FFT of the same reflected vehicle signal). If yes, only the edged main lobe is kept while the other edged FFT lobes with the same time stamp are disregarded. This is repeated until all resulting lobes of all lanes have different time stamps. In fact, the foregoing results are equal to either the failure of the BTC1 or the satisfaction of both the BTC1 and the BTC2 or the satisfaction of the BTC1 and the failure of the BTC2. Therefore, the proposed alternative is equivalent to the proposed method 2.

5. Experimental Section

We carry out on-site experimental tests on the performance of the conventional approach and the proposed methods. The experimental results confirm that the proposed methods can achieve significant improvements over the conventional scheme. In addition, the outcomes suggest that the proposed method 2 be the best overall among the schemes tested. The experimental results and the predicted performance analysis in section 4.2 are consistent.

5.1. Experimental Setup

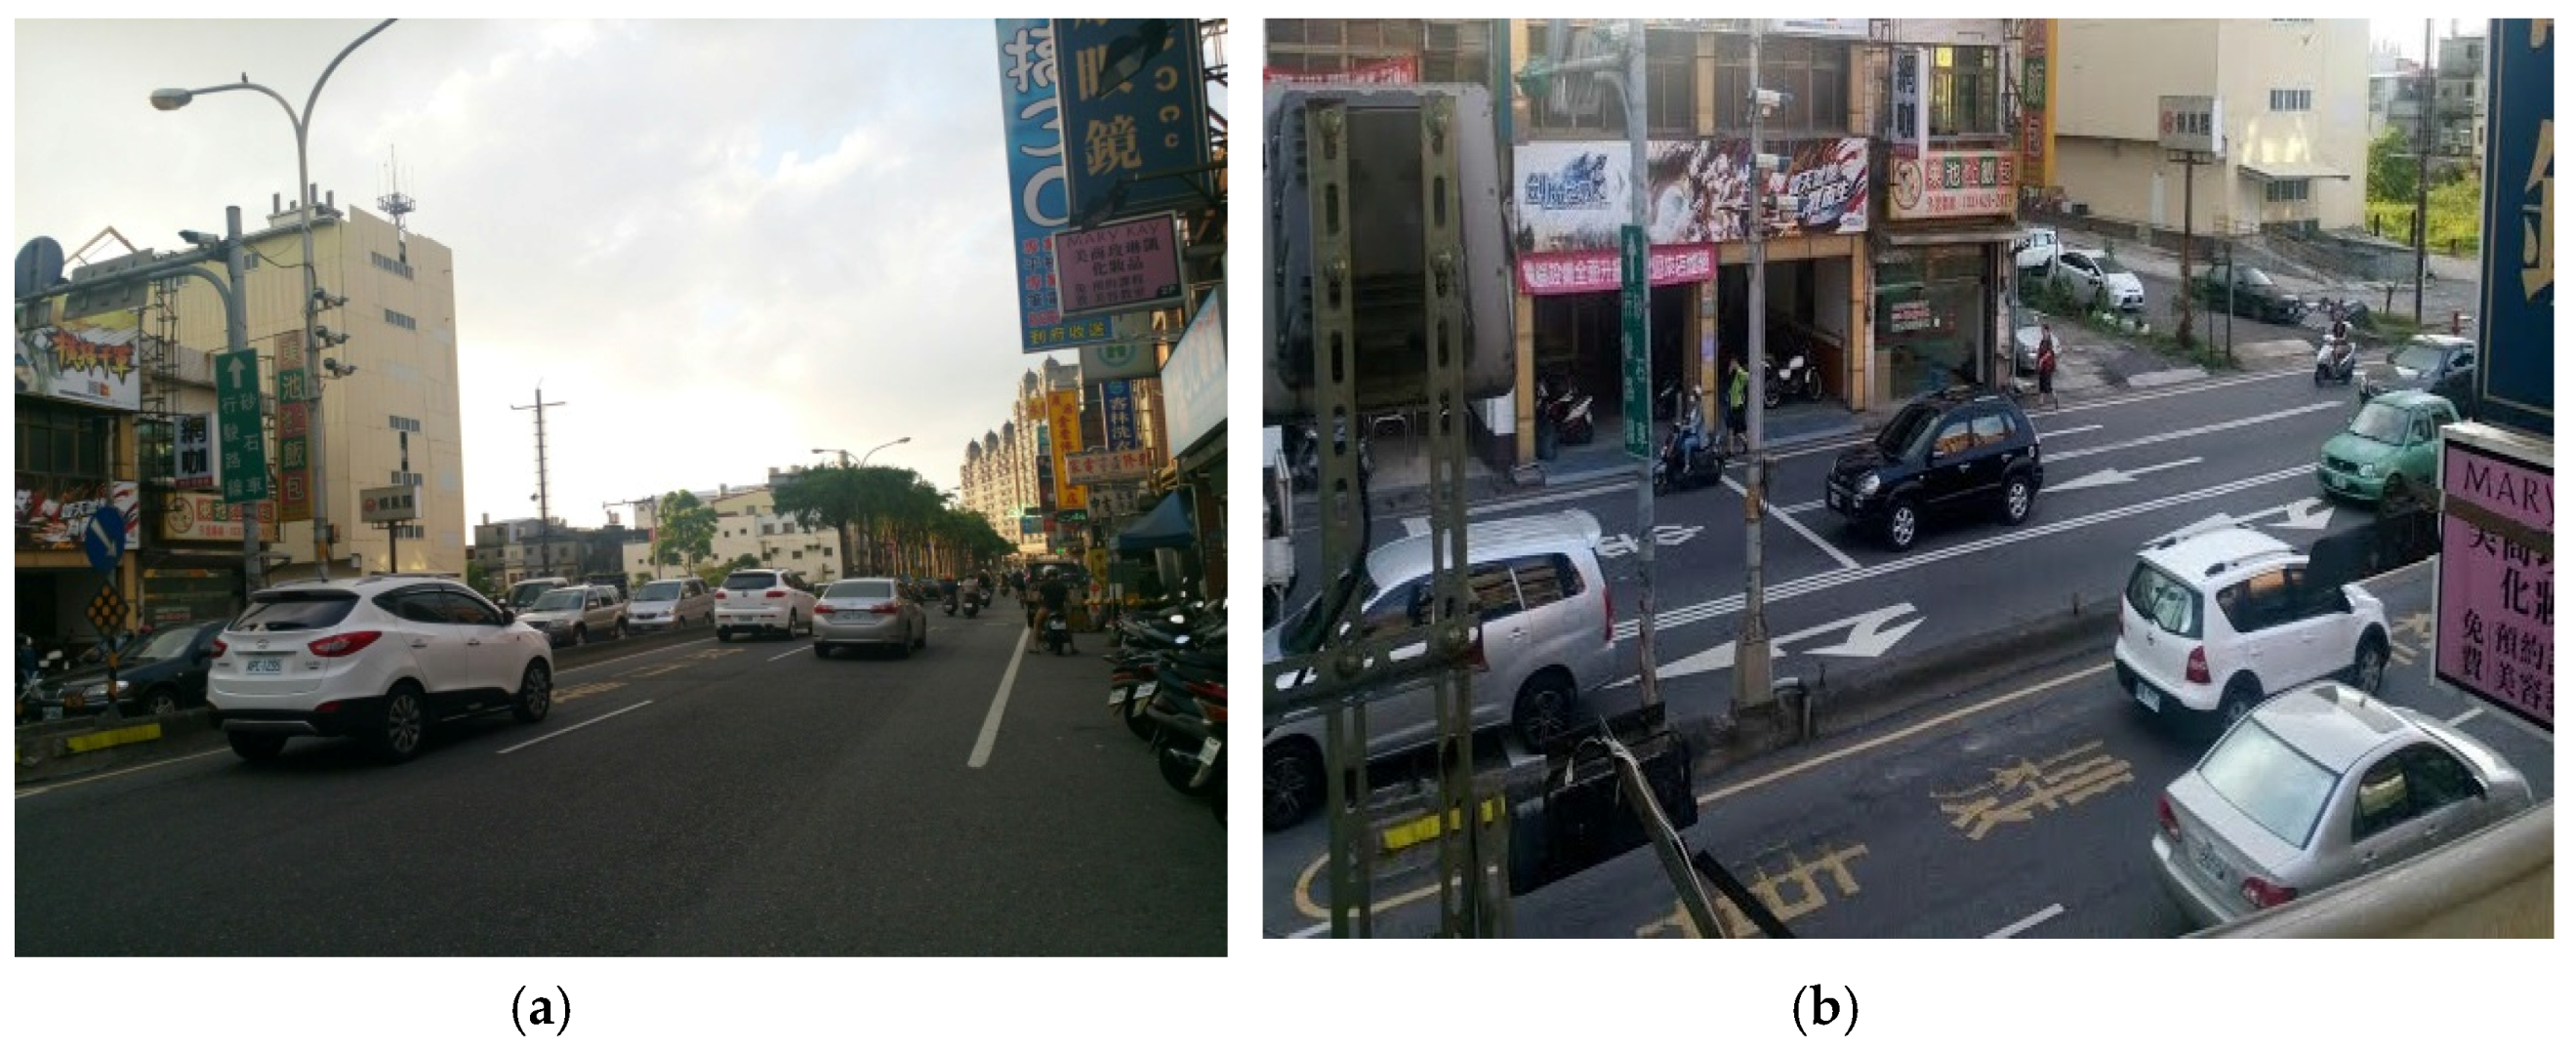
The experiments are performed at an urban road site shown in Figure 12. Two southbound lanes A and B and two northbound lanes C and D are at the site. Each lane width is around 3.5 m. Separation blocks lay between lanes B and C. Since there are separation blocks between lanes B and C, only the borderline between lanes A and B, and that between lanes C and D are considered in the proposed algorithms.
The FMCW TMRD (UUEI, Taoyuan, Taiwan) with a 10-GHz frequency band is utilized for the experiments because it is accessible to us, and is commonly and commercially used. However, the TMRD can have only one algorithm equipped for vehicle detection at each time. Therefore, we cannot use one TMRD for the performance comparisons of several algorithms using the same received signal inputs at each time. To tackle the aforementioned situation, two TMRDs are deployed as shown in Figure 13 for testing the performance of two algorithms at each time block. FMCW transmissions by the two TMRDs are synchronized. Besides, the two TMRDs are close to each other and placed at 4 ~ 5 m in height. It is ensured that the two TMRDs can operate simultaneously without mutual FMCW interferences. No extra space at the site is available for the deployment of a third TMRD so that the height requirement and limitation can be met. This is because many business advertisements excessively occupy building walls.
To begin with, we properly set thresholds for the proposed and conventional methods. This is achieved empirically as follows. For several days, we observe and record many FFT magnitudes of environment noise within the detection zone of each lane under the conditions with no vehicles or with vehicles. To demonstrate this, we display Figure 14. Figure 14a is a snapshot of those observations within the detection zone of each lane under the conditions with no vehicles while Figure 14b is under the conditions with vehicles. Subsequently, we approximate the average of ensemble FFT peaks of noise within a lane as the threshold value corresponding to the lane. As a result, 22, 21, 15 and 15 are given as threshold values for lanes A, B, C and D, respectively. Figure 15 is a snapshot of the edged FFTs of received vehicle signals and clutter after the threshold values are applied. The threshold value for the conventional method is chosen as 31 because for many times, the value 31 is instantaneously observed and recorded as the overall maximum FFT peaks of noise within all lanes. An instance is shown in Figure 14b.
Though the aforementioned threshold selection process is utilized for our experiments herein, it can also be used at other test sites. However, selected threshold values for one site can be very different from those for the other places.
For each method, the detection accuracy of lane vehicle flow (LVF) for lane i with i = A , B , C , D , is evaluated based on
LVF accuracy = ( 1 | actual vehicle no. of lane  i - detected vehicle no .  of lane  i | actual vehicle no .  of lane  i ) × 100 %
For each method, the detection accuracy of directional traffic volume (DTV) for lanes i and j with ( i , j ) = ( A , B )  or  ( C , D ) is evaluated based on
DTV accuracy = ( 1 | actual total vehicle no .  of lanes  i  and  j - detected total vehicle no .  of lanes  i  and  j | actual total vehicle no .  of lanes  i  and  j   ) × 100 %
The actual vehicle no. of a lane is counted once at each time as long as a vehicle passes the pre-selected exit point of the detection zone of the lane. Therefore, if a vehicle makes and completes a lane change when it passes the detection zone, we count one as the actual vehicle no. in current lane while zero as the actual vehicle no. in previous lane. This ensures that the actual vehicle no. of a lane at each time block is obtained with no double counts. Accordingly, Equations (5) and (6) would not incorrectly increase the detection accuracies of LVF and DTV.

5.2. Experimental Results

We undertake many experimental tests during various time periods for several work days. Specifically, we evaluate the performance of algorithms during representative time blocks of light, moderate, and busy traffic conditions. Time slots of midnight, noon, and morning and evening rush hours are accordingly taken into account. Experimental results are given in Table 1, Table 2, Table 3, Table 4, Table 5, Table 6, Table 7, Table 8, Table 9, Table 10, Table 11 and Table 12. Table 1, Table 2 and Table 3, Table 4, Table 5 and Table 6 and Table 7, Table 8, Table 9, Table 10, Table 11 and Table 12 show the performance comparisons for light, moderate and rush-hour traffic, respectively. The traffic detection accuracies of the experiments are consistent for the same time slot of work days. In other words, they are unbiased and reliable.
The results show that LVF and DTV detection accuracies given by the proposed methods are significantly higher than those by the conventional method. It is noted that DTV detection accuracy of each proposed method is nearly perfect. Moreover, the proposed method 2 generally achieves better LVF detection accuracy than the proposed method 1. Accordingly, it is confirmed that the proposed methods can tackle the problem of lane-crossing FFT side lobes more appropriately. In addition, the proposed method 2 can achieve the best overall performance among the schemes tested.
Table 1, Table 2, Table 3, Table 4, Table 5, Table 6, Table 7, Table 8, Table 9, Table 10, Table 11 and Table 12 show that the detected vehicle number of lane A (lane D) given by the proposed methods tend to be less than the actual vehicle number. Conversely, the detected vehicle number on lane B (lane C) given by the proposed methods tends to be more than the actual vehicle number. This phenomenon may be explained by using road site traffic conditions. A car within lane A (lane D) may be driven close to or may slightly cross the borderline between lanes A and B (lanes D and C) for avoiding motorcycles and bicycles on the sideway beside lane A (lane D). Therefore, the magnitude peak of an edged FFT main lobe which should belong to lane A (lane D) may appear within lane B (lane C). However, since separation blocks are between lanes B and C, lane B (lane C) drivers cannot do what lane A (lane D) drivers do. The gain of the vehicle number within lane B (lane C) and the loss of the vehicle number within lane A (lane D) are almost balanced. Therefore, the proposed methods achieve very high DTV detection accuracy.

6. Conclusions

In this paper, we have presented plausible methods for a FMCW TMRD system to achieve high detection accuracy of multiple-lane vehicle flow and traffic volume. Noticeably, FFT-, and lane-related information are incorporated into the development of the proposed methods 1 and 2. Unlike the conventional scheme, the proposed methods can make smart decisions for reducing the effects of FFT side lobes of vehicle signals adverse to traffic detection. Therefore, the proposed methods can significantly outperform the conventional method. Predicted performance analysis shows that the proposed method 2 is more sophisticated and adaptive in terms of the detection of vehicle number within a lane than the proposed method 1. Based on FFT and time-stamp information, we can also obtain an equivalent alternative of the proposed method 2. On-site experiments have confirmed that the proposed methods 1 and 2 significantly outperform the conventional scheme. In addition, the proposed method 2 can achieve the best overall performance over the proposed method 1.

Acknowledgments

This research work of T.-J. H. was partially supported by Chung Yuan Christian University.

Author Contributions

T.-J.H. and M.-J.C. initiated and discussed the research problem; T.-J.H conceived and developed the methods; M.-J.C. performed the experiments and took photos; M.-J.C. and T.-J.H. analyzed the data; T.-J.H. prepared and wrote the paper.

Conflicts of Interest

The authors declare no conflict of interest.

References

  1. Traffic Detector Handbook: Third Edition-Volume I. Available online: https://www.fhwa.dot.gov/ publications/research/operations/its/06108/06108.pdf (accessed on 11 October 2006).
  2. Ceng, M.D. Method of using radar vehicle detector to determine vehicle type, speed, and radar detection zone width. Taiwan Patent I395162. Available online: http://twpat3.tipo.gov.tw/tipotwoc/tipotwekm (accessed on 1 May 2013).
  3. Wang, T. Wireless traffic sensor system. United States Patent 8918270. Available online: http://patft.uspto.gov/netahtml/PTO/srchnum.htm (accessed on 23 December 2014).
  4. Kim, I.S.; Jeong, K.; Jeong, J.K. Two novel radar vehicle detectors for the replacement of a conventional loop detector. Microwave J 2001, 44, 22–40. [Google Scholar]
  5. Yu, X.; Prevedouros, P.D.; Sulijoadikusumo, G. Evaluation of autoscope, smartsensor HD and infra-red traffic logger for vehicle classification. Transp. Res. Rec. J. Transp. Res. Board 2110, 2160, 77–86. [Google Scholar] [CrossRef]
  6. Vehicle detect and monitor techniques for intelligent transportation—A survey. Available online: http://www.iosrjournals.org/iosr-jmce/papers/scicete(civil)-volume4/48.pdf (accessed on 10 December 2009).
  7. Yu, X.; Prevedouros, P.D. Performance and challenges in utilizing non-intrusive sensors for traffic data collection. Adv. Remote Sens. 2013, 2, 45–50. [Google Scholar] [CrossRef]
  8. Krawczyk, G.; Suda, J. Evaluation of integrated vehicle detector for usage in ports. Sci. J. 2014, 38, 50–56. [Google Scholar]
  9. Stove, A.G. Linear FMCW radar techniques. IEE Proc. F. Radar Signal Proc. 1992, 139, 343–350. [Google Scholar] [CrossRef]
  10. Jefferis, B.; Morgan, S.D. Vehicle Detection Systems. United States Patent 5339081. Available online: http://patft.uspto.gov/netahtml/PTO/srchnum.htm (accessed on 16 August 1994).
  11. Hsieh, J.W.; Yu, S.H.; Chen, Y.S.; Hu, W.F. Automatic traffic surveillance system for vehicle tracking and classification. IEEE Trans. Intell. Transp. Syst. 2006, 7, 175–187. [Google Scholar] [CrossRef]
  12. Park, S.J.; Kim, T.Y.; Kang, S.M.; Koo, K.H. A Novel Signal Processing Technique for Vehicle Detection Radar. In Proceedings of the 2003 IEEE MTT-S International Symposium Digest, Philadelphia, PA, USA, 8–13 June 2003.
  13. Yao, C.L. Vehicle Detection Using Endpoint Detection Method for FMCW Radar Detector. Master Thesis, Department of Transportation Technology and Management, National Chiao Tung University, Taiwan, August 2010. [Google Scholar]
  14. Jeng, S.L.; Chieng, W.H.; Lu, H.P. Estimating speed using a side-looking single-radar vehicle detector. IEEE Trans. Intell. Transp. Syst. 2014, 15, 607–614. [Google Scholar] [CrossRef]
  15. Lu, H.P.; Tsao, P.C.; Yang, C.M.; Hsu, H.J. Vehicel Detector and Method for Measuring Distance and Velocity of Vehicle. Taiwan Patent I474030. Available online: http://twpat3.tipo.gov.tw/tipotwoc/tipotwekm (accessed on 21 February 2015).
  16. Chang, K.W.; Wang, H.; Shreve, G. Forward-looking automotive radar using a W-band single-chip transceiver. IEEE Trans. Microwave Theory Tech. 1995, 43, 1659–1668. [Google Scholar] [CrossRef]
  17. Ho, T.J.; Chung, M.J. An Approach to Traffic Flow Detection Improvements of Non-contact Microwave Radar Detectors. In Proceedings of the 2016 IEEE International Conference on Applied System Innovation, Okinawa, Japan, 28 May–1 June 2016.
Figure 1. Functional structure of the frequency-modulated continuous waveform (FMCW) traffic microwave radar detector (TMRD) system.
Applsci 06 00196 g001
Figure 2. Sideway-looking traffic sensing of the FMCW TMRD.
Applsci 06 00196 g002
Figure 3. Frequency versus time characteristics for the FMCW.
Applsci 06 00196 g003
Figure 4. The functional procedure of the conventional approach.
Applsci 06 00196 g004
Figure 5. An example of the fast Fourier transforms (FFT) main lobe lying within the left lane and a FFT side lobe lying within the right lane.
Applsci 06 00196 g005
Figure 6. Functional procedure of the proposed method 1.
Applsci 06 00196 g006
Figure 7. Functional procedure of the proposed method 2.
Applsci 06 00196 g007
Figure 8. Functional procedure of the proposed alternative.
Applsci 06 00196 g008
Figure 9. The result of handling the case shown in Figure 5 using the proposed method 1.
Applsci 06 00196 g009
Figure 10. An example of the FFT main lobe lying within the right lane and a FFT side lobe lying within the left lane.
Applsci 06 00196 g010
Figure 11. The results of handling the case in Figure 10 using the proposed methods. (a) The outcome using the proposed method 2; (b) The outcome using the proposed method 1.
Applsci 06 00196 g011
Figure 12. Urban road site for traffic experimental tests. (a) Road site viewed fromthe sideway; (b) Road site viewed from the deployed TMRDs.
Applsci 06 00196 g012
Figure 13. Two TMRDs deployed at the road site.
Applsci 06 00196 g013
Figure 14. Threshold selection for traffic experimental tests. (a) A snapshot of FFT magnitude of environment noise within each lane with no vehicles; (b) A snapshot of FFT magnitudes of both environment noise and vehicle signal within each lane.
Applsci 06 00196 g014
Figure 15. A snapshot of edged FFTs of received vehicle signals and clutter.
Applsci 06 00196 g015
Table 1. Results of LVF (lane vehicle flow) and DTV (directional traffic volume) detection during 12:25–12:35 AM (light traffic) using (a) proposed method 2 and (b) conventional method.
(a) Proposed Method 2
LaneActual Vehicle NumberDetected Vehicle NumberLVF AccuracyDTV Accuracy
A232191.3%98.1%
B303196.7%
C272992.6%100%
D232191.3%
(b) Conventional Method
LaneActual Vehicle NumberDetected Vehicle NumberLVF AccuracyDTV Accuracy
A232782.6%81.1%
B303680.0%
C273377.8%80.0%
D232782.6%
Table 2. Results of LVF and DTV detection during 12:45–12:55 AM (light traffic) using (a) proposed method 1 and (b) conventional method.
(a) Proposed Method 1
LaneActual Vehicle NumberDetected Vehicle NumberLVF AccuracyDTV Accuracy
A191789.5%97.4%
B202195.0%
C232591.3%97.9%
D252288.0%
(b) Conventional Method
LaneActual Vehicle NumberDetected Vehicle NumberLVF AccuracyDTV Accuracy
A192378.9%76.9%
B202575.0%
C232687.0%81.3%
D253176.0%
Table 3. Results of LVF and DTV detection during 1:10–1:20 AM (light traffic) using (a) proposed method 2 and (b) proposed method 1.
(a) Proposed Method 2
LaneActual Vehicle NumberDetected Vehicle NumberLVF AccuracyDTV Accuracy
A201890.0%97.5%
B202195.0%
C222490.9%100%
D262492.3%
(b) Proposed Method 1
LaneActual Vehicle numberDetected Vehicle NumberLVF AccuracyDTV Accuracy
A201785.0%97.5%
B202290.0%
C222490.9%97.9%
D262388.5%
Table 4. Results of LVF and DTV detection during 8:30–8:40 AM (rush-hour traffic) using (a) proposed method 2 and (b) conventional method.
(a) Proposed Method 2
LaneActual Vehicle NumberDetected Vehicle NumberLVF AccuracyDTV Accuracy
A767294.7%99.4%
B9510094.7%
C909495.6%98.8%
D857992.9%
(b) Conventional Method
LaneActual Vehicle NumberDetected Vehicle NumberLVF AccuracyDTV Accuracy
A768489.5%88.3%
B9510787.4%
C909990.0%89.1%
D859588.2%
Table 5. Results of LVF and DTV detection during 8:50–9:00 AM (rush-hour traffic) using (a) proposed method 1 and (b) conventional method.
(a) Proposed Method 1
LaneActual Vehicle NumberDetected Vehicle NumberLVF AccuracyDTV Accuracy
A868093.0%99.4%
B768193.4%
C798592.4%100%
D807492.5%
(b) Conventional Method
LaneActual Vehicle NumberDetected Vehicle NumberLVF AccuracyDTV Accuracy
A869490.7%89.5%
B768588.2%
C799086.1%86.8%
D809087.5%
Table 6. Results of LVF and DTV detection during 9:10–9:20 AM (rush-hour traffic) using (a) proposed method 2 and (b) proposed method 1.
(a) Proposed Method 2
LaneActual Vehicle NumberDetected Vehicle NumberLVF AccuracyDTV Accuracy
A555396.4%99.1%
B596294.9%
C515592.2%99.0%
D524994.2%
(b) Proposed Method 1
LaneActual Vehicle NumberDetected Vehicle NumberLVF AccuracyDTV Accuracy
A555192.7%99.1%
B596491.5%
C515690.2%100%
D524790.4%
Table 7. Results of LVF and DTV detection during 12:00–12:10 PM (moderate traffic) using (a) proposed method 2 and (b) conventional method.
(a) Proposed Method 2
LaneActual Vehicle NumberDetected Vehicle NumberLVF AccuracyDTV Accuracy
A605693.3%100%
B747894.6%
C626693.5%100%
D736994.5%
(b) Conventional Method
LaneActual Vehicle NumberDetected Vehicle NumberLVF AccuracyDTV Accuracy
A606788.3%90.3%
B748091.9%
C626890.3%89.6%
D738189.0%
Table 8. Results of LVF and DTV detection during 12:20–12:30 PM (moderate traffic) using (a) proposed method 1 and (b) conventional method.
(a) Proposed Method 1
LaneActual Vehicle NumberDetected Vehicle NumberLVF AccuracyDTV Accuracy
A565394.6%98.4%
B697492.8%
C586391.4%99.2%
D666293.9%
(b) Conventional Method
LaneActual Vehicle NumberDetected Vehicle NumberLVF AccuracyDTV Accuracy
A566485.7%88.0%
B697689.9%
C586489.7%89.5%
D667389.4%
Table 9. Results of LVF and DTV detection during 12:40–12:50 PM (moderate traffic) using (a) proposed method 2 and (b) proposed method 1.
(a) Proposed Method 2
LaneActual Vehicle NumberDetected Vehicle NumberLVF AccuracyDTV Accuracy
A535094.3%99.2%
B717594.4%
C626595.2%100%
D595694.9%
(b) Proposed Method 1
LaneActual Vehicle NumberDetected Vehicle NumberLVF AccuracyDTV Accuracy
A534992.5%100%
B717594.4%
C626693.5%100%
D595594.2%
Table 10. Results of LVF and DTV detection during 7:30–7:40 PM (rush-hour traffic) using (a) proposed method 2 and (b) conventional method.
(a) Proposed Method 2
LaneActual Vehicle NumberDetected Vehicle NumberLVF AccuracyDTV Accuracy
A11912495.8%99.2%
B12312098.4%
C848895.2%99.4%
D948994.7%
(b) Conventional Method
LaneActual Vehicle NumberDetected Vehicle NumberLVF AccuracyDTV Accuracy
A11913586.6%87.6%
B12313788.6%
C849685.7%86.5%
D9410687.2%
Table 11. Results of LVF and DTV detection during 7:50–8:00 PM (rush-hour traffic) using (a) proposed method 1 and (b) conventional method.
(a) Proposed Method 1
LaneActual Vehicle NumberDetected Vehicle NumberLVF AccuracyDTV Accuracy
A667290.9%100%
B958993.7%
C717791.5%99.4%
D898494.4%
(b) Conventional Method
LaneActual Vehicle NumberDetected Vehicle NumberLVF AccuracyDTV Accuracy
A667487.9%90.0%
B9510391.6%
C717890.1%89.3%
D899988.8%
Table 12. Results of LVF and DTV detection during 8:10–8:20 PM (rush-hour traffic) using (a) proposed method 2 and (b) proposed method 1.
(a) Proposed Method 2
LaneActual Vehicle NumberDetected Vehicle NumberLVF AccuracyDTV Accuracy
A787494.9%100%
B899395.5%
C656895.4%97.9%
D787292.3%
(b) Proposed Method 1
LaneActual SSVehicle NumberDetected Vehicle NumberLVF AccuracyDTV Accuracy
A787393.6%98.8%
B899296.6%
C656796.9%95.8%
D787089.7%

