Review

Acoustic Emissions to Measure Drought-Induced Cavitation in Plants

by
Linus De Roo
*,†,
Lidewei L. Vergeynst
,
Niels J.F. De Baerdemaeker
and
Kathy Steppe
Laboratory of Plant Ecology, Department of Applied Ecology and Environmental Biology, Faculty of Bioscience Engineering, Ghent University, Coupure links 653, 9000 Gent, Belgium
*
Author to whom correspondence should be addressed.
These authors contributed equally to this work.
Appl. Sci. 2016, 6(3), 71; https://doi.org/10.3390/app6030071
Submission received: 30 December 2015 / Revised: 25 January 2016 / Accepted: 27 January 2016 / Published: 4 March 2016
(This article belongs to the Special Issue Acoustic and Elastic Waves: Recent Trends in Science and Engineering)

Abstract

:
Acoustic emissions are frequently used in material sciences and engineering applications for structural health monitoring. It is known that plants also emit acoustic emissions, and their application in plant sciences is rapidly increasing, especially to investigate drought-induced plant stress. Vulnerability to drought-induced cavitation is a key trait of plant water relations, and contains valuable information about how plants may cope with drought stress. There is, however, no consensus in literature about how this is best measured. Here, we discuss detection of acoustic emissions as a measure for drought-induced cavitation. Past research and the current state of the art are reviewed. We also discuss how the acoustic emission technique can help solve some of the main issues regarding quantification of the degree of cavitation, and how it can contribute to our knowledge about plant behavior during drought stress. So far, crossbreeding in the field of material sciences proved very successful, and we therefore recommend continuing in this direction in future research.

Graphical Abstract

1. Introduction

Stress in materials or structures is often accompanied by the built up of mechanical pressures, which, upon release, lead to elastic wave propagation away from the stressed zone [1]. These waves are called acoustic emissions. Today, the acoustic emission technique is widely applied for material testing and structural health monitoring on engineering materials such as concrete [2,3,4], metal alloys [5] and fiber composite materials [6]. However, the oldest reported scientifically planned acoustic emission experiment avant la lettre was performed on wood in 1933 by Fuyuhiko Kishinouye [3,7,8], long before the term acoustic emission (AE) was introduced by Schofield in 1961 [3]. In 1966, Milburn and Johnson used a similar measurement set-up as Kishinouye to detect for the first time AE signals in plants, when they were subjected to dehydration.
Nowadays, drought associated with global warming gains increasing interest. How plants cope with drought stress is a topic of an intense debate [9,10,11,12,13,14,15,16] and urges the need for a good measure of drought stress. In this paper, the relevant literature contributing to the development of the AE technique is reviewed in order to propose it as a promising method to measure drought-induced cavitation in plants.
Before starting, we want to point out the different use of the concept stress between physicists and plant scientists. As described by Lichtenthaler [17] and according to physics, stress in plants means the state of a plant under the condition of a force applied. The response of the plant to this stress is called strain as long as no damage occurs. This distinction is not often made in plant sciences, where stress and strain are mostly used interchangeably, but which can be confusing in other research fields. Therefore, in what follows, we will use both physically defined terms as an attempt to also introduce this stress concept in plant sciences.

2. The Importance of Water

On a daily basis, plants extract water from the soil via the roots from where it is transported in the stem towards the leaves, where it eventually transpires into the atmosphere [18]. This seemingly wasteful process is vital for plant survival. Water is the transport medium that carries nutrients from the soil towards the plant organs and distributes generated carbohydrates throughout the plant. The evaporation of water in the stomata of leaves provides a cooling function, which is necessary to prevent overheating of leaves during sunny days. The water in living cells also provides a crucial role in the firmness and elasticity of soft tissues. The positive pressure that is exerted on the cell walls, called turgor pressure, is essential for growth (through cell growth and cell division) and fulfills the role of backbone in non-woody tissues such as leaves and petioles. Only a minor fraction of the transported water (<1%) is used to make new plant material through photosynthesis [19,20]. Given this multitude of functions, it is hence no wonder that water shortage is one of the main causes of plant mortality [21,22].
Water is transported in the xylem tissue of the plant following a gradient in water potential. Xylem is a porous structure of dead cells containing a network of parallel conduits, interconnected by pits [23]. The xylem conduits operate under negative pressure, or tension. According to the cohesion-tension theory [18], the origin of this tension is the evaporation of water in the stomatal region. When the stomata in the leaves are open, water is transpired due to the difference in water vapour pressure between the atmosphere and the substomatal cavity. As water evaporates into the air spaces in the leaf, water menisci in the small capillaries (nanometer scale) in adjacent cell walls are retracted and capillary forces (due to strong adhesion) pull the menisci back towards the surface. The network of many small capillaries in the cell wall acts thus as a wick for water rise [24]. Thanks to the strong cohesion between water molecules, the tension is transmitted downwards and water can be drawn towards the leaves. The tension in the xylem conduits may increase enormously when faced with a dry soil or with a great transpirational demand that exceeds the rate of water supply from the roots or from internal water reserves. This involves a risk of gas bubbles entering the conduits, which may expand and quickly fill the whole conduit. The water released from the conduits during this process may contribute to the transpiration stream, but on the other hand, the water conducting system will be locally interrupted. Because adjacent conduits are interconnected via pits in the conduit walls, the sap may circumvent the embolized conduit. However, when too many conduits are embolized, this will impair plant functioning. The formation of air emboli that block sap flow in xylem conduits is currently of high interest because it is one of the key processes leading to plant mortality during drought [22]. The phenomenon is called cavitation, which is the mechanical breakage of the continuous xylem water column and occurs when the tensile strength of the column is exceeded [25]. According to the current knowledge, the main cause of cavitation is the failure of a pit in the conduit wall to prevent gas from entering the conduit at strong tension [26], known as the air-seeding hypothesis [27]. Recently, Schenk et al. [28] postulated that nanobubbles are snapped off during air-seeding. These nanobubbles are stabilized by surfactants and may exist in plant sap under tension. They may eventually result in an embolism when the size of the nanobubble exceeds a critical threshold due to increasing tension or when many nanobubbles coalesce.
A plant’s vulnerability to cavitation is often used as a key feature of its drought resistance [29], and has been defined by plotting the percentage loss of hydraulic conductivity (PLC, %) against decreasing xylem water potential (ψ, MPa), which results in a vulnerability curve (VC) (Figure 1) [30]. The xylem water potential at 50% PLC (P50) is the most common parameter to describe a species “drought resistance”. The cumulative number of AE, originating from cavitation events, are a good estimate for conductivity loss [31,32,33,34,35] and thus has the potential to be used as an indirect and non-destructive method to construct VCs and to determine drought resistance of plants.
Because of prevailing tensions in plants, xylem is under a metastable state [37,38], which makes it a difficult object to study. A small intrusion in the tissue will cause the formation of emboli in the conduits, hereby influencing the very mechanism that is about to be studied. Therefore, the current destructive methods are under intense debate [31,39], triggered as well by recent evidence for possible artefacts in these techniques [40,41]. The use of the non-destructive AE technique has therefore gained renewed interest in plant sciences [31,33]. In particular, the question about how plants cope with drought stress in a changing climate, and which mechanisms are underlying drought resistance are gaining increased importance [9,11,29]. Application of AE in plant research can help with answering these fundamental questions to increase our knowledge on drought tolerance of plants and their ability to recover from and adapt to predicted future droughts.

3. Acoustic Emission (AE) Application to Measure Drought-Induced Cavitation: From Past to Present

As stated in the introduction, Milburn and Johnson [42] recorded sounds in plants when they were subjected to dehydration. They detected audible vibrations (<20 kHz) in petioles of dehydrating leaves of diverse plant species by fixing the petiole on a phonograph pick-up needle (Figure 2). Because measurements were often disturbed by environmental noise, the step was made towards AE detection in the ultrasonic frequency range (>20 kHz) by Tyree and Dixon [43]. This has facilitated various experiments because the problematic ambient noise in the audible range could be electronically filtered. Based on similar sound production by the rupture of plant sap under tension in glass tubes [18,44], it was hypothesized that the rupture of sap in plant conduits produced the observed sounds during drying. Although extensive circumstantial evidence was provided to support this hypothesis [45,46,47,48], it was realized that sounds may be produced by other mechanisms too. Sounds were observed during drying of plant tissues that do not contain conduits [45,49], during re-watering [48], and also during freezing [50,51,52] and thawing [50,51]. The AE technique is also applied to monitor internal cracking of wood during drying [53,54] and soaking [53]. Moreover, Gagliano et al. [55] speculated that plants may actively produce sounds for short-distance communication. AE detection is thus an interesting tool, applicable in a wide range of domains. Further scope of this review is, however, on its application in the detection of drought-induced cavitation in plants.
During dehydration of fresh plant material, AE signal detection was found to be a valid method to measure cavitation in woody branches [35], leaves [56], herbaceous stems [57] and sap wood sections [49], while others found a poor correspondence between hydraulic and acoustic measurements [58,59]. Especially in angiosperm species, the continued AE activity after loss of most of the hydraulic conductivity was a great cause of concern [31,60]. Other processes than cavitation in sap-conducting elements that could cause extra AE signals during drought stress have been suggested by various authors: cavitation of fibers, wood tracheids or ray cells [58,59,61,62], mechanical strains [25,48], and microscopic failure [43,63,64]. Moreover, the actual mechanism that causes cavitation-related AE signals is not exactly known. Different processes have also been suggested: vibration of the conduit wall after sudden pressure release due to cavitation [42,43,60], oscillation of hydrogen bounds in water after pressure release [43], conversion from liquid water to vapour during cavitation of the water [25], pit membrane rupture [65], torus aspiration (in gymnosperms [43]), the entry of a gas bubble through a pore in the pit membrane [25], and subsequent bubble oscillation [23]. Moreover, as the number of detected cavitation related AE signals may be larger than the number of cavitated conduits [56,66,67], different AE-inducing processes might be involved during cavitation.
Attempts have been made to use signal features in order to get more insights into the underlying processes. Ritman and Milburn [61] suggested that vessel length has an influence on the cut-off frequency of the detected signals. They suggested that cavitation in long vessels produced broadband signals with frequencies down to 500 Hz, whereas cavitation in fibers and wood tracheids only produced higher frequencies (>100 kHz). Tyree and Sperry [60] observed that, when detecting AE signals in the frequency range 50–1000 kHz, the frequency spectra changed towards higher frequencies when the degree of cavitation increased in Thuja, Pinus, and Acer stems. However, they stayed indecisive about the possible origin of the signals. Based on the waveforms, Laschimke et al. [68] distinguished two types of AE signals in dehydrating leaves of Ulmus glabra: the abrupt disruption of the water column and an oscillating source that was related to the vibration of gas bubbles during sap flow. It was also found that AE energy is a function of conduit size and xylem tension [34] and Rosner et al. [66] found that this parameter might be a better measure for hydraulic conductivity loss than AE counts.
Although further research is necessary to develop reliable methods for AE data interpretation, this technique has a high potential for continuous long-term cavitation monitoring in the field [69,70,71,72,73]. Already in 1983, Tyree and Dixon [43] (page 1099) were looking forward to the scientific progress that could be realized with the AE method:
“If it can be proved that most ultrasonic AE are a result of cavitation events, then we will have a powerful diagnostic tool that may give us new insight into the water relations of trees and other plants.”
However, Quarles [74], who was especially interested in AE detection of fractures in wood, realized that deeper insights in the AE method would be essential for successful implementation:
“For successful implementation, it will be essential to understand how the propagating acoustic wave changes as a function of factors such as distance and propagating direction between the acoustic source and the receiving transducer.”
During the past couple of decades, rapid developments in microelectronics have resulted in great advances in the AE technique. Currently, high performance acquisition systems are available that are able to record and store waveforms from multiple channels at high sample frequencies [64,75]. Despite the large amount of research concerning AE application to measure drought-induced cavitation, the full potential of these state of the art measurement systems has not been used so far. In what follows, current state-of-the-art and applications of AE in cavitation research will be illustrated as well as future opportunities. These deliver important findings that contribute to the development of a powerful diagnostic AE-tool for online and non-destructive measurement of cavitation.

4. Current State-of-the-Art and Application of AE in Plant Sciences

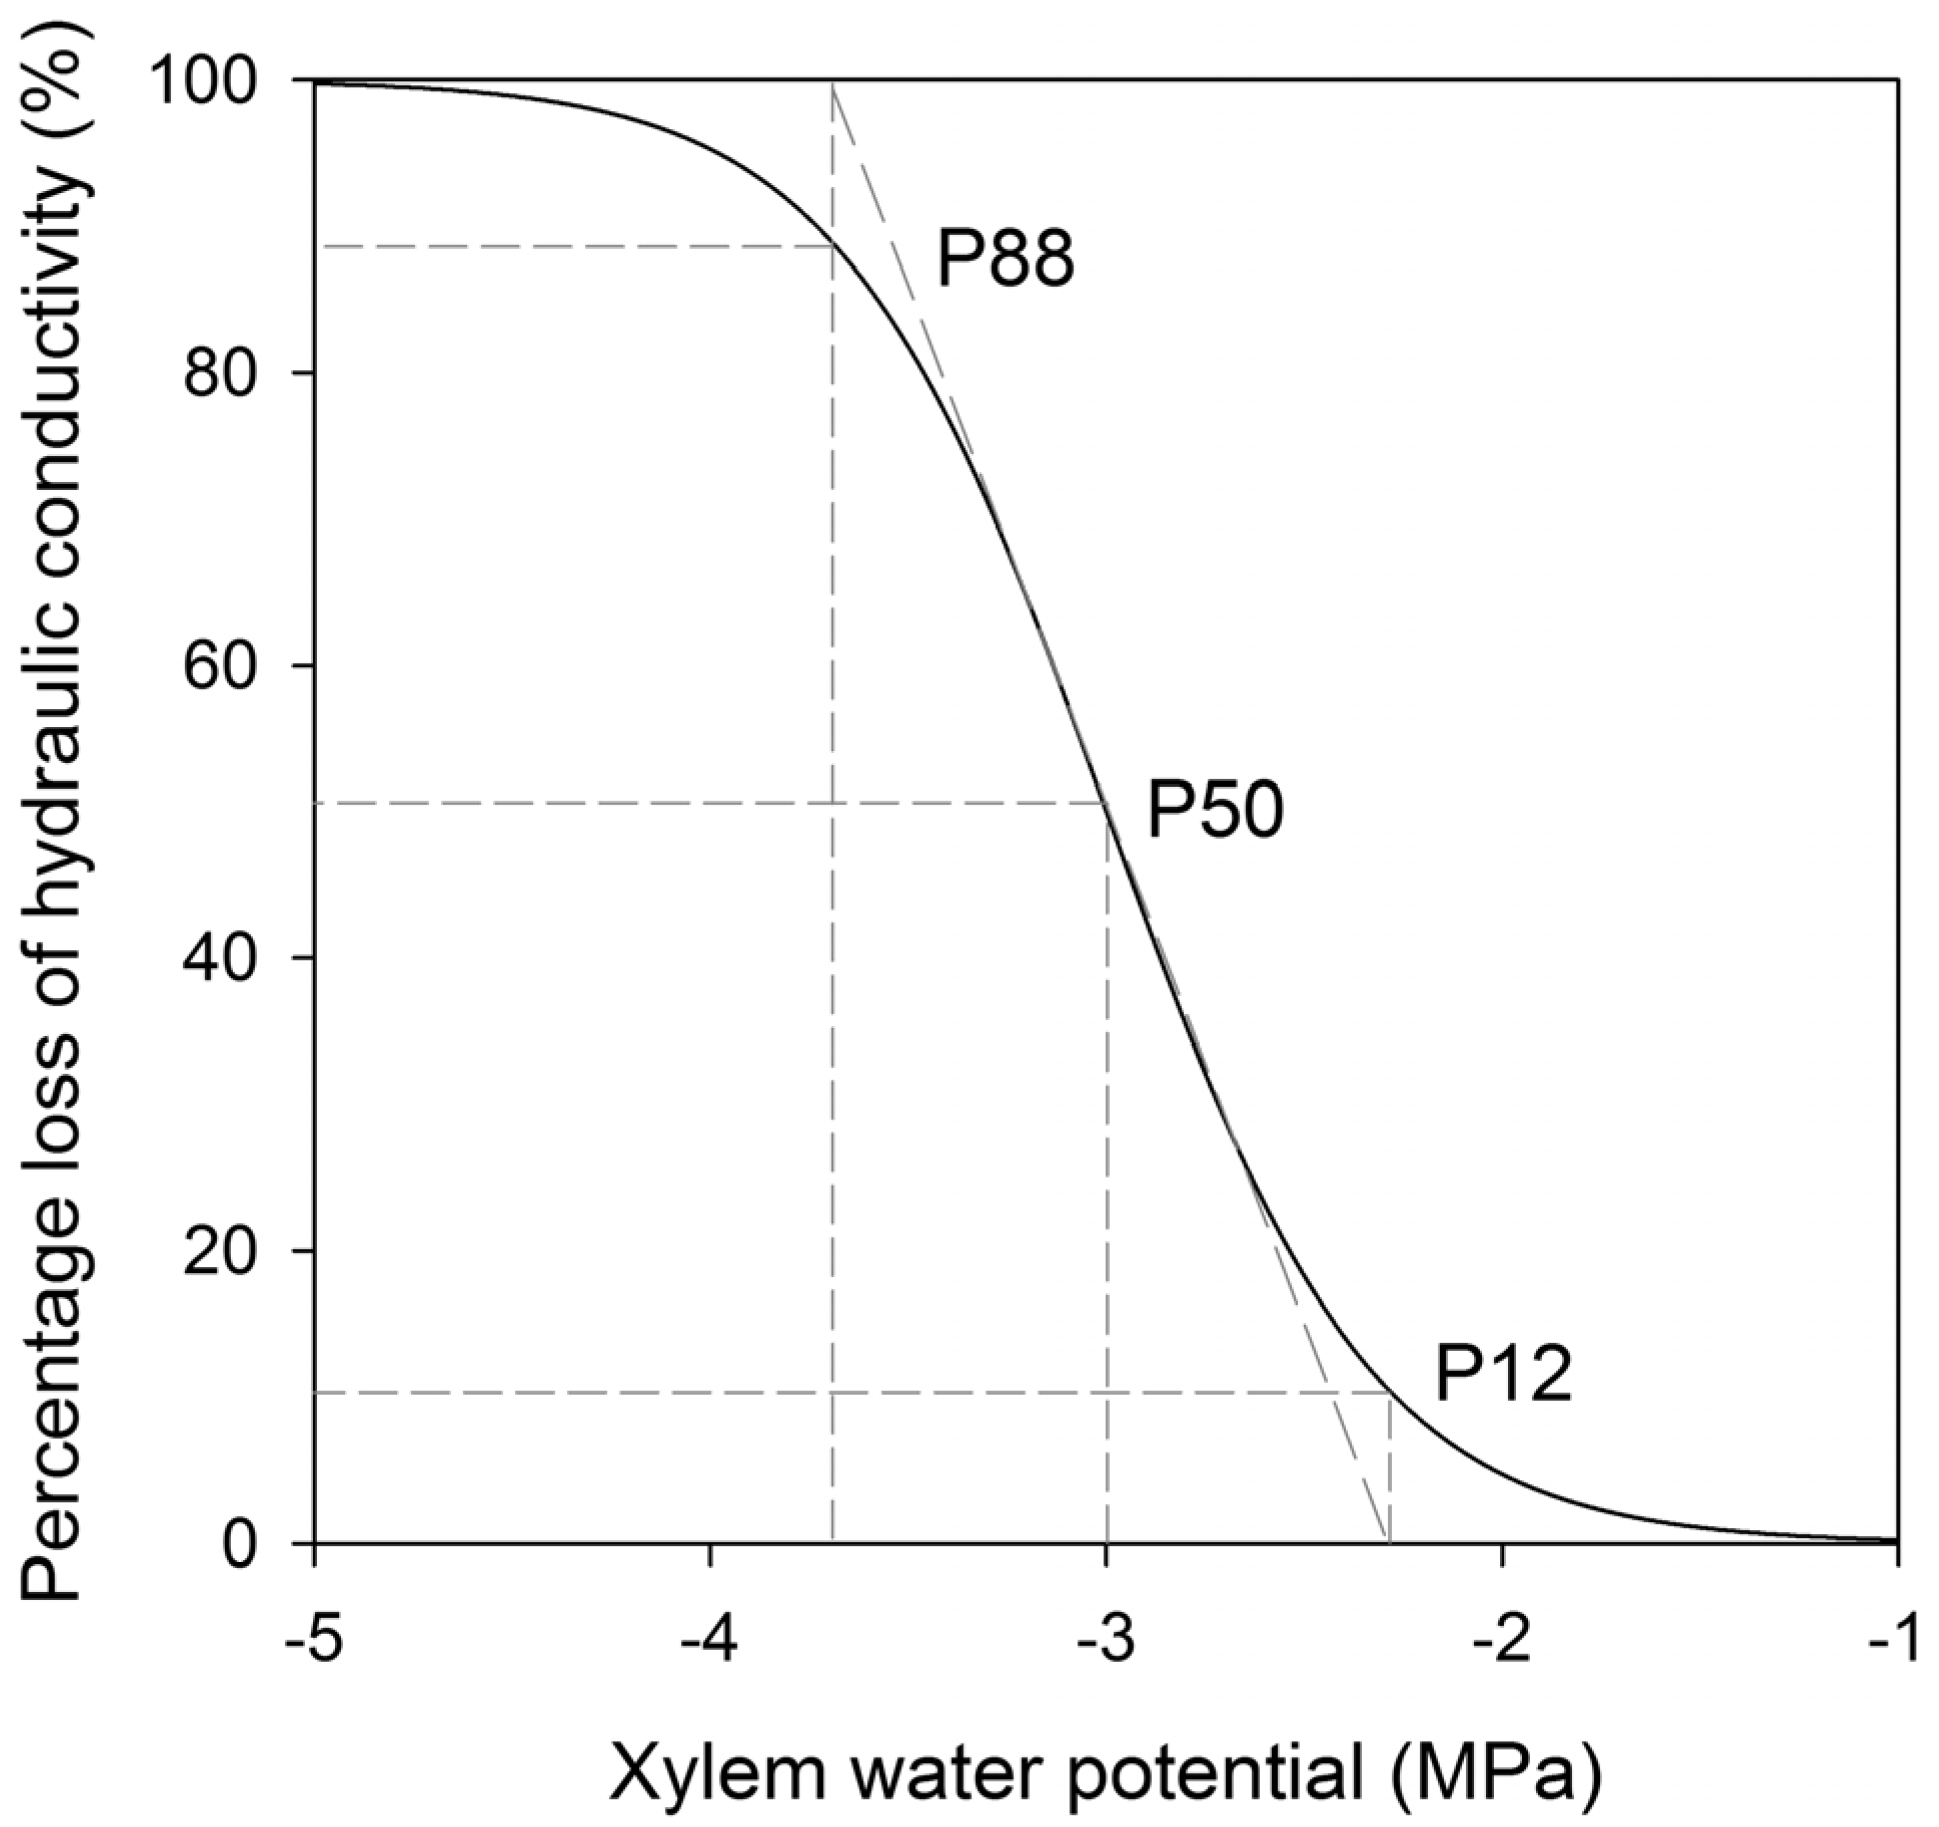
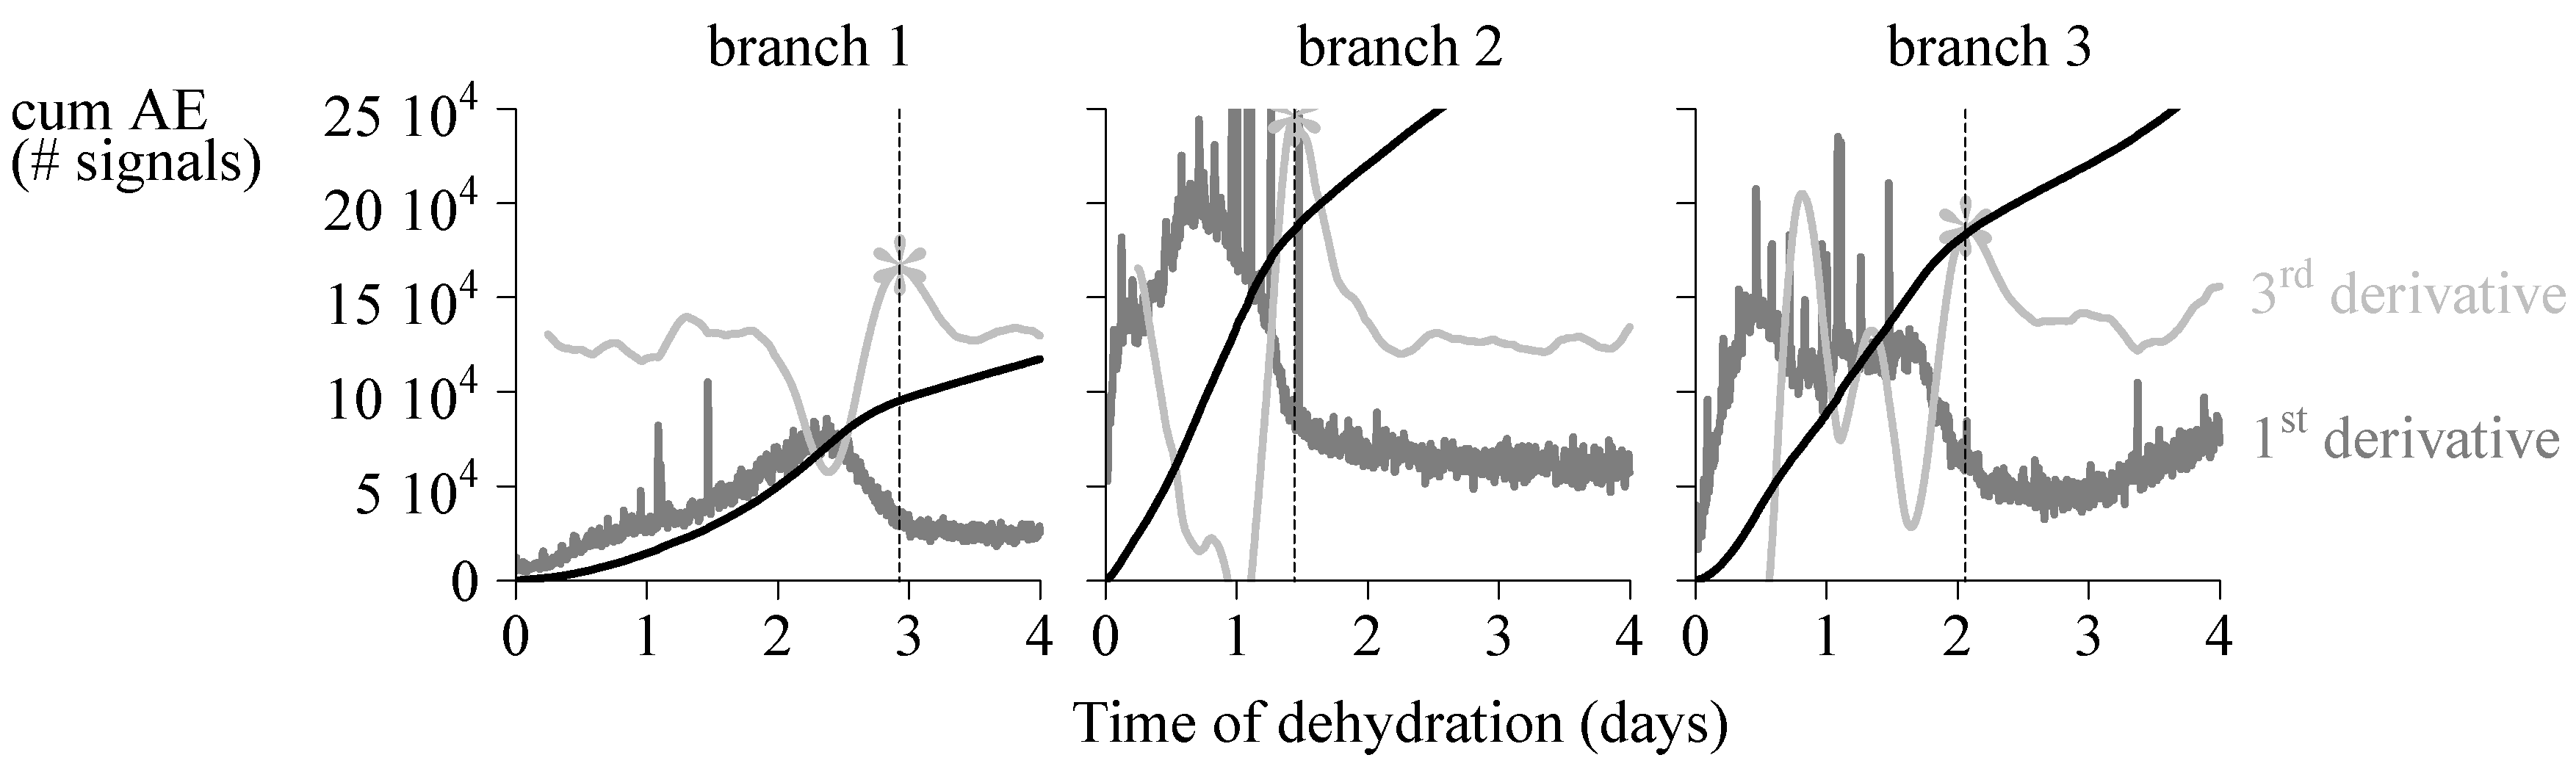
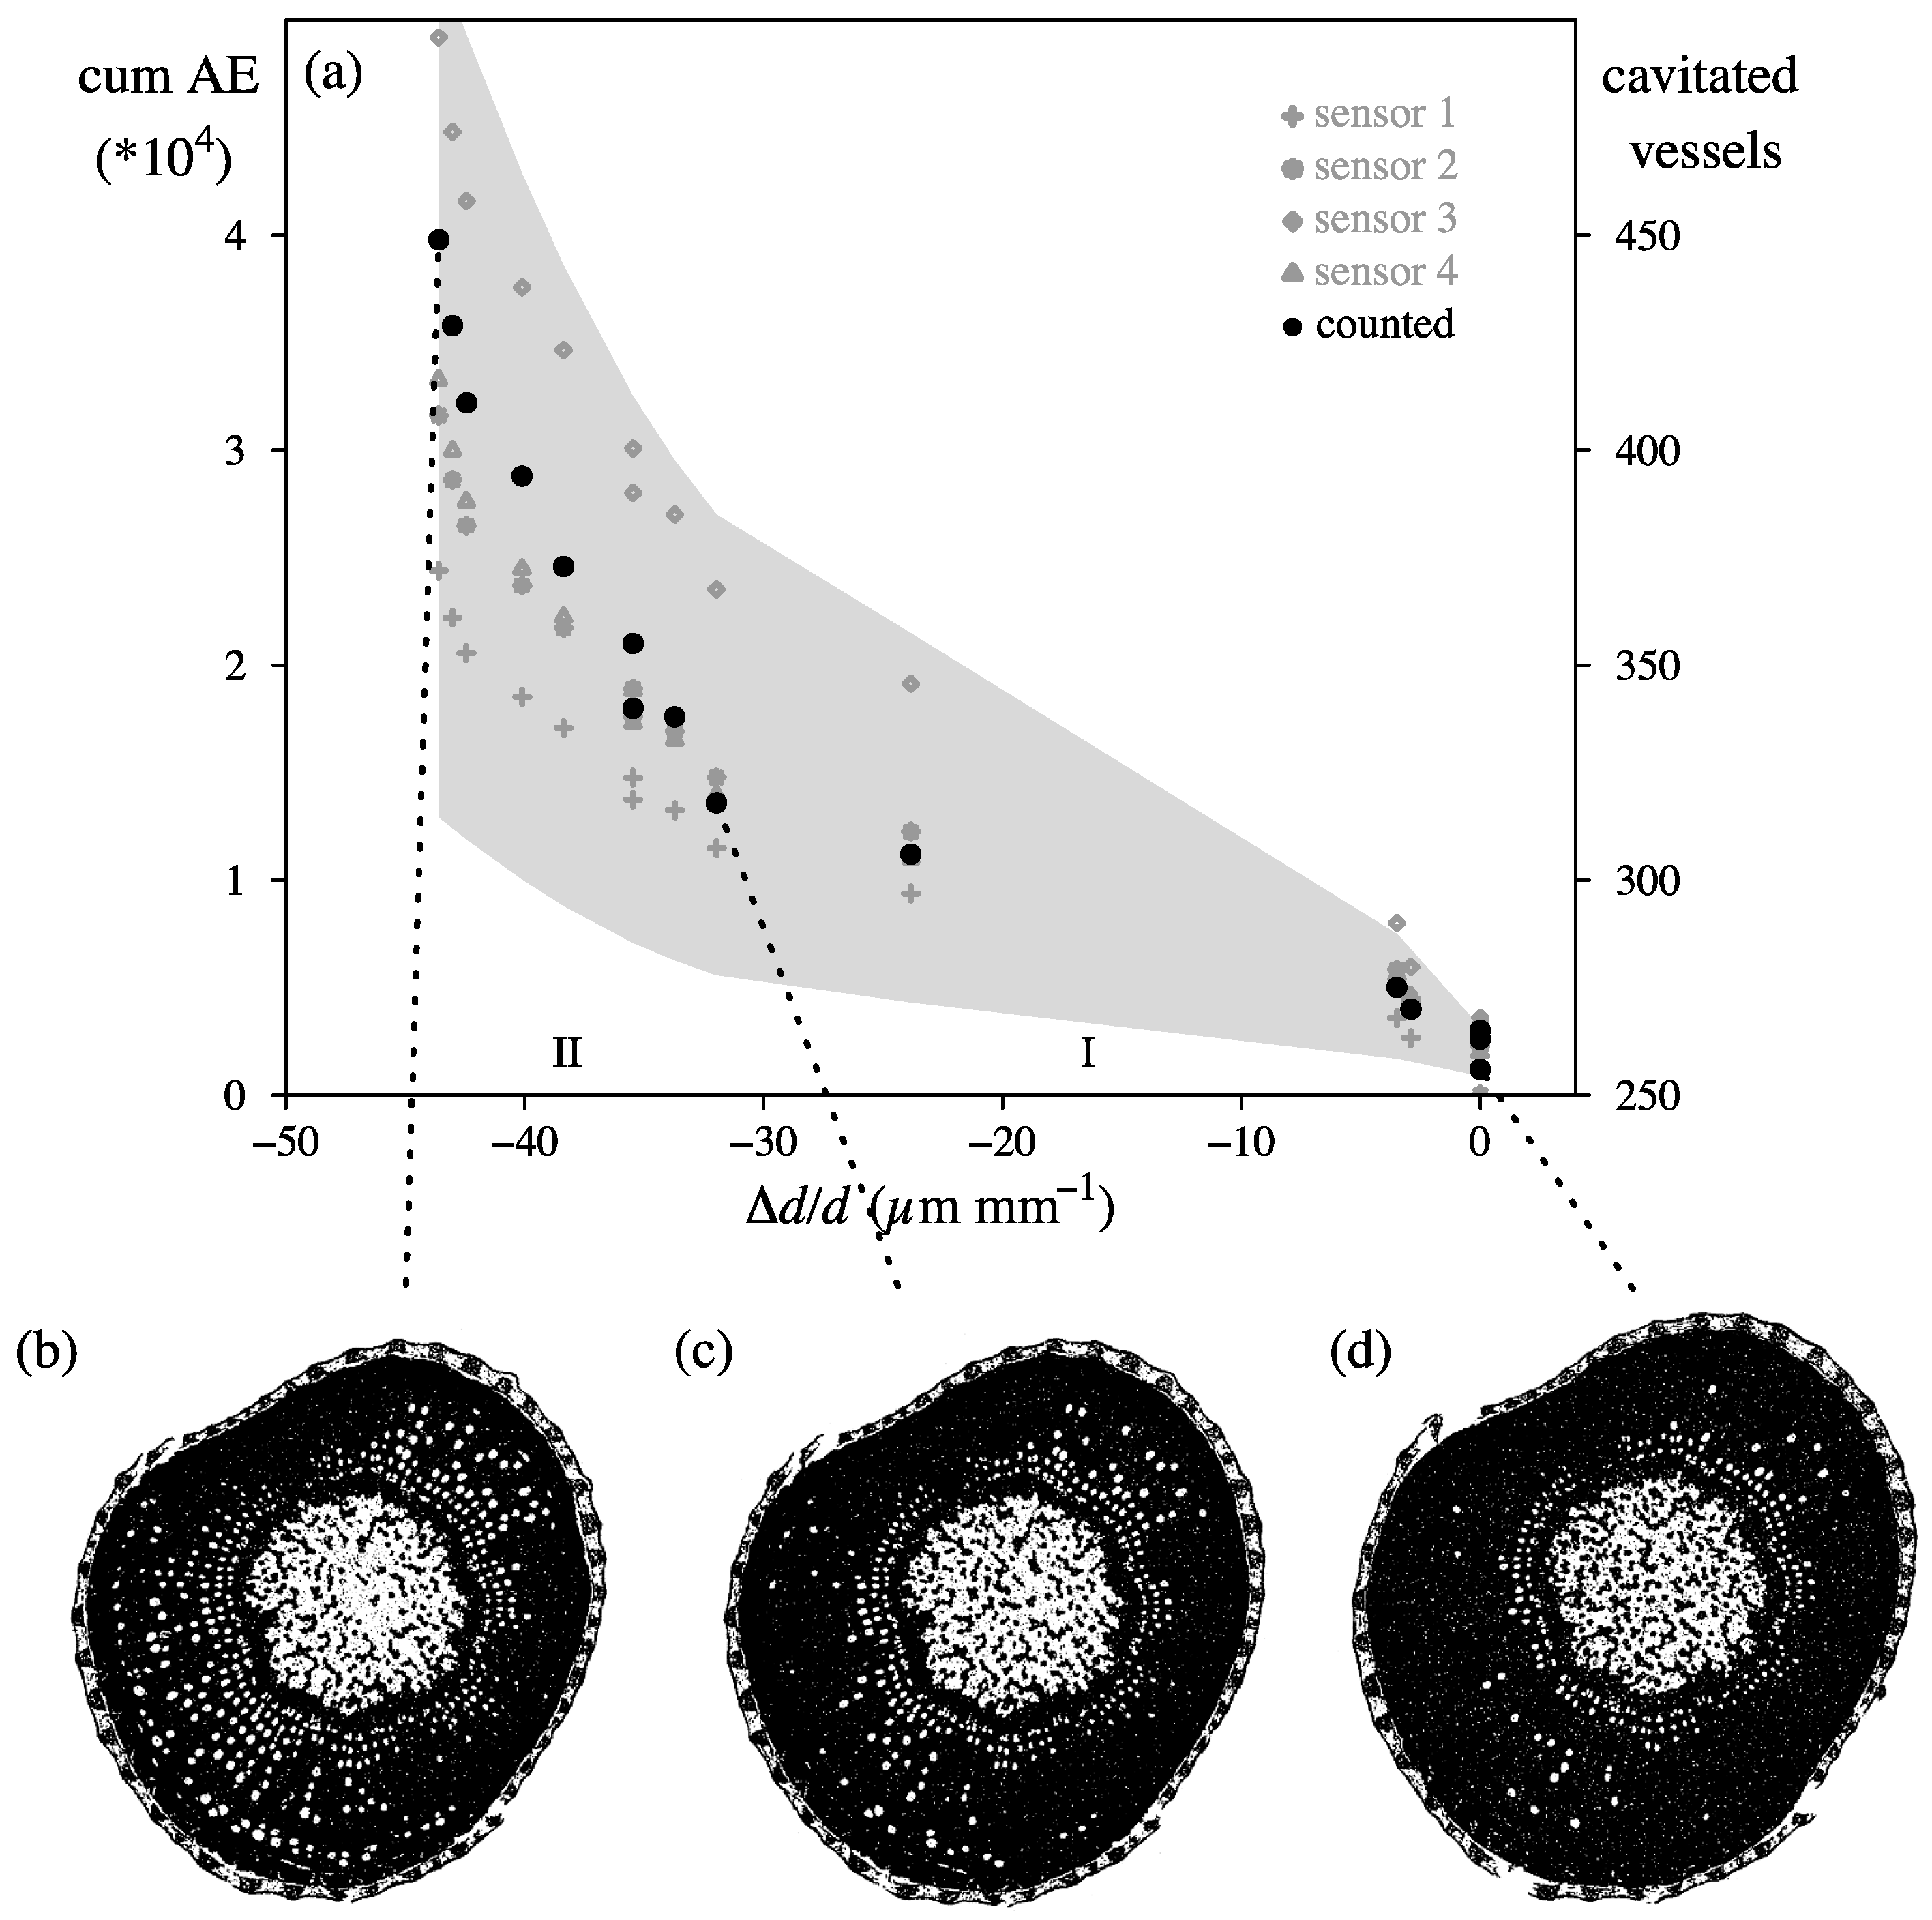
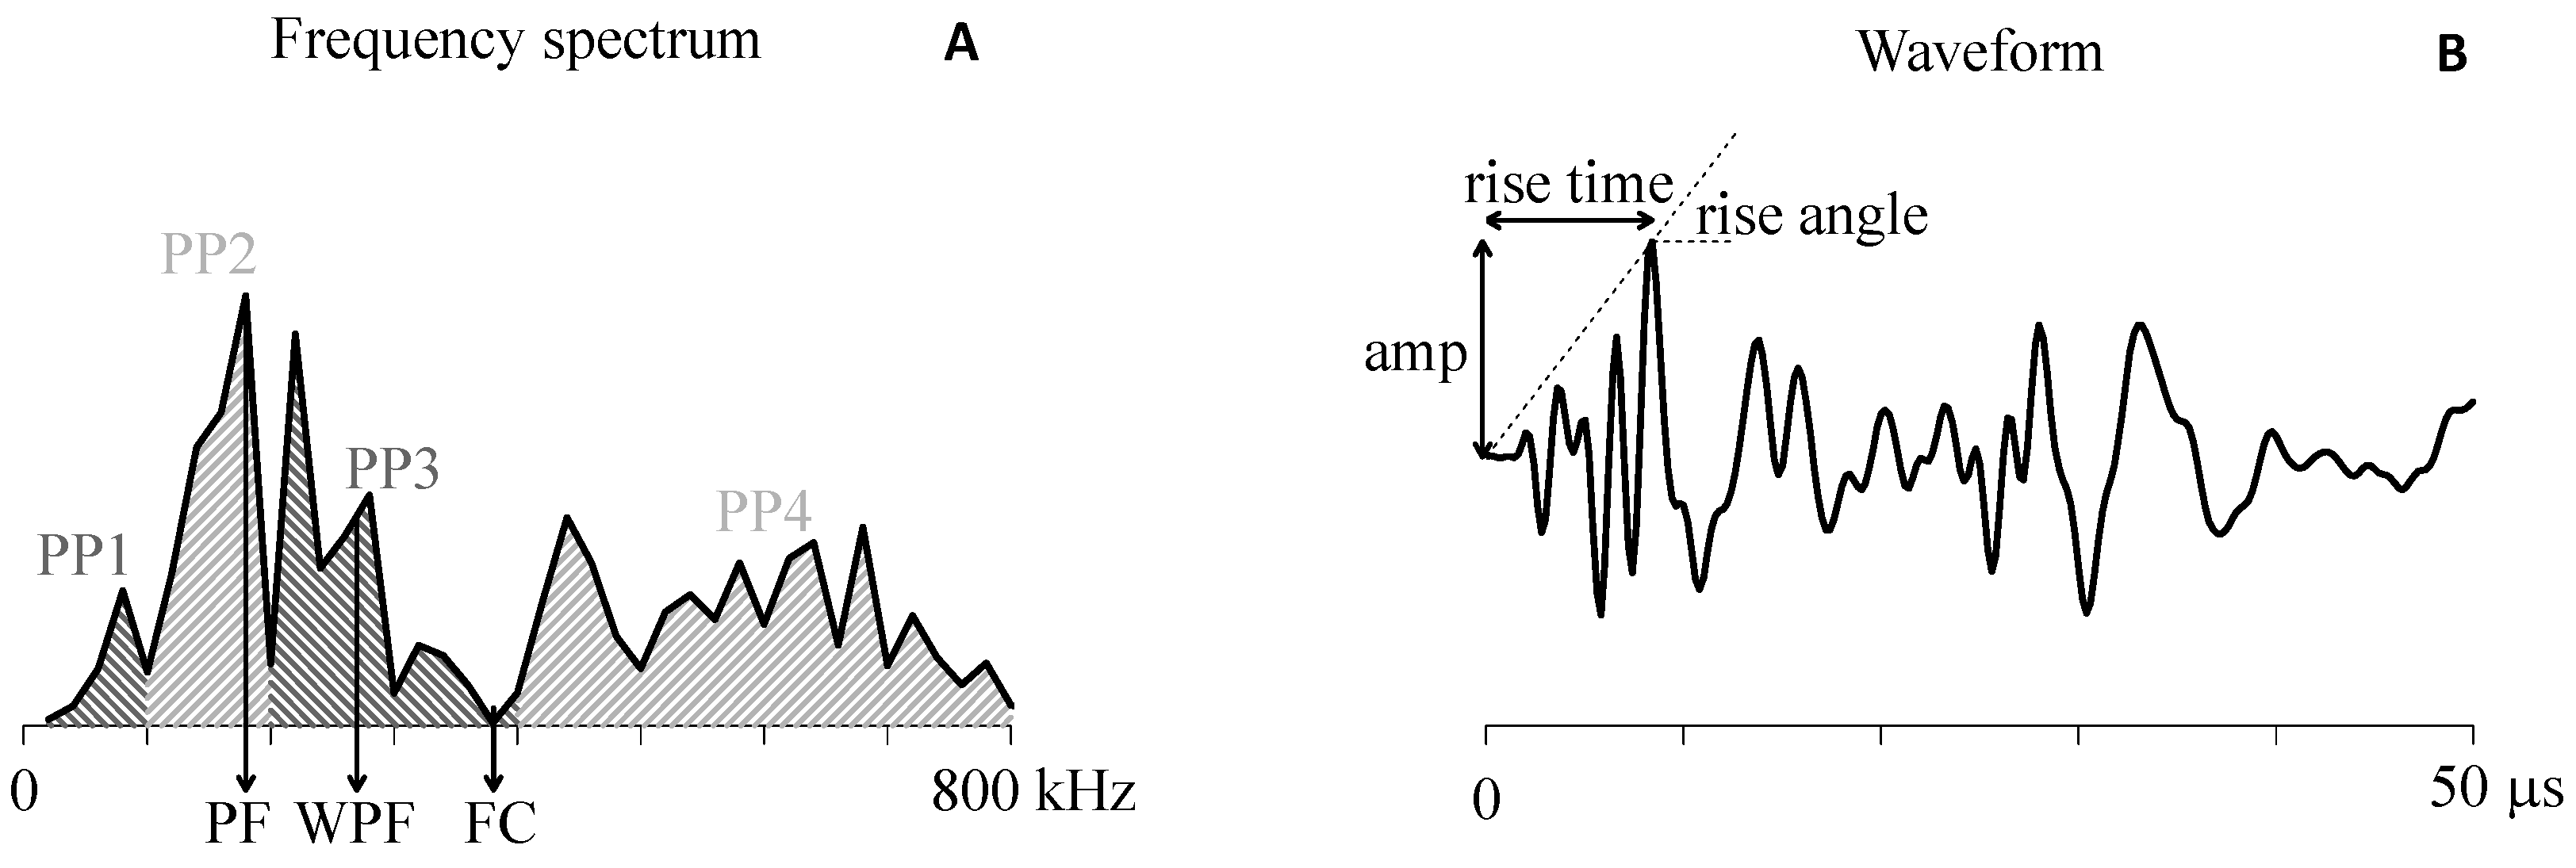
4.1. Endpoint Selection

Due to the many different AE sources acting during plant dehydration, AE activity can be detected long after most of the hydraulic conductivity is lost [31,76]. This makes it difficult to determine the endpoint (i.e., 100% PLC) of the VC, which physiologically corresponds with complete cavitation of the xylem vessels and, thus, the full breakdown of the plants hydraulic pathway. As a possible solution, many studies make use of arbitrary methods. In addition, they focus more on gymnosperms, because gymnosperms have a more uniform and plain anatomy, and, thus, a more straightforward AE pattern compared to angiosperms [34]. Wolkerstorfer, Rosner et al. [64] filtered AE measured on dehydrating Pinus by drawing a straight line “by eye” through the point cloud of amplitude versus time. If no clear groups can be distinguished in the point cloud, they suggest using other AE features such as cumulative amplitude or energy until plausible VCs can be constructed. However, one has to be cautious when using this method, because the filtering has a strong effect on the estimated vulnerability. Other arbitrary methods include setting the endpoint at a water potential value that equals (i) the endpoint taken from parallel testing with another method [77]; (ii) a value taken from literature; or (iii) the turgor loss point of the leaves [78,79].
Vergeynst et al. [80] developed a more mathematical approach to determine the VC endpoint. Given that PLC should by definition be linked to cumulative AE, and that, according to Aggelis et al. [81], a specific AE-inducing mechanism results in an AE activity, Vergeynst et al. [80] recommended determining the VC endpoint by the end of the AE activity peak, which mathematically corresponds to the local maximum of the third derivative of the curve of cumulative AE versus time (Figure 3).
Although the AE activity may continue after the selected endpoint (Figure 3), the obtained P50 values (−2.30 to −2.73 MPa) corresponded well with values found in literature for grapevine (−2.17 to −2.97 MPa; [82,83]), from which was concluded that the endpoint was accurate, and that the remaining AE activity was related to other sources than cavitation. Strong evidence for their approach was given by validation with X-ray micro-computed tomography (µCT), which showed quite similar patterns for both visually and acoustically detected cavitation [31] (Figure 4).
The difficulty in determining the endpoint of VCs based on AEs has also been addressed by Nolf et al. [84]. To tackle this problem, these authors hypothesized that the highest acoustic activity should occur near the steepest part of the VC, which is the inflection point, reflecting P50. They obtained good similarity when comparing their method with hydraulic measurements of 16 species. The major drawback of this approach is that the VC has to have a perfect sigmoidal S-shape. Any deviation from this ideal curve might cause the steepest part to deviate from the targeted P50 value.

4.2. AE Feature Extraction

A major challenge in using AEs as an indirect measure for cavitation is determination of the source of the detected signal [31]. The AE signal is shaped by the followed path from source to sensor, which makes signal interpretation not straightforward because of the wood’s anisotropic characteristics [85]. These include differences in sound propagation in the three wood directions, wood density, xylem water content and wood anatomy [34]. Previous AE application in cavitation research mainly focused on the cumulative AE signal because of the assumption that the majority of the signals correspond to a loss in hydraulic conductivity [43,46,86,87]. Given the many different AE sources during dehydration, this assumption is, however, not always valid [64,87]. Extraction of the AE signals caused by cavitation is therefore necessary. A method that has already proven its success is extraction of the signals based on corresponding wave features. In industrial lumber drying, for example, the amplitude and energy of AE signals were used to pinpointing wood checking [88,89,90,91,92].
Rosner et al. [66] measured AEs on juvenile and mature wood samples, taken from living Picea abies trees, with a broadband sensor in the frequency range 100–1000 kHz. After extraction of the waveform features amplitude, rise time, rise angle and absolute energy (Figure 5), cumulative AE energy appeared to be a good measure for PLC and, thus, for VC development. This was confirmed in other studies on leaves of P. ponderosa, P. nigra, C. chrysophylla and P. japonica [93], and on P. abies wood samples [94]. Mayr and Rosner [34] found a correlation between tracheid lumen area and mean AE energy in P. abies wood samples using a 150 kHz resonant sensor, which responds most strongly to acoustic waves in the 50–200 kHz frequency range. A comparison between samples with different early-latewood distribution revealed that the mean energy of AEs during wood drying increased in earlywood but decreased in samples containing more latewood. This was attributed to the homogeneous structure of earlywood and its larger tracheid diameters, causing AE energy to increase with increasing xylem tension. More resistant latewood tracheids, which cavitate at a more negative xylem tension, emitted lower energy because of their smaller diameters and more heterogeneous structure [34,64]. Ponomarenko et al. [23] found a similar relationship, confirming that AE energy is linked to mechanical elastic energy, which is released during cavitation in conifer tracheids. Whereas AE feature extraction to determine cavitation-related AE has been successfully applied in conifers, it remains a challenge for the more heterogeneous angiosperms [31,34].
Vergeynst et al. [80] proposed clustering to determine cavitation-related AE in angiosperms. By using state-of-the-art techniques from material sciences, finite element modelling and an automated clustering algorithm [85,95,96], in combination with broadband point-contact sensors, they were able to extract the AE that originated from cavitation during dehydration of grapevine branches. The flat frequency response of these sensors in a wide frequency range (20–1000 kHz) allows differentiation between different AE sources. Instead of relating waveform features of AE signals with cavitation, Vergeynst et al. [80] recommended to use the frequency features of AE signals. Following Sause and Horn [97], they extracted from the frequency spectrum, peak frequency (PF), frequency centroid (FC), weighted PF (WPF, geometric mean of PF and FC) and the partial powers of the following frequency ranges: 0–100 kHz, 100–200 kHz, 200–400 kHz and 400–800 kHz (Figure 5). The signals that typified the cavitation phase were characterized by a high intensity at 100–200 kHz. Another signal type, with high intensity in the range 400–800 kHz, was strongly related with branch shrinkage, and probably originated from micro-fractures, which are small fissures in the stretched cell wall or pith membrane due to an initial volume change. Finally, a low-frequency signal type (high intensity below 100 kHz) was identified that was attributed to macro-fractures or free drainage of water through the porous wood medium. This clustering approach to identify cavitation-related AE signals is a great advance, and may lead to the development of a powerful tool to also investigate cavitation in plants in their native environment. AE sources, such as micro- and macro-fractures, will no longer disturb cavitation measurements but may provide additional information on, for instance, use of elastic water reserves or mechanical strains.
It has often been assumed that one AE signal represents cavitation of a single water column [98]. However, except from the observed one-to-one relationship by Tyree and Dixon [47] and Lewis [99] on small sapwood samples of two gymnosperm species, the number of AE signals has been either lower [23,100,101,102] or higher [56,66] than the number of cavitating conduits in further experiments. In measurements on grapevines, the number of cavitation-related AE signals exceeded the number of vessels in the branch by one or two size orders [33]. Moreover, the amplitude distribution with maximum signal density near the detection threshold of 28 dBAE suggested that a considerable part of the signals could not be detected because their amplitude fell below the detection threshold, and thus probably even more AE signals are produced during xylem cavitation [103]. The use of less sensitive measurement systems, or higher detection threshold settings, might explain cases where less AE signals than cavitated conduits were observed.
One reason for the higher number of signals observed by Vergeynst et al. [80] could be overlapped between adjacent cluster types, so that part of the cavitation-related signal type possibly originated from other co-occurring AE sources, such as micro-fractures or water drainage. This overlap might be caused by different attenuation of the AE signals dependent on their frequency. The effect of attenuation was also observed during a freeze-thaw experiment, where it decreased in frozen samples [104]. A second hypothesis is that the cavitation process generates many AE signals. According to the nanobubble theory of Schenk et al. [28], many nanobubbles may be formed and exist in the xylem before they coalesce and form an embolism. Coalescence of these nanobubbles and subsequent bubble collapse may result in much more AE signals than cavitated conduits. Alternatively, fissures in the stretched pith membrane or rearrangements of the cell wall layers due to pressure redistribution after cavitation may cause many AE signals per cavitated conduit. Further research and more detailed modelling of the actual micro-mechanical processes at the AE source, such as bubble formation and coalescence, may hopefully throw light on cavitation-related AE sources and, accordingly, on the processes behind emboli formation.

4.3. In Vivo Measurements

Dealing with drought stress is a dynamic process and the resistance of a plant against drought depends on both physiological and anatomical characteristics [21]. To obtain a good understanding of a plant’s behavior during drought stress, in vivo measurements on plants are necessary. Conventional methods to determine a plants’ vulnerability to cavitation are destructive, and their results are recently under intense debate because several artefacts are reported to play a role [40,41,105]. In addition, these methods are labor-intensive, which hampers their applicability in the field. The call for non-destructive methods is therefore now more urgent than ever [39]. Cochard et al. [41] recently recommended µCT as the standard technique to measure hydraulic vulnerability, but this method is not suitable for field applications. Today, the AE technique is used in a destructive way and, thus, subject to similar artefacts as the conventional methods, but in contrast to these established methods, the AE technique has the potential to measure non-destructively, enabling automated and continuous measurements of cavitation in the field. Because of the difficult signal interpretation of AEs, only a few studies have focused on the possibility of in vivo measurements of cavitation on actively growing trees with acoustic sensors. Field measurements on P. sylvestris with a 150 kHz resonant sensor during the growing season showed good relationships between AE activity and stem diameter variation [73] or sap flow [106,107]. In addition, such continuous measurements will provide valuable information on plant behavior during drought and, more specifically, contribute to the debated process of cavitation recovery [36,108,109,110,111].
When using the AE technique on living plants in lab or field conditions, Vergeynst et al. [80] use a broadband point-contact sensor (20–1000 kHz) with flat frequency response in order to differentiate between the different AE sources. Based on preliminary analysis and clustering, a minimum set of signal frequency features may be selected (weighted peak frequency, frequency centroid and partial powers) that enable discrimination between different AE sources. However, when it is sufficiently demonstrated that the resonant sensor shows good results, its use might be preferred in further practical applications because of the more straightforward data processing and interpretation. A second point of attention for in vivo measurements is the particular nature of cavitation detection. Contrary to the hydraulic method and visualization methods, the AE technique measures changes in the degree of embolism rather than the degree of embolism itself. This principle should be kept in mind when preparing and interpreting AE measurements of cavitation. If the initial state of xylem embolism is known, cumulative AE measurements might result in the degree of embolism if cavitation has not been repaired in the measurement period. This will require a reference number of AE signals at 100% embolism, which may be obtained in a VC or at the end of a drought experiment. Combination of broadband AE measurements with other non-destructive measurements of sap flow, water potential, water content and xylem/phloem shrinkage [20] may yield the largest insight into plant water dynamics during drought. A better knowledge of these dynamics is crucial to feed mechanistic plant and climate models and will help with guiding mitigation of climate change impacts on plants in natural and agricultural communities [112].

5. Conclusions and Future Perspectives

How plants cope with drought in a changing climate is an active area of research, but a lot of questions remain unanswered. Mechanisms and strategies that underlie plant survival and mortality during drought are the subject of an intense debate [9,10,11,12,13,14,15,16]. The main drivers of this discussion are, however, the used methods instead of the actual mechanisms that occur in plants [39,41,110,113]. Development of a universal technique to measure cavitation, and vulnerability to it, will be essential to bring the debate to a next level, which will change the focus towards physiology behind drought resistance. In this review, we showed that revival in the use of AEs for detection of plants’ vulnerability to drought is very promising. It might become a powerful non-destructive, readily automated and online method. Although great advances were recently made in dealing with the main criticisms of the technique, such as being indirect and endpoint selection difficulties, further research is needed. The behavior of AEs in plant material has to be studied, and questions regarding wave propagation through wood, the behavior of dehydrating wood, and the mechanisms behind cavitation need to be answered in order to fundamentally link AEs and cavitation events. In order to achieve this, we recommend:
  • A combination of cavitation measurements with AE broadband sensors and µCT in a broad range of plant species: interpretation of the acoustic signals in combination with visuals will govern the largest insights in the mechanisms underlying cavitation.
  • Feature extraction from the AE signals: this will allow a comprehensive analysis of the AE sources, and will deliver valuable information on cavitation and other AE producing processes that occur in drought-stressed plants.
  • Detailed study of wave propagation and attenuation in plants, both in dehydrating and in frozen samples.
  • Investigation of the effects of debarking prior to acoustic measurements: as the bark can be an additional AE source, this might influence the captured signals.
  • Further validation of the use of broadband point-contact AE sensors in the field of plant hydraulics versus the 150 kHz resonance AE sensor.
  • Development of an in situ AE measurement protocol for living plants, and its translation to drought sensitivity.
To conclude, the use of AEs in plant sciences to measure cavitation is promising and is gaining increasing interest. As implementation of some of the state-of-the-art techniques from material sciences already pushed frontiers in cavitation research, we believe that cross-fertilization between these different scientific domains will also be beneficial for both in the future.

Acknowledgments

The authors thank the Research Foundation—Flanders (FWO) for funding (research program G.0941.15N granted to Kathy Steppe, and PhD Fellowship granted to Lidewei L. Vergeynst).

Author Contributions

Lidewei L. Vergeynst, Linus De Roo and Niels J. F. De Baerdemaeker reviewed the literature. Kathy Steppe supervised the work. Linus De Roo wrote most of the manuscript with the input of Lidewei L. Vergeynst, and all authors contributed by discussing and reviewing drafts and the final version of the manuscript. Linus De Roo and Lidewei L. Vergeynst contributed equally to the manuscript.

Conflicts of Interest

The authors declare no conflict of interest.

References

  1. Ernst, R.; Zwimpfer, F.; Dual, J. One sensor acoustic emission localization in plates. Ultrasonics 2016, 64, 139–150. [Google Scholar] [CrossRef] [PubMed]
  2. Robeyst, N.; Grosse, C.U.; de Belie, N. Measuring the change in ultrasonic p-wave energy transmitted in fresh mortar with additives to monitor the setting. Cem. Concrete Res. 2009, 39, 868–875. [Google Scholar] [CrossRef]
  3. Ohtsu, M. History and fundamentals. In Acoustic Emission Testing; Springer: Heidelberg, Germany, 2008; pp. 11–18. [Google Scholar]
  4. Ohtsu, M. Fundamentals and applications. In Acoustic Emission and Related Non-Destructive Evaluation Techniques in the Fracture Mechanics of Concrete; Woodhead Publishing: Cambridge, UK, 2015; Volume 1, pp. 11–18. [Google Scholar]
  5. Jayakumar, T.; Mukhopadhyay, C.K.; Venugopal, S.; Mannan, S.L.; Raj, B. A review of the application of acoustic emission techniques for monitoring forming and grinding processes. J. Mater. Process. Technol. 2005, 159, 48–61. [Google Scholar] [CrossRef]
  6. Hamstad, M.A. Thirty years of advances and some remaining challenges in the application of acoustic emission to composite materials. In Acoustic Emission beyond the Millennium; Kishi, T., Ohtsu, M., Yuyama, S., Eds.; Elsevier: Oxford, UK, 2000; pp. 77–91. [Google Scholar]
  7. Drouillard, T.F. Anecdotal history of acoustic emission from wood. J. Acoust. Emiss. 1990, 9, 155–176. [Google Scholar]
  8. Kishinouye, F. An experiment on the progression of fracture (a preliminary report). J. Acoust. Emiss. 1990, 9, 177–180. [Google Scholar]
  9. Anderegg, W.R.; Berry, J.A.; Smith, D.D.; Sperry, J.S.; Anderegg, L.D.; Field, C.B. The roles of hydraulic and carbon stress in a widespread climate-induced forest die-off. Proc. Natl. Acad. Sci. USA 2012, 109, 233–237. [Google Scholar] [CrossRef] [PubMed]
  10. Allen, C.D.; Macalady, A.K.; Chenchouni, H.; Bachelet, D.; McDowell, N.; Vennetier, M.; Kitzberger, T.; Rigling, A.; Breshears, D.D.; Hogg, E.T. A global overview of drought and heat-induced tree mortality reveals emerging climate change risks for forests. For. Ecol. Manag. 2010, 259, 660–684. [Google Scholar] [CrossRef]
  11. Anderegg, W.R.L.; Flint, A.; Huang, C.-Y.; Flint, L.; Berry, J.A.; Davis, F.W.; Sperry, J.S.; Field, C.B. Tree mortality predicted from drought-induced vascular damage. Nat. Geosci. 2015, 8, 367–371. [Google Scholar] [CrossRef]
  12. McDowell, N.G.; Ryan, M.G.; Zeppel, M.J.; Tissue, D.T. Feature: Improving our knowledge of drought-induced forest mortality through experiments, observations, and modeling. New Phytol. 2013, 200, 289–293. [Google Scholar] [CrossRef] [PubMed]
  13. Martínez-Vilalta, J.; Lloret, F.; Breshears, D.D. Drought-induced forest decline: Causes, scope and implications. Biol. Lett. 2012, 8, 689–691. [Google Scholar] [CrossRef] [PubMed]
  14. Zeppel, M.J.; Anderegg, W.R.; Adams, H.D. Forest mortality due to drought: Latest insights, evidence and unresolved questions on physiological pathways and consequences of tree death. New Phytol. 2013, 197, 372–374. [Google Scholar] [CrossRef] [PubMed]
  15. Doughty, C.E.; Metcalfe, D.; Girardin, C.; Amézquita, F.F.; Cabrera, D.G.; Huasco, W.H.; Silva-Espejo, J.; Araujo-Murakami, A.; da Costa, M.; Rocha, W. Drought impact on forest carbon dynamics and fluxes in amazonia. Nature 2015, 519, 78–82. [Google Scholar] [CrossRef] [PubMed] [Green Version]
  16. Hartmann, H.; Adams, H.D.; Anderegg, W.R.; Jansen, S.; Zeppel, M.J. Research frontiers in drought-induced tree mortality: Crossing scales and disciplines. New Phytol. 2015, 205, 965–969. [Google Scholar] [CrossRef] [PubMed]
  17. Lichtenthaler, H.K. Vegetation stress: An introduction to the stress concept in plants. J. Plant Physiol. 1996, 148, 4–14. [Google Scholar] [CrossRef]
  18. Dixon, H.H. Transpiration and the Ascent of Sap in Plants; Macmillan and Co.: London, UK, 1914. [Google Scholar]
  19. Kozlowski, T.T.; Pallardy, S.G. Growth Control in Woody Plants; Elsevier: San Diego, CA, USA, 1997. [Google Scholar]
  20. Steppe, K.; Sterck, F.; Deslauriers, A. Diel growth dynamics in tree stems: Linking anatomy and ecophysiology. Trends Plant Sci. 2015, 20, 335–343. [Google Scholar] [CrossRef] [PubMed]
  21. Sevanto, S.; McDowell, N.G.; Dickman, L.T.; Pangle, R.; Pockman, W.T. How do trees die? A test of the hydraulic failure and carbon starvation hypotheses. Plant Cell Environ. 2014, 37, 153–161. [Google Scholar] [CrossRef] [PubMed]
  22. McDowell, N.; Pockman, W.T.; Allen, C.D.; Breshears, D.D.; Cobb, N.; Kolb, T.; Plaut, J.; Sperry, J.; West, A.; Williams, D.G. Mechanisms of plant survival and mortality during drought: Why do some plants survive while others succumb to drought? New Phytol. 2008, 178, 719–739. [Google Scholar] [CrossRef] [PubMed]
  23. Ponomarenko, A.; Vincent, O.; Pietriga, A.; Cochard, H.; Badel, E.; Marmottant, P. Ultrasonic emissions reveal individual cavitation bubbles in water-stressed wood. J. R. Soc. Interface 2014, 11. [Google Scholar] [CrossRef] [PubMed]
  24. Nobel, P.S. Physicochemical and Environmental Plant Physiology; Academic Press: San Diego, CA, USA, 1999. [Google Scholar]
  25. Jackson, G.; Grace, J. Cavitation and water transport in trees. Endeavour 1994, 18, 50–54. [Google Scholar] [CrossRef]
  26. Rockwell, F.E.; Wheeler, J.K.; Holbrook, N.M. Cavitation and its discontents: Opportunities for resolving current controversies. Plant Physiol. 2014, 164, 1649–1660. [Google Scholar] [CrossRef] [PubMed]
  27. Zimmermann, M. Xylem structure and the ascent of sap. Xylem Structure and the Ascent of Sap; Springer-Verlag: Berlin, Germany, 1983. [Google Scholar]
  28. Schenk, H.J.; Steppe, K.; Jansen, S. Nanobubbles: A new paradigm for air-seeding in xylem. Trends Plant Sci. 2015, 20, 199–205. [Google Scholar] [CrossRef] [PubMed]
  29. Choat, B.; Jansen, S.; Brodribb, T.J.; Cochard, H.; Delzon, S.; Bhaskar, R.; Bucci, S.J.; Feild, T.S.; Gleason, S.M.; Hacke, U.G.; et al. Global convergence in the vulnerability of forests to drought. Nature 2012, 491, 752–755. [Google Scholar] [CrossRef] [PubMed]
  30. Domec, J.-C.; Gartner, B.L. Cavitation and water storage capacity in bole xylem segments of mature and young douglas-fir trees. Trees 2001, 15, 204–214. [Google Scholar] [CrossRef]
  31. Rosner, S. A new type of vulnerability curve: Is there truth in vine? Tree Physiol. 2015, 35, 410–414. [Google Scholar] [CrossRef] [PubMed]
  32. Cochard, H.; Badel, E.; Herbette, S.; Delzon, S.; Choat, B.; Jansen, S. Methods for measuring plant vulnerability to cavitation: A critical review. J. Exp. Bot. 2013, 64, 4779–4791. [Google Scholar] [CrossRef] [PubMed]
  33. Vergeynst, L.L.; Dierick, M.; Bogaerts, J.A.; Cnudde, V.; Steppe, K. Cavitation: A blessing in disguise? New method to establish vulnerability curves and assess hydraulic capacitance of woody tissues. Tree Physiol. 2015, 35, 400–409. [Google Scholar] [CrossRef] [PubMed]
  34. Mayr, S.; Rosner, S. Cavitation in dehydrating xylem of picea abies: Energy properties of ultrasonic emissions reflect tracheid dimensions. Tree Physiol. 2011, 31, 59–67. [Google Scholar] [CrossRef] [PubMed]
  35. Gullo, M.L.; Salleo, S. Different vulnerabilities of Quercus ilex L. To freeze-and summer drought-induced xylem embolism: An ecological interpretation. Plant Cell Environ. 1993, 16, 511–519. [Google Scholar] [CrossRef]
  36. Fichot, R.; Brignolas, F.; Cochard, H.; Ceulemans, R. Vulnerability to drought-induced cavitation in poplars: Synthesis and future opportunities. Plant Cell Environ. 2015, 38, 1233–1251. [Google Scholar] [CrossRef] [PubMed]
  37. Dixon, H.H.; Joly, J. On the ascent of sap. Philos. Trans. R. Soc. Lond. B 1895. [Google Scholar] [CrossRef]
  38. Steudle, E. The cohesion-tension mechanism and the acquisition of water by plant roots. Annu. Rev. Plant Biol. 2001, 52, 847–875. [Google Scholar] [CrossRef] [PubMed]
  39. Jansen, S.; Schuldt, B.; Choat, B. Current controversies and challenges in applying plant hydraulic techniques. New Phytol. 2015, 205, 961–964. [Google Scholar] [CrossRef]
  40. Wheeler, J.K.; Huggett, B.A.; Tofte, A.N.; Rockwell, F.E.; Holbrook, N.M. Cutting xylem under tension or supersaturated with gas can generate plc and the appearance of rapid recovery from embolism. Plant Cell Environ. 2013, 36, 1938–1949. [Google Scholar] [CrossRef] [PubMed]
  41. Cochard, H.; Delzon, S.; Badel, E. X-ray microtomography (micro-CT): A reference technology for high-resolution quantification of xylem embolism in trees. Plant Cell Environ. 2015, 38, 201–206. [Google Scholar] [CrossRef] [PubMed]
  42. Milburn, J.; Johnson, R. The conduction of sap: II. Detection of vibrations produced by sap cavitation in ricinus xylem. Planta 1966, 69, 43–52. [Google Scholar] [CrossRef] [PubMed]
  43. Tyree, M.T.; Dixon, M.A. Cavitation events in Thuja occidentalis L.? Utrasonic acoustic emissions from the sapwood can be measured. Plant Physiol. 1983, 72, 1094–1099. [Google Scholar] [CrossRef] [PubMed]
  44. Temperley, H.; Chambers, L.G. The behaviour of water under hydrostatic tension: I. Proc. Phys. Soc. 1946, 58, 420. [Google Scholar] [CrossRef]
  45. Milburn, J.A. Cavitation in Ricinus by acoustic detection: Induction in excised leaves by various factors. Planta 1973, 110, 253–265. [Google Scholar] [CrossRef] [PubMed]
  46. Tyree, M.T.; Dixon, M.A.; Thompson, R.G. Ultrasonic acoustic emissions from the sapwood of Thuja occidentalis measured inside a pressure bomb. Plant Physiol. 1984, 74, 1046–1049. [Google Scholar] [CrossRef] [PubMed]
  47. Tyree, M.T.; Dixon, M.A.; Tyree, E.L.; Johnson, R. Ultrasonic acoustic emissions from the sapwood of cedar and hemlock an examination of three hypotheses regarding cavitations. Plant Physiol. 1984, 75, 988–992. [Google Scholar] [CrossRef] [PubMed]
  48. Milburn, J.A. Cavitation studies on whole ricinus plants by acoustic detection. Planta 1973, 112, 333–342. [Google Scholar] [CrossRef] [PubMed]
  49. Kikuta, S.B. Ultrasound acoustic emissions from bark samples differing in anatomical characteristics. Phyton 2003, 43, 161–178. [Google Scholar]
  50. Raschi, A.; Mugnozza, G.S.; Surace, R.; Valentini, R.; Vazzana, C. The use of ultrasound technique to monitor freezing and thawing of water in plants. Agric. Ecosyst. Environ. 1989, 27, 411–418. [Google Scholar] [CrossRef]
  51. Mayr, S.; Sperry, J.S. Freeze-thaw-induced embolism in pinus contorta: Centrifuge experiments validate the “thaw-expansion hypothesis” but conflict with ultrasonic emission data. New Phytol. 2010, 185, 1016–1024. [Google Scholar] [CrossRef] [PubMed]
  52. Charrier, G.; Charra-Vaskou, K.; Kasuga, J.; Cochard, H.; Mayr, S.; Ameglio, T. Freeze-thaw stress: Effects of temperature on hydraulic conductivity and ultrasonic activity in ten woody angiosperms. Plant Physiol. 2014, 164, 992–998. [Google Scholar] [CrossRef] [PubMed]
  53. Moliński, W.; Raczkowski, J.; Poliszko, S.; Ranachowski, Z. Mechanism of acoustic emission in wood soaked in water. Holzforschung 1991, 45, 13–17. [Google Scholar] [CrossRef]
  54. Rosner, S. Characteristics of acoustic emissions from dehydrat-ing wood related to shrinkage processes. J. Acoustic Emission 2007, 25, 149–157. [Google Scholar]
  55. Gagliano, M.; Mancuso, S.; Robert, D. Towards understanding plant bioacoustics. Trends Plant Sci. 2012, 17, 323–325. [Google Scholar] [CrossRef] [PubMed]
  56. Kikuta, S.; Gullo, M.; Nardini, A.; Richter, H.; Salleo, S. Ultrasound acoustic emissions from dehydrating leaves of deciduous and evergreen trees. Plant Cell Environ. 1997, 20, 1381–1390. [Google Scholar] [CrossRef]
  57. Hacke, U.G.; Sperry, J.S.; Pittermann, J. Drought experience and cavitation resistance in six shrubs from the great basin, utah. Basic Appl. Ecol. 2000, 1, 31–41. [Google Scholar] [CrossRef]
  58. Sperry, J.S.; Tyree, M.T.; Donnelly, J.R. Vulnerability of xylem to embolism in a mangrove vs. an inland species of rhizophoraceae. Physiol. Plant. 1988, 74, 276–283. [Google Scholar] [CrossRef]
  59. Cochard, H.; Tyree, M.T. Xylem dysfunction in quercus: Vessel sizes, tyloses, cavitation and seasonal changes in embolism. Tree Physiol. 1990, 6, 393–407. [Google Scholar] [CrossRef] [PubMed]
  60. Tyree, M.; Sperry, J. Characterization and propagation of acoustic emission signals in woody plants: Towards an improved acoustic emission counter. Plant Cell Environ. 1989, 12, 371–382. [Google Scholar] [CrossRef]
  61. Ritman, K.; Milburn, J. Acoustic emissions from plants: Ultrasonic and audible compared. J. Exp. Bot. 1988, 39, 1237–1248. [Google Scholar] [CrossRef]
  62. Kasuga, J.; Charrier, G.; Uemura, M.; Améglio, T. Characteristics of ultrasonic acoustic emissions from walnut branches during freeze-thaw-induced embolism formation. J. Exp. Bot. 2015, 66, 1965–1975. [Google Scholar] [CrossRef] [PubMed]
  63. Rosner, S.; Konnerth, J.; Plank, B.; Salaberger, D.; Hansmann, C. Radial shrinkage and ultrasound acoustic emissions of fresh versus pre-dried norway spruce sapwood. Trees 2010, 24, 931–940. [Google Scholar] [CrossRef] [PubMed]
  64. Wolkerstorfer, S.V.; Rosner, S.; Hietz, P. An improved method and data analysis for ultrasound acoustic emissions and xylem vulnerability in conifer wood. Physiol. Plant 2012, 146, 184–191. [Google Scholar] [CrossRef] [PubMed]
  65. Rosner, S. Waveform features of acoustic emission provide information about reversible and irreversible processes during spruce sapwood drying. BioResources 2012, 7, 1253–1263. [Google Scholar]
  66. Rosner, S.; Klein, A.; Wimmer, R.; Karlsson, B. Extraction of features from ultrasound acoustic emissions: A tool to assess the hydraulic vulnerability of norway spruce trunkwood? New Phytol. 2006, 171, 105–116. [Google Scholar] [CrossRef] [PubMed]
  67. Mayr, S.; Schmid, P.; Laur, J.; Rosner, S.; Charra-Vaskou, K.; Dämon, B.; Hacke, U.G. Uptake of water via branches helps timberline conifers refill embolized xylem in late winter. Plant Physiol. 2014, 164, 1731–1740. [Google Scholar] [CrossRef] [PubMed]
  68. Laschimke, R.; Burger, M.; Vallen, H. Acoustic emission analysis and experiments with physical model systems reveal a peculiar nature of the xylem tension. J. Plant Physiol. 2006, 163, 996–1007. [Google Scholar] [CrossRef] [PubMed]
  69. Tyree, M.T.; Fiscus, E.L.; Wullschleger, S.; Dixon, M. Detection of xylem cavitation in corn under field conditions. Plant Physiol. 1986, 82, 597–599. [Google Scholar] [CrossRef] [PubMed]
  70. Ikeda, T.; Ohtsu, M. Detection of xylem cavitation in field-grown pine trees using the acoustic emission technique. Ecol. Res. 1992, 7, 391–395. [Google Scholar] [CrossRef]
  71. Jackson, G.; Grace, J. Field measurements of xylem cavitation: Are acoustic emissions useful? J. Exp. Bot. 1996, 47, 1643–1650. [Google Scholar] [CrossRef]
  72. Perks, M.P.; Irvine, J.; Grace, J. Xylem acoustic signals from mature pinus sylvestris during an extended drought. Ann. For. Sci. 2004, 61, 1–8. [Google Scholar] [CrossRef]
  73. Hölttä, T.; Vesala, T.; Nikinmaa, E.; Perämäki, M.; Siivola, E.; Mencuccini, M. Field measurements of ultrasonic acoustic emissions and stem diameter variations. New insight into the relationship between xylem tensions and embolism. Tree Physiol. 2005, 25, 237–243. [Google Scholar] [CrossRef] [PubMed]
  74. Quarles, S.L.; Association, W.D.K.; Association, W.D.K. Acoustic Emission Generated during Drying. In Proceedings of the 41st Western Dry Kiln Association Meeting, Corvallis, OR, USA, 1990; p. 53.
  75. Michlmayr, G.; Cohen, D.; Or, D. Sources and characteristics of acoustic emissions from mechanically stressed geologic granular media—A review. Earth Sci. Rev. 2012, 112, 97–114. [Google Scholar] [CrossRef]
  76. Tyree, M.T.; Sperry, J.S. Vulnerability of xylem to cavitation and embolism. Annu. Rev. Plant Biol. 1989, 40, 19–36. [Google Scholar] [CrossRef]
  77. Hacke, U.; Sauter, J. Xylem dysfunction during winter and recovery of hydraulic conductivity in diffuse-porous and ring-porous trees. Oecologia 1996, 105, 435–439. [Google Scholar] [CrossRef]
  78. Nardini, A.; Tyree, M.T.; Salleo, S. Xylem cavitation in the leaf of prunus laurocerasusand its impact on leaf hydraulics. Plant Physiol. 2001, 125, 1700–1709. [Google Scholar] [CrossRef] [PubMed]
  79. Salleo, S.; Gullo, L.; Raimondo, F.; Nardini, A. Vulnerability to cavitation of leaf minor veins: Any impact on leaf gas exchange? Plant Cell Environ. 2001, 24, 851–859. [Google Scholar] [CrossRef]
  80. Vergeynst, L.L.; Sause, M.G.R.; Steppe, K. Clustering reveals cavitation-related acoustic emission signals from dehydrating branches. Tree Physiol. 2016, in press. [Google Scholar]
  81. Aggelis, D.; Matikas, T.; Shiotani, T. Advanced acoustic techniques for health monitoring of concrete structures. In The Song’s Handbook of Concrete Durability; Kim, S.H., Ann, K.Y., Eds.; Middleton Publishing Inc: Middleton, WI, USA, 2010; pp. 331–378. [Google Scholar]
  82. Choat, B.; Drayton, W.M.; Brodersen, C.; Matthews, M.A.; Shackel, K.A.; Wada, H.; Mcelrone, A.J. Measurement of vulnerability to water stress-induced cavitation in grapevine: A comparison of four techniques applied to a long-vesseled species. Plant Cell Environ. 2010, 33, 1502–1512. [Google Scholar] [CrossRef] [PubMed]
  83. Brodersen, C.R.; McElrone, A.J.; Choat, B.; Lee, E.F.; Shackel, K.A.; Matthews, M.A. In vivo visualizations of drought-induced embolism spread in vitis vinifera. Plant Physiol. 2013, 161, 1820–1829. [Google Scholar] [CrossRef] [PubMed]
  84. Nolf, M.; Beikircher, B.; Rosner, S.; Nolf, A.; Mayr, S. Xylem cavitation resistance can be estimated based on time-dependent rate of acoustic emissions. New Phytol. 2015, 208, 625–632. [Google Scholar] [CrossRef] [PubMed]
  85. Vergeynst, L.L.; Sause, M.G.; Hamstad, M.A.; Steppe, K. Deciphering acoustic emission signals in drought stressed branches: The missing link between source and sensor. Front. Plant Sci. 2015, 6. [Google Scholar] [CrossRef] [PubMed] [Green Version]
  86. Lo, G.M.; Salleo, S. Three different methods for measuring xylem cavitation and embolism: A comparison. Ann. Bot. 1991, 67, 417–424. [Google Scholar]
  87. Cochard, H. Vulnerability of several conifers to air embolism. Tree Physiol. 1992, 11, 73–83. [Google Scholar] [CrossRef] [PubMed]
  88. Niemz, P.; Emmler, R.; Pridöhl, E.; Fröhlich, J.; Lühmann, A. Vergleichende untersuchungen zur Anwendung von piezoelektrischen und Schallemissionssignalen bei der trocknung von Holz. Holz als Roh und Werkstoff 1994, 52, 162–168. [Google Scholar] [CrossRef]
  89. Lee, S.-H.; Quarles, S.; Schniewind, A. Wood fracture, acoustic emission, and the drying process part 2. Acoustic emission pattern recognition analysis. Wood Sci. Technol. 1996, 30, 283–292. [Google Scholar] [CrossRef]
  90. Beall, F. Overview of the use of ultrasonic technologies in research on wood properties. Wood Sci. Technol. 2002, 36, 197–212. [Google Scholar] [CrossRef]
  91. Kawamoto, S.; Williams, R.S. Acoustic Emission and Acousto-Ultrasonic Techniques for Wood and Wood-Based Composites: A Review; US Department of Agriculture: Madison, WI, USA, 2002.
  92. Beall, F.C.; Breiner, T.A.; Wang, J. Closed-loop control of lumber drying based on acoustic emission peak amplitude. For. Prod. J. 2005, 55, 167–174. [Google Scholar]
  93. Johnson, D.M.; Meinzer, F.C.; Woodruff, D.R.; McCulloh, K.A. Leaf xylem embolism, detected acoustically and by cryo-sem, corresponds to decreases in leaf hydraulic conductance in four evergreen species. Plant Cell Environ. 2009, 32, 828–836. [Google Scholar] [CrossRef] [PubMed]
  94. Rosner, S.; Karlsson, B.; Konnerth, J.; Hansmann, C. Shrinkage processes in standard-size norway spruce wood specimens with different vulnerability to cavitation. Tree Physiol. 2009, 29, 1419–1431. [Google Scholar] [CrossRef] [PubMed]
  95. Sause, M.G.R.; Gribov, A.; Unwin, A.R.; Horn, S. Pattern recognition approach to identify natural clusters of acoustic emission signals. Pattern Recognit. Lett. 2012, 33, 17–23. [Google Scholar] [CrossRef]
  96. Zelenyak, A.M.; Hamstad, M.A.; Sause, M.G. Modeling of acoustic emission signal propagation in waveguides. Sensors 2015, 15, 11805–11822. [Google Scholar] [CrossRef] [PubMed]
  97. Sause, M.; Horn, S. Simulation of acoustic emission in planar carbon fiber reinforced plastic specimens. J. Nondestruct. Eval. 2010, 29, 123–142. [Google Scholar] [CrossRef]
  98. Haacs, R.; Blank, R.W. Acoustic emission from drought-stressed red pine (Pinus resinosa). J. Acoust. Emiss. 1990, 9, 181–187. [Google Scholar]
  99. Lewis, A.M. Two Mechanisms for the Initiation of Embolism in Tracheary Elements and Other Dead Plant Cells under Water Stress; Harvard University: Cambridge, MA, USA, 1987. [Google Scholar]
  100. Sandford, A.; Grace, J. The measurement and interpretation of ultrasound from woody stems. J. Exp. Bot. 1985, 36, 298–311. [Google Scholar] [CrossRef]
  101. Ritman, K.; Milburn, J. Monitoring of ultrasonic and audible emissions from plants with or without vessels. J. Exp. Bot. 1991, 42, 123–130. [Google Scholar] [CrossRef]
  102. Kikuta, S.; Lo Gullo, M.; Kartusch, B.; Rosner, S.; Richter, H. Ultrasound Acoustic Emissions from Conifer Sapwood Sections: Relationship between Number of Events Detected and Number of Tracheids. In Proceedings of the IAWA International Symposium on Wood Sciences, Montpellier, France, 24–29 October 2004; p. 29.
  103. Vergeynst, L.L. Investigation and Application of the Acoustic Emission Technique to Measure Drought-Induced Cavitation in Woody Plants; Ghent University: Ghent, Belgium, 2015. [Google Scholar]
  104. Charrier, G.; Pramsohler, M.; Charra-Vaskou, K.; Saudreau, M.; Ameglio, T.; Neuner, G.; Mayr, S. Ultrasonic emissions during ice nucleation and propagation in plant xylem. New Phytol. 2015, 207, 570–578. [Google Scholar] [CrossRef] [PubMed]
  105. Torres-Ruiz, J.M.; Jansen, S.; Choat, B.; McElrone, A.J.; Cochard, H.; Brodribb, T.J.; Badel, E.; Burlett, R.; Bouche, P.S.; Brodersen, C.R.; et al. Direct X-ray microtomography observation confirms the induction of embolism upon xylem cutting under tension. Plant Physiol. 2015, 167, 40–43. [Google Scholar] [CrossRef] [PubMed]
  106. Zweifel, R.; Zeugin, F. Ultrasonic acoustic emissions in drought-stressed trees—More than signals from cavitation? New Phytol. 2008, 179, 1070–1079. [Google Scholar] [CrossRef] [PubMed]
  107. Steppe, K.; Zeugin, F.; Zweifel, R. Low-decibel ultrasonic acoustic emissions are temperature-induced and probably have no biotic origin. New Phytol. 2009, 183, 928–931. [Google Scholar] [CrossRef] [PubMed]
  108. Brodersen, C.R.; McElrone, A.J. Maintenance of xylem network transport capacity: A review of embolism repair in vascular plants. Front. Plant Sci. 2013, 4. [Google Scholar] [CrossRef] [PubMed]
  109. Zwieniecki, M.A.; Holbrook, N.M. Confronting maxwell′s demon: Biophysics of xylem embolism repair. Trends Plant Sci. 2009, 14, 530–534. [Google Scholar] [CrossRef] [PubMed]
  110. McCulloh, K.A.; Meinzer, F.C. Further evidence that some plants can lose and regain hydraulic function daily. Tree Physiol. 2015, 35, 691–693. [Google Scholar] [CrossRef] [PubMed]
  111. Meinzer, F.C.; McCulloh, K.A. Xylem recovery from drought-induced embolism: Where is the hydraulic point of no return? Tree Physiol. 2013, 33, 331–334. [Google Scholar] [CrossRef] [PubMed]
  112. Zwieniecki, M.A.; Secchi, F. Threats to xylem hydraulic function of trees under “new climate normal” conditions. Plant Cell Environ. 2015, 38, 1713–1724. [Google Scholar] [CrossRef] [PubMed]
  113. McElrone, A.; Brodersen, C.; Alsina, M.; Drayton, W.; Matthews, M.; Shackel, K.; Wada, H.; Zufferey, V.; Choat, B. Centrifuge technique consistently overestimates vulnerability to water stress-induced cavitation in grapevines as confirmed with high-resolution computed tomography. New Phytol. 2012, 196, 661–665. [Google Scholar] [CrossRef] [PubMed]
Figure 1. Typical vulnerability curve with P12, P50 and P88 representing the xylem water potential at which, respectively, 12%, 50% and 88% of xylem hydraulic conductivity is lost, adapted from Domec and Gartner [30] and Fichot et al. [36].
Applsci 06 00071 g001
Figure 2. Picture of the vibration detector used by Milburn and Johnson [42] to detect drying-induced sounds in leaf petioles.
Applsci 06 00071 g002
Figure 3. Vergeynst et al. [80] calculated the point of 100% loss of hydraulic conductivity (P100) as the endpoint of the acoustic emission (AE) activity (first derivative of the curve of cumulative AE) peak, where the third derivative of the curve of cumulative AE signals in time reached a local maximum (indicated by the vertical dashed line and the “*” symbol). The black line shows the curve of cumulative AE. Results of measurements on three different grapevine branches are shown.
Applsci 06 00071 g003
Figure 4. (a) Cumulative AE (cum AE, grey symbols, left y-axis) detected by four different AE sensors (1–4) showed a pattern similar to the number of cavitated vessels (black symbols, right y-axis) counted on μCT images when plotted against relative radial diameter shrinkage (∆d/d), which is a measure for decreasing xylem water potential. The μCT cross-sections of the grapevine branch are shown for the beginning (d) and end (b) of the dehydration experiment and at the breakpoint between Phases I and II (c). The grey zone in (a) delimits the 99.7% confidence interval around the mean cumulative AE curve [33].
Applsci 06 00071 g004
Figure 5. (A) Frequency features peak frequency (PF), weighted peak frequency (WPF), frequency centroid (FC) and four partial powers (PP) were used for the automated clustering algorithm; and (B) Waveform features rise time, amplitude and rise angle describe the shape of the AE signal [80].
Applsci 06 00071 g005

