
Novel Graphical Representation and Numerical Characterization of DNA Sequences

Abstract
:
1. Introduction
2. Methods
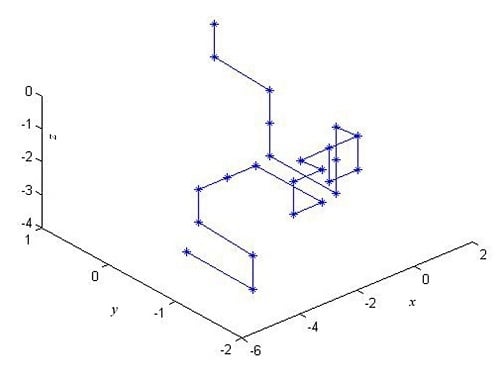
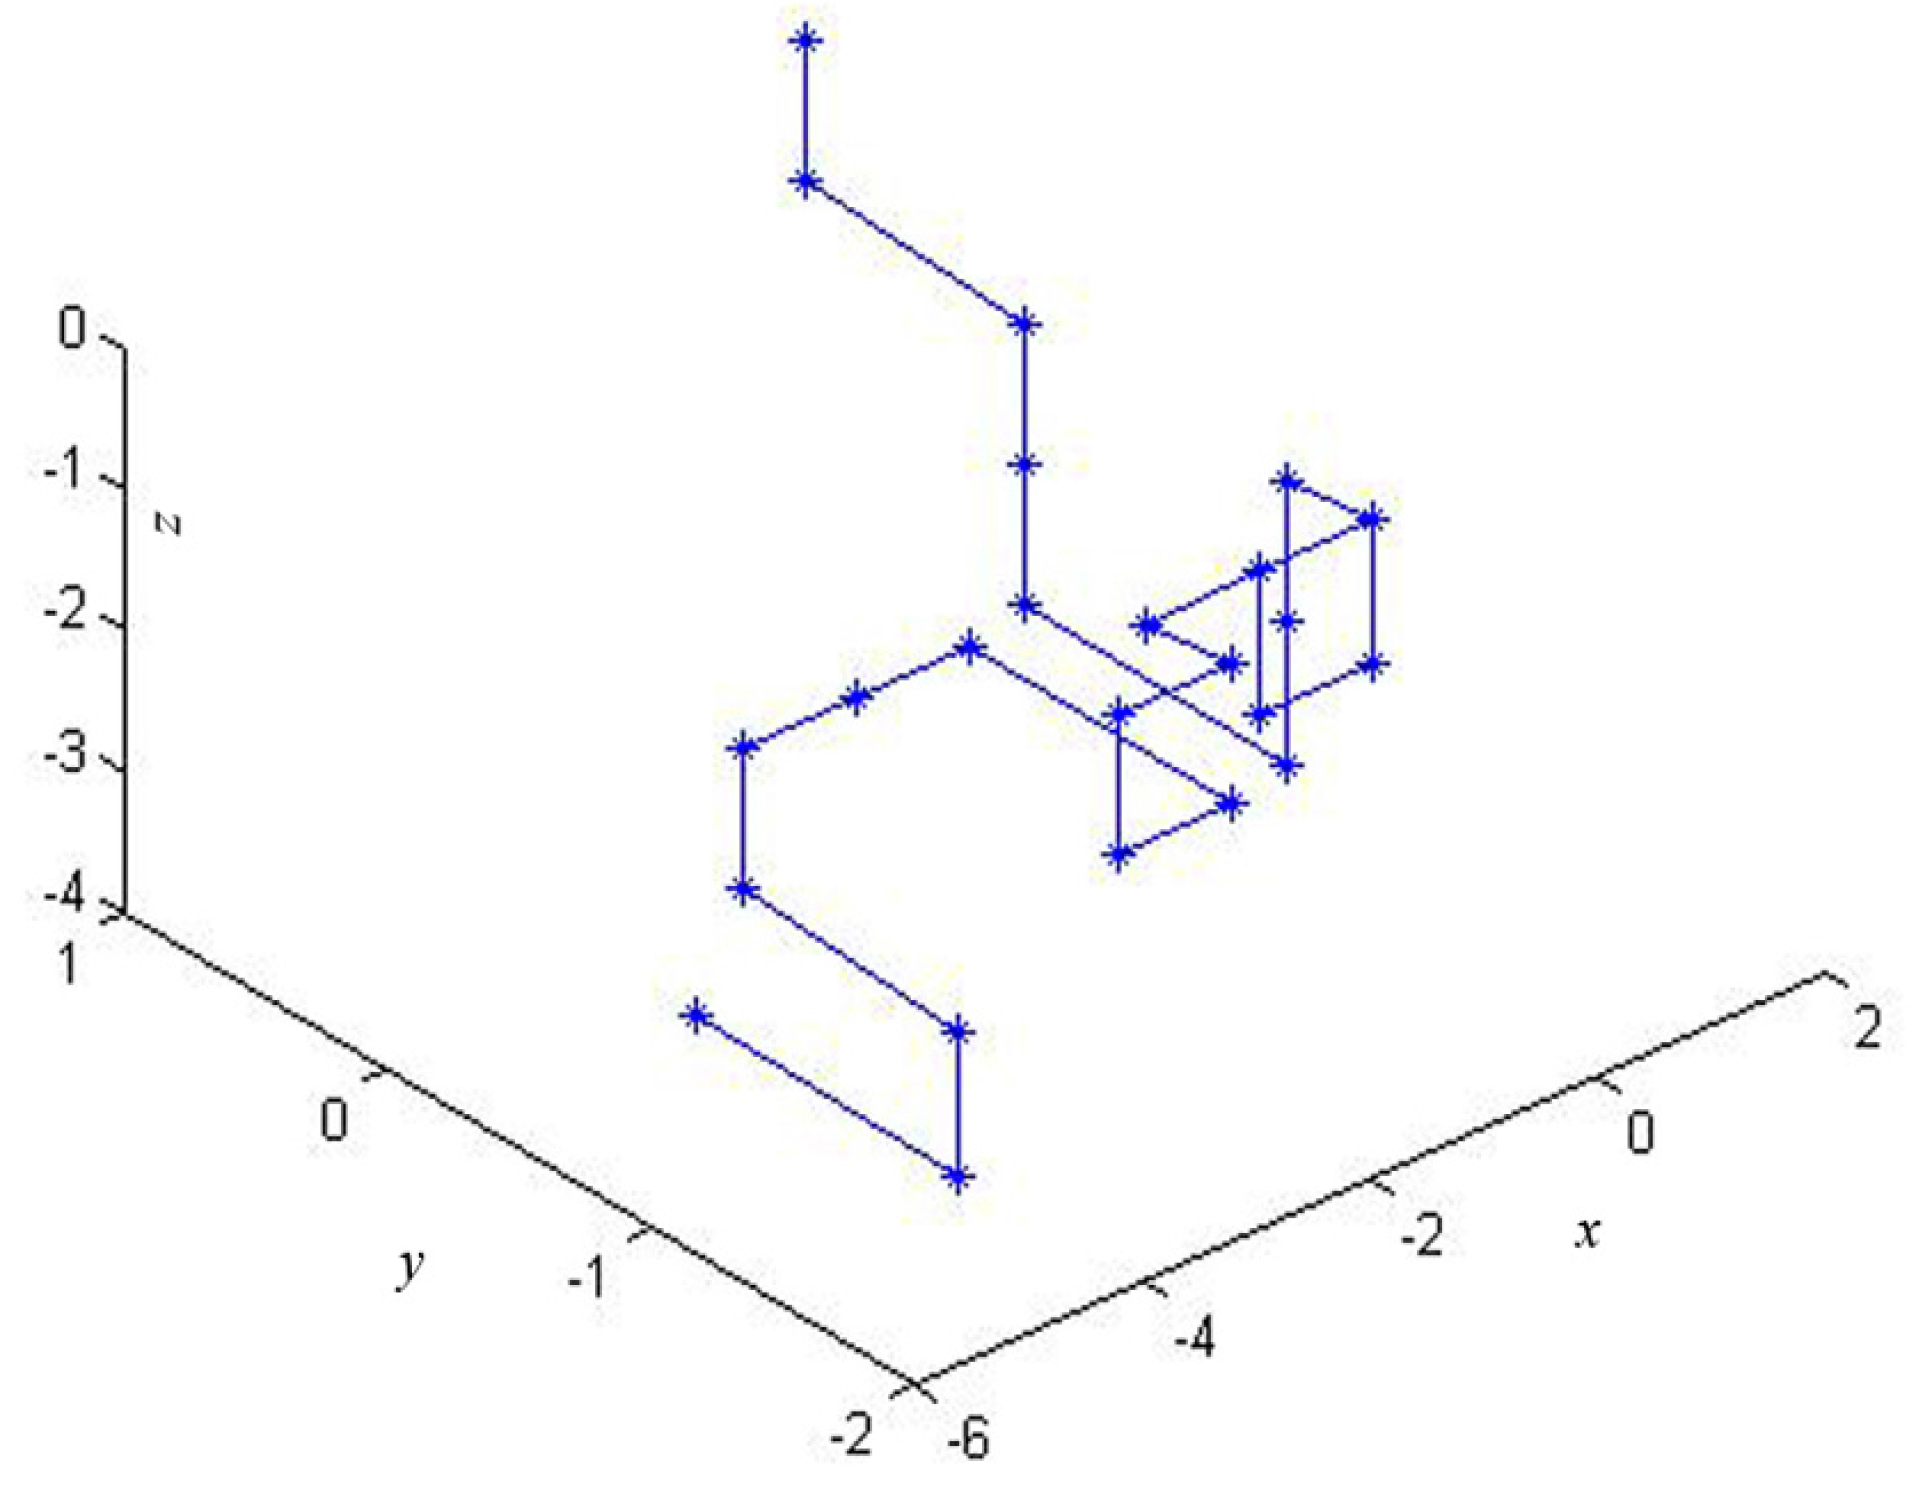
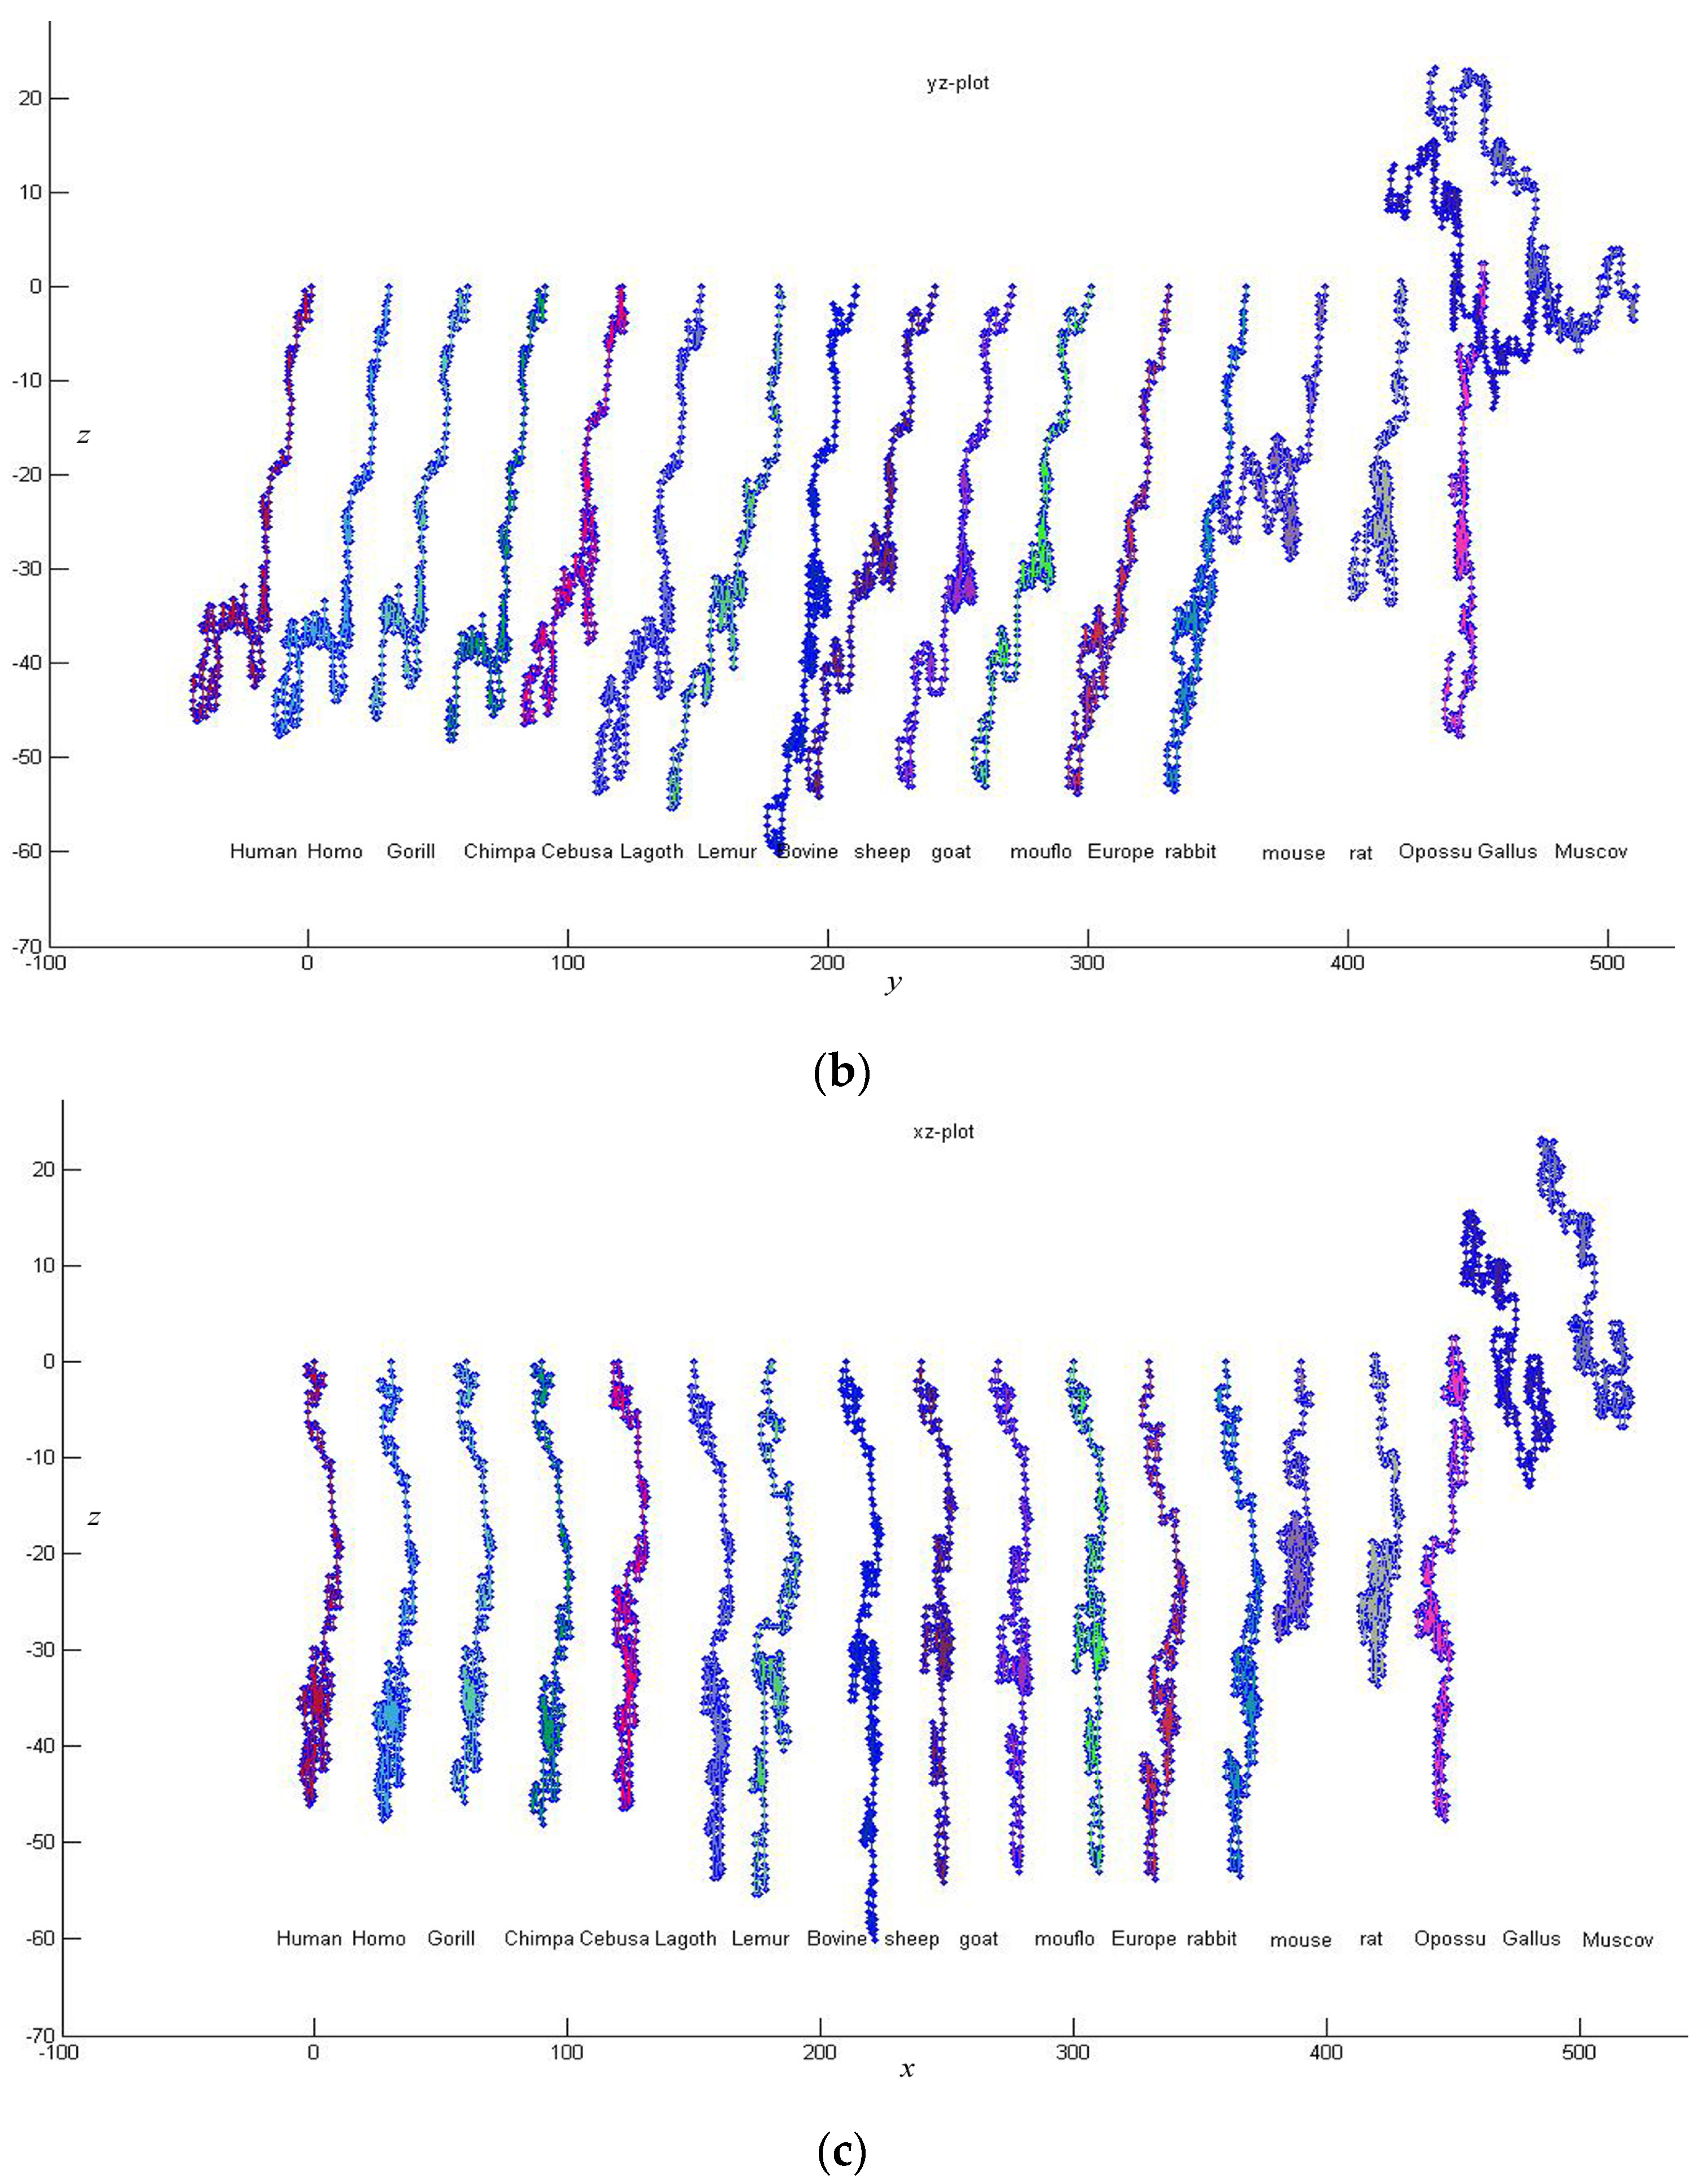
2.1. The 3-D Graphical Representation
2.2. Numerical Characterization of DNA Sequences
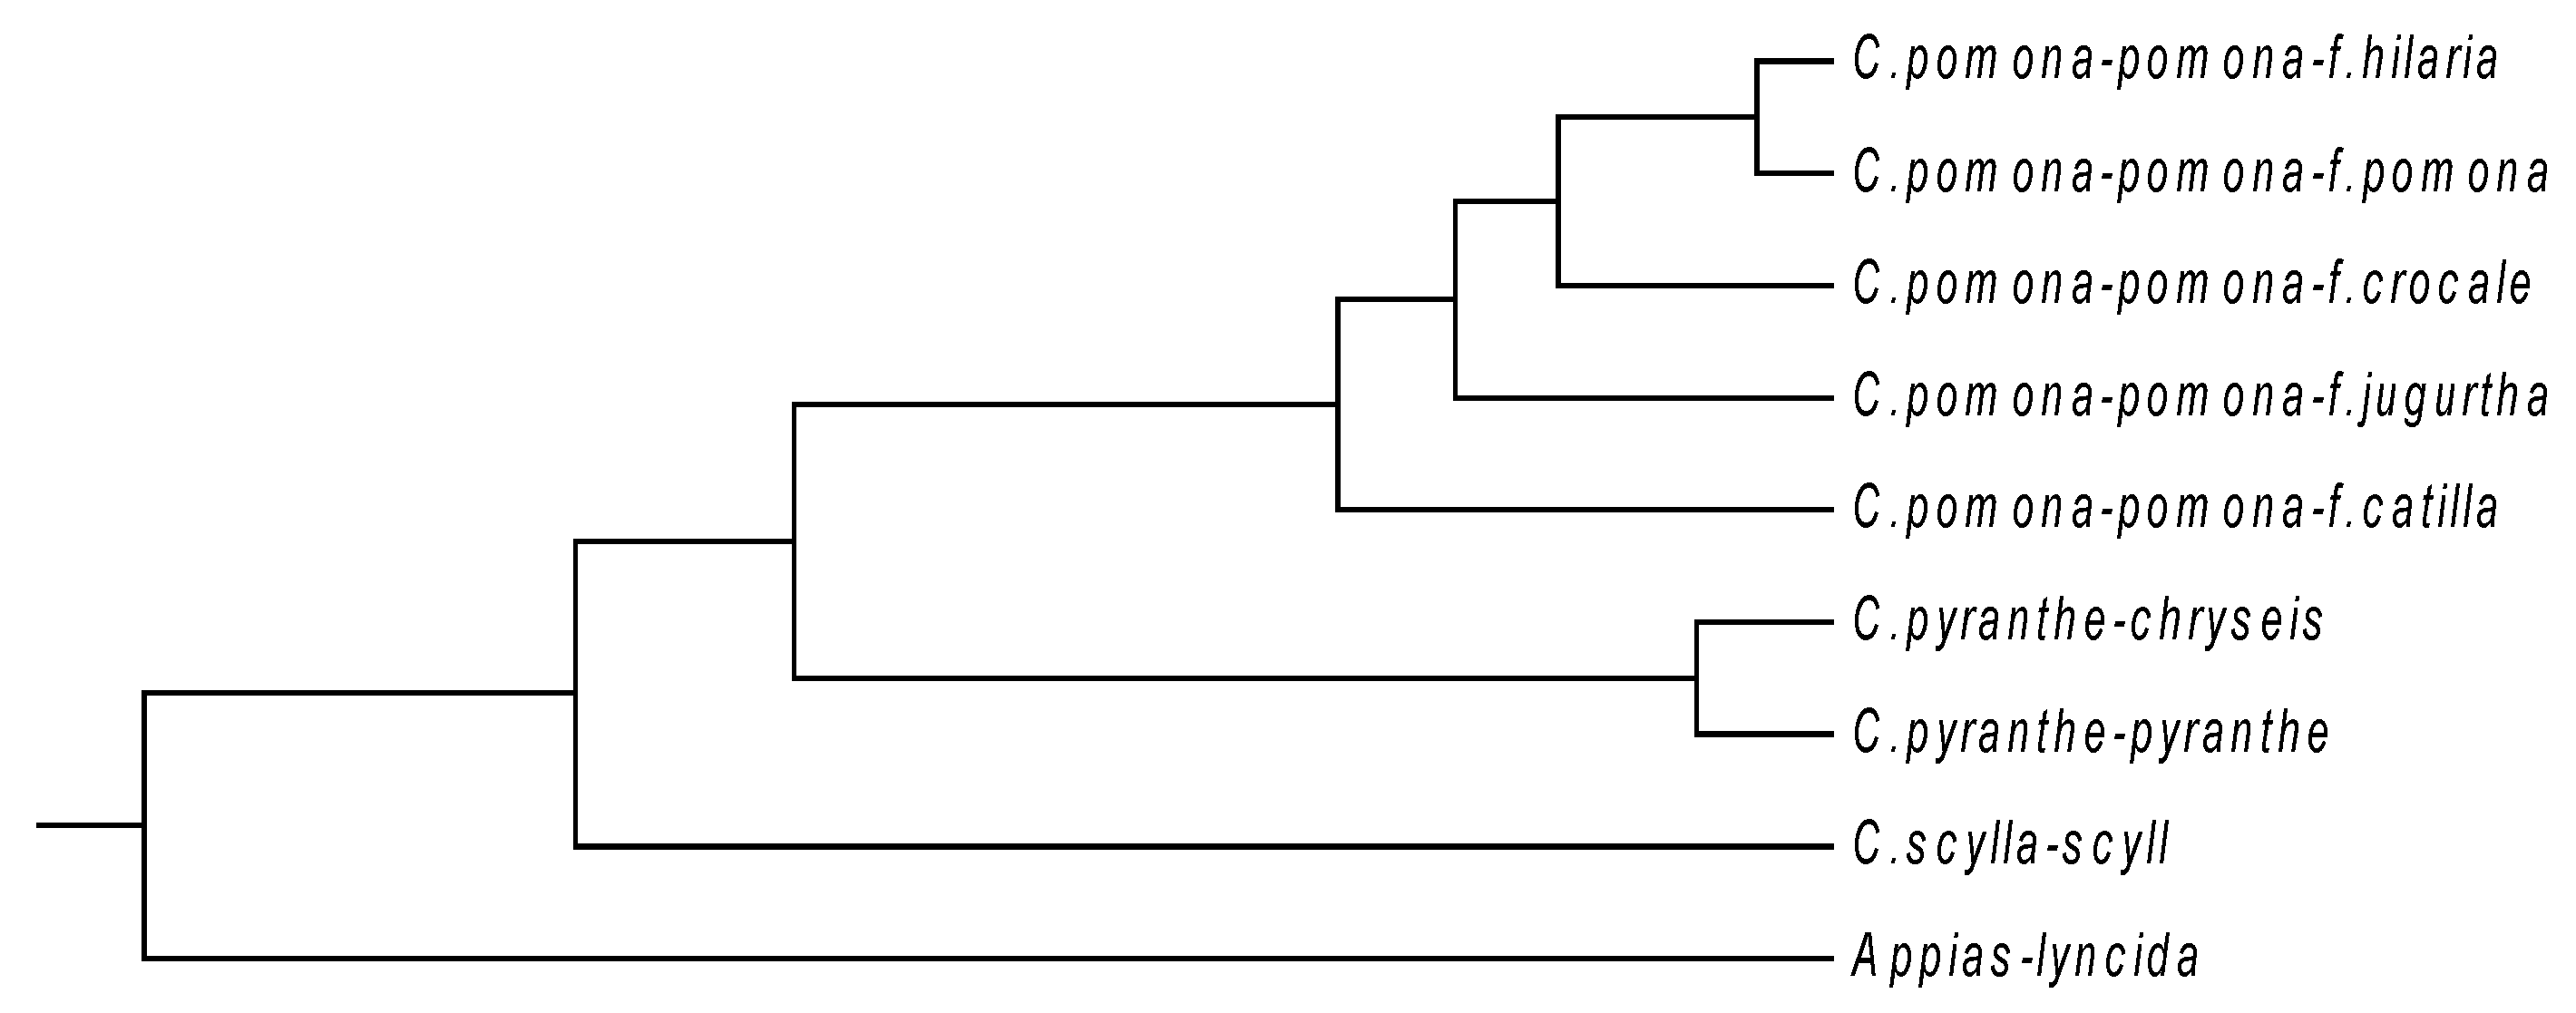
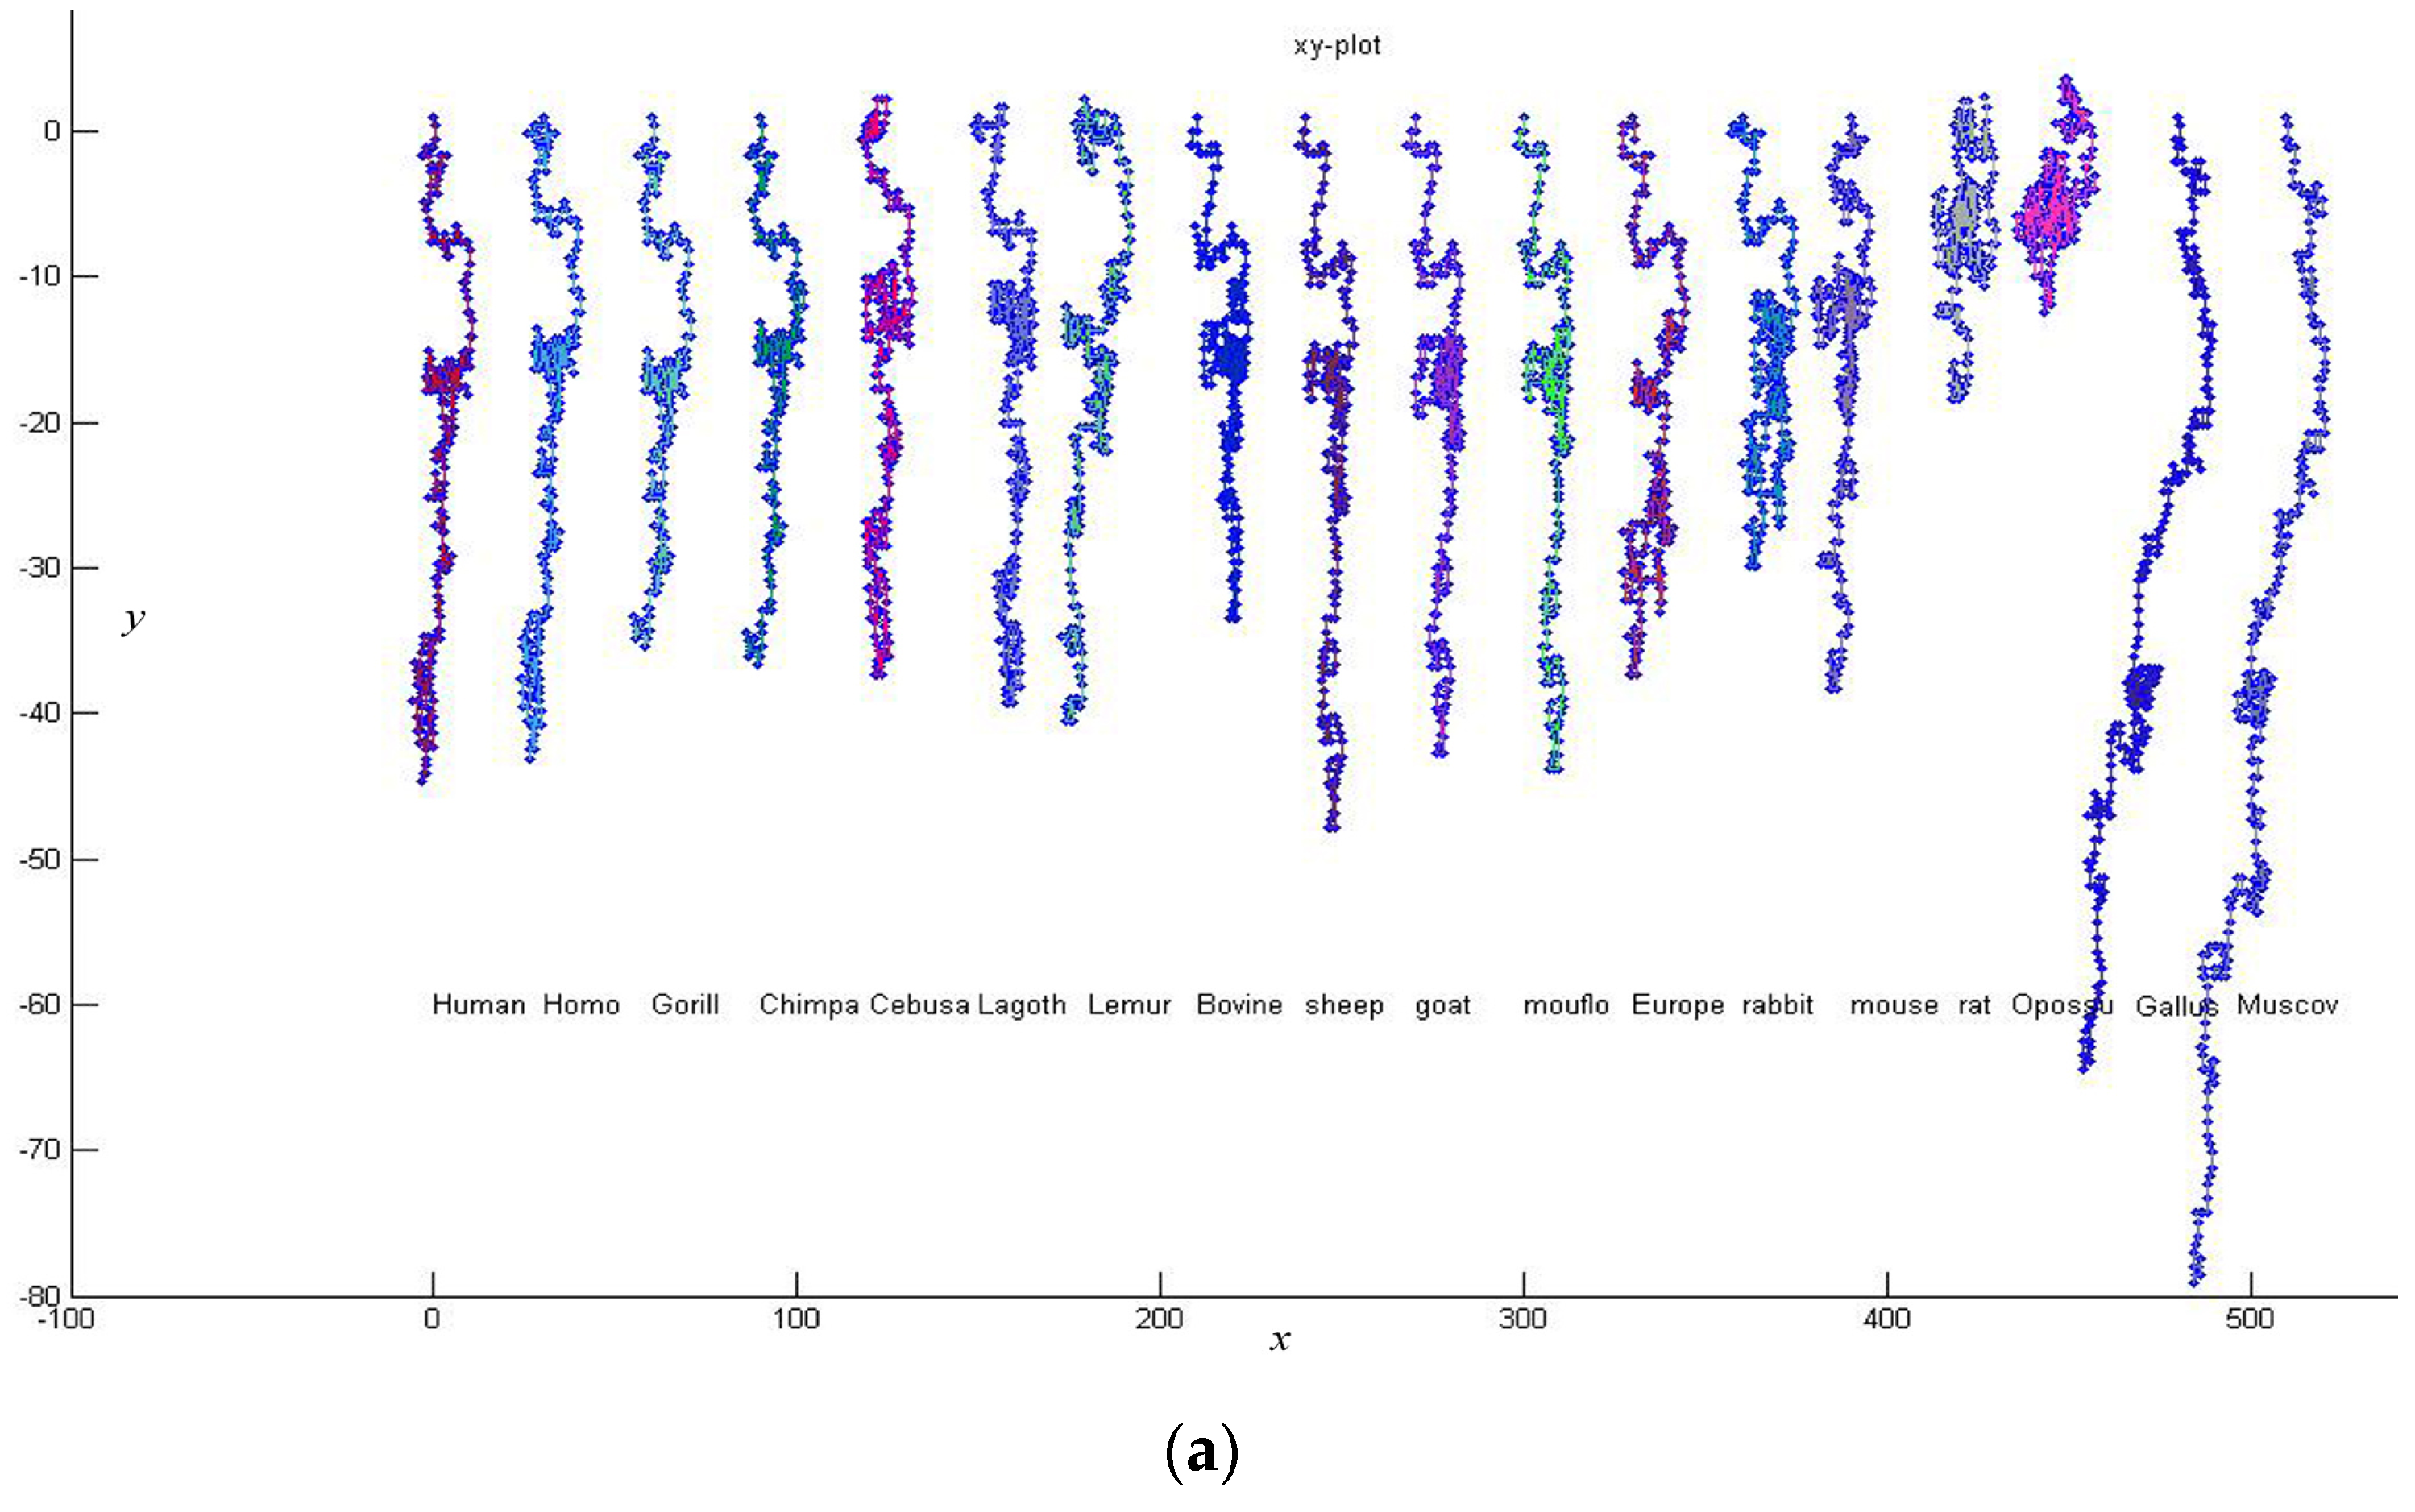
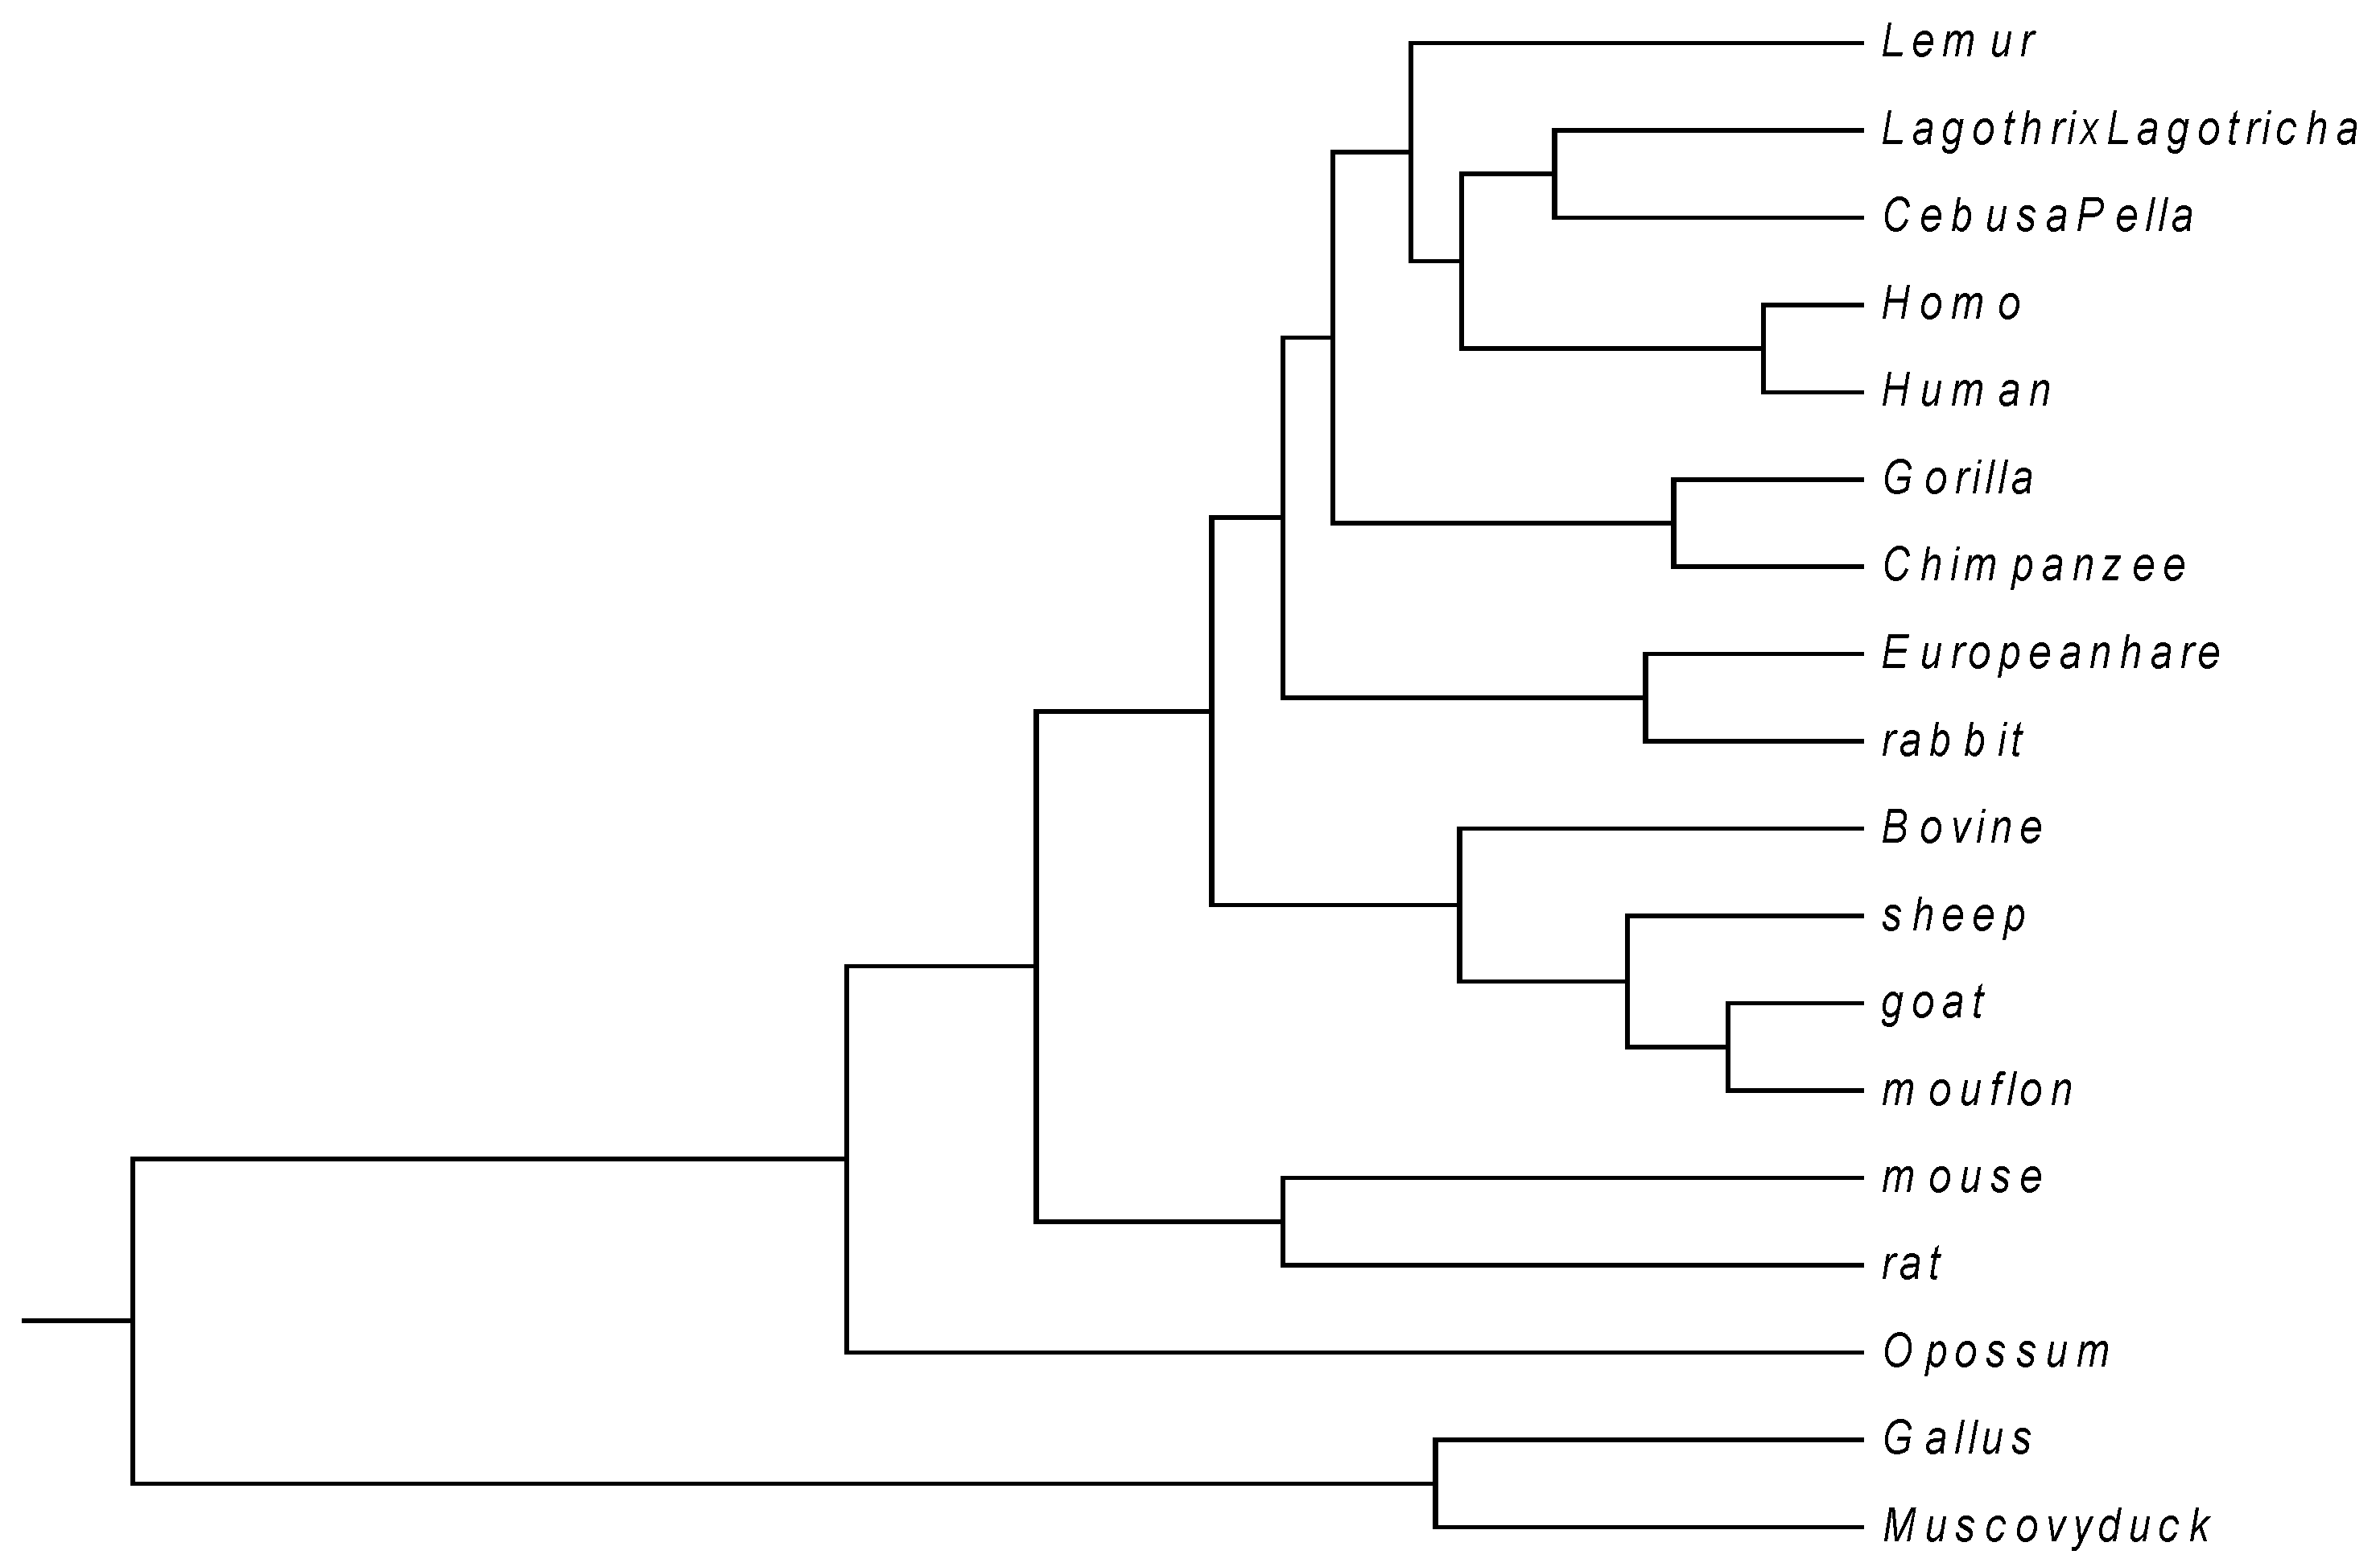
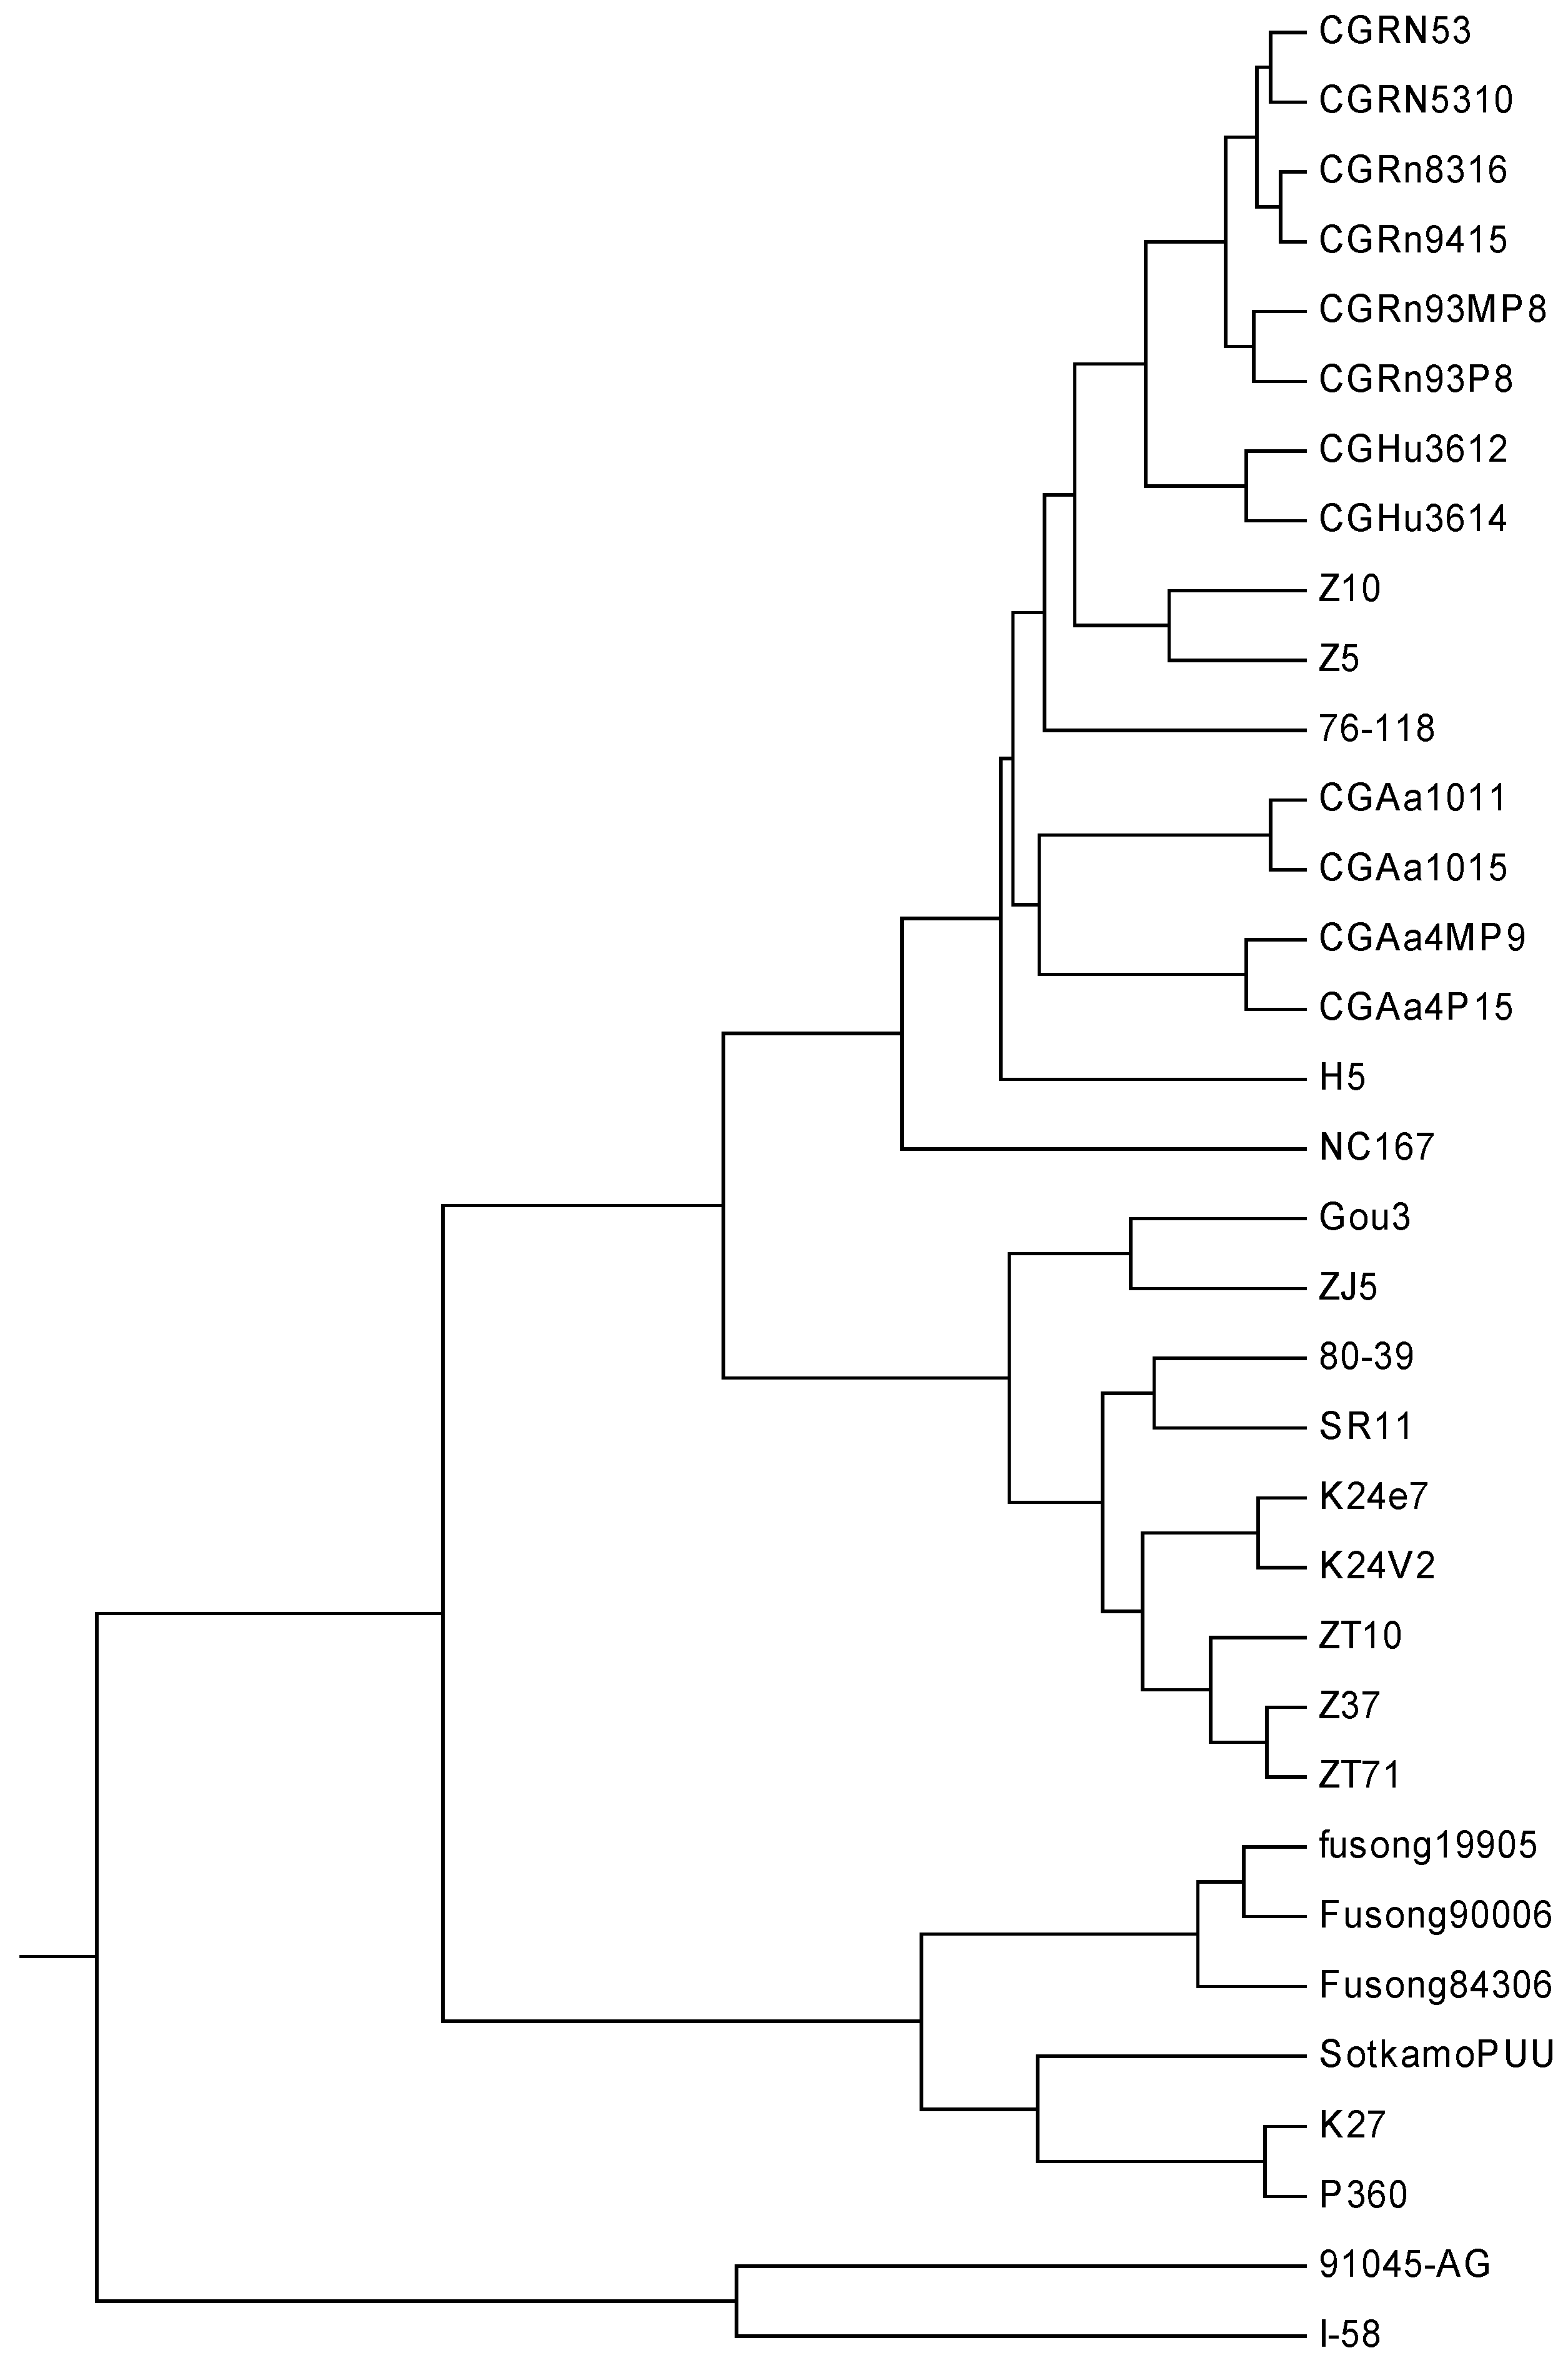
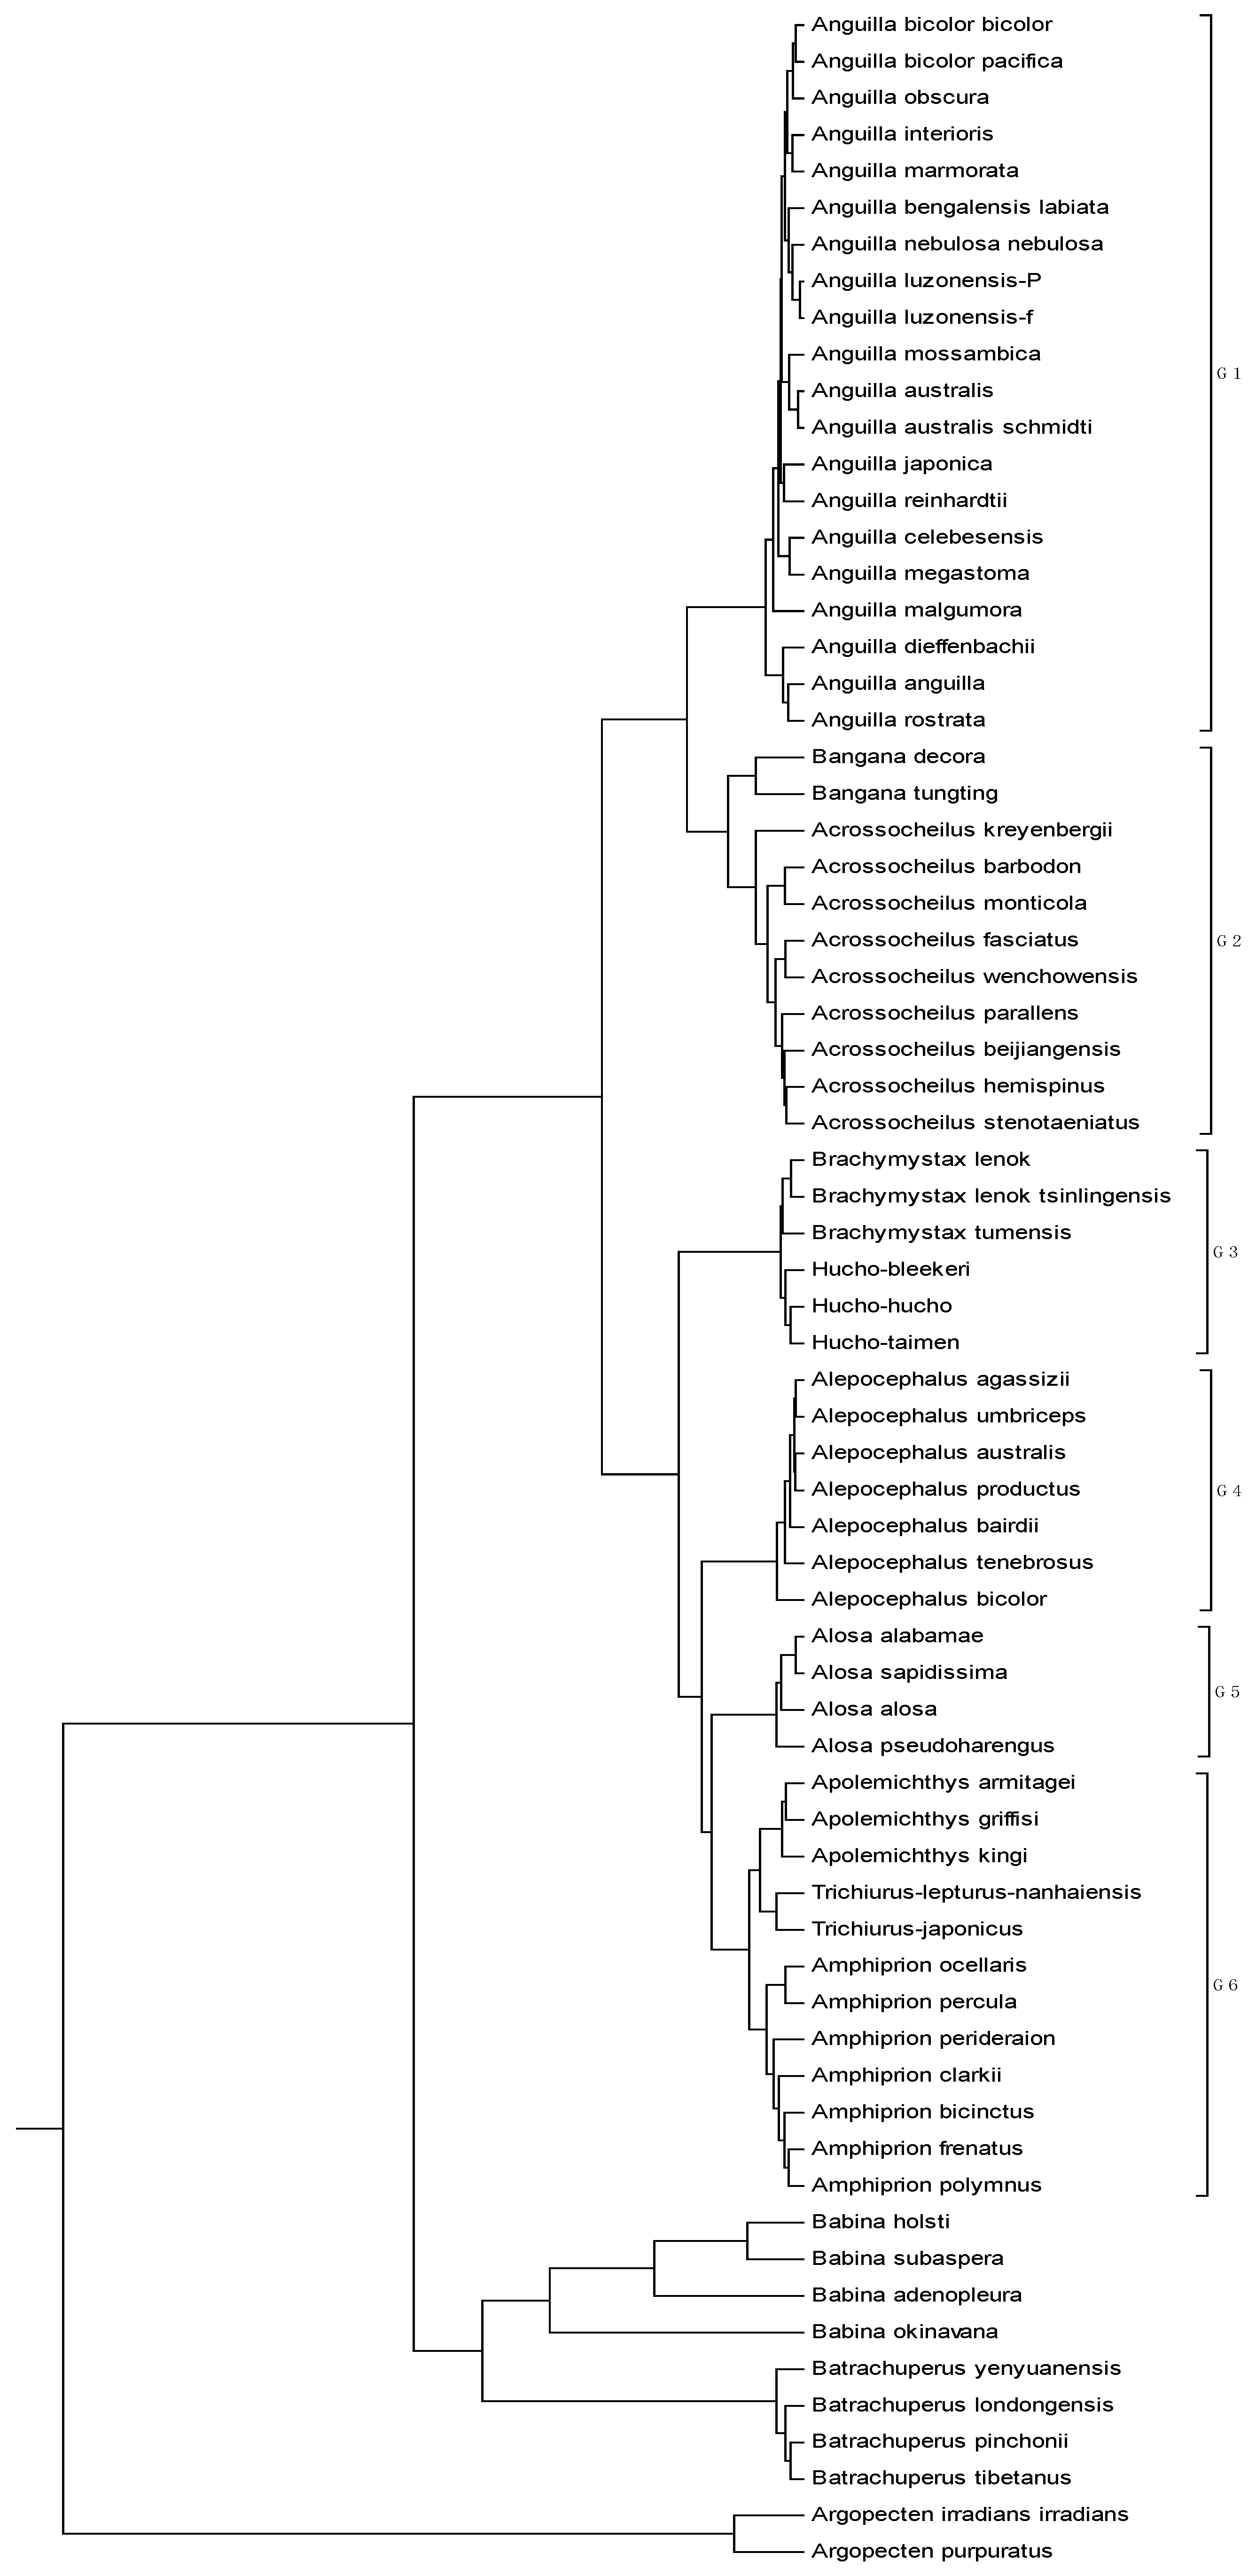
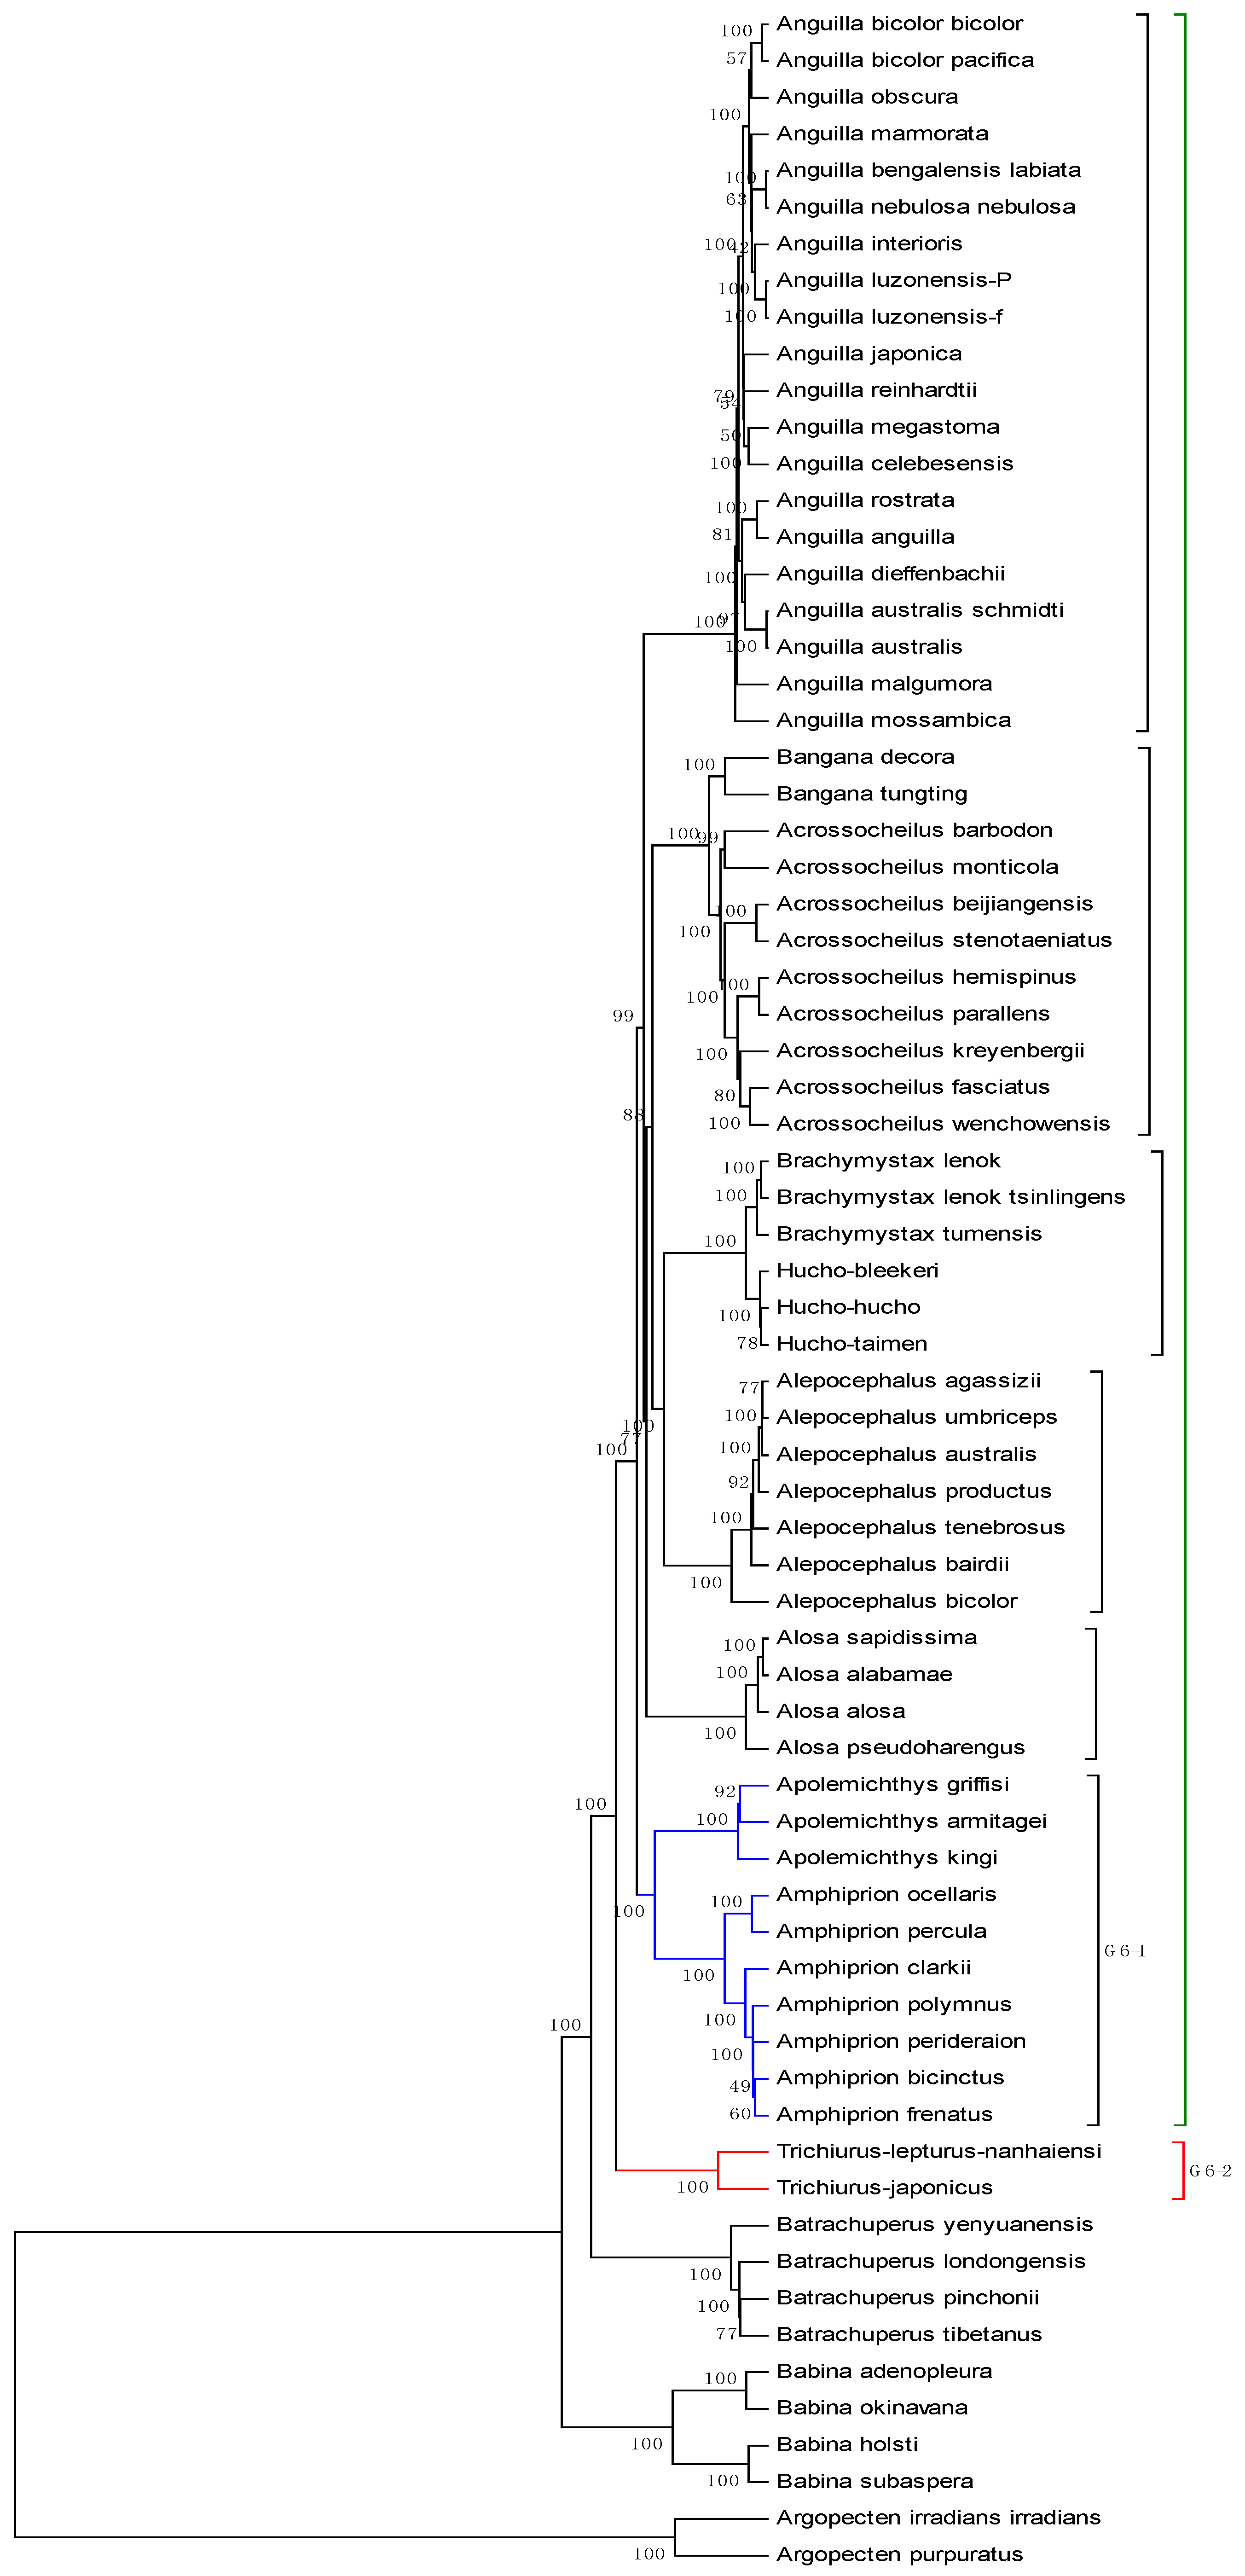
3. Results and Discussion
4. Concluding Remarks
Acknowledgments
Author Contributions
Conflicts of Interest
References
- Tian, K.; Yang, X.Q.; Kong, Q.; Yin, C.C.; He, R.L.; Yau, S.S.T. Two dimensional Yau-hausdorff distance with applications on comparison of DNA and protein sequences. PLoS ONE 2015, 10. [Google Scholar] [CrossRef] [PubMed]
- Hamori, E.; Ruskin, J. H curves, a novel method of representation of nucleotide series especially suited for long DNA sequences. J. Biol. Chem. 1983, 258, 1318–1327. [Google Scholar] [PubMed]
- Gates, M.A. Simpler DNA sequence representations. Nature 1985, 316. [Google Scholar] [CrossRef]
- Nandy, A. A new graphical representation and analysis of DNA sequence structure: I methodology and application to globin genes. Curr. Sci. 1994, 66, 309–314. [Google Scholar]
- Nandy, A. Graphical representation of long DNA sequences. Curr. Sci. 1994, 66, 821. [Google Scholar]
- Leong, P.M.; Morgenthaler, S. Random walk and gap plots of DNA sequences. Comput. Appl. Biosci. 1995, 11, 503–507. [Google Scholar] [CrossRef] [PubMed]
- Jeffrey, H.J. Chaos game representation of gene structure. Nucleic Acids Res. 1990, 18, 2163–2170. [Google Scholar] [CrossRef] [PubMed]
- Randic, M.; Vracko, M.; Nandy, A.; Basak, S.C. On 3-D graphical representation of DNA primary sequences and their numerical characterization. J. Chem. Inf. Comput. Sci. 2000, 40, 1235–1244. [Google Scholar] [CrossRef] [PubMed]
- Randic, M.; Novic, M.; Plavsic, D. Milestones in graphical bioinformatics. Int. J. Quantum Chem. 2013, 113, 2413–2446. [Google Scholar] [CrossRef]
- Randic, M.; Zupan, J.; Balaban, A.T.; Vikic-Topic, D.; Plavsic, D. Graphical representation of proteins. Chem. Rev. 2011, 111, 790–862. [Google Scholar] [CrossRef] [PubMed]
- Li, C.; Tang, N.N.; Wang, J. Directed graphs of DNA sequences and their numerical characterization. J. Theor. Biol. 2006, 241, 173–177. [Google Scholar] [CrossRef] [PubMed]
- Yang, Y.; Zhang, Y.Y.; Jia, M.D.; Li, C.; Meng, L.Y. Non-degenerate graphical representation of DNA sequences and its applications to phylogenetic analysis. Comb. Chem. High Throughput Screen. 2013, 16, 585–589. [Google Scholar] [CrossRef] [PubMed]
- Gonzzlez-Diaz, H.; Perez-Montoto, L.G.; Duardo-Sanchez, A.; Paniagua, E.; Vazquez-Prieto, S.; Vilas, R.; Dea-Ayuela, M.A.; Bolas-Fernandez, F.; Munteanu, C.R.; Dorado, J.; et al. Generalized lattice graphs for 2D-visualization of biological information. J. Theor. Biol. 2009, 261, 136–147. [Google Scholar] [CrossRef] [PubMed]
- Zhang, Z.J. DV-Curve: A novel intuitive tool for visualizing and analyzing DNA sequences. Bioinformatics 2009, 25, 1112–1117. [Google Scholar] [CrossRef] [PubMed][Green Version]
- Qi, Z.H.; Jin, M.Z.; Li, S.L.; Feng, J. A protein mapping method based on physicochemical properties and dimension reduction. Comput. Biol. Med. 2015, 57, 1–7. [Google Scholar] [CrossRef] [PubMed]
- Waz, P.; Bielinska-Waz, D. 3D-dynamic representation of DNA sequences. J. Mol. Model. 2014, 20. [Google Scholar] [CrossRef] [PubMed]
- Yao, Y.H.; Yan, S.; Han, J.; Dai, Q.; He, P.A. A novel descriptor of protein sequences and its application. J. Theor. Biol. 2014, 347, 109–117. [Google Scholar] [CrossRef] [PubMed]
- Ma, T.T.; Liu, Y.X.; Dai, Q.; Yao, Y.H.; He, P.A. A graphical representation of protein based on a novel iterated function system. Phys. A 2014, 403, 21–28. [Google Scholar] [CrossRef]
- Zhang, R.; Zhang, C.T. A brief review: The Z curve theory and its application in genome analysis. Curr. Genom. 2014, 15, 78–94. [Google Scholar] [CrossRef] [PubMed]
- Zhang, C.T.; Zhang, R.; Ou, H.Y. The Z curve database: A graphic representation of genome sequences. Bioinformatics 2003, 19, 593–599. [Google Scholar] [CrossRef] [PubMed]
- Zhang, R.; Zhang, C.T. Z curves, an intuitive tool for visualizing and analyzing DNA sequences. J. Biomol. Struct. Dyn. 1994, 11, 767–782. [Google Scholar] [CrossRef] [PubMed]
- Herisson, J.; Payen, G.; Gherbi, R. A 3D pattern matching algorithm for DNA sequences. Bioinformatics 2007, 23, 680–686. [Google Scholar] [CrossRef] [PubMed]
- Bianciardi, G.; Borruso, L. Nonlinear analysis of tRNAs squences by random walks: Randomness and order in the primitive information polymers. J. Mol. Evol. 2015, 80, 81–85. [Google Scholar] [CrossRef] [PubMed]
- Ghosh, A.; Nandy, A. Graphical representation and mathematical characterization of protein sequences and applications to viral proteins. Adv. Protein Chem. Struct. Biol. 2011, 83. [Google Scholar] [CrossRef]
- Karlin, S.; Burge, C. Dinucleotide relative abundance extremes: A genomic signature. Trends Genet. 1995, 11, 283–290. [Google Scholar] [PubMed]
- Karlin, S. Global dinucleotide signatures and analysis of genomic heterogeneity. Curr. Opin. Microbiol. 1998, 1, 598–610. [Google Scholar] [CrossRef]
- Yang, X.W.; Wang, T.M. Linear regression model of short k-word: A similarity distance suitable for biological sequences with various lengths. J. Theor. Biol. 2013, 337, 61–70. [Google Scholar] [CrossRef] [PubMed]
- Li, C.; Ma, H.; Zhou, Y.; Wang, X.; Zheng, X. Similarity analysis of DNA sequences based on the weighted pseudo-entropy. J. Comput. Chem. 2011, 32, 675–680. [Google Scholar] [CrossRef] [PubMed]
- Rocha, E.P.; Viari, A.; Danchin, A. Oligonucleotide bias in Bacillus subtilis: General trends and taxonomic comparisons. Nucleic Acids Res. 1998, 26, 2971–2980. [Google Scholar] [CrossRef] [PubMed]
- Pride, D.T.; Meineramann, R.J.; Wassenaar, T.M.; Blaser, M.J. Evolutionary implications of microbial genome tetranucleotide frequency biases. Genome Res. 2003, 13, 145–158. [Google Scholar] [CrossRef] [PubMed]
- Li, C.; Wang, J. Numerical characterization and similarity analysis of DNA sequences based on 2-D graphical representation of the characteristic sequences. Comb. Chem. High. Throughput Screen. 2003, 6, 795–799. [Google Scholar] [CrossRef] [PubMed]
- Li, C.; Wang, J. New invariant of DNA sequences. J. Chem. Inf. Model. 2005, 36, 115–120. [Google Scholar] [CrossRef] [PubMed]
- Bai, F.; Zhang, J.; Zheng, J.; Li, C.; Liu, L. Vector representation and its application of DNA sequences based on nucleotide triplet codons. J. Mol. Graph. Model. 2015, 62, 150–156. [Google Scholar] [CrossRef] [PubMed]
- MEGA, Molecular Evolutionary Genetics Analysis. Available online: http://www.megasoftware.net (accessed on 15 January 2014).
- Wang, J.; Shang, S.Q.; Zhang, Y.L. Phylogenetic relationship of genus catopsilia (Lepidoptera: Pieridae) based on partial sequences of NDI and COI genes from China. Acta. Zootaxon. Sin. 2010, 35, 776–781. [Google Scholar]
- Zhang, Y.Z.; Dong, X.; Li, X.; Ma, C.; Xiong, H.P.; Yan, G.J.; Gao, N.; Jiang, D.M.; Li, M.H.; Li, L.P.; et al. Seoul virus and hantavirus disease, Shenyang, People’s Republic of China. Emerg. Infect. Dis. 2009, 15, 200–206. [Google Scholar] [CrossRef] [PubMed]
- Yao, P.P.; Zhu, H.P.; Deng, X.Z.; Xu, F.; Xie, R.H.; Yao, C.H.; Weng, J.Q.; Zhang, Y.; Yang, Z.Q.; Zhu, Z.Y. Molecular evolution analysis of hantaviruses in Zhejiang province. Chin. J. Virol. 2010, 26, 465–470. [Google Scholar]
- Clustal: Multiple Sequence Alignment. Available online: http://www.clustal.org (accessed on 31 August 2012).


| Base | A | G | C | T |
|---|---|---|---|---|
| A | {A,A} | {A,G} | {A,C} | {A,T} |
| G | - | {G,G} | {G,C} | {G,T} |
| C | - | - | {C,C} | {C,T} |
| T | - | - | - | {T,T} |
| Point | Dinucleotide | x | y | z |
|---|---|---|---|---|
| 1 | AT | 0 | 1 | 0 |
| 2 | TG | 0 | 1 | −1 |
| 3 | GG | 0.5774 | 0.4226 | −1.5774 |
| 4 | GT | 0.5774 | 0.4226 | −2.5774 |
| 5 | TG | 0.5774 | 0.4226 | −3.5774 |
| 6 | GC | 0.5774 | −0.5774 | −3.5774 |
| 7 | CA | 0.5774 | −0.5774 | −2.5774 |
| 8 | AC | 0.5774 | −0.5774 | −1.5774 |
| 9 | CC | 0 | −1.1547 | −1 |
| 10 | CT | −1 | −1.1547 | −1 |
| … | … | … | … | … |
| No. | Species | AC (GenBank) | Location |
|---|---|---|---|
| 1 | Human | U01317 | join(62187..62278, 62409..62631, 63482..63610) |
| 2 | Homo | AF007546 | join(180..271,402..624,1475..1603) |
| 3 | Gorilla | X61109 | join(4538..4630, 4761..4982, 5833..>5881) |
| 4 | Chimpanzee | X02345 | join(4189..4293, 4412..4633, 5484..>5532) |
| 5 | Lemur | M15734 | join(154..245, 376..598, 1467..1595) |
| 6 | CebusaPella | AY279115 | join(946..1037, 1168..1390, 2218..2346) |
| 7 | LagothrixLagotricha | AY279114 | join(952..1043, 1174..1396, 2227..2355) |
| 8 | Bovine | X00376 | join(278..363, 492..714, 1613..1741) |
| 9 | Goat | M15387 | join(279..364, 493..715, 1621..1749) |
| 10 | Sheep | DQ352470 | join(238..323, 452..674, 1580..1708) |
| 11 | Mouflon | DQ352468 | join(238..323, 452..674, 1578..1706) |
| 12 | European hare | Y00347 | join(1485..1576, 1703..1925, 2492..2620) |
| 13 | Rabbit | V00882 | join(277..368, 495..717, 1291..1419) |
| 14 | Mouse | V00722 | join(275..367, 484..705, 1334..1462) |
| 15 | Rat | X06701 | join(310..401, 517..739, 1377..>1505) |
| 16 | Opossum | J03643 | join(467..558, 672..894, 2360..2488) |
| 17 | Gallus | V00409 | join(465..556, 649..871, 1682..1810) |
| 18 | Muscovy duck | X15739 | join(291..382, 495..717, 1742..1870) |
| NO. | Species | Code | AC (GenBank) | Region |
|---|---|---|---|---|
| 1 | C.pomona pomona f.pomona | PA | GU446662 | Yexianggu, Yunnan |
| 2 | C.pomona pomona f.hilaria | HI | GU446664 | Yexianggu, Yunnan |
| 3 | C.pomona pomona f.crocale | CR | GU446663 | Menglun, Yunnan |
| 4 | C.pomona pomona f.catilla | CA | GU446666 | Daluo, Yunnan |
| 5 | C.pomona pomona f.jugurtha | JU | GU446665 | Daluo, Yunnan |
| 6 | C.scylla scylla | CS | GU446667 | Yinggeling, Hainan |
| 7 | C.pyranthe pyranthe | CP | GU446668 | Daluo, Yunnan |
| 8 | C.pyranthe chryseis | CH | GU446669 | Yinggeling, Hainan |
| 9 | Appias lyncida | - | GU446670 | Bawangling, Hainan |
| No. | Strain | AC (GenBank) | Type | Region |
|---|---|---|---|---|
| 1 | CGRn53 | EF990907 | HTNV | Guizhou |
| 2 | CGRn5310 | EF990906 | HTNV | Guizhou |
| 3 | CGRn93MP8 | EF990905 | HTNV | Guizhou |
| 4 | CGRn8316 | EF990903 | HTNV | Guizhou |
| 5 | CGRn9415 | EF990902 | HTNV | Guizhou |
| 6 | CGRn93P8 | EF990904 | HTNV | Guizhou |
| 7 | CGHu3612 | EF990909 | HTNV | Guizhou |
| 8 | CGHu3614 | EF990908 | HTNV | Guizhou |
| 9 | Z10 | AF184987 | HTNV | Shengzhou |
| 10 | Z5 | EF103195 | HTNV | Shengzhou |
| 11 | NC167 | AB027523 | HTNV | Anhui |
| 12 | CGAa4MP9 | EF990915 | HTNV | Guizhou |
| 13 | CGAa4P15 | EF990914 | HTNV | Guizhou |
| 14 | CGAa1011 | EF990913 | HTNV | Guizhou |
| 15 | CGAa1015 | EF990912 | HTNV | Guizhou |
| 16 | H5 | AB127996 | HTNV | Heilongjiang |
| 17 | 76-118 | M14626 | HTNV | South Korea |
| 18 | Gou3 | AF184988 | SEOV | Jiande |
| 19 | ZJ5 | FJ753400 | SEOV | Jiande |
| 20 | 80-39 | AY273791 | SEOV | South Korea |
| 21 | SR11 | M34881 | SEOV | Japan |
| 22 | K24-e7 | AF288653 | SEOV | Xinchang |
| 23 | K24-v2 | AF288655 | SEOV | Xinchang |
| 24 | Z37 | AF187082 | SEOV | Wenzhou |
| 25 | ZT10 | AY766368 | SEOV | Tiantai |
| 26 | ZT71 | AY750171 | SEOV | Tiantai |
| 27 | K27 | L08804 | PUUV | Russia |
| 28 | P360 | L11347 | PUUV | Russia |
| 29 | Sotkamo | X61035 | PUUV | Finland |
| 30 | Fusong843-06 | EF488805 | PUUV | Jilin |
| 31 | Fusong199-05 | EF488803 | PUUV | Jilin |
| 32 | Fusong900-06 | EF488806 | PUUV | Jilin |
| 33 | 91045-AG | KF297911 | PV | Iran |
| 34 | I-58 | KF297914 | PV | Iran |
| No. | Genome | AC (GenBank) | Length |
|---|---|---|---|
| 1 | Acrossocheilus barbodon | NC_022184 | 16596 |
| 2 | Acrossocheilus beijiangensis | NC_028206 | 16600 |
| 3 | Acrossocheilus fasciatus | NC_023378 | 16589 |
| 4 | Acrossocheilus hemispinus | NC_022183 | 16590 |
| 5 | Acrossocheilus kreyenbergii | NC_024844 | 16849 |
| 6 | Acrossocheilus monticola | NC_022145 | 16599 |
| 7 | Acrossocheilus parallens | NC_026973 | 16592 |
| 8 | Acrossocheilus stenotaeniatus | NC_024934 | 16594 |
| 9 | Acrossocheilus wenchowensis | NC_020145 | 16591 |
| 10 | Alepocephalus agassizii | NC_013564 | 16657 |
| 11 | Alepocephalus australis | NC_013566 | 16640 |
| 12 | Alepocephalus bairdii | NC_013567 | 16637 |
| 13 | Alepocephalus bicolor | NC_011012 | 16829 |
| 14 | Alepocephalus productus | NC_013570 | 16636 |
| 15 | Alepocephalus tenebrosus | NC_004590 | 16644 |
| 16 | Alepocephalus umbriceps | NC_013572 | 16640 |
| 17 | Alosa alabamae | NC_028275 | 16708 |
| 18 | Alosa alosa | NC_009575 | 16698 |
| 19 | Alosa pseudoharengus | NC_009576 | 16646 |
| 20 | Alosa sapidissima | NC_014690 | 16697 |
| 21 | Amphiprion bicinctus | NC_016701 | 16645 |
| 22 | Amphiprion clarkia | NC_023967 | 16976 |
| 23 | Amphiprion frenatus | NC_024840 | 16774 |
| 24 | Amphiprion ocellaris | NC_009065 | 16649 |
| 25 | Amphiprion percula | NC_023966 | 16645 |
| 26 | Amphiprion perideraion | NC_024841 | 16579 |
| 27 | Amphiprion polymnus | NC_023826 | 16804 |
| 28 | Anguilla anguilla | NC_006531 | 16683 |
| 29 | Anguilla australis | NC_006532 | 16686 |
| 30 | Anguilla australis schmidti | NC_006533 | 16682 |
| 31 | Anguilla bengalensis labiata | NC_006543 | 16833 |
| 32 | Anguilla bicolor bicolor | NC_006534 | 16700 |
| 33 | Anguilla bicolor pacifica | NC_006535 | 16693 |
| 34 | Anguilla celebesensis | NC_006537 | 16700 |
| 35 | Anguilla dieffenbachia | NC_006538 | 16687 |
| 36 | Anguilla interioris | NC_006539 | 16713 |
| 37 | Anguilla japonica | NC_002707 | 16685 |
| 38 | Anguilla luzonensis (Philippine eel) | NC_011575 | 16635 |
| 39 | Anguilla luzonensis (freshwater eel) | NC_013435 | 16632 |
| 40 | Anguilla malgumora | NC_006536 | 16550 |
| 41 | Anguilla marmorata | NC_006540 | 16745 |
| 42 | Anguilla megastoma | NC_006541 | 16714 |
| 43 | Anguilla mossambica | NC_006542 | 16694 |
| 44 | Anguilla nebulosa nebulosa | NC_006544 | 16707 |
| 45 | Anguilla obscura | NC_006545 | 16704 |
| 46 | Anguilla reinhardtii | NC_006546 | 16690 |
| 47 | Anguilla rostrata | NC_006547 | 16678 |
| 48 | Apolemichthys armitagei | NC_027857 | 16551 |
| 49 | Apolemichthys griffisi | NC_027592 | 16528 |
| 50 | Apolemichthys kingi | NC_026520 | 16816 |
| 51 | Argopecten irradians irradians | NC_012977 | 16211 |
| 52 | Argopecten purpuratus | NC_027943 | 16270 |
| 53 | Babina adenopleura | NC_018771 | 18982 |
| 54 | Babina holsti | NC_022870 | 19113 |
| 55 | Babina okinavana | NC_022872 | 19959 |
| 56 | Babina subaspera | NC_022871 | 18525 |
| 57 | Bangana decora | NC_026221 | 16607 |
| 58 | Bangana tungting | NC_027069 | 16543 |
| 59 | Batrachuperus londongensis | NC_008077 | 16379 |
| 60 | Batrachuperus pinchonii | NC_008083 | 16390 |
| 61 | Batrachuperus tibetanus | NC_008085 | 16379 |
| 62 | Batrachuperus yenyuanensis | NC_012430 | 16394 |
| 63 | Brachymystax lenok | NC_018341 | 16832 |
| 64 | Brachymystax lenok tsinlingensis | NC_018342 | 16669 |
| 65 | Brachymystax tumensis | NC_024674 | 16836 |
| 66 | Hucho bleekeri | NC_015995 | 16997 |
| 67 | Hucho hucho | NC_025589 | 16751 |
| 68 | Hucho taimen | NC_016426 | 16833 |
| 69 | Trichiurus lepturus nanhaiensis | NC_018791 | 17060 |
| 70 | Trichiurus japonicus | NC_011719 | 16796 |
© 2016 by the authors; licensee MDPI, Basel, Switzerland. This article is an open access article distributed under the terms and conditions of the Creative Commons by Attribution (CC-BY) license (http://creativecommons.org/licenses/by/4.0/).
Share and Cite
Li, C.; Fei, W.; Zhao, Y.; Yu, X. Novel Graphical Representation and Numerical Characterization of DNA Sequences. Appl. Sci. 2016, 6, 63. https://doi.org/10.3390/app6030063
Li C, Fei W, Zhao Y, Yu X. Novel Graphical Representation and Numerical Characterization of DNA Sequences. Applied Sciences. 2016; 6(3):63. https://doi.org/10.3390/app6030063
Chicago/Turabian StyleLi, Chun, Wenchao Fei, Yan Zhao, and Xiaoqing Yu. 2016. "Novel Graphical Representation and Numerical Characterization of DNA Sequences" Applied Sciences 6, no. 3: 63. https://doi.org/10.3390/app6030063
APA StyleLi, C., Fei, W., Zhao, Y., & Yu, X. (2016). Novel Graphical Representation and Numerical Characterization of DNA Sequences. Applied Sciences, 6(3), 63. https://doi.org/10.3390/app6030063