1. Introduction
The solar power generation module is connected to a buck, boost or buck-boost converter, with a maximum power point tracker at the output end of solar panel to increase output efficiency. Common algorithms for maximum power point tracking (MPPT) include the variable-step incremental conductance proposed by Liu in 2008 [
1] and the perturb and observe (P&O) proposed by Femia in 2005 [
2]. Because the efficiency of solar power is seriously affected by the angle of solar irradiation, many scholars have proposed a solar tracking system to keep the solar radiation angle perpendicular to the solar panels. The MPPT can provide an increase in irradiation and enhance the efficiency of power generation [
3]. After this enhancement it is important to quickly and efficiently convert the electrical energy for storage with the battery [
4]. In a solar panel power generation system, the common charge-up methods used include constant current (CC), constant voltage (CV), constant current-constant voltage (CC-CV), pulse charge-up and Reflex charge-up [
4].
In terms of current studies of general battery charging, Horkos [
5] proposed different charging techniques of lead-acid batteries in 2015 for detection of the optimum charging frequency and used multiple charge modes and fixed frequency as a comparison. This increased charging efficiency to a great extent when compared to the old charge modes. In 2006, Marcos proposed a fast charge control [
6] method, and the final experimental data showed that the battery temperature rise was improved effectively, which had an indirect effect on charging efficiency. In 2012, Hsieh and Shih compared the charging efficiency in different MPPTs [
7]. The results showed that the pulse charge-up method performed more efficiently in both capacity and voltage charging. It improved the battery chemical reaction and prolonged battery life. In 2007, Wang used a 12-V/7-Ah lead-acid battery to test 3C charging [
8], and successfully used the Reflex charge-up method to control the temperature level. This showed that Reflex charging contributed to the chemical reaction rate and suppressed the temperature inside a lead-acid battery.
In 2005 [
9] Liu proposed the ant colony system (ACS) from amongst the many studies on solar battery charging related algorithms and used it to look for the most efficient charge-up method. The ACS system allowed the optimal solution to be found in a short time. The multichannel battery test advantage and the clonal genetic algorithm were also used. In 2012, Yau proposed the extremum search of Genetic algorithms (GA) in a PI controller [
10], and used the IAE convergence property to obtain the optimum extremum value. Finally, the characteristics of the PI controller were used to suppress high frequency noise and eliminate the system steady-state error to achieve stable CV charging.
In order to effectively explore the power generation efficiency of a solar tracking system, it must be self-sufficient, so the solar tracking system proposed by Yau [
3] was used in this study. However, they only discussed a new design concept of solar tracking scheme in that study [
3]. They did not consider the charging control of battery. In order to improve their work, a lead-acid battery was used for energy storage in this study because these have been widely applied and the technology is mature [
4]. Lead-acid batteries are characterized by low price, are mass-produced and have an extensive range of application. The CV-Reflex charge strategy mode was used because the initial charging rate is high. However, the battery temperature rises with charging time, and this causes an exponential decrease in the charging current, which prolongs charging time. To counter this effect, the Reflex charge-up method was used after a period, because it suppresses temperature rise and has a higher charge rate than CV at the later stage. There should be an optimum frequency suitable for this system in the Reflex charging process, and the solar charge model built for this study in the MATLAB/Simulink environment was used to compare the various charge modes. The Reflex charging frequency search method was optimized by CPSO [
4]. Particle swarm optimization (PSO) was optimized by logistic mapping, and the parameters were optimized using the Taguchi method. Finally, the optimum frequency was found based on the system energy consumption criteria of the integral square error (ISE). However, it was only a simulation result and did not discuss the concept of self-sufficient power supply in that study [
4]. Therefore, it will be implemented by FPGA chip in this study, and the self-sufficient power supply system will be discussed in this study to verify whether this scheme can act as a self-sufficient power supply.
2. Solar Energy Charging System Design
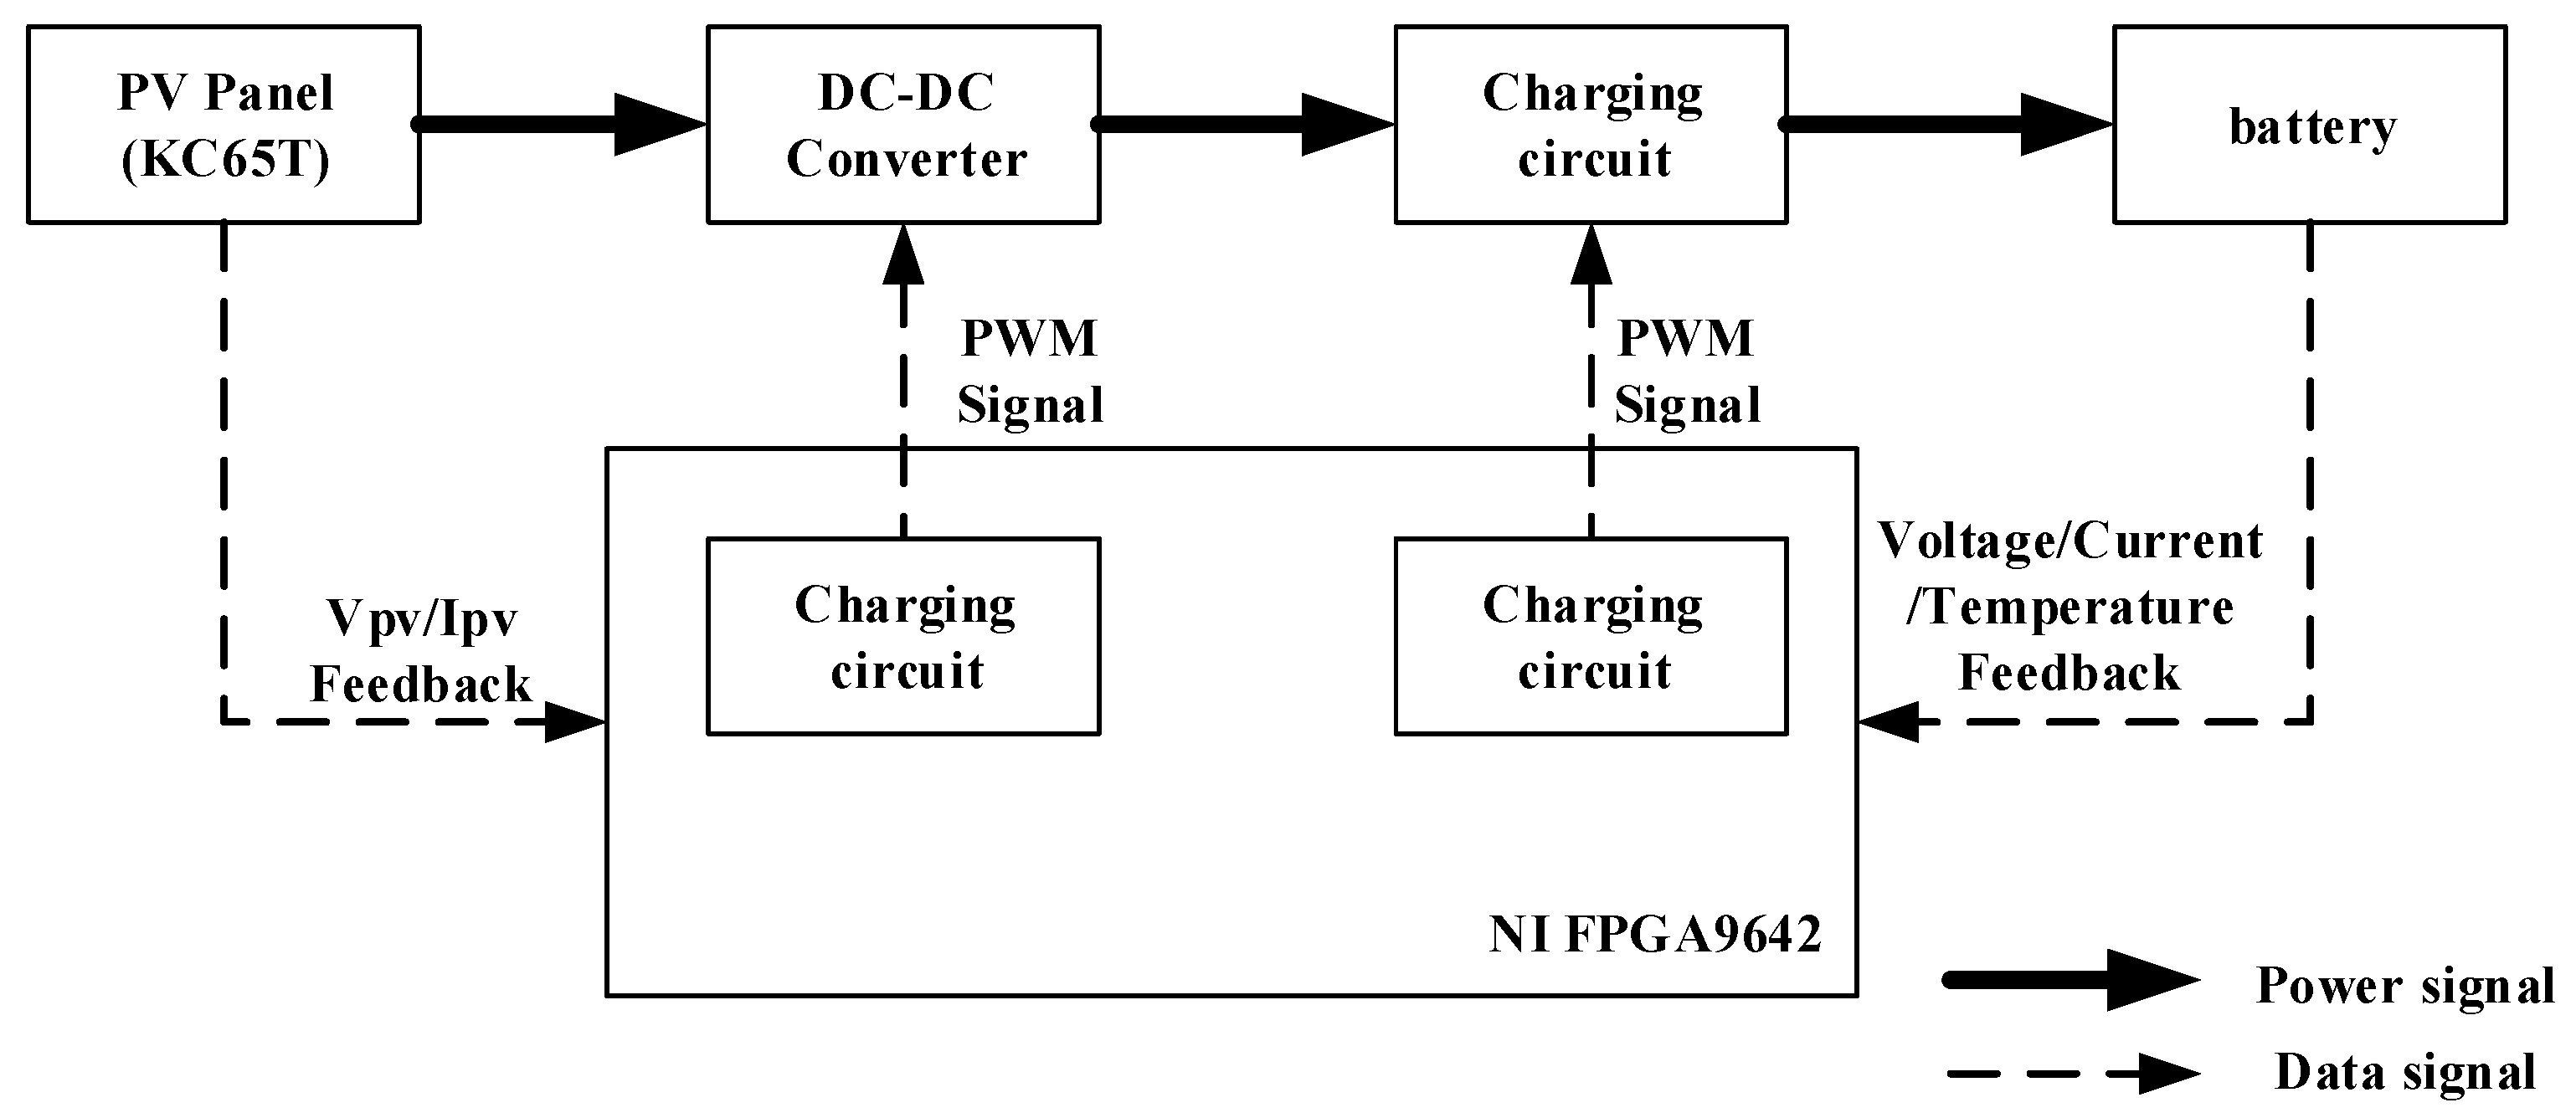
The aim of the solar energy charging system was the storage of energy in the reserve battery, as shown in
Figure 1. In this study, a NI Single-Board RIO device (FPGA 9642) (Xilinx, San Jose, CA, USA) was used as a controller to implement the control scheme. The NI sbRIO-9642 device features an industrial Freescale MPC5200 real-time processor with speeds up to 400 MHz for deterministic real-time applications. The real-time processor (IBM, New York, NY, USA) is combined via a high-speed internal PCI bus with an onboard reconfigurable Xilinx Spartan-3 field-programmable gate array (FPGA) [
3]. The voltage/current exported by the solar panel flows through the feedback circuit, the FPGA extracts data, and these data are fed back to the notebook PC for MPPT and calculation of the charge control on-off cycle. The calculated on-off cycle is fed back to the FPGA so that the FPGA exports the calculated PWM (pulse width modulation) (Xilinx, San Jose, CA, USA) through the gate drive circuit for signal output. When the PWM signal is sent to the charging circuit, the lead-acid battery feeds back the real-time charging voltage/current/temperature data synchronously. Finally, the data extracted by FPGA are fed back to the notebook PC for real-time data display.
Figure 1.
Schematic diagram of the solar power system circuit.
Figure 1.
Schematic diagram of the solar power system circuit.
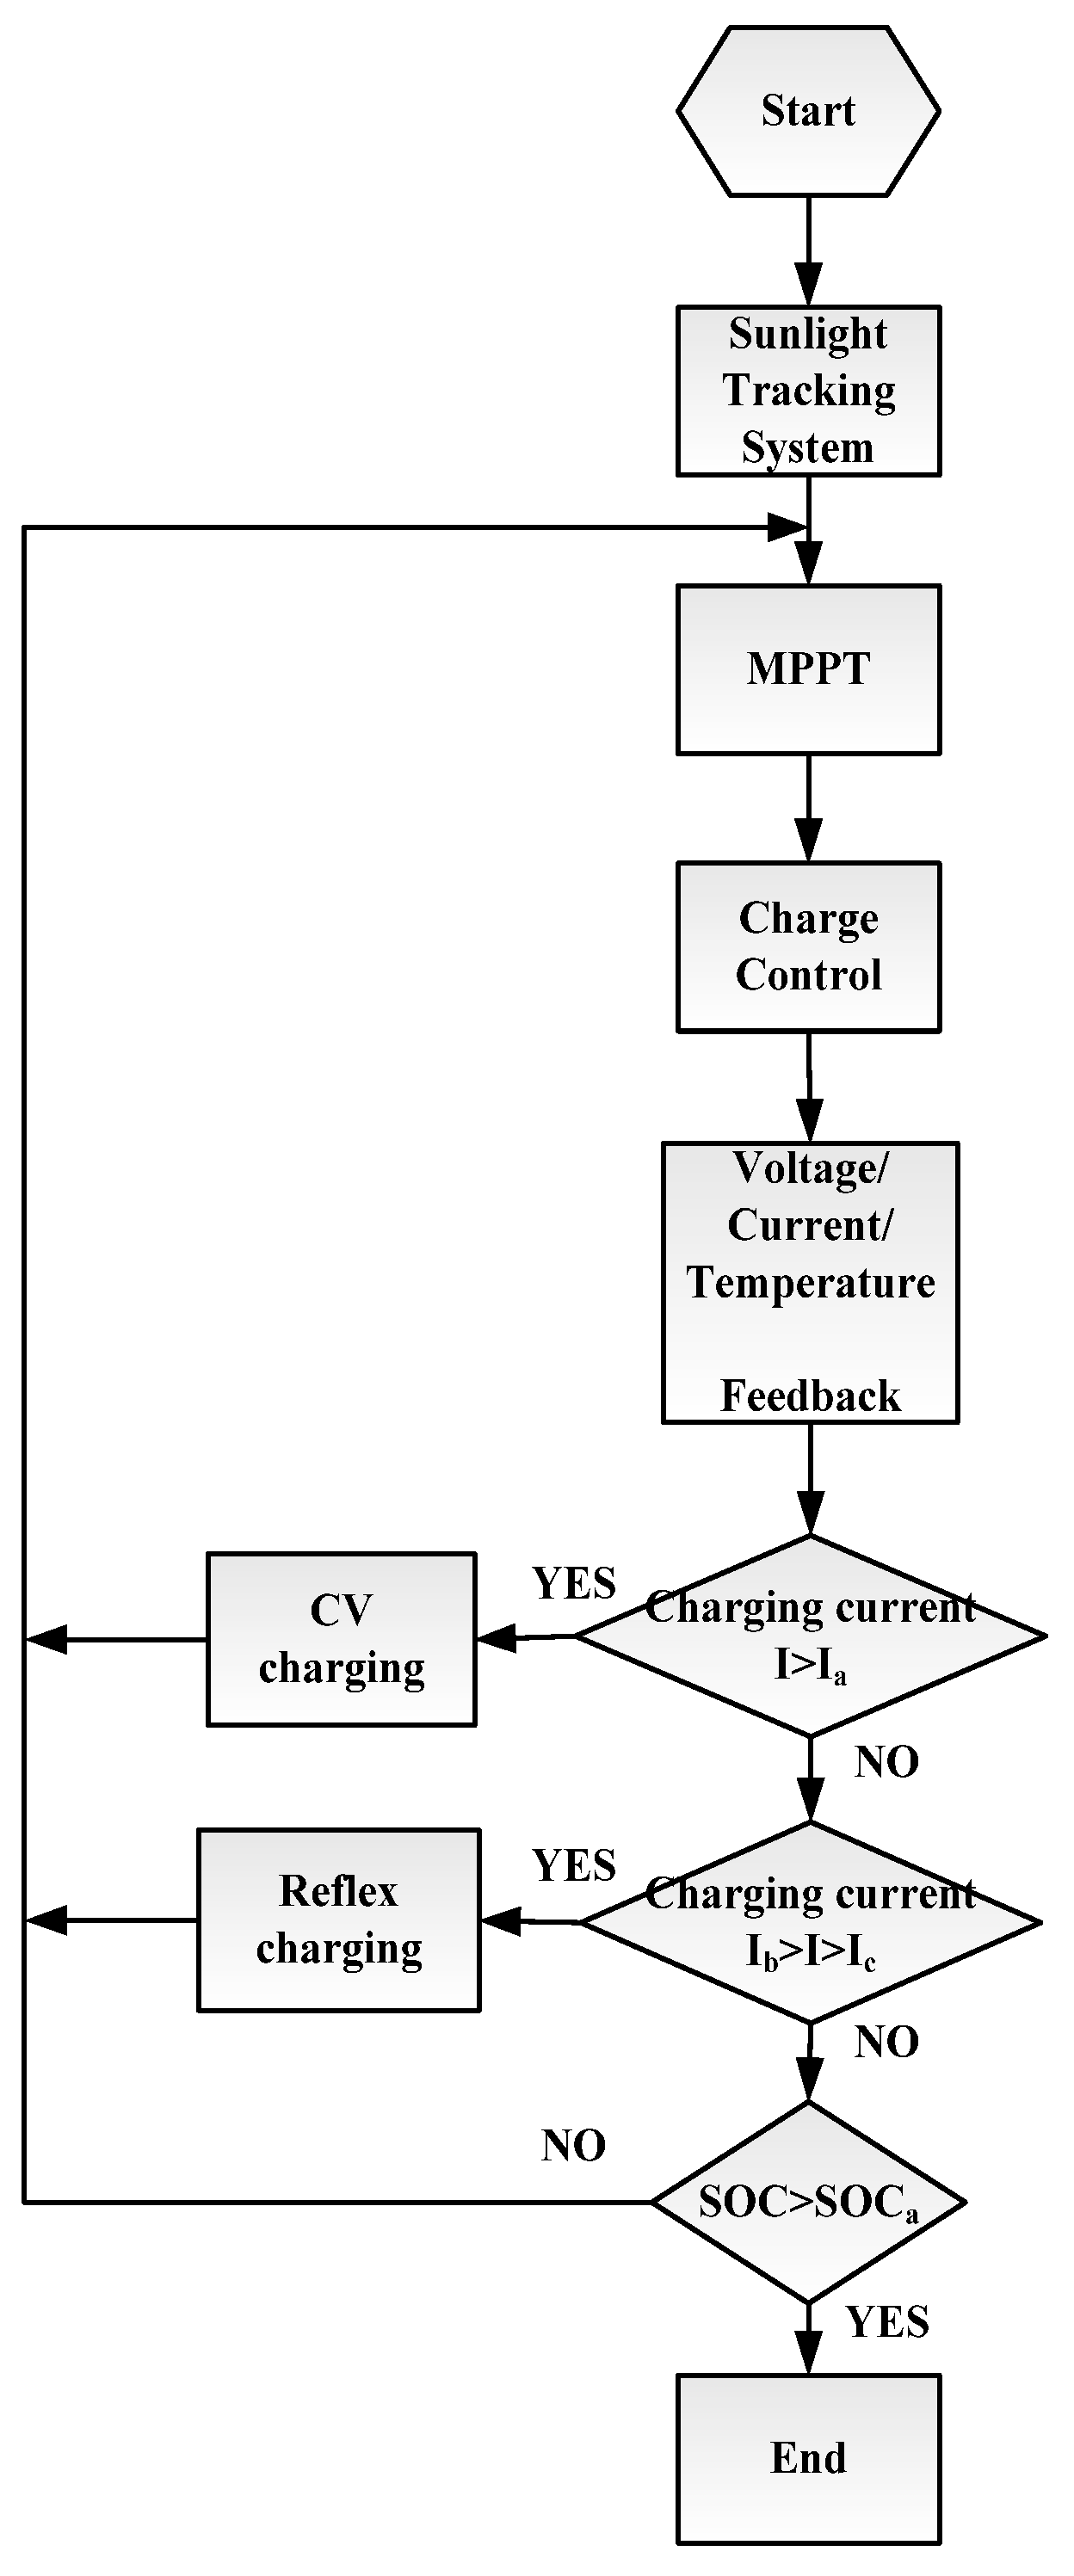
The solar charge control system process is shown in
Figure 2. The automatic solar tracking system (NCUT, Taichung, Taiwan) used is that proposed by Yau
et al. [
3]. The solar tracking system positioning is implemented from the start. The MPPT is started before the charge control system, when the sun’s rays are normal to the panel. The feedback circuit provides real-time battery voltage/current data during charge to judge the present battery charging condition.
Ia is defined as the charge current for CV charging, and
Ib, and
Ic represent the charge current and discharge current for Reflex charging. When the battery side current
I >
Ia, CV charging is used; if the battery side current
Ib >
I >
Ic, Reflex charging is used. Finally, judgment of whether the battery is full is made according to SOC > SOC
a., where SOC is the state of charge.
Figure 2.
Solar charge control system flow chart.
Figure 2.
Solar charge control system flow chart.
3. Optimization Algorithm
When a battery is being charged, it is important to allow a buffer time for the electrolyte chemical reaction to limit the temperature rise. However, there is no optimum frequency for low switching loss and high charging efficiency in Reflex charging, the switch and battery have different losses at different frequencies. Therefore, to obtain the optimum charging frequency, we used the PSO algorithm [
11,
12] and CPSO [
13] to search for the optimum Reflex charging frequency. The optimum frequency was calculated using the PSO, improved by the Taguchi method, and a logistic map [
3]. The ISE [
4] was used to judge the optimum frequency, expressed as Equation (1). ISE represents the aggregate consumption of energy within the designated time for the evaluation of system design performance, and we used
e(
t) as the optimum switching loss and switching consumption error at various frequencies. That is the difference of the power of pre-charging circuit, and the output power of stage output in the battery charge is called the error value
e(
t) and t is the time.
In the Reflex charge-up method, a reasonable on-and-off pulse width is determined, and the improved PSO is then used to search for the optimum frequency and to select an ISE function with minimum consumption.
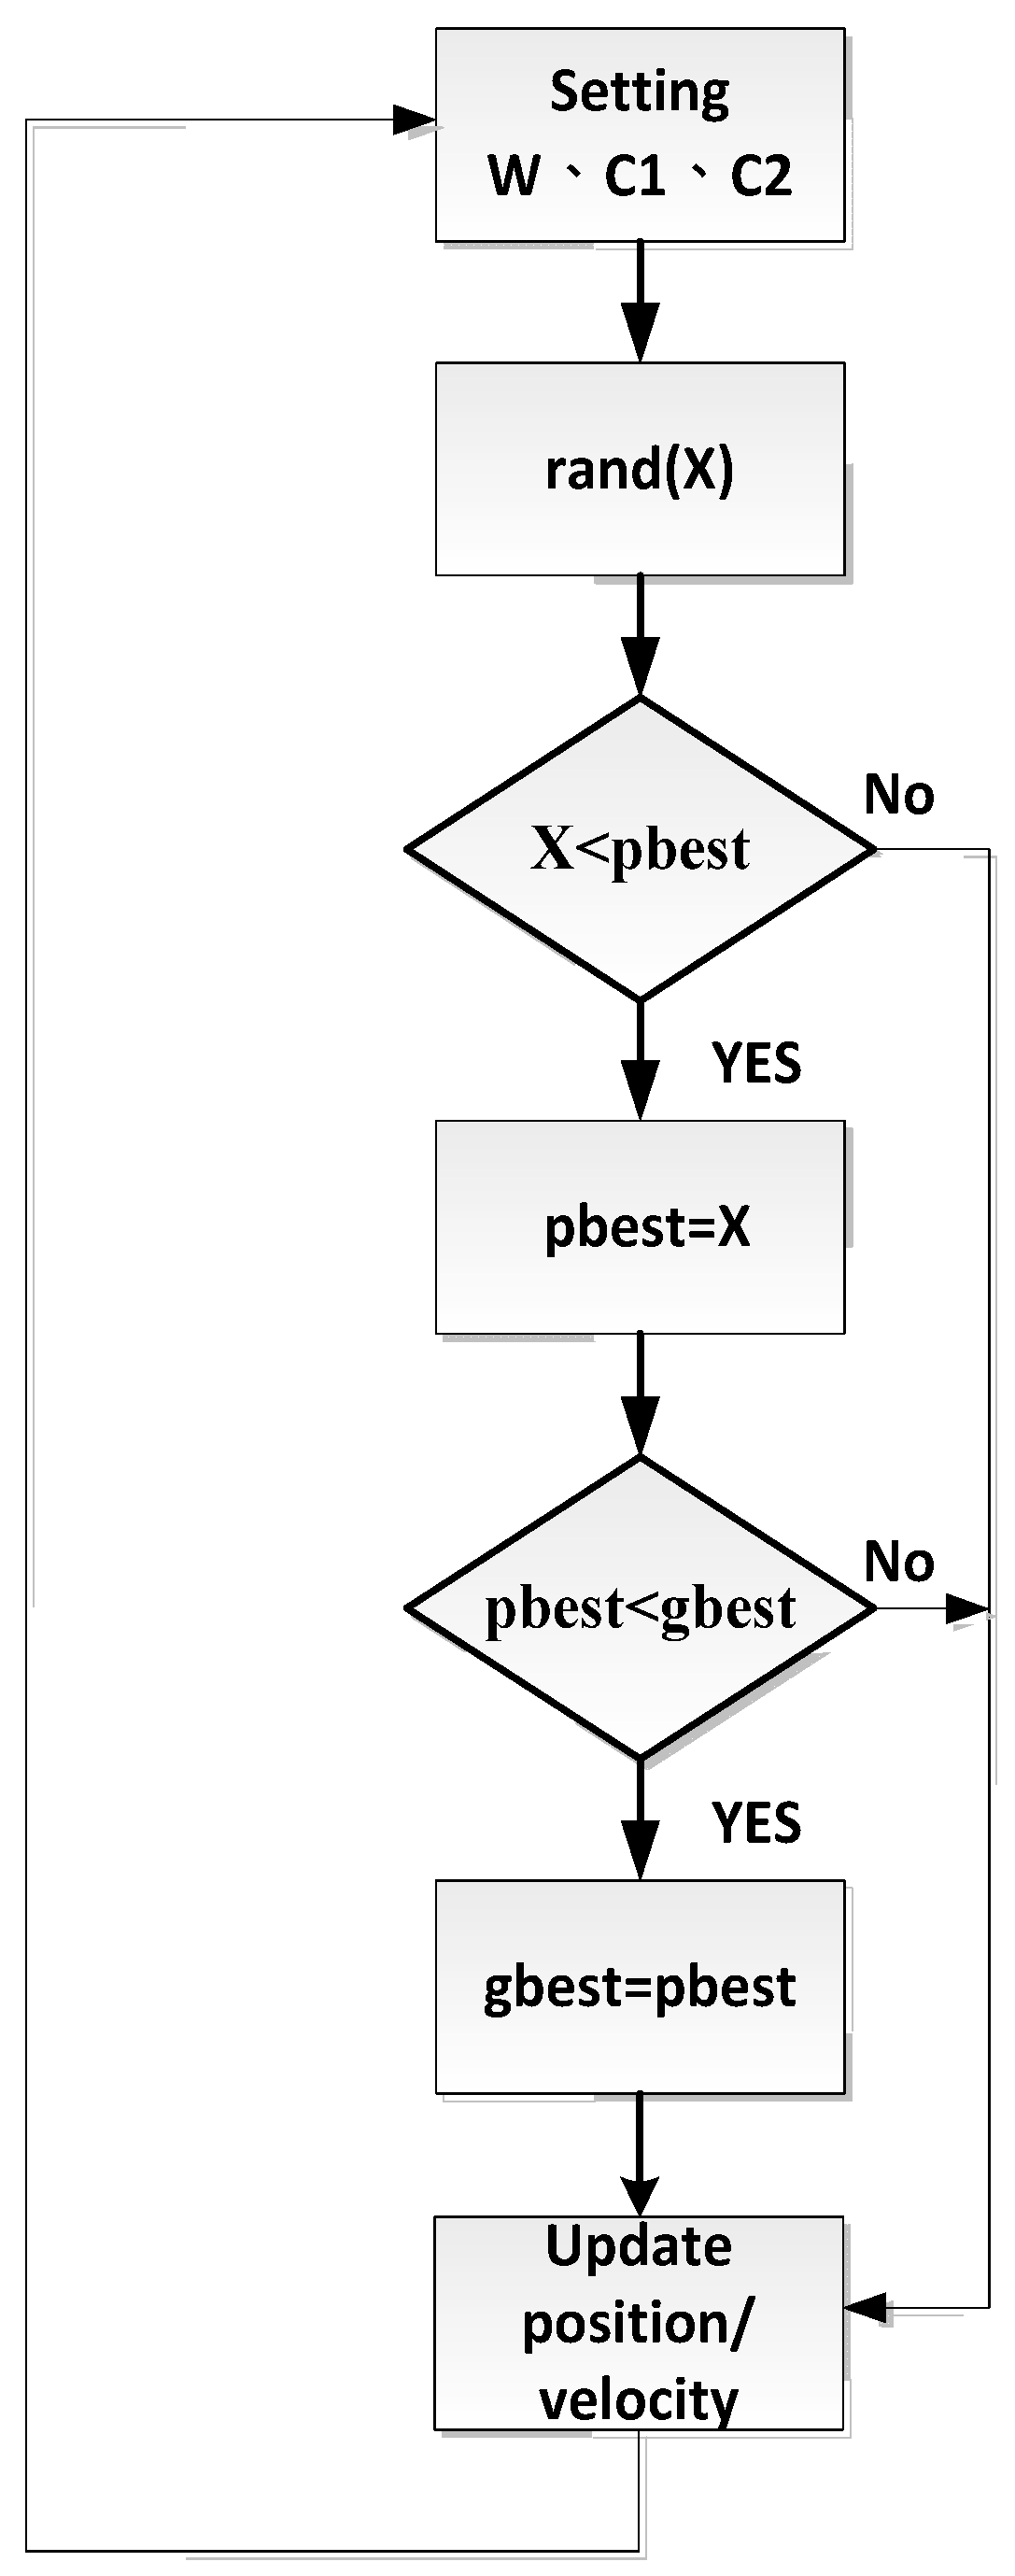
In velocity-updating Equation (2), the PSO is used to find a current optimal solution of each particle iteratively, set as pbest here. When the iteration of all particles is finished, an optimal solution can be found, set as gbest. The position updating is expressed in Equation (3), the initial position of each particle.
Figure 3 is the PSO flow chart.
Velocity updating equation:
Position updating equation:
Vn: Particle update rate.
n: Particle code.
W: Inertia Weight.
C1, C2: Learning constants.
rand: Random number between 0 and 1.
pbest: Optimal solution of current particle up to now.
gbest: The optimal solution of all particles up to now
Xn: Current position of particle.
Many high-tech products have a high replacement rate and manufacturers strive to improve product quality and to reduce production cost. The Taguchi method, proposed by Dr. Genichi Taguchi (1950), uses a standard simple orthogonal array for the evaluation of experimental design. The number of experiments that need to be conducted is reduced by this simplicity, and design parameters can be optimized with few experiments [
14].
The Taguchi method is used for quality definition, defining the signal-to-noise (S/N) ratio, and in the quality evaluation of products. In this study we used a Taguchi orthogonal array [
4] to determine the learning factor of PSO. The system objective function is
ISE, so the S/N ratio was calculated according to the data of the
ISE. The Taguchi method was used, and the design parameters were substituted in the
ISE obtained by PSO, as shown in reference 4. Finally, the optimum parameters were worked out from reference 4 as
C1 is 1,
C2 is 1, and
W is 0.75.
Figure 3.
PSO flow chart.
Figure 3.
PSO flow chart.
4. Simulation and Experiment Results
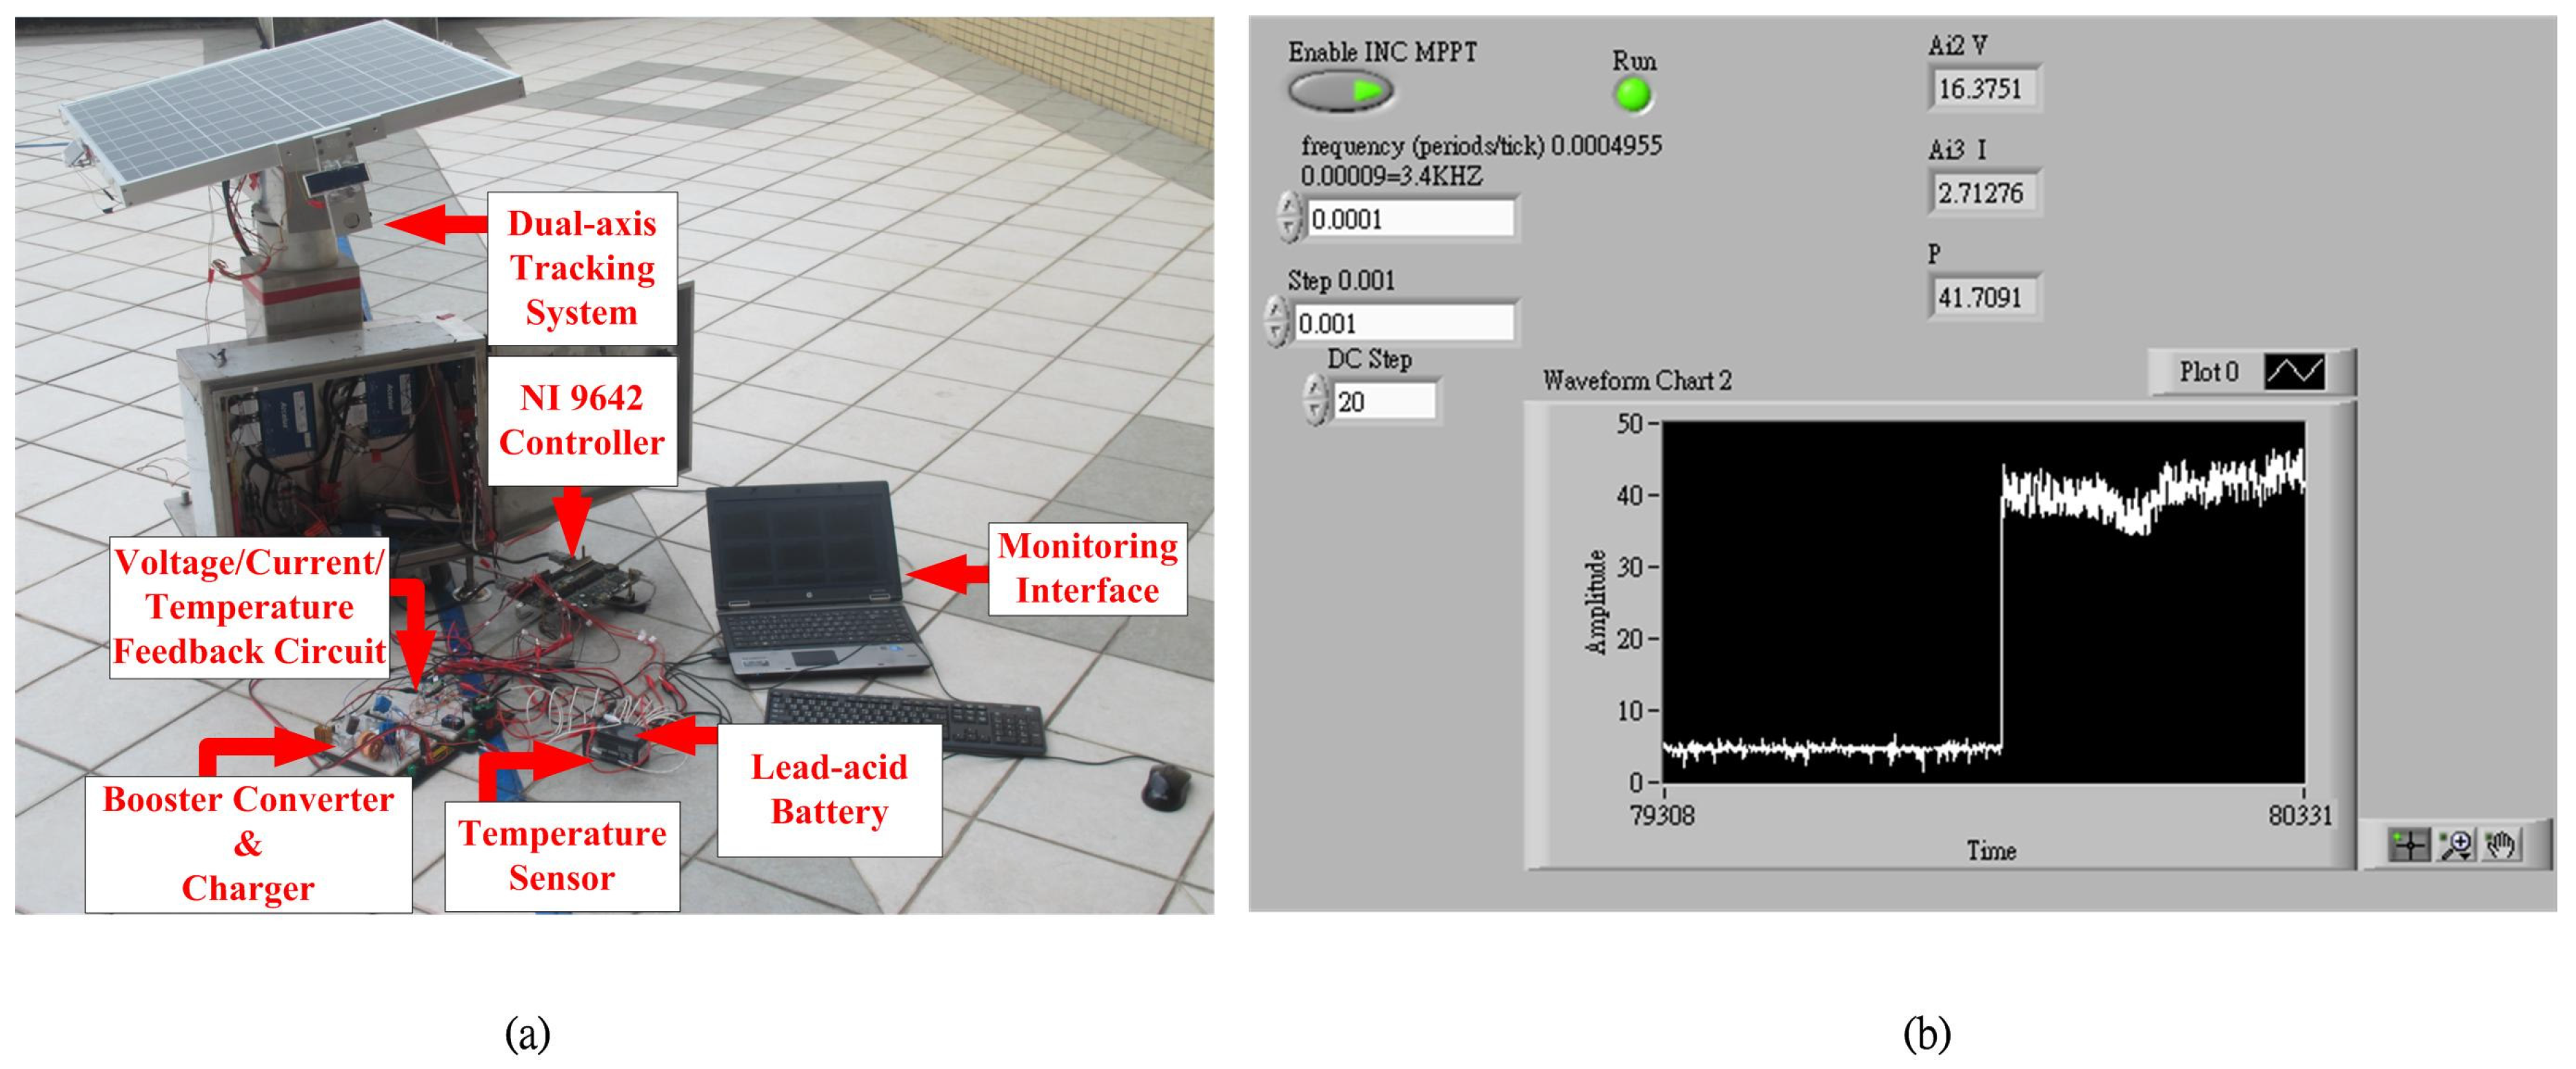
The MPPT was tested in practice.
Figure 4 shows the field hardware architecture and the MPPT control interface [
3].
Figure 4.
Solar tracking power supply system. (a) Onsite hardware architecture; (b) MPPT control interface.
Figure 4.
Solar tracking power supply system. (a) Onsite hardware architecture; (b) MPPT control interface.
Figure 5,
Figure 6 and
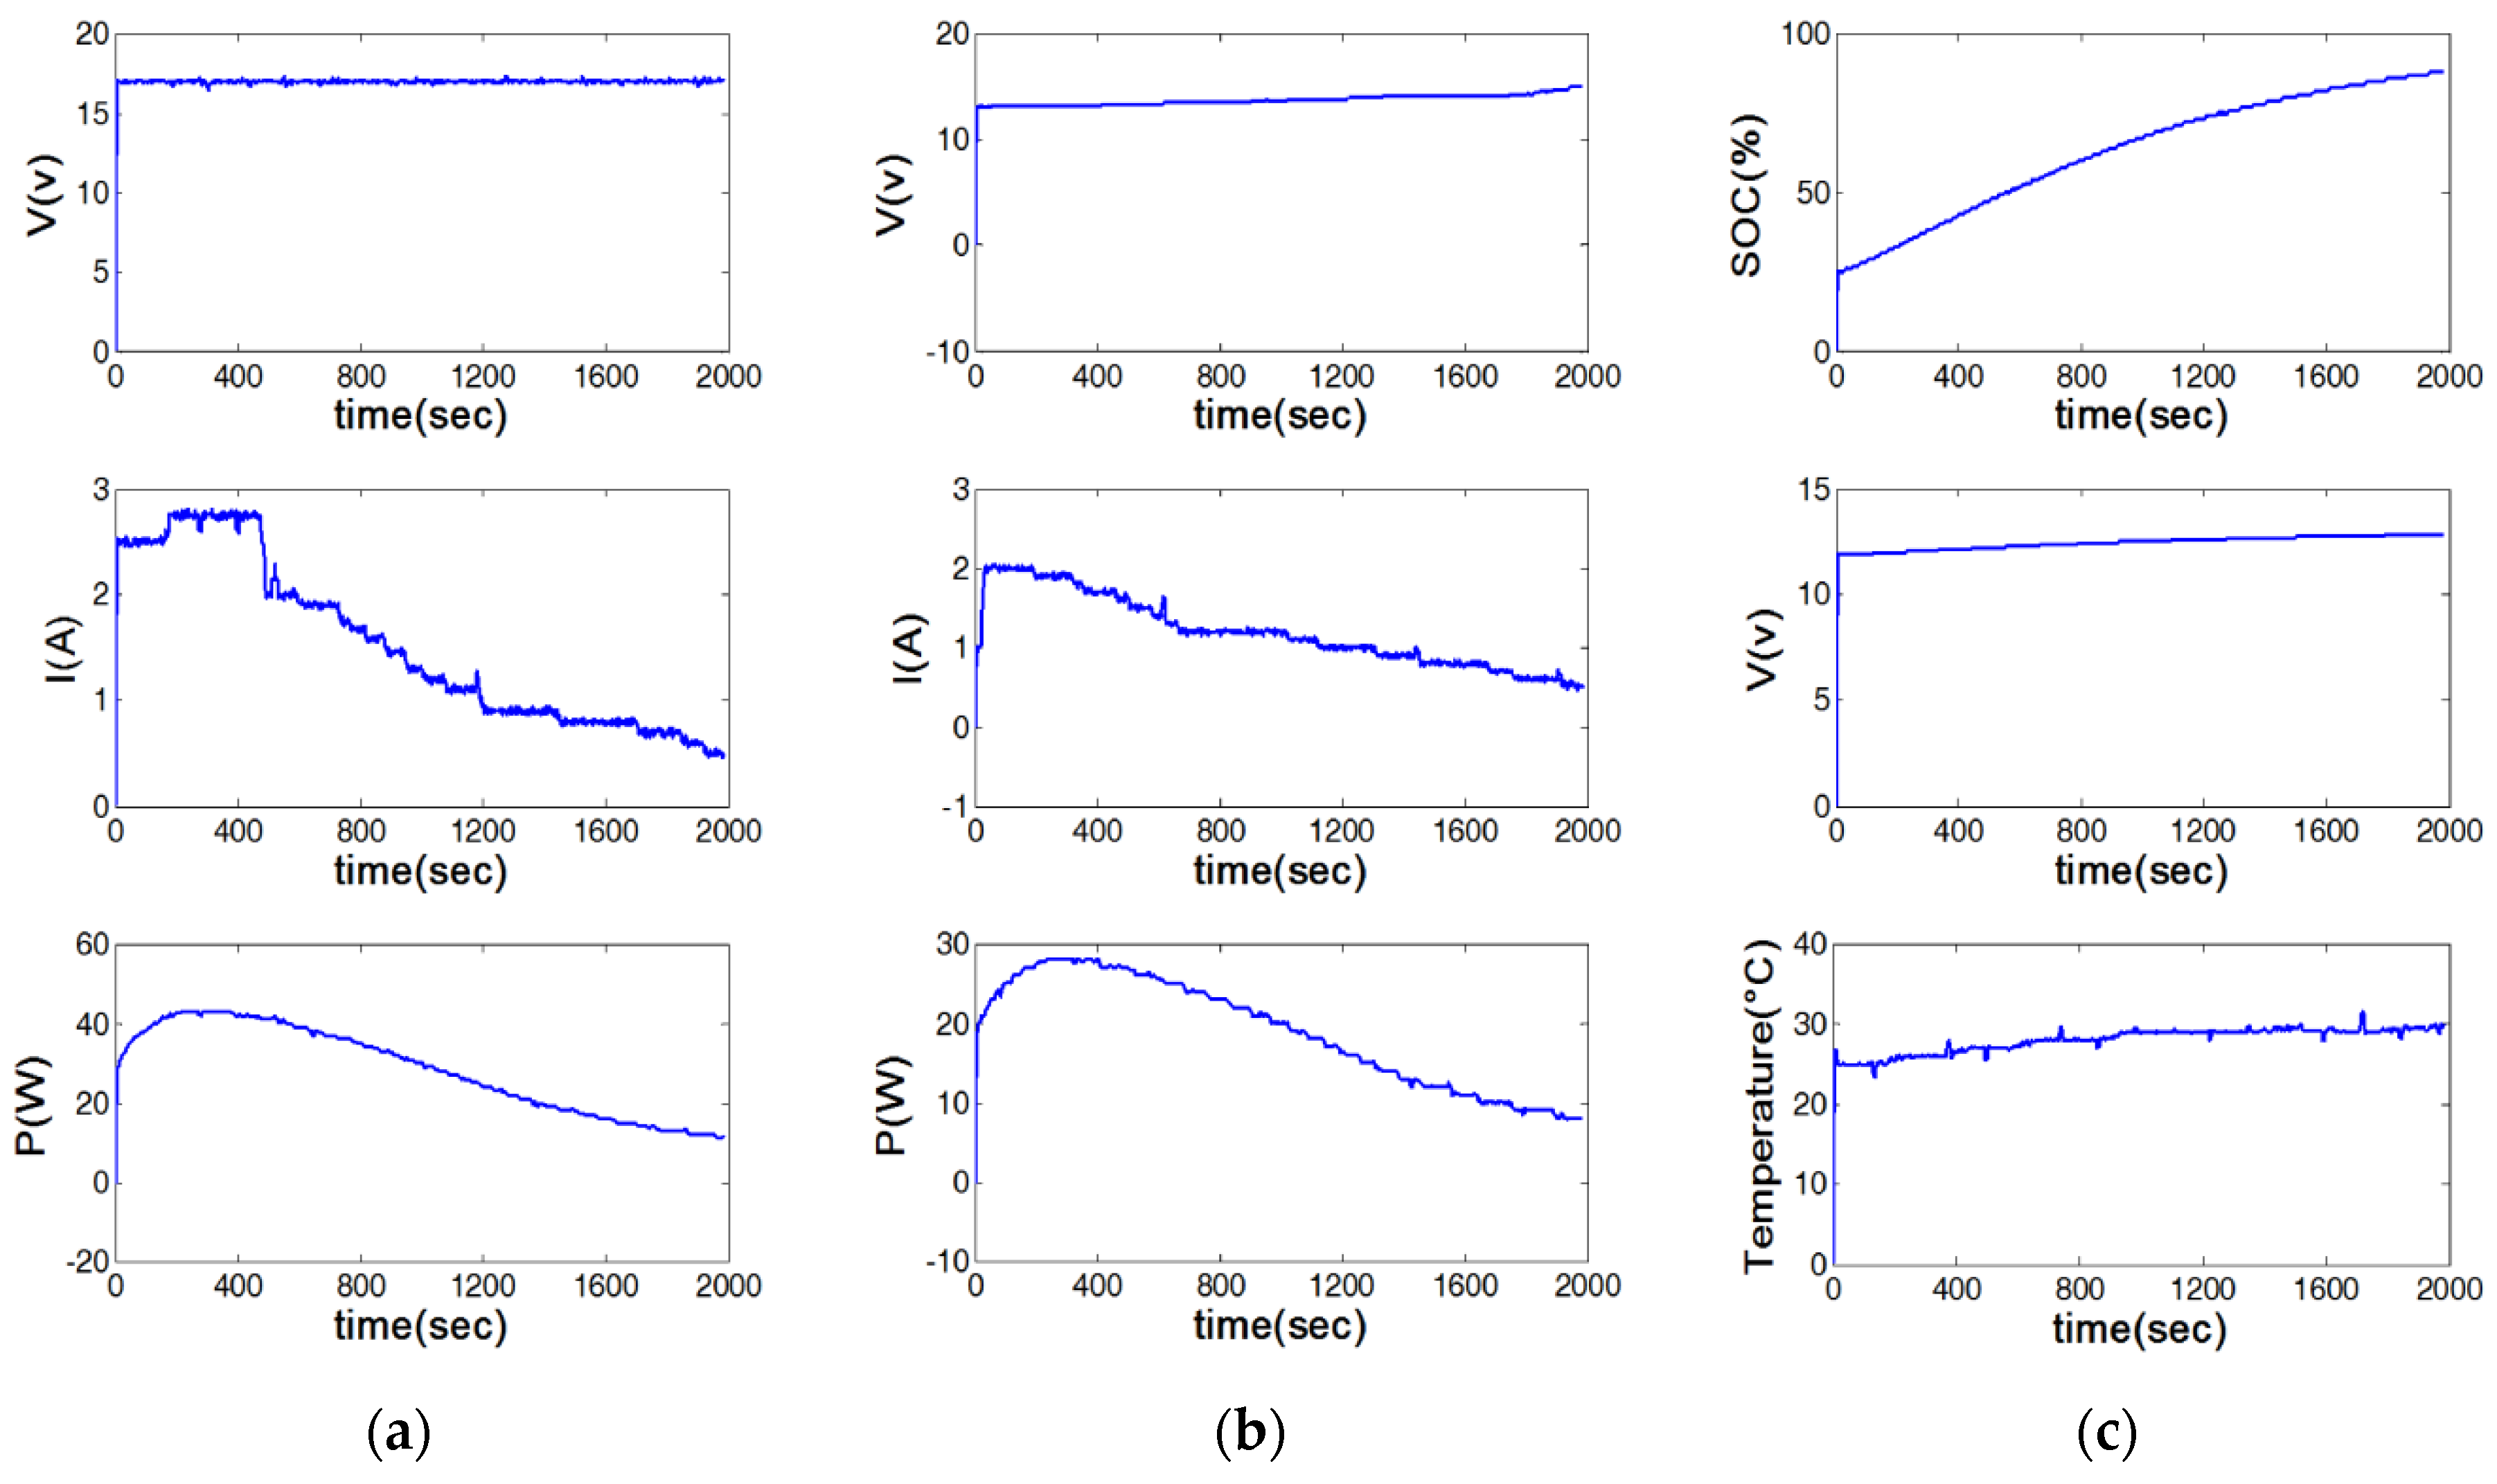
Figure 7 show the experiment results of CV, CV-positive pulse and CV Reflex charging. We used FPGA hardware for data acquisition, and LABVIEW for data feedback, calculation and display. The data shown in the various figures were recorded once every 2 s, and 30 min of charging was drawn into a single curve instantly. The experiment results focused on the temperature in different charging modes. It can be seen in
Figure 8 (the temperature curve comparison diagram) that the CV increases by 4 °C–5 °C and continuously in the case of low current. In terms of the CV-positive pulse, the temperature is slightly better after the charge mode has been switched, but it is still worse than it is in the CV-Reflex mode used in this study. The temperature remains steady when the reflex is switched to 800 s.
Figure 5.
CV charging. (a) Power end voltage, current and power curves; (b) battery end charging voltage, current and power curves; (c) SOC (%), actual voltage and temperature (°C) curves inside battery.
Figure 5.
CV charging. (a) Power end voltage, current and power curves; (b) battery end charging voltage, current and power curves; (c) SOC (%), actual voltage and temperature (°C) curves inside battery.
Figure 6.
CV-positive pulse charging. (a) Power end voltage, current and power curves; (b) battery end charging voltage, current and power curves; (c) SOC (%), actual voltage and temperature (°C) curves inside battery.
Figure 6.
CV-positive pulse charging. (a) Power end voltage, current and power curves; (b) battery end charging voltage, current and power curves; (c) SOC (%), actual voltage and temperature (°C) curves inside battery.
Figure 7.
CV-Reflex charging. (a) Power end voltage, current and power curves; (b) battery end charging voltage, current and power curves; (c) SOC (%), actual voltage and temperature (°C) curves inside battery.
Figure 7.
CV-Reflex charging. (a) Power end voltage, current and power curves; (b) battery end charging voltage, current and power curves; (c) SOC (%), actual voltage and temperature (°C) curves inside battery.
Figure 8.
Temperature rise curve comparison diagram.
Figure 8.
Temperature rise curve comparison diagram.
5. Self-Sufficient Power Supply Evaluation
When the solar energy charging system was completed, the availability of the equipment used for the solar tracking system was investigated.
Figure 9 shows the external power supply used in this study. First, for the lead-acid battery (charging and equipment power supply are individual batteries), a DC-DC converter was used to increase the voltage from 12 V to 24 V for the solar tracking equipment. The equipment included an NI 9642 controller, an NI 9516 motion card, an ADP-055-18 motor driver and motor.
Figure 9.
Schematic diagram of battery operation.
Figure 9.
Schematic diagram of battery operation.
Equations (4) to (8) show the current and operating voltage of equipment measured by the probe, calculated to obtain the power consumption for each piece of equipment. Equation (4) shows the total power exported from the battery to the converter and equipment:
Equation (5) shows the total power for the load end:
Equation (6) is the power for NI 9642:
Equation (7) is the total power for motion control card, motor driver and dual-axis motor:
Equation (8) is the power for the DC-DC converter:
The lead-acid batteries required for the solar power system and the solar tracking system are different, and experimental evaluation of the charging power consumption for the system shows that the power needed for charging the total system is 25 W. The total power consumption of the battery supply system is 17.52 W, which means that the solar charge is sufficient for all the equipment and a small amount of charging can be implemented by the self-sufficient power supply.

