1. Introduction
Phosphorus (P) exists in soils in both inorganic and organic forms [
1,
2]. Many agricultural areas have relatively high soil total P concentrations compared to background environmental levels [
3]. However, these high concentrations are often sub-optimal for agricultural practices, as most of the soil P is not readily available to plants because it is bound in insoluble inorganic and organic forms, such as calcium, iron and aluminum phosphate, inositol hexakisphosphate, and phytate. The deficit of available P is often treated through the addition of inorganic P fertilisers. A proportion of this is also converted into insoluble forms [
4,
5], which accumulate, raising overall soil P concentrations.
The organic P content of soil depends on a number of factors, including soil drainage, soil pH, the inorganic content of parent material and cultivation [
6]. As a consequence, the organic P fraction of soils varies significantly, generally representing between 20% and 80% of total soil P [
6,
7,
8]. Pasture soils tend to contain a higher proportion of organic P than cultivated soils [
9]. Some of the “available” organic P forms play important role in biological cycling of P in soils, however the dynamics of organic P are not completely understood and require further investigation [
10,
11].
Organic P determinations in soil can be difficult due to extraction, separation and detection problems [
12]. First identified in 1940 [
13,
14], phytate (C
6H
6Ca
6O
24P
6 as a calcium salt) has been considered the abundant organic P form [
6,
11,
15], representing up to 50% of all soil organic P [
6,
16,
17]. However, an investigation by Smernik and Dougherty [
18] involving phytate spiking, has indicated that this organic P may have been previously overestimated due to misassignment of resonances in
31P NMR spectra. Their study showed that phytate contributed <5% and <3% of organic P and total P, respectively, in the four Australian grazing soils analysed.
Many methods have been used to extract organic P, including base extraction, chromatographic isolation and acid or base hydrolysis [
18,
19,
20,
21,
22]. More recently, phosphorus-31 (
31P) nuclear magnetic resonance (NMR) spectroscopy has been adopted as it removes many limiting factors of these chromatographic methods [
12]. Phosphorus is particularly amenable to NMR analysis because NMR-active
31P is the only P isotope found naturally. The main advantage of NMR is that it has the potential to be able to detect and quantify all P species simultaneously [
23].
First used for soil characterisation in 1980 [
24],
31P NMR spectroscopy has been used for both qualitative and quantitative estimates of both organic and inorganic soil P compounds [
2,
25]. The use of
31P NMR spectroscopy enables quantification of many phosphate compounds, including inorganic orthophosphate (PO
43−), polyphosphate (P
nO
3n+1(n+2)−)and pyrophosphate (P
2O
74−), organic orthophosphate monoesters (RPO
42−) and diesters (R
2PO
4−), as well as some specific organic P compounds [
8,
11,
25,
26]. Of the organic compounds, monoesters are usually the principal form found in soil [
6]. Monoester phosphates combine with metal ions, like Fe, to produce moderately labile insoluble complexes [
16,
27,
28]. However, it has recently been reported that monoesters such as Inositolhexaphosphate isomers are often dominating and they do not produce moderately labile insoluble complexes, but are strongly bound to the soil solid phase [
29]. Organic diesters are found in relatively small concentrations compared to monoesters. Diester phosphates are considered more labile than monoester phosphate and are generally more accessible to attack by soil microbes, which in combination contributes to lower concentrations in soil [
27,
28].
A study comparing soil extraction procedures for
31P NMR spectroscopy reported that the highest total P recovery and the greatest diversity of P forms were achieved using a combined NaOH and EDTA solution [
25]. A method for the extraction and subsequent quantification of organic P using
31P NMR spectroscopy coupled with a NaOH-EDTA extraction was also reported [
15]. The addition of EDTA enables better characterisation of organic P than possible in NaOH extractions [
25]. Due to the relative ease of the method,
31P NMR analysis of NaOH-EDTA extracts has been widely accepted as the preferred technique for organic P measurement [
8,
11,
18].
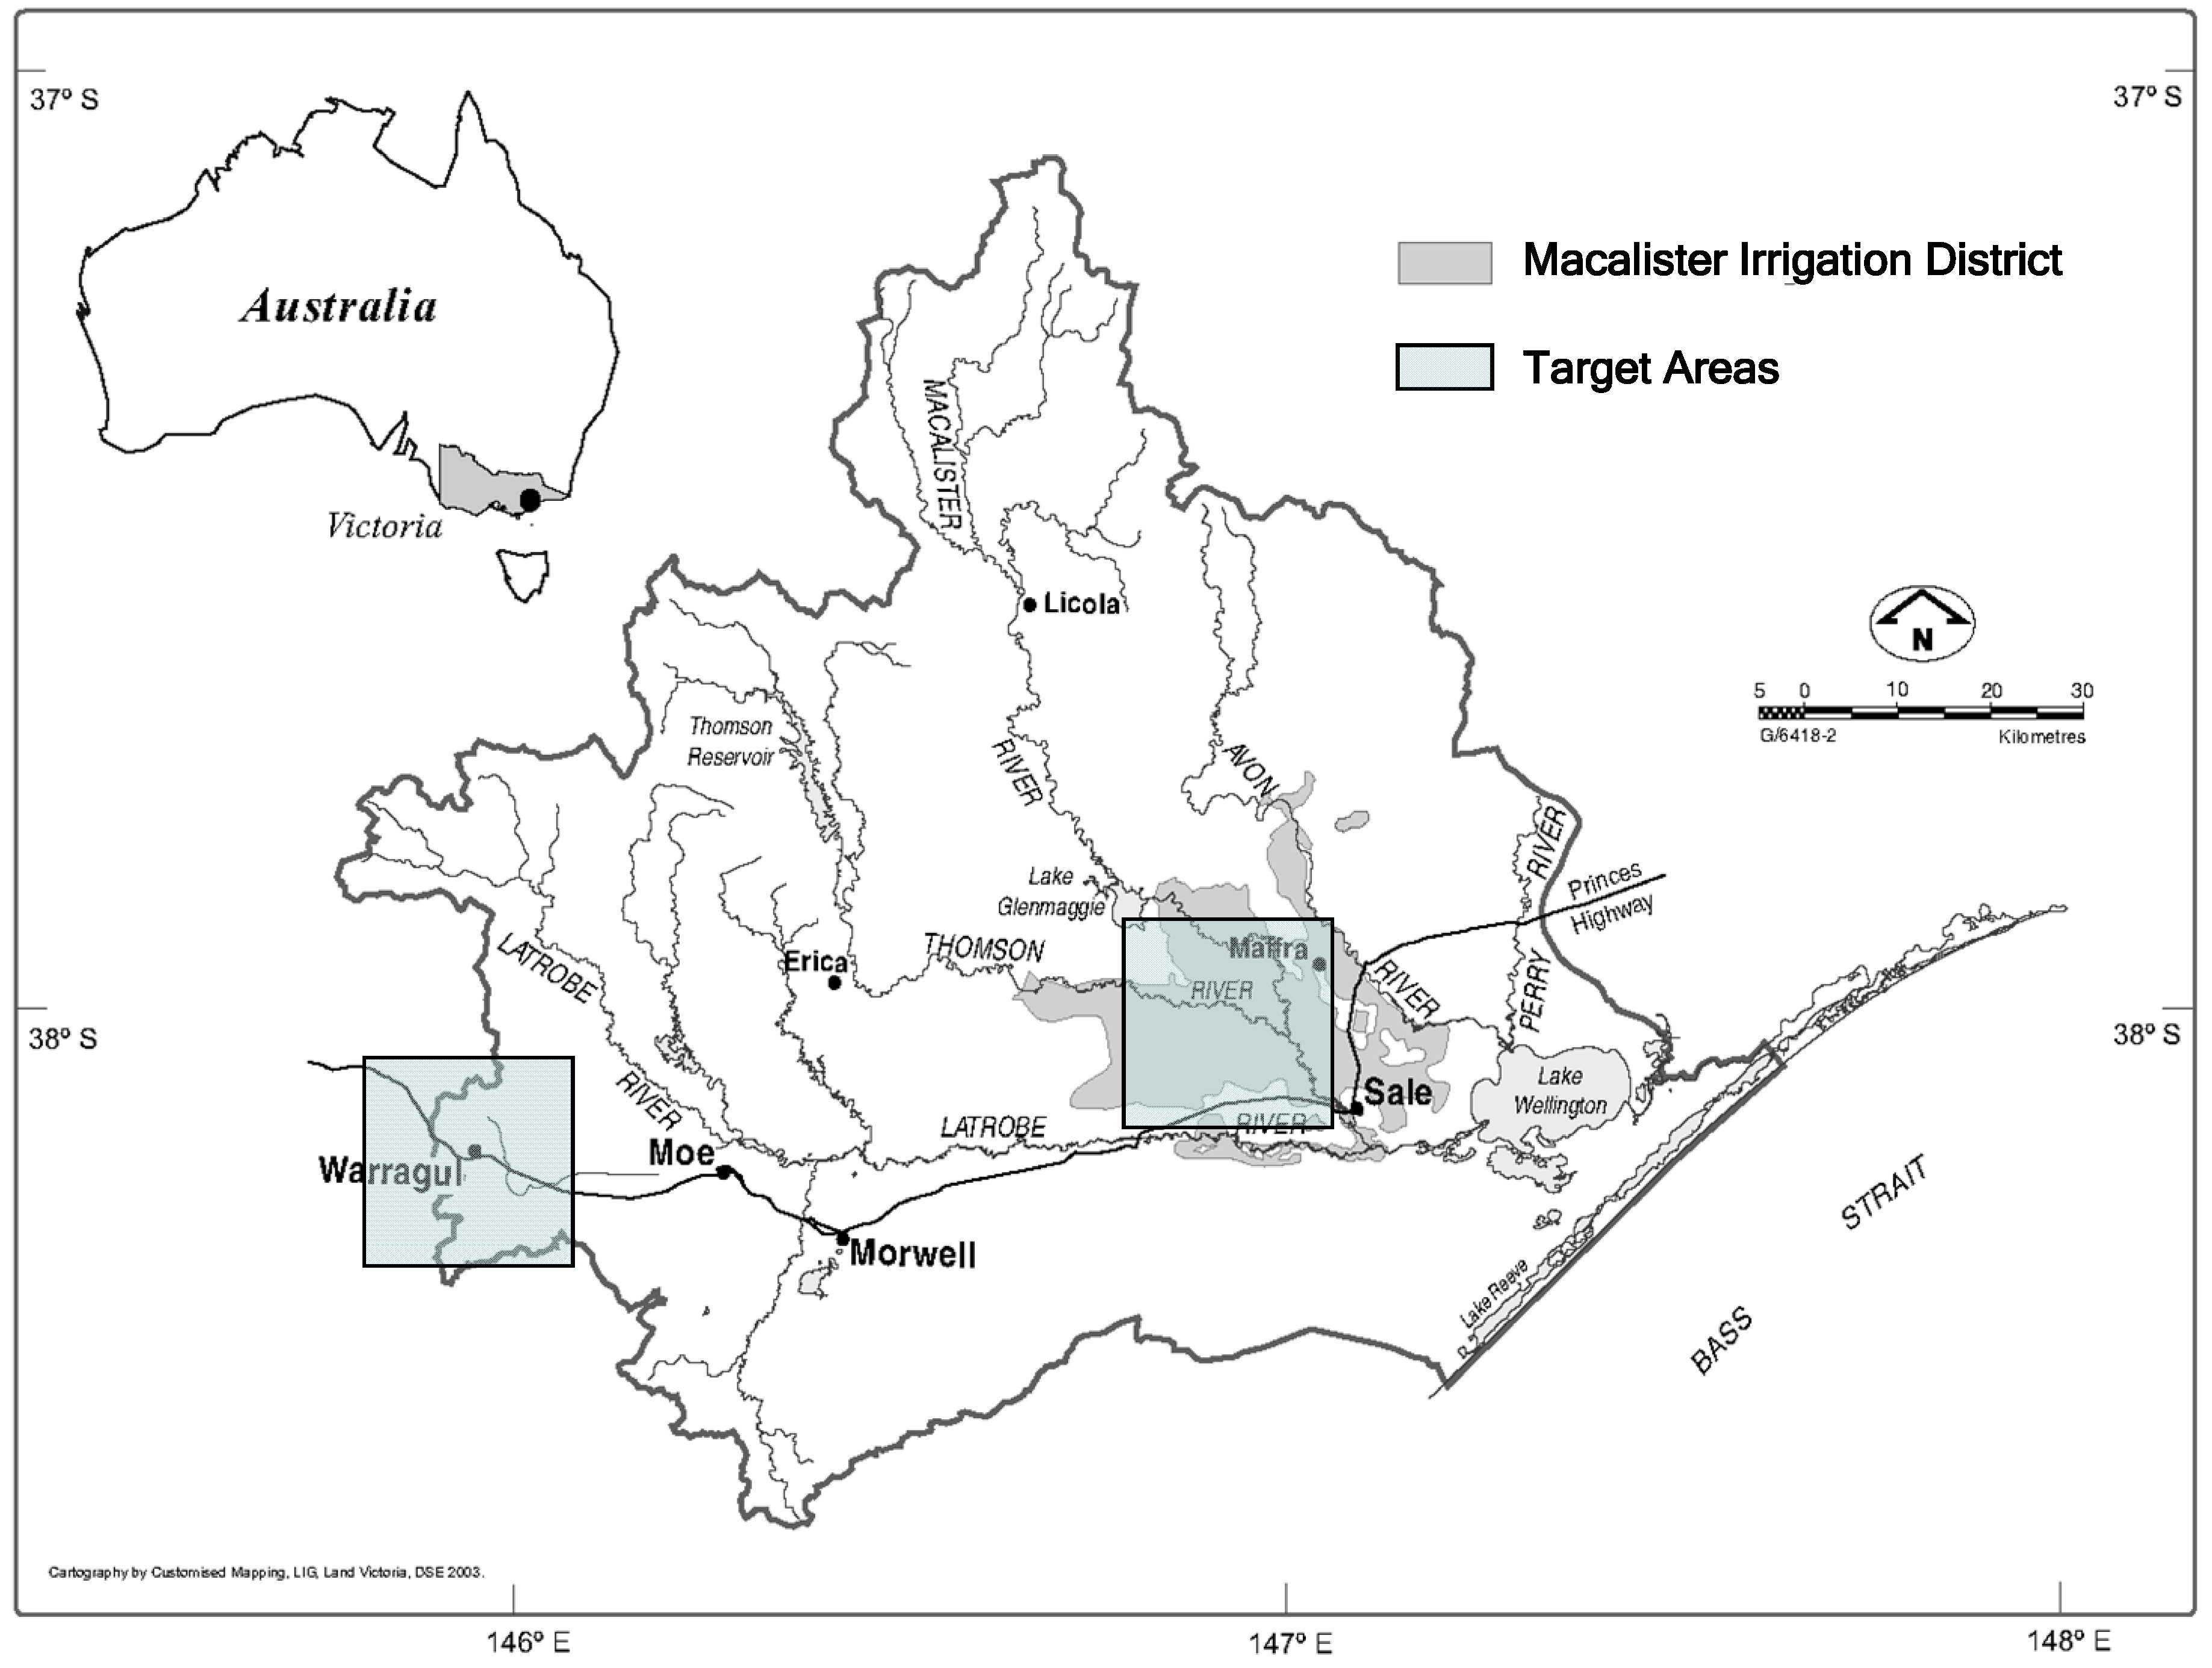
In this study, the surface soil P components of soil samples collected from dairy and beef rearing pastoral systems from two areas in the Gippsland region (south-eastern Victoria, Australia) are measured by chemical methods and 31P NMR spectroscopy, and comparison is made to: (a) identify factors influencing the concentrations of organic and total P in different Australian soils; (b) establish if there are differences between soil P components of multiple pastoral systems; (c) investigate if and how P components vary between two agricultural areas; and (d) identify how physical factors, such as moisture, soil pH, slope and elevation, affect P composition and concentrations, particularly the organic P, of different soils.
3. Results
The physical characteristics of the sampled sites and fertiliser application are summarised in
Table 1. Evidently, the sampled sites in the Warragul area were much higher in elevation than those in the Maffra area. Also, the fertiliser applications for most of the sites in Warragul area were generally higher than those in the Maffra area.
Table 1.
Information for individual sampling sites of the Warragul and Maffra areas.
Table 1.
Information for individual sampling sites of the Warragul and Maffra areas.
| Sampling Sites | Measured Parameters | Site W1 | Site W2 | Site W3 | Site W4 | Site W5 | Site W6 | Site W7 |
|---|
| Warragul Area | Estimated Slope (m 100 m−1) a | <1.0 | 2.9 | 11.7 | 9.2 | 11.7 | <1.0 | 4.0 |
| Elevation (m) b | 134 | 133 | 159 | 150 | 134 | 108 | 112 |
| Soil Description c | GCLD | GCLD | RCLF | RCLF | RCLF | GCLD | GSLD |
| Period Post Fertiliser Application (d) | 365 | 365 | 365 | 365 | 45 * | 20 | 730+ |
| Amount of Last Fert. Application (kg·P·ha−1) | 24.8 | 24.8 | 24.8 | 24.8 | 3.7 * | 14.8 | n/a |
| Fert. Applied Over 2 Years (kg·P·ha−1) | 24.8 | 24.8 | 24.8 | 24.8 | 3.7 * | 14.8 | n/a |
| Sampling Sites | Measured Parameters | Site M1 | Site M2 | Site M3 | Site M4 | Site M5 | Site M6 | Site M7 |
| Maffra Area | Estimated Slope (m 100 m−1) a | <1.0 | <1.0 | 3.3 | <1.0 | <1.0 | <1.0 | <1.0 |
| Elevation (m) b | 46 | 43 | 36 | 33 | 28 | 33 | 33 |
| Soil Description c | GRCLS | GRCLS | GRCLS | GRCLS | GYCLS | GCLS | GCLS |
| Period Post Fertiliser Application (d) | 365 | 45 | 1000+ | 730+ | 60 | 130 | 130 |
| Amount of Last Fert. Application (kg·P·ha−1) | 11.8 | 14.5 | n/a | n/a | 13.2 | 7.7 | 7.7 |
| Fert. Applied Over 2 Years (kg·P·ha−1) | 11.8 | 29.0 | n/a | n/a | 26.4 | 15.4 | 15.4 |
The results obtained for various soil properties for the selected sites are given in
Table 2. Dual pH measurements were conducted on all soil samples, one using deionised water (pH
W) and the other with calcium chloride (pH
Ca) as extractants. Of these, the (pH
Ca) test is more accurate, as it is more directly related to the pH a plant is exposed to in the soil. In general, (pH
W) is usually about 0.5–0.9 higher than (pH
Ca). The soil pH measurements of the samples obtained from the Warragul area were: pH
W 5.0 to 5.6 (average 5.3) and for pH
Ca 4.1 to 4.9 (average 4.6). These were only slightly higher for soil samples obtained from the Maffra area with pH
W 4.9 to 6.2 (average 5.7) and pH
Ca 4.5 to 5.6 (average 5.2).
The electrical conductivity, water extractable P and calcium chloride extractable P obtained for soil samples from the sites in the Maffra area were higher than those from the Warragul area. In contrast, the Colwell P obtained for sites in the Warragul area were higher than those from the Maffra area.
As evident in the results in
Table 3, the total P concentrations ranged between 1779 and 3009 mg P kg
−1 for the classified soil from sites (W1–W6) in the Warragul area and ranged between 1447 and 2381 mg P kg
−1 for the sites in Maffra area. This is somewhat reflective of the higher fertiliser application in the Warragul area. The total P concentrations obtained with the NaOH-EDTA extracts indicate that between 71.6% and 90.5% of the soil P was extracted. The proportion of P extracted with NaOH-EDTA varied with soil type, and ranged from 85.9% to 90.5% for Dermosols (not including the unclassified site W7), 71.6% to 81.3% for Sodosols and 73.3% to 77.3% for Ferrosols. Organic P (the combination of monoester P and diester P) represented between 21.3% and 50.2% (sites W3 and M4) of total extract P (
Table 4). More specifically, the organic P in the Dermosols, Ferrosols and Sodosols ranged from 30.7% to 32.9%, 21.3% to 31.1% and 23.5% to 50.2%, respectively. It is important to note that the extractable organic P obtained for Dermosols and Ferrosols were in reasonable agreement with the range of 20% to 30% obtained by Turner [
45]. In contrast, the Sodosols gave much wider range of extractable organic P of 23.5%–50.2%, but the recoveries obtained (23.5%–31.6%) for soils collected from three of these sites (M1, M2 and M7) were also close to the range reported by Turner [
46].
Table 2.
Measured soil parameters for the surface soil (0–20 mm) of individual sampling sites of the Warragul and Maffra areas.
Table 2.
Measured soil parameters for the surface soil (0–20 mm) of individual sampling sites of the Warragul and Maffra areas.
| Sampling Sites | Soil Parameters | Site W1 | Site W2 | Site W3 | Site W4 | Site W5 | Site W6 | Site W7 |
|---|
| Warragul Area | pHW | 5.5 | 5.4 | 5.0 | 5.1 | 5.4 | 5.6 | 5.2 |
| pHCa | 4.9 | 4.8 | 4.4 | 4.3 | 4.8 | 4.8 | 4.1 |
| Electrical Conductivity (dS/m) | 0.542 | 0.483 | 0.322 | 0.351 | 0.291 | 0.223 | 0.092 |
| Total P (mg P kg−1) | 1838 | 1941 | 3009 | 2680 | 1779 | 2062 | 1103 |
| Colwell P (mg P kg−1) | 730 | 671 | 418 | 446 | 126 | 251 | 110 |
| Olsen P (mg P kg−1) | 93 | 80 | 114 | 99 | 36 | 74 | 39 |
| Water extractable P (mg P kg−1) | 17.5 | 11.7 | 3.7 | 6.6 | 3.0 | 10.1 | 8.9 |
| Calcium chloride extractable P (mg P kg−1) | 6.7 | 4.3 | 1.7 | 2.9 | 0.9 | 5.0 | 3.3 |
| Sampling Sites | Soil Parameters | Site M1 | Site M2 | Site M3 | Site M4 | Site M5 | Site M6 | Site M7 |
| Maffra Area | pHW | 5.3 | 5.6 | 4.9 | 6.1 | 5.4 | 6.0 | 6.2 |
| pHCa | 4.9 | 5.3 | 4.5 | 5.3 | 5.0 | 5.6 | 5.6 |
| Electrical Conductivity (dS/m) | 0.766 | 1.713 | 1.293 | 0.689 | 1.225 | 0.874 | 0.535 |
| Total P (mg P kg−1) | 1936 | 2381 | 1447 | 1470 | 1775 | 2000 | 1743 |
| Colwell P (mg P kg−1) | 314 | 443 | 106 | 89 | 334 | 319 | 306 |
| Olsen P (mg P kg−1) | 77 | 133 | 33 | 36 | 108 | 86 | 81 |
| Water extractable P (mg P kg−1) | 29.5 | 53.0 | 13.7 | 19.5 | 48.4 | 47.8 | 32.1 |
| Calcium chloride extractable P (mg P kg−1) | 11.7 | 40.2 | 7.8 | 7.2 | 46.2 | 22.1 | 12.7 |
Table 3.
Selected soil and soil extract (NaOH-EDTA) characteristics of individual sampling sites of the Warragul and Maffra areas.
Table 3.
Selected soil and soil extract (NaOH-EDTA) characteristics of individual sampling sites of the Warragul and Maffra areas.
| Sampling Sites | Measured Parameters | Site W1 | Site W2 | Site W3 | Site W4 | Site W5 | Site W6 | Site W7 |
|---|
| Warragul Area | Soil Total P (mg P kg−1) | 1838 | 1941 | 3009 | 2680 | 1779 | 2062 | 1103 |
| Extract Total P (mg P kg−1) a | 1663 | 1708 | 2237 | 2072 | 1304 | 1771 | 836 |
| Extract Total P (%) b | 90.5 | 88.0 | 74.3 | 77.3 | 73.3 | 85.9 | 75.7 |
| Extract Organic P (mg P kg−1) | 577 | 559 | 508 | 547 | 447 | 572 | 399 |
| Extract Organic P (%) c | 34.7 | 32.7 | 22.7 | 26.4 | 34.3 | 32.3 | 47.8 |
| Sampling Sites | Measured Parameters | Site M1 | Site M2 | Site M3 | Site M4 | Site M5 | Site M6 | Site M7 |
| Maffra Area | Soil Total P (mg P kg−1) | 1936 | 2381 | 1447 | 1470 | 1775 | 2000 | 1743 |
| Extract Total P (mg P kg−1) a | 1472 | 1867 | 1174 | 1053 | 1378 | 1608 | 1417 |
| Extract Total P (%) b | 76.0 | 78.4 | 81.1 | 71.6 | 77.6 | 80.4 | 81.3 |
| Extract Organic P (mg P kg−1) | 494 | 666 | 628 | 591 | 692 | 678 | 364 |
| Extract Organic P (%) c | 33.6 | 35.7 | 53.5 | 56.1 | 50.2 | 42.2 | 25.7 |
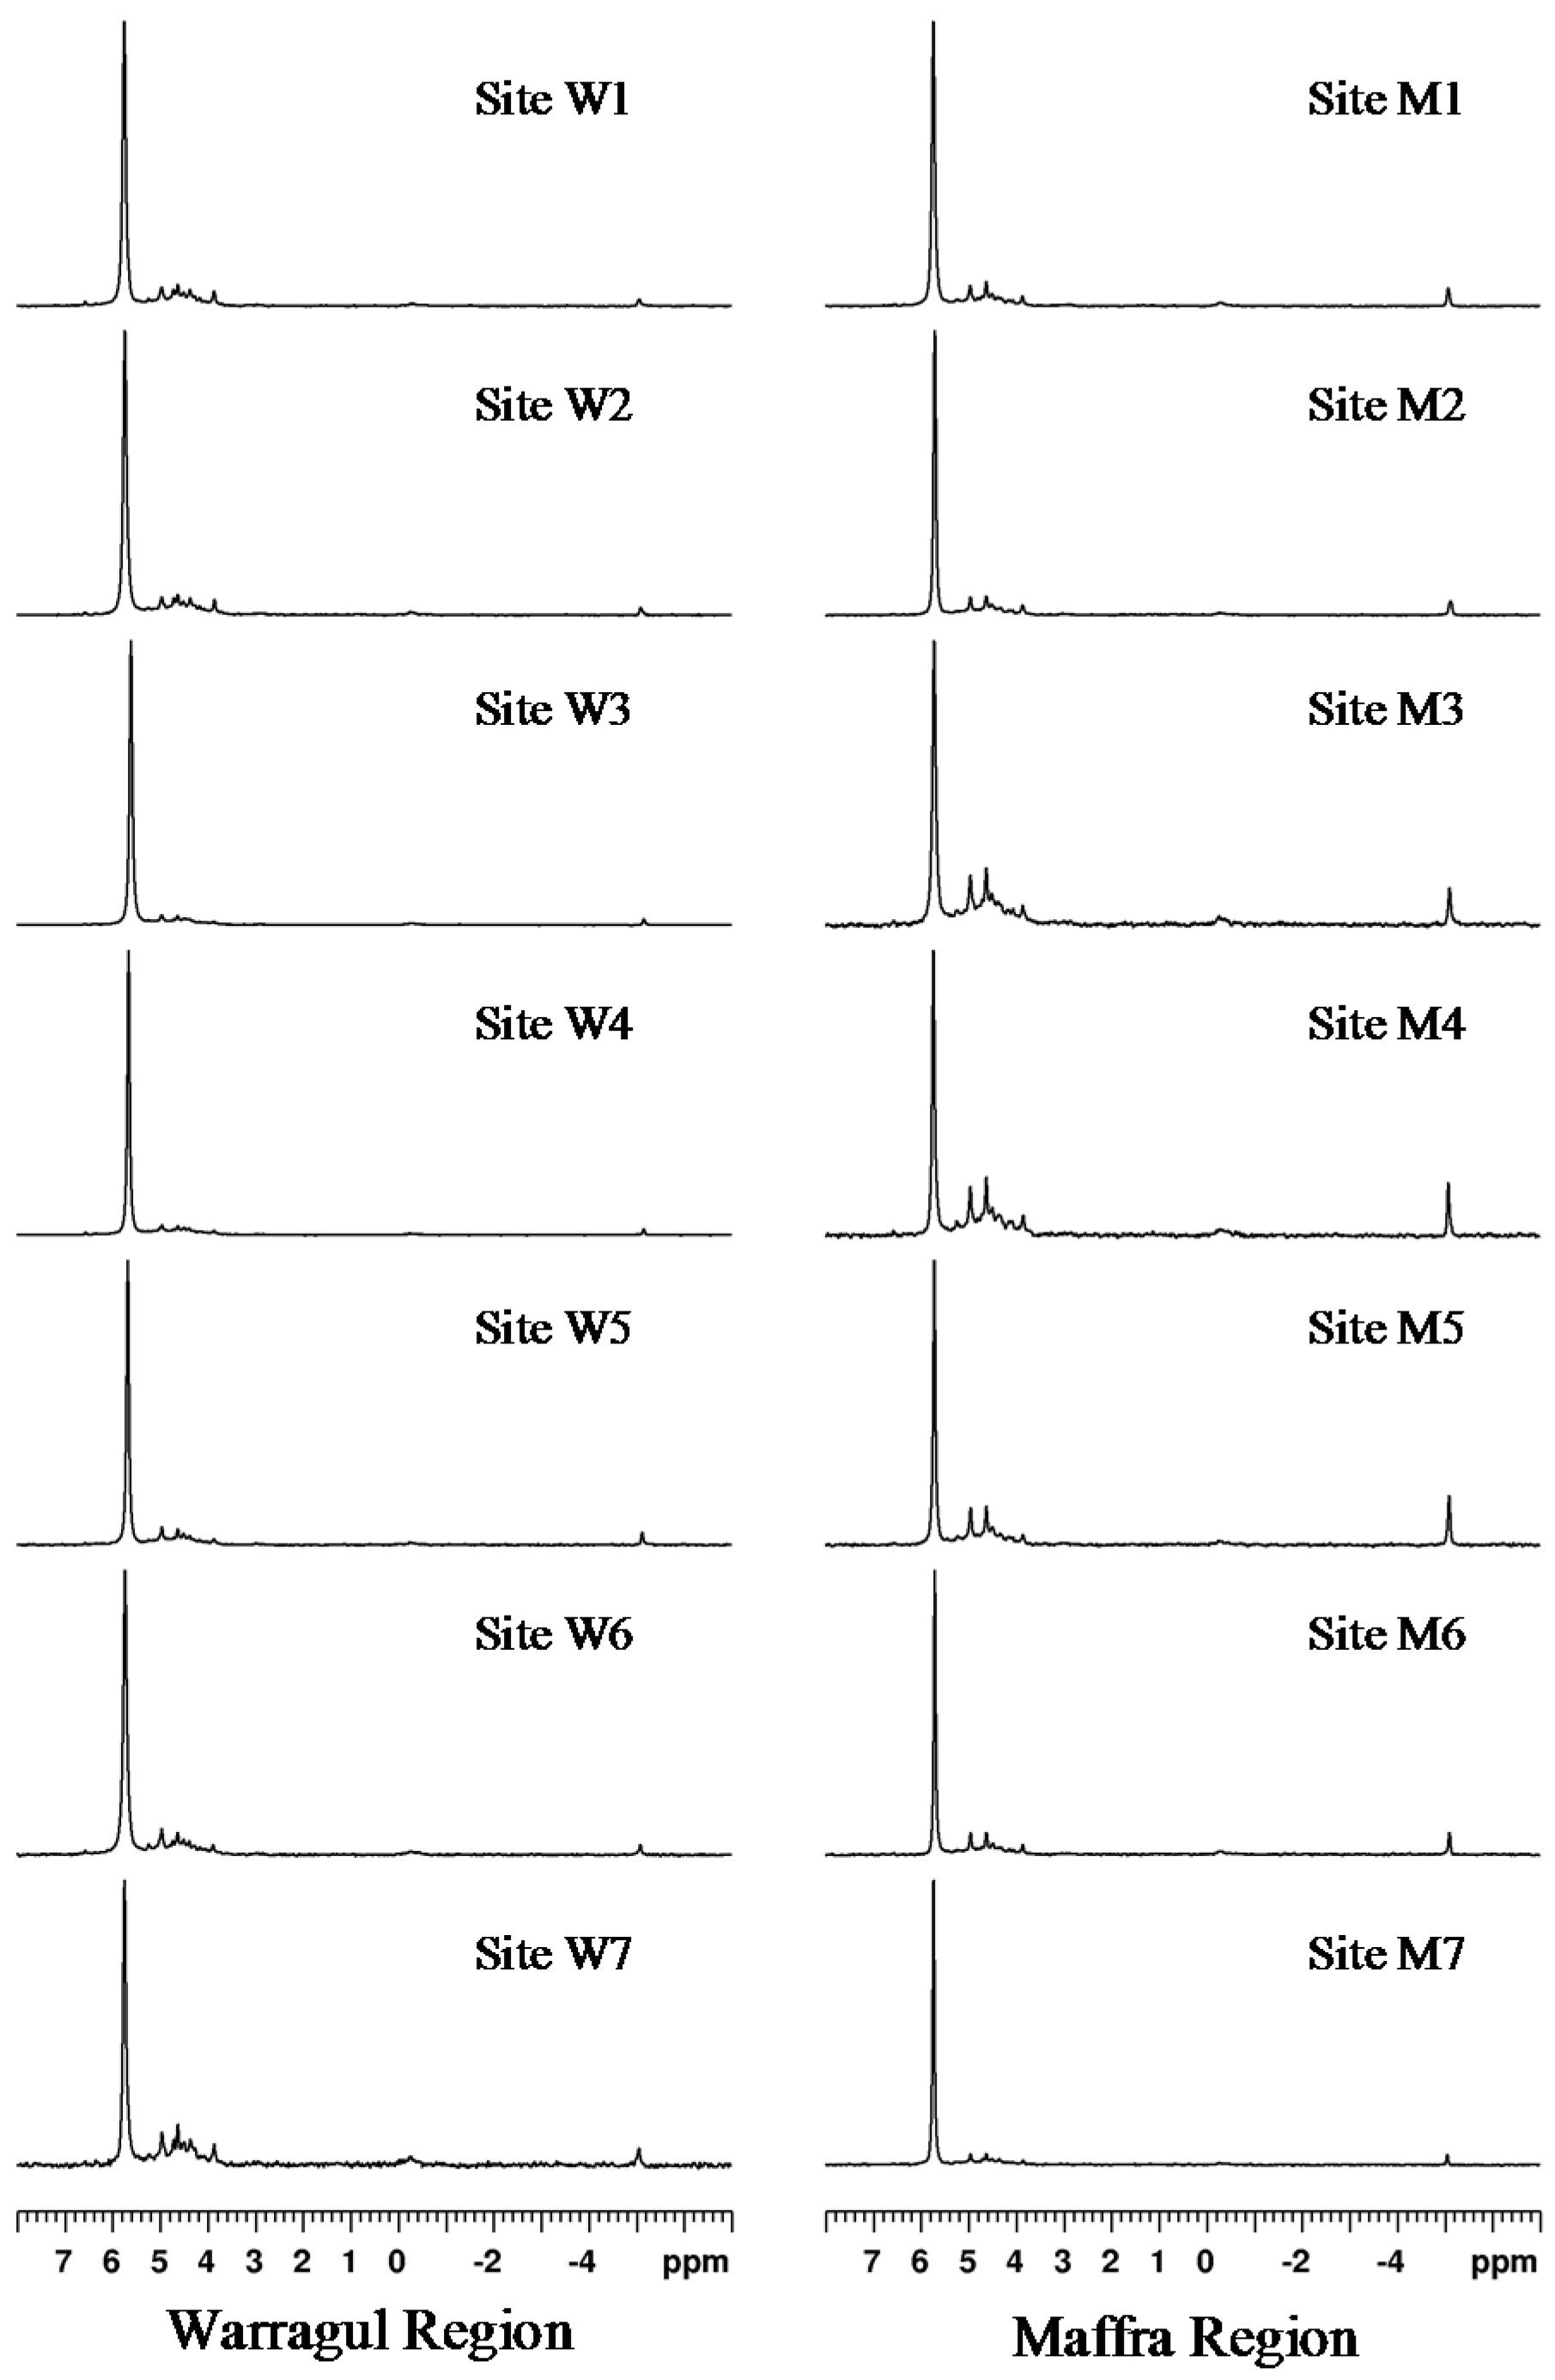
The
31P NMR spectra of NaOH-EDTA extracts of all fourteen soils are shown in
Figure 2. These spectra are similar to
31P NMR of NaOH-EDTA soil extracts published previously [
8,
11,
18,
46,
47]. The distribution of P species, as determined by integration of the
31P NMR spectra across broad chemical shift regions is given in
Table 4.
Table 4.
The percentage distribution of the total 31P NMR signal across four diagnostic chemical regions.
Table 4.
The percentage distribution of the total 31P NMR signal across four diagnostic chemical regions.
| Sampling Sites | Site | 7 to 5.3 ppm Orthophosphate (%) | 5.3 to 2 ppm Monoester Phosphate (%) | 0.5 to −1 ppm Diester Phosphate (%) | −4.5 to −5.5 ppm Pyrophosphate (%) |
|---|
| Warragul Area | W1 | 65.3 (0.6) | 31.0 (0.1) | 1.9 (0.1) | 1.8 (0.4) |
| W2 | 67.3 (0.1) | 30.1 (0.5) | 1.5 (0.2) | 1.1 (0.4) |
| W3 | 77.3 (1.6) | 19.8 (1.5) | 1.5 (0.3) | 1.4 (0.2) |
| W4 | 73.6 (0.0) | 23.4 (0.1) | 1.5 (0.1) | 1.6 (0.0) |
| W5 | 65.7 (1.2) | 28.6 (0.8) | 2.5 (0.2) | 3.1 (0.2) |
| W6 | 67.7 (0.1) | 28.9 (0.4) | 1.8 (0.1) | 1.6 (0.4) |
| W7 | 52.2 (2.2) | 39.6 (0.4) | 5.7 (0.9) | 2.6 (0.9) |
| Maffra Area | M1 | 66.4 (1.4) | 28.2 (0.6) | 2.0 (0.6) | 3.3 (0.2) |
| M2 | 64.3 (0.3) | 29.1 (0.1) | 2.5 (0.0) | 4.1 (0.2) |
| M3 | 46.5 (1.0) | 44.6 (0.3) | 3.8 (1.1) | 5.0 (0.2) |
| M4 | 43.9 (2.1) | 46.4 (0.6) | 3.8 (1.7) | 5.9 (1.0) |
| M5 | 49.8 (0.3) | 37.9 (0.0) | 3.8 (0.2) | 8.5 (0.1) |
| M6 | 57.8 (3.7) | 33.0 (1.9) | 3.9 (1.3) | 5.2 (0.5) |
| M7 | 74.3 (2.1) | 22.2 (2.1) | 1.3 (0.8) | 2.2 (0.8) |
| Average | 62.3 | 31.6 | 2.7 | 3.4 |
Figure 2.
Solution 31P NMR spectra of NaOH-EDTA soil extracts.
Figure 2.
Solution 31P NMR spectra of NaOH-EDTA soil extracts.
As in previous studies, the most abundant P species in most of the soils was orthophosphate [
18]. With a chemical shift from 7.0 to 5.3 ppm in the NMR spectra, orthophosphate accounts for between 43.9% and 77.3% of the total signal intensity in these soils. An exception was site M4, which contained marginally more (46.4%) monoester P than orthophosphate P (43.9%). Across all soils, monoester phosphate (between 5.3 and 2.0 ppm) represented 19.8% to 46.4% of the total P (average 31.6%).
Diester phosphate (between 0.5 and −1.0 ppm) on average contributed 2.7% of signal intensity, whereas pyrophosphate (between −4.5 and −5.5 ppm) averaged 3.4%. Diester phosphate appeared to account for a lower proportion of the signal intensity for the Warragul samples (averaging 2.3%) than those from the Maffra area (3.0%). This difference becomes more apparent when the contribution of W7 is removed from these calculations, lowering the average diester phosphate contribution for the Warragul area to 1.8%.
Site W7 contained the most diester phosphate (5.7%) of all the soils tested. This site was different to others due to its unique soil type, a grey sandy loam. Based on other soils surrounding its location, soil from site W7 featured Dermosol characteristics.
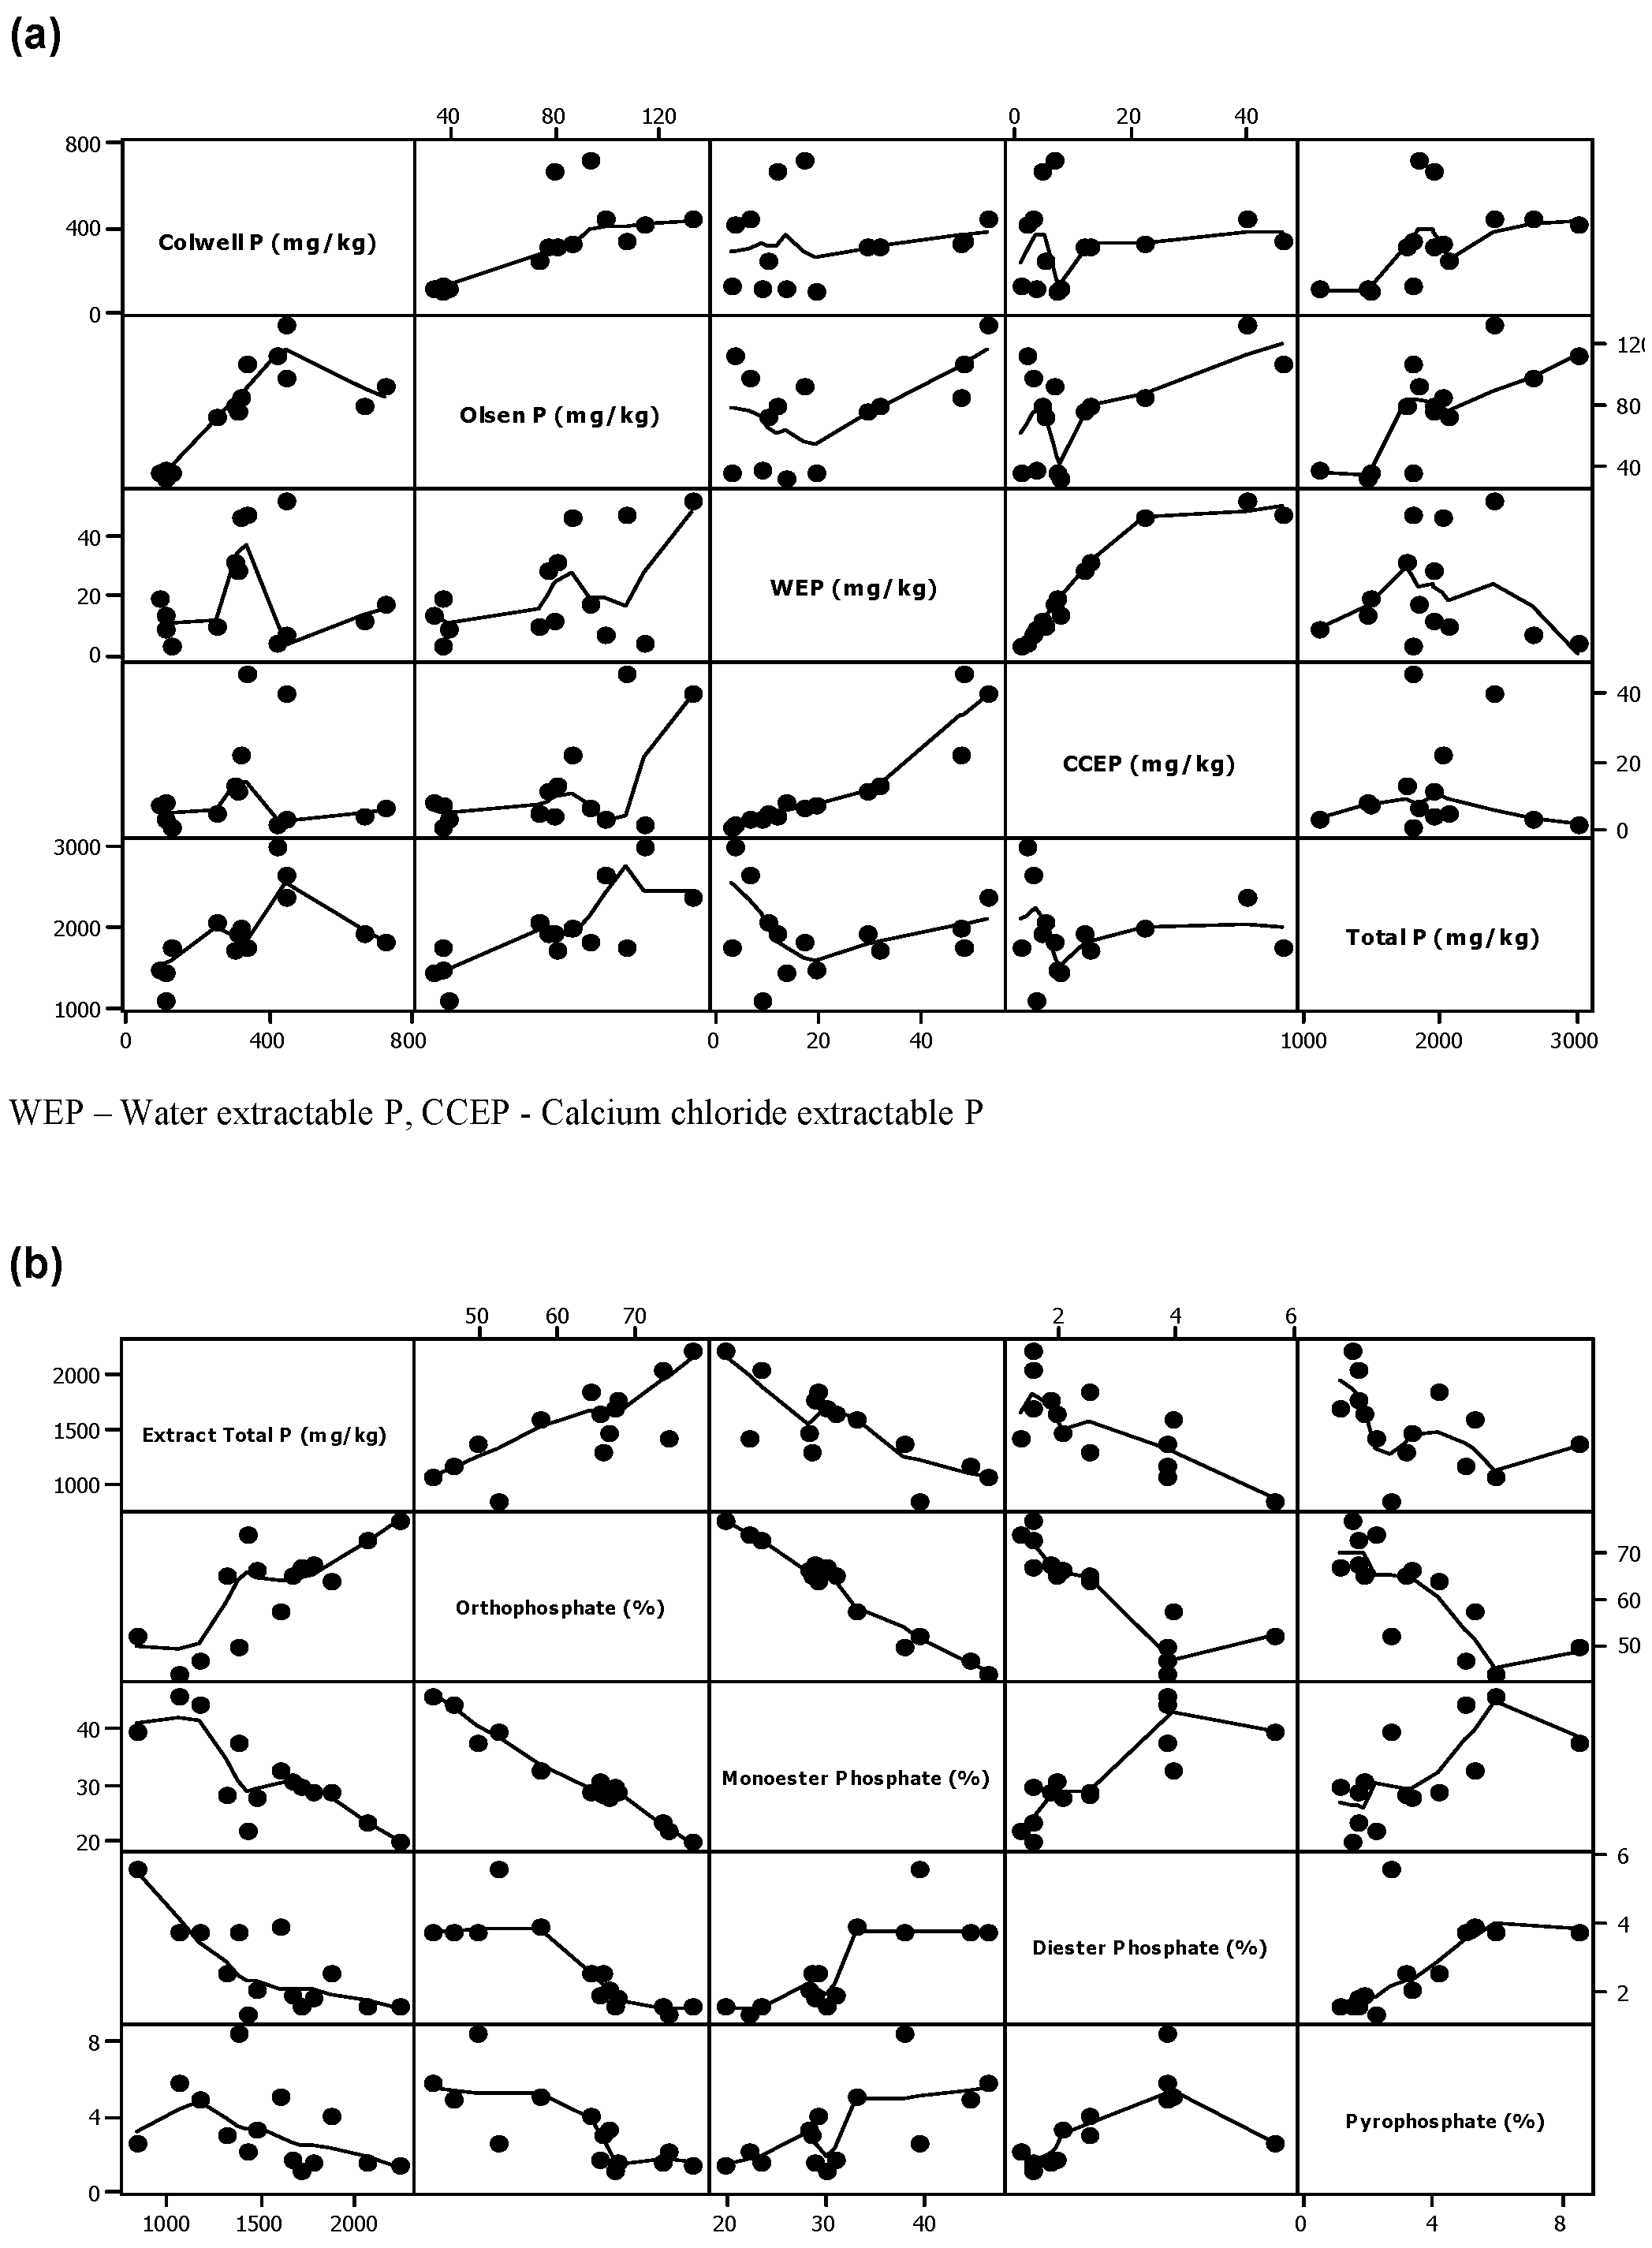
Figure 3 shows the scatter plots obtained between the concentrations of the various inorganic and organic phosphates found in all soil samples. It is obvious that, given the limited number of sampling sites considered in this initial study, it is difficult to identify clear correlation between many of these P species. Notwithstanding this limitation, correlation between the concentrations of some of these species is still clearly evident and these will be highlighted later in the discussion section.
Figure 3.
Scatter plots of the trend between some of the inorganic and organic P levels in the soil samples. (a) Colwell P, Olsen P, water extractable P (WEP), calcium chloride extractable P (CCEP) and Total P as mg/kg; (b) Extractable total P, orthophosphate, monoester P, diester P and pyrophosphate as percentage (%).
4. Discussion
By removing fertiliser variables, such as timing and rate, some clear differences can be seen between soil types. These differences are most clearly demonstrated when comparing sites W1 and W2 (grey clay loam Dermosols) to sites W3 and W4 (red clay loam Ferrosols). Although separate, each of these sites were managed as a single site utilising similar farm management practices, with each receiving identical recent P fertiliser additions (24.8 kg·P·ha
−1, 365 d). Although separated by less than 2 km, these pairs of sites showed some clear differences that were attributed predominantly to soil type and this will be discussed in more detail later in this section. Total soil P concentrations were much lower for sites W1 and W2 (1838 and 1941 mg P kg
−1) than sites W3 and W4 (3009 and 2680 mg P kg
−1). Based on site averages, these higher total P concentrations, which were 51% greater for the Ferrosol sites, were not reflected in the results for the agronomic soil testing, with the Dermosol sites (W1 and W2) giving higher Colwell P values than the Ferrosol sites (W3 and W4), and similar Olsen P values (
Table 2).
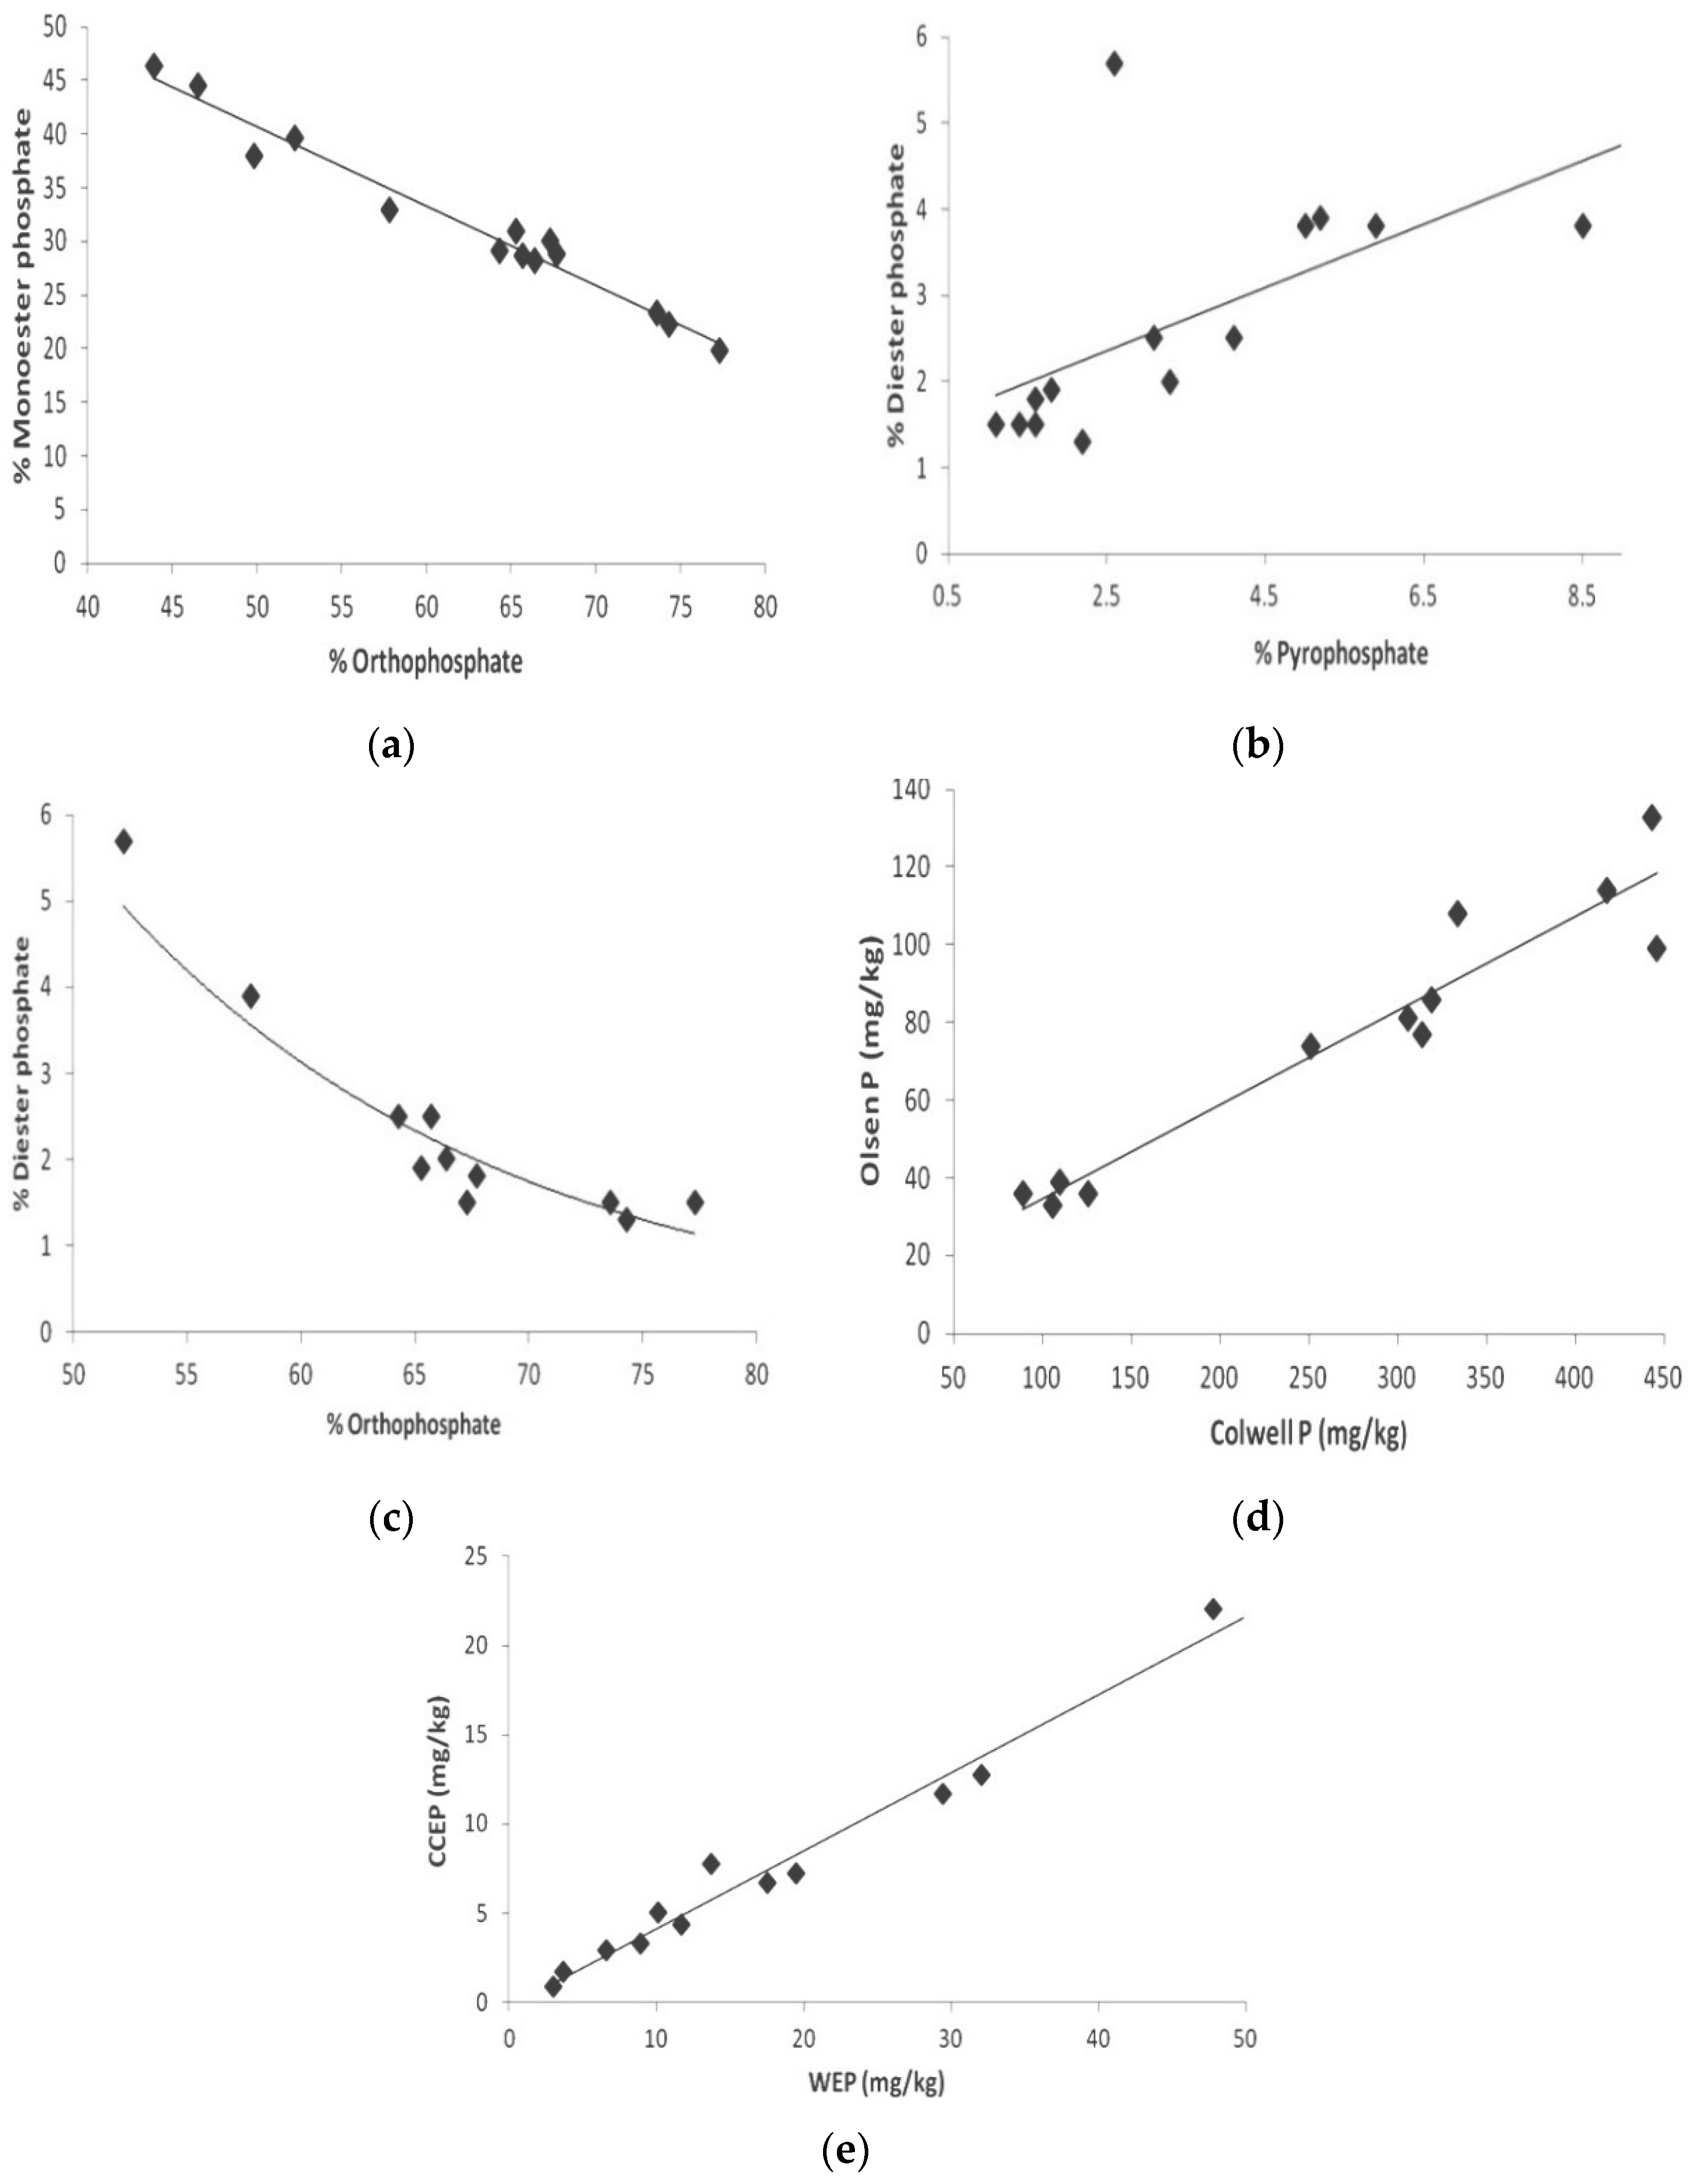
Figure 4.
Selected scatter plots demonstrating correlation between: (a) monoester P and orthophosphate; (b) diester P and pyrophosphate; (c) diester P andorthophosphate; (d) Olsen P and Colwell P; (e) CCEP and WEP.
Figure 4.
Selected scatter plots demonstrating correlation between: (a) monoester P and orthophosphate; (b) diester P and pyrophosphate; (c) diester P andorthophosphate; (d) Olsen P and Colwell P; (e) CCEP and WEP.
Despite slight management disparity, there were discrepancies when comparing the P composition within the soils from Maffra sites M2 and M5 using NMR analysis. The red Sodosol (M2) gave 64.3% of total P in the form of orthophosphate (inorganic), whereas it was 49.8% for the yellow Sodosol (M5). Another feature of the yellow Sodosol is the relatively high proportion of pyrophosphate (8.5%) compared to all other soils. This was 44% higher than the next highest pyrophosphate percentage (site M4, 5.9%) and more than doubled the highest proportion achieved in soils from the Warragul area (ranging between 1.1% and 3.1%). As with any alkaline organic P extraction procedure there is always the possibility that hydrolysis may have influenced these results. Pyrophosphate is unstable in aqueous solution and some may have been hydrolysed during the extraction into inorganic phosphate [
23,
48]. To some degree, the concentration of monoester phosphate is likely to be overestimated through the degradation of diester phosphate during the extraction process [
48,
49]. This possibility needs to be taken in consideration when viewing these results.
The lowest soil orthophosphate levels also corresponded with the lowest fertiliser inputs for the Maffra soils (site M3, 46.5% and site M4 43.9%). Sites M3 and M4, which are of a similar soil type, had not received P-based fertilisers for at least two years prior to soil sampling. Not surprisingly, these soils had the lowest total P concentrations (1447 mg P kg
−1 and 1470 mg P kg
−1 for M3 and M4, respectively), with the exception of site W7. Again these low fertiliser rates resulted in a high proportion of monoester P (44.6% and 46.4% for M3 and M4, respectively). This view is well supported by the scatter plot of monoester P and orthophosphate levels shown in
Figure 4a. It is clearly obvious that monoester P level was highest when orthophosphate level in the soil was lowest.
To better understand the cause of these variations and differences, it was necessary to further discuss the influence of important parameters, such as soil type and management practices, including fertilisation, moisture, pH and slope/elevation variations.
4.1. Influence of Soil Type
The use of NMR spectroscopy for investigating the P complexes of each soil type revealed distinct differences in signal strength distribution. Typically, diester phosphate and pyrophosphate were similar irrespective of soil type, but those of monoester phosphate and orthophosphate were different. This view is well supported by the scatter plot between diester P and pyrophosphate concentrations.
Figure 4b shows that, with the exception of two outliers, reasonably good correlation was found between the concentrations of these two P species. Also, the scatter plot in
Figure 4c reveals that diester P level is highest where fertilise input is lowest, as reflected by low orthophosphate level. This indicates that during low fertilizer input, a relatively large proportion of P is stored in soil in the organic diester P form.
The average proportion of orthophosphate was 66.8% for the grey Dermosol (sites W1, W2, W6) and 72.2% for the red Ferrosol sites (sites W3, W4, W5). The monoester phosphate region on average accounted for 30.0% and 23.9% of signal intensity for Dermosol and Ferrosol soils, respectively.
With the longer exposure (16 h) of the extracted P from the soil to the NaOH-EDTA solution, it is possible that the hydrolysis of labile P forms can lead to production of artefacts which can influence the observed difference of the P forms to some extent. However, the differences in soil mineralogy which reflects soil formation processes will have stronger influence on the observed trends of the P forms. For example, by definition, Ferrosols have B2 horizons which are high in iron (Fe) content [
39]. This may also be reflected in the surface soil horizon (A) as Ferrosols lack strong texture contrast between the A and B horizons [
39]. Soils high in Fe sorb P strongly due to their variable charged oxides and, therefore, Fe is an important factor in soil P sorption [
50,
51]. Hence, the presence of higher Fe concentrations may account, in part, for the higher orthophosphate proportion (
Table 4), much higher total P concentrations (
Table 2), and relatively low concentrations of other soil P measurements (
Table 2) in the Ferrosol sites with the same fertiliser application rates (that is, Dermosol sites W1 and W2 compared to Ferrosol sites W3 and W4).
The Ferrosol sites (W3 and W4) had average concentrations of 432 mg P kg
−1 and 107 mg P kg
−1 for Colwell P and Olsen P, respectively. The comparative concentrations for the Dermosol sites (W1 and W2) were 701 mg P kg
−1 for Colwell P and 87 mg P kg
−1 for Olsen P. The higher Olsen P concentrations in soil from the Ferrosol sites indicate that the soil had more plant available P (as indicated by Olsen P values) than those from the Dermosol sites. On the other hand, the much higher Colwell P value obtained for the Dermosol sites indicate that the soil contains more structurally bound phosphate reserve than soil from the Ferrosol sites. Furthermore, the lower Colwell P obtained for soil from all of the Ferrosol sites (including site W5) is consistent with the lower total P extracted (73.3%–77.3%) with the NaOH-EDTA solution (
Table 3) compared with those of the Dermosol sites, including site W6 (85.9%–90.5%). The significant difference also supports the view that the Dermosols have higher structurally bound (reserve) P. In general, the higher Colwell P obtained for sites in the Warragul area (110–730 mg P kg
−1) than those in Maffra area (89–443 mg P kg
−1) indicates higher structurally bound (reserve) P in soil within the Warragul area.
In spite of the differences in the Olsen P and Colwell P levels in the different soil samples,
Figure 4d shows that there is a reasonably good correlation between the Olsen P and Colwell P levels obtained for other soil samples when the W1 and W2 Dermosol sites are removed. This observation supports the view that either of these parameters can be used to gain a reasonable indication of plant available P.
The differences between the soil from Dermosol (sites W1 and W2) and Ferrosol sites (sites W3 and W4) with the same fertiliser treatments were also evident in the environmental soil tests. The environmental soil test utilised weak extractants (namely deionised water and 0.1 M calcium chloride) to provide insight into P that may be environmentally available. As reflected by the results in
Table 2, the use of these weak extractants (water and calcium chloride) for the environmental soil tests gave comparable lower P concentrations than Olsen P and Colwell P values. The average water extractable P (WEP) and calcium chloride extractable P (CCEP) concentrations for the Dermosol sites were 14.6 mg P kg
−1 and 5.5 mg P kg
−1, respectively. In contrast, the WEP and CCEP concentrations for the Ferrosol sites were considerably lower, averaging 5.1 and 2.3 mg P kg
−1, respectively, corresponding to 35% of WEP and 42% of CCEP concentrations found for the Dermosol samples. Interestingly, these results indicate that while on average the Ferrosol sites have similar plant available P (higher Olsen P value) to those of the Dermosol sites, the reverse was revealed by the environmental soil test results. These observations indicate a possible distinction between plant available P and environmentally available P. The higher environmentally available P concentrations observed for the Dermosol sites are reflective of their higher Colwell P values.
More interestingly, the WEP and CCEP concentrations obtained for the sites in the Maffra area (13.7–53.0 mg P kg−1 and 7.2–46.2 mg P kg−1, respectively) were much higher than those from Warragul areas (3.0–17.5 mg P kg−1 and 0.9–6.7 mg P kg−1, respectively). This observation indicates that environmental leaching of P occurs more readily from the Sodosols than from the Dermosols and Ferrosols.
The results for sampling sites in the Maffra area also suggest differences due to soil characteristics. Even though all soils from the sites in Maffra area were Sodosols, there were still some variations in soil type, predominantly reflecting differences in subsurface soil colour (
Table 1).
Notwithstanding the variation in the environmental P levels with soil type,
Figure 4e shows that there is a very good correlation between CCEP and WEP levels. This observation suggests that either of these parameters may be reasonably used to gain an indication of the environmental P level in soil.
4.2. Influence of Management Practices
4.2.1. Fertiliser Variations
The impact of different management practices applied to the sampling sites were also investigated. An important feature of site W7 is that it had not received any fertiliser P applications for a minimum of two years prior to sampling. Thus, a combination of soil type (the only grey sandy loam Dermosol) and fertiliser application is likely to be the cause of the difference between site W7 and the other sites.
The lack of fertiliser inputs to site W7 is clearly reflected in the total P (1103 mg P kg
−1), extracted total P (836 mg P kg
−1) and orthophosphate portion (52.2%) measurements, each the lowest among the Warragul sites. The lower orthophosphate in this soil, in turn, increased the relative proportions of other soil P types, with W7 having the highest proportion of monoester P (39.6%) and the second highest proportion of pyrophosphate (2.6%) (
Table 4). This view is well supported by the scatter plots in
Figure 4.
The apparent increase in orthophosphate concentrations due to fertiliser application is not unexpected. In fact the purpose of any type of fertiliser P application is to increase available P for pasture production and all fertiliser P inputs for the sampled site were inorganic blends. Depending on soil texture, fertilisers additions have also been found to increase soil organic P, especially monoester P [
23,
52].
Sites M1 to M4 also had similar soil characteristics, but received different fertiliser P inputs over different periods. Site M1 had 11.8 kg·P·ha
−1 applied approximately 365 d prior to sampling, whereas 14.5 kg·P·ha
−1 was applied approximately 45 d pre-sampling to site M2 (
Table 1). Site M2 also had an extra 14.5 kg·P·ha
−1 addition around 400 d before sampling. The extra and more recent fertiliser additions appears to be reflected in the soil P concentrations (total P and orthophosphate portion). All measured P concentrations were higher at site M2 than at site M1, including total P (23% higher), Colwell P (41%), Olsen P (73%), WEP (80%) and CCEP (24%). The CCEP concentrations appears to be most affected by the recent fertiliser additions. Although the fertiliser additions are not enough to fully account for differences between P capacity measurements (namely total P and Colwell P), they may also be indicative of different long term management strategies between the sites. Interestingly, these differences were also reflected by three of the different proportions in the four
31P NMR chemical regions. Corresponding signal proportions for sites M1 and M2 were orthophosphate (66.4% and 64.3%), monoester P (28.2% and 29.1%), diester P (2.0% and 2.5%) and pyrophosphate (3.3% and 4.1%). Only the orthophosphate proportion of the soil from site M2 was lower than that obtained from site M1. Although the difference is small (2.1%) and could be insignificant, it may also indicate that soil from site M2 contained higher proportion of structurally bound (reserve) P, as reflected by its higher Colwell P value (
Table 2).
The results reported for the Ferrosol site W5 must also be viewed carefully. Although this site received a fertiliser addition close (45 d) to the time of sampling the total P input was relatively minor, equivalent to 3.7 kg·P·ha−1. This application was the only fertiliser P application for at least a three year period prior to sampling. The apparent lack of fertiliser input was obvious with all soil P measurements lower at site W5 compared with soil from other Ferrosol sites (W3 and W4).
The difference is particularly noticeable when comparing the agronomic soil P test results of the Colwell and Olsen P values. The average concentrations (sites W3 and W4) of 432 mg P kg−1 (Colwell P) and 107 mg P kg−1 (Olsen P) were clearly higher than those found for site W5 (Colwell P 126 mg P kg−1 and Olsen P 36 mg P kg−1). Site W5 also had the lowest WEP and CCEP concentrations of all sampled sites. Fertiliser application differences are also notable when interpreting the NMR spectra for this site. Even with the recent inorganic fertiliser addition prior to sampling, the proportion of orthophosphate averaged 9.8% less than other Ferrosol sites. However, this site had the highest proportion of pyrophosphate at 3.1% of all the sites in the Warragul area. Thus, indicating that the retention of P as pyrophosphate and other insoluble inorganic/organic P may account for the low WEP and CCEP concentrations obtained for this soil sample.
As with the Warragul sites fertiliser management variations were also evident for the Maffra sites. Site M2 received a P fertiliser application 15 d closer to sampling in comparison with M5 (45 d compared to 60 d). Slightly higher P fertiliser application rates (possibly over an extended period) at site M2 may be reflected in the measured soil P concentrations, particularly total P concentrations (2381 mg P kg−1 for site M2 and 1775 mg P kg−1 for site M5). Despite fertiliser additions (13.2 kg·P·ha−1, 60 d), site M5 was one of three (also sites M3 and M4) sample locations which had a lower proportion of orthophosphate than the combination of monoester P, diester P and pyrophosphate. The low proportion of orthophosphate at site M5 is an interesting observation due to the relatively recent fertiliser application to the site (60 d). In fact, this results is more reflective of other Maffra soil types which had not received P fertiliser input for an extended period (>730 d). The low proportion of orthophosphate may also be due to insufficient elapsed time to allow fertiliser P to be solubilised and incorporated into the soil structure. The NMR results for site M5 also do not reflect what was found for WEP (48.4 mg P kg−1) and CCEP (46.2 mg P kg−1) analysis. This was the highest CCEP concentration and second highest WEP concentration measured across all sites. The CCEP and WEP measurements are often associated with “available” P measurement and this would be expected to indicate an increased presence of inorganic orthophosphate. These results appeared to be more reflective of the recent fertiliser additions for the Maffra area as site M2 (WEP 53.0 mg P kg−1 and CCEP 40.2 mg P kg−1) produced similar results for recent fertiliser addition.
An interesting comparison can be made between sites M6 and M7. Both of these sites are located on the Macalister Research Farm, a dairy farm situated in the MID of south-east Victoria. Each of the irrigation bays measured were a vertic, mesonatric grey Sodosol [
39]. Site M6 (graded) was laser graded six years prior to sampling which involved disk ploughing followed by minor cutting and filling. The top soil was retained within the irrigation bay. Site M7 (established) had not been significantly altered through cultivation (>20 years prior). Each of these sites received identical P fertiliser application (15.4 kg·P·ha
−1) and timing (130 d) for the two years preceding soil sampling.
Even after a six year period from the laser grading, there still appears to be a significant difference between the graded and established sites. This was reflected in both soil P measurements and organic P composition. All soil P concentrations for the 20 mm depth were higher in the established bay (site M6), particularly the environmental P tests (total P 15% greater; Colwell P 4%; Olsen P 6%; WEP 49%; CCEP 74%). This was not completely unexpected. Surface soil and accumulated P is redistributed throughout the soil profile due to laser-grading process. A possible explanation for P being held in a more available form is that the mixing of the soil profile may, in turn, expose fresh P adsorption sites within the soil. With more adsorption sites exposed, graded bays could have a greater capacity to convert newly adsorbed P from the available form to occluded P over time. The processes of converting available P to occluded P may diminish with time with P binding within the soil structure being utilised. Hence, established bays may have a reduced ability to bind P into its soil structure, holding P in a more “available” form.
The
31P NMR phosphate distribution of the graded site (site M6) and established irrigation bay (site M7) in
Table 4 shows comparatively high orthophosphate concentrations/proportions for site M7. This appear most closely linked to the higher concentrations of the environmental soil P tests (namely WEP and CCEP) for the established bay site. Whether this relationship exists or it is coincidental requires more in-depth study. Regardless these differences are again likely due to the redistribution, in this case organic material and organic P that has accumulated in the surface soil throughout the soil profile. Whether the redistribution of P and different forms also occurs at different cultivation and soil depths is beyond the scope of this study and requires further investigation.
A previous study [
49] has shown that soil left bare fallow for a 20 year period after ploughing had less organic P compared with a grassland reference soil. The study indicated that proportion of organic monoester P remained the same while proportion of diester P decreased over time. Diester P loss did not appear to have occurred in our study with similar monoester and diester P ratios maintained whether the sites had been laser graded (M6) or was established (M7) (
Table 4). The results seem to support the previously mentioned dilution effect of organic P through the soil profile.
4.2.2. Moisture Variations
Moisture is a factor which may impact on soil P speciation and organic P composition. Moisture has been shown to increase organic P forms in soil [
23]. For example, an increase in diester P and, indeed, other organic P components have been linked to increased moisture and acidic pH [
23]. This may be due to lower decomposition rates and/or decreased microbial biomass. However, another study has shown a positive correlation with increased microbial populations for pasture based soils [
23,
48]. Hence, the influences of microbial populations are still debatable due to variable results related to the heterogeneity of diester P [
23,
53].
Investigation of moisture inputs received by sampled sites showed a stark difference between the rainfall averages of the Maffra (582 mm) and the Warragul areas (1021 mm). Even though the Maffra area received only 57% of the average rainfall of Warragul, this is somewhat offset if not surpassed, due to all sites in the Maffra area receiving boarder-check (flood) irrigation as part of the MID. The timing of the irrigation applications may also be important as the irrigation season of the MID occurs annually between 15 August and 15 May, encompassing the Australian summer. Sampling for the Maffra area occurred during April 2007 and was towards the end of the regular irrigation season. Without intensive monitoring of moisture inputs at each individual site it is difficult to estimate the impact of soil hydration on the final results. This intensive and costly monitoring is outside the scope of the present study. Even so, there may be some correlation between the irrigated system (Maffra), with a relatively constant water supply, and the rain-fed system (Warragul). As moisture is known to increase soil organic P [
23] this may account for the much higher organic P (combined monester P and diester P) proportions found in sites in the Maffra area, averaging 37.5% compared with those in the Warragul area which averaged 31.1%.
Soil moisture may have also been a factor affecting sites within a sampled area. The Dermosols of sites W1 and W2 are located on a flood plain area and, as such, would be subjected to saturation and flooding during different seasonal events. However, this possibility was not deemed sufficient to class the soil as a hydrosol for the purpose of this study. Nevertheless, moisture may be considered an important factor for the organic P composition of soil from sites W1 and W2. In wetland soils, organic P has been shown to be predominant [
54,
55]. This may also account for the large difference in organic P concentration (combined monoester P and diester P) obtained for soil from Dermosol sites W1 and W2 (32.9% and 31.6%) compared to those from Ferrosol sites W3 and W4 (21.3% and 24.9%) under the same farm management. However, it is important to note that prior to sampling, both Warragul and Maffra areas were subjected to extended drought conditions (>3 years). For the period between 2002 and 2006 inclusive, the Warragul and Maffra areas received approximately 79% (ranging between 68% and 93%) and 78% (ranging between 61% and 90%) of the long term (>100 years) average rainfall respectively [
56]. Hence, it is unlikely that the Dermosol sites W1 and W2 were subject to normal soil flooding and saturation processes throughout the extended dry period. Nevertheless, the generally higher moisture content at these sites over an extended period may be sufficient to enable formation of higher organic P concentration than in the Ferrosol sites.
4.2.3. Soil pH
Soil pH is a very important consideration when evaluating the speciation of P in soil. This is due to the influence of pH on various factors including extractability of different P forms, microbial populations and organic material breakdown [
1,
23]. For example, in one study, acidic to neutral pH ranges of Spanish forest soil showed a negative correlation with monoester P concentrations [
57,
58]. Regardless of the extracting medium, pH does not appear to be drastically different between sites and sampled areas, as all soils measured were slightly acidic in nature, as indicated by the results given in
Table 2. For this reason, it was expected that the effect of these pH differences between sites would be minimal.
4.2.4. Slope and Elevation
The slope and elevation of the measured sampling sites were recorded to determine possible impact on the results obtained. In particular, it is known that the slope of a sampling site may impact on excess overland flow (surface water runoff) [
59] and can, in turn, influence P retention and/or transport. In south-eastern Australia and other temperate regions, surface runoff is considered the predominant pathway for P transport [
60,
61,
62].
Overall, the site slope and elevation appeared to have nominal impacts on the soil P concentrations and P speciation of the measured sites. However, if these observations are also reflected in P transport in surface runoff, further investigation would be needed. If slope and elevation differences exist, these appeared to be overshadowed by other variables, particularly area sampled, soil type, fertiliser input and timing. In fact, the differences between the area sampled, slope and elevation are inherently linked in this case. This is due to the Warragul area being found in rolling hills and the Maffra area of generally flat irrigation bays and topography. Hence, both average elevation and slope are clearly higher in the Warragul area (elevation 133 m; slope <5.9 m 100 m−1) compared to the Maffra area (elevation 36 m; slope <1.3 m 100 m−1).
5. Conclusions
The results obtained in this study indicate that soil type, fertiliser P application rate and timing, and moisture variations had significant influence on soil P measurements and P speciation by NMR analysis. The lowest soil P concentrations were found in soil samples from sites with no recent inorganic fertiliser P inputs and this correlated well with the observed signal intensities of the NMR spectra. Soils from Maffra area which received moisture from both rainfall and boarder-check (flood) irrigation had much higher organic P (combined monoester P and diester P) than those from the Warragul area. Whether this highlights the difference moisture may play in the formation of higher organic P component in soil is unclear and requires further detailed investigation. On the other hand, the soils from the Warragul area which received higher fertiliser P addition had much higher orthophosphate proportion (67.0% on average) and total P (2059 mg P kg−1 on average) than soils in the Maffra area (57.6% and 1822 mg P kg−1, respectively, on average) which received much less fertiliser P addition. Thus, highlighting the importance of application rate of fertiliser P in management practices applied to ensure optimum plant available P.
The soil type also had a major influence on soil P concentrations and speciation. On average, orthophosphate contributions were 5.5% lower in Dermosols compared to those of Ferrosols, and even lower (9.2%) when identical fertiliser P inputs and management strategies were employed. Even Sodosols were on average 14.7% lower in orthophosphate than Ferrosols. In contrast, the organic P (combined monoester P and diester P) proportion in Sodosols was on average 5.8% and 11.7% higher than those of Dermosols and Ferrosols, respectively. The pyrophosphate proportions were also generally higher in Sodosols than in Dermosols and Ferrosols. It is therefore recommended that more careful consideration must be given to soil type when undertaken or investigating management practices that are designed to assess and ensure optimum plant available P.
As only fourteen sampling sites were considered, the results reported in this study only provide a snapshot of a particular moment in time. Further sampling, in-depth monitoring and characterisation of different soils are necessary to enable more definitive links to be made between soil properties and site management variables.


