Abstract
Vibration power and amplitude are essential factors in ultrasonic drawing processes, especially for difficult-to-draw materials like titanium and its alloys. This paper presents a new composite power-superimposed ultrasonic vibrator for wire drawing which was driven by three separate ultrasonic transducers. The transducers were uniformly distributed around the circular cross section of the vibrator, with their axes along the radial direction and pointing to the center. The vibrator can concentrate the vibrational energy of multiple transducers and transform the radial vibration into a longitudinal vibrator because of the Poisson effect and therefore output larger vibration power and amplitude. In the paper, the four-terminal network method was used to establish the vibration equations of the vibrator. The FE model was established in ANSYS to investigate its characteristics under various excitation conditions. A prototype was manufactured and measurements were performed to verify the validation of FEA results. The results matched well with the theoretical results. It was found that the composite vibrator achieved an amplitude of about 40 μm when driven by square wave signals with 120° in phase difference, which implies a potential way of applying ultrasonic vibration to the processing of difficult-to-draw materials.
1. Introduction
Titanium and its alloys are used in aircraft, armor plating, naval ships, spacecraft, and missiles due to their high tensile strength to density ratio [1], high corrosion resistance [2], fatigue resistance, high crack resistance [3], and ability to withstand moderately high temperatures without creeping. However, they are also of high resistance, which make them difficult to machine, especially for the wire-drawing process. Conventional processing methods are involved, with complicated heat preparation, surface treatment and multiple vacuum annealing [4,5,6], which is neither energy-saving nor environmental friendly. In addition, they involve high wire breakage ratio, large contact or friction force, and poor surface quality [7]. Ultrasonic-vibration drawing, which applies ultrasonic vibration to the die axially or radially, contributes to the improvement of lubricant conditions, the softening of metals and the reduction of drawing force [8,9,10]. Therefore, it is promising to superimpose ultrasonic vibration in the process of titanium wire drawing.
In the previous studies, Blaha and Langenecker [11] firstly observed the “volume effect” of ultrasonic vibration during a static tensile test of zinc monocrystal. The phenomenon was similar to that of the thermal softening effect, with decreased yield stress and flow stress, and was more efficient [12]. Mori and Inoue [13] carried out the study to fabricate fine wires using the longitudinal ultrasonic-vibration drawing method. Murakawa et al. [14] carried out chlorine-free skin-pass drawing of stainless steel wires through the application of the radial direction ultrasonic-vibration drawing method. QI Haiqun et al. [15] carried out an oxygen-free brass wire drawing experiment on the LH-200/17 drawing machine at the approximate speed of practical production using an ultrasonic vibrator which can achieve a maximum amplitude of about 20 μm. The ultrasonic vibration reduced the drawing force by 7% and greatly improved the surface quality of the wire. He also developed a orthogonal composite ultrasonic-vibration system for titanium and titanium alloy wire drawing [16], but the surface quality was poor. Yang Chongqiu et al. [17] developed a new piezoelectric ceramic longitudinal-torsional composite ultrasonic vibrator with four uniform slant slits cut off at the end of the ultrasonic amplitude horn to transform the longitudinal ultrasonic vibration into a L & T composite motion. The torsional and longitudinal amplitude of the vibrator could reach 0.25° and 25 μm, respectively. He then applied it to titanium wire drawing, and it was proven that the new system could apparently reduce the drawing force, though at the sacrifice of surface quality due to its higher friction force within the contact area.
We attribute the cause of the difficulties in titanium wire drawing to the inadequate power intensity of ultrasonic vibration, considering the relatively high resistance of titanium and titanium alloy wires. Therefore, we intend to develop an ultrasonic system which can produce much greater longitudinal amplitude. However, it is impractical to develop an ultrasonic vibration system with a single ultrasonic transducer that can provide enough power for both the limitation of structural parameters and for that of the piezoceramic’s property. Thus, a power-superimposed vibration system was proposed with three ultrasonic transducers uniformly distributed along the disc, which acts as a component of the amplitude horn. The piezoceramic stacks were poled axially to transfer vibrational energy radially to the center of the disc. The disc will transform the radial vibration into longitudinal vibration due to the Poisson effect.
In order to study the characteristics of the ultrasonic vibrator, the frequency equation of the system was established using the four-terminal network method, and the finite element model was built in ANSYS. Based on the FE model, simulations of modal analysis, harmonic analysis as well as transient analysis were conducted under various excitation conditions and with different structural parameters. A prototype was manufactured and measured to verify the validation of theoretical and simulation results. The proposed vibrator has obvious advantages compared with the classic ultrasonic vibrators driven by a single transducer as it can concentrate the energy of multiple transducers and achieve much larger longitudinal amplitude (40 μm), which is beneficial in improving the efficiency of ultrasonic wire drawing, especially for difficult-to-draw materials like titanium. Furthermore, the number and the driving mode of the transducers can be adjusted freely to satisfy different requirements for resonant frequency and longitudinal amplitude.
2. Structure and Mathematical Model
2.1. Structure and Working Principle
In this section, a composite power-superimposed ultrasonic vibration system will be designed. Figure 1 shows the structure diagram of the composite vibrator, the frequency of which is assumed to be 21 kHz. It can be seen that the whole system is composed of three separate transducers and an energy concentrating structure. The latter is made up of four parts: discs 1 and 2 and rods 3 and 4. The concentrator structure, as a whole, was made from duralumin alloy 70A04. Table 1 shows the relevant structural sizes and material parameters.

Table 1.
Dimension and material parameters of power-superimposed ultrasonic vibrator.
| Dimension Parameters (mm) | Material Parameters (7A04) | |||||||
|---|---|---|---|---|---|---|---|---|
| L0 | L | L1 | R0 | R | E (N/mm2) | C (mm/s) | P (g/mm3) | v |
| 20 | 40 | 20 | 10 | 20 | 6.85 × 10⁻⁴ | 5.1 × 10⁶ | 2700 | 0.34 |

Figure 1.
Structure of the composite power-superimposed vibrator.
Figure 1.
Structure of the composite power-superimposed vibrator.
The transducers were uniformly installed surround the side area of disc 1 and could vibrate along the radial direction of the disc. As is shown in Figure 2a, each transducer was driven by four pieces of PZT that were compressed together under preload pressure. Any two adjacent PZTs have been polarized axially but along the opposite direction. In Figure 2b, the nodal section with zero displacement was used for fixation of the vibrator. It can be seen that the rear ends of the three transducers and rod 4 were fixed in the FE model. The disc will concentrate the longitudinal vibration energy of the transducers and produce radial deformation correspondingly. However, longitudinal deformation will occur at the same time because of the Poisson effect. Therefore, the composite power-superimposed vibrator can combine the effort of several transducers and exert much larger longitudinal vibration amplitude. In order to strengthen this effect, cylinder and cone shaped amplitude horns were combined organically to achieve a higher amplification ratio on the premise of a high quality factor.

Figure 2.
Polarization mode and constraint condition setting of the vibrator for FE analysis: (a) Polarization mode; (b) constraint condition setting.
Figure 2.
Polarization mode and constraint condition setting of the vibrator for FE analysis: (a) Polarization mode; (b) constraint condition setting.
2.2. Vibration Equations
In order to obtain the value of Rres and r0, the vibration equations of the ultrasonic vibration system should be established at first. Before this some assumptions have to be made to simplify the physical model. We assume that disc 1 vibrates radially, rods 3 and 4 vibrate longitudinally, while disc 2 vibrates both radially and longitudinally. The approximate vibration equation of the first part can be described as follows:
The approximate vibration equation of second part can be described as:
Similarly, the vibration equation of the rods would be:
where J1(Kpr) and Y1(Kpr) is the Bessel function, Ai (i = 1, 2, 3, 4) are constant, K1 = w/C1, C1 = (E/ρ)1/2, and the boundary conditions of the composite power-superimposed ultrasonic vibration system can be expressed as follows:
where
When the resonance frequency was set as 21 kHz, and r1 = 31.5 mm, T0 min = 70 mm, H = 35 mm, H1 = 100 mm, the variation between Rres and r0 could be obtained, as shown in Figure 3.
Figure 3.
Variation of Rres with r0.
Figure 3.
Variation of Rres with r0.

2.3. Amplification Ratio
According to Huang [18], any variable cross-section amplitude horn can be equivalent to a four-terminal network, as shown in Figure 4. The free vibration equations can be transformed to transport equations in the form of a transport matrix. As for the variable cross-section, such as a cylinder, cone, exponent surface, etc., the transport matrix was presented in the reference. For the left part of the node section, the transport equation is expressed by Equation (11).
Figure 4.
Equivalent four-terminal network of amplitude horn.
Figure 4.
Equivalent four-terminal network of amplitude horn.

The transport matrix is shown as follows:
where
where, , .
The speed ratio is calculated as follows:
We set the cylindrical coordinate system and simplified the energy concentrating structure to be composed of a rod and a disc, as is shown in Figure 5.
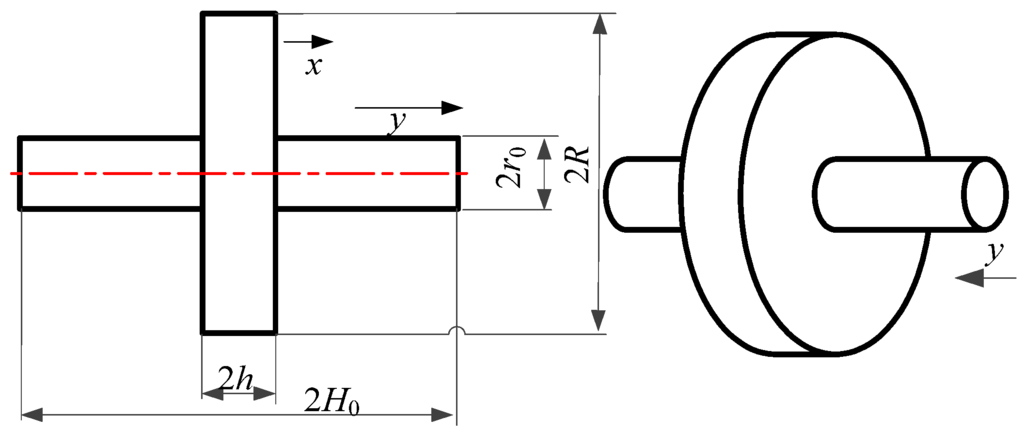
Figure 5.
Simplified model of energy concentrating structure.
Figure 5.
Simplified model of energy concentrating structure.

For the overlapping part:
For the other parts:
where
kp = w/Cp, Cp = [E/ρ(1-v2)]1/2 is the longitudinal wave velocity in the disc, Ji and Ni are Bessel functions of the first kind and second kind respectively. The boundary conditions are as follows:
Based on above equations, the amplification ratio is derived as follows:
Theoretically speaking, when the resonant frequency is 21 kHz, r1 = 31.5 mm, 2H = 100 mm, r0 = 3 mm, the amplification ratio of the amplitude horn can be calculated. However, the vibration amplitude does not equal that of the end point of the transducer, and the influence of the Poisson effect should not be neglected, so we still need to conduct FE simulation to get the amplification ratio of the whole vibration system.
3. Regulation Analysis of the Power-Superimposed Vibrator
3.1. Modal Analysis and Harmonic Analysis
In order to study the variation of the vibrator’s characteristic with structural parameters more precisely, FE models need to be built in the first step. Considering the complexity of the composite ultrasonic vibration system, the FE model was established by APDL command in ANSYS, as is shown in Figure 2. In the FE model, the PZTs were meshed with the SOLID 226 element, while the rest were meshed with the SOLID 186 element. The material of piezoelectric ceramic sheets is PZT8 and the material of the rear cover of the transducer is steel 45. The material for the rest parts of the vibrator is duralumin alloy 70A04, as mentioned. The rear ends of the transducers and the back end of the vibrator were constrained in all DOF. Through conducting the model analysis with a frequency range of 20–30 kHz, we determined the resonant frequencies and the corresponding vibration modes, the six lowest orders of which are shown in Table 2.
Table 2.
Resonant frequencies of the power-superimposed vibrator at the six lowest orders.
| Order | 1 | 2 | 3 | 4 | 5 | 6 |
|---|---|---|---|---|---|---|
| Frequency/Hz | 20,096 | 21,912 | 22,855 | 22,859 | 23,474 | 23,476 |
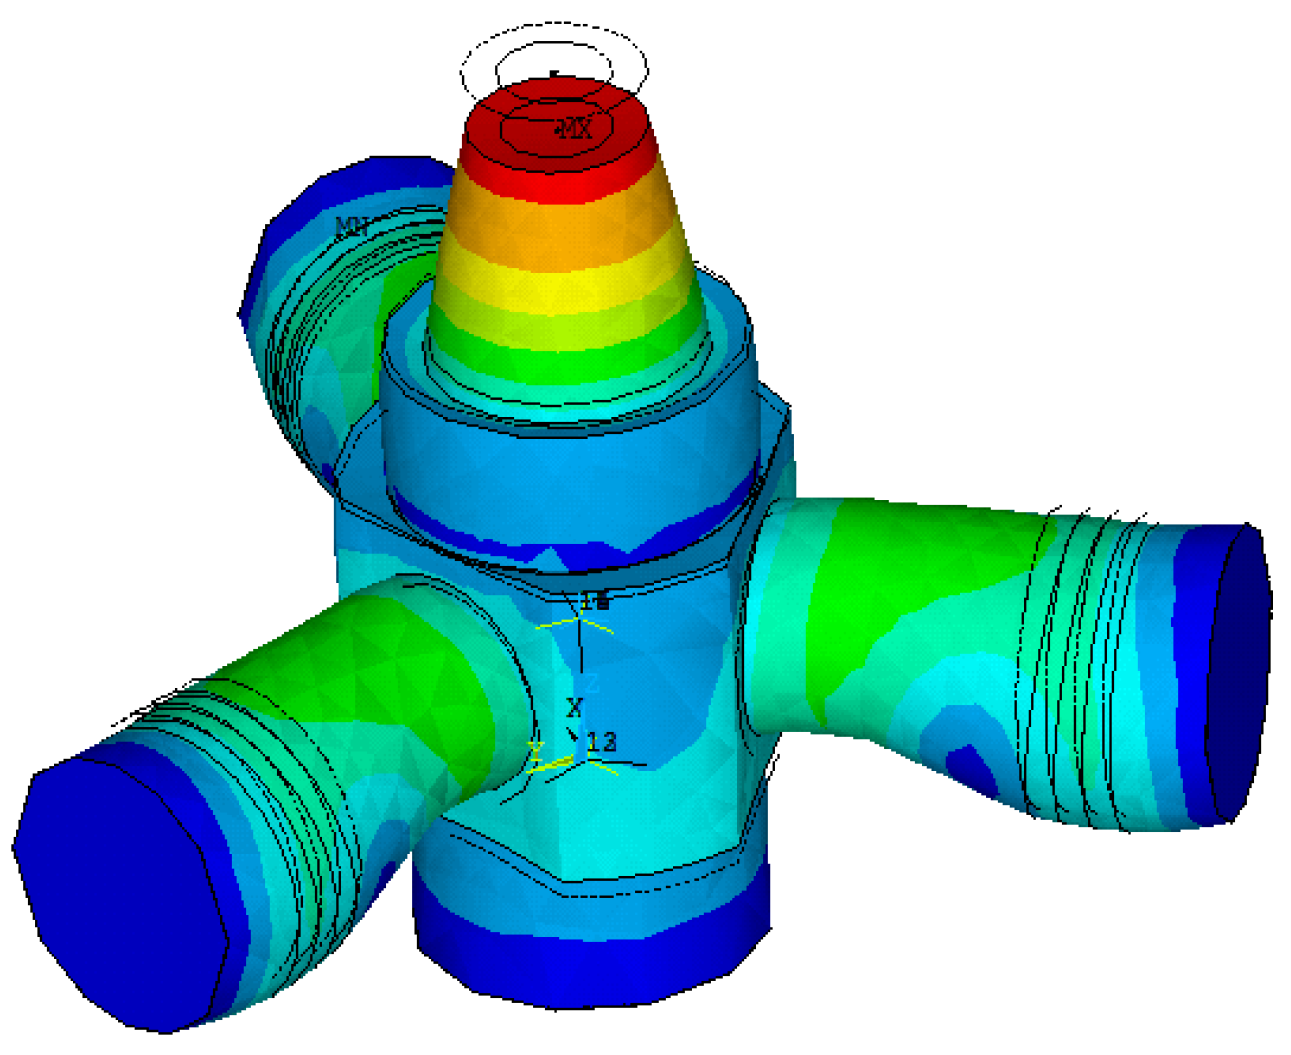
We can obtain the longitudinal mode of the composite vibrator at the frequency of 21911.5 Hz and the displacements at its top end are as shown in Figure 6. The stress contour also shows that the vibrator has mainly deformed in the longitudinal direction.

Figure 6.
Longitudinal mode of the vibrator at 21.9 kHz.
Figure 6.
Longitudinal mode of the vibrator at 21.9 kHz.
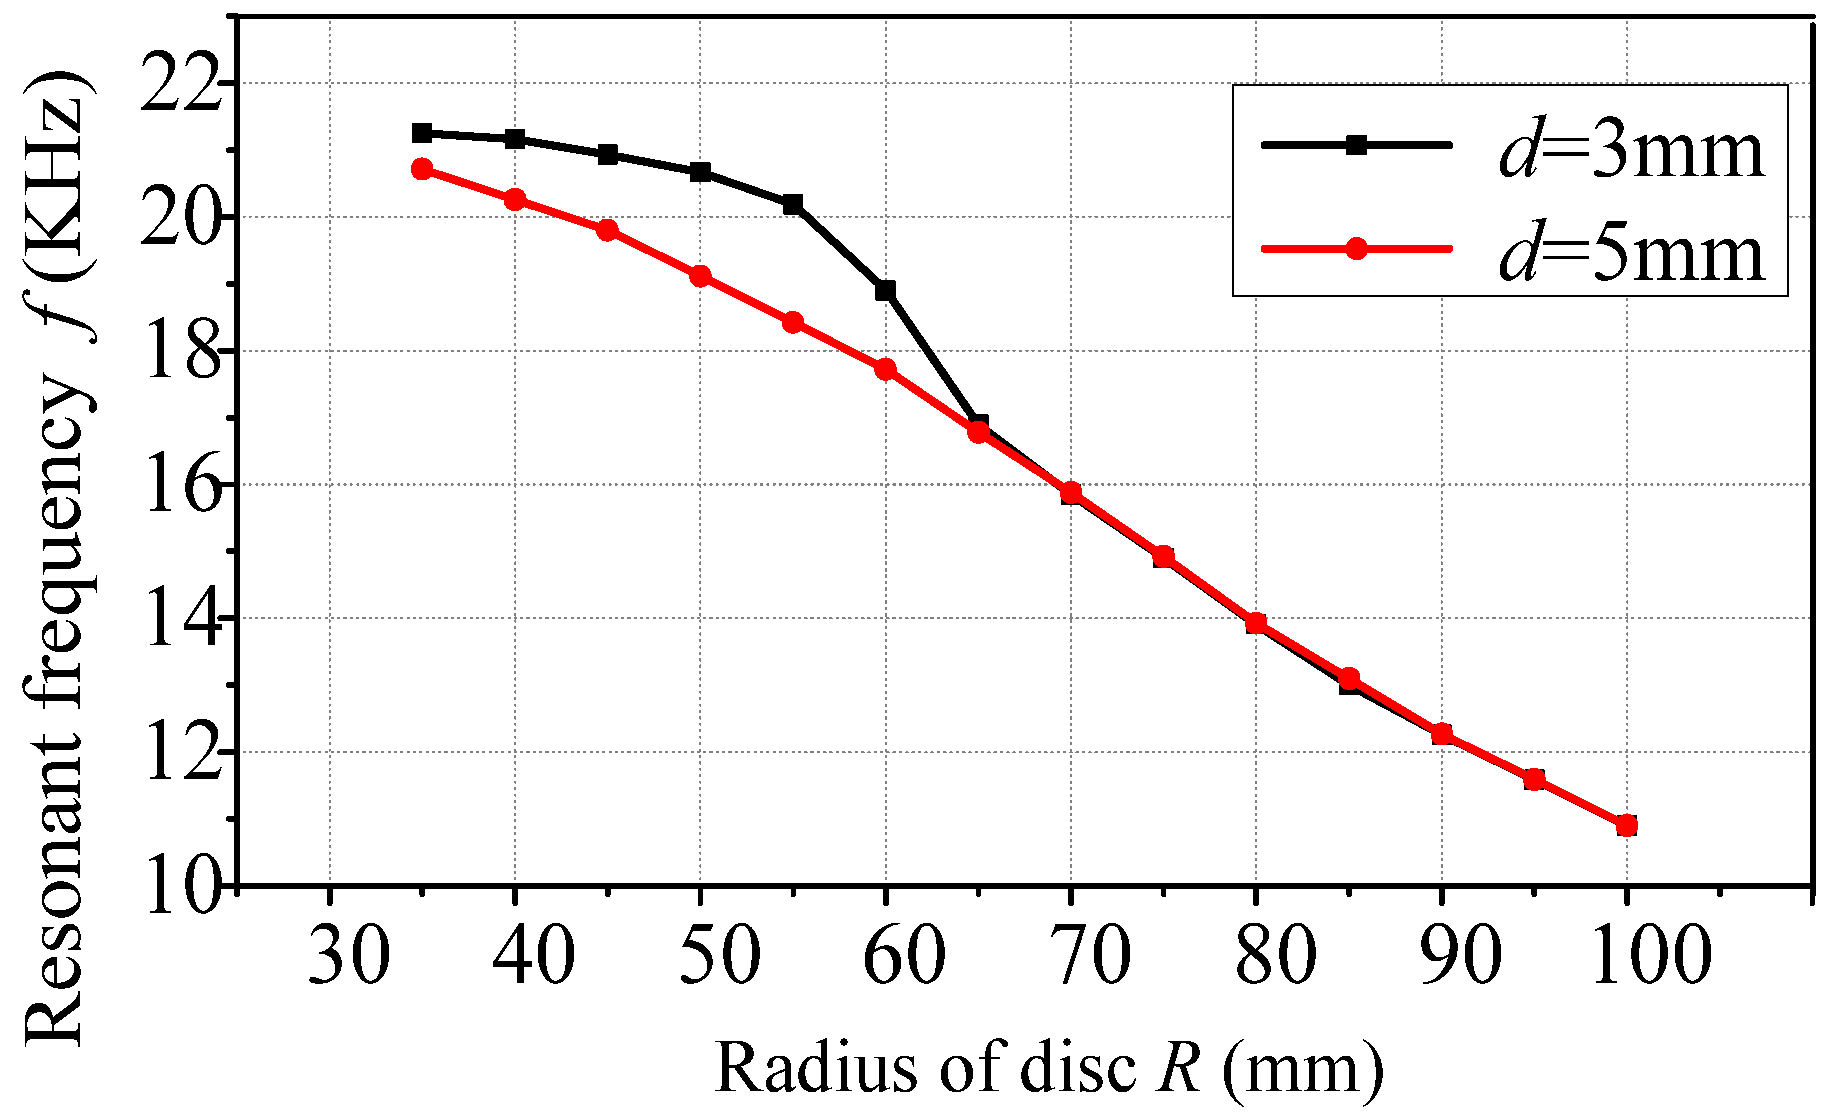
We also studied the influence of structural parameters on the inherent frequency of the composite power-superimposed vibration system. Figure 7 shows the various regulations of the vibrator’s inherent frequency along with the disc’s radius when the diameter of the inner bore d is Φ3 mm and Φ5 mm respectively. It can be seen that when the inner bore size remains unchanged, the resonant frequency decreases remarkably with the increase of the radial size of the disc. When the disc’s radius is less than 65 mm, the resonant frequency increases as the bore size decreases, but not significantly. Considering the convenience of manufacturing, the bore size was set to Φ5 mm.

Figure 7.
Variation of resonant frequency with the disc’s radius.
Figure 7.
Variation of resonant frequency with the disc’s radius.
In order to get the amplification ratio between the composite power-superimposed ultrasonic vibration system and the transducers, harmonic simulations were conducted on them. A voltage of 100 V and 21911 Hz was applied across the PZT ceramics. We can obtain the maximum amplitude of the longitudinal vibration at the end of the vibrator and the transducer respectively, as Figure 8a shows, and therefore calculate the amplification ratio between them. It can be seen that the amplitude reaches 401.1 μm, which is much larger than that of the transducers (40.9 μm). The amplitude factor can be as high as 9.83, which implies the excellent performance of the vibrator. The amplitude of the vibrator in the x and y direction are very small compared with that in longitudinal direction, as is shown in Figure 8b. It can be seen that the maximum values are 81 μm and 41 μm, respectively, and it occurs almost at an identical resonant frequency to that of the longitudinal vibration.
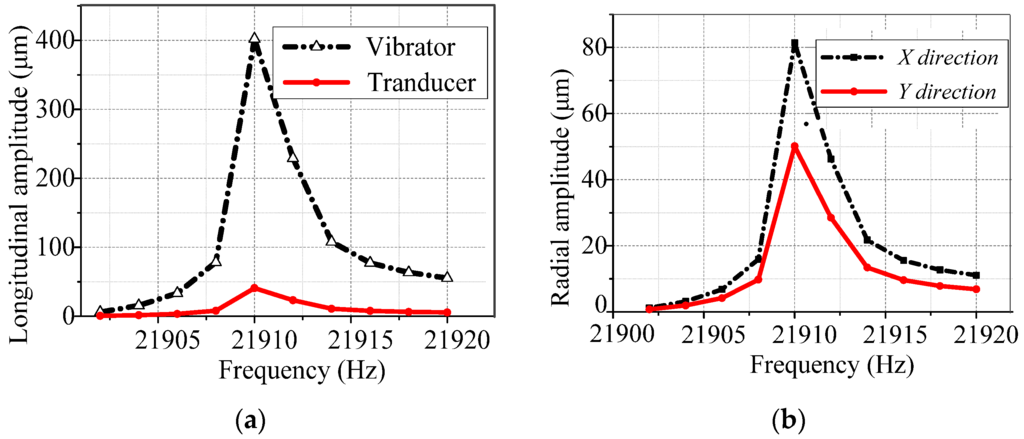
Figure 8.
Harmonic response of the power-superimposing vibration system. (a) Longitudinal amplitude vs. frequency of the vibrator and transducers. (b) Radial amplitude vs. frequency in X and Y directions.
Figure 8.
Harmonic response of the power-superimposing vibration system. (a) Longitudinal amplitude vs. frequency of the vibrator and transducers. (b) Radial amplitude vs. frequency in X and Y directions.

3.2. Transient Analysis and Driving Methods
Transient analysis is a good indicator of the actual working status of the composite vibrator. The maximum amplitudes and the corresponding amplification ratio of the vibration system during a short period can be obtained. In this paper, the vibrator was driven by three separate transducers, all of which have exactly the same configuration and are distributed uniformly around the disc. Therefore, we need to study the influences of the driving signals in terms of their forms and the phase difference between them. In this paper we mainly studied the occasions where the driving signal is a sinusoidal voltage or a square wave voltage with the same phase or with a phase difference of 120°.
When the same sinusoidal voltage was applied across the PZTs of the three transducers in the simulation, the longitudinal and radial amplitudes of the vibrator and the longitudinal amplitudes of the transducer at their top surfaces could be obtained. Figure 9 shows the relevant results within 0.8 ms during the simulation period. From Figure 9a we can see that the longitudinal amplitude of the vibrator is much larger than that of the transducer, being 21.78 μm and 5.13 μm, respectively. The amplification ratio is 4.25, which is very different from the result obtained in harmonic analysis. This might be caused by the phase of driving signals. Figure 9b shows the radial amplitude of the vibration, which is negligible with a maximum value of 1.26 μm. We tried to plot the movement trajectory of the point at the top surface, but it is chaotic.
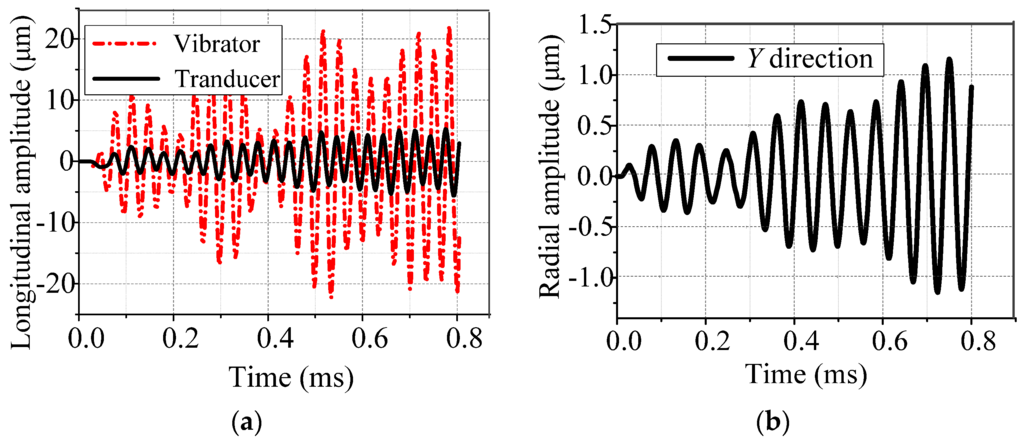
Figure 9.
Transient analysis of the power-superimposing vibration system driving by sinusoidal voltages without phase difference (a) Longitudinal amplitude of vibrator and transducers; (b) Radial amplitude in Y direction.
Figure 9.
Transient analysis of the power-superimposing vibration system driving by sinusoidal voltages without phase difference (a) Longitudinal amplitude of vibrator and transducers; (b) Radial amplitude in Y direction.

When sinusoidal voltages were applied with a phase difference of 120° between each other, the results are shown in Figure 10. It can be seen from Figure 10a that the longitudinal amplitude of the vibrator is still much larger than that of the transducer, at 43.75 μm and 5.37 μm, respectively. However, the amplification ratio has reached 8.15, which is really quite close to the result obtained in harmonic analysis. Therefore, it is better to apply sinusoidal voltages across the PZTs with an appropriate phase difference. Figure 10b shows the radial amplitudes of the vibrator in x and y directions with maximum values of 0.6 μm and 1.1 μm, which are negligible compared with that of longitudinal amplitude.

Figure 10.
Transient analysis of the power-superimposing vibration system driving by sinusoidal voltages with a phase difference of 120° between each other. (a) Longitudinal amplitude of vibrator and transducers. (b) Radial amplitude in X and Y directions.
Figure 10.
Transient analysis of the power-superimposing vibration system driving by sinusoidal voltages with a phase difference of 120° between each other. (a) Longitudinal amplitude of vibrator and transducers. (b) Radial amplitude in X and Y directions.
The movement trajectory of the point at its top end in XY plan and XZ plan were also plotted, as shown in Figure 11, where Z presents the longitudinal direction and XY plan represents the radial directions. It can be found that the movement tracks of the points at the top end of the vibrator are ellipses, both in the XY plane and in XZ plane. Therefore, the contact points of the die and the titanium wire would have a similar movement trajectory, which means the composite vibrations of both longitudinal and radial direction were imposed on the drawing processes. According to references [16,19], both forms of vibration exert a strong influence on the drawing process, and the composite vibration can produce better effects, including drawing force reduction and improved surface quality.
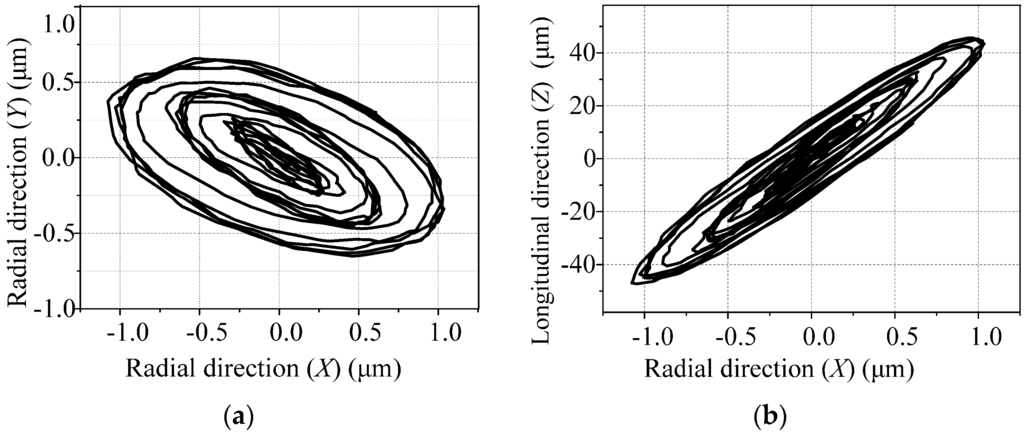
Figure 11.
Trajectory of the points at the top end of the power-superimposing vibrator driven by sinusoidal voltages with 120° difference in phase between each other. (a) Trajectory in XY plane. (b) Trajectory in XZ plane.
Figure 11.
Trajectory of the points at the top end of the power-superimposing vibrator driven by sinusoidal voltages with 120° difference in phase between each other. (a) Trajectory in XY plane. (b) Trajectory in XZ plane.

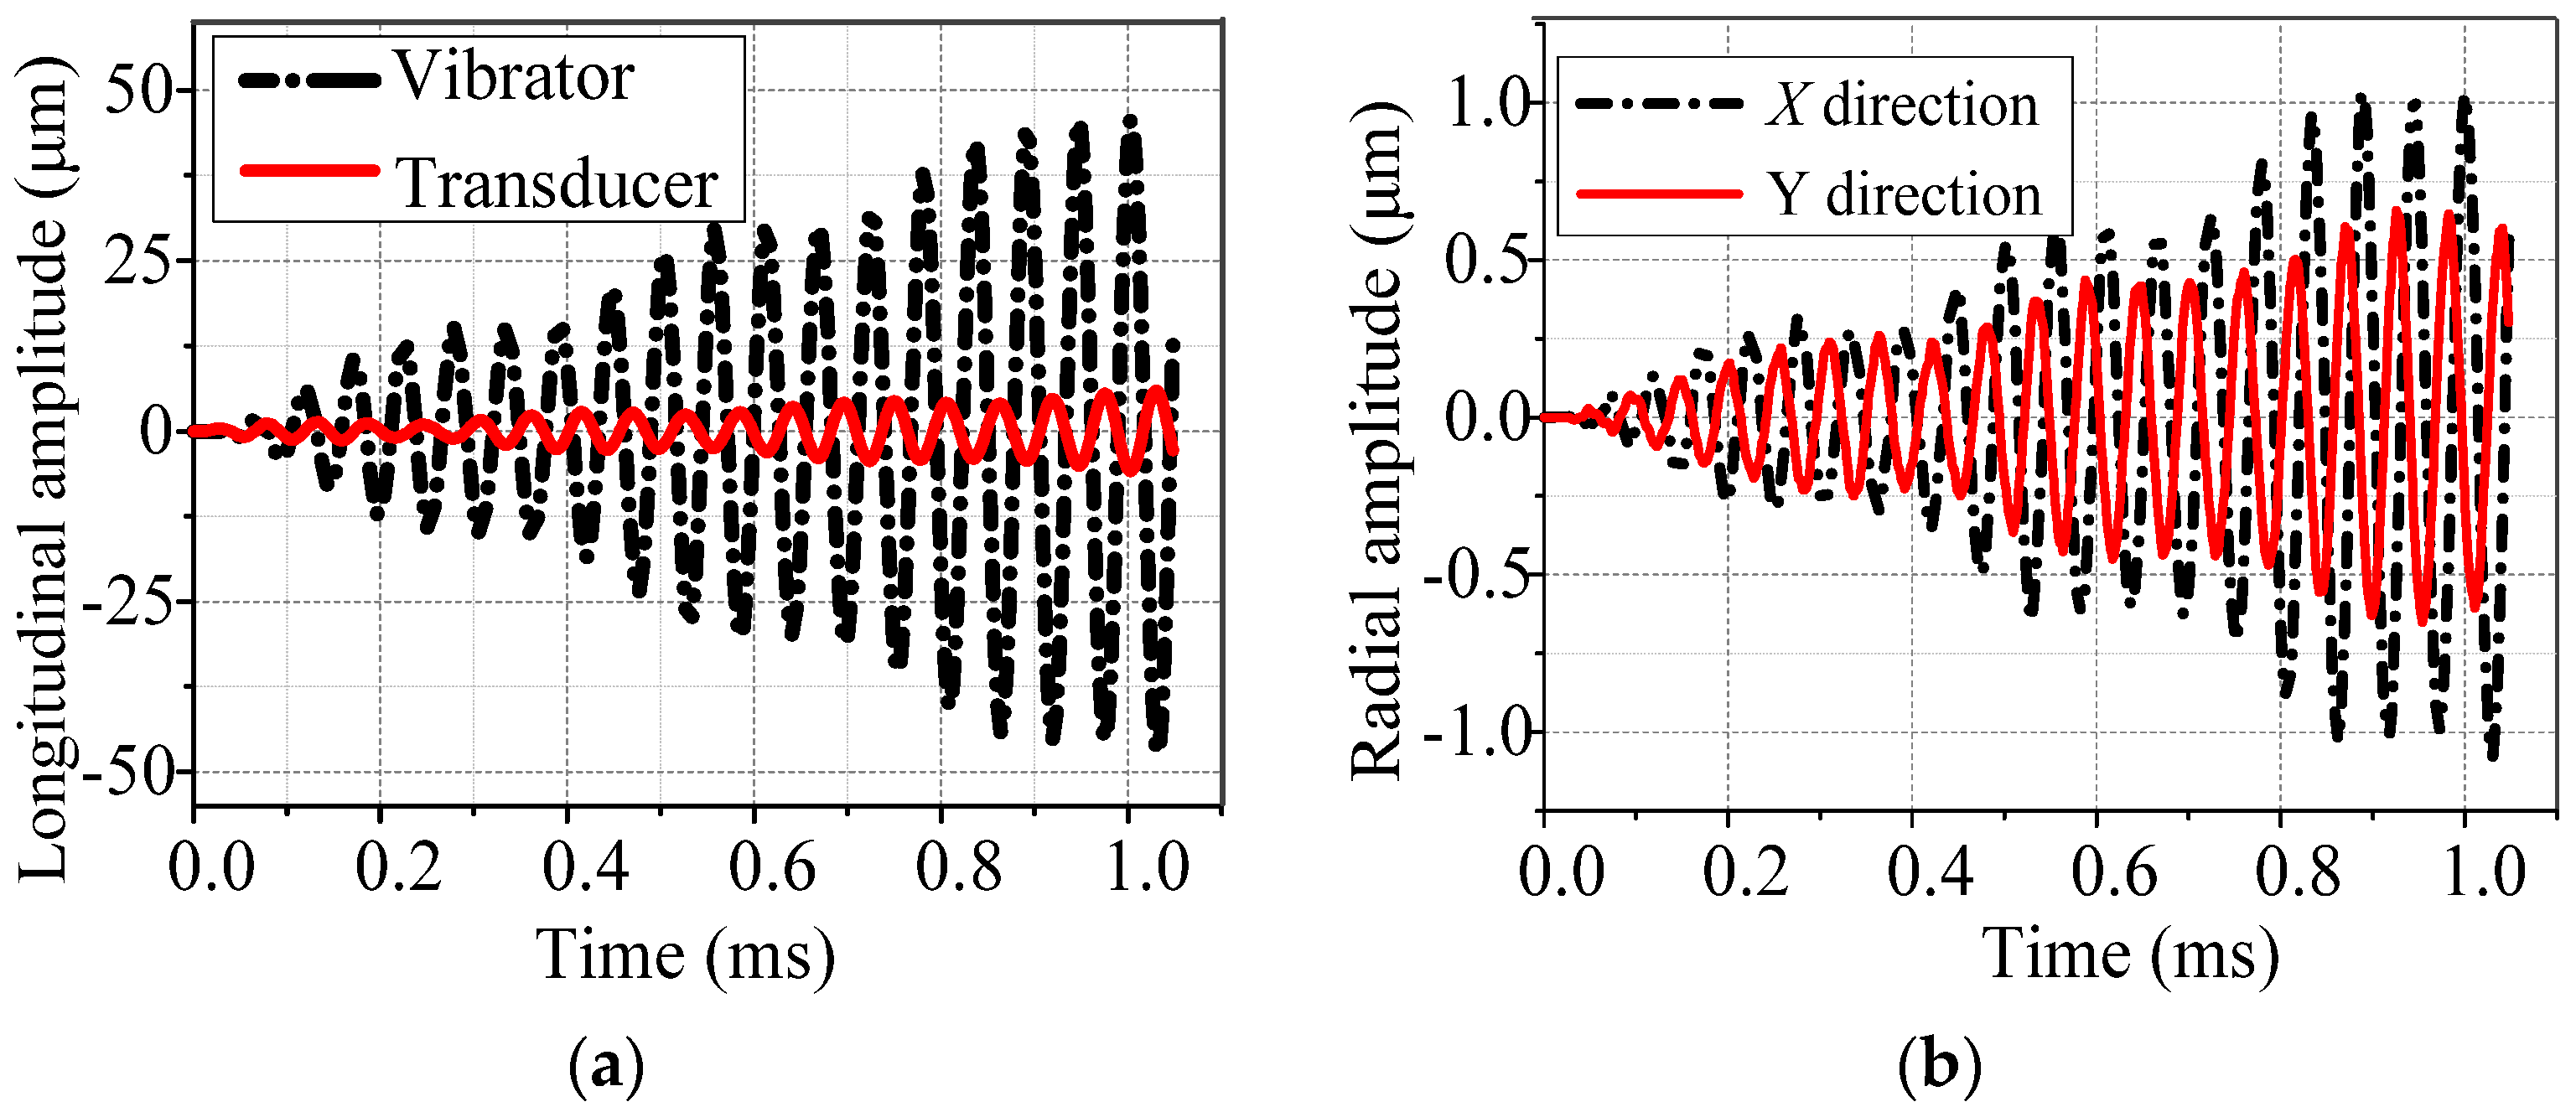
The transient simulation can be conducted by applying square wave voltages that have a 120° phase difference at both ends of the PZTs of the transducers. Similar results can be obtained, as shown in Figure 12. More specifically, the maximum magnitudes of the vibration system and the transducer are 45.92 μm and 5.48 μm, with an amplification ratio of 8.37. The radial amplitudes of the vibrator in the x and y directions are 2.4 μm and 3.6 μm.
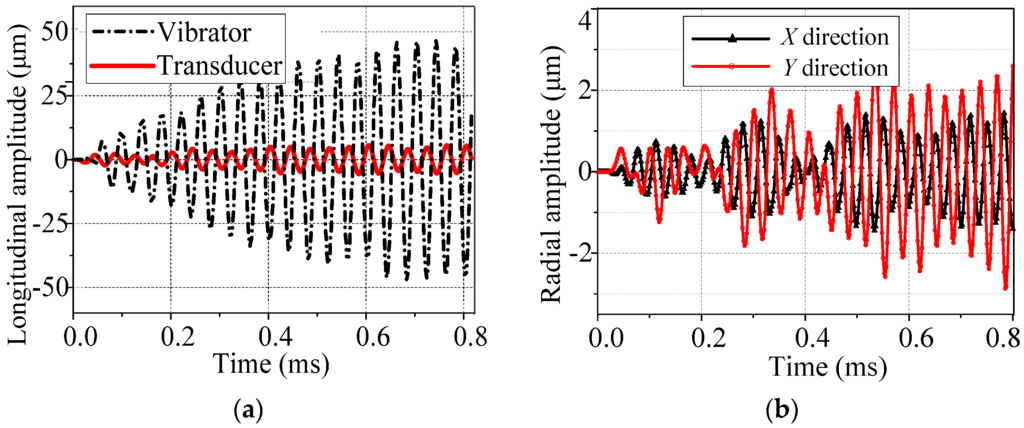
Figure 12.
Transient analysis of the power-superimposing vibration system driven by square wave voltages with a phase difference of 120°. (a) Longitudinal amplitude of vibrator and transducers. (b) Radial amplitude in X and Y directions.
Figure 12.
Transient analysis of the power-superimposing vibration system driven by square wave voltages with a phase difference of 120°. (a) Longitudinal amplitude of vibrator and transducers. (b) Radial amplitude in X and Y directions.

Based on the above analyses, it can be found that an appropriate phase difference is necessary to realize greater amplitude. Compared with sinusoidal signals with the same effective value of 100V, the square wave signal can achieve a slightly higher amplification (4%). We can conclude that, under the driving voltage of 100V in effective value and 120° in phase difference, the power-superimposed vibration system can achieve a longitudinal amplitude of about 45 μm, which is quite beneficial for wire drawing.
4. Fabrication and Measurement
A prototype of the composite power-superimposed vibrator and the clamping device for it were manufactured, the assembly of which is shown in Figure 13a. An impedance test appliance HP4294A was used to obtain the resonance frequency and impedance characteristics, the results of which are shown in Figure 13b. The error in the resonance frequency between the test and the above simulation is mainly attributed to the machining tolerance, offset characteristics of PZTs, and the conductivity of the glue. In addition, in terms of series matching for ultrasonic power, the vibrator resonates at the lowest point of the impedance curve with a negative phase angle, which means an extra inductance is needed to be cascaded in the circuit.
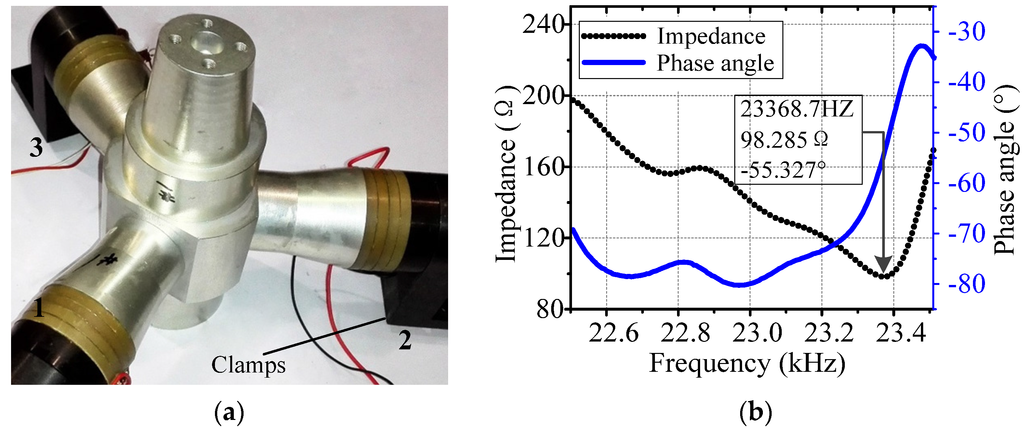
Figure 13.
Assembled manufactured power-superimposed vibrator and its impedance test results. (a) Assembled manufactured vibrator. (b) Impedance test results.
Figure 13.
Assembled manufactured power-superimposed vibrator and its impedance test results. (a) Assembled manufactured vibrator. (b) Impedance test results.

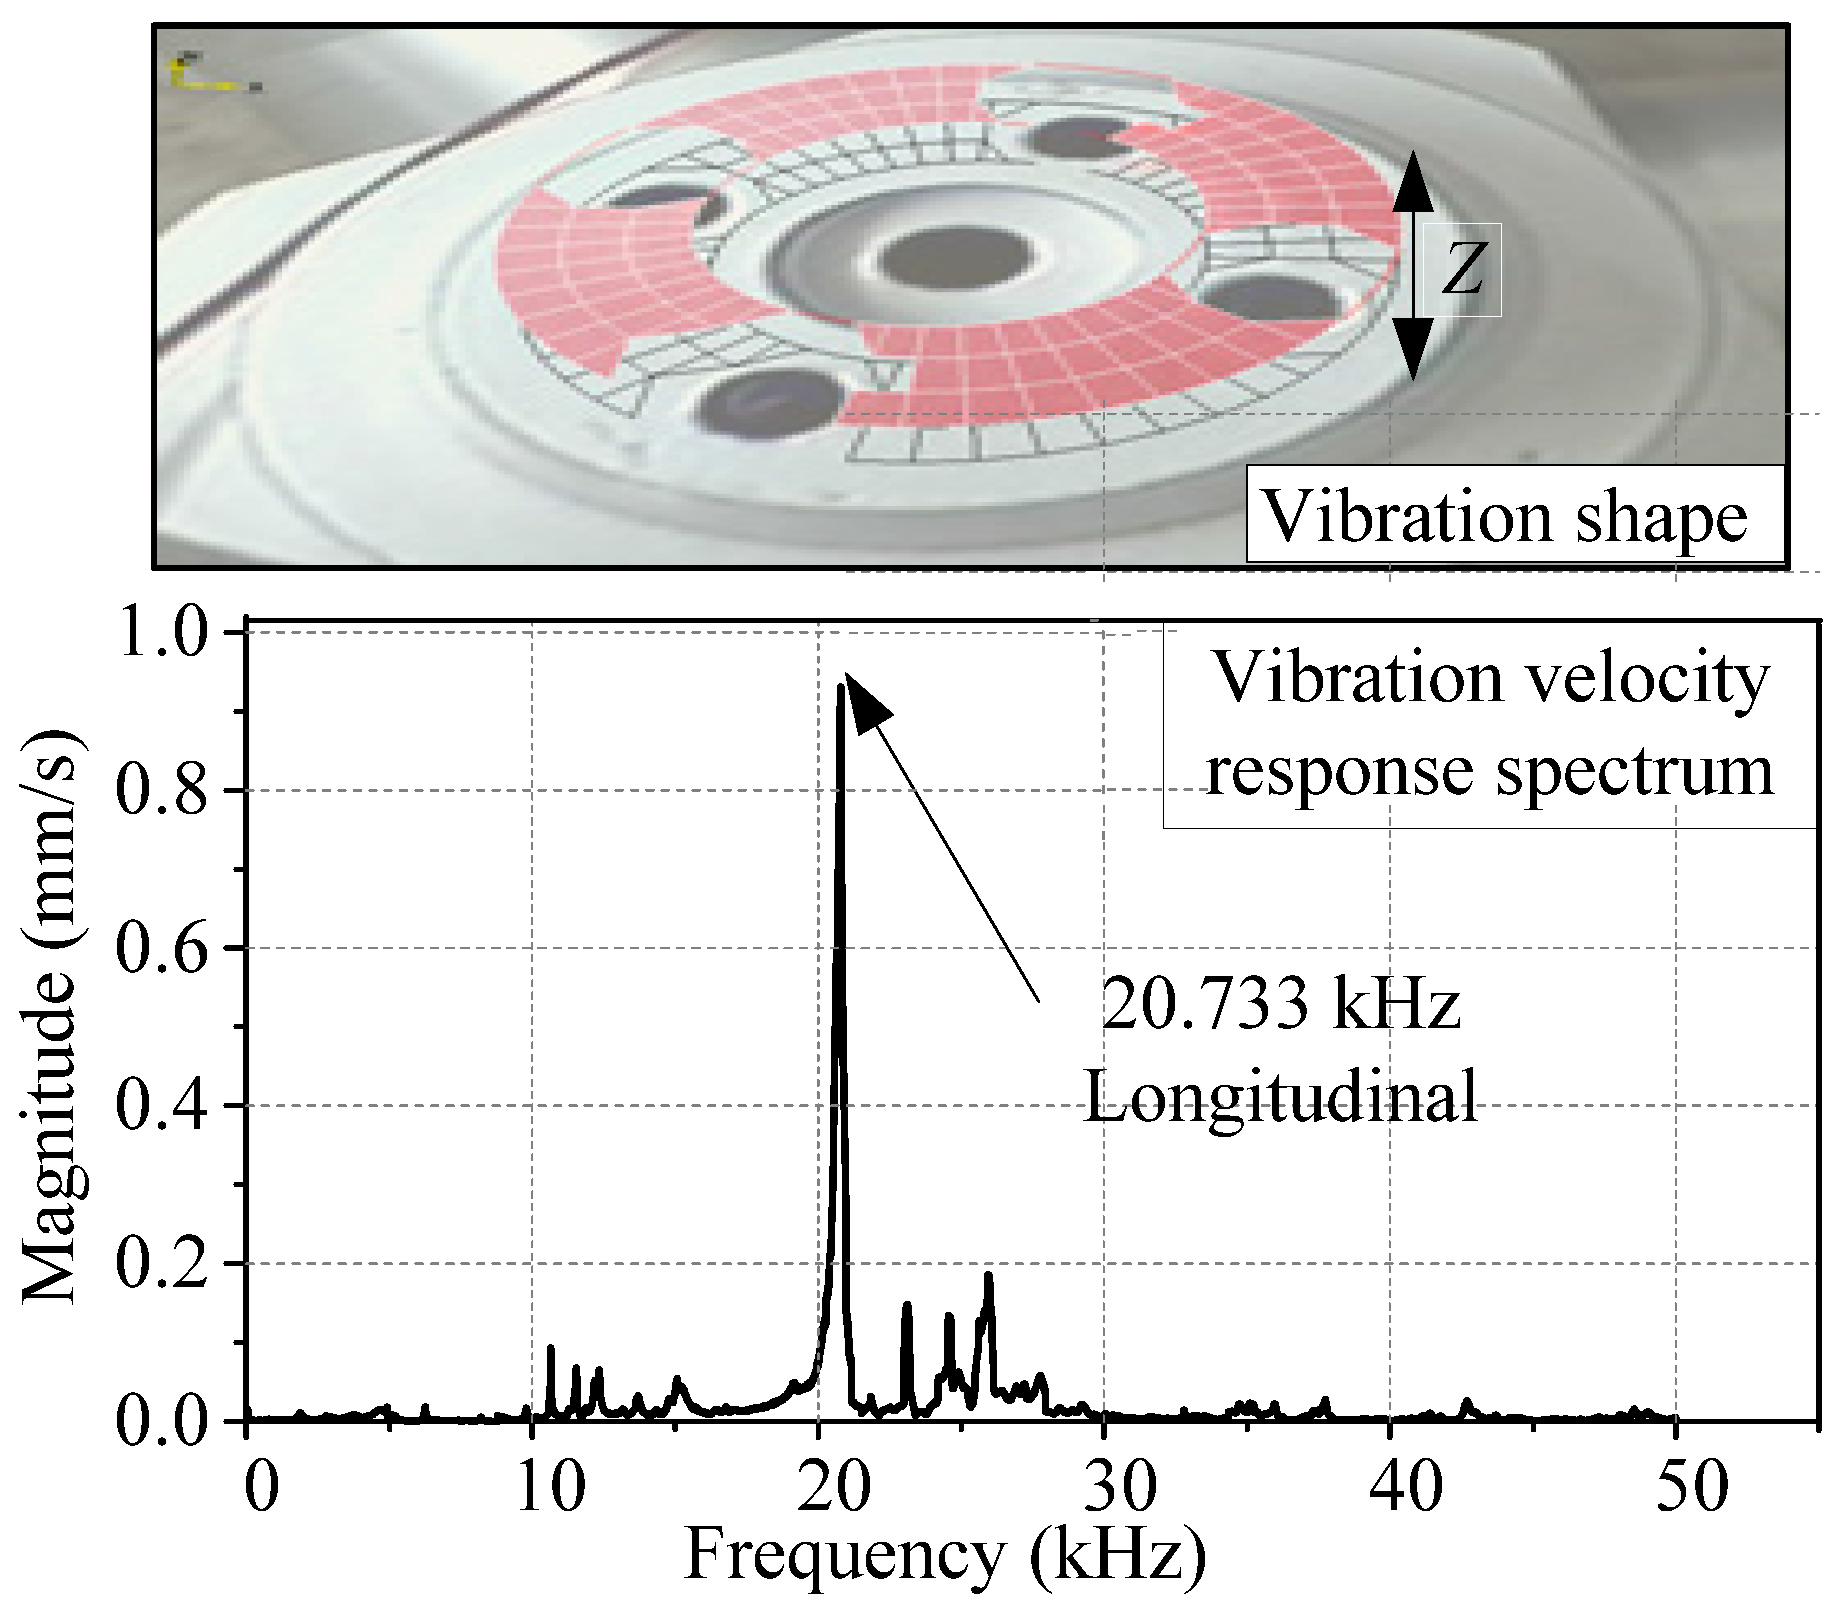
A Polytec PSV-400-M2 scanning laser vibrometer was applied to obtain the vibration mode with the matched inductance, as is shown in Figure 14. The measurement results shown in Figure 15 presents the longitudinal vibration mode. By scanning the front end with a circular point array, and turning on 200 V voltages, the front end vibrates up and down at the resonance frequency point of 20.773 kHz, with a longitudinal vibration speed of about 0.9 mm/s. There are certainly other modes to choose from, such as the bending mode and the longitudinal-bending composite mode occurring at 23.117 kHz and 24.594 kHz, respectively; however, the amplitude is too small for practical application in wire drawing.
The actual greatest amplitude of longitudinal vibration can be measured using a micrometer gauge. By changing the output frequency of the ultrasonic power supply, the best working frequency can be easily found out. The maximum vibration amplitude is 40 μm, where the frequency is 20.837 kHz, which matches well with the simulation and the measurement. The errors between the simulation results and the measurement can be caused by many factors, but the different boundary conditions may exert the most significant influences.
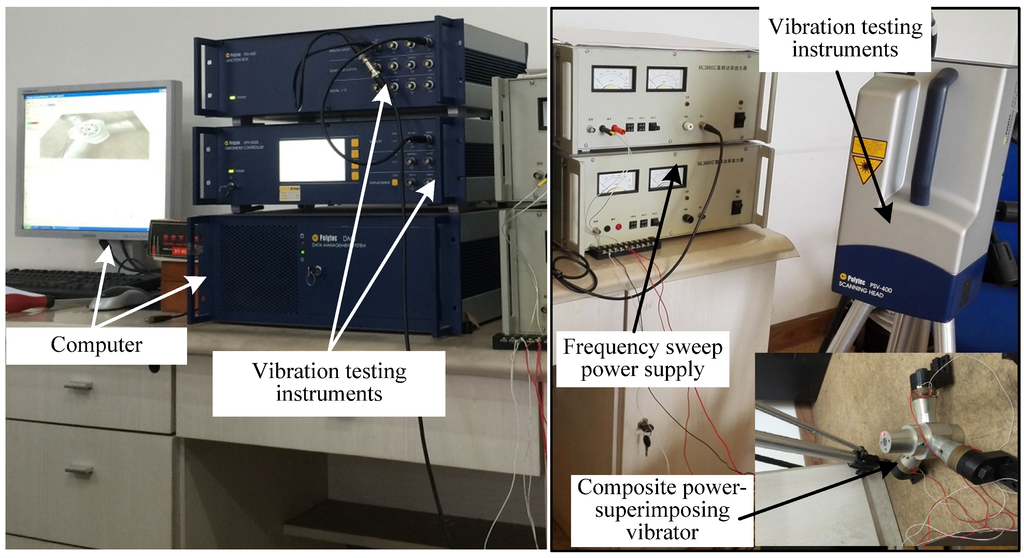
Figure 14.
Vibration measurement system.
Figure 14.
Vibration measurement system.

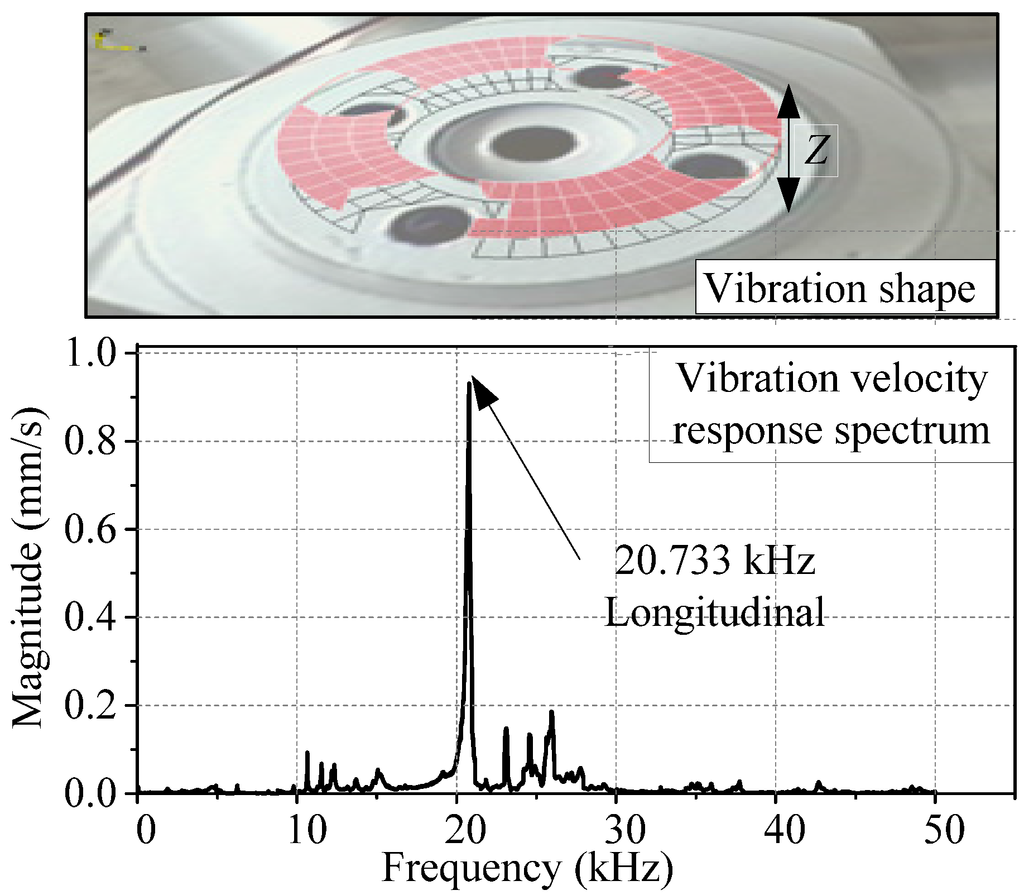
Figure 15.
Vibration measurement result of composite power-superimposing vibrator.
Figure 15.
Vibration measurement result of composite power-superimposing vibrator.
5. Conclusions
A composite power-superimposed ultrasonic vibrator driven by three independent transducers was analyzed and tested. It can concentrate the vibration energy of multiple transducers and exert greater longitudinal amplitude. The power and amplitude can be improved easily by installing more transducers as long as the side area of the disc is sufficient. FE simulations were conducted to study the influence of structural parameters and driving methods. It was found that the resonant frequency will clearly decrease with the increment of the disc’s radius while not being noticeably affected by the diameter of the inner bore. The vibrator can achieve a maximum longitudinal amplitude of 45.92 μm when driven by square wave signals with 120° of phase difference, which is almost twice the corresponding results announced by Qi [15,16] and Yang [17,19]. The amplitude is about 8.15 times as high as the amplitude of the separate transducer, which means the vibrator performs well in concentrating the vibrational energy of the three transducers. Based on the result, a prototype was manufactured and measured. It shows that the vibrator can output a maximum amplitude of about 40 μm when the frequency of the driving signal is 20.837 kHz, which matched well with the simulation results. The amplitude is also greater when compared with previous studies. This paper implied a potential method for applying ultrasonic vibration to the processing of difficult-to-draw materials more efficiently.
Acknowledgments
This project is supported by the National Natural Science Foundation of China (No. 51575130), Postdoctoral Scientific Research Staring Foundation of Heilongjiang Province (Grand No. LBH-Q12092).
Author Contributions
All authors conceived and designed the experiments and analyzed the data; Shen Liu and Kai Guo carried out the FEM analysis and performed the experiments; all authors contributed to the writing of the paper.
Conflicts of Interest
The authors declare no conflict of interest.
References
- Parris, W.; Rosenberg, H.W. High Strength Titanium Alloys. U.S. Patent 3,802,877, 1974. [Google Scholar]
- Lide, D.R. Handbook of chemistry and physics, 83rd ed.; CRC Press: Boca Raton, FL, USA, 2002; p. 504. [Google Scholar]
- Moiseyev, V.N. Titanium Alloys: Russian Aircraft and Aerospace Applications; CRC Press: Boca Raton, FL, USA, 2005. [Google Scholar]
- Tang, L.; Du, Y. Experimental study on green electrical discharge machining in tap water of Ti-6Al-4V and parameters optimization. Int. J. Adv. Manuf. Technol. 2014, 70, 469–475. [Google Scholar] [CrossRef]
- Ma, J.; Andrus, P.; Condoor, S.; Lei, S. Numerical investigation of effects of cutting conditions and cooling schemes on tool performance in up milling of Ti-6Al-4V alloy. Int. J. Adv. Manuf. Technol. 2015, 78, 361–383. [Google Scholar] [CrossRef]
- Kumar, J.; Khamba, J. Modeling the material removal rate in ultrasonic machining of titanium using dimensional analysis. Int. J. Adv. Manuf. Technol. 2010, 48, 103–119. [Google Scholar] [CrossRef]
- Siegert, K.; Möck, A. Wire drawing with ultrasonically oscillating dies. J. Mater. Process. Technol. 1996, 60, 657–660. [Google Scholar] [CrossRef]
- Yao, Z.; Kim, G.Y.; Faidley, L.; Zou, Q.; Mei, D.; Chen, Z. Effects of superimposed high-frequency vibration on deformation of aluminum in micro/meso-scale upsetting. J. Mater. Process. Technol. 2012, 212, 640–646. [Google Scholar] [CrossRef]
- Siddiq, A.; El Sayed, T. Ultrasonic-assisted manufacturing processes: Variational model and numerical simulations. Ultrasonics 2012, 52, 521–529. [Google Scholar] [CrossRef] [PubMed]
- Liu, J.W.; Baek, D.K.; Ko, T.J. Chipping minimization in drilling ceramic materials with rotary ultrasonic machining. Int. J. Adv. Manuf. Technol. 2014, 72, 1527–1535. [Google Scholar] [CrossRef]
- Blaha, F.; Langenecker, B. Tensile deformation of zinc crystal under ultrasonic vibration. Naturwissenschaften 1955, 42, 556. [Google Scholar] [CrossRef]
- Siddiq, A.; El Sayed, T. Acoustic softening in metals during ultrasonic assisted deformation via cp-fem. Mater. Lett. 2011, 65, 356–359. [Google Scholar] [CrossRef]
- Mori, E.; Inoue, M. Effects of drawing speed and backward tension application of ultrasonic vibration to metal wire drawing (2nd report). J. JSTP 1970, 11, 144. [Google Scholar]
- Murakawa, M.; Kaewtatip, P.; Jin, M. Skin pass wire drawing of stainless steel with chlorine-free lubricant with the aid of ultrasonic vibration. Trans. N. Am. Manuf. Res. Inst. SME 2000, 28, 75–80. [Google Scholar]
- Qi, H.; Shan, X.; Xie, T. Design and experiment of the high speed wire drawing with ultrasound. Chin. J. Mech. Eng. 2009, 4, 580–586. [Google Scholar] [CrossRef]
- Haiqun, Q.I.; Zhang, H.; Song, X.; Wang, L.; Yin, Z.; Shan, X. Experimental research of the wire drawing with composite ultrasonic vibration imposed by anti-pull. J. Harbin Eng. Univ. 2013, 34, 402–408. [Google Scholar]
- Yang, C.; Shan, X.; Xie, T. A new piezoelectric ceramic longitudinal-torsional composite ultrasonic vibrator for wire drawing. Ceram. Int. 2015, 41, S625–S630. [Google Scholar] [CrossRef]
- Huang, D. Design of vibration system for ultrasonic wave vibrator. J. Vib. Shock 2005, 24, 107–108. [Google Scholar]
- Yang, C.; Shan, X.; Xie, T. Titanium wire drawing with longitudinal-torsional composite ultrasonic vibration. Int. J. Adv. Manuf. Technol. 2015. [Google Scholar] [CrossRef]
© 2016 by the authors; licensee MDPI, Basel, Switzerland. This article is an open access article distributed under the terms and conditions of the Creative Commons by Attribution (CC-BY) license (http://creativecommons.org/licenses/by/4.0/).