Article

Dynamic Analysis of Jacket Substructure for Offshore Wind Turbine Generators under Extreme Environmental Conditions

1
Institute of Nuclear Energy Research, Taoyuan City 325, Taiwan
2
National Chin-Yi University of Technology, Taichung City 411, Taiwan
*
Author to whom correspondence should be addressed.
Appl. Sci. 2016, 6(10), 307; https://doi.org/10.3390/app6100307
Submission received: 12 April 2016 / Revised: 14 October 2016 / Accepted: 17 October 2016 / Published: 21 October 2016
(This article belongs to the Special Issue Selected Papers from the 2015 International Conference on Inventions)

Abstract

:
In order to develop dynamic analysis technologies regarding the design of offshore wind turbine generators (OWTGs), a special project called Offshore Code Comparison Collaboration Continuation (OC4) was conducted by IEA (International Energy Agency) in 2010. A similar project named INER-OC4 has been performed by the Institute of Nuclear Energy Research (INER) to develop the OWTG technologies of Taiwan. Since the jacket substructure will be applied to Taiwan OWTGs before 2020, the INER-OC4 project has been devoted to the design and analysis of jacket support structure. In this work, the preliminary result of INER-OC4 is presented. A simplified analysis procedure for jacket support structure has been proposed. Both of the NREL (National Renewable Energy Laboratory) 5 MW OWTG FAST model and OC4 jacket substructure model have been built and analyzed under severe design load cases (DLCs) of IEC (International Electrotechnical commission) 61400-3. Simulation results of six severe DLCs are performed in this work and the results are in agreement with the requirements of API (American Petroleum Institute) and NORSOK (Norwegian Petroleum Industry) standards.

Graphical Abstract

1. Introduction

Taiwan is a populous and mountainous island. The location for wind turbine generator (WTG) installation is therefore limited. On the contrary, wind fields over the sea are much more attractive than those that belong to land, both in terms of quantity and quality of the wind energy [1]. As a result, the development of OWTGs (offshore wind turbine generators) has received great attention worldwide in the past two decades. However, the design and installation of OWTGs is much more complex than those of onshore WTGs due to the operating environments. One of the most important issues is the design and analysis of OWTG support structure. Since the water depth, soil type, and wave condition are much different according to the OWTG installed location, various types of substructure designs have been proposed such as fixed-bottom monopiles, gravity bases, tripods, jacket-type and floating structures.
Due to the global demand for OWTGs, two special projects, Offshore Code Comparison Collaboration (OC3) and Offshore Code Comparison Collaboration Continuation (OC4), have been conducted by International Energy Agency (IEA) in 2005 and 2010, respectively. The goals of the two projects are to develop essential knowledge with respect to the OWTG design, for example, the mathematic model of OWTG system, the controller design, the dynamics of aerodynamic loading and support structure design, with the aid of transnational cooperation. Similar projects, namely INER-OC3 and INER-OC4, have been performed by the Institute of Nuclear Energy Research (INER) to develop the OWTG technologies of Taiwan. Since the jacket substructure will be applied to Taiwan OWTGs before 2020, the INER-OC4 project has been devoted to the design and analysis of jacket support structure.
Assessment of structural reliability for OWTGs is a challenging task. Estimation of the loading effect is necessary due to the large variability in environmental conditions. A method to estimate the failure probability for OWTG support structures has been proposed [2]. Both monopile and jacket support structure were investigated. The uncertainties of soil stiffness and aerodynamic damping are evaluated by Monte Carlo integration. According to the simulation results, the system reliability of monopile is highly determined by the environmental uncertainties while the jacket support structure is more robust against the uncertainties and modeling errors. A similar research for the calibration of safety factors and fatigue design factors for OWTG substructures was reported. A reliability-based approach and a probabilistic model have been proposed to evaluate the acceptable reliability level for fatigue failure of OWTG substructures [3]. Based on the WTG component design data quoted from global manufacturers in USA, Asia and Europe, towers, blades, the jacket foundation support structure and generators contribute to 25%–30%, 15%–26%, 15% and 7% of an OWTG cost, respectively [4]. Being one of the main cost components in a typical offshore wind project, the substructure cost generally increases with the water depth, due to the complexity of the structural design and manufacturing process, as well as the additional material cost [5,6]. A comparison study was conducted between a conventional four-legged and a newly-developed three-legged bottom fixed jacket substructure for OWTGs [7]. Fatigue and ultimate limit state analyses were performed to verify the efficacy of three-legged jacket substructure.
Offshore wind turbines are subject to combined wind and wave loading, which have to take into account for the structural assessment. An integrated analysis method for complex OWTG support structure under wind and wave loadings was proposed by Seidal et al. [8]. The calculation process is implemented with the aid of software Excel, ASAS and Flex 5. The idea of this integrated and sequential approach is to completely substitute the Flex 5 foundation module by a more complex model in ASAS (chosen for the “Offshore” part) while maintaining the general approach in Flex 5. This enables design calculations for both fatigue and extreme conditions without the need for a substitute monopile model. Design optimization of OWTG support structure is an expensive task, due to the highly-constrained, non-convex and nonlinear nature of the design problem. An analytical gradient-based method has been proposed by Chew et al. [9] to solve the dynamic constrained optimization problem of OWTG support structures. The design sensitivities of the objective and constraint functions are evaluated analytically while the optimization of the structure is performed, subject to sizing, eigenfrequency, extreme load and fatigue load constraints. This framework was validated using the numerical OC4 OWTG jacket model. Another work regarding the ship impact and influence of gravity loads, wind force, and soil stiffness has been reported in 2015 [10]. Numerical analyses focused on the force transfer between legs and braces have been illustrated. These simulation results were then employed to fix the hypotheses for the development of a simplified tool based on analytical formulations.
The current analysis methods for WTG system design can be divided into two types: Coupled and decoupled method. It can already be seen that WTG industry is moving forward to employ a more accurate partially or fully integrated approach for their detailed design and analysis of WTG systems. An integrated load analysis was proposed by Seidel and used successfully by REpower [
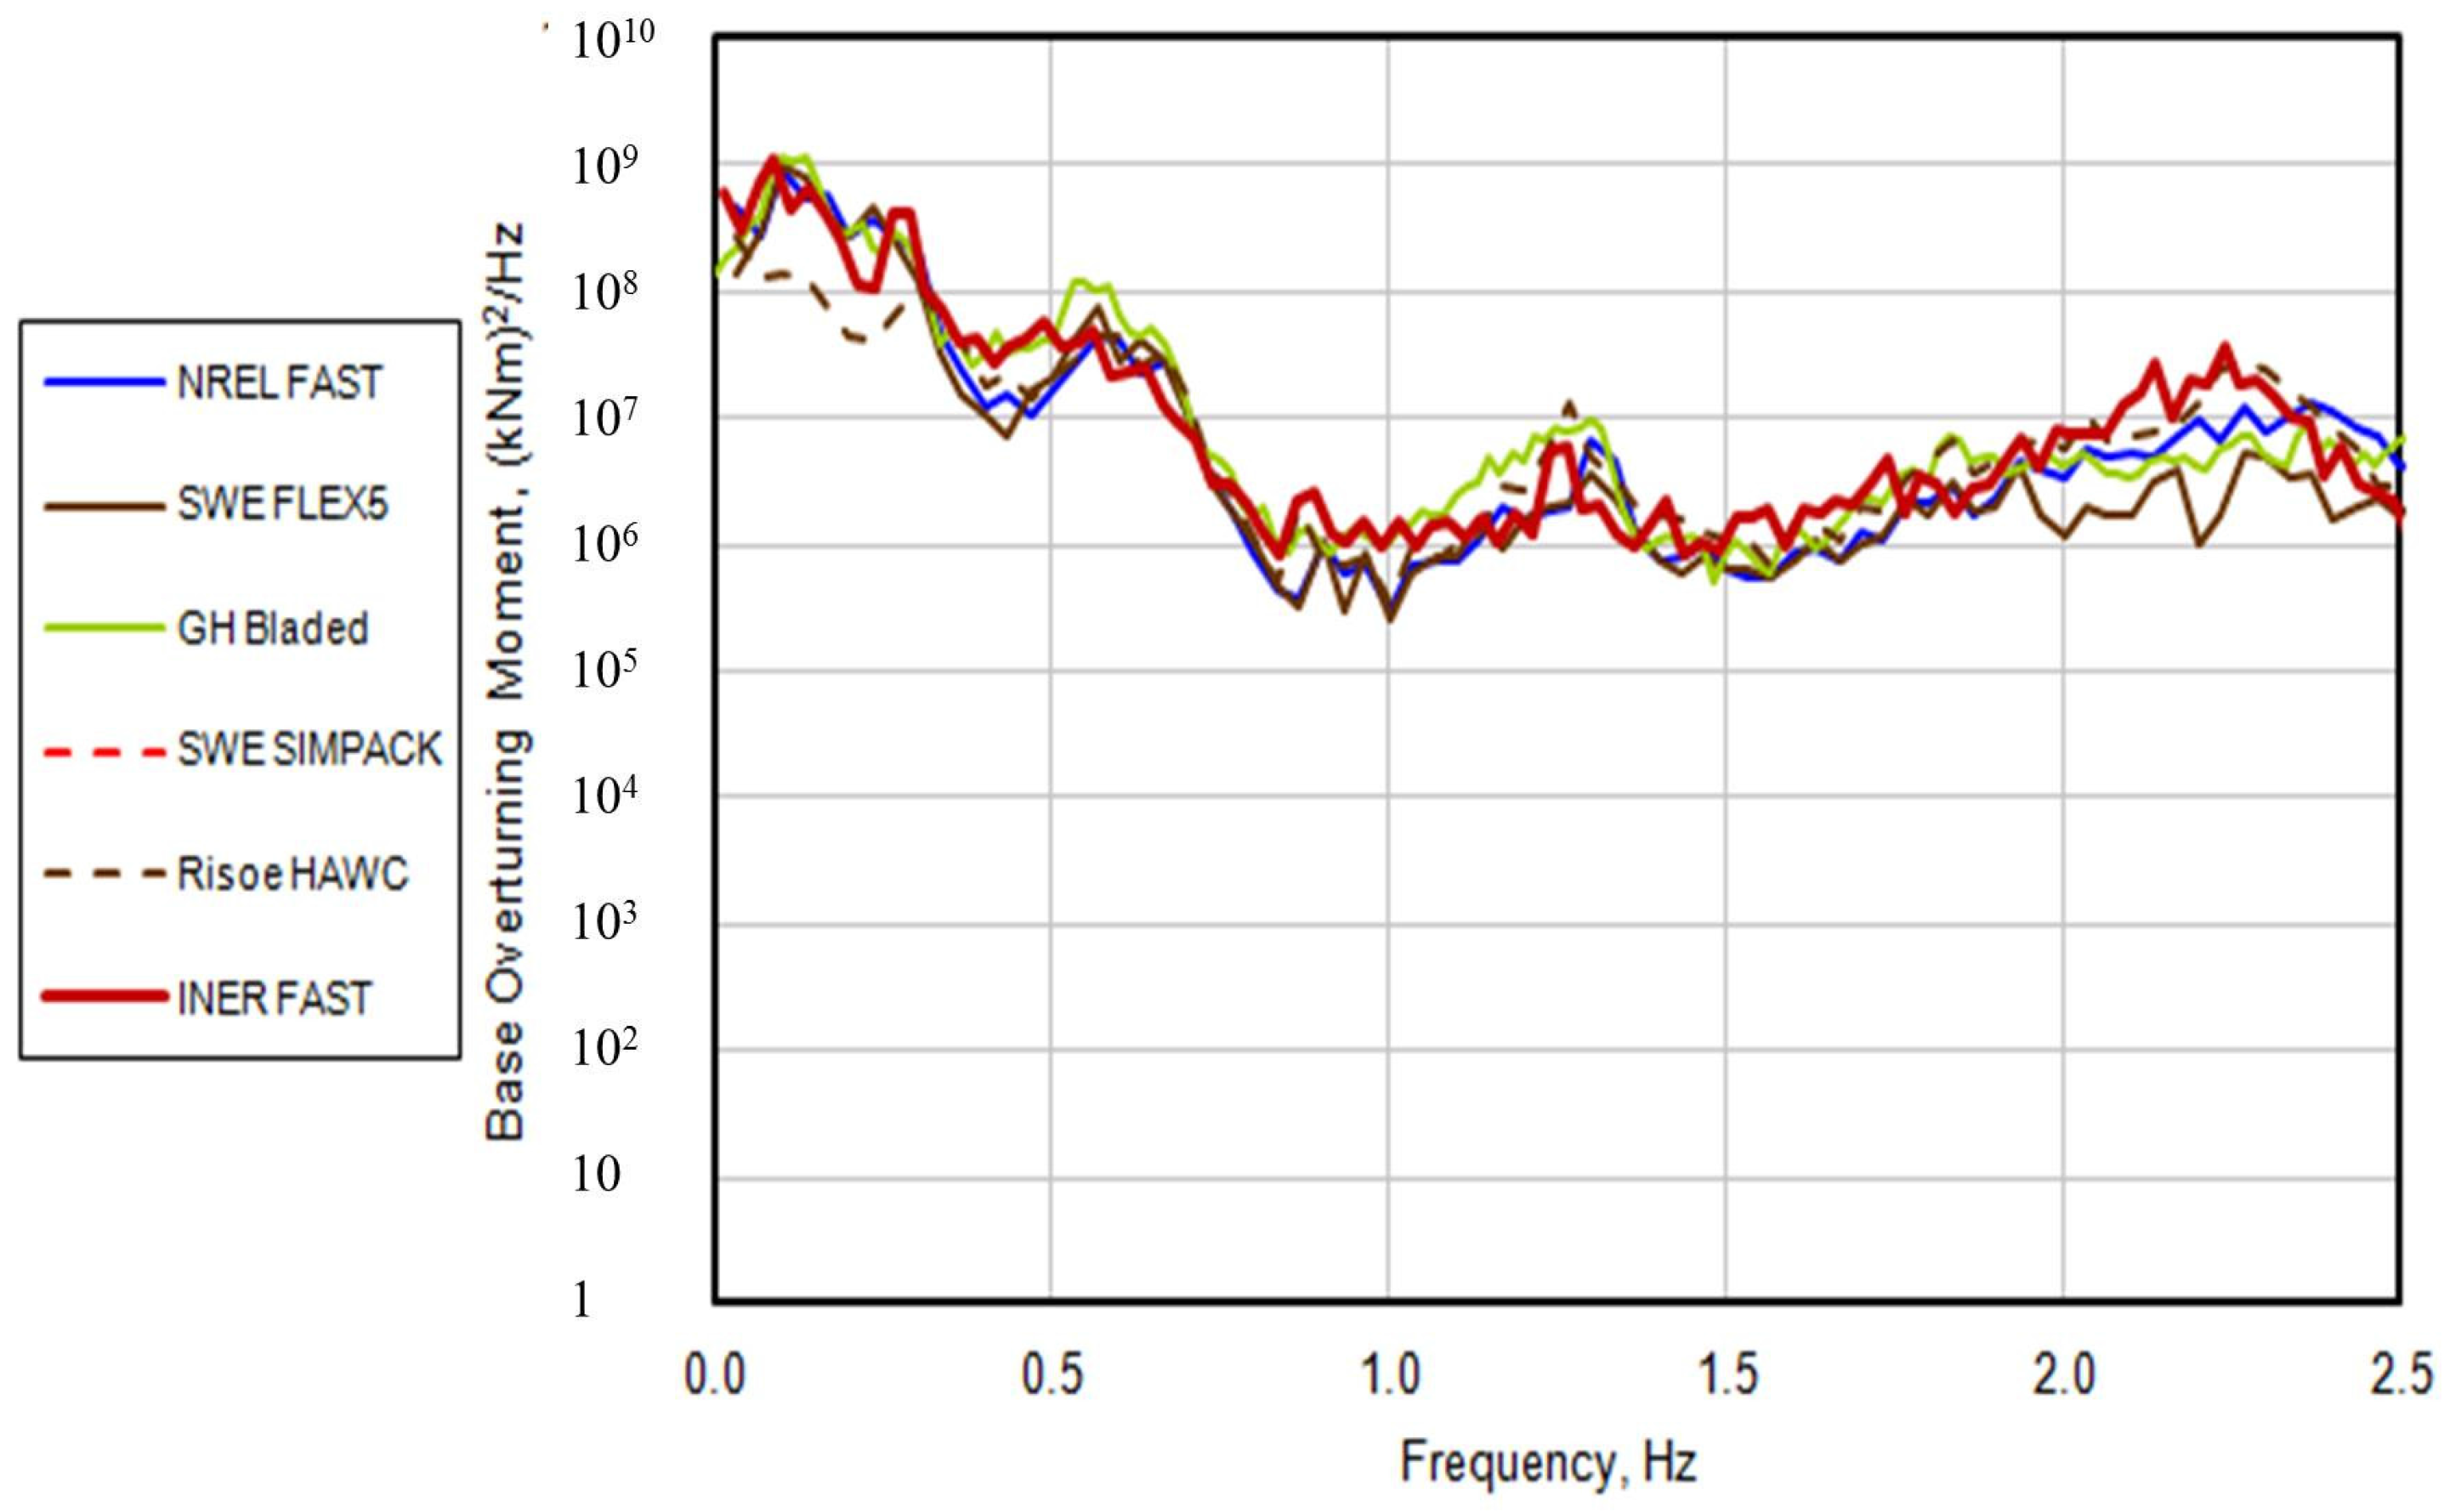
11]. The detailed design process of support structure, the integrated WTG model and the integrated load simulation method are all introduced in this paper. Another work regarding the dynamic responses of a jacket-type offshore wind turbine has been reported by Ong et al. [12]. The objective of this study is to evaluate the applicability of the computationally efficient linear decoupled model by comparing with the results obtained from the nonlinear coupled model. Numerical studies of dynamic response of the OC4 jacket-type offshore wind turbine using both linear decoupled and nonlinear coupled models have been carried out in that work. Comparisons between the linear decoupled models and nonlinear coupled model were evaluated through performing eigenfrequency analysis, a decay test, and dynamic simulations with only wave excitation and combined wind-wave conditions within the operational conditions of the OWTG. According to the results, the differences between the decoupled model and the coupled model are primarily due to the decoupling, not nonlinearity. The decoupled method can have significant impact on the accuracy of the structural analysis. However, this approach is still widely adopted in the WTG industry due to its simplicity to implement and efficiency. Since the development of offshore WTG system design in Taiwan is just conducted for few years, the decoupled method is helpful for the initial design phase.
Generally speaking, most of the current OWTG support structure designs are based on the recommendations by IEC (International Electrotechnical commission) 61400-3 [13], though there are many other design guidelines proposed such as those by DNV (Det Norske Veritas) [14] and GL (Germanischer Lloyd) [
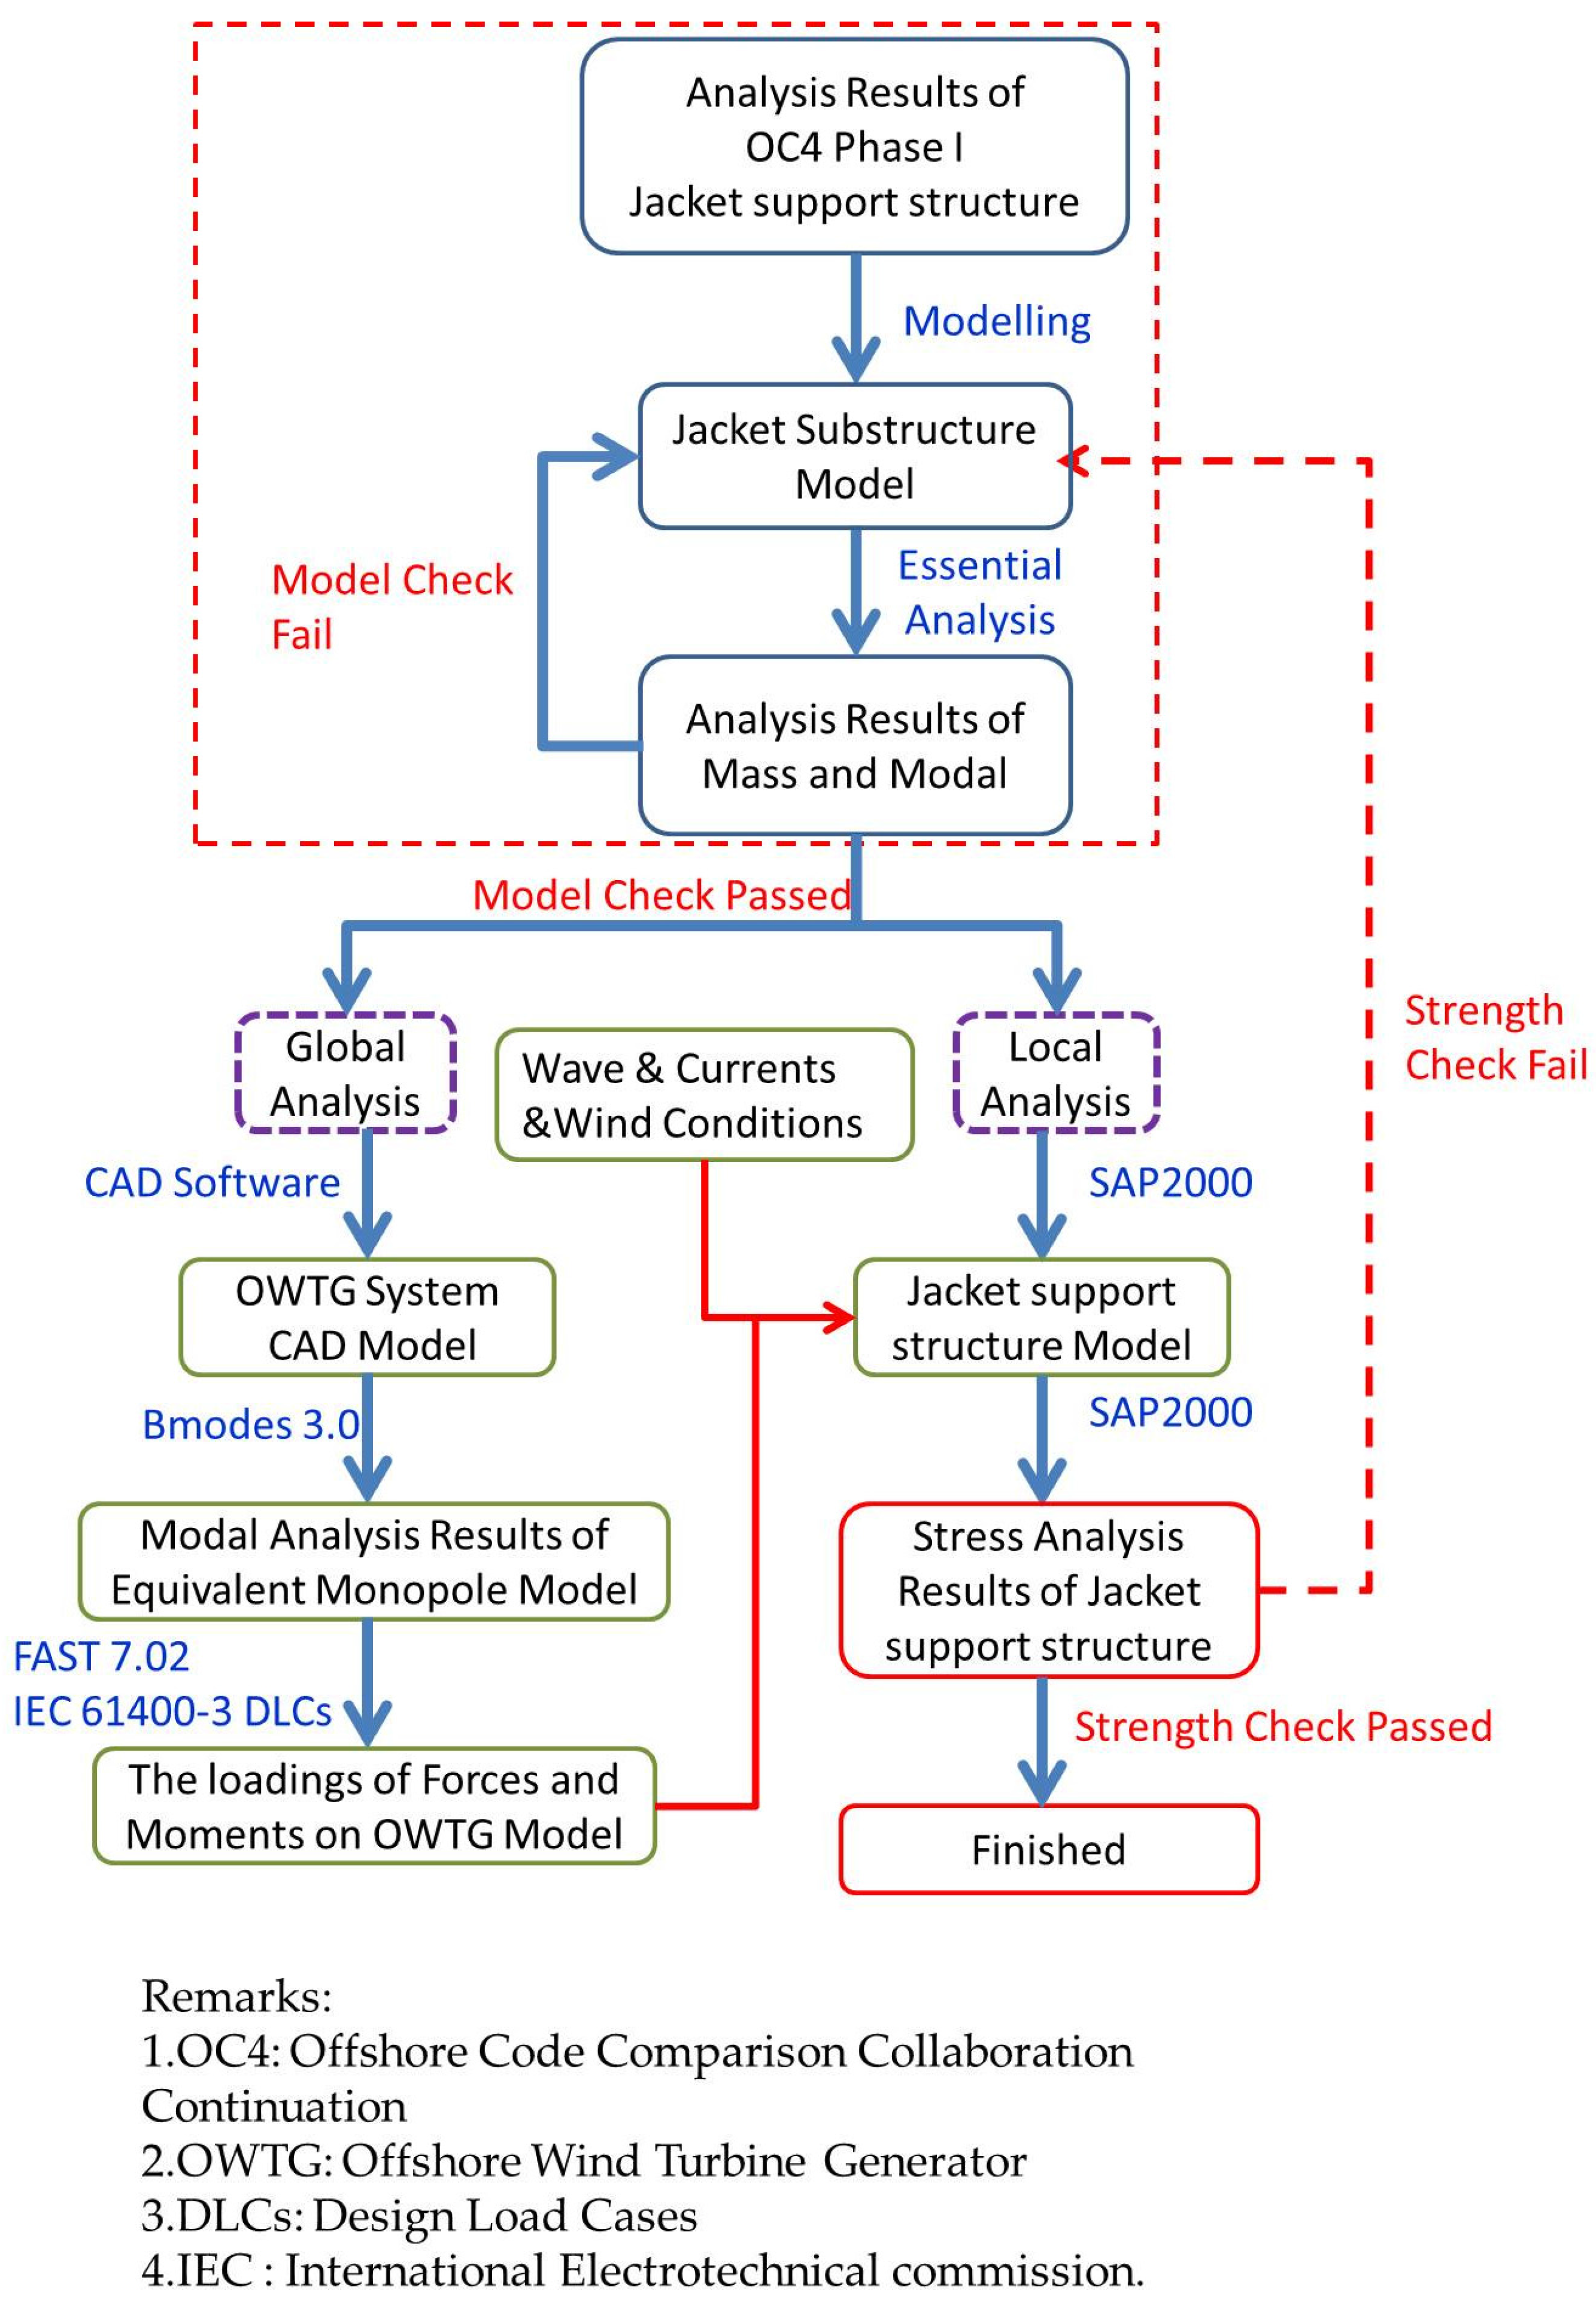
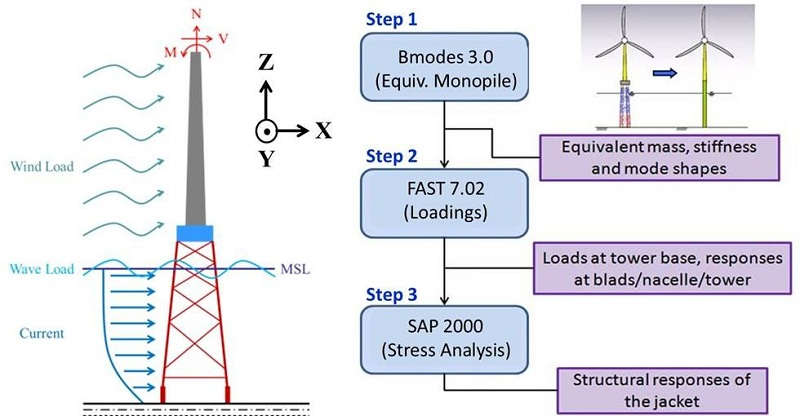
15]. The development of OWTGs in Taiwan was conducted from 2011. The jacket substructure is going to be applied to Taiwan OWTGs before 2020. Due to the environmental considerations of Taiwan, the design and analysis of OWTG foundation has received much attention. For OWTG support structure analysis, the software Bladed can be employed. However, this commercial program is not adopted by every research teams due to its cost and the limitation of source code modifications. In OC4, different software and methods have been adopted and proposed by individual teams to accomplish the OWTG analysis. In this work, a simplified and low cost analysis procedure for OWTG jacket substructure has been proposed. The goal of INER-OC4 is to develop the technical capability for the design and analysis of jacket support structure against Taiwan environments. The preliminary results of INER-OC4 regarding the analysis procedure of jacket support structure have been presented in this work. The NREL (National Renewable Energy Laboratory) 5 MW OWTG FAST model, the OC4 jacket substructure model and some environmental data (i.e., wave and current) from the Taiwan Central Weather Bureau are engaged in the intensive simulations. The proposed analysis procedure is depicted in Figure 1. OC4 Phase I is the major reference of INER-OC4. The employed jacket support structure model in this work is designed according to the OC4 Phase I. After the details of jacket substructure are determined, the essential information, i.e., the mass and modal analysis, are evaluated and then compared with those by other OC4 research teams. The tasks of modeling and model check will continue until no significant difference observed. Once the model check passed, the global analysis and local analysis will be engaged sequentially. In the global analysis, freeware FAST 7.02 [16] is employed to investigate the dynamic response of OWTG supported by jacket substructure. However, only the monopile support structure can be analyzed by FAST 7.02 [17]. The purpose of global analysis is therefore to build the equivalent monopile model for jacket support structure and evaluate the aerodynamic response of the OWTG supported by this simplified substructure under various Design Load Cases of IEC 61400-3. The NREL FAST code is employed to analyze the dynamic response of the OWTG system under severe design load cases (DLCs) of IEC 61400-3. In the local analysis, the major object of investigation is the jacket support structure. The model of jacket support structure is firstly established with the aid of software SAP2000. The aerodynamic loadings on OWTG model from global analysis and the environmental loadings (actual data of wave and currents in Taiwan) are included in the following simulations as well. The aim of local analysis is to compute and check the strength of member and joint of jacket substructure. These simulation results are finally examined by the API (American Petroleum Institute) RP 2A-WSD [18] and NORSOK (Norwegian Petroleum Industry) N-004 [19] standards. Totally, six ultimate DLCs of IEC 61400-3 are investigated and the results are revealed in this work. If the designed jacket support structure cannot fulfill the strength requirement, the procedure will return to the initial step.

2. Analysis Procedure

This work is the preliminary results of INER-OC4 project. The major analysis steps in Figure 1 can be further simplified and represented as Figure 2. During the intensive simulations, the NREL 5 MW OWTG FAST model is combined with the OC4 jacket substructure model which is built according to the models proposed by Jonkman et al. [20] and Vorpahl et al. [21]. The modeling techniques are basically implemented according to the standard modes of international design guidelines or projects (like OC3 and OC4). However, some actual environmental data (i.e., wave and current) of Taiwan have been employed in these simulations to replace the stochastic data. The overall analysis procedure has been divided into the following three stages.

2.1. Stage 1—Verification of NREL 5 MW OWTG FAST Model

First stage is to verify the NREL 5 MW OWTG FAST model built by INER with the aid of freeware FAST 7.02 (NREL, Golden, CO, USA). The full-system modal behavior, the fully coupled Aero-Hydro-Servo-Elastic response, and flexible OWTG dynamics are all involved in the analyses under the load cases of OC3 Phase I. These analysis results are compared with those by other OC3 research teams [22] to ensure the validity and efficacy of the employed NREL 5 MW OWTG FAST model.

2.2. Stage 2—Construction of Equivalent Monopile Model for OC4 Jacket Support Structure

For OWTG support structure analysis, the software Bladed (DNV GL, Oslo, Norway) can be employed to implement the analysis. However, this commercial program was not adopted by every research teams due to its cost and the limitation of source code modifications. In this work, a simplified and low cost analysis procedure for OWTG jacket substructure has been proposed. The analysis flowchart for OC4 jacket substructure model is displayed in Figure 2. The first step is to build the CAD (Computer-Aided Design) profile of the OC4 jacket support structure and then simplify it to be a monopile model with the aid of freeware BModes 3.0 [23]. The essential information for equivalent monopile model construction, such as the density, cross-sectional area, young’s module and area moment of inertia, are evaluated according to the CAD profile of jacket substructure. Both of the OWTG model and the equivalent monopile model will be employed to investigate the operation loadings. The full jacket substructure model is finally analyzed under these operation loadings with the aid of Software SAP 2000 [24].

2.3. Stage 3—Investigations of OWTG Dynamics under OC4 Load Cases, IEC Design Load Cases and Partial Taiwan Environmental Conditions

This stage is refers to Step 2 and Step 3 in Figure 2. Step 2 is to investigate the loadings induced by OWTG operation, e.g., the resulted force and moments at tower top, under OC4 load case (Phase I). Step 3 is to inspect the strength of members and joints of OC4 jacket support structure model. The outputs of Step 2 are the inputs of software SAP2000 in Step 3. The impact of wave, current and marine growth is also taken into consideration in the stress analysis. Actual data of wave and current are obtained from the Taiwan Central Weather Bureau (Taipei, Taiwan). The structural strength check of OC4 jacket substructure is accomplished under extreme DLCs of IEC 61400-3.

3. Verification of NREL 5 MW OWTG FAST Model under Load Cases of OC3 Phase I

Two software packages, i.e., FAST [16] and MCrunch [25], are employed for dynamic simulations and data post-processing respectively. The OWTG simulations are accomplished by FAST. However, the output of FAST is time-domain data. Before these data can be compared with those of OC3 research teams, the FAST output must be transferred to frequency-domain data with the aid of MCrunch. As mentioned in Section 2, the NREL 5 MW OWTG FAST model has to be verified according to the load cases of OC3 Phase I (see Table 1 for more details) before advanced analyses.

3.1. Load Case 1.2

The natural frequencies of a flexible OWTG model supported by a monopile under stationary condition are shown in Figure 3. Merely the results of first two orders are provided because: (i) only the first two orders data are released by OC3; (ii) the analysis order higher than second order is prohibited by FAST; and (iii) the effect of high order against WTG operation can be ignored. The analysis results by INER are in good agreement with those by other OC3 research teams except for the second order natural frequencies of turbine structures. Since the natural frequencies evaluated by modal-based codes are generally higher than those by multibody-based or FEM (Finite Element Method)-based codes, analysis errors by different teams can therefore be exhibited in high order frequencies.

3.2. Load Case 5.3

The environmental effect is included in Load Case 5.3. The wind conditions and wave conditions are given according to OC3 Phase I standards. Partial analysis results under Load Case 5.3 are shown in Figure 4 and Figure 5. Figure 4 is the variation of base shear force under stochastic wind flow. Figure 5 is the variation of base overturning moment under drastic wave conditions. The analysis results by individual OC3 research teams are similar in the frequency interval of 0–1.5 Hz. However, for frequency beyond 1.5 Hz, significant analysis errors between individual teams have been observed due to the difference of simulation settings and applied analysis methods. Since the variations of turbulent wind and irregular wave are given randomly, the simulation results of individual teams can hardly be identical. That is why there are analysis errors between NREL and INER in Figure 4 and Figure 5, though the OWTG model and analysis software of the two teams are the same.

4. Construction of Equivalent Monopile Model for OC4 Jacket Support Structure

As mentioned in 
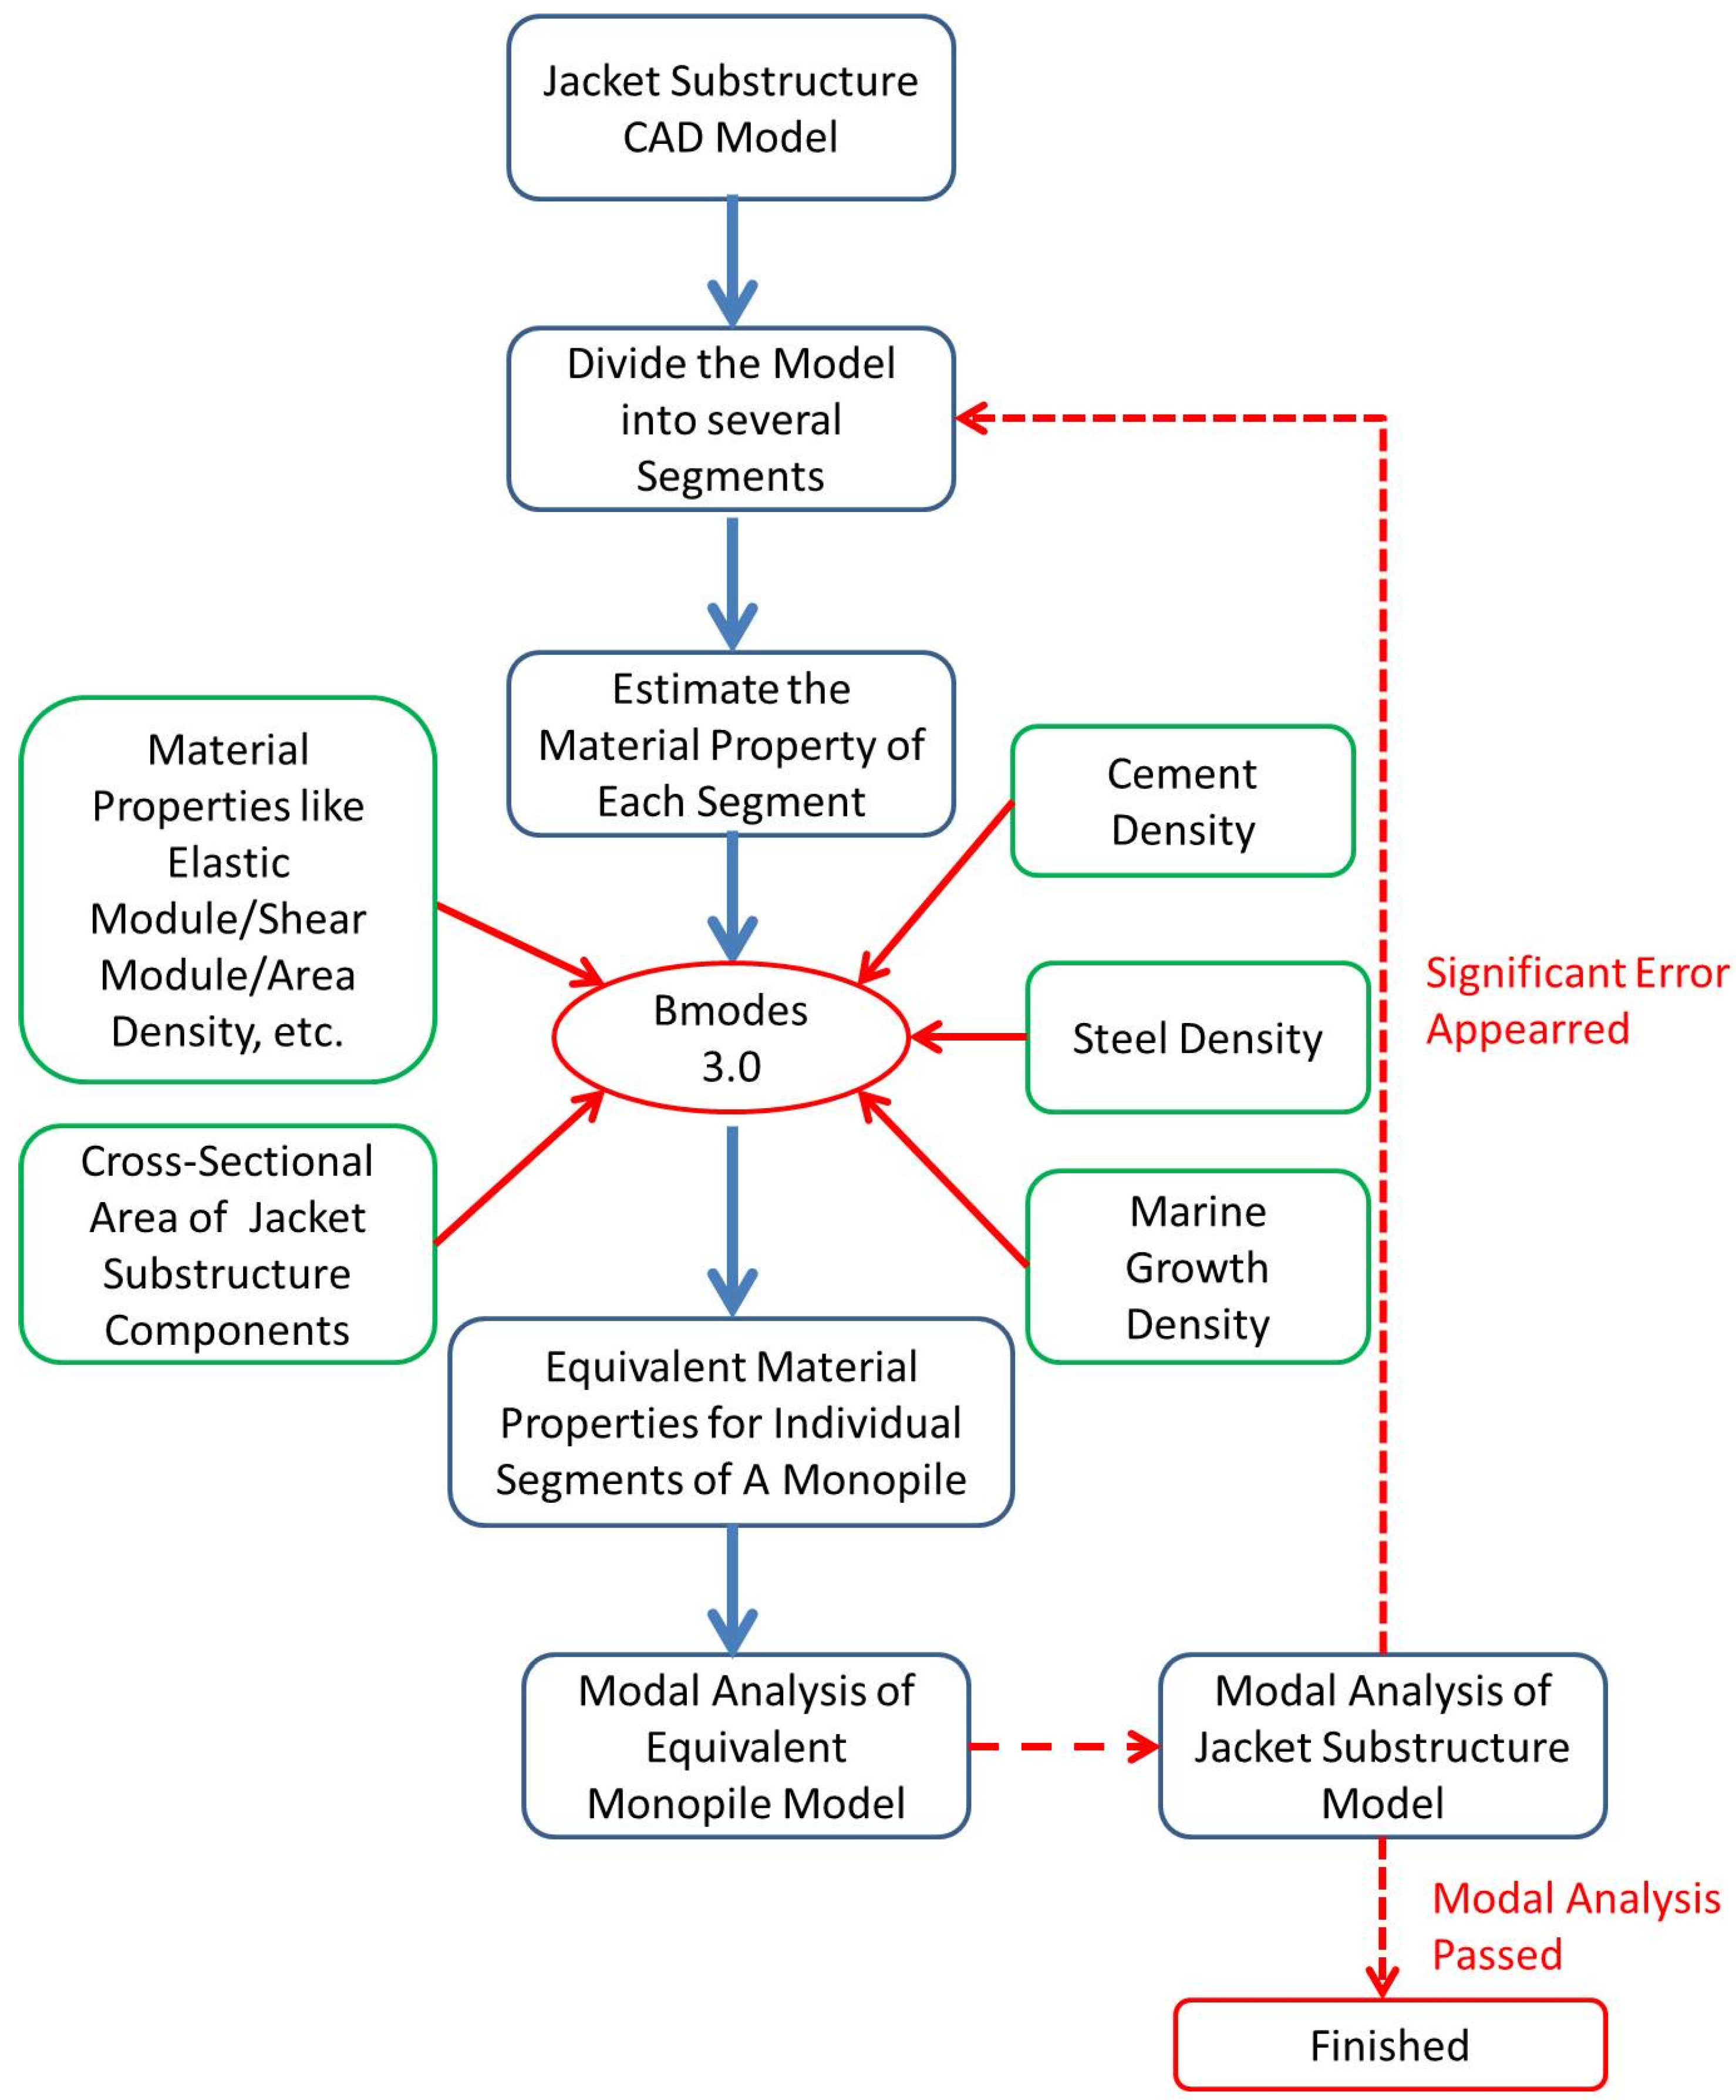
Section 2, the goal of this work is to propose an analysis procedure for jacket substructure and to verify its efficacy. The second analysis stage is to build an equivalent (substitute) monopile model of OC4 jacket substructure. The OC4 jacket support structure is firstly built by Solidworks 2013 (Dassault Systems, Waltham, MA, USA), as shown in Figure 6. The essential information for equivalent monopile model construction, like the density, cross-sectional area, young’s module and area moment of inertia, are all obtained from this CAD profile. With the aid of freeware BModes 3.0, the OC4 jacket support structure model is finally simplified to be a monopile model. The flowchart of equivalent monopile model construction is shown in Figure 7. The CAD model of jacket support structure will be divided into several segments along the vertical direction. The software BModes 3.0 is employed to calculate the equivalent material property for the segment of jacket substructure transferred to be a part of a monopile.
In addition, the global analysis is to obtain the aerodynamic loadings of an OWTG supported by an equivalent monopile. These loadings will be the input of local analysis. According to the released OC4 data, the transition piece (tower base) is supposed to be a rigid body. The NREL 5 MW OWTG FAST model is further simplified based on the OC4 documents as follows:
  • The tower base is remodeled to be a rigid concrete block of dimension 4 m × 9.6 m × 9.6 m and is placed on the top of OC4 jacket substructure.
  • The mass of concrete block is about 666 tons. The block C.O.G. (Center of Gravity) and tower centerline are entirely overlapped.
  • The RNA is treated as a point mass in SAP2000. The weight of rotor nacelle assembly (RNA) is assumed to be 350 tons [21].
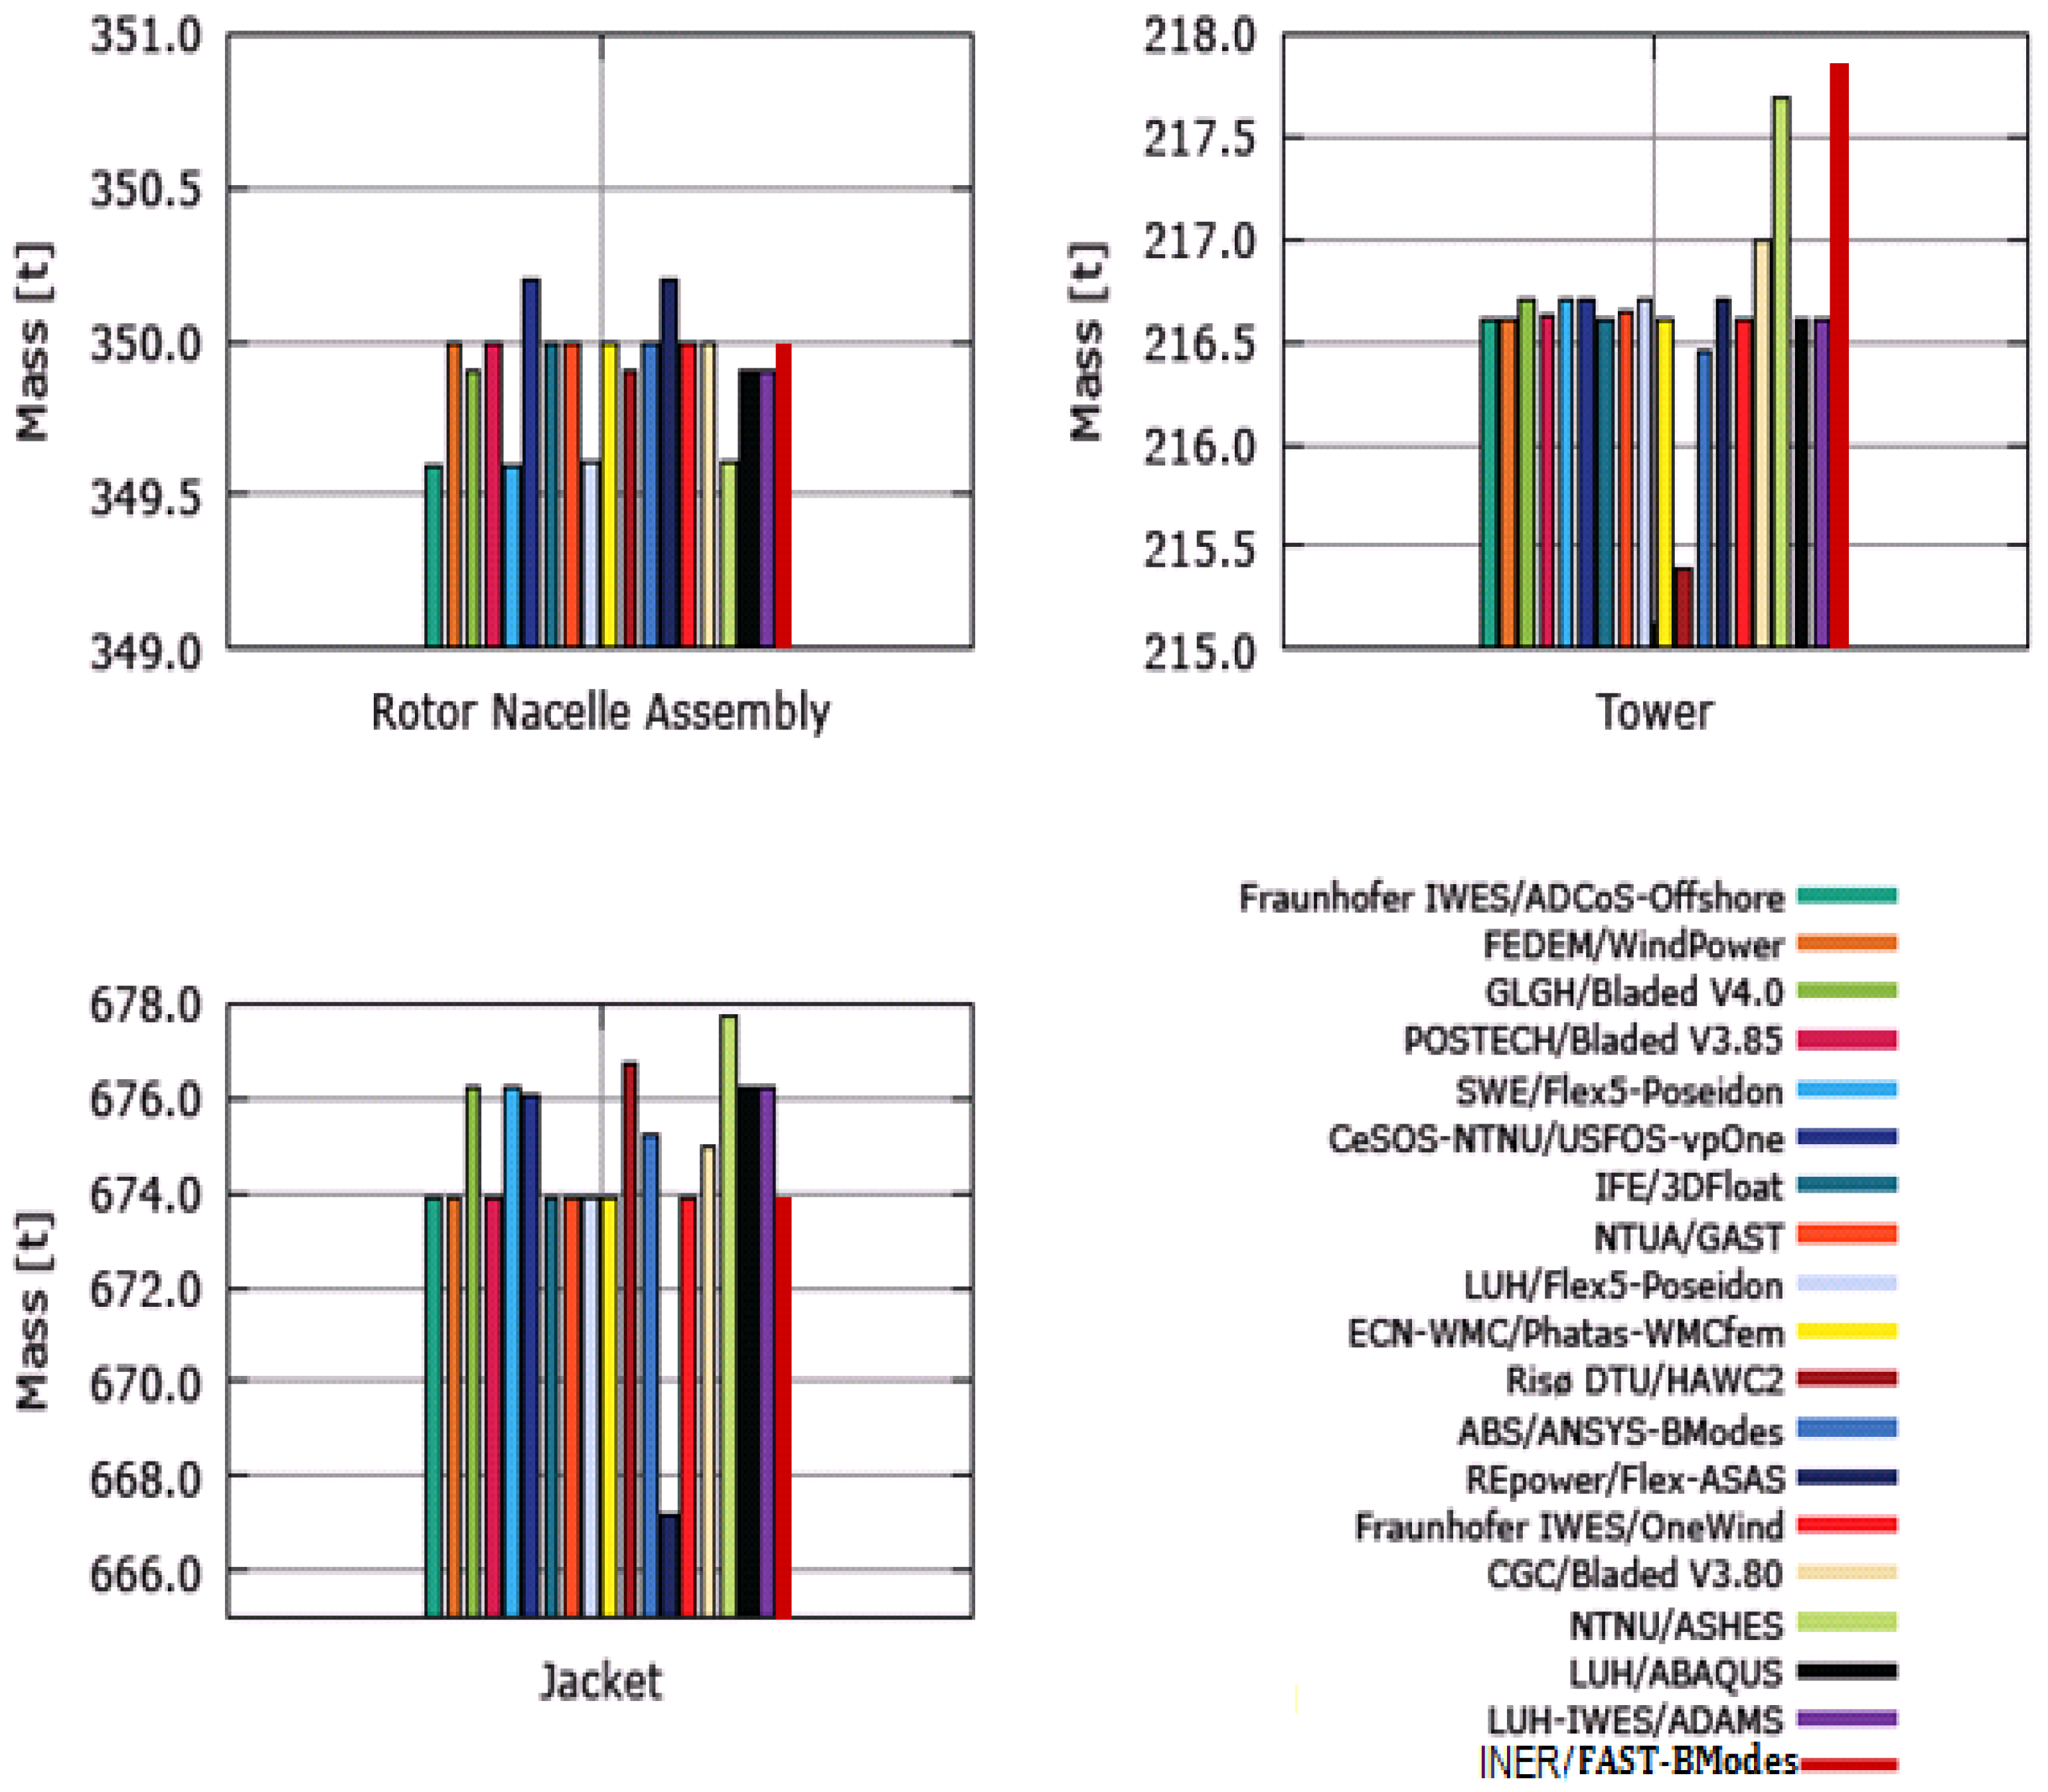
The constructed models and masses of substructure components are shown in Figure 6 and Figure 8, respectively. Ignorable error occurred (see Table 2) in comparison with the results by ABS (American Bureau of Shipping) [26].
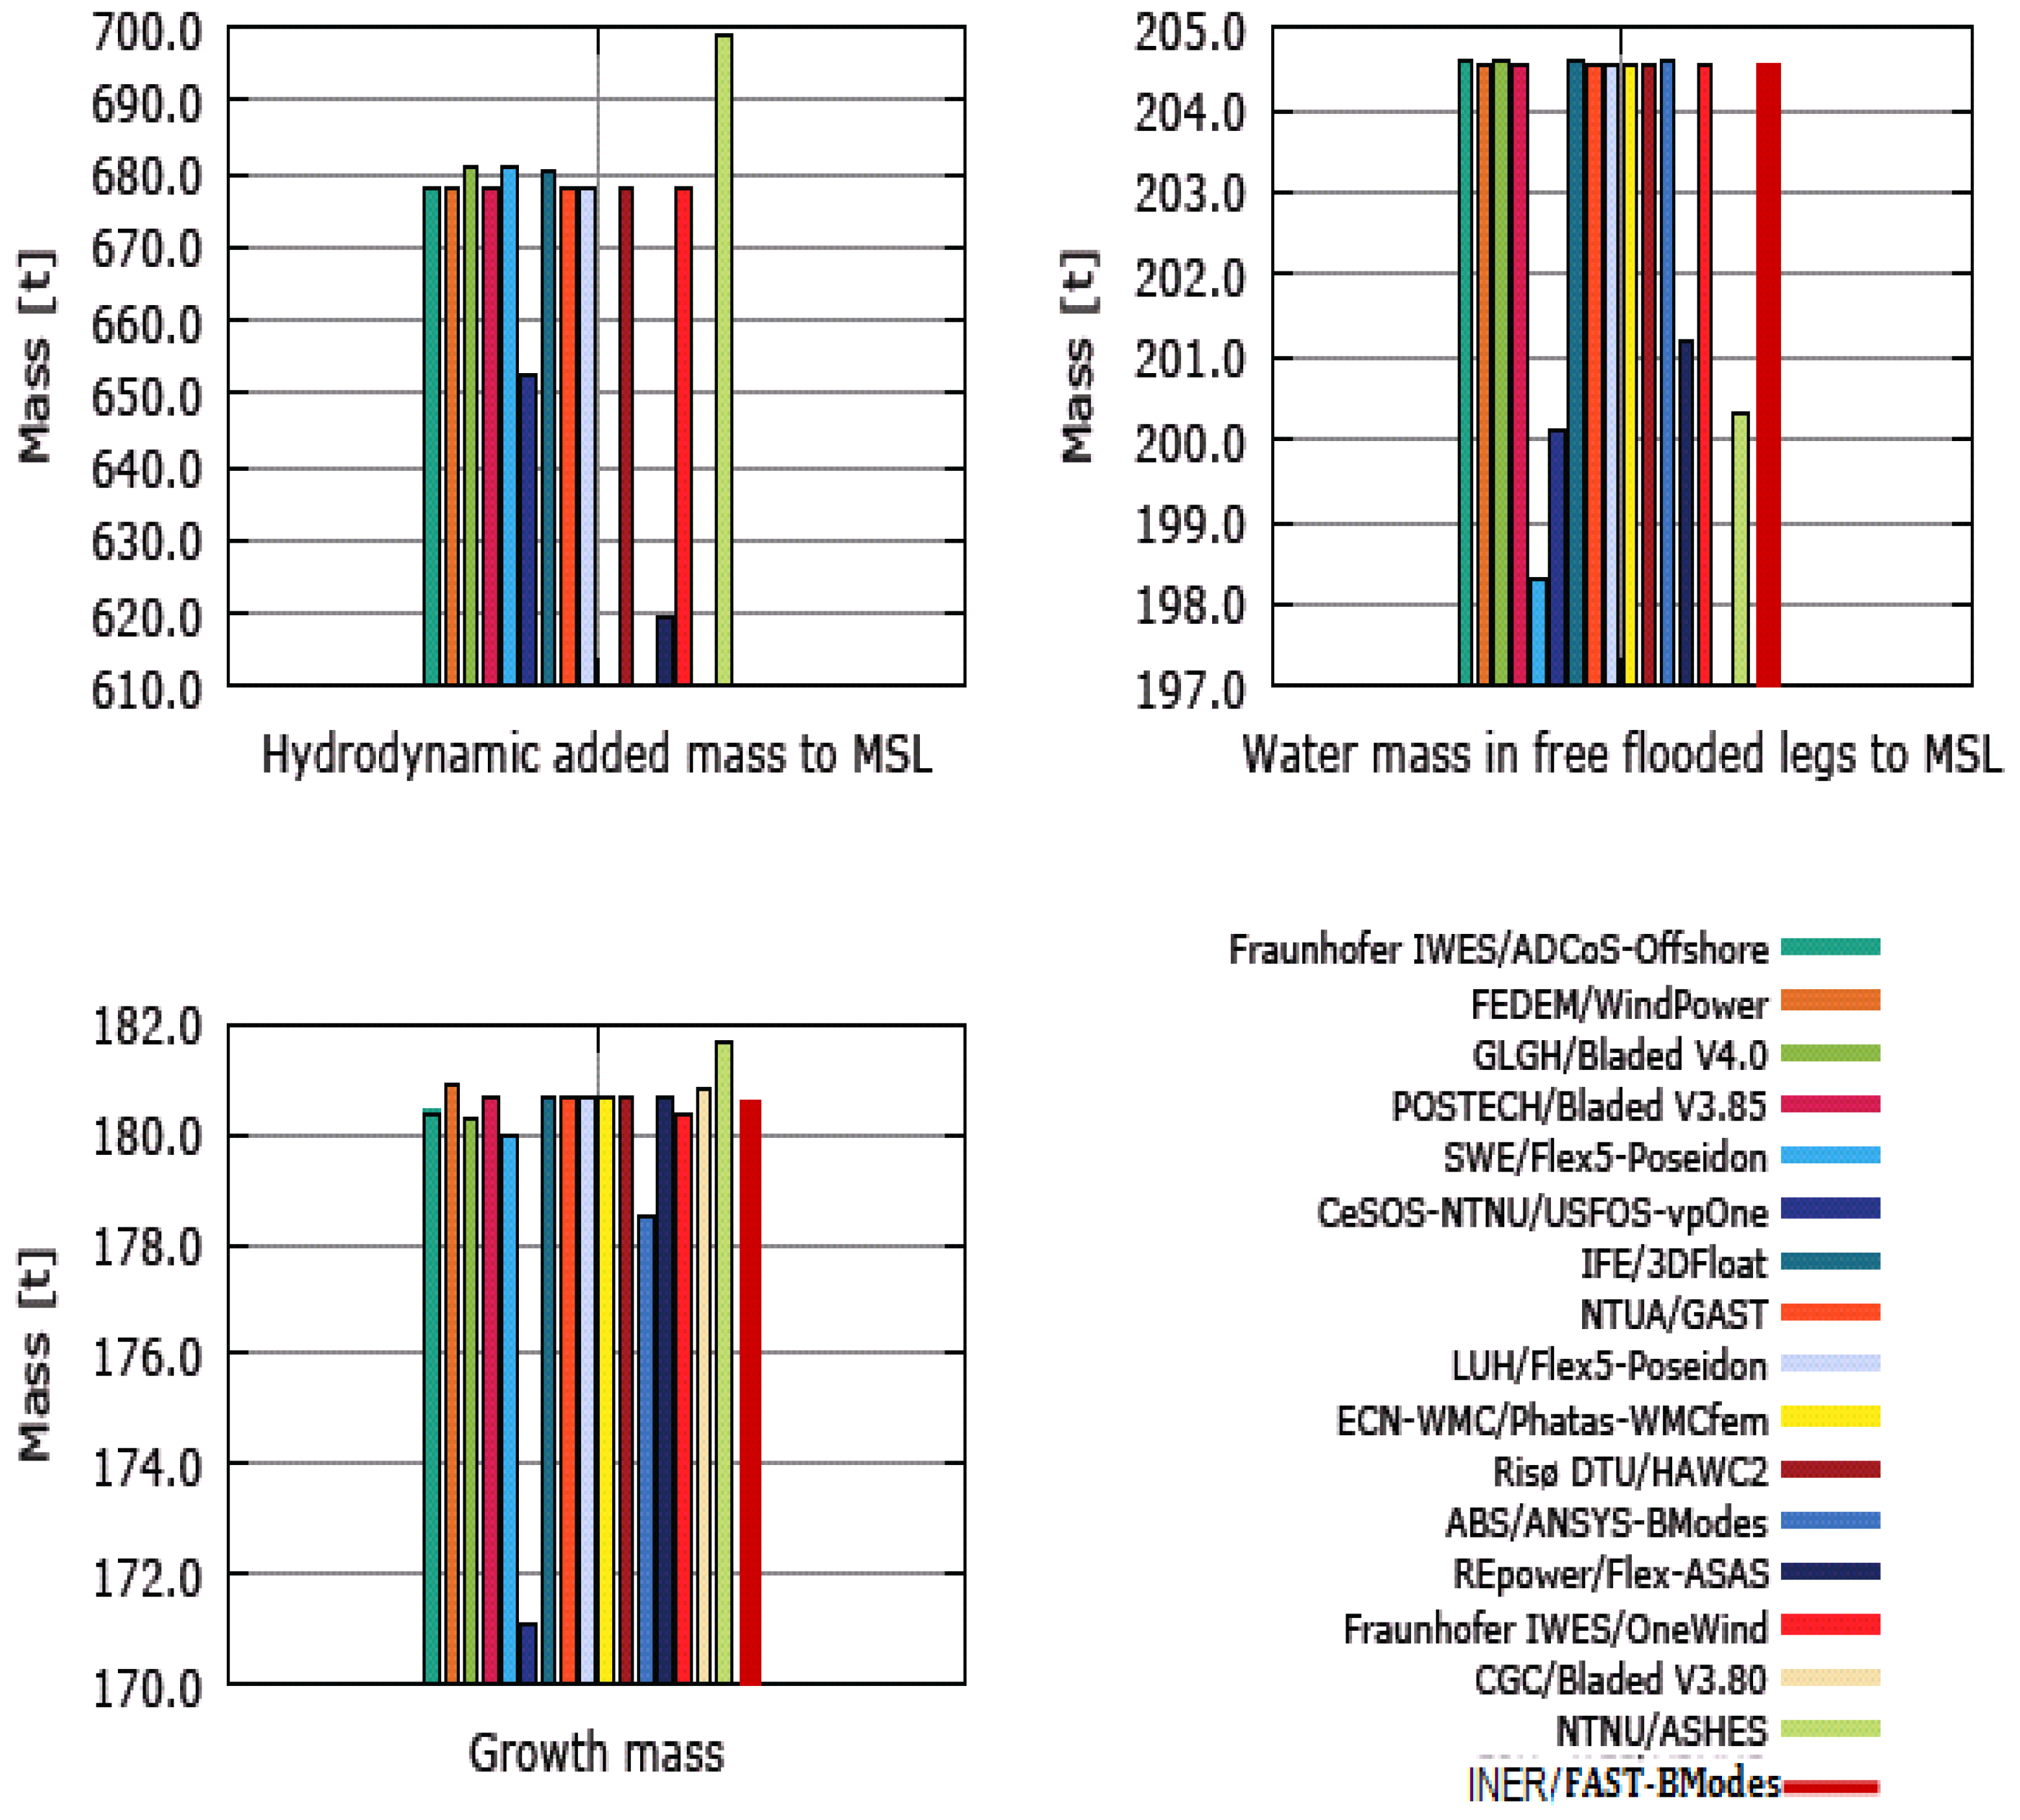
Moreover, the hydrodynamic mass and marine growth, which are shown in Figure 9 and Figure 10, respectively, are taken into consideration as well. The OWTG is expected to be installed in Taiwan Strait and the corresponding water depth is 50 m. The equivalent hydrodynamic mass is estimated at the water depth of 50 m below mean sea level (MSL) and the marine growth is only engaged within the water depth range of 2–40 m below MSL (see Table 3 [27]). Similarly, a comparison between the simulation results by INER and ABS is accomplished in Table 4. It can be observed that nearly negligible errors exhibited between these results of the two research teams.
Based on similar assumptions mentioned in Ref. [28], the combination of OC4 jacket substructure model and simplified OWTG model can be represented by the verified mass, equivalent modes and partial load cases. After the contour construction using commercial CAD software (see Figure 6), the modal evaluation can be performed with the aid of freeware BModes 3.0. The definition of “segment” is illustrated in Figure 11. The tower and jacket substructure have been divided into several sections (segments) for modal analysis. The modal analysis results for various segment numbers are compared with the results in Ref. [28] and the error should be within 5%. Some of the modl analysis results of the combined model are listed in Table 5. These analysis errors in Table 5 are mainly from the model simplification. Since the results belonging to segment number of 40 are the closest to the results of Ref. [28], the simulation results of 40 segments model are employed in the following simulations.

5. Evaluation of OWTG Loadings under OC4 Phase I Load Cases

In Section 4, the equivalent monopile model for OC4 jacket substructure and the simplified tower model are prepared. This Section refers to Step 2 in Figure 2. The purpose of OC4 Load Case analysis is to obtain the loadings during OWTG operation. According to the simulation standards of NREL, a 5 MW OWTG should be placed at the height of 50 m above MSL. In the following analyses, the freeware FAST 7.02 is employed to analyze the OWTG dynamics. Simulation results of three Load Cases are introduced in this Section, i.e., load case 2.4b, 3.2 and 3.4a (see Table 6 for more details). The three Load Cases refer to the OWTG operation under steady wind (3.2) and turbulent wind (2.4b and 3.4a).

5.1. Load Case 2.4b

In this load case, the WTG is supposed to be a rigid body and the turbulent wind flow is defined according to Ref. [29]. The probability density function (PDF) of the tower-top and mudline fore-aft shear forces, shown in Figure 12a,b respectively, are similar to those by other OC4 research teams. The PDF peaks by ADCoS-offshore are much higher than those by other teams and lead to the lowest DEL (Damage Equivalent Load) value, as shown in Figure 12c. Though FAST is employed by both INER and ABS to accomplish the Load Case investigations, there are significant differences in the simulation results between the two teams. BModes (3.0, NREL, Golden, CO, USA) and ANSYS (14, ANSYS, Inc., Canonsburg, PA, USA) are adopted by INER and ABS, respectively, to deal with the jacket substructure analysis. The support structure model simplification and analysis definitions are expected to be much different from each other. The analysis errors between the two teams are therefore produced.

5.2. Load Case 3.2

The OWTG (including RNA and tower) is assumed to be fully flexible and the steady wind flow is applied. Load Case 3.2 is focused on the influence of tower shadow effect. The dynamics of low-speed shaft torque is revealed in Figure 13. These data are obtained during the time interval of 30–40 s of the simulation period (the simulation data of the first 30 s is dropped according to the OC4 recommendation). The torque fluctuation is induced due to the tower shadow effect. Since there are three blades equipped with the OWTG, the blade passing frequency is three times the OWTG rotating frequency. The trend of torque fluctuation of the present results is similar to those by most of OC4 research teams.

5.3. Load Case 3.4a

Similarly, in Load Case 3.4a, the OWTG is only investigated under the load of stochastic wind flow. In addition, the regulation of blade pitch angle is taken into consideration in this case and the initial conditions are set as: rotor speed of 9 rpm and blade pitch angle of 0°. The analysis results of flapwise and edgewise shear force agree very well with the results by other OC4 research teams, as shown in Figure 14a,b respectively. The PDF of pitching moment at the blade root is shown in Figure 14c. The curve discrepancies are originated from the rate and magnitude of pitching action, namely, the variations of these curves are dependent on whether the rated rotor speed (12.1 rpm) is achieved or not. In this case, the employed wind flow data for every research team is the same. In other words, the simulation error between individual teams mainly comes from the used OWTG models. For example, the variation of these curves is highly determined by the position of blade mass center. There is an interesting issue reported by Risø DTU [29]. Since the PDF of wind flow data under different time step interval is the same, the precision of simulation results will not be affected by time step interval setting.

6. Strength Check for Jacket Substructure under Extreme Design Load Cases of IEC 61400-3

Totally, there are eight categories of DLCs (Design Load Cases) in IEC 61400-3 standard, as listed in Table 7. Since typhoons hit Taiwan every year, DLC 6 series have been employed to inspect the support structure strength. The standard process for the WTG against approaching Typhoons in Taiwan is to regulate the blades to be pitched-down, apply breaks on the main shaft (parked) and release the yaw (free yaw). In addition, the electrical network is usually lost after the Typhoon lands on Taiwan and the overall situation is similar to the conditions defined by DLC 6.2a and 6.2b. There are totally 1296 and 216 situations for DLC 6.2a and DLC 6.2b, respectively (Table 8), due to various wind conditions, waves, sea currents, and water level. All of these situations have been investigated by INER and finally six conditions (Case 1–Case 6) corresponding to maximum loading of individual terms are selected, as shown in Table 8. It should be noted that the variables of Case 2 and Case 4 are identical because of the y-axis maximum force and x-axis maximum moment are both taken place under this environmental setting. The influence of wave, current, marine growth, external water pressure and OWTG dynamics is also included in the following simulations (see Table 9 and 
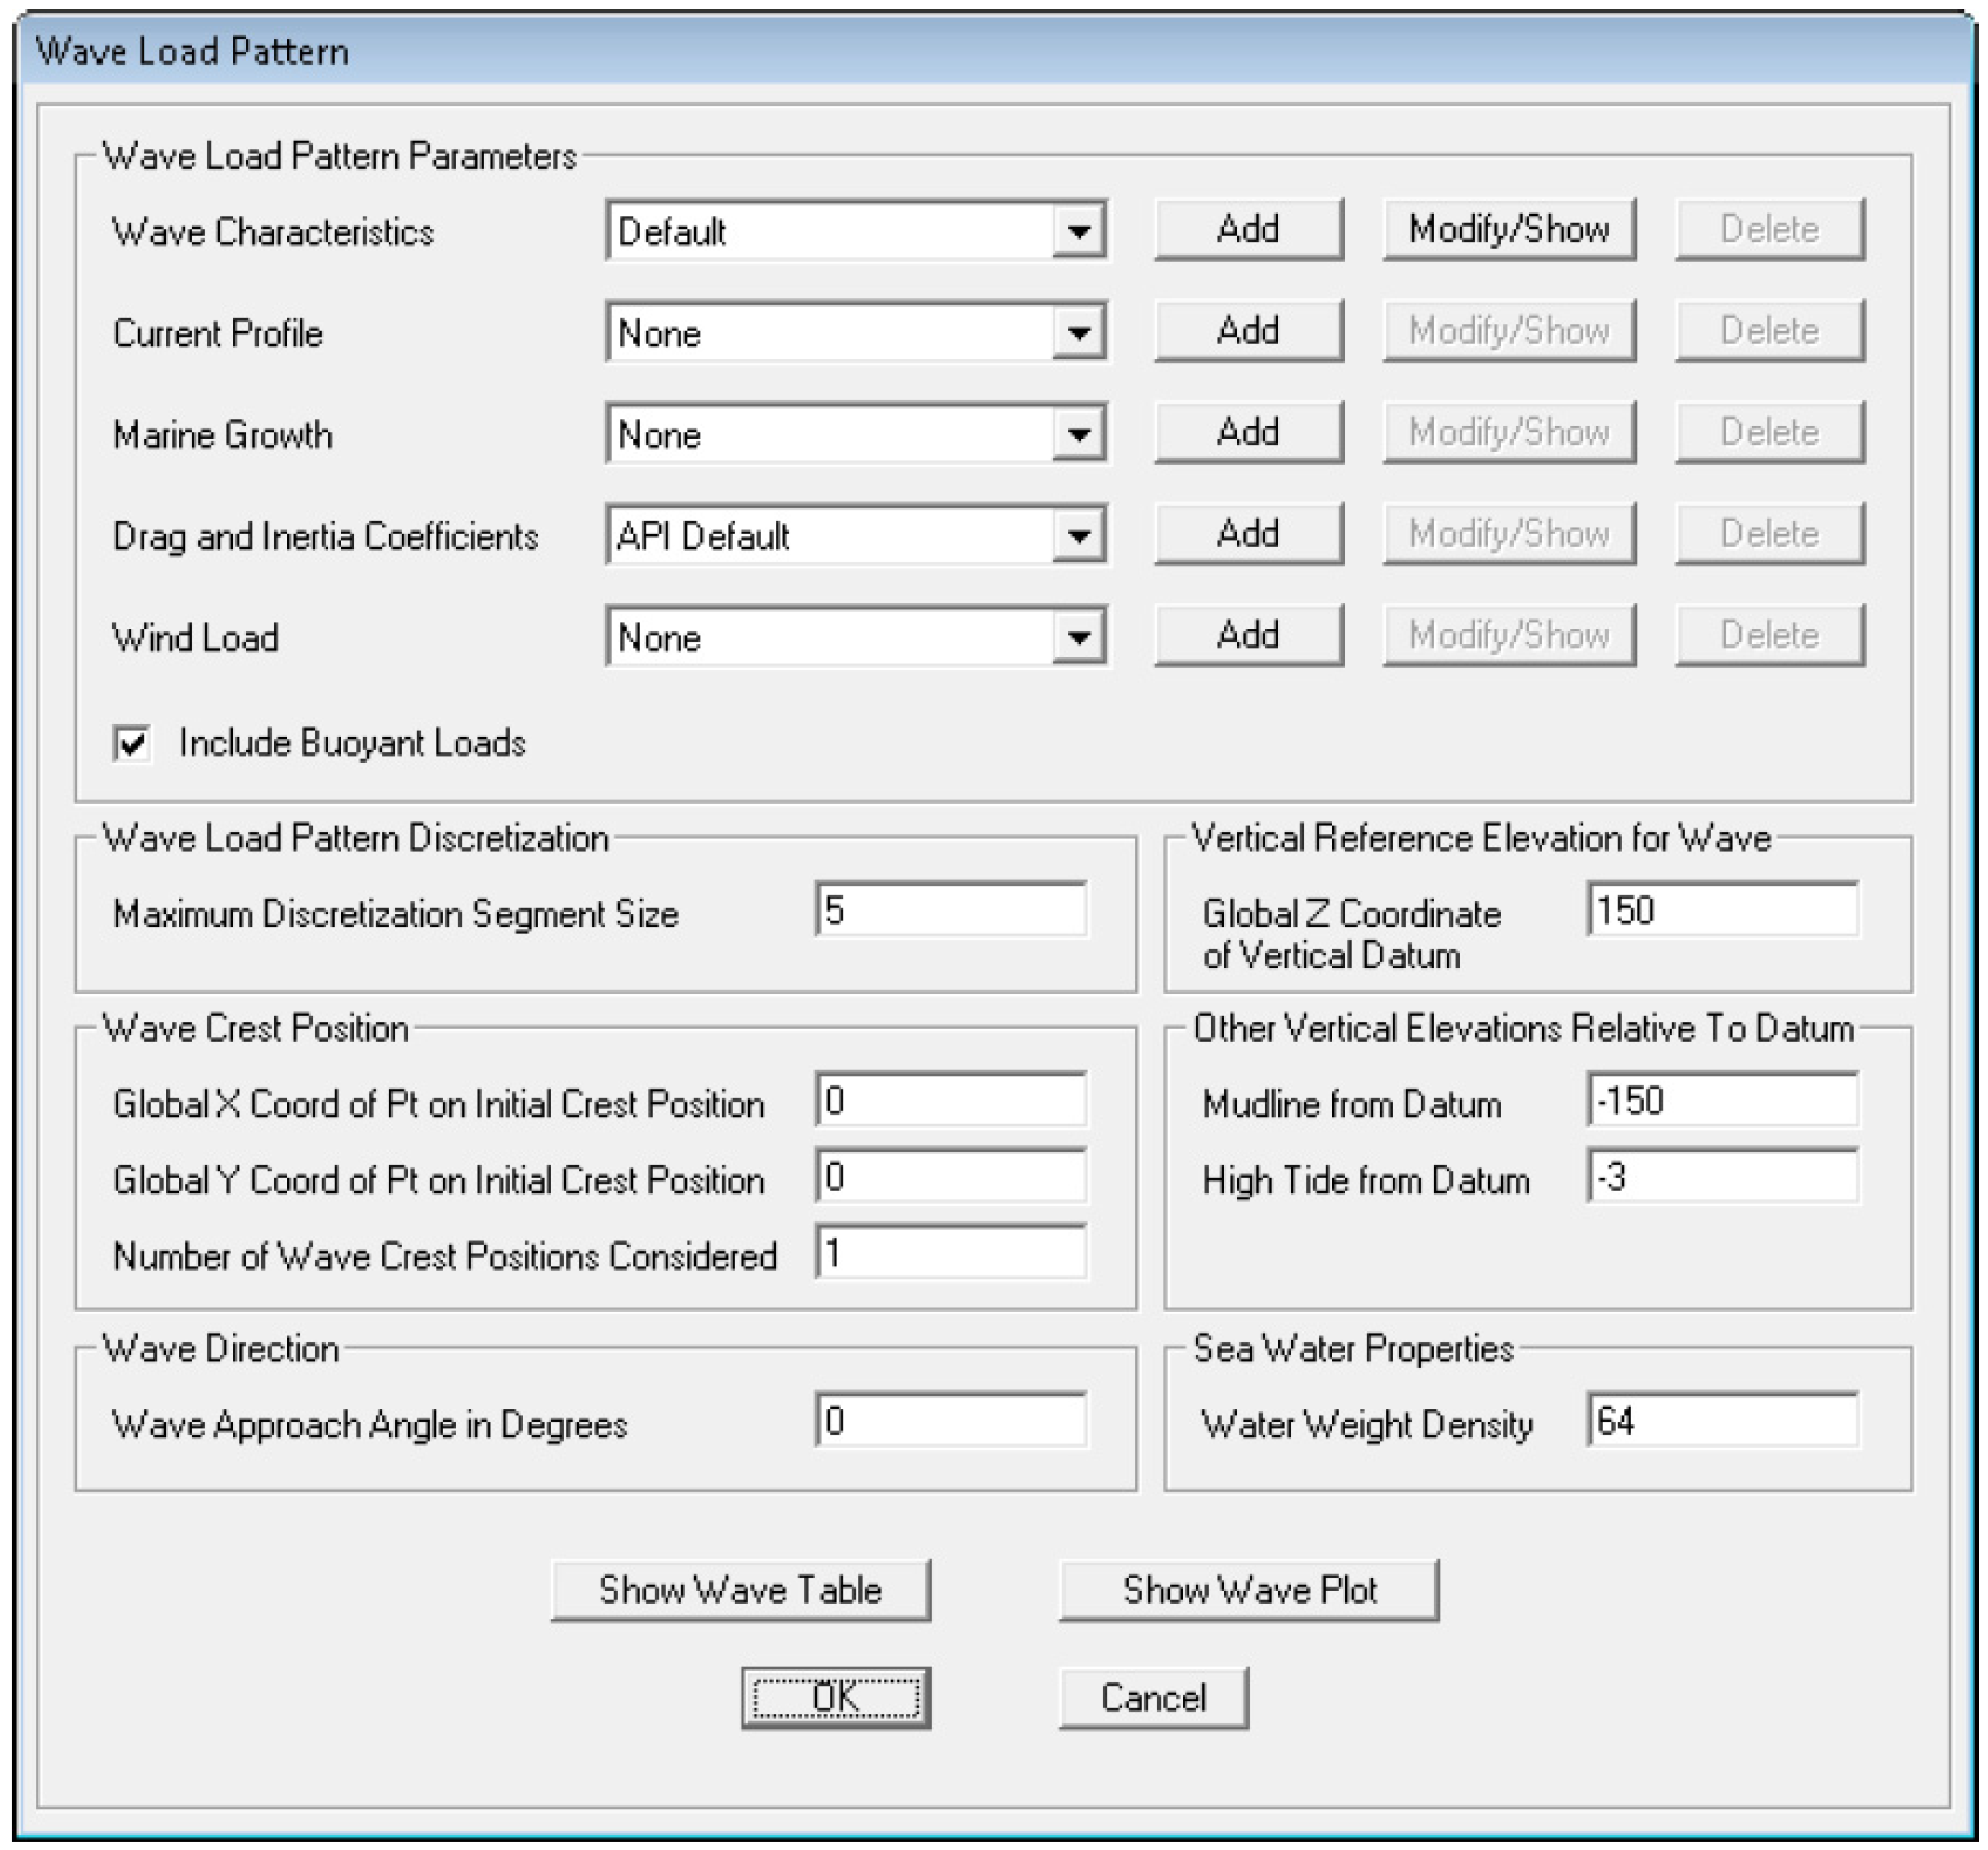
Figure 15 for more details). The simulation of water pressure influence is achieved using the software package SAP2000. The automatic wave load is a special type of load pattern commands in SAP2000 (Figure 16). The structural loadings due to waves, current flow, marine growth, buoyancy and wind can be enclosed simultaneously in one simulation via this load command. Wave velocity and acceleration fields could be automatically generated by using airy (linear), stokes or cnoidal wave theories or, alternatively, they can be directly input by the user. Current velocity and direction, marine growth, drag coefficients and inertia (mass) coefficients are all specified as a function of water depth. Wind load, acting in any direction, can also be specified as a part of the wave load. The wind load acts on the portion of the structure that is above the wave surface.
By defining the sea level height, the wave height and the wave period, the load effects due to water pressure can be applied to the jacket substructure. The marine growth is only engaged within the water depth range of 2–40 m below MSL (see Table 3 [27]). The raw data of wave and current were recorded by Taiwan Central Weather Bureau (Taipei, Taiwan) during the time interval of 2013–2014. However, the applied data of these two parameters are a revision of raw data based on Ref. [30] and irregular wave models (Jonswap spectrum and Pierson–Moskowitz spectrum) are employed as well in the intensive simulations.
The resulted forces and moments at tower top for Case 1–Case 6 are listed in Table 10. These loadings are estimated with the aid of freeware FAST and the analysis rules of IEC 61400-3 standard. These maximum forces and moments will be defined as the ultimate limit state (ULS) for the following structural analysis. The model construction of OC4 jacket substructure is introduced in Figure 17. All of the involved components are fulfill with the requirements of NORSOK N-004 [18] and API RP 2A-WSD [19] standards. More details regarding the difference between the two standards can be found in Ref. [31]. The used safety factors of WSD and the load and resistance factors of LRFD are defined in Table 11 and Table 12, respectively.
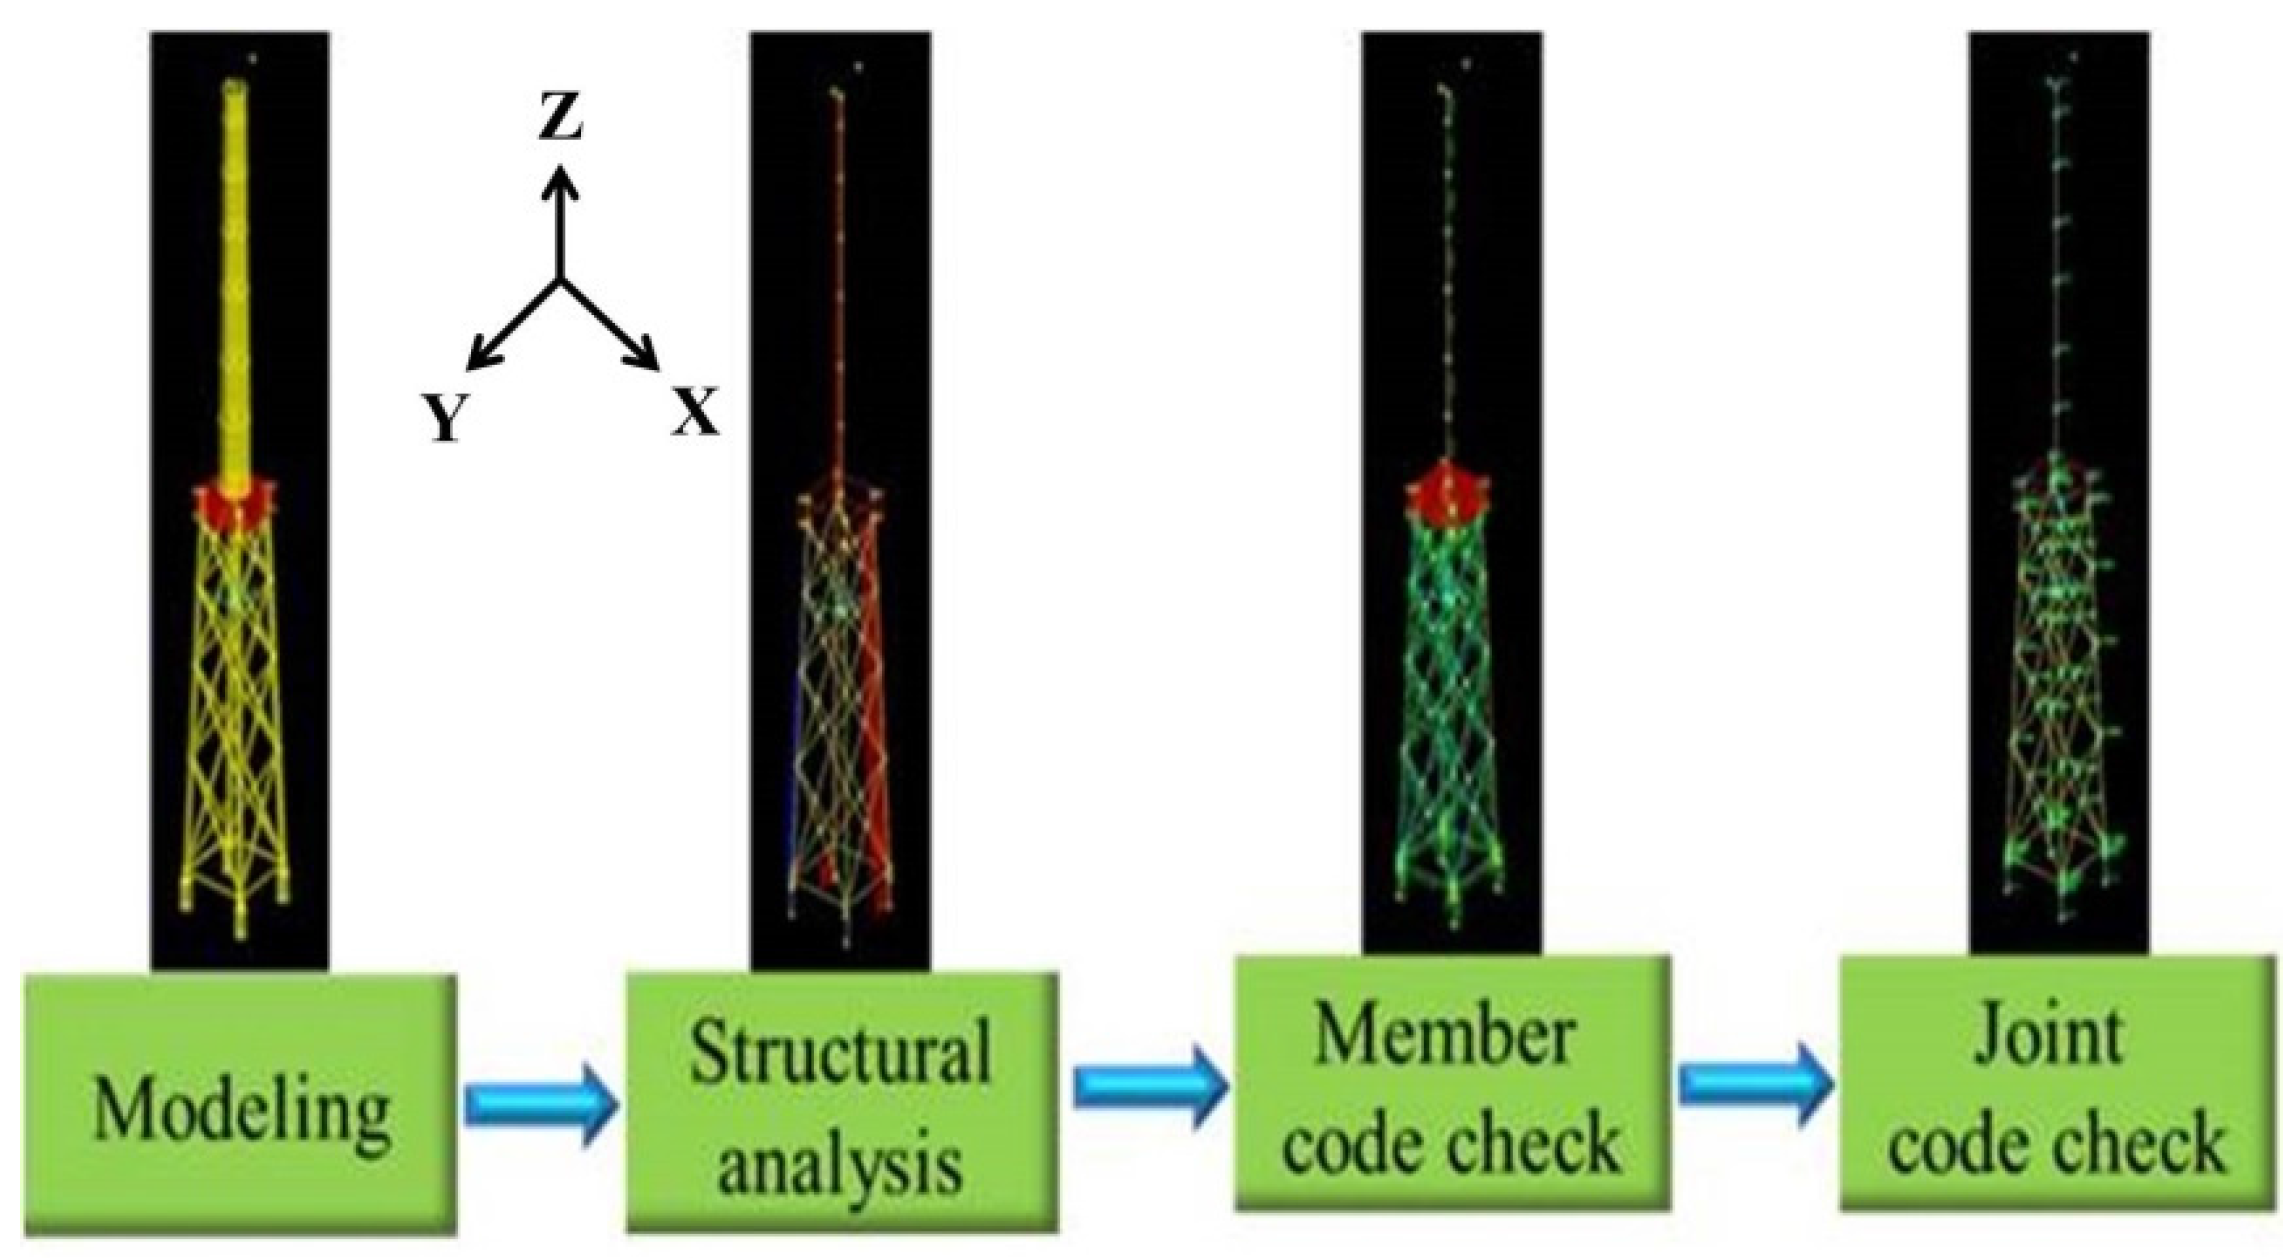
The following simulations for OC4 jacket substructure model are implemented with the aid of software SAP2000 [
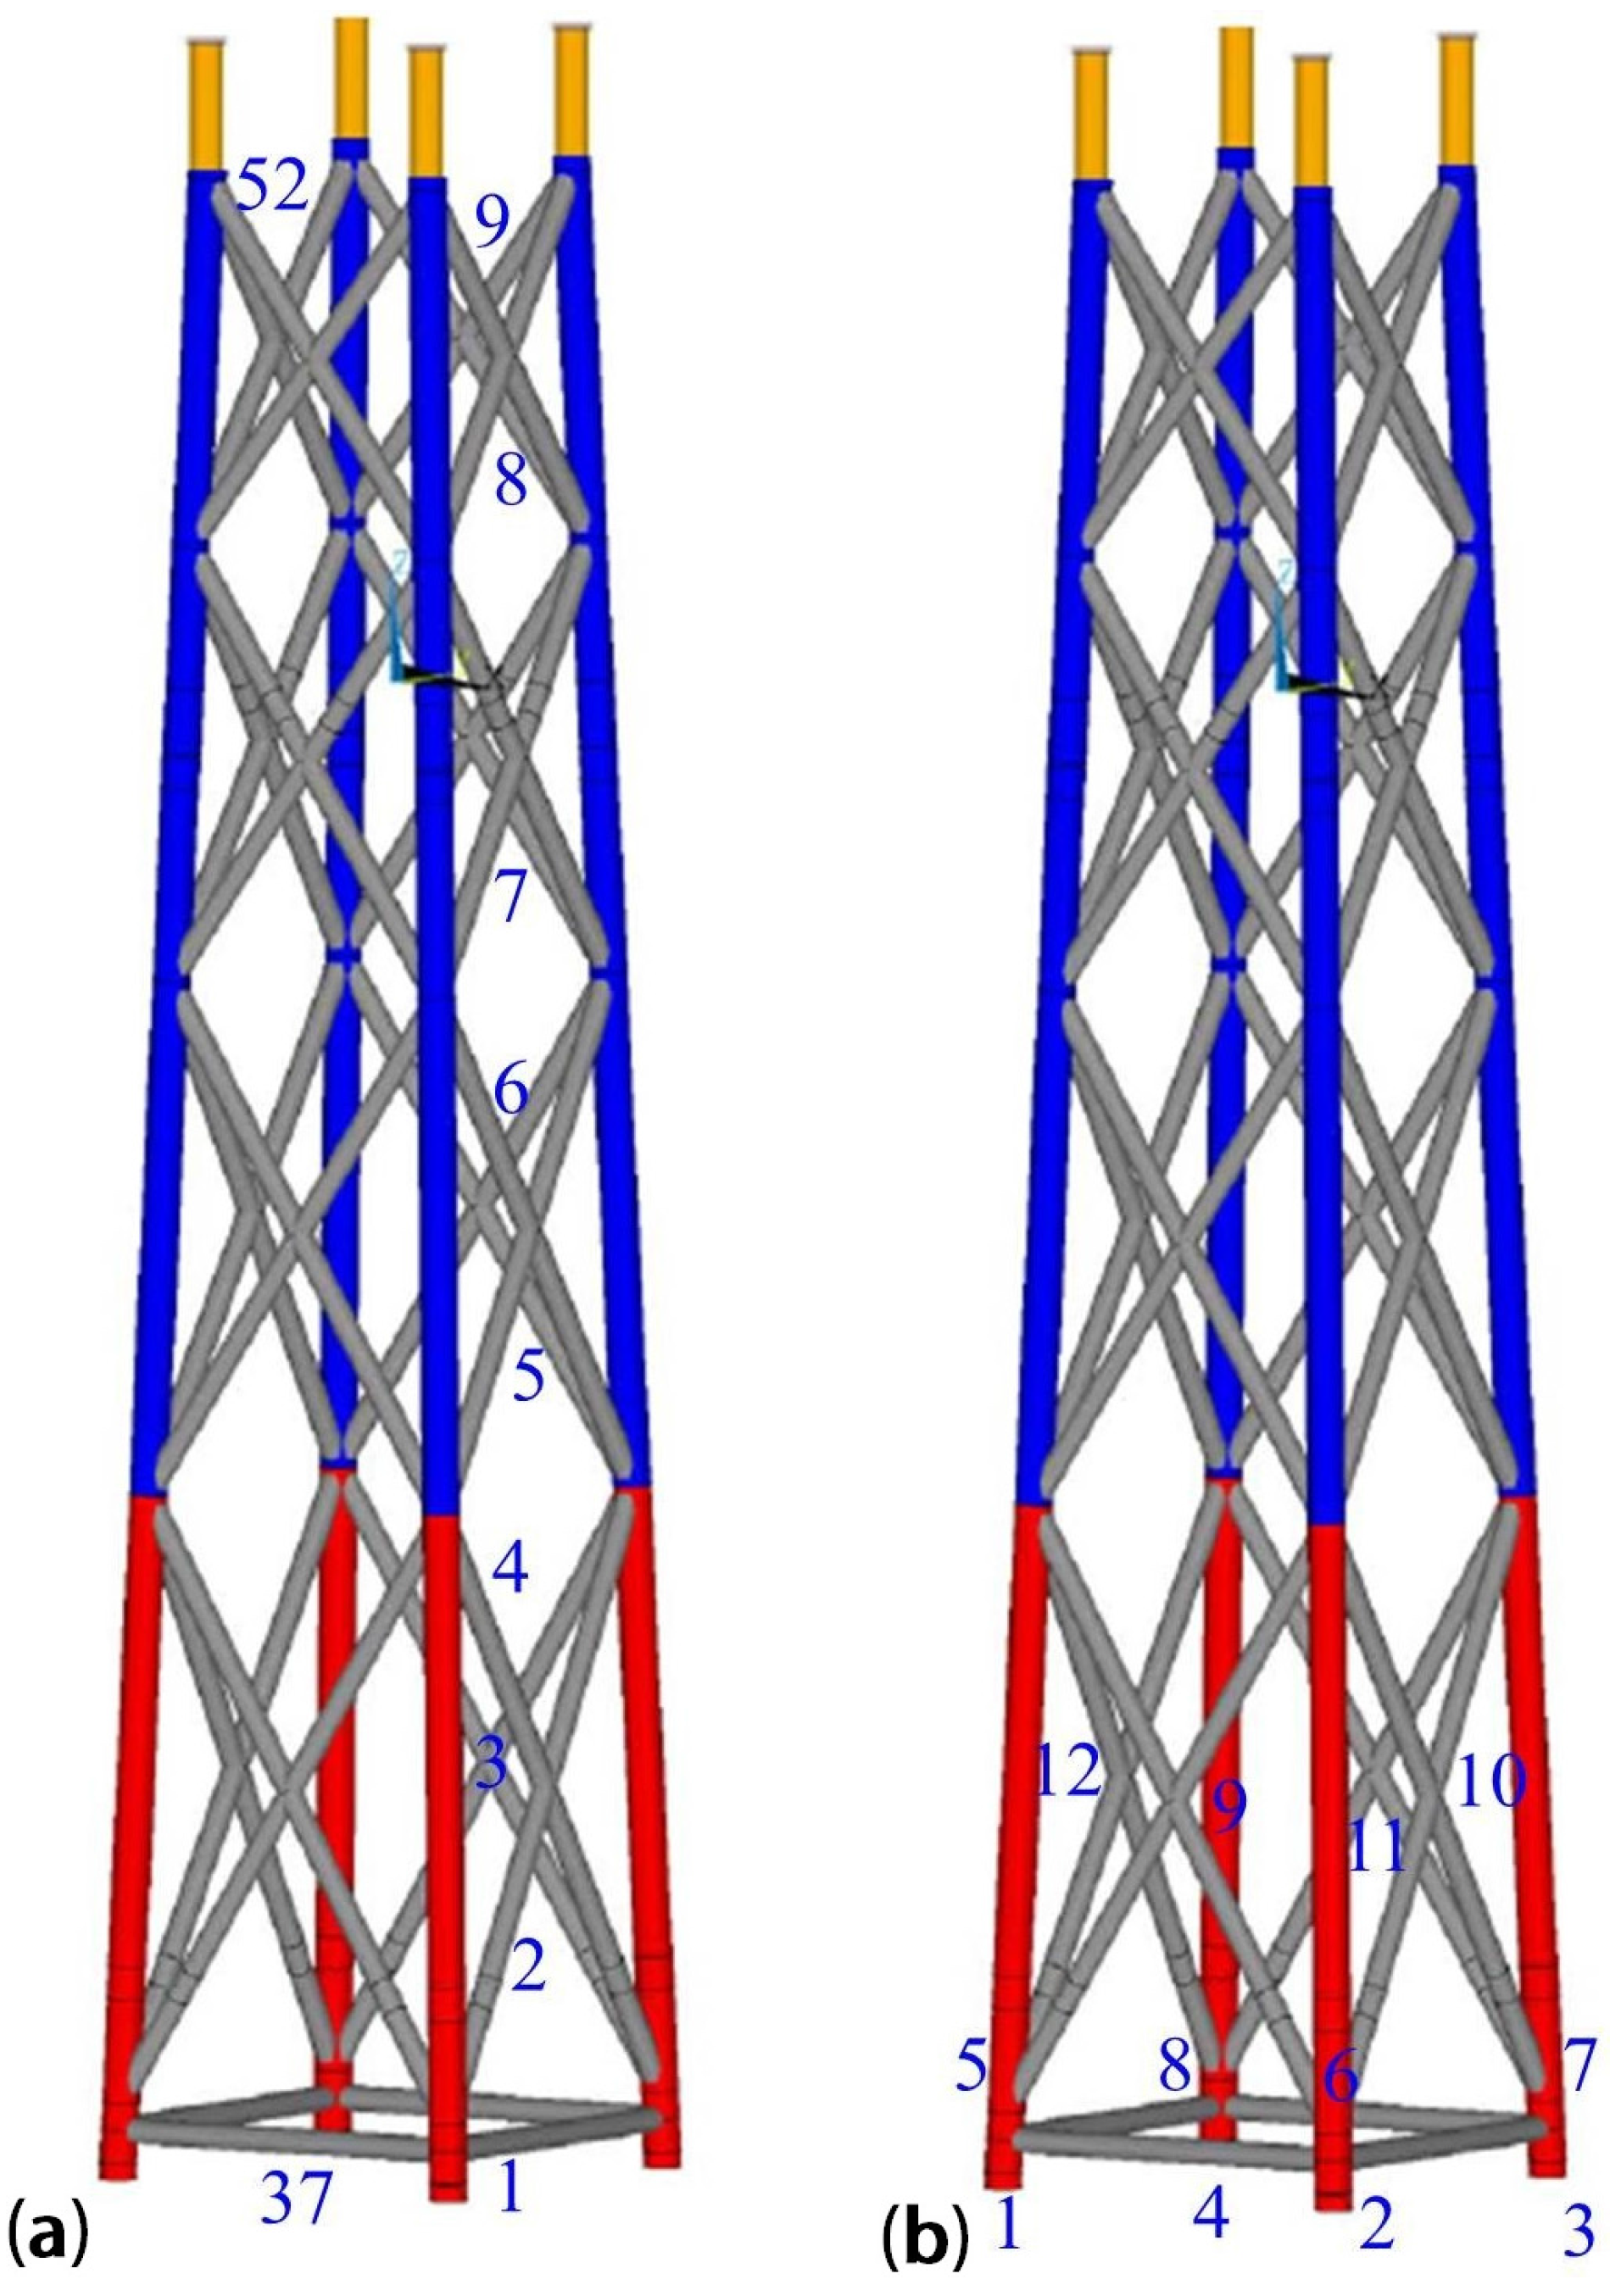
24]. The joints are assumed to be perfectly connected. As a result, the local joint flexibility and the overlap of joints have not been taken into consideration in this work. The definitions of “Member No.” and “Joint No.” for jacket substructure are illustrated in Figure 18. Each leg (the dotted line in 
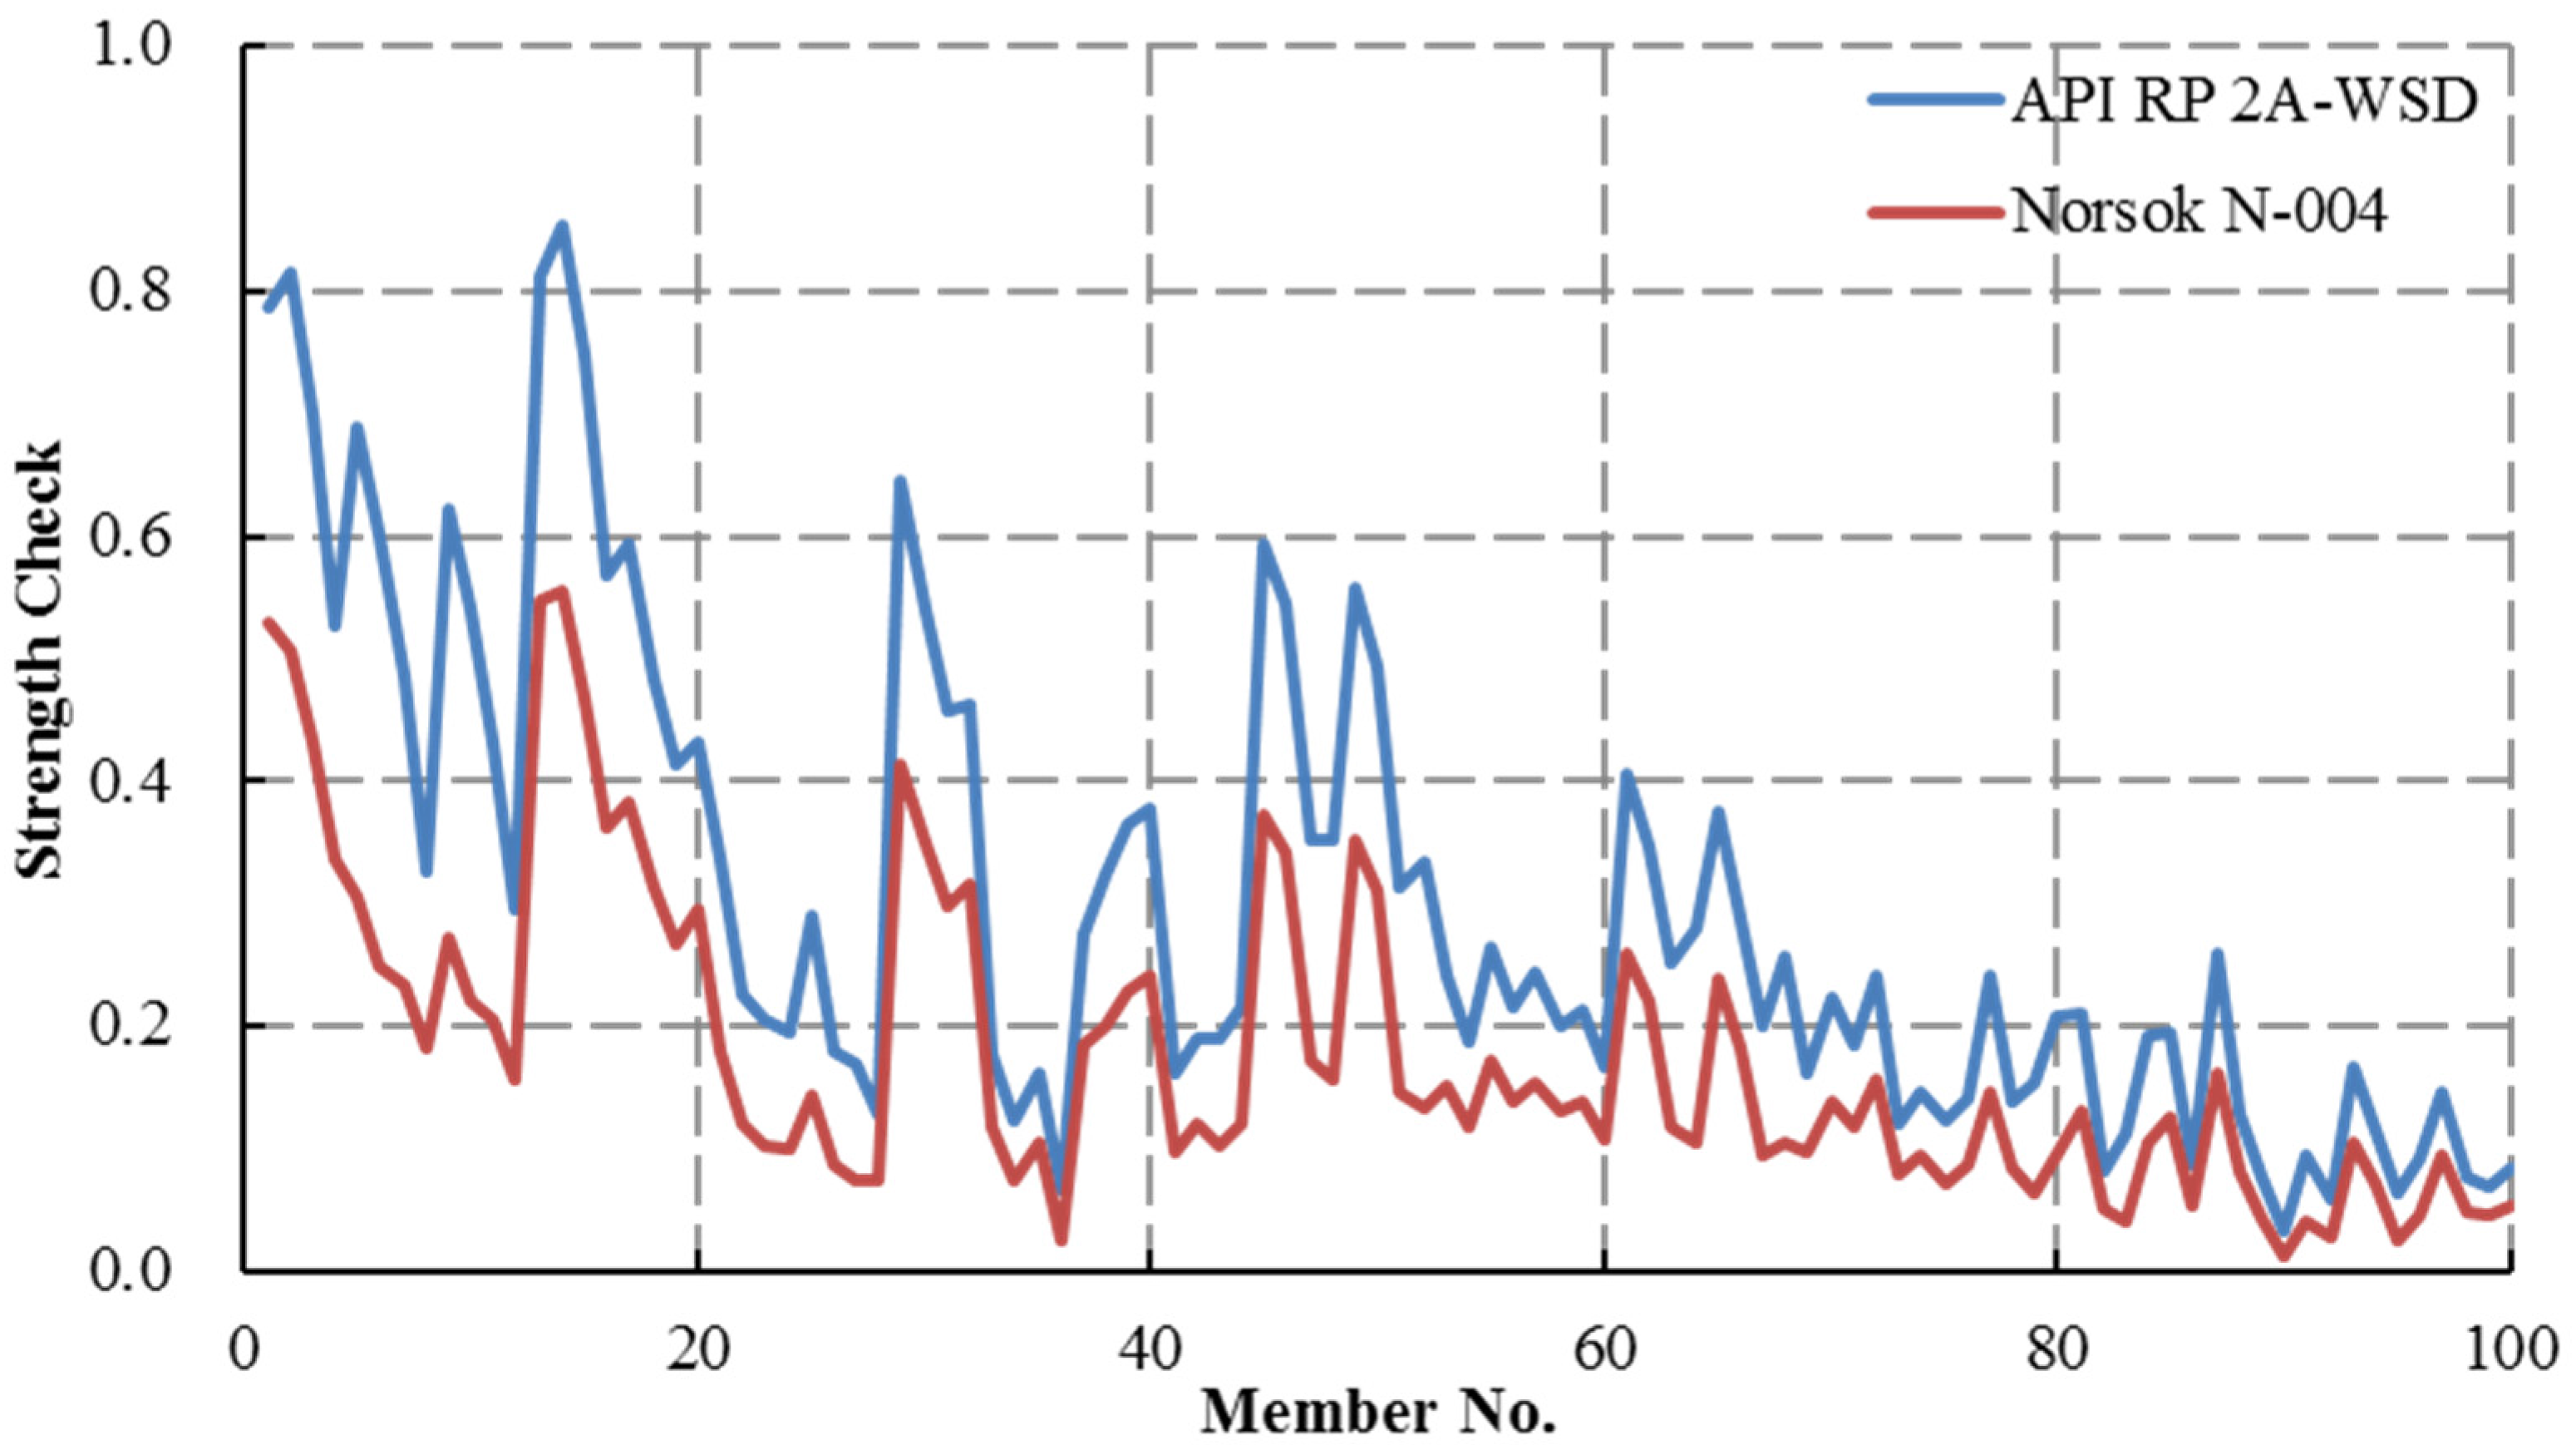
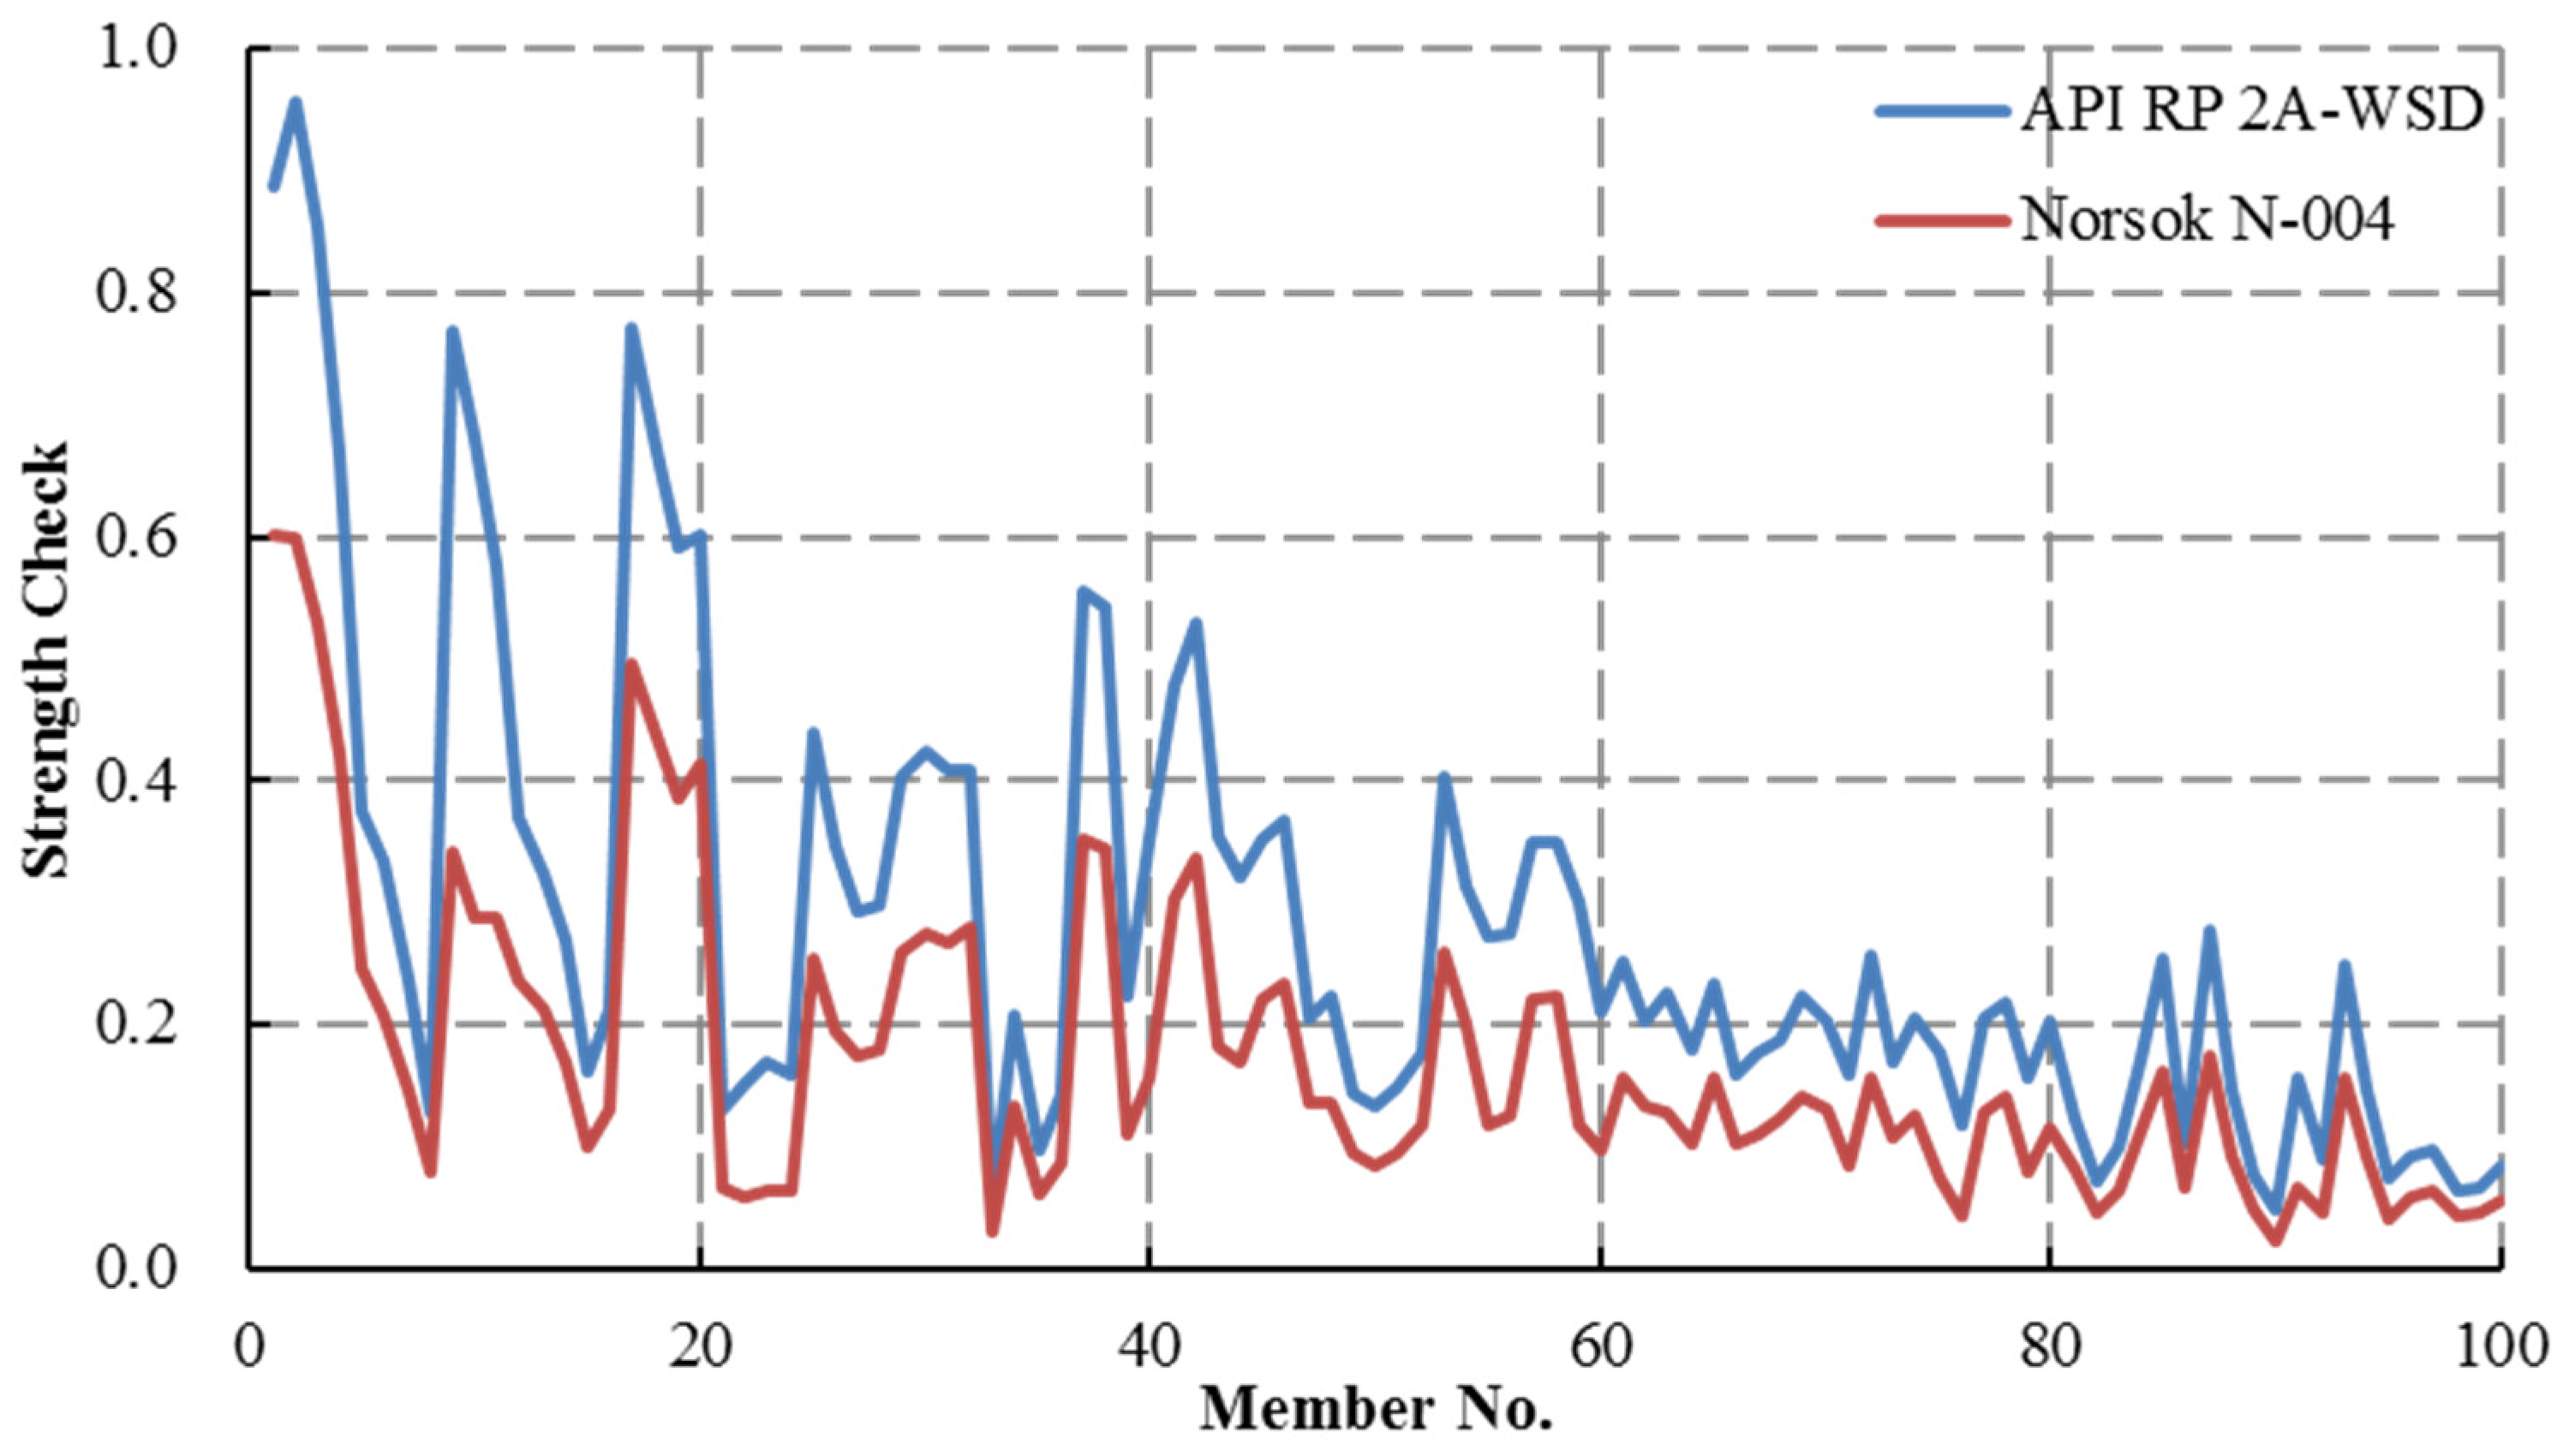
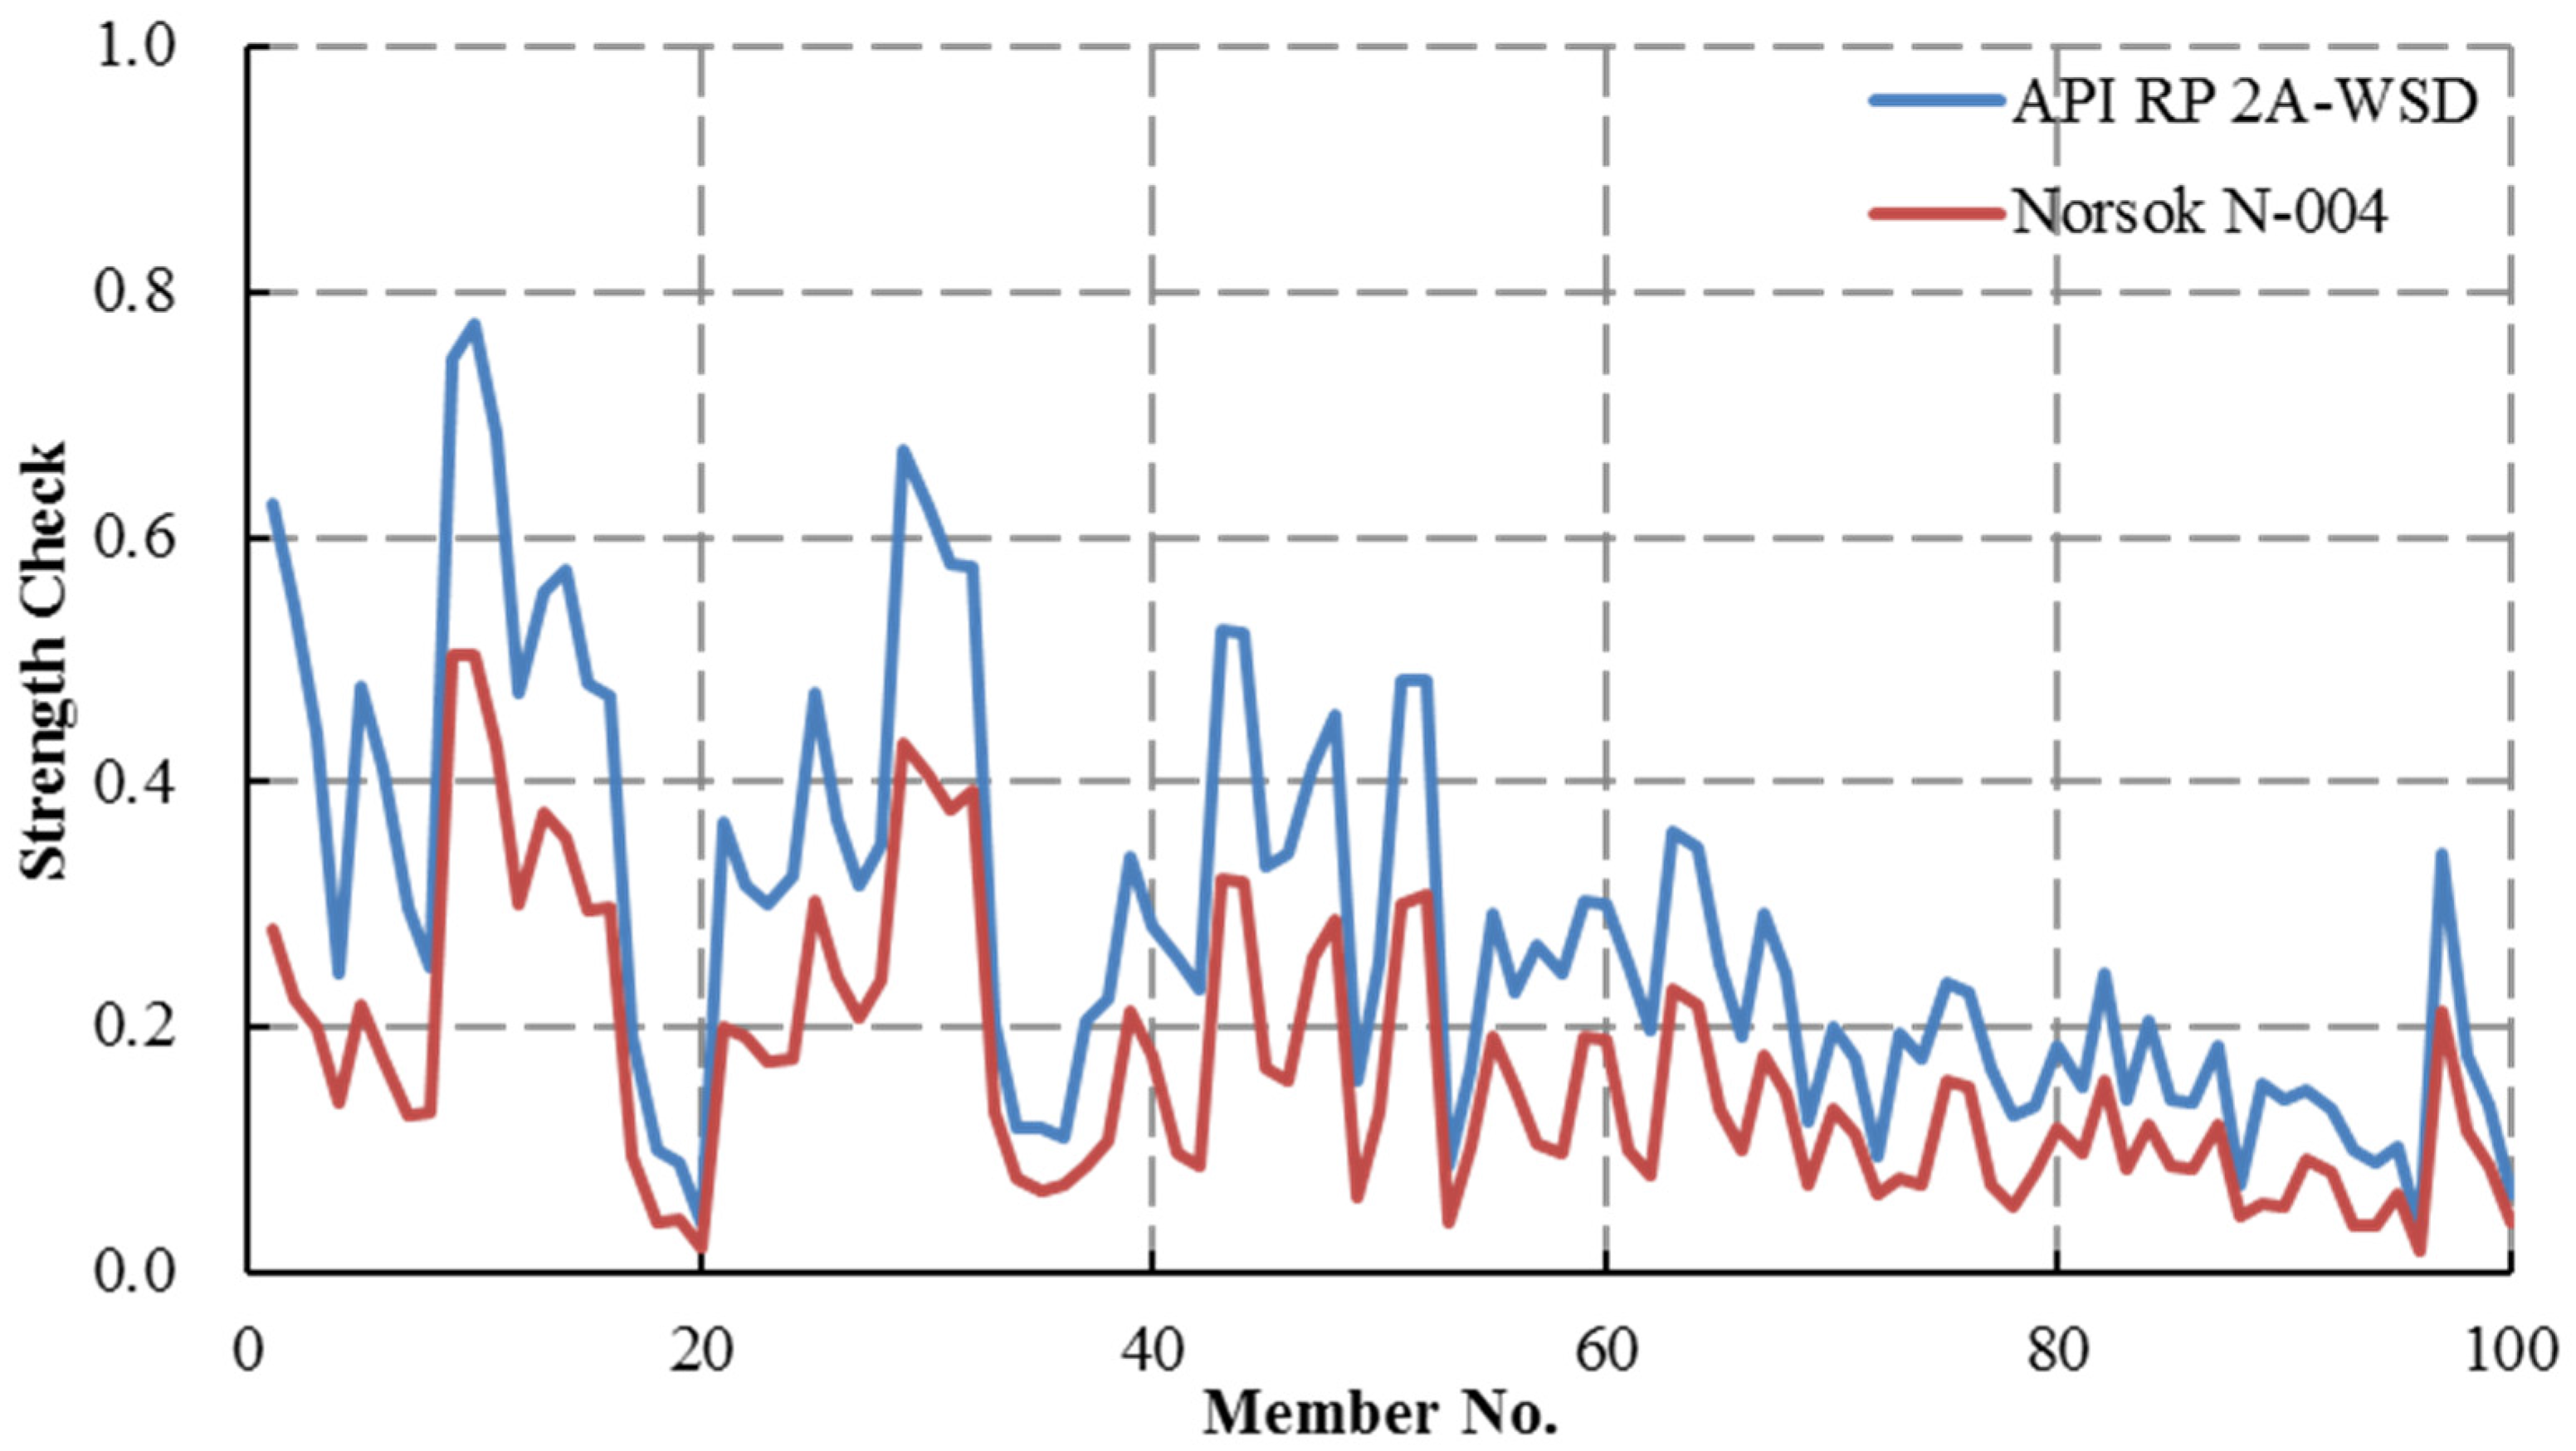
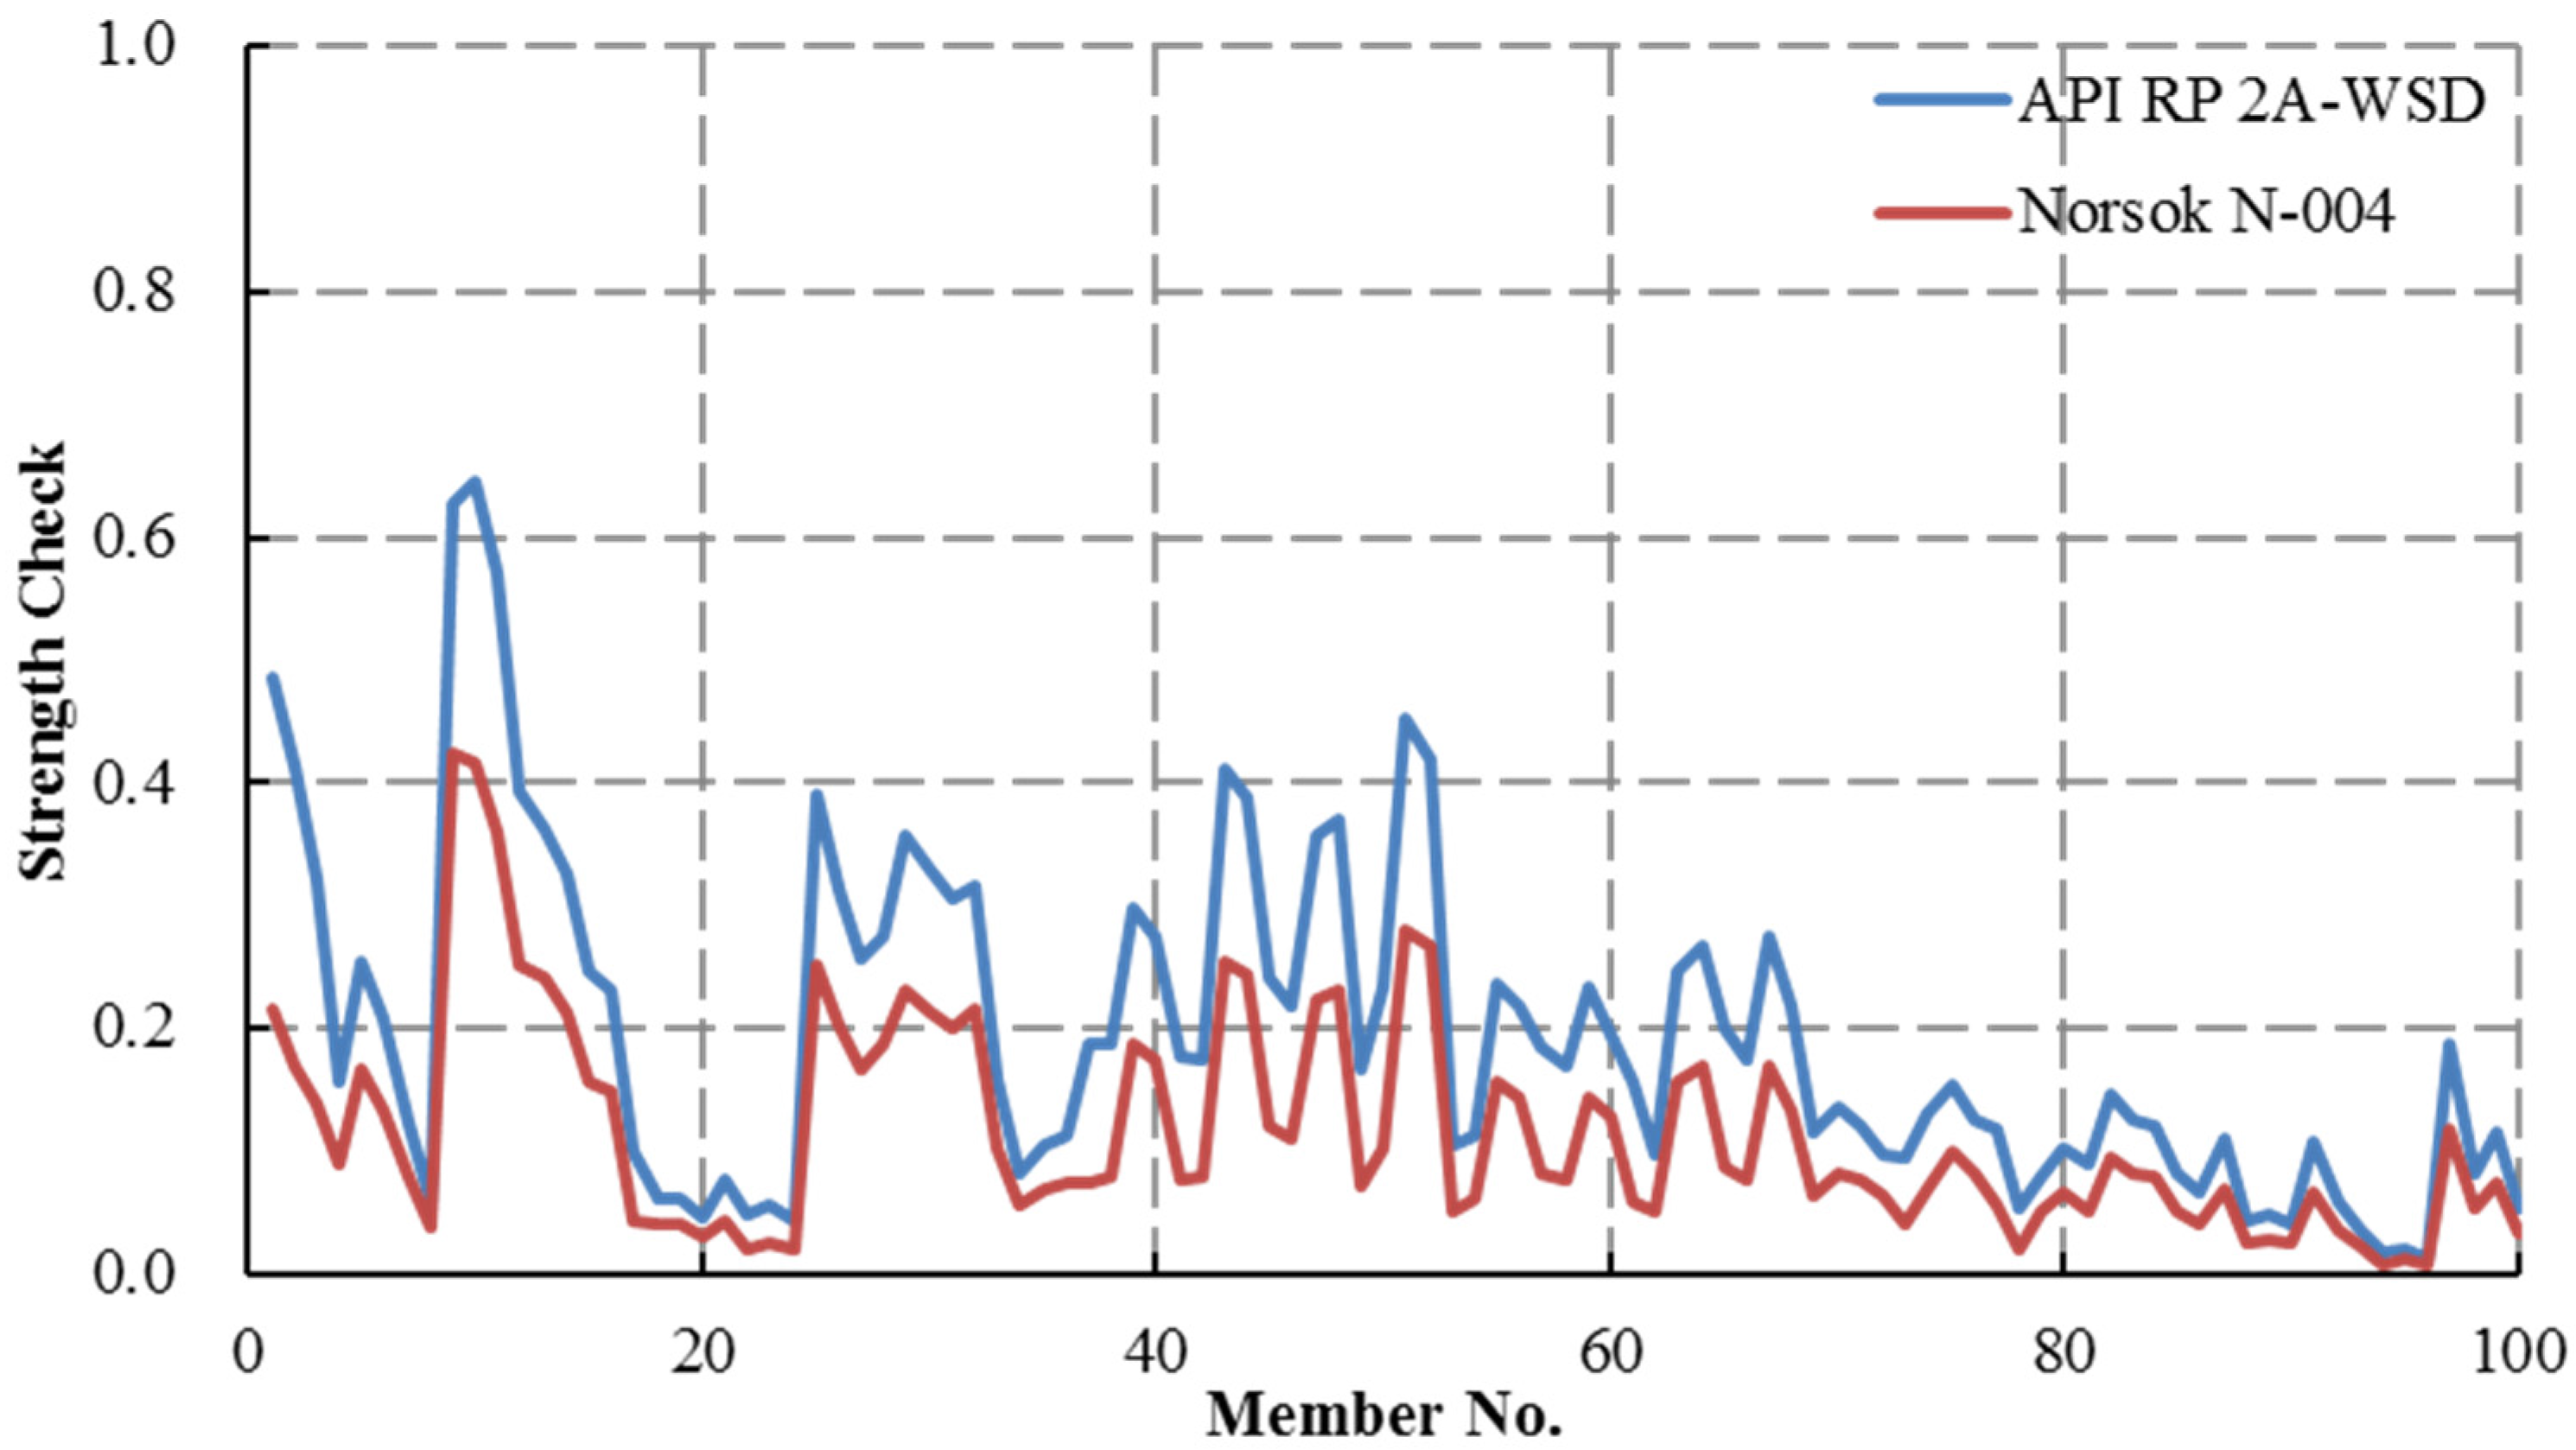
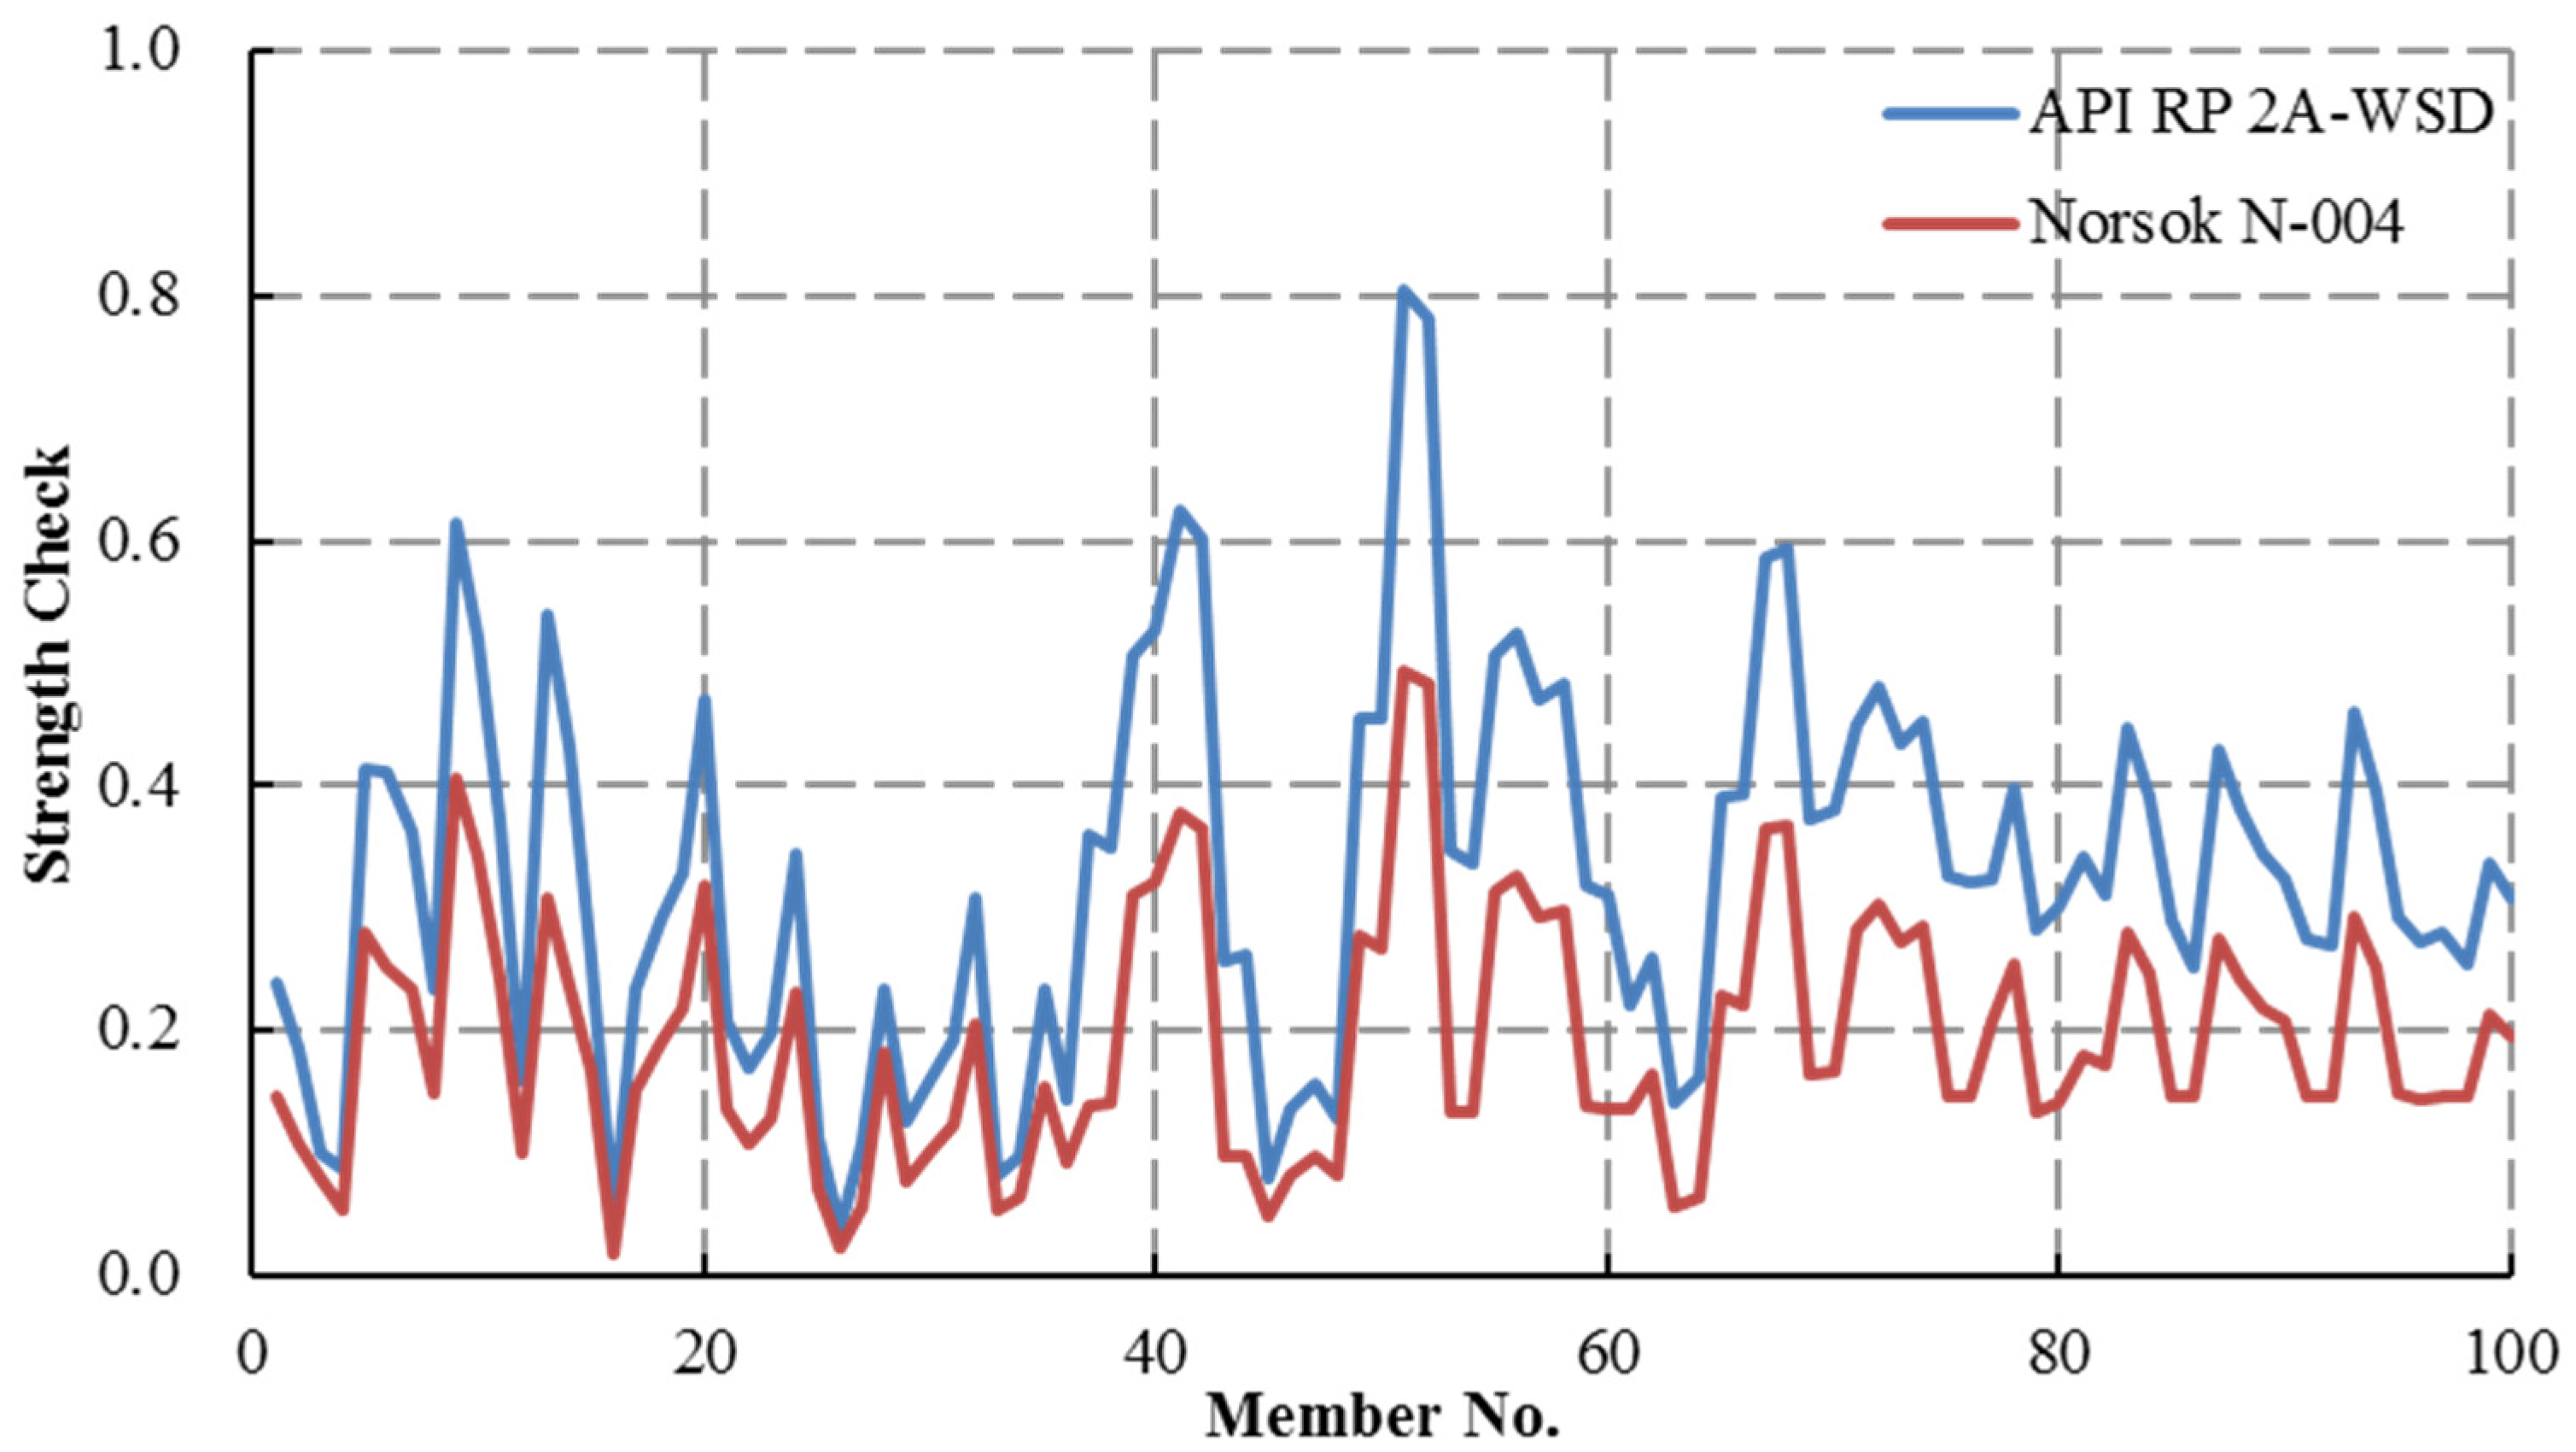
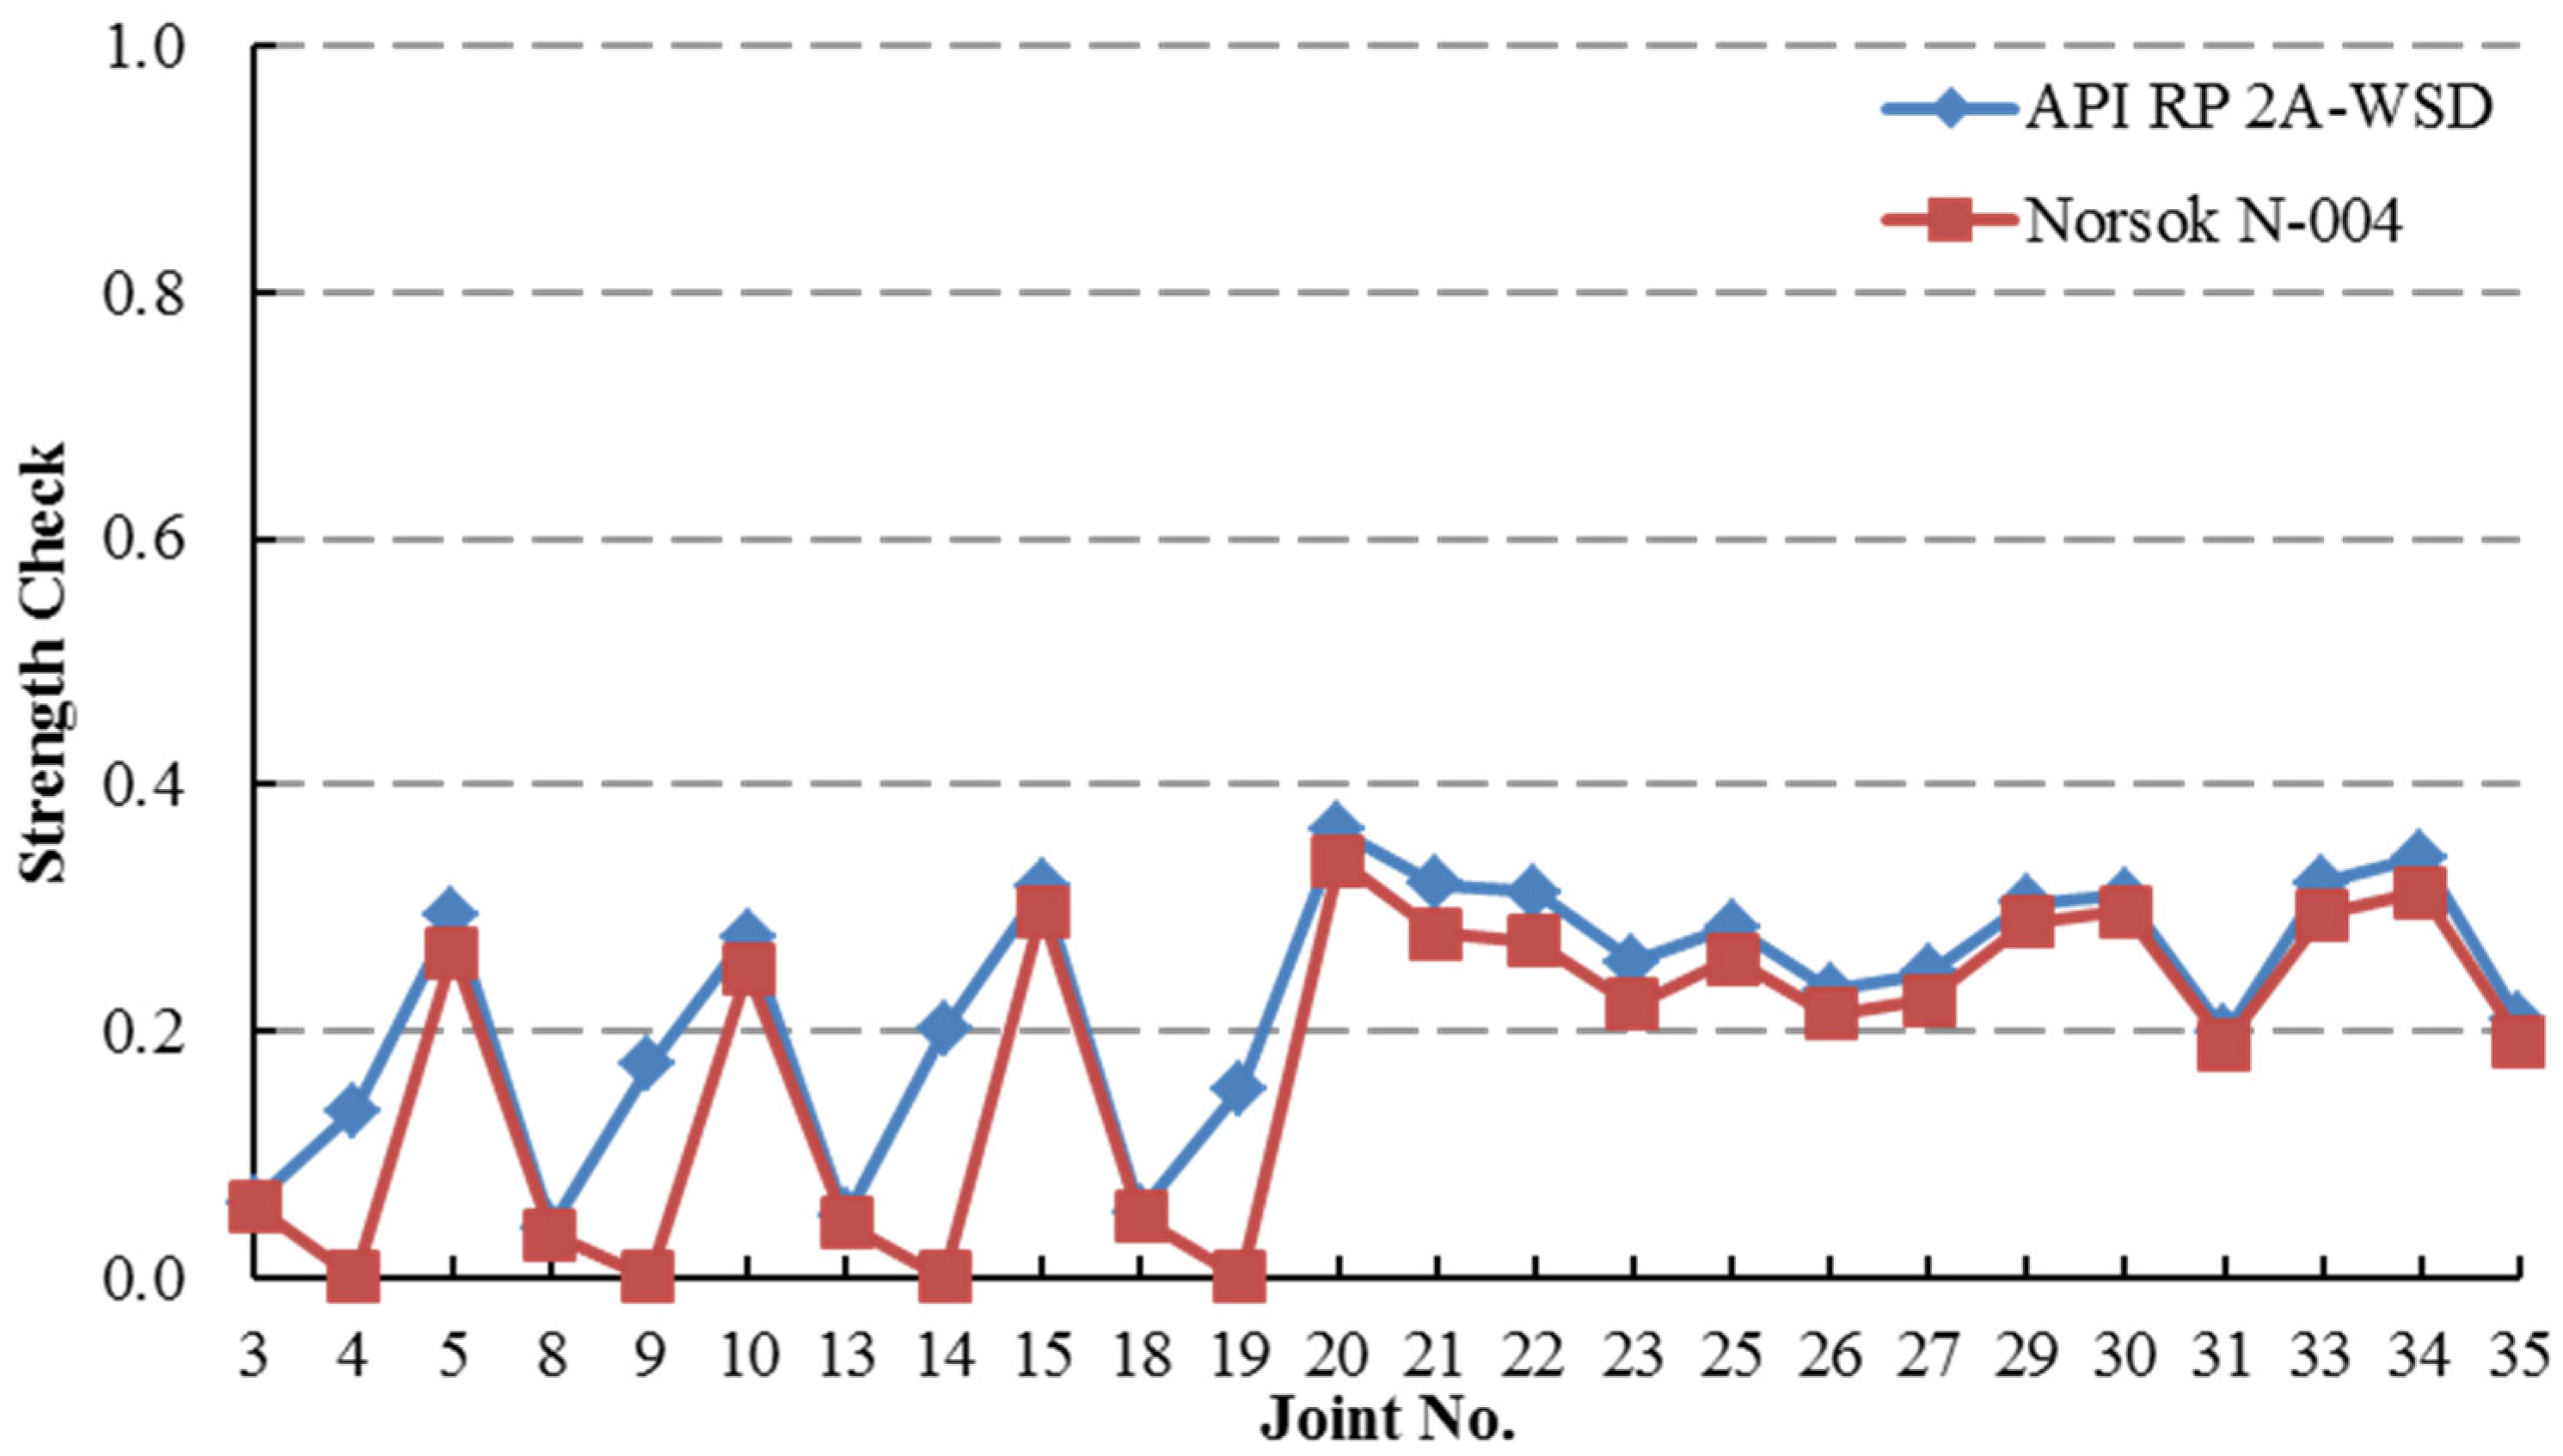
Figure 18) is divided into nine members and totally 36 members define for four legs. The chords between four legs are divided into 64 members. As a result, a jacket substructure is composed of 100 members. On the other hand, the joint is numbered bottom up and counterclockwise. The simulation results of member strengths for Case 1–Case 6 are shown in Figure 19, Figure 20, Figure 21, Figure 22, Figure 23 and Figure 24, respectively.
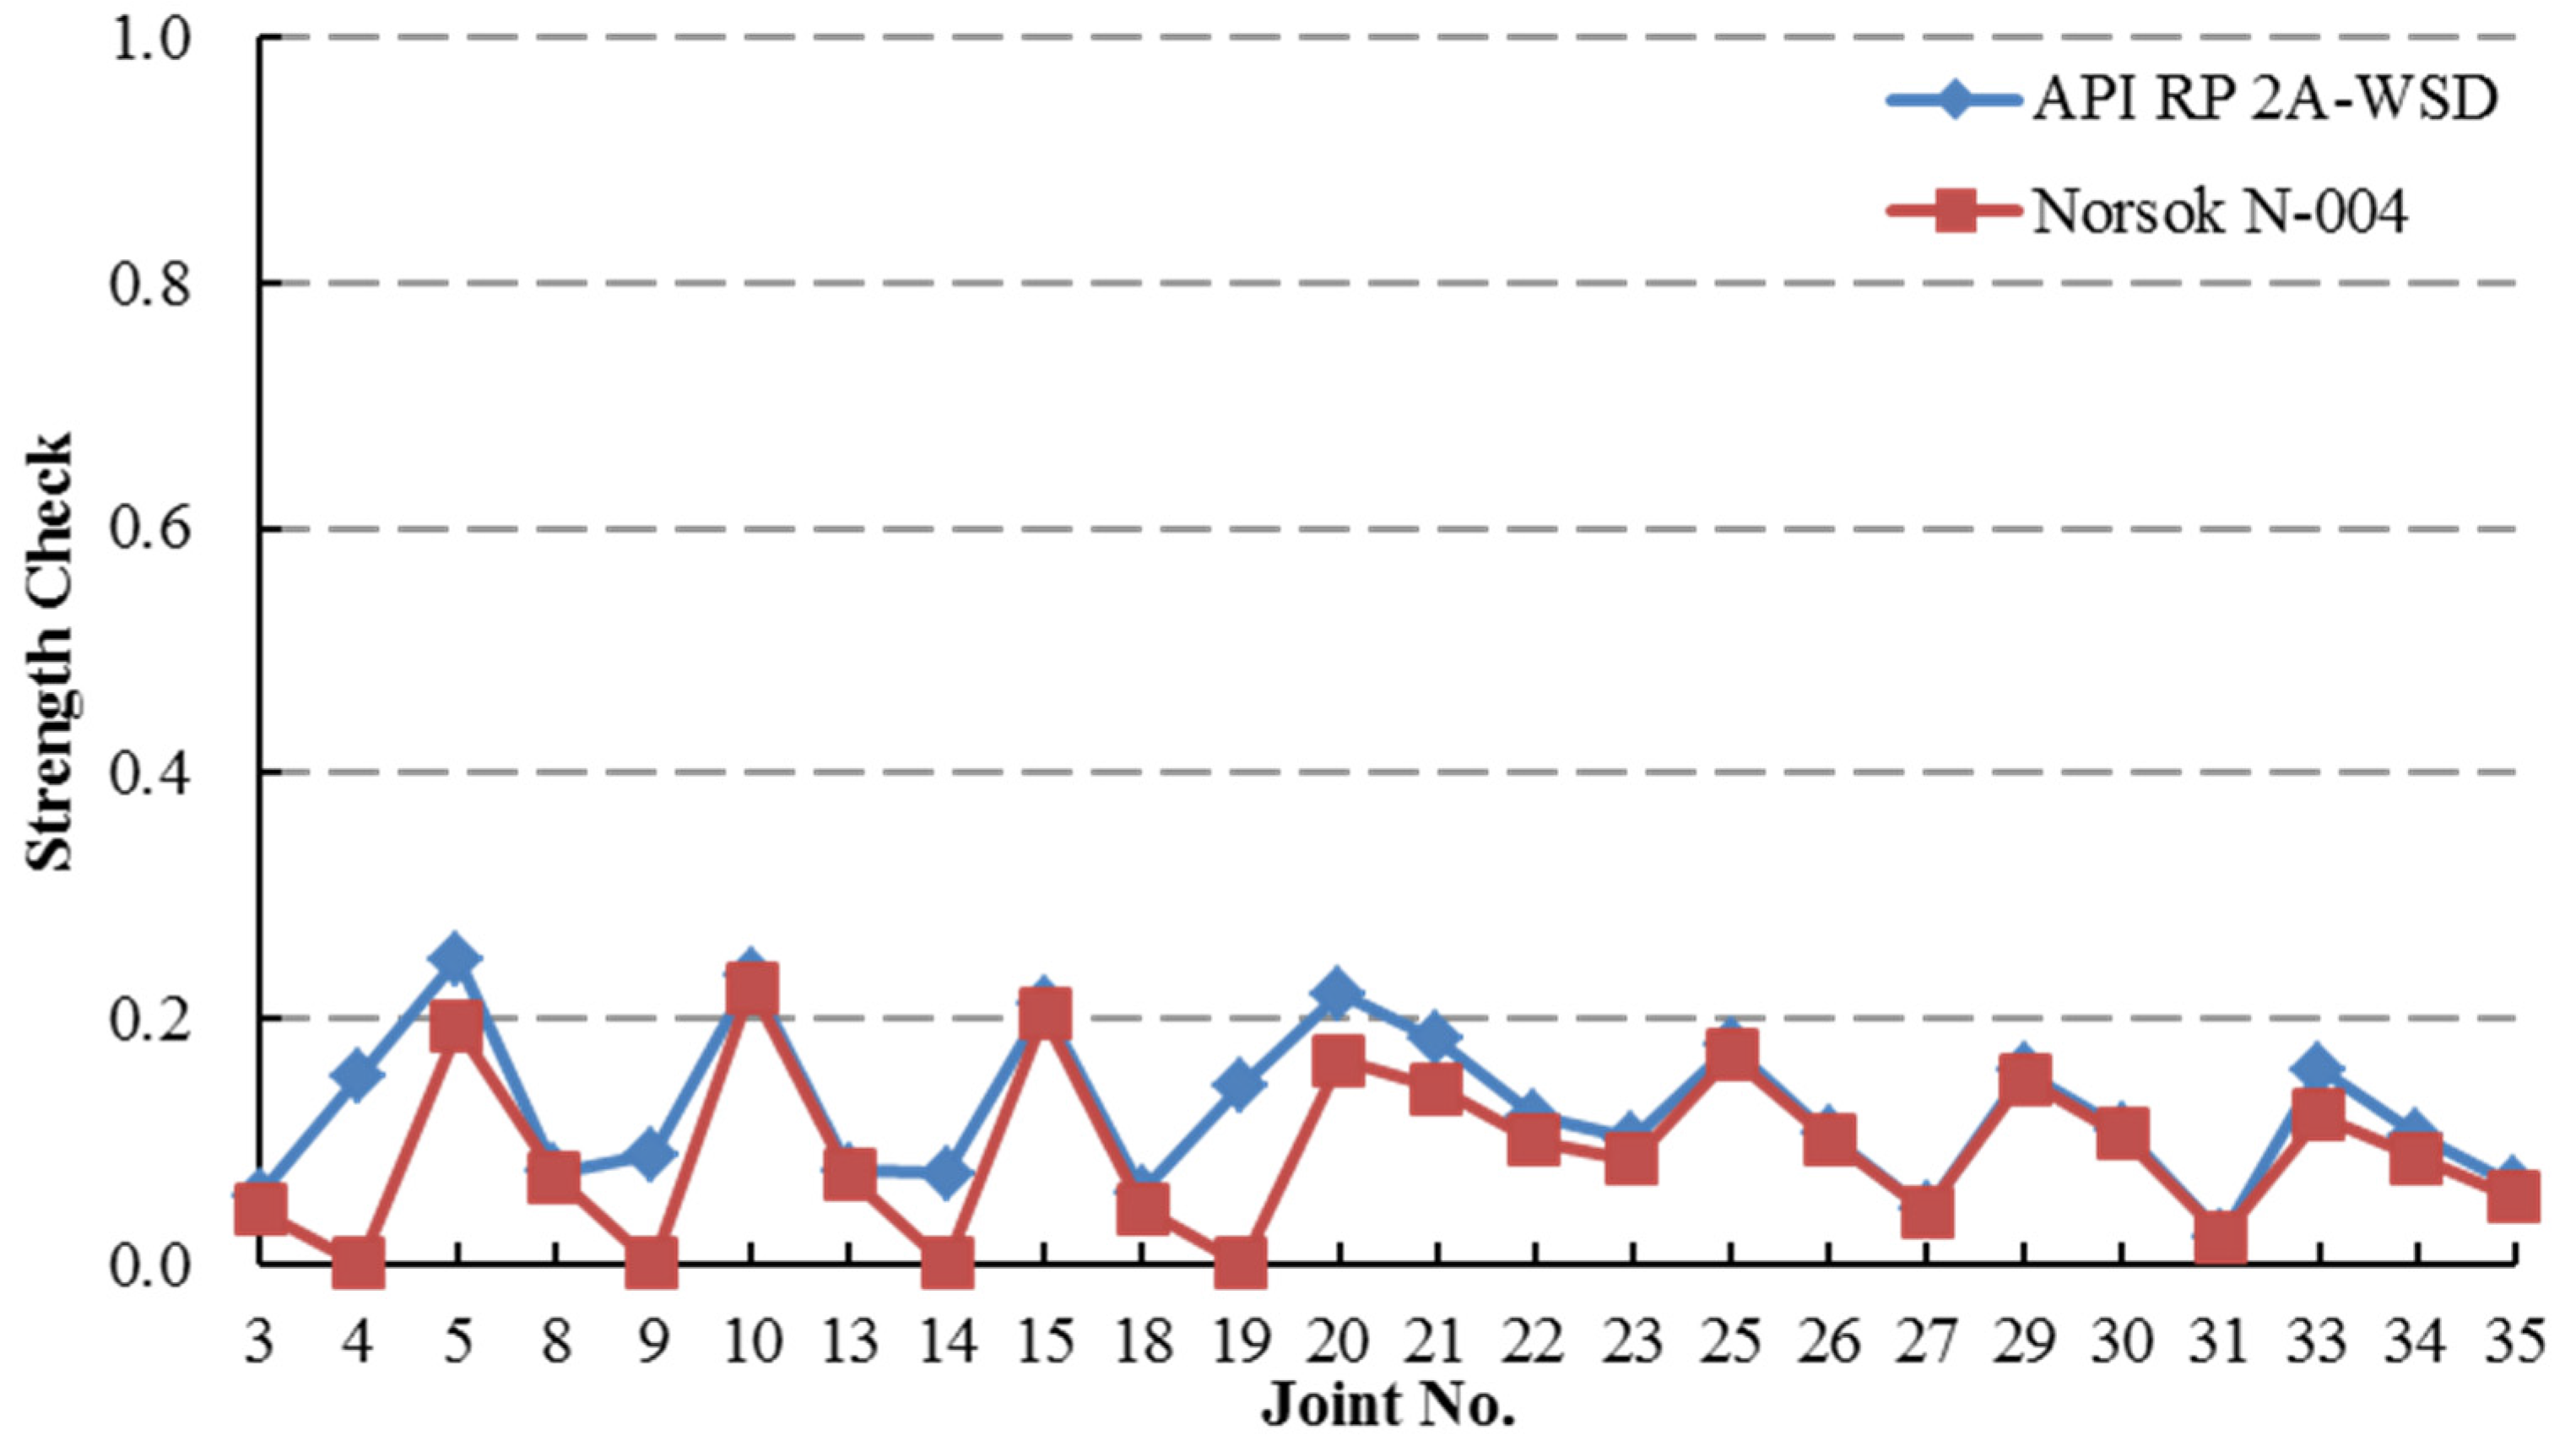
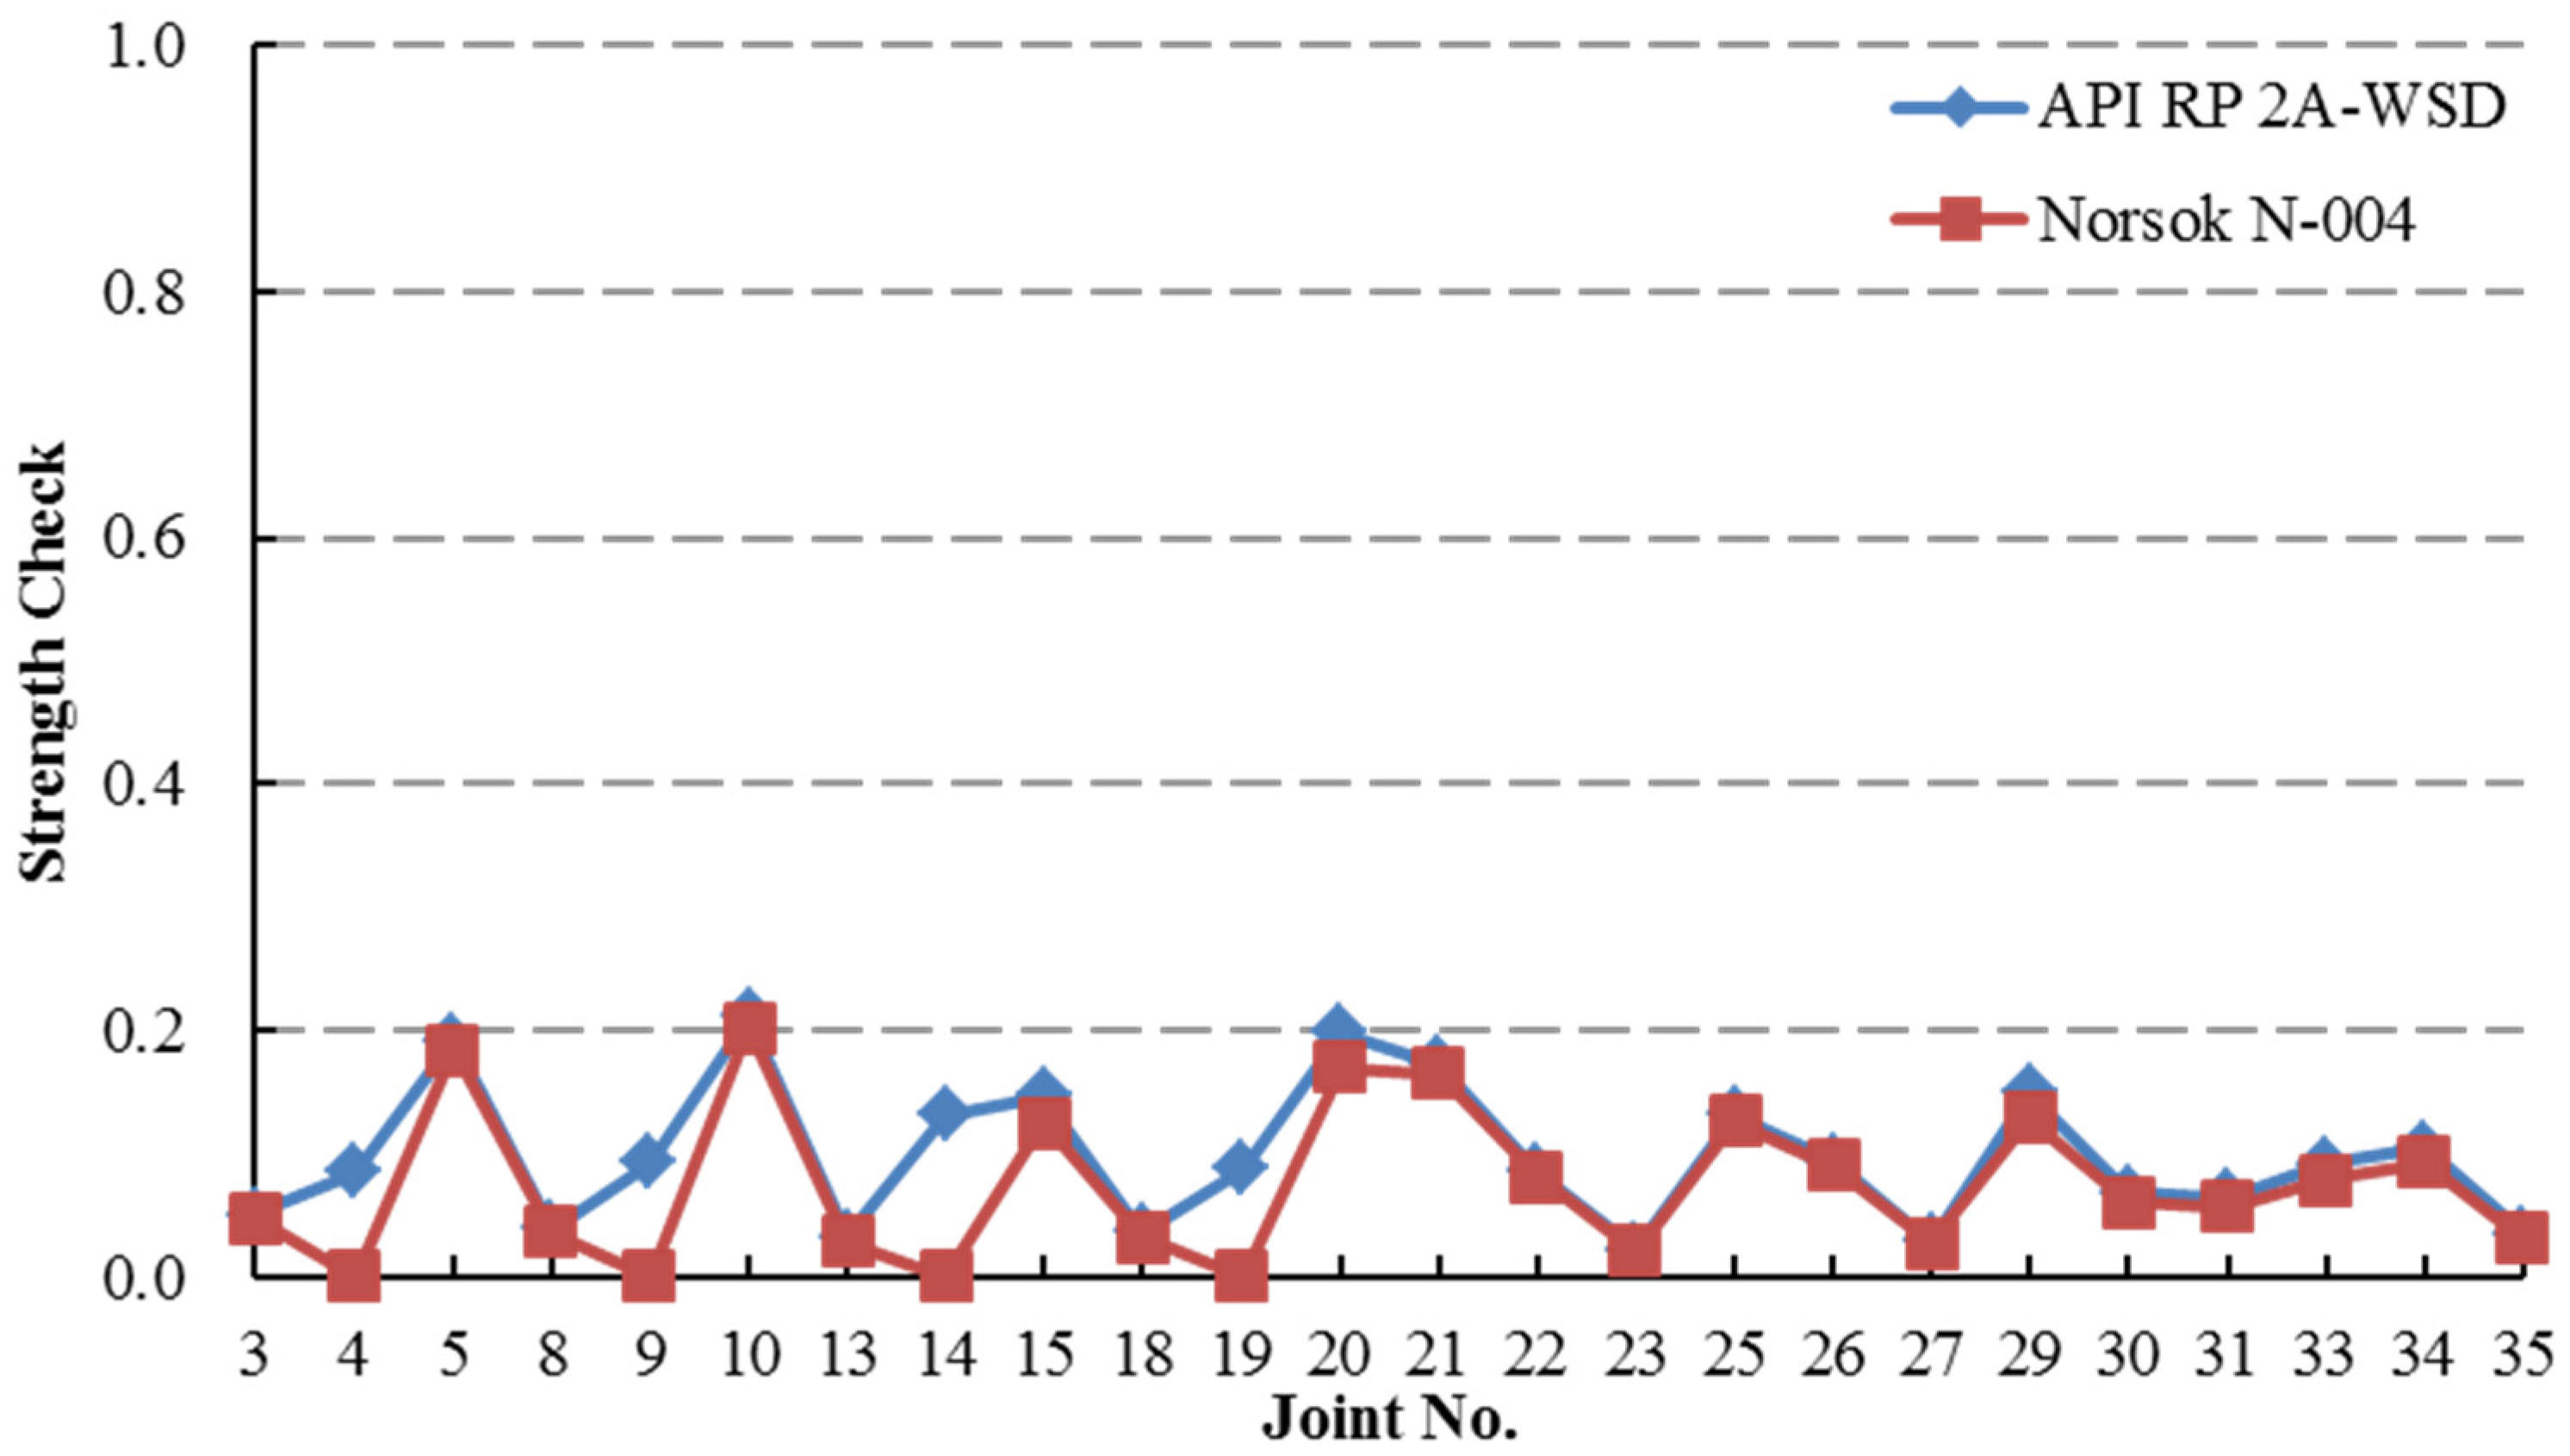
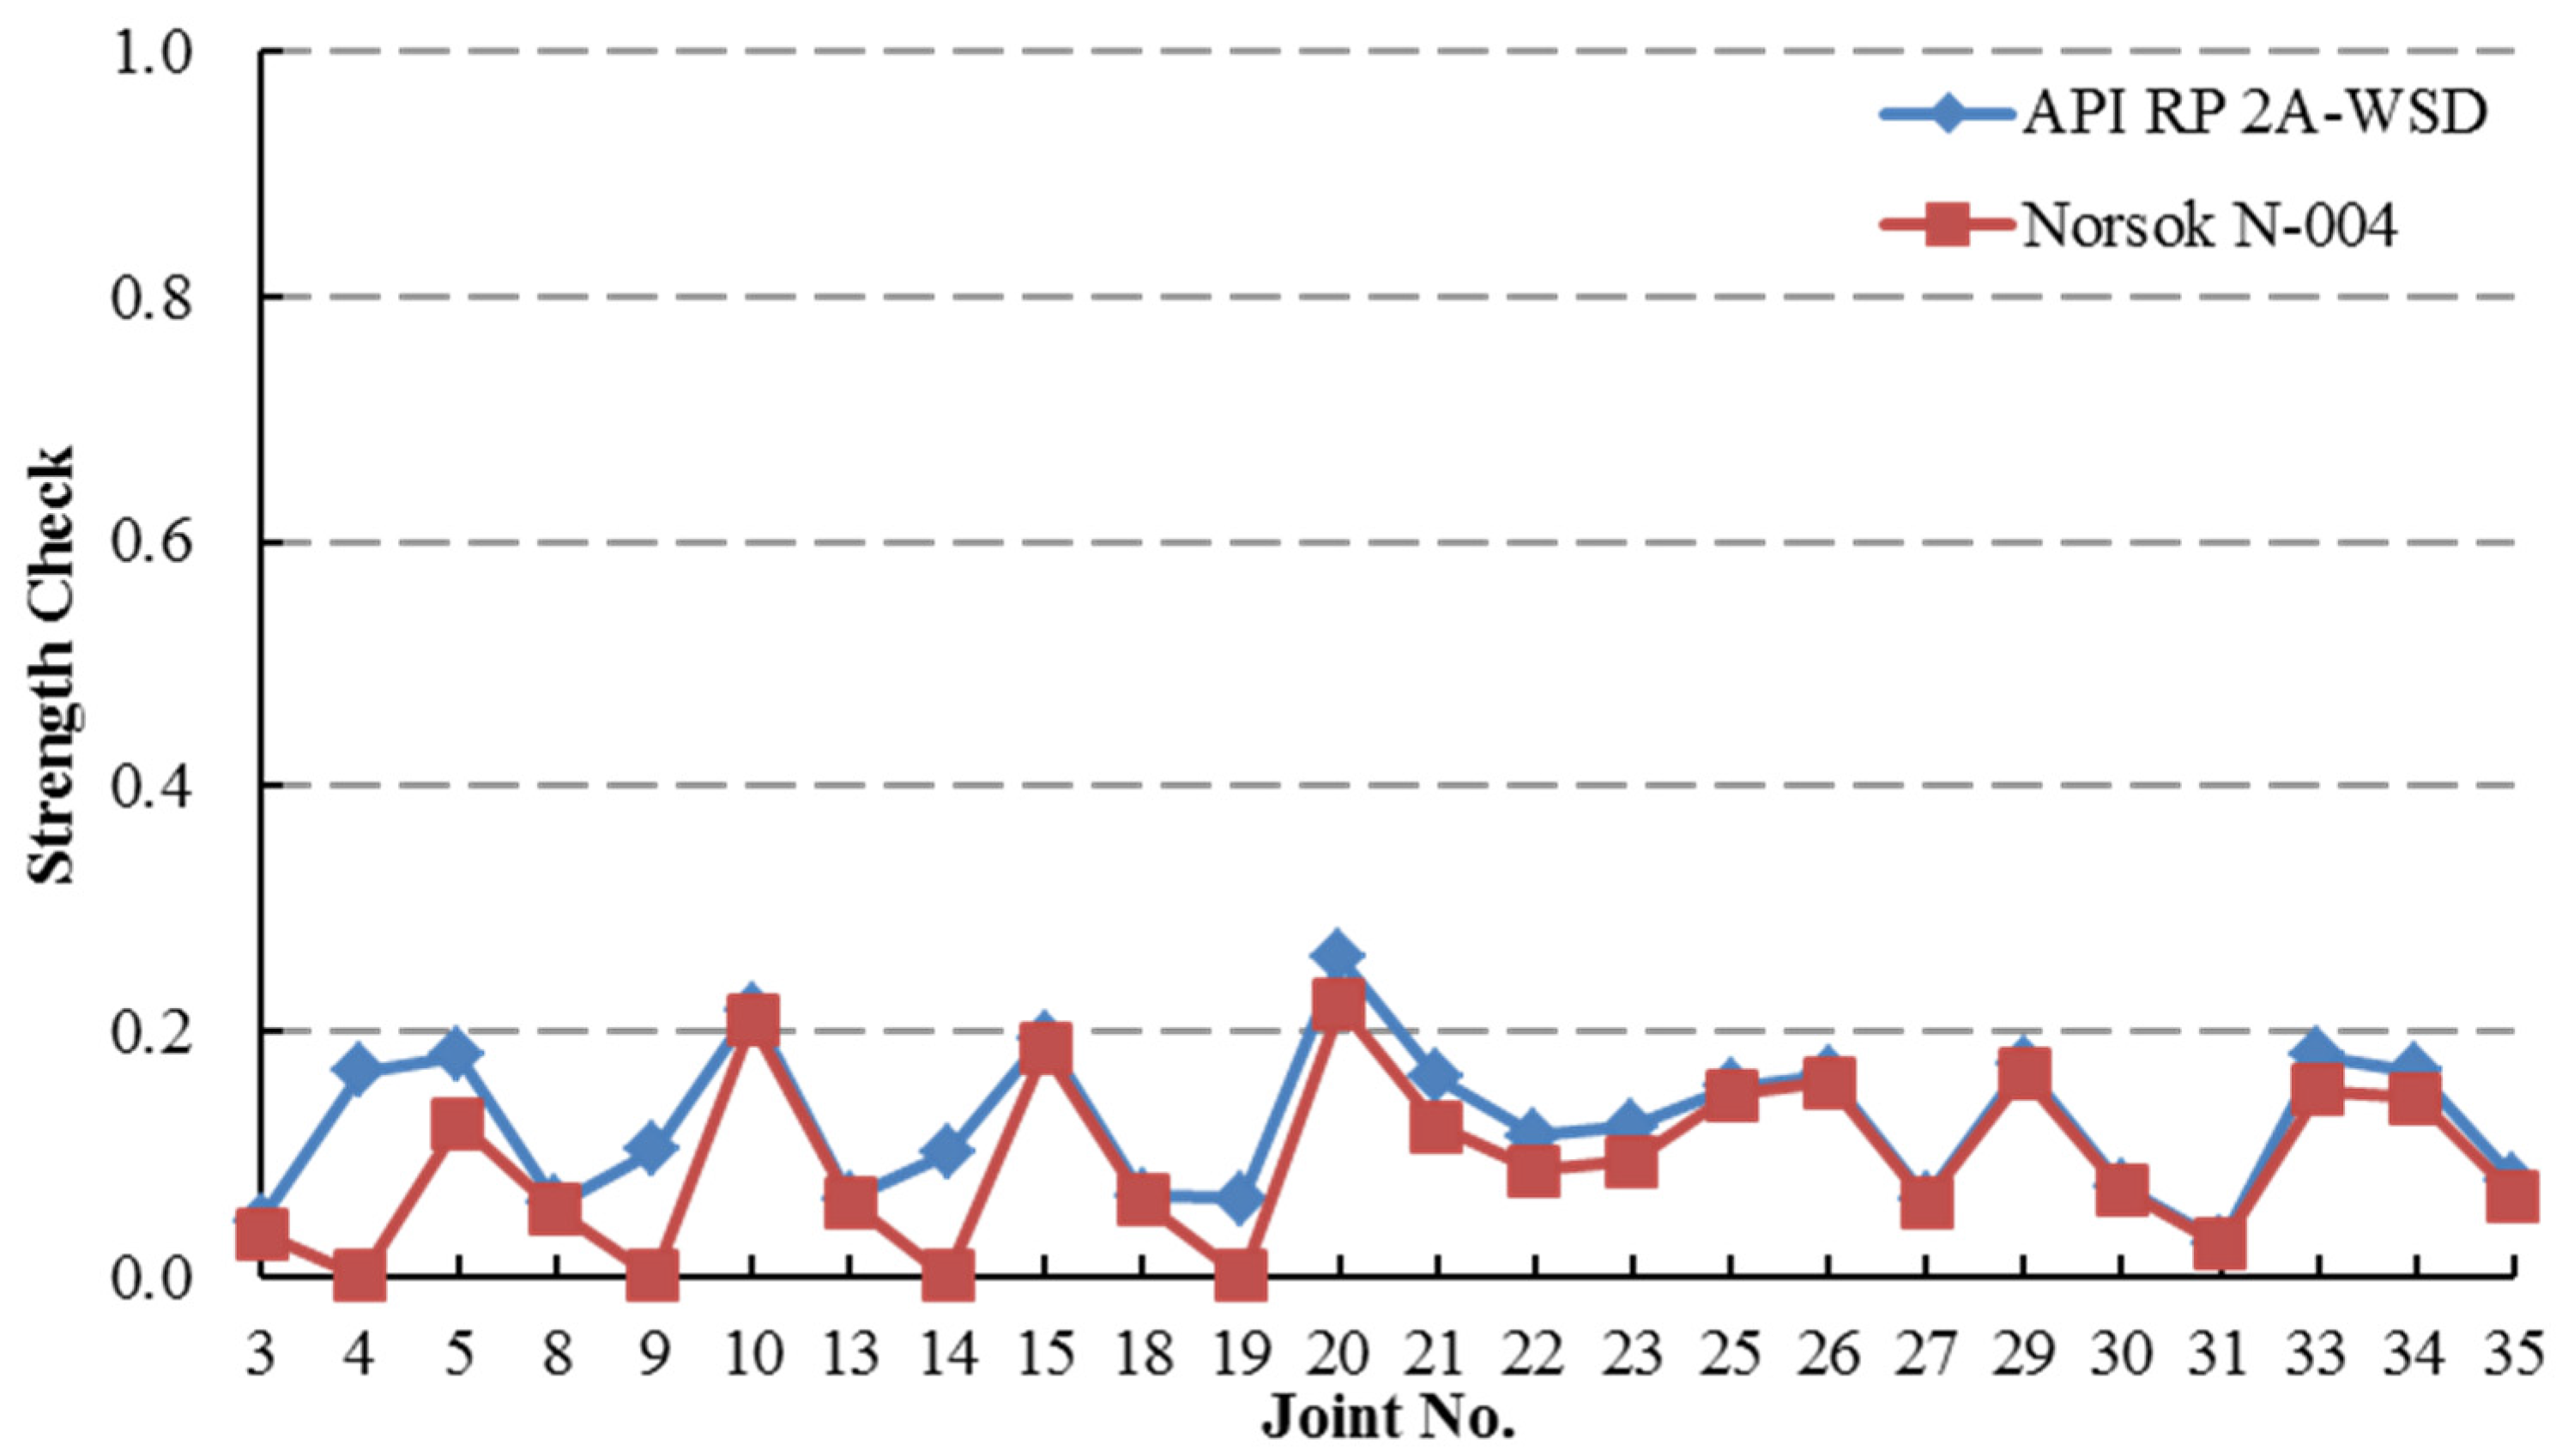
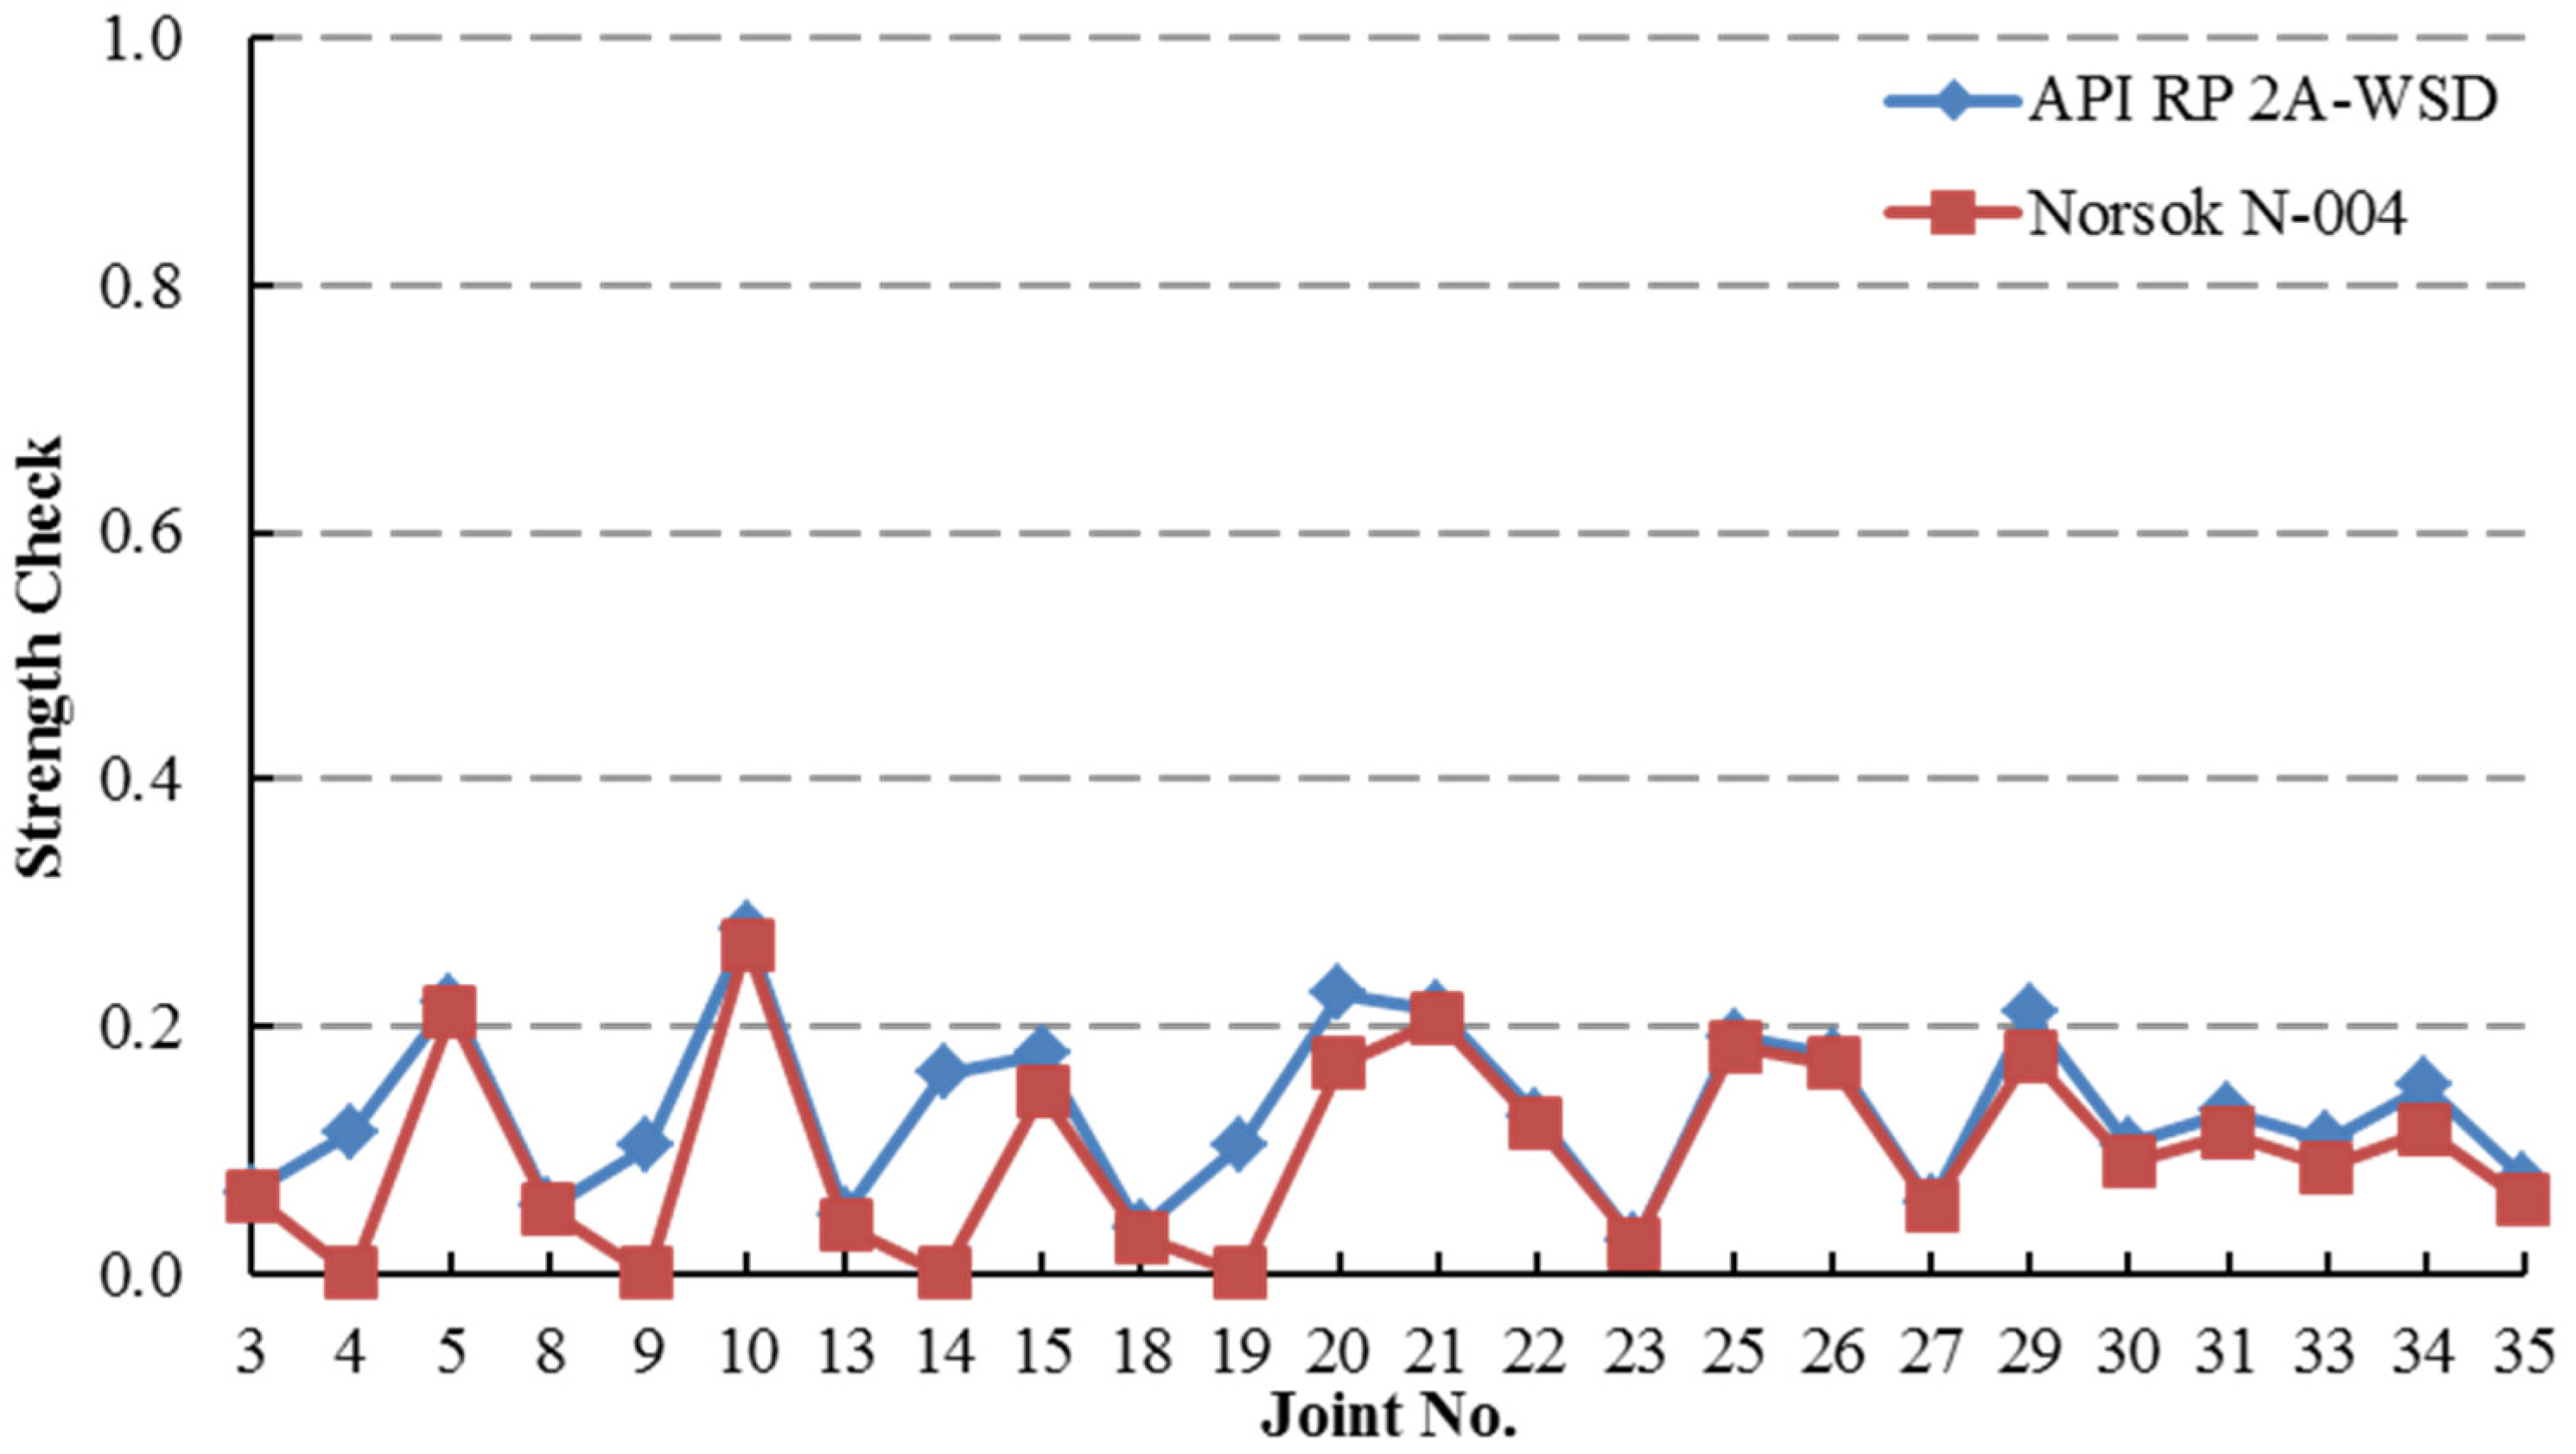
All of the member strengths by API standard are higher than those by NORSOK standard. In other words, API standard is more conservative against the structure components design than NORSOK standard. Furthermore, the strengths of the first 20 members are generally stronger than that of rest members. This is because those members are located close to the bottom of jacket structure (close to the seabed). Based on these results, more attention should be paid to the bottom structure design of jacket substructure regarding the loading of axial forces and moments. The resulted punch shear strengths for joints are demonstrated in Figure 25, Figure 26, Figure 27, Figure 28, Figure 29 and Figure 30. It is obvious that the joint shear strength in Case 6 is higher than those of the other cases. The induced torsion in Case 6 (see Table 10) becomes a loading to the jacket structure and finally leads to the increase of shear strength. However, all of the simulation results are within the safety threshold.

7. Conclusions

The importance of OWTG support structure dynamics has been identified by IEA OC3 and OC4 projects over the past decade. The substructure dynamics should be treated as a part of full system dynamics when OWTG installed in the sea. For clearly exploring the interaction of substructures and OWTGs, various types of support structures were investigated in the individual phases of OC3 and OC4 projects. The environmental impacts for OWTGs are varied according to the OWTG installed location. In order to establish the OWTG design technologies of Taiwan, a low cost and simplified analysis method has been proposed in this work. The main results are summarized as follows:
*
Time consumption for analyses is much reduced. In this work, totally 1512 (1296 + 216) cases have been investigated. For one case (a ten minutes simulation), the dynamic analysis of an equivalent model can be accomplished within 20 min but a detailed analysis by software Bladed takes at least 6 h. The proposed analysis method is much fast than the standard method.
*
No expensive software is included. All of the involved software is freeware or low-cost computer program.
*
The decoupled method is helpful for the initial design phase. Since the analysis of OWTG system by the proposed method does not take much time, many DLCs can be performed to check the system design.
*
A method for equivalent monopile model construction has been proposed. The aerodynamic analyses of wind turbines are often investigated with the aid of FAST. However, complex support structures cannot be included in FAST simulations. With the aid of software BModes 3.0, an equivalent monopile for the jacket substructure can be built and enclosed in the OWTG analysis under FAST.
*
According to the analysis results of strength check for members and joints, the loadings are highly determined by the environmental variations. As a result, the DLC and the operational situation should be investigated as much as possible.
*
More attention should be devoted to the bottom of jacket substructure due to the loading of axial forces and moments.
*
API standard may be more suitable for support structure design under rigorous environment.

Acknowledgments

This research was sponsored by the Ministry of Science and Technology in Taiwan under Grants MOST 104-3113-E-042A-003 and MOST 103-2218-E-167-002.

Author Contributions

Wen-Jeng Lai and Chin-Yu Lin performed the analyses; Wen-Jeng Lai, Chin-Yu Lin and Rong-Mao Lee analyzed the data; Chin-Cheng Huang contributed reagents/materials/analysis tools; and Rong-Mao Lee wrote the paper.

Conflicts of Interest

The authors declare no conflict of interest.

References

  1. Jonkman, J.; Musial, W. IEA Wind Task 23 Offshore Wind Technology and Deployment; Technical Report: NREL/TP-5000-48191; National Renewable Energy Laboratory: Golden, CO, USA, 2010.
  2. Muskulus, M.; Schafhirt, S. Reliability-based design of wind turbine support structures. In Proceedings of the Symposium on Reliability of Engineering System, Hangzhou, China, 15–17 October 2015.
  3. Marquez-Dominguez, S.; Sorensen, J.D. Fatigue reliability and calibration of fatigue design factors for offshore wind turbines. Energies 2012, 5, 1816–1834. [Google Scholar] [CrossRef]
  4. Fullenkamp, P.H.; Holody, D.S. U.S. Wind Energy Manufacturing and Supply Chain: A Competitiveness Analysis (Prepared for U.S. Department of Energy); Document DE-EE-0006102; Global Wind Network: Cleveland, OH, USA, 2014. [Google Scholar]
  5. Dolan, D. Deepwater fixed bottom wind turbine platform. In Proceedings of the Deepwater Wind Energy Research & Development Planning Workshop, Washington, DC, USA, 26–27 October 2004.
  6. Musial, W.; Ram, B. Large-Scale Offshore Wind Power in the United States—Assessment of Opportunities and Barriers; Technical Report: NREL/TP-500-49229; National Renewable Energy Laboratory: Golden, CO, USA, 2010.
  7. Chew, K.-H.; Ng, E.Y.K.; Tai, K. Offshore wind turbine jacket substructure: A comparison study between four-legged and three-legged designs. J. Ocean Wind Energy 2014, 1, 74–81. [Google Scholar]
  8. Seidel, M.; von Mutius, M.; Rix, P.; Steudel, D. Integrated analysis of wind and wave loading for complex support structure of offshore wind turbines. In Proceedings of the Conference Proceedings Offshore Wind 2005, Cppenhagen, Denmark, 26–28 October 2005.
  9. Chew, K.-H.; Tai, K.; Ng, E.Y.K.; Muskulus, M. Optimization of offshore wind turbine support structure using an analytical gradient-based method. Energy Procedia 2015, 80, 100–107. [Google Scholar] [CrossRef]
  10. Sourne, H.L.; Barrera, A.; Maliakel, J.B. Numerical crashworthiness analysis of an offshore wind turbine jacket impacted by a ship. J. Mar. Sci. Technol. 2015, 23, 694–704. [Google Scholar]
  11. Seidel, M. Design of support structure for offshore wind turbines—Interfaces between project owner, turbine manufacturer, authorities and designer. Stahlbau 2010, 9, 1–13. [Google Scholar] [CrossRef]
  12. Ong, M.C.; Bachynski, E.E.; Okland, O.D.; Passano, E. Dynamic responses of a jacket-type offshore wind turbine using decoupled and coupled models. In Proceedings of the ASME 2014 33rd International Conference on Ocean, Offshore and Arctic Engineering, San Francisco, CA, USA, 8–13 June 2014.
  13. International Electromechanical Commission (IEC). Wind Turbines—Part 3: Design Requirements for Offshore Wind Turbines; IEC 61400-3; IEC: London, UK, 2009. [Google Scholar]
  14. Det Norske Veritas (DNV). Design of Offshore Wind Turbine Structures; DNV-OS-J101; DNV: Oslo, Norway, 2013. [Google Scholar]
  15. Germanischer Lloyd (GL). Guideline for the Certification of Offshore Wind Turbines; GL: Oslo, Norway, 2012. [Google Scholar]
  16. Jonkman, J.M.; Buhl, M.L., Jr. FAST User’s Guide; Technical Report: NREL/TP-500-38230; National Renewable Energy Laboratory: Golden, CO, USA, 2005.
  17. Kim, K.; Lo, T.-W.; Yu, A.Q. A dynamic analysis method for an offshore wind turbine with a jacket support structure. In Proceedings of the 18th Offshore Symposium, Houston, TX, USA, 7 February 2013.
  18. Standards Norway. Design of Steel Structures; Standards Norway: Lysaker, Norway, 2013. [Google Scholar]
  19. American Petroleum Institute (API). API RP 2A-WSD: Recommended Practice for Planning, Designing and Constructing Fixed Offshore Platforms—Working Stress Design, 21th ed.; API Publishing Services: Washington, DC, USA, 2002. [Google Scholar]
  20. Jonkman, J.; Butterfield, S.; Musial, W.; Scott, G. Definition of a 5-MW Reference Wind Turbine for Offshore System Development; Technical Report: NREL/TP-500-38060; National Renewable Energy Laboratory: Golden, CO, USA, 2009.
  21. Vorpahl, F.; Popko, W.; Kaufer, D. Description of a basic model of the up wind reference jacket for code comparison in the OC4 project under IEA wind annex XXX. Fraunhofer Inst. Wind Energy Energy Syst. Technol. 2011, 4, 1–14. [Google Scholar]
  22. Passon, P.; Kuhn, M.; Butterfield, S.; Jonkman, J.; Camp, T.; Larsen, T.J. OC3—Benchmark exercise of aero-elastic offshore wind turbine codes. In Proceedings of the 2nd Conference on the Science of Making Torque From Wind, Copenhagen, Denmark, 28–31 August 2007.
  23. Bir Gunjit, S. User’s Guide to BModes; National Renewable Energy Laboratory: Golden, CO, USA, 2007.
  24. CSI Analysis Reference Manual. CSI analysis reference manual for SAP2000 Version 16; Computers & Structures Inc. (CSI): Walnut Creek, CA, USA, 2014. [Google Scholar]
  25. Buhl, M., Jr. MCrunch User’s Guide for Version 1.00; Technical Report: NREL/TP-500-43139; National Renewable Energy Laboratory: Golden, CO, USA, 2008.
  26. Jonkman, J.; Robertson, A.; Popko, W.; Vorpahl, F.; Zuga, A.; Kohlmeier, M.; Larsen, T.J.; Yde, A.; Saetertro, K.; Okstad, K.M.; et al. Offshore code comparison collaboration continuation (OC4), Phase I—Results of coupled simulations of an offshore wind turbine with jacket support structure. In Proceedings of the 22nd International Society of Offshore and Polar Engineers Conference, Rhodes, Greece, 17–22 June 2012.
  27. Vorpahl, F.; Popko, W.; Kaufer, D. Description of a Basic Model of the Upwind Reference Support for Code Comparison in the OC4 Project under IEA Wind Annex 30; Technical Report; Frauenhofer: Munich, Germany, 2011. [Google Scholar]
  28. Kim, K.; Lo, T.-W.; Yu, Q. A dynamic Analysis Method for an Offshore Wind Turbine with a Jacket Support Structure; Renewables & Offshore Technology Group: Houston, TX, USA, 2013. [Google Scholar]
  29. Larsen, T.J. Turbulence for the IEA Annex 30 OC4 Project; IEA: Paris, France, 2011. [Google Scholar]
  30. Dean, R.G.; Dalrymple, R.A. Water Waves and Mechanics for Engineers and Scientists; Prentice-Hall Inc.: Englewood Cliffs, NJ, USA, 1984. [Google Scholar]
  31. Salmon, C.G.; Johnson, J.E. Steel Structures: Design and Behavior, 5th ed.; Pearson: London, UK, 2008. [Google Scholar]
Figure 1. Frame of the proposed Low Cost Analysis Method for Jacket Support Structure.
Applsci 06 00307 g001
Figure 2. Simplified Flowchart of the Major Analysis Steps for OC4 Jacket Substructure Model.
Applsci 06 00307 g002
Figure 3. Full System Natural Frequencies under Load Case 1.2 of OC3 Phase I.
Applsci 06 00307 g003
Figure 4. Power Spectra of Base Shear Force under Load Case 5.3 of OC3 Phase I.
Applsci 06 00307 g004
Figure 5. Power Spectra of Base Overturning Moment under Load Case 5.3 of OC3 Phase I.
Applsci 06 00307 g005
Figure 6. OC4 Jacket Substructure CAD Model (a); and Simplified Tower Model (b).
Applsci 06 00307 g006
Figure 7. Flowchart of the Construction of Equivalent Monopile Model for Jacket Substructure.
Applsci 06 00307 g007
Figure 8. Masses of OWTG (Offshore Wind Turbine Generator) Components.
Applsci 06 00307 g008
Figure 9. Growth Mass (a); and Flooded Legs (b).
Applsci 06 00307 g009
Figure 10. Additional Mass Loadings. MSL: Mean Sea Level
Applsci 06 00307 g010
Figure 11. Segment Definition for Modal Analysis.
Applsci 06 00307 g011
Figure 12. Analysis Results for Load Case 2.4b of OC4 Phase I. (a) PDF_Tower-Top Fore-Aft Shear Force; (b) PDF_Fore-Aft Shear Force at Mudline; (c) DEL_Fore-Aft Shear Force at Mudline. PDF: Power Density Function; BSX: Fore-Aft Shear Force at Mudline; DEL: Damage Equivalent Load.
Applsci 06 00307 g012aApplsci 06 00307 g012b
Figure 13. Analysis Result for Load Case 3.2 of OC4 Phase I (Low-Speed Shaft Torque).
Applsci 06 00307 g013
Figure 14. Analysis Results for Load Case 3.4a of OC4 Phase I. (a) PDF- flapwise shear force at blade root; (b) PDF- edgewise shear force at blade root; (c) PDF- pitching moment at blade root.
Applsci 06 00307 g014
Figure 15. Loadings for Jacket Support Structure. MSL: Mean Sea Level; M: Moment; N: Normal Force; V: Shear Force.
Applsci 06 00307 g015
Figure 16. Wave load pattern of SAP2000.
Applsci 06 00307 g016
Figure 17. Model Construction and Verification of OC4 Jacket Substructure Model.
Applsci 06 00307 g017
Figure 18. Definitions of Member No. (a); and Joint No. (b).
Applsci 06 00307 g018
Figure 19. Member Strength Check (Case 1).
Applsci 06 00307 g019
Figure 20. Member Strength Check (Case 2).
Applsci 06 00307 g020
Figure 21. Member Strength Check (Case 3).
Applsci 06 00307 g021
Figure 22. Member Strength Check (Case 4).
Applsci 06 00307 g022
Figure 23. Member Strength Check (Case 5).
Applsci 06 00307 g023
Figure 24. Member Strength Check (Case 6).
Applsci 06 00307 g024
Figure 25. Joint Strength Check (Case 1).
Applsci 06 00307 g025
Figure 26. Joint Strength (Case 2).
Applsci 06 00307 g026
Figure 27. Joint Strength Check (Case 3).
Applsci 06 00307 g027
Figure 28. Joint Strength Check (Case 4).
Applsci 06 00307 g028
Figure 29. Joint Strength Check (Case 5).
Applsci 06 00307 g029
Figure 30. Joint Strength Check (Case 6).
Applsci 06 00307 g030
Table 1. Load Cases Definitions of OC3 (Offshore Code Comparison Collaboration) Phase I.
Load CaseEnabled DOF (Degrees of Freedom)Wind ConditionsWave ConditionsAnalysis Type
1.2Substructure, tower, drivetrain, bladesNoneNoneEigenanalysis with gravity and structural damping
5.3Substructure, tower, drivetrain, bladesTurbulent: Vhub = 18 m/s, σ1 = 2.674 m/s, Mann modelIrregular Airy: Hs = 6 m, Tp = 10 mTime-series statistics, DELs (Damage Equivalent Loads), power spectra
Vhub: Hub height wind speed; σ1: Longitudinal wind speed standard deviation; Hs: Significant wave height; Tp: Peak spectral period; Pierson–Moskowitz wave spectrum is used for irregular sea state.
Table 2. Comparison of Model Properties.
ItemsABSINER
JacketError (%)Equivalent MonopileError (%)
Mass (tons)1724.61724.920.021724.750.01
Modal Analysis (Hz)ABSINER
JacketError (%)Equivalent MonopileError (%)
1st Side-to-Side0.31530.31290.760.31300.72
1st Fore-Aft0.31800.31341.450.31351.42
2nd Side-to-Side1.11161.15293.721.15593.98
2nd Fore-Aft1.14461.15791.161.16091.42
ABS: American Bureau of Shipping; INER: Institute of Nuclear Energy Research
Table 3. Marine growth conditions [21].
Depth Range (m) 40 Z g 2
Thickness (m) t g = 0.1
Density (kg/m3) ρ g = 1100
Table 4. Simulation Results Comparison: Growth Mass and Flooded Legs Mass.
ItemsABSINER (Growth Mass)ABSINER (Flooded Legs)
Mass (t)178.5180.67204.6204.56
Error-1.22%-0.02%
Table 5. Modal Analysis for NREL 5 MW WTG FAST Model and OC4 Jacket Substructure Model.
Number of Segment1st Side-Side1st Fore-Aft2nd Side-Side2nd Fore-Aft
400.32590.32891.10351.1329
200.349 (7.09%)0.3519(6.99%)0.8536 (−22.64%)0.8729 (−22.95%)
240.3275 (0.05%)0.3305 (0.05%)1.1467 (3.92%)1.1798 (4.14%)
270.3268 (0.03%)0.3297 (0.02%)1.1383 (2.99%)1.1706 (3.33%)
350.3272 (0.04%)0.3301 (0.04%)1.1273 (2.16%)1.1584 (2.25%)
490.3315 (1.72%)0.3345 (1.70%)1.1122 (0.08%)1.1408 (0.07%)
560.3346 (2.66%)0.3377 (2.68%)1.1487 (4.10%)1.1794 (4.11%)
640.3331 (2.21%)0.3362 (2.22%)1.1248 (1.93%)1.1537 (1.84%)
700.3335 (2.33%)0.3367 (2.37%)1.1293 (2.34%)1.1585 (2.26%)
Modal units: Hz; “%” is the error percentage compared with 40 segments.
Table 6. Load Cases of OC4 Phase I for Jacket Substructure.
Load CaseEnabled DOFWind ConditionsWave Conditions
2.4bNone: Rotor speed and blade pitch via controllerNTM (Kaimal): Vhub = 18 m/sNo water
3.2All, Rotor speed and blade pitch via controllerSteady, uniform, no shear. Vhub = 8 m/sNo water
3.4aAll, Rotor speed and blade pitch via controllerNTM (Kaimal): Vhub = 11.4 m/sNo water
NTM: normal turbulence model; Vhub: average wind speed at the hub height.
Table 7. Categories of Design Load Cases in IEC 61400-3.
DLC CategoriesDesign Situation
1 Series (1.1–1.6)Power production
2 Series (2.1–2.4)Power production plus occurrence of fault
3 Series (3.1–3.3)Start up
4 Series (4.1–4.2)Normal shut down
5 Series (5.1)Emergency shut down
6 Series (6.1–6.4)Parked
6.1aExtreme wind speed model and Turbulent wind model
6.1bExtreme wind speed model and Steady wind model
6.1cReduced wind speed model and Steady wind model
6.2aExtreme wind speed model and Turbulent wind model
Other conditions: Loss of electrical network
6.2bExtreme wind speed model and Steady wind model
Other conditions: Loss of electrical network
6.3aExtreme wind speed model and Turbulent wind model
Other conditions: Extreme yaw misalignment
6.3bExtreme wind speed model and Steady wind model
Other conditions: Extreme yaw misalignment
7 Series (7.1–7.2)Parked and fault conditions
8 Series (8.1–8.3)Transport, assembly, maintenance and repair
Table 8. Simulation Cases for DLC 6.2a and DLC 6.2b.
Items6.2a6.2b
Number of Turbulence Seed61
Number of Misaligned Angle of Wind and Wave (full range: −180° – +180°/every 30 degree interval)1212
Number of Wind Direction33
Number of Wave Direction33
Number of Water Level (50 m + 3 m/50 m − 3 m)22
Analyzed Cases1296216
Table 9. Environmental Variables for Jacket Substructure Analysis.
Case No.DLCMisaligned Angle of Wind and Wave (Deg.)HS (m)TP (s)Current Speed (m/s)Wind Speed (m/s)
1DLC6.2b180.09.110370
2DLC6.2b30.09.110370
3DLC6.2a30.07.6310347.5
4DLC6.2b30.09.110370
5DLC6.2b–90.09.110370
6DLC6.2b0.09.110370
HS: Significant wave height; TP: Peak spectral period.
Table 10. Loading of Force (Fn) and Moment (Mn) at Tower Top due to OWTG Dynamics
Case No.DLCFx (MN)Fy (MN)Fz (MN)Mx (MN-m)My (MN-m)Mz (MN-m)
1DLC6.2b1.54 (max)−0.16−5.527.7196.3−3.79
2DLC6.2b0.78−1.60 (max)−4.9199.344.88.97
3DLC6.2a0.17−0.65−5.79 (max)46.17.382.08
4DLC6.2b0.78−1.60−4.9199.3 (max)44.88.97
5DLC6.2b1.500.536−5.36−33.0118 (max)−4.35
6DLC6.2b0.48-0.10−4.68−32.023.3−50.2 (max)
Table 11. Safety factors of Working Stress Design (WSD).
Design ConditionAxial TensionAxial CompressionBendingHoop Compression
Basic allowable stresses1.672.0Fy/Fb2.0
One-third increase in allowable stresses is permitted1.251.5Fy/(1.33Fb)1.5
Table 12. Load and Resistance Factors of Load and Resistance Factor Design (LRFD).
Limit ActionAction CombinationsPermanent Actions (G)Variable Actions (Q)Environmental Actions (E) dDeformation Actions (D) e
ULSa a1.31.30.71.0
ULSb1.01.01.31.0
SLS-1.01.01.01.0
ALSAbnormal effect b1.01.01.01.0
ALSDamaged condition c1.01.01.01.0
FLS-1.01.01.01.0
a For permanent actions and/or variable actions, an action factor of 1, 0 shall be used where this gives the most unfavorable action effect; b Actions with annual probability of exceedance = 10−4; c Environmental actions with annual probability of exceedance = 10−2; d Earthquake shall be handled as environmental action within the limit state design for ULS and ALS (abnormal effect); e Applicable for concrete structures. ULS: Ultimate Limit State; SLS: Service Limit State; ALS: Accidental Limit State; FLS: Fatigue Limit State.

