Conference Report

Modeling and Simulation of IGCC Considering Pressure and Flow Distribution of Gasifier

1
The Key Laboratory of Power Machinery and Engineering of Education Ministry, Shanghai Jiao Tong University, Shanghai 200240, China
2
Gas Turbine Research Institute, Shanghai Jiao Tong University, Shanghai 200240, China
*
Author to whom correspondence should be addressed.
Appl. Sci. 2016, 6(10), 292; https://doi.org/10.3390/app6100292
Submission received: 7 September 2016 / Revised: 28 September 2016 / Accepted: 29 September 2016 / Published: 20 October 2016

Abstract

:
The integrated gasification combined cycle (IGCC) is a power generation technology which combines clean coal technology with a combined cycle. The system modeling is significant for design, operation and maintenance of the IGCC power plant. However, the previous IGCC modeling methods only contained a simplified compartment gasifier model, which is useful to consider the heat transfer and chemical reaction inside the gasifier, but cannot analyze the pressure and flow distribution. In order to obtain a more accurate model of IGCC system, the volume-resistance technique and modular modeling method are utilized in this paper. The new model can depict the dynamic response and distribution characteristics of the gasifier, as well as their influence on the IGCC system. The simulation result of the gasifier and IGCC system shows an obvious delay after considering pressure and flow distribution. Therefore, the proposed IGCC system model can obtain a more reliable result when considering the distribution characteristics of the gasifier.

Graphical Abstract

1. Introduction

Coal will continuously be a main energy source for worldwide power generation in the coming decades, especially in developing countries such as China and India [1,2]. The gas turbine combined cycle (GTCC) is an advanced power generation system but it cannot accept coal as a fuel directly, until integrated gasification combined cycle (IGCC) technology was developed to combine the clean coal technology and combined cycle system together. The IGCC power plant, with high specific power, high efficiency and low emissions, is one of the best solutions for coal burning power generation.
C gasification is the core technology of the IGCC system, and the coal gasifier is the key component for the IGCC power plant. The US Department of Energy recognizes accurate simulation as one of the most important steps towards greater commercialization of gasification [3]. Field tests of the gasifier and IGCC cost a great deal of resources and might be dangerous; thus, investigations of the simulation method are needed to provide preliminary references.
There has been a great amount of research into the gasification process and IGCC system modeling. Elseviers [4] utilized ASPEN Plus to simulate the gasification and desulfurization process, and then analyzed the IGCC system performance. Chui [5] discussed the simulation of entrained flow coal gasification of IGCC based on chemical reactions, and assumed that the pressure affecting the heterogeneous reactions was equal to the atmospheric value. Jiang [6] discussed the simulation and optimization of IGCC, focusing on the steam sub-system. Kapetaki [7] analyzed the difference between the IGCC plants with coal-slurry and dry coal gasifiers through system simulation, while Zheng [8] compared four IGCC power plants using Shell, Texaco, British Gas Lurgi (BGL) and Kellogg–Rust–Westinghouse (KRW) gasifiers, respectively. Gemayel [9] simulated an IGCC process integrated with a bitumen upgrading facility. However, the above studies are all focused on steady-state simulation, and are all based on the chemical reaction balance and thermodynamics analysis of IGCC plants. Then the later compartment dynamic models were developed to describe the internal gasification reaction and dynamic response in detail. Sun [10] proposed a dynamic model of the gasifier using a shift equilibrium constant to describe the chemical reaction balance; however, the constant is only related to the temperature. Zhang [11] proposed another dynamic model for the gasifier of the IGCC power plant, using pressure-related coefficients to describe the heterogeneous reactions. Lee [12] developed a more detailed dynamic model considering the gas-particle friction and the gas-wall friction. However, both of them set the pressure as constant. Wang [13] discussed dynamic modeling and simulation of the IGCC process but the gasifier pressure was also given directly by the fixed designed parameter. Hla [14] described the behavior of coal in an entrained-flow gasifier in detail, yet the pressure was also assumed to be constant. Huang [15] utilized the volume-resistance characteristic method to describe the pressure and flow dynamic response of the gasifier but did not develop it into an IGCC system model. Therefore, it still lacks the consideration of pressure and the flow distribution of the gasifier, which reduces the accuracy of the IGCC system simulation.
This paper will present an IGCC model containing an improved non-iterative gasifier model based on the volume-resistance method. The proposed model can calculate the distribution characteristics of the gasifier, especially the pressure and flow distribution, as well as its influence on the IGCC system performance. Since the volume inertias of the gasifier and other components have been considered in this model, the simulation can show a more convincing result for the system dynamic response of the IGCC power plant.

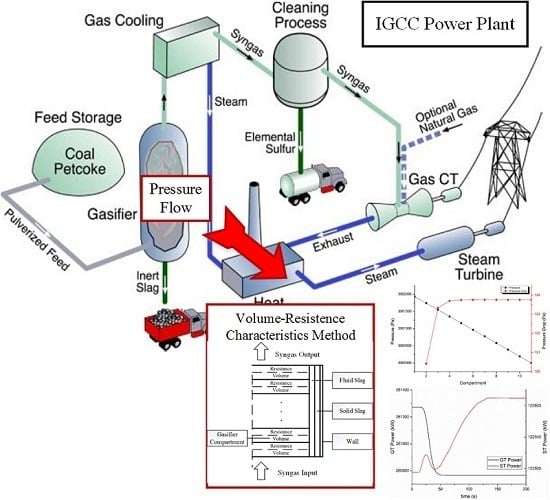
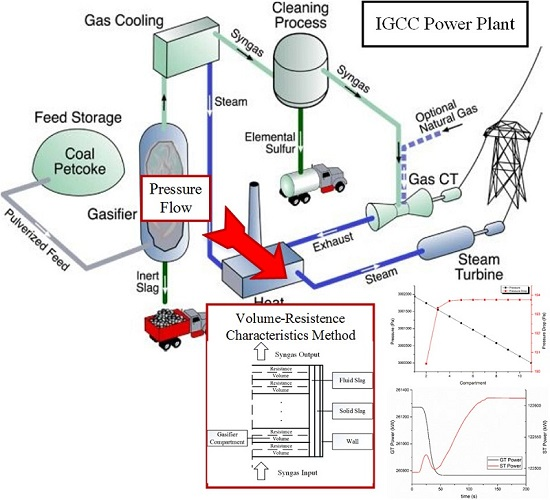
2. Description of Shell Gasifier and IGCC Power Plant

The Buggenum IGCC plant and its Shell gasifier are chosen to be the representative research objects. Pressurized coal, oxygen and, if necessary, steam are the main reactants and enter the gasifier through pairs of opposed burners. The raw gas (mainly H2 and CO) leaves the reactor at near-gasification temperature, and is subsequently quenched by a cool recycled gas. Then the convective cooler cools the raw gas and generates superheated steam. After leaving the syngas cooler, the cooled gas passes through the bag filter where about 98% of the fly slag is removed. Part of the cleaned gas is recycled to be used as quench gas [8].
In order to show the pressure and flow distribution characteristics for the Shell gasifier, the model consists of 10 compartments and is shown in Figure 1. Each compartment has unique parameters. For models of earlier works, which will be called no-pressure models in the following text, only the chemical reactions and energy equations are considered. Thus, the pressure and mass flow rate are not state parameters, which means that they are only related to the input parameters, while the inertias are ignored. However, in this paper, the pressure and flow distribution of the gasifier would be added into the new model and solved by the state equations through the volume-resistance method.
The layout of the IGCC system is shown in Figure 2. The gasification island is introduced in the above. A remodeled gas turbine is the core of the power island, and a double pressure with reheating (2PR) heat recovery steam generator (HRSG) recovers the heat from the exhaust gas of this gas turbine. As mentioned above, the waste heat from the cooled gas is also recovered to generate the superheated steam.
The main steam from the high-pressure evaporator is mixed with the steam from one of the convective coolers of the gasification island, and is heated in superheater to enter the steam turbine. Then, the exhaust steam of the high-pressure cylinder, mixed with steam from the other syngas cooler, is heated in the reheater and expanded in the intermediate-pressure cylinder. At last, the low-pressure steam system generates the low-pressure steam, which is mixed with the exhaust steam of the intermediate-pressure cylinder and finally enters into the low-pressure cylinder.

3. IGCC System Modeling

The volume-resistance (V-R) method is utilized for gasifier modeling to obtain several simplified ordinary differential equations to describe the pressure and flow characteristics of the gasification process [16]. Furthermore, we deal with the IGCC system simulation in this paper, and thus the modular modeling method is utilized to build the gas turbine and steam system model. Generally, the flow characteristics can be described through basic equations in models of power machines, for example the Frugal formula in the model of the steam turbine. Therefore, the pressure state equations are proposed in other modular components, such as the combustor and heat exchanger.

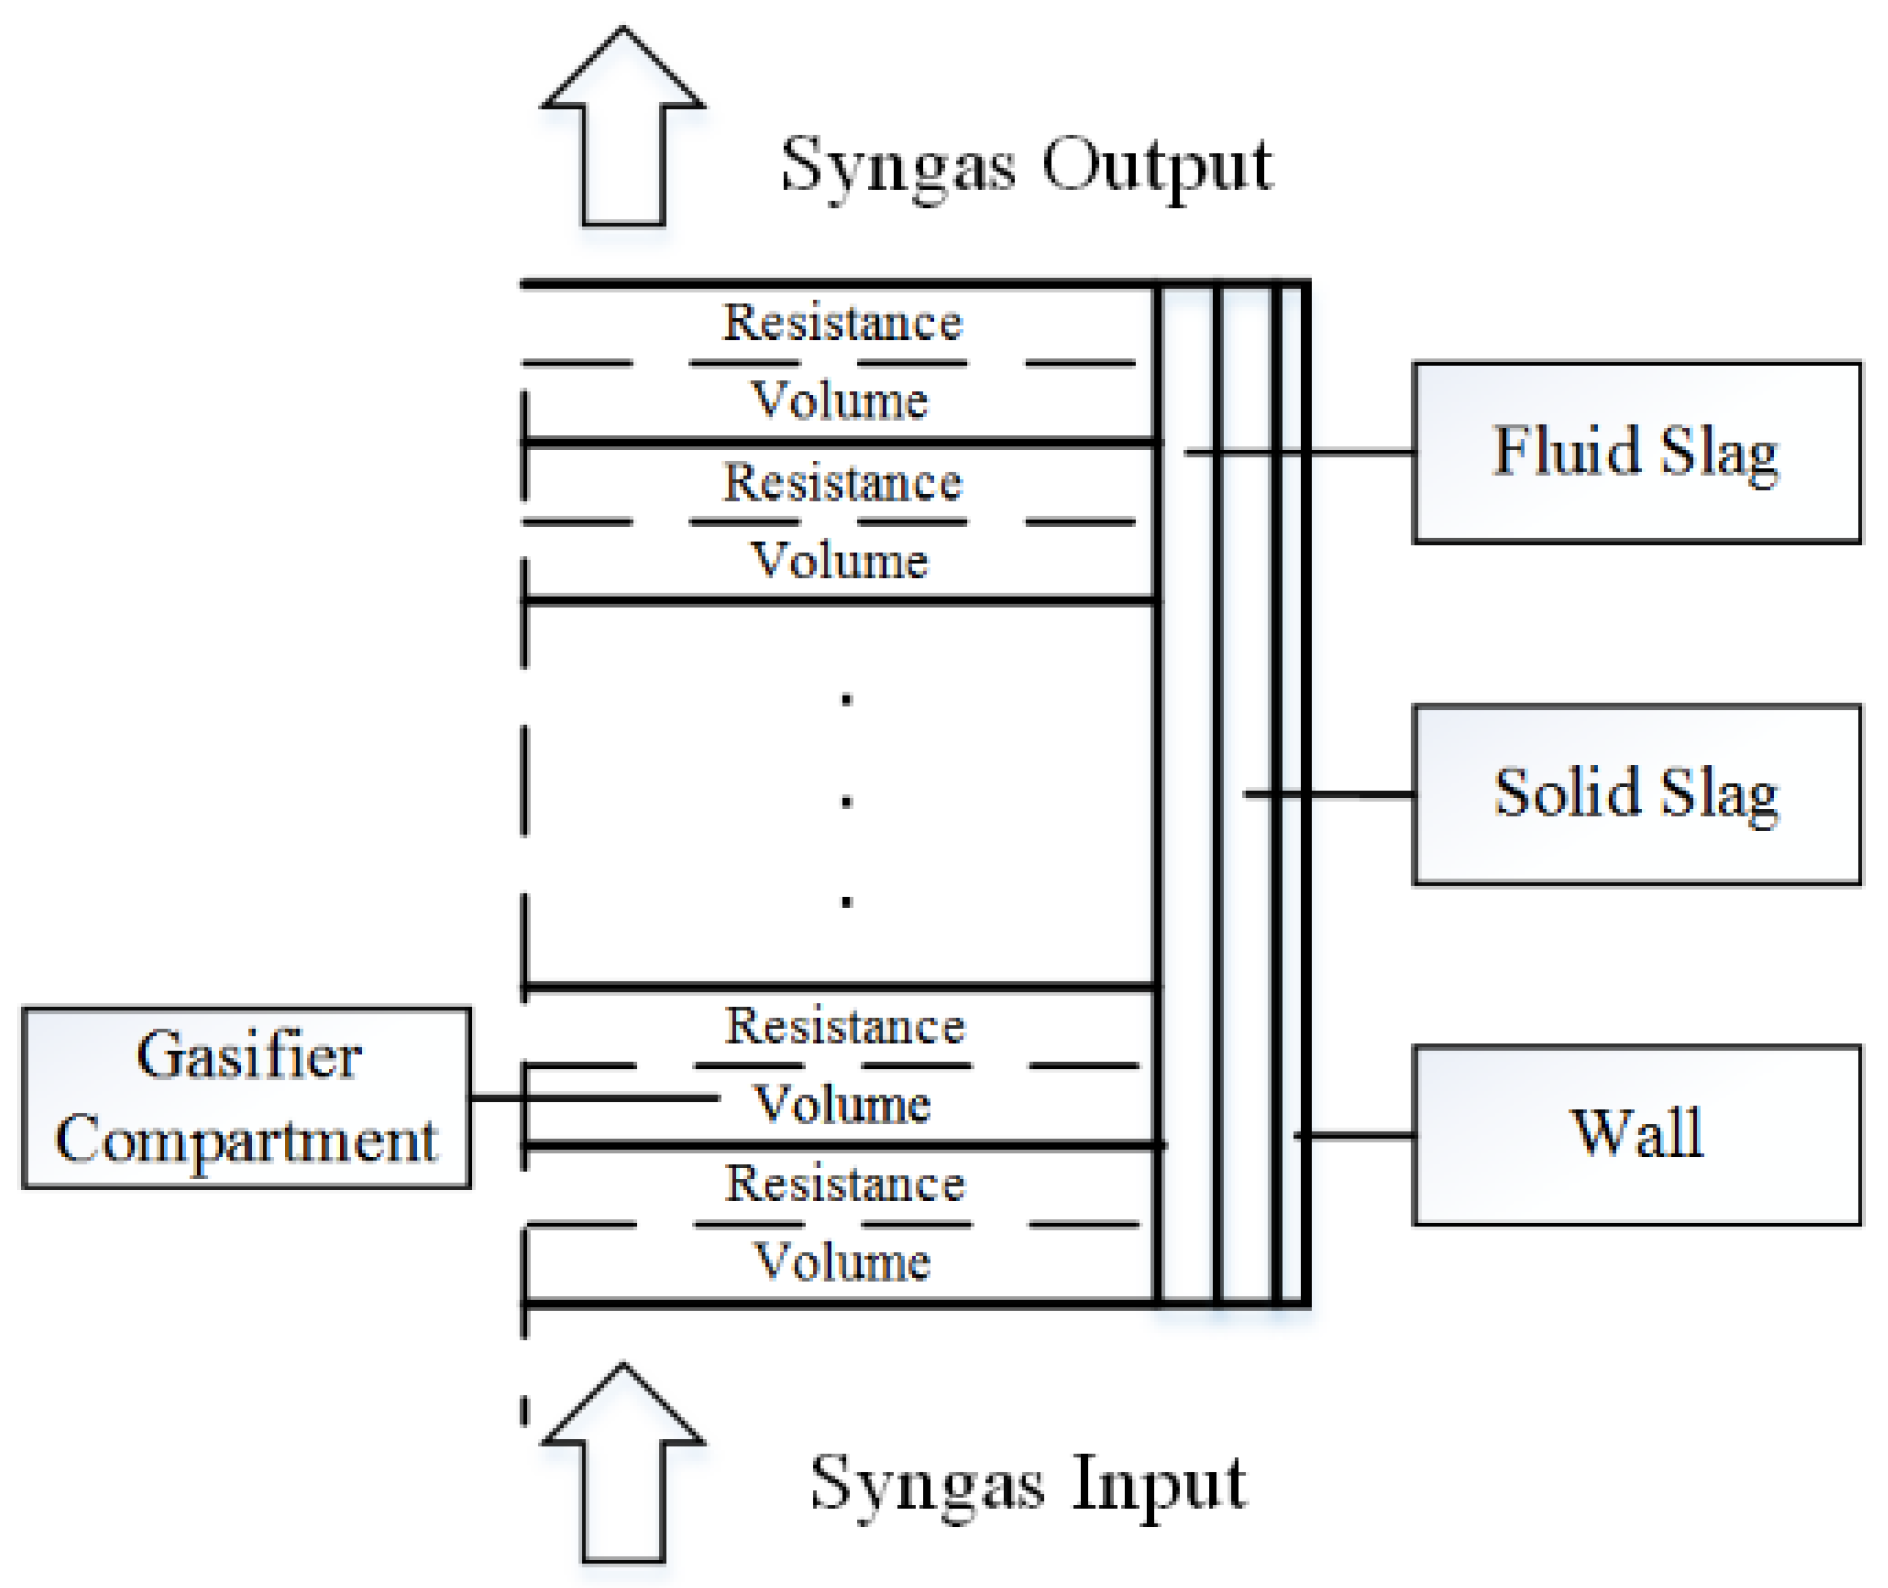
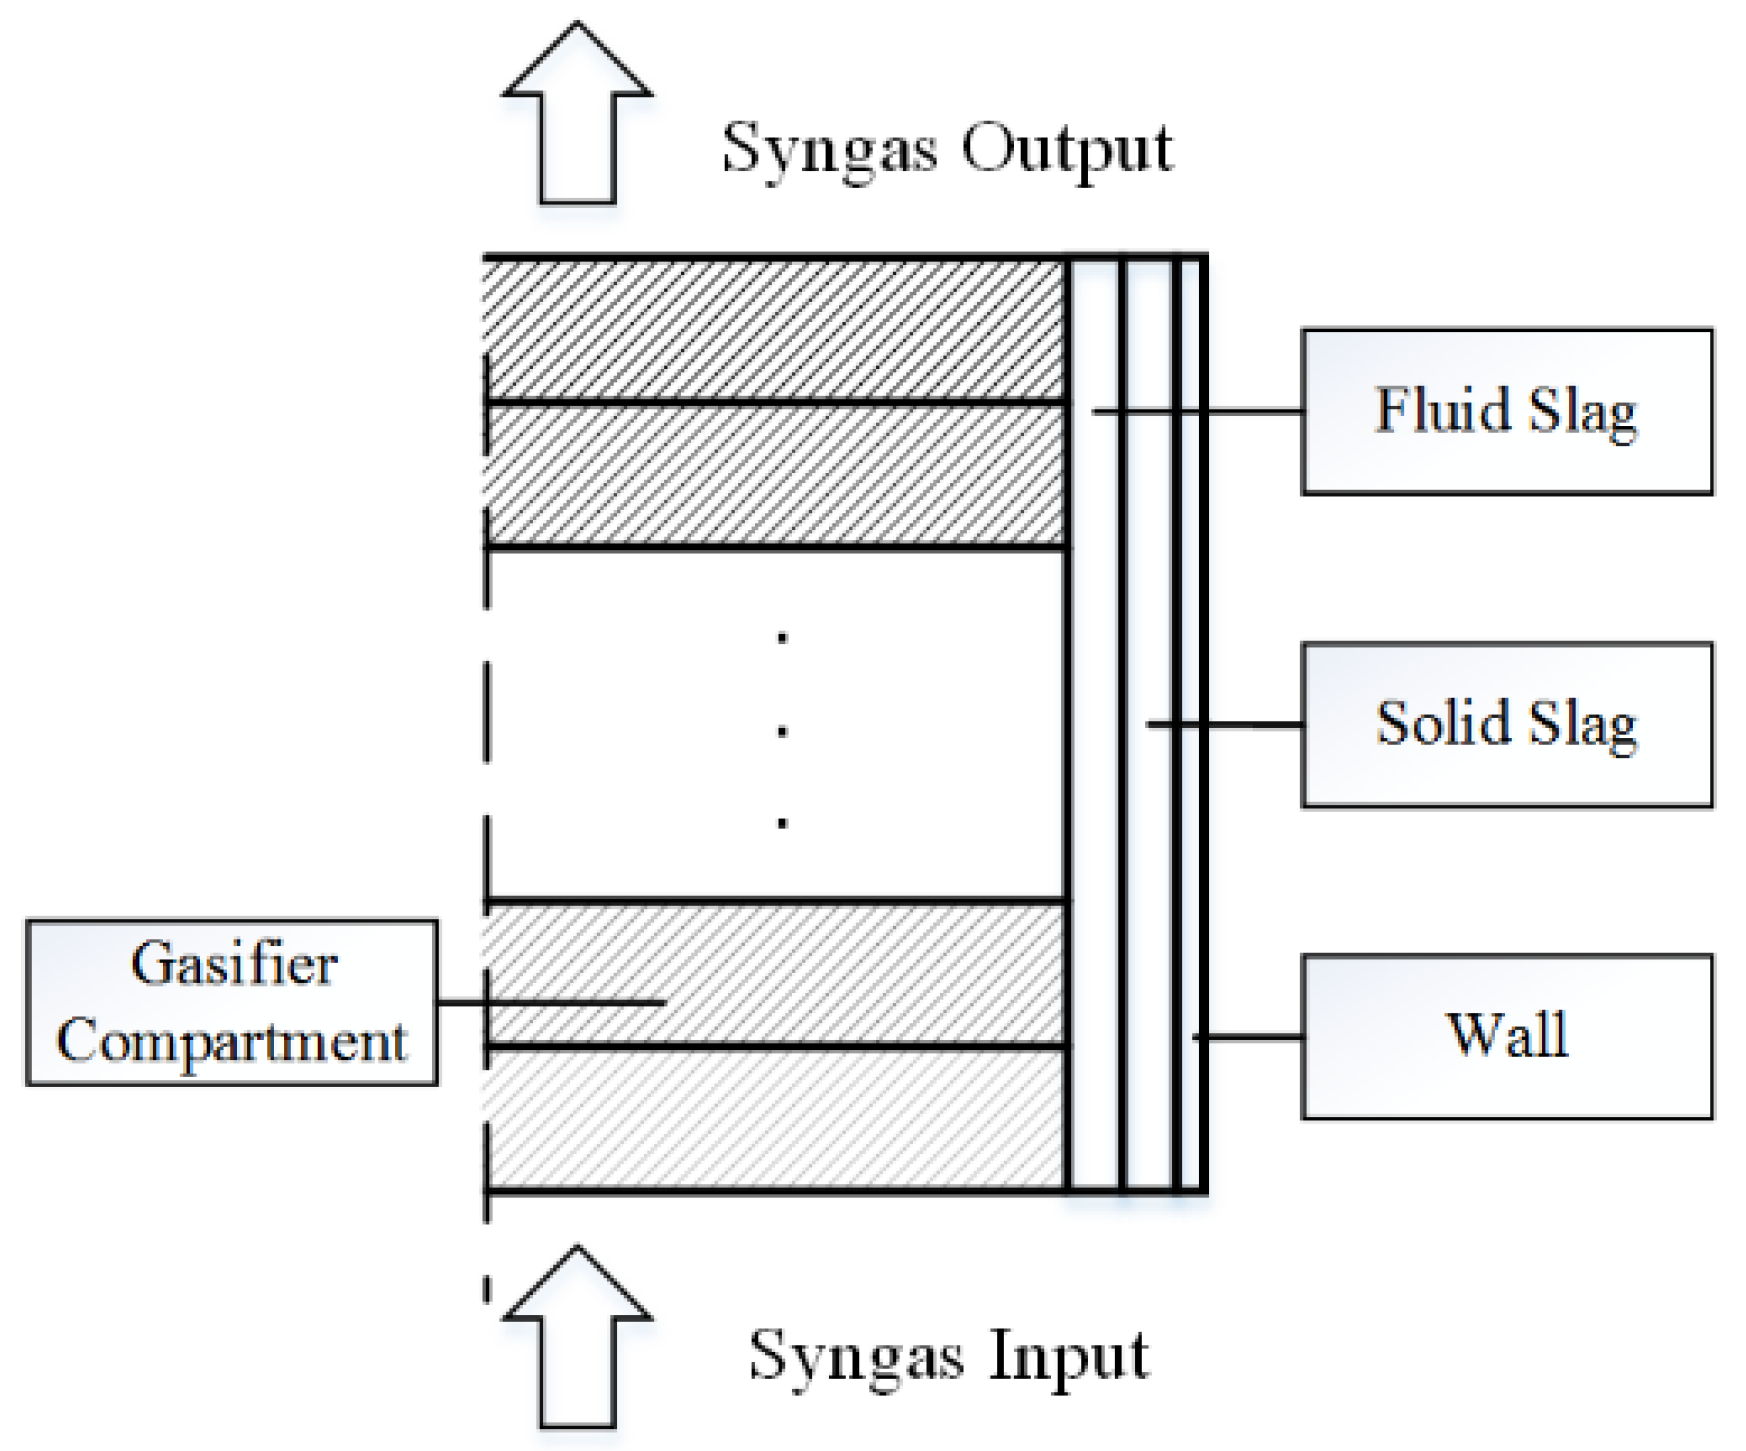
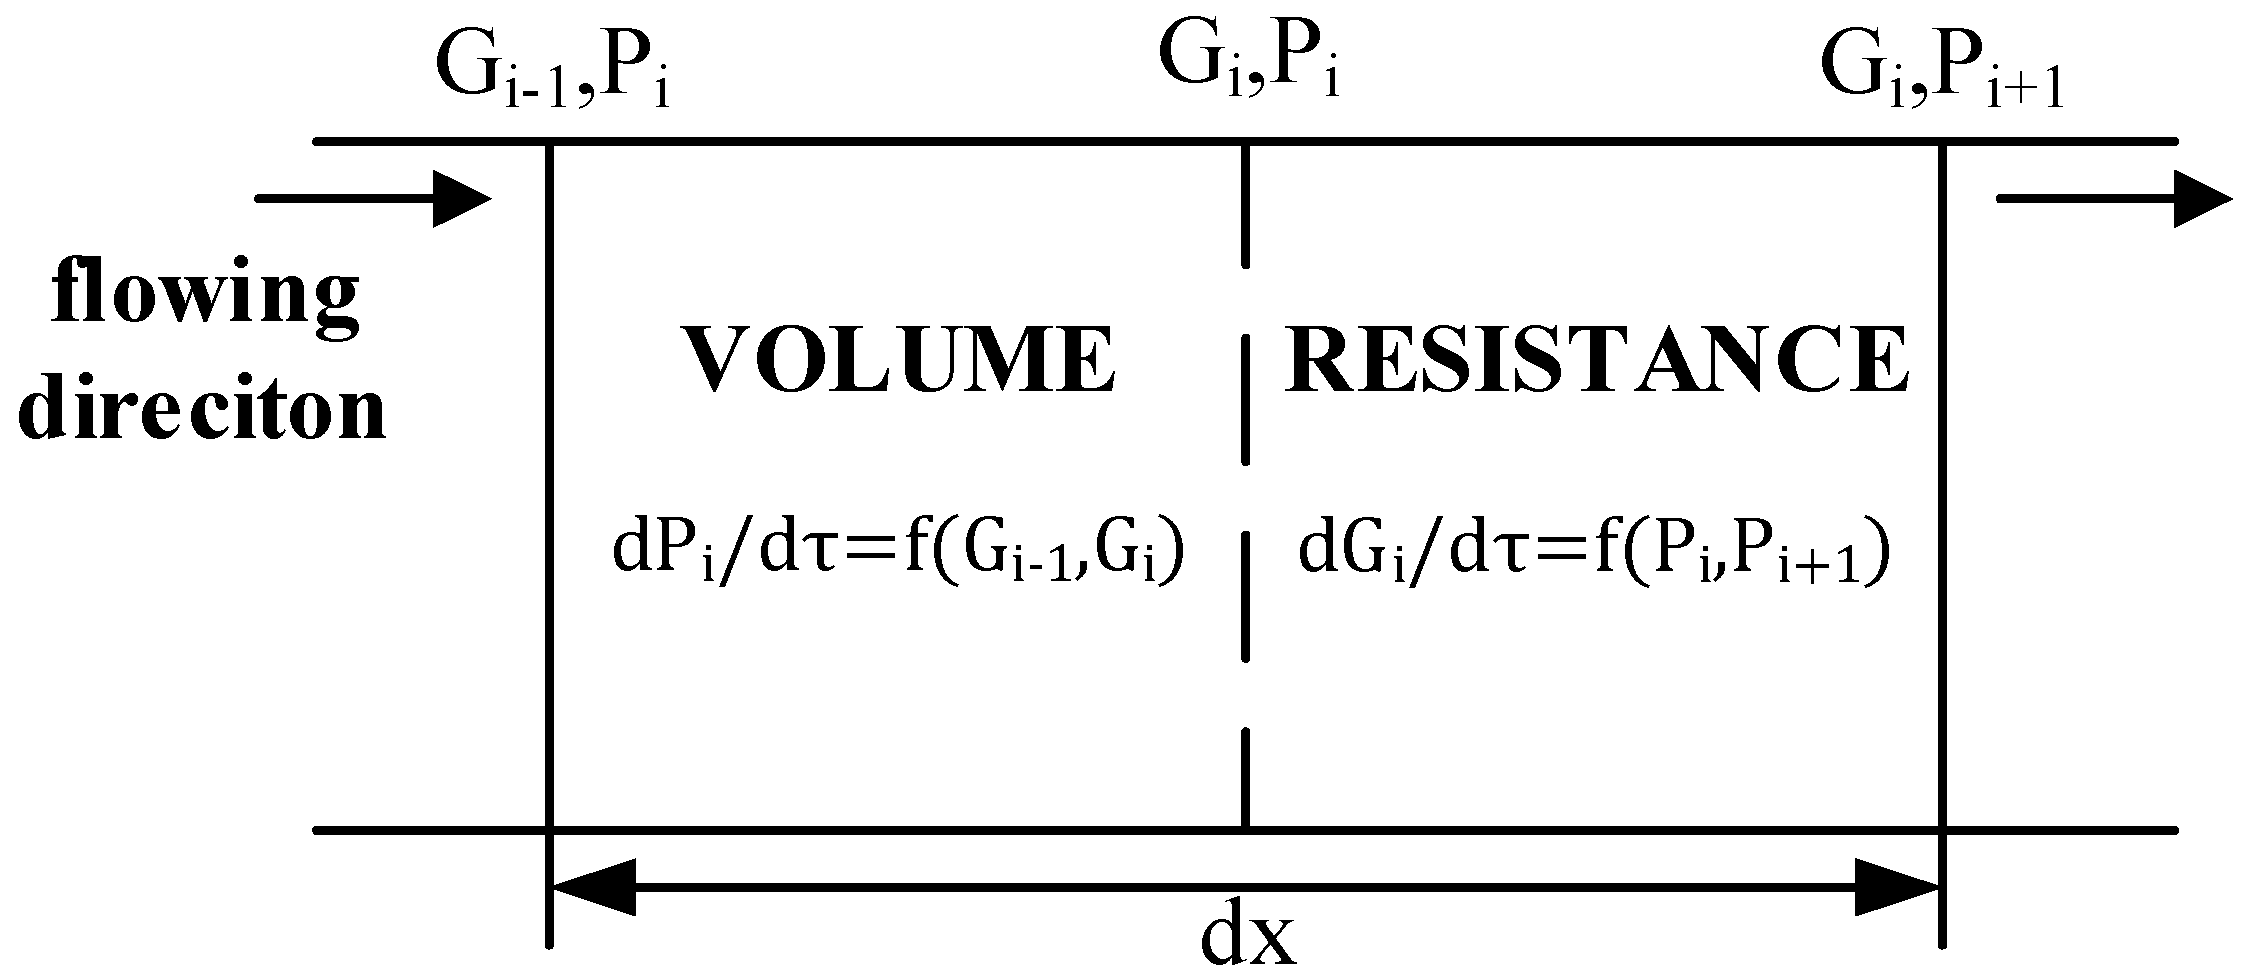
3.1. Gasifier Model and Volume-Resistance Method

Each gasifier compartment is separated into two sub-modules. One is the volume sub-module and the other is the resistance sub-module, as shown in Figure 3.
The dashed line in the control section represents that this control volume has both volume and resistance properties. We can assume that the pressure change occurs only in the volume sub-module due to the flow rate difference, while the flow rate change occurs only in the resistance sub-module due to the pressure difference. We will deal with the pressure and flow distribution based on this assumption.
The V-R method doubles the number of compartments with new volume and resistance sub-modules, as shown in Figure 4.
Based on the above idea, using the mass conservation theorem, the state equation of pressure in the volume sub-module was derived [17]. The equation can be written as the follows:
d P i d τ = R g T i V i d m i , j d τ
where P is the state parameter pressure and τ is the time; R g is the ideal gas constant; T i and V i stand for the temperature and the volume of compartment I, respectively; m i , j stands for the mass of component j in compartment i, which is calculated through the chemical reaction. The state equation of mass was derived from Reference [18] and can be written as:
d n g , i Y j , i d τ = n ˙ j , i 1 + R j , i n ˙ j , i
where n g , i stands for the total mole number of syngas in compartment i and Y j , i stands for the molar fraction of component j in compartment i; n ˙ j , i 1 stands for the inlet molar flow rate of component j from compartment i; G j , i stands for the outlet molar flow rate of component j of compartment i; and R j , i stands for the reaction rate of component j in compartment i.
The homogeneous and heterogeneous chemical reactions are contained in each compartment, and the reaction rate is shown as follows.
For the homogeneous reaction [18],
k i = k 0 e x p ( E R T g ) C A C B
For the heterogeneous reaction [19],
R i = 1 [ 1 k d i f f + 1 k s Y 2 + 1 k d a s h ( 1 Y 1 ) ]
where k i and R i are the homogeneous and heterogeneous reaction constants, respectively; k 0 , E, C A , C B , k d i f f , k s , k d a s h are all coefficients and can be found in References [18,19].
It should be noted that Equation (4) is related to the mole number while Equation (1) requires the mass. Thus, molar mass should be considered to solve the pressure equation.
Using the momentum conservation theorem, the equation of the flow rate in the volume sub-module can be written as follows,
d G i d τ = A P i P i + 1 d x U σ
where G i is the mass flow rate of compartment i; A and x are the sectional area and the length of each compartment; U and σ are the wet perimeter and friction resistance, respectively.
The flow rate equation can be simplified to reduce the quantity of the state parameters,
G i = k P i P i + 1
Besides, the reaction heat and heat loss of slag must be considered to build the energy equation. Because of the flow rate and reaction rate, the temperature is also a state parameter. Therefore, we can build the state equation for the temperature of each compartment [18].
( n c , i c p , s + j = 1 N g n g , i Y i , j c p , g , j ) d T i d τ = G c , i 1 c p , s T i 1 G c , i c p , s T i + T i 1 j = 1 N g G g , i 1 Y i 1 , j c p , g , j T i j = 1 N g G g , i Y i , j c p , g , j + Q C H Q s , i
The above equation contains four parts. They are the energy flow of solid coke, the energy flow of gas, the chemical reaction heat, as well as the heat loss.
Based on Equations (2)–(7), the pressure state equation can be solved to finish the calculation of the volume-resistance method.

3.2. Gas Turbine Model

The modeling of the three key components of gas turbine is discussed in following section. The compressor and turbine models are based on the characteristics maps. The relationship among the pressure ratio, mass flow rate, rational speed and efficiency can be written as:
G T p = f 1 ( π , n / T )
η = f 2 ( π , n / T )
where π , n and η stand for the pressure ratio, rotational speed and component efficiency, respectively.
The combustor model is focused on the pressure and temperature dynamic response; thus, it contains two core state equations, which are also the core equations of the whole gas turbine model. Furthermore, because of the consistency of the parameters inside the combustor, it can be described as a lumped model. The state equation of the pressure is similar to the gasifier, which can be written as:
d p d τ = R g T g V ( G f + G a G g )
where the subscripts f, a, and g stand for the fuel, air and gas, respectively.
The turbine inlet temperature (TIT) is the most important parameter for the gas turbine, which is also calculated in the combustor model. The state equation of TIT can be written as follows:
d T g d τ = G f ( h f + H V ) + G a h a G g h g ( h g R g T g ) ( G f + G a G g ) ρ g V c p , g
where HV stands for the heating value of the syngas fuel, h is the enthalpy, and ρ is the density.
The turbine inlet pressure and temperature are both calculated through these state equations. The results are sent to the compressor and turbine model to obtain the pressure ratio and reduced rational speed of the characteristics maps and to calculate the output power.

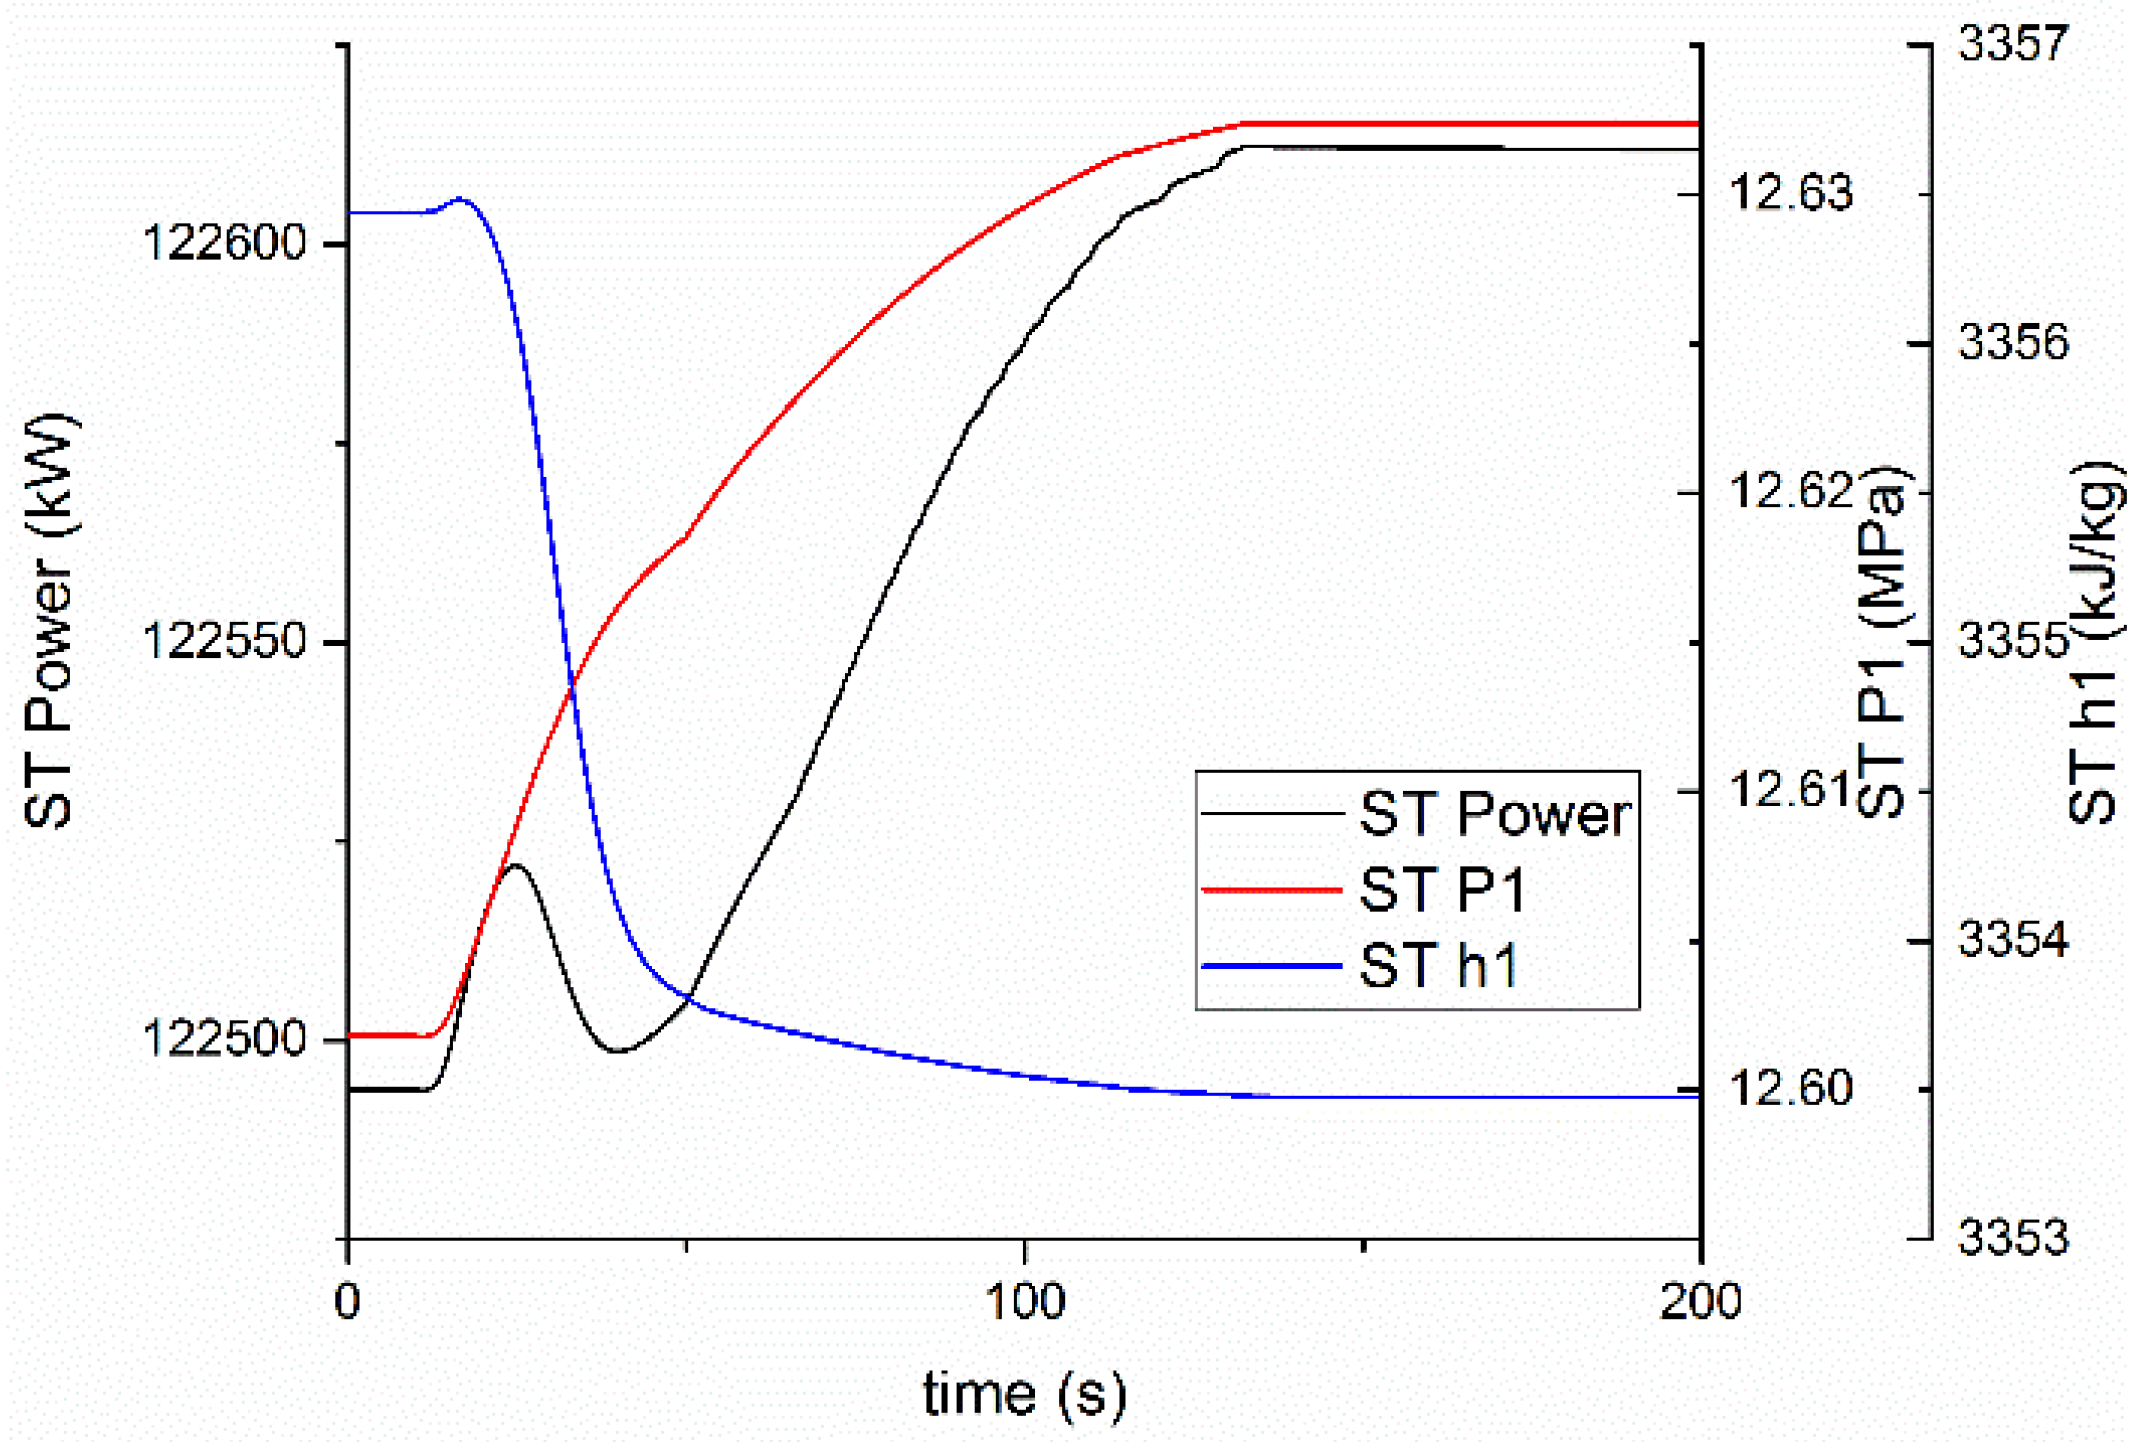
3.3. Steam System Model

The steam system, including the heat recovery steam generator (HRSG) and steam turbine, is described as several simplified drums, heat exchangers and turbine stage groups.
The state equations of pressure and enthalpy for the superheater are written as:
d p d τ = G i n h i n G o u t h o u t + Q V ( 1 + c p / R )
d h d τ = G i n h i n G o u t h o u t + ( 1 R / c p ) ( G o u t G i n ) h 2 ρ ( 1 + R / c p )
The modeling of the drum, evaporator and economizer is similar and is introduced in detail in Reference [20].
The steam turbine model is based on the Frugal formula, which can be written as:
G G 0 = p i n 2 p o u t 2 p i n , 0 2 p o u t , 0 2 · T i n , 0 T i n
where subscript 0 stands for the design parameters.
Similar to the gas turbine, the heat exchanger models calculate the pressure and temperature, and then send the results to the steam turbine models for calculating the flow rate. It is a non-iterative model because all the equations could be solved through the results of the last simulation step.

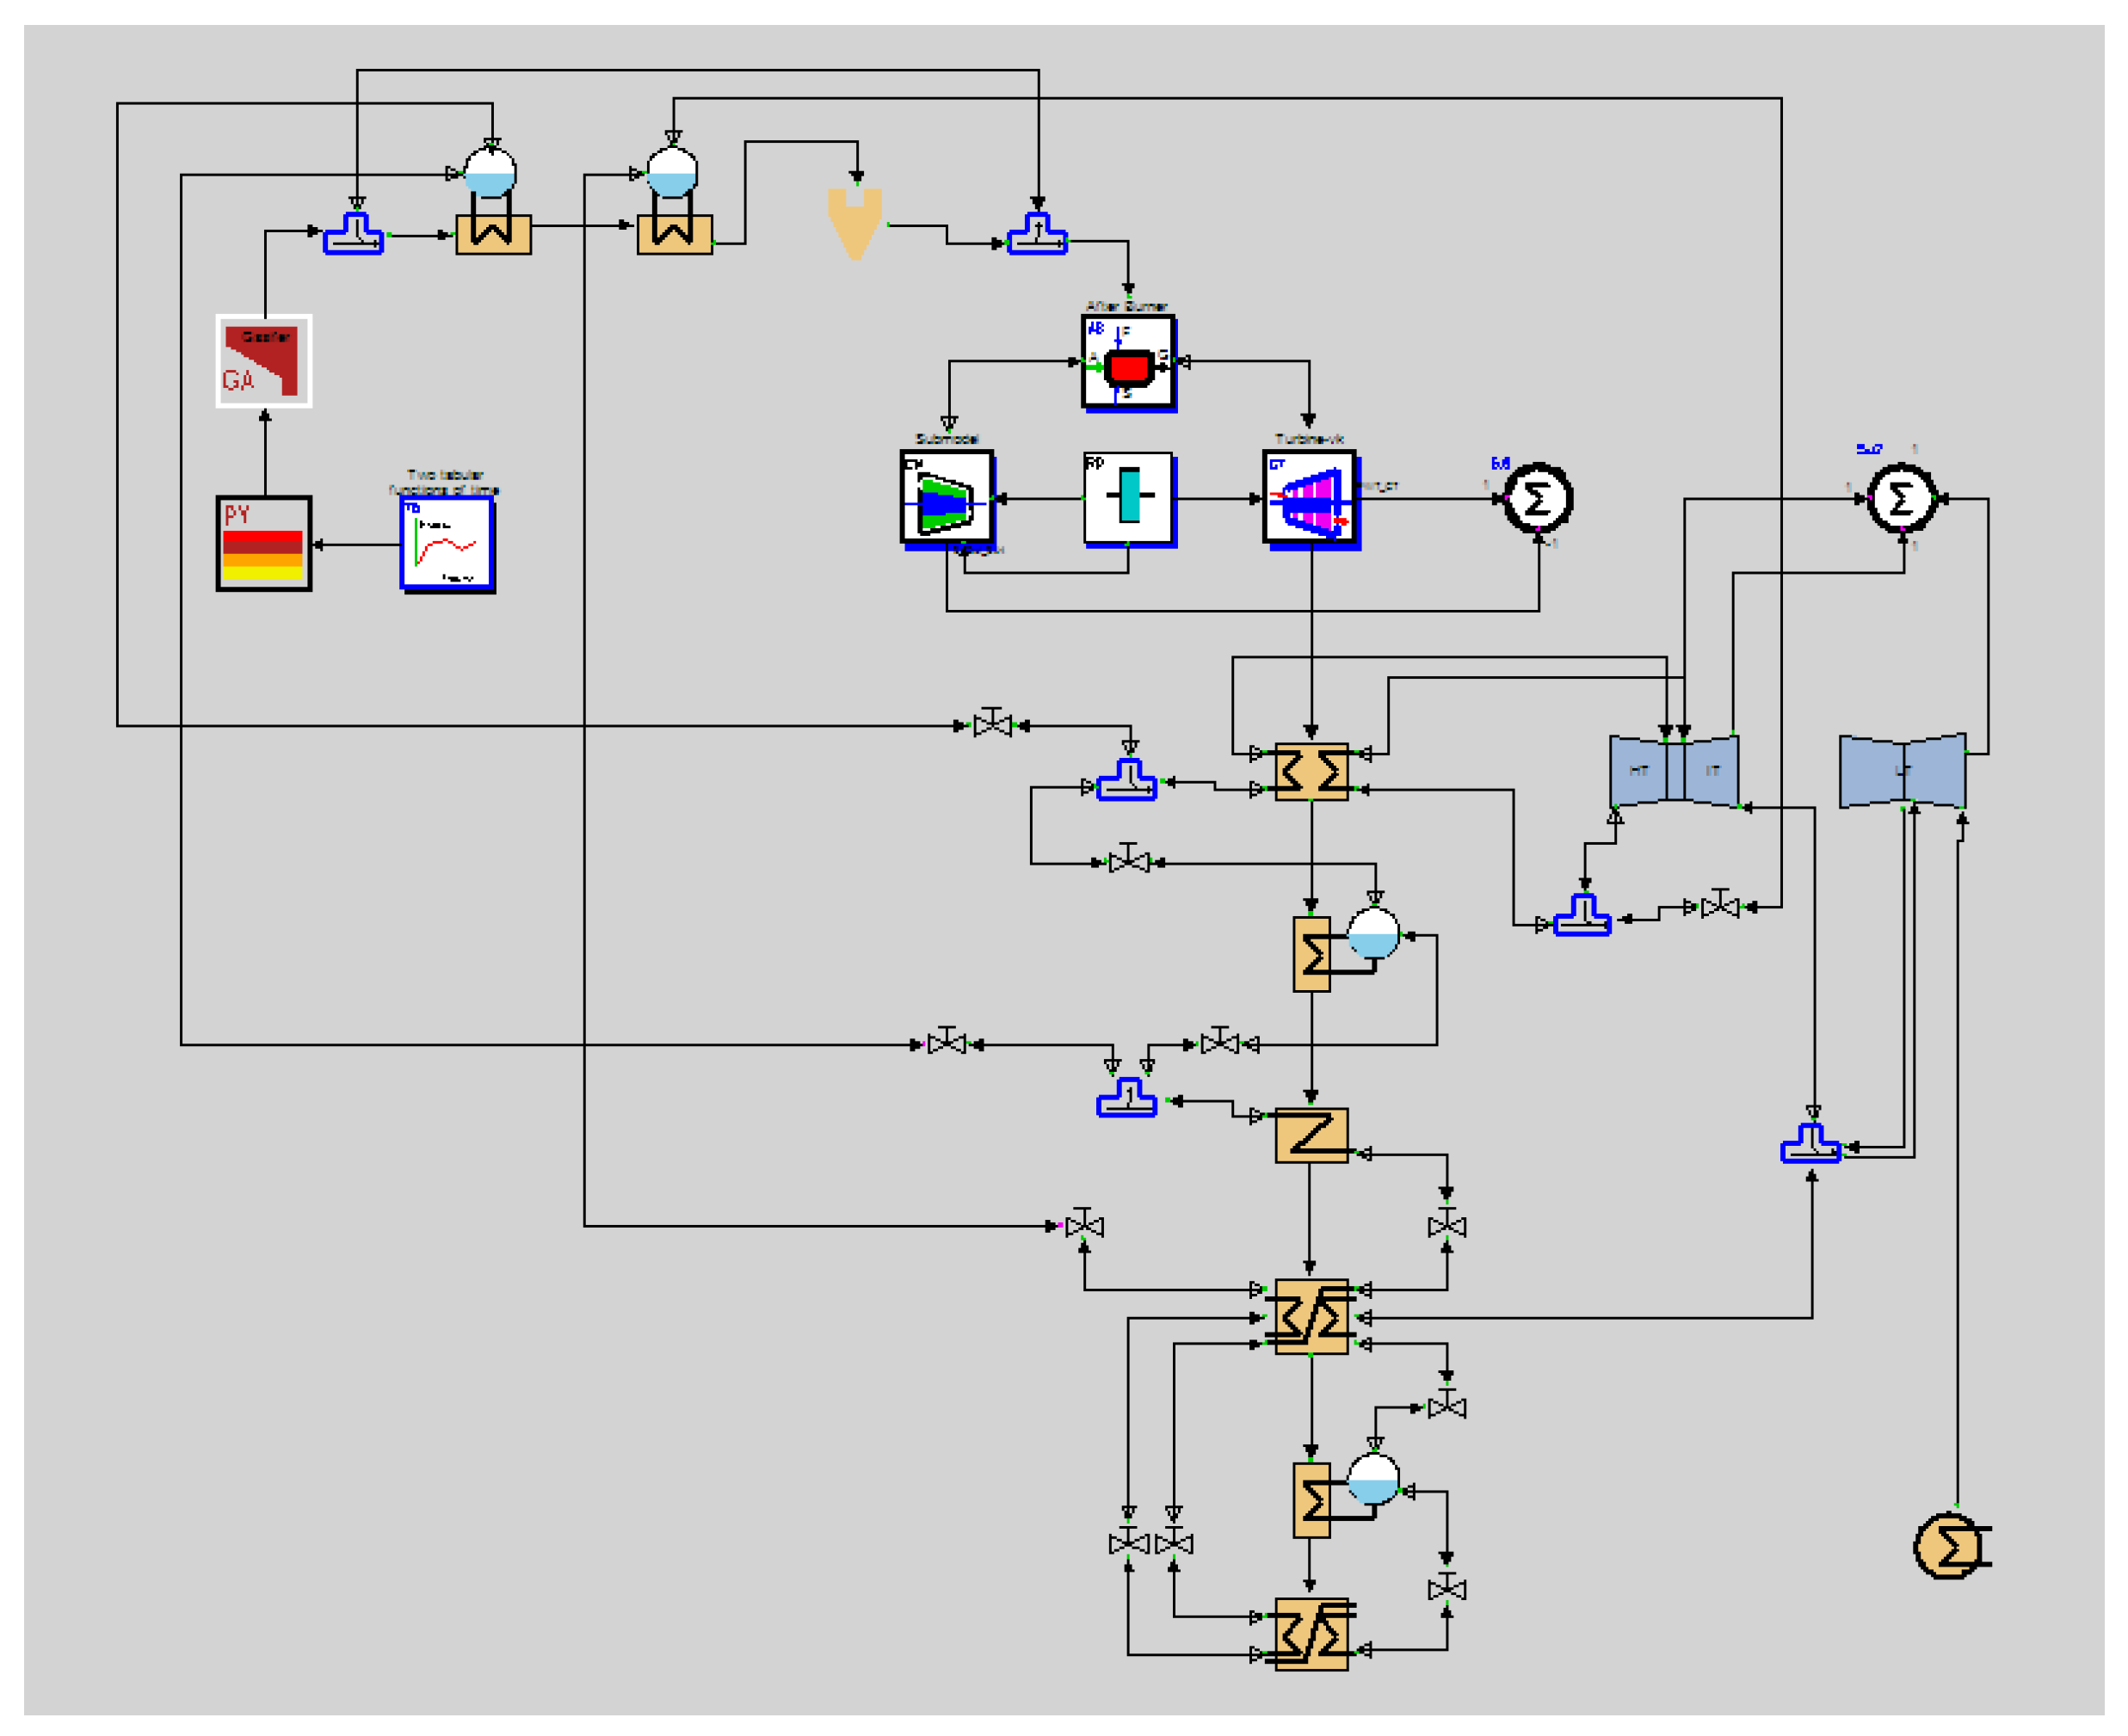
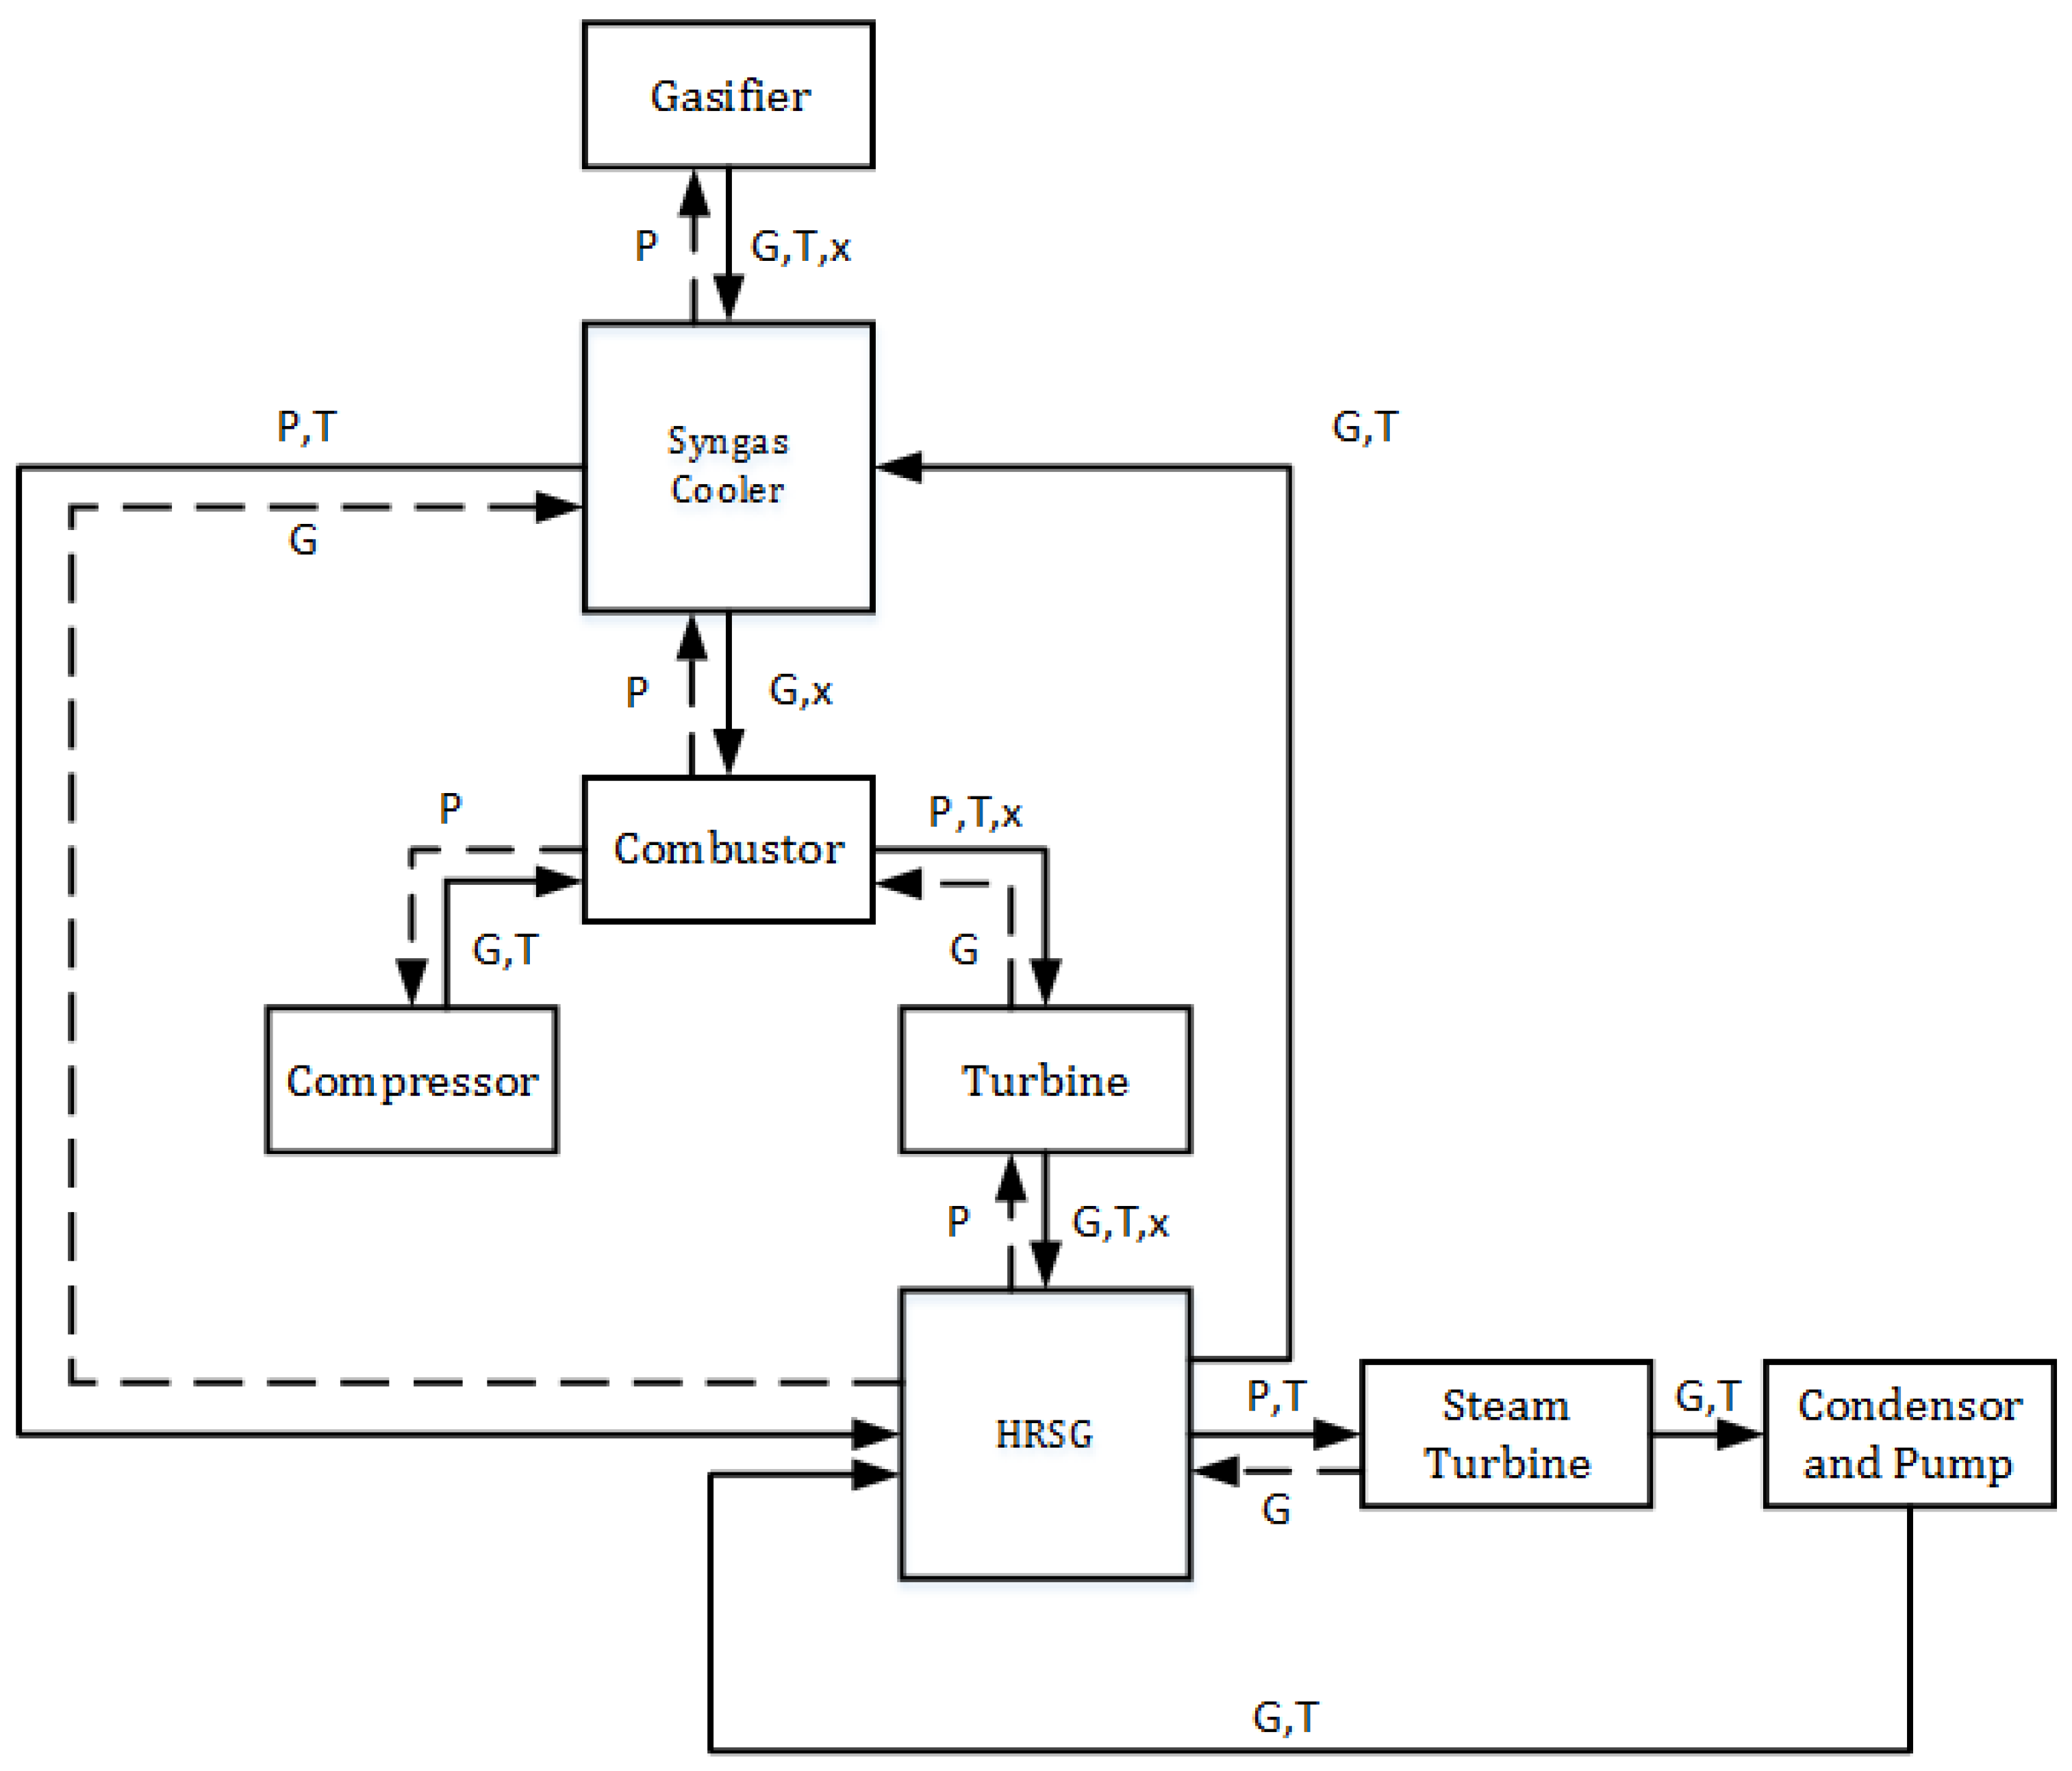
3.4. IGCC System Model

The MSC Eesy5 platform is taken as the simulation environment, and the schematic diagram of the system model on the software is shown as Figure 2. The system model is built based on the modular modeling. Because it is a non-iterative model, the calculation priority is not important. Figure 5 shows the data flow direction of the system model.
The solid lines represent that the data flow directions are the same as the real flow directions, while the dashed lines stand for the reverse. Based on the theory of modular modeling, the pressure is calculated only in models of the combustor, the HRSG as well as the syngas cooler. That is why the data flow directions are opposite to the real flow directions.
The control system of the IGCC is simplified in this model. The exhaust temperature control of the gas turbine is ignored. That is to say that there is no inlet guide vane to control the mass flow of air, and thus the turbine outlet temperature (TOT) is not constant and is related to the gas turbine performance.

4. Results and Analysis

4.1. Gasifier Simulation

Model validation of the gasifier has been implemented based on the El Cerrejon coal of the Buggenum IGCC, for which the proximate analysis and ultimate analysis are shown in Table 1. The simulation results of the molar fraction are given in Table 2, and they have been compared with the reference data [10,11,12,13,14,15,16,17,18,19,20,21].
It can be seen from Table 2 that the results of the V-R model are almost the same as those of the no-pressure model during the steady-state simulation, which means that the V-R characteristics only influence the dynamic response. The above simulation results show that all three models can predict the gasification process in steady state well. However, with the V-R model, more performance parameters can be calculated. The pressure distribution performance along the axial direction is indicated in Figure 6.
From the result of the pressure drop, it can be observed that the pressure distribution is not linear. The reason is that the heterogeneous reactions, which increase the flow rate, mainly exist in the first few compartments. Thus, the higher flow rate increases the pressure drop in the following compartments. On the other hand, the pressure drop becomes steady in the last few compartments, showing that only homogeneous reactions occur at this part.
In this paper, we focus on pressure and flow distribution and its influence on the dynamic performance of the gasifier. The dynamic response when the feedstock undergoes a step change is chosen as the research object. The simulation result is also compared with the no-pressure model in the following text.
The dynamic responses of the pressure of compartments #1 and #10 are shown in Figure 7, with respect to a +1% step change in the oxygen flow rate at the 10th second.
It can be seen that the pressure dynamic response of compartment #10 is later than that of compartment #1 due to the flow direction of the syngas. Moreover, the range of the pressure response of compartment #10 is much smaller than that of compartment #1. The reason is the same as the steady-state analysis, which is because there are only homogeneous reactions in compartment #10 which do not cause the pressure to change.
The outlet flow rate is influenced by both the inlet parameter and pressure distribution with the V-R model. Therefore, the flow rate would continue changing until the pressure is steady, which is shown in Figure 8.
Different from the result of the no-pressure model, the dynamic response of flow rate is influenced by the pressure distribution in the new V-R model; thus, the response is delayed about 20 s compared to the no-pressure model to reach the stable state. The results from the V-R model can reflect the transportation delay as well as the volume inertia characteristics. This will be the advantage for the new gasifier model.

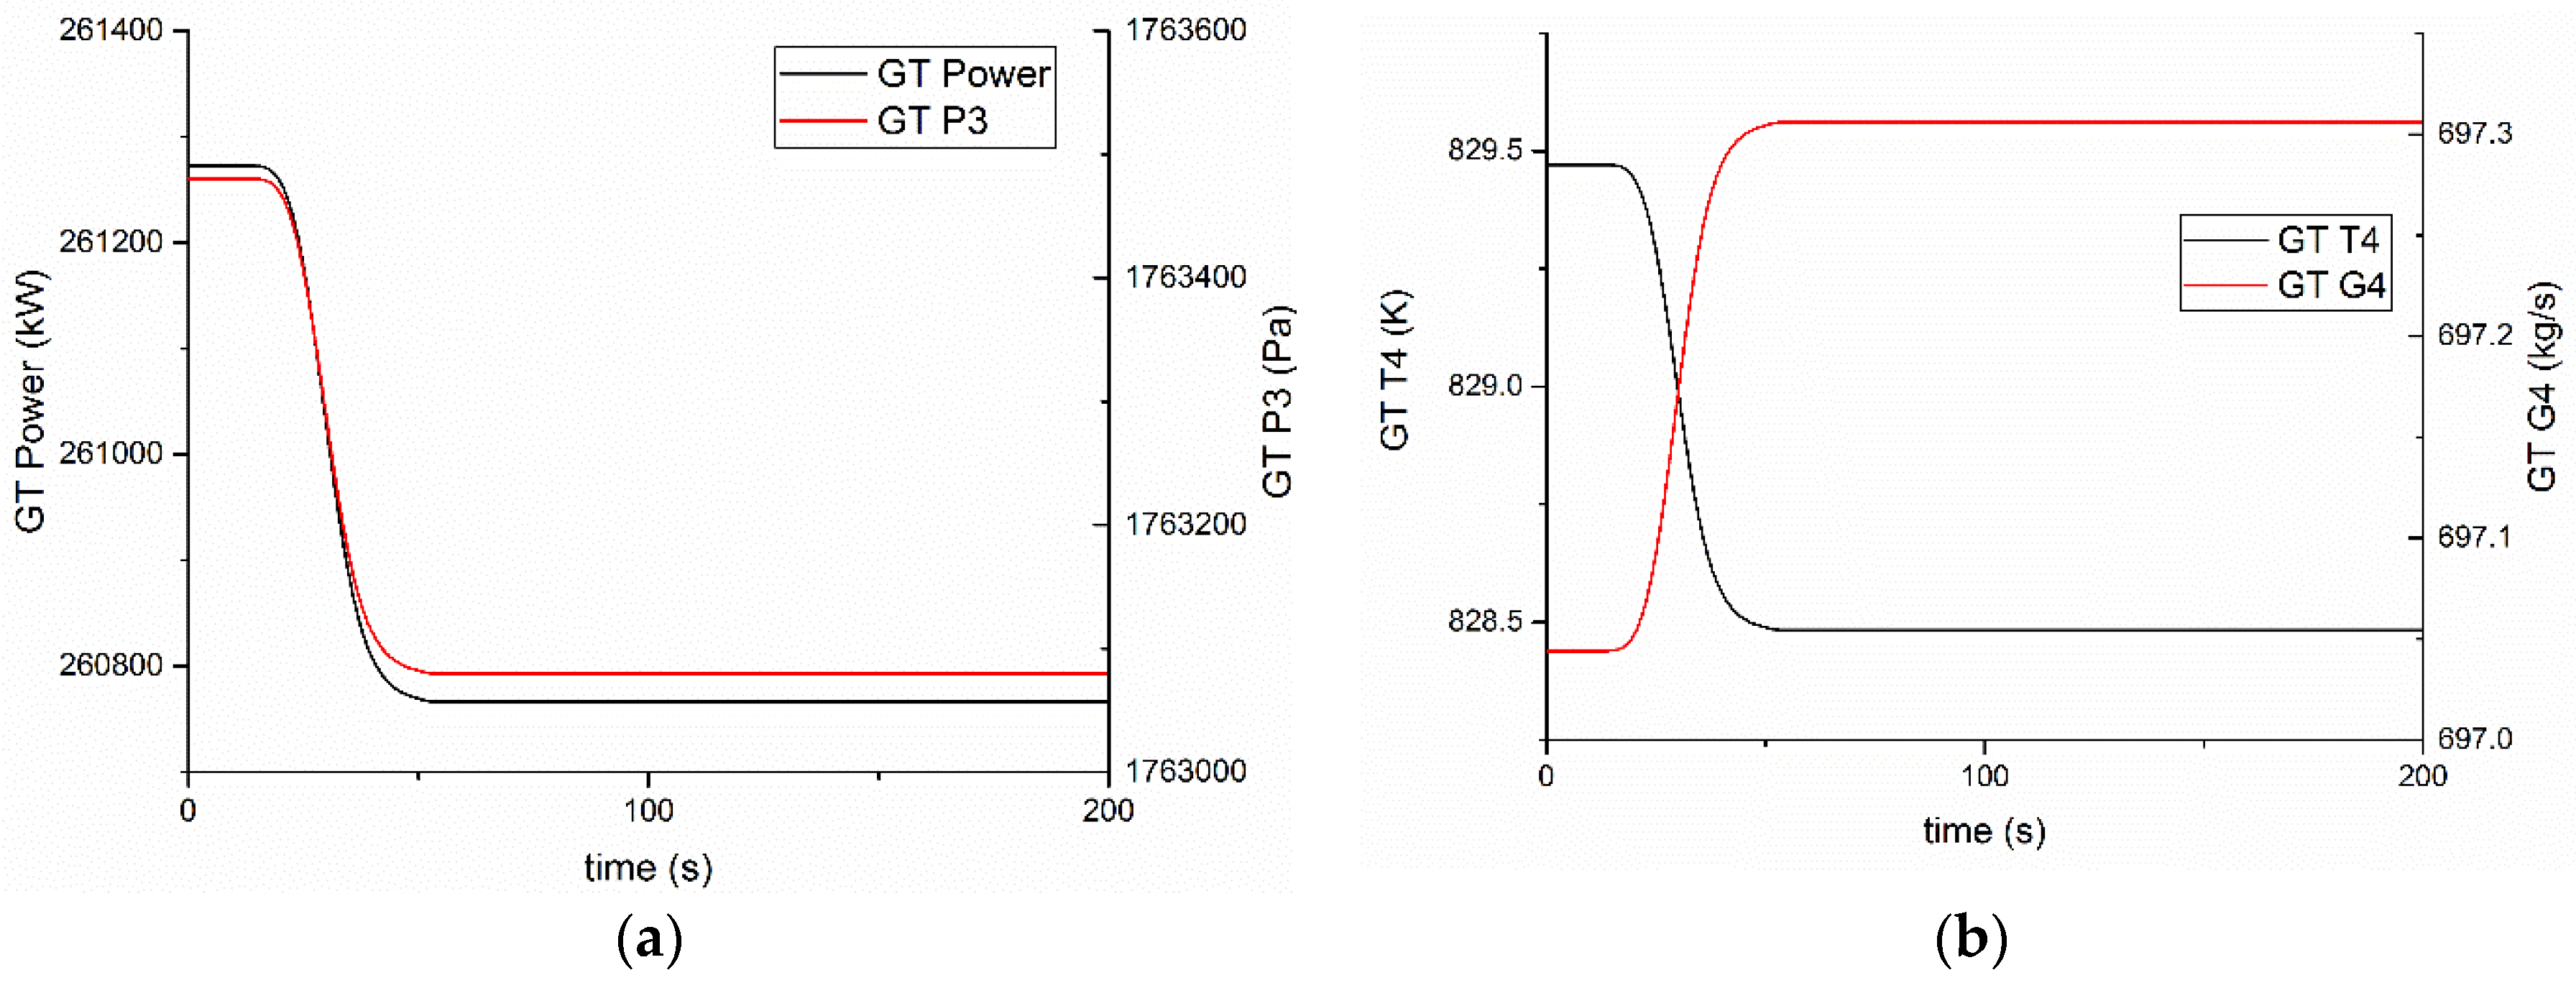
4.2. IGCC System Simulation

Combining the gasifier model with the power island model, the simulation of the IGCC system is eventually done. The dynamic response of the output power with the same +1% step change in the oxygen flow rate is shown in Figure 9. It is an interesting simulation condition because the flow rate of the fuel increases while the heating value decreases.
Due to the higher oxygen-to-coal ratio, the total heating value of the syngas decreases. Thus, the output power of the gas turbine decreases and achieves stability in about 50 s. It is an extremely quick response speed when considering that the gasifier has already taken about 40 s to reach stability. The results show that the gas turbine has the fastest response speed of all the components of IGCC plant.
Figure 10 shows the dynamic responses for the main parameters of the gas turbine. The turbine inlet pressure, which represents the pressure ratio, has a similar response trend as the power. This is because these two parameters are both related to the total heating value directly. The outlet flow rate and temperature have an opposite dynamic response. The outlet flow rate increases due to the higher flow rate of the fuel, while the outlet temperature decreases due to the lower heating value.
The dynamic responses for the output power, the main steam pressure and the enthalpy of the steam turbine are shown in Figure 11. Although the turbine outlet temperature (TOT) decreases, the waste heat from the gas turbine increases, mainly because of the higher flow rate. Due to this reason, the output power finally increases. However, the dynamic response is complicated because the changes of the steam pressure and temperature are opposite. The main steam pressure rises due to the higher waste heat, resulting in a higher mass flow in the steam turbine. The main steam temperature rises for the same reason at first, and then falls because of the lower TOT and higher steam flow rate. Since the inertia of the pressure is much smaller, the quick response of the pressure and flow rate lowers the steam temperature very rapidly. It is the reason why the output power of the steam turbine falls from the 25th s to the 40th s. The decreasing speed of the temperature becomes much slower, so that the output power becomes raised again. Finally, the power increases and achieves stability in 120 s, which is much slower than the gas turbine.
The above analysis shows that the dynamic responses are complicated with the simplified control strategy, mainly because the changes of the heating value and syngas flow rate are opposite. Thus, the design of the IGCC control system should be discussed more in-depth in the future.

5. Conclusions

The modeling of the IGCC considering the pressure and flow distribution of the gasifier has been proposed in this paper. A dynamic simulation was conducted. The following conclusions can be drawn:
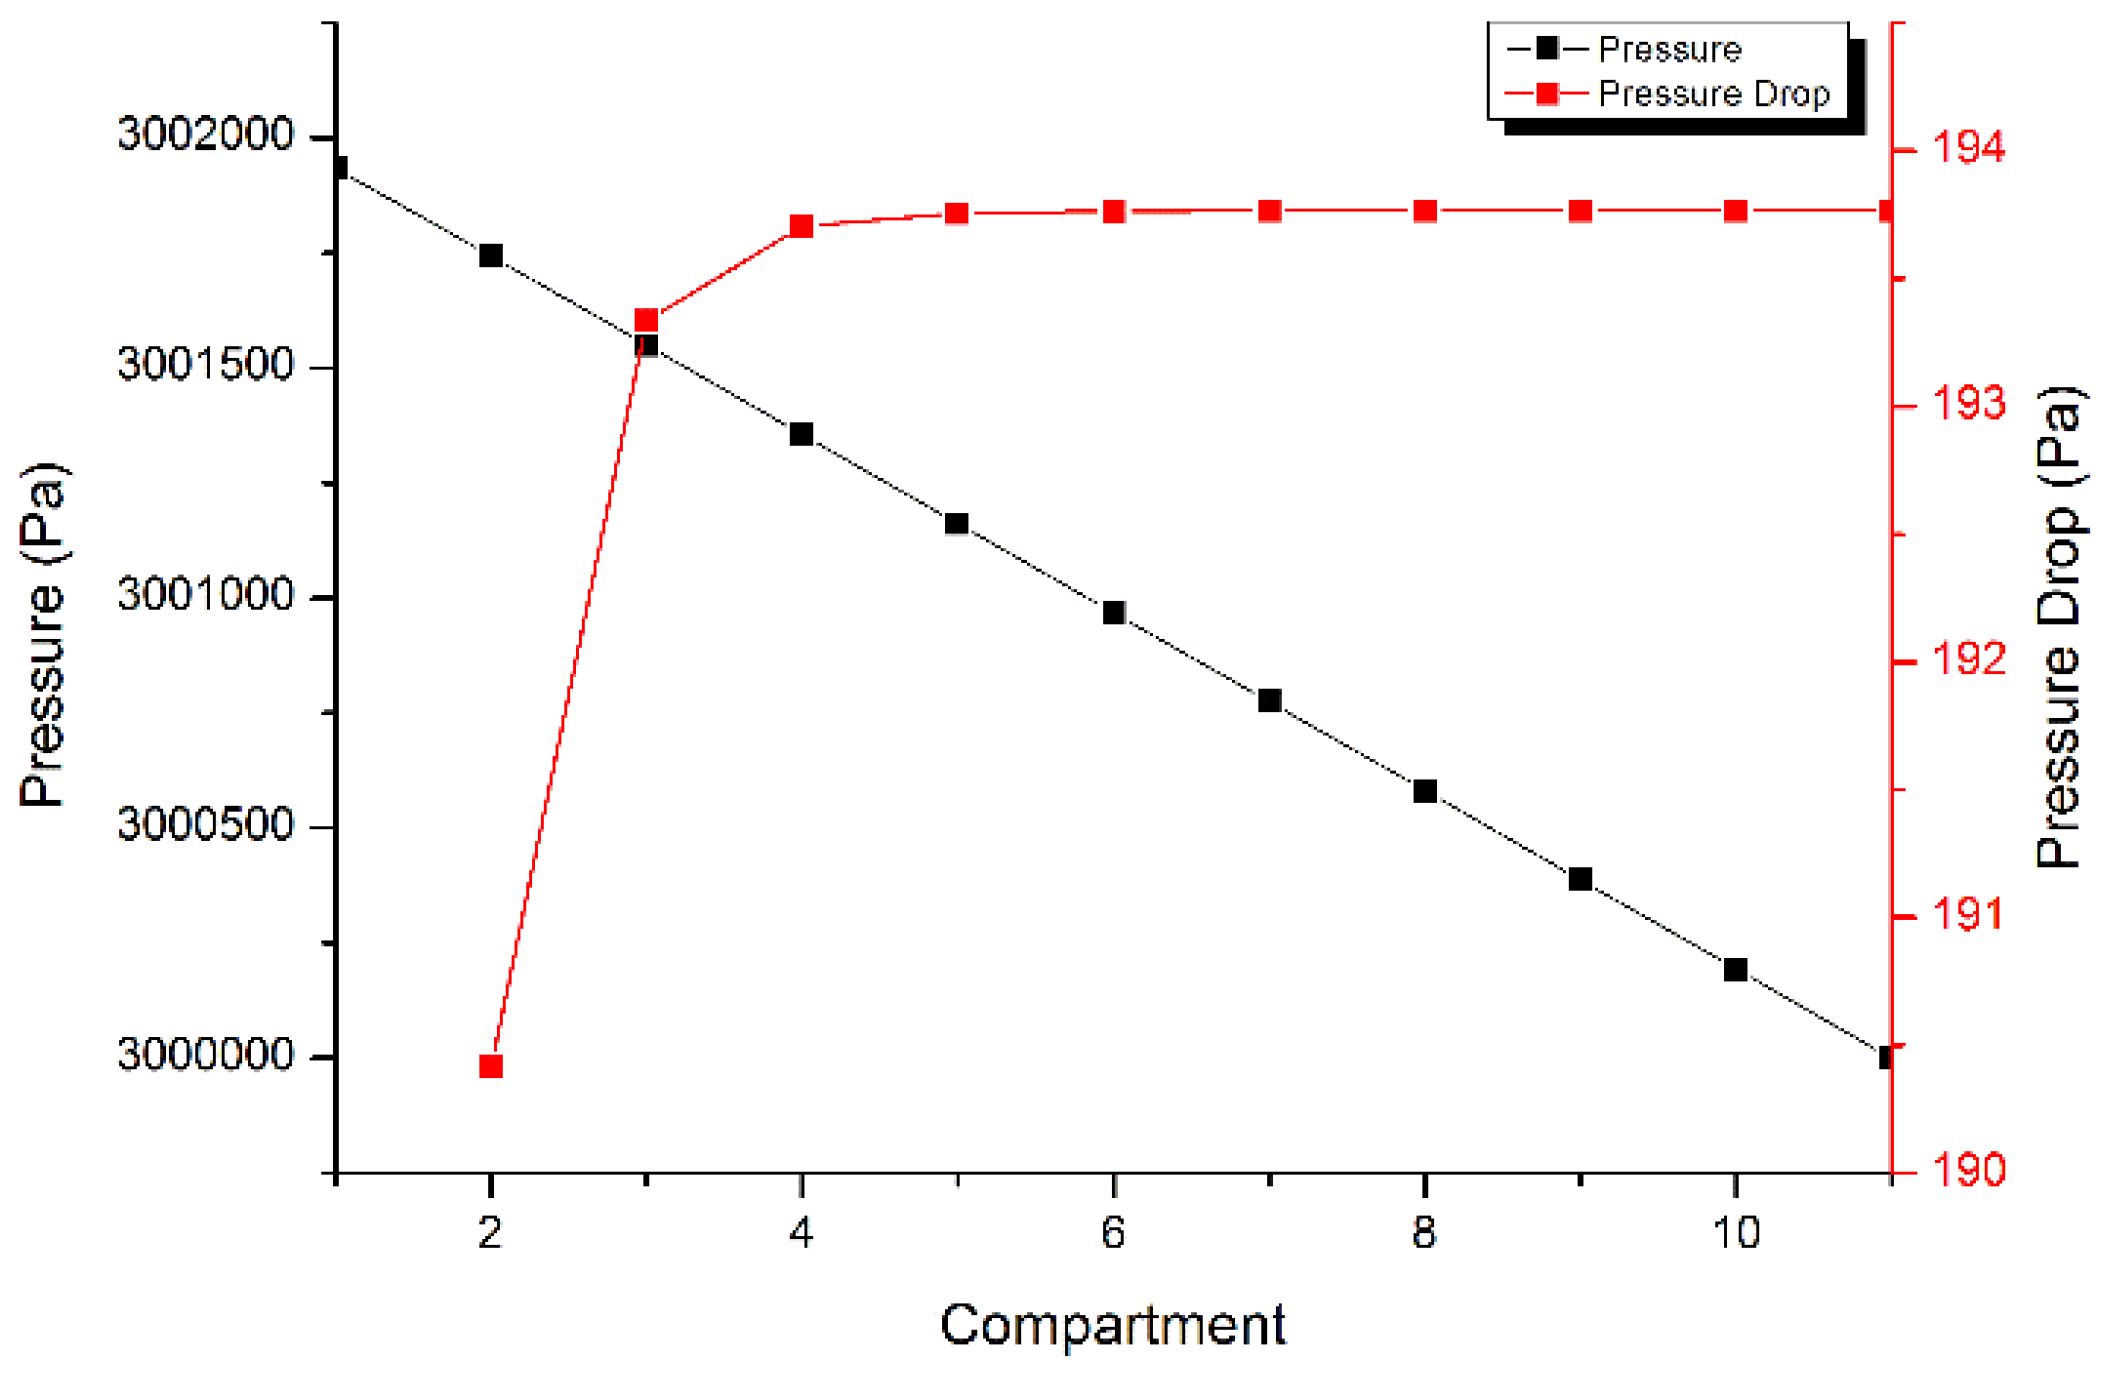
  • The new volume-resistance model can be used in the simulation of the Shell gasifier and IGCC system, especially in the analysis of the pressure and flow distribution characteristics in the gasifier. It meets the requirements for both steady-state and dynamic simulations.
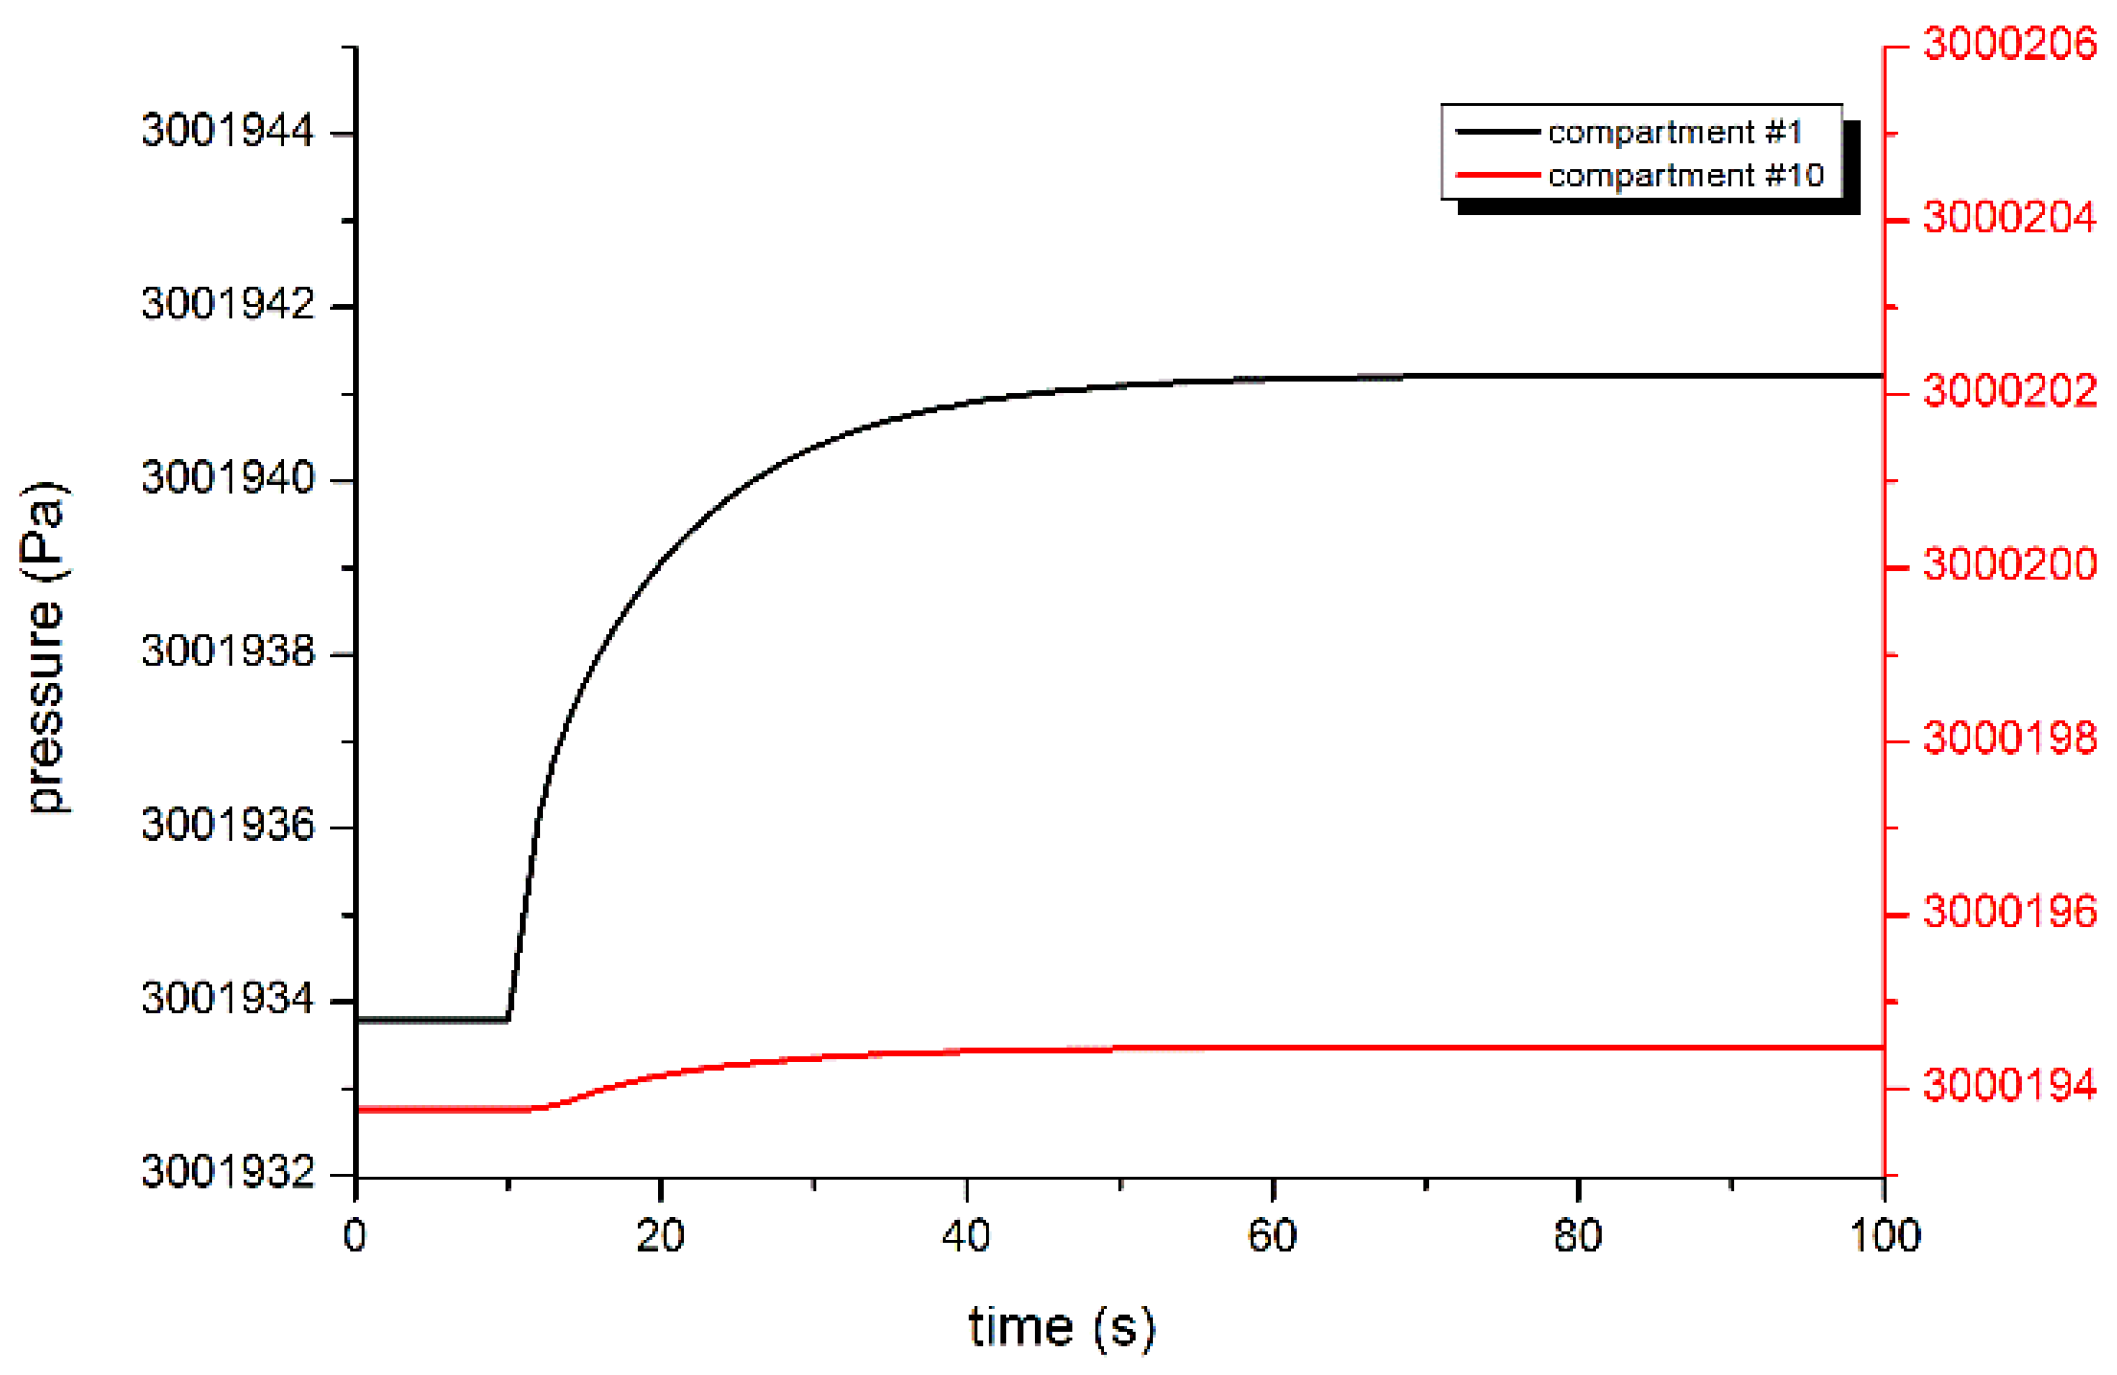
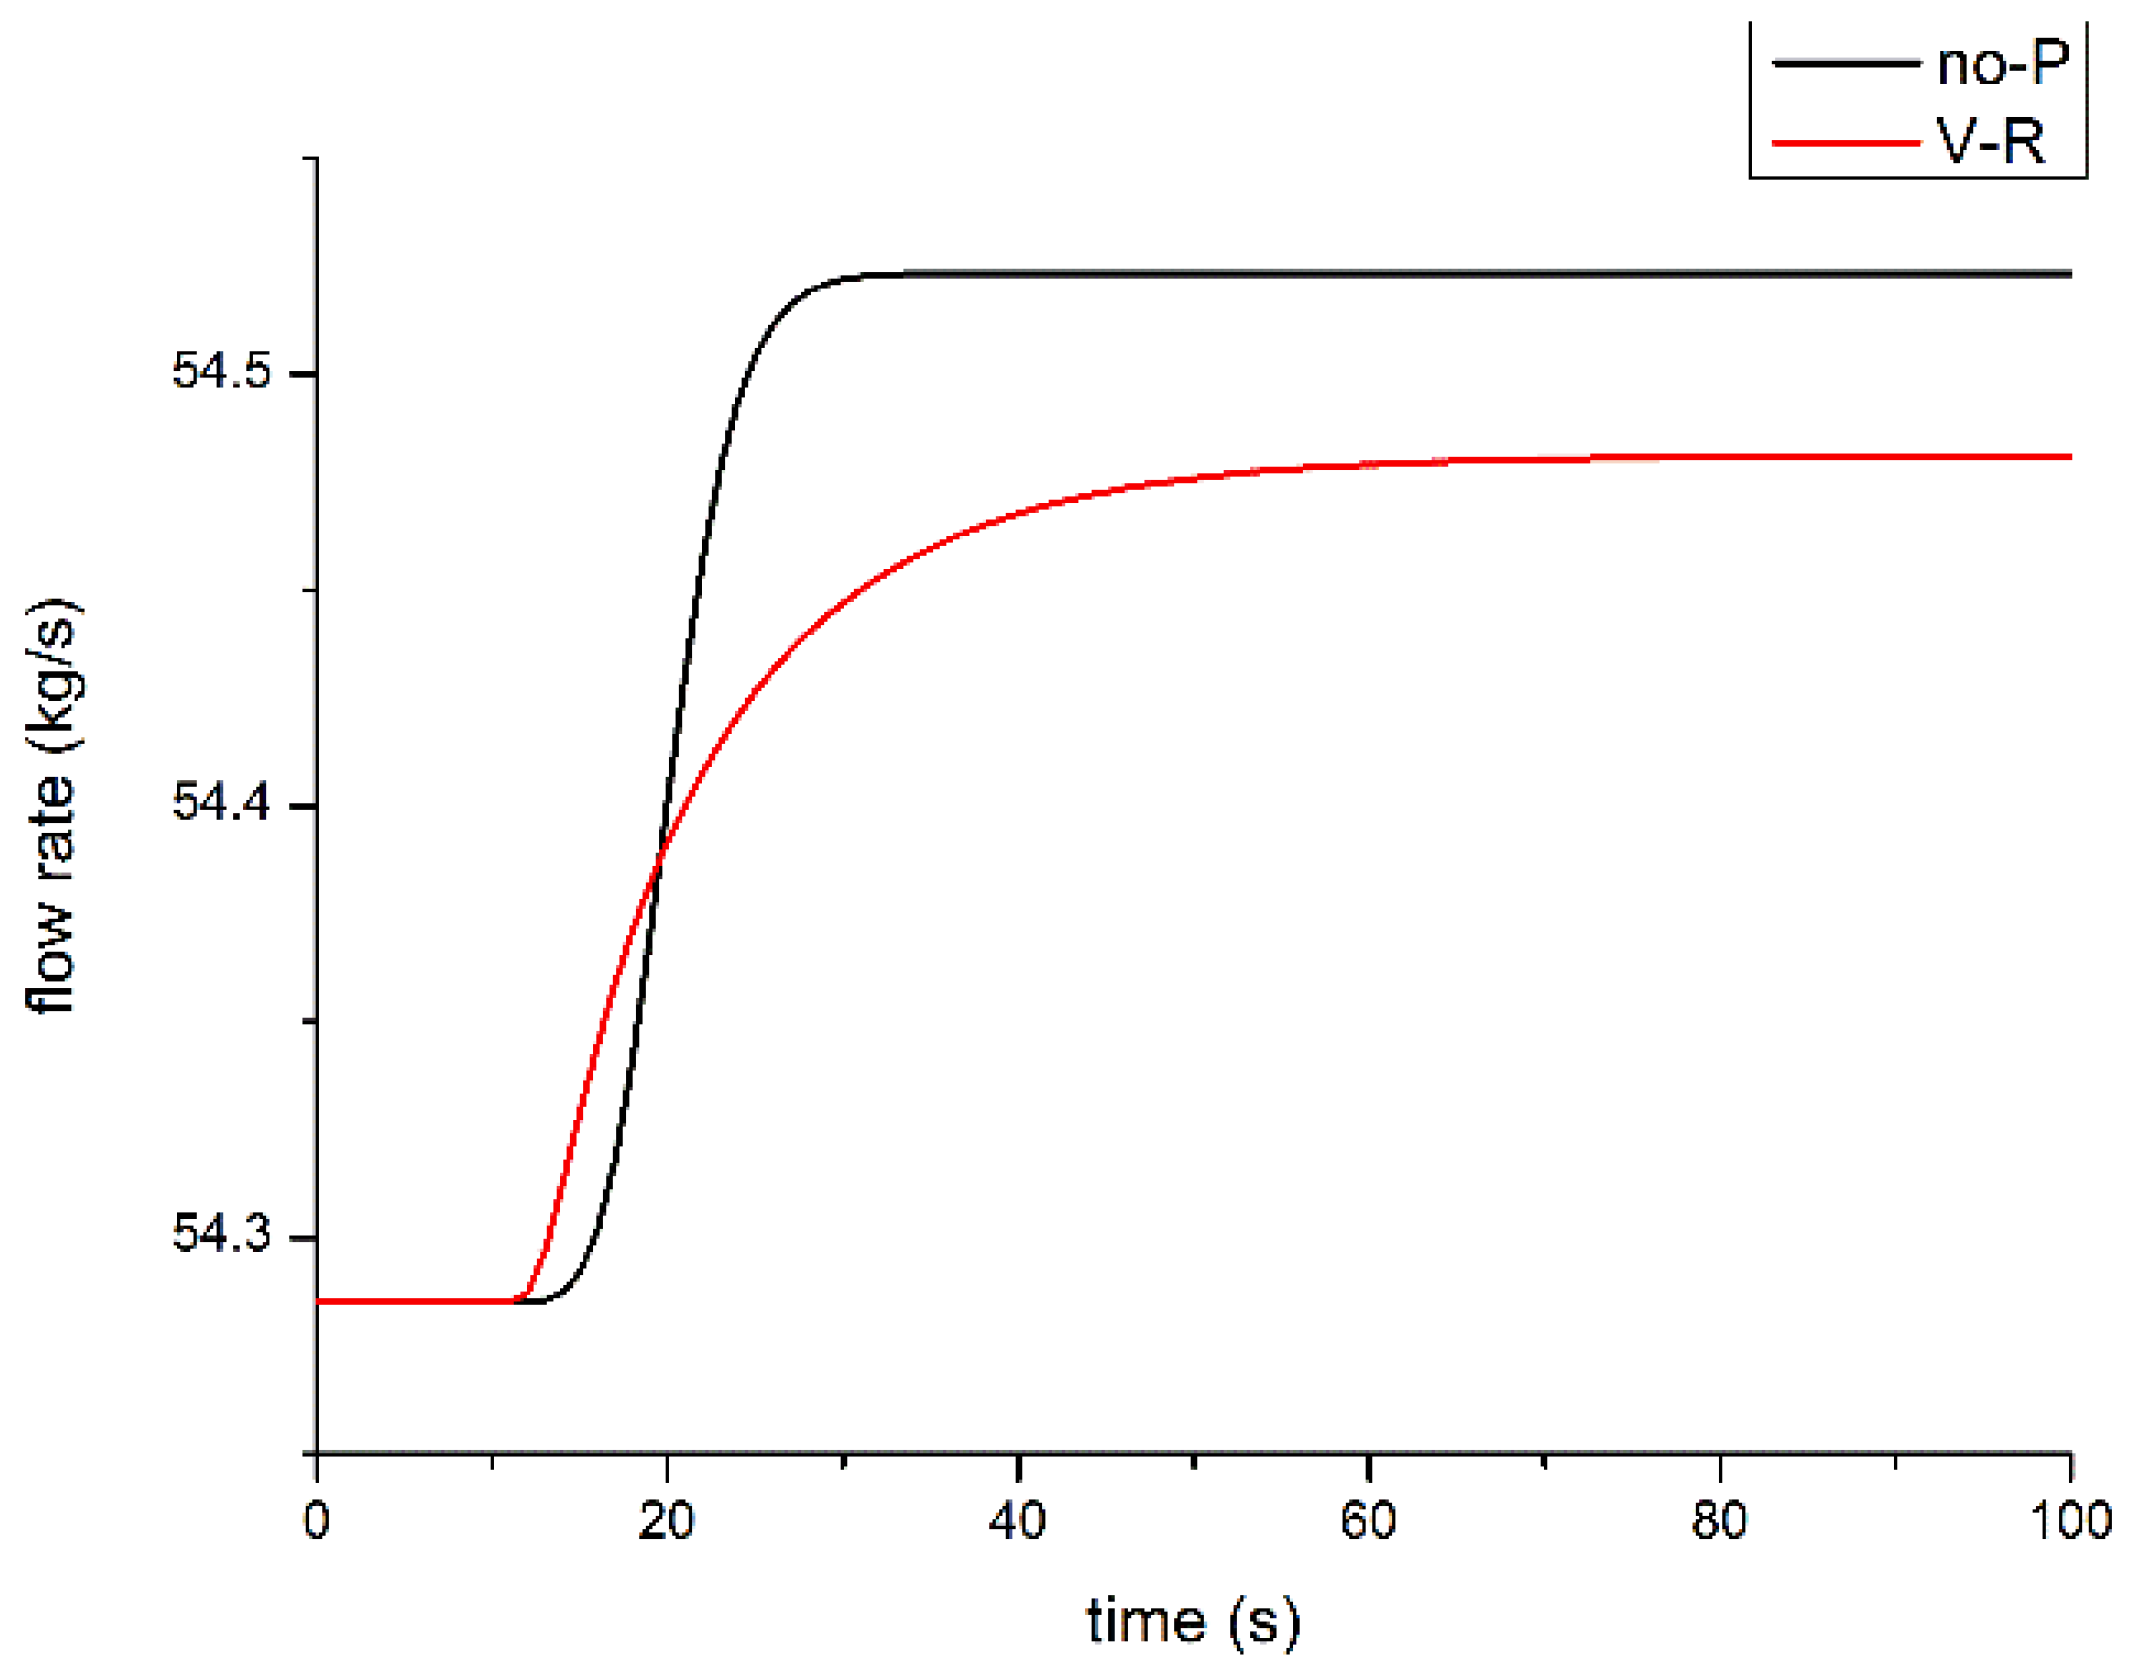
  • The IGCC system model with the new gasifier model can show the volume inertia well, through calculating the pressure and flow distribution. The simulation results of the new model show an obvious delay compared with the results of the models without considering the pressure and flow distribution. It is more realistic to reflect the dynamic response of the IGCC power plant.
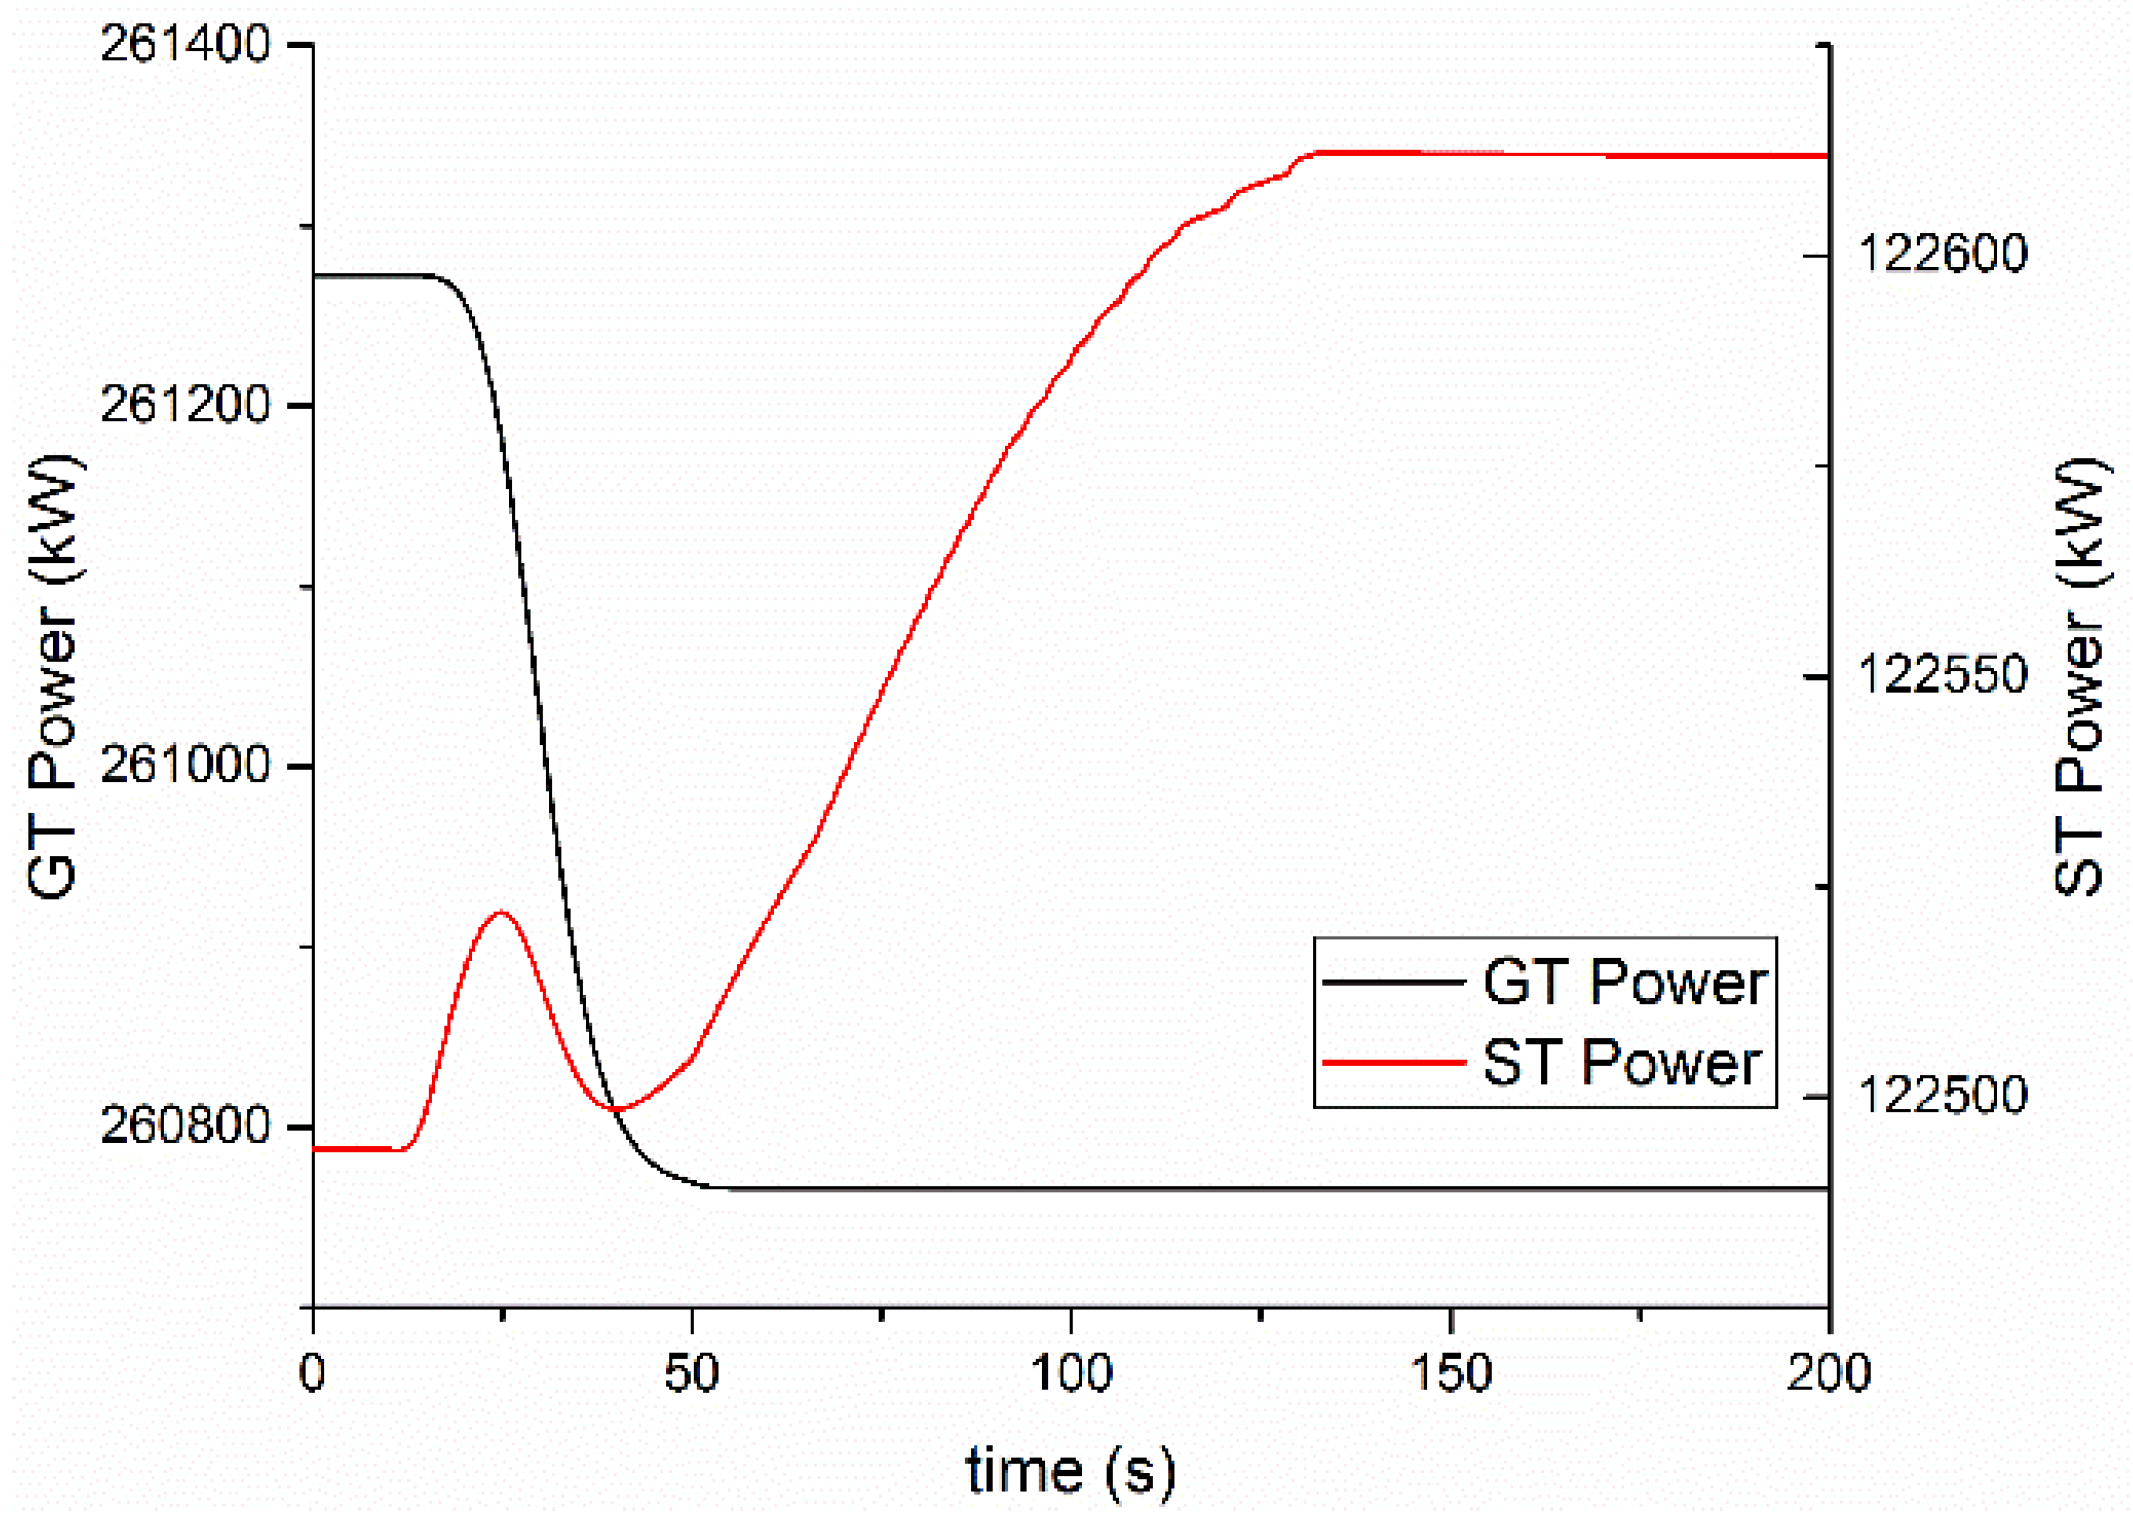
  • The simplified control system causes complicated dynamic responses for the steam turbine, which reduces the stability of the IGCC power plant. The new model can be used for the design of the IGCC control system.

Acknowledgments

This work is supported by Program of Science and Technology Committee of Shanghai Municipal (09DZ1200702).

Author Contributions

Ming Su and Huisheng Zhang proposed the volume-resistance characteristics method. Huisheng Zhang and Di Huang built the new IGCC model. Di Huang did the simulation experiment, analyzed the data and wrote the manuscript. Shilie Weng supervised the study and proof read the manuscript.

Conflicts of Interest

The authors declare no conflict of interest.

References

  1. Liu, H.W.; Ni, W.D.; Li, Z.; Ma, L.W. Strategic thinking on IGCC development in China. Energy Policy 2008, 36, 1–11. [Google Scholar] [CrossRef]
  2. Zhao, L.F.; Xiao, Y.H.; Gallagher, K.S.; Wang, B.; Xu, X. Technical, environmental, and economic assessment of deploying advanced coal power technologies in the Chinese context. Energy Policy 2008, 36, 2709–2718. [Google Scholar] [CrossRef]
  3. Liu, S.M.; Wang, P.Y.; Wei, S.L.; Kou, K.X. The Dynamic Model for the Gas Station of IGCC. Gas Turbine Technol. 2001, 14, 27–31. [Google Scholar]
  4. Elseviers, W.F.; van Mierlo, T.; van de Voorde, M.J.F.; Verelst, H. Thermodynamic simulations of lignite-fired IGCC with in situ desulfurization and CO2 capture. Fuel 1996, 75, 1449–1456. [Google Scholar] [CrossRef]
  5. Chui, E.H.; Majeski, A.J.; Lu, D.Y.; Hughes, R.; Gao, H.; McCalden, D.J.; Anthony, E.J. Simulation of entrained flow coal gasification. Energy Procedia 2009, 1, 503–509. [Google Scholar] [CrossRef]
  6. Jiang, L.; Lin, R.; Jin, H.; Cai, R.; Liu, Z. Study on thermodynamic characteristic and optimization of steam cycle system in IGCC. Energy Convers. Manag. 2002, 43, 1339–1348. [Google Scholar] [CrossRef]
  7. Kapetaki, Z.; Ahn, H.; Brandani, S. Detailed process simulation of pre-combustion IGCC plants using coal-slurry and dry coal gasifiers. Energy Procedia 2013, 37, 2196–2203. [Google Scholar] [CrossRef]
  8. Zheng, L.; Furinsky, E. Comparison of Shell, Texaco, BGL and KRW gasifiers as part of IGCC plant computer simulations. Energy Convers. Manag. 2005, 46, 1767–1779. [Google Scholar] [CrossRef]
  9. Gemayel, J.E.; Macchi, A.; Hughes, R.; Anthony, E.J. Simulation of the integration of a bitumen upgrading facility and an IGCC process with carbon capture. Fuel 2014, 117, 1288–1297. [Google Scholar] [CrossRef]
  10. Sun, B.; Liu, Y.W.; Chen, X.; Zhou, Q.; Su, M. Dynamic modeling and simulation of shell gasifier in IGCC. Fuel Process. Technol. 2011, 92, 1418–1425. [Google Scholar] [CrossRef]
  11. Zhang, H.S.; Huang, D.; Zhou, D.J.; Weng, S.L.; Lu, Z.H. The dynamic modeling and simulation on a Shell gasifier. In Proceedings of the ASME 2013 International Mechanical Engineering Congress & Exposition, San Diego, CA, USA, 15–21 November 2013; p. V06AT07A057.
  12. Lee, H.H.; Lee, J.C.; Joo, Y.J.; Min, O.; Lee, C.H. Dynamic modeling of Shell entrained flow gasifier in an integrated gasification combined cycle process. Appl. Energy 2014, 131, 425–440. [Google Scholar] [CrossRef]
  13. Wang, Y.; Wang, J.H.; Luo, X.; Guo, S.; Lv, J.F.; Gao, Q.R. Dynamic modelling and simulation of IGCC process with Texaco gasifier using different coal. Syst. Sci. Control Eng. Open Access J. 2015, 3, 198–210. [Google Scholar] [CrossRef]
  14. Hla, S.S.; Roberts, D.G.; Harris, D.J. A numerical model for understanding the behaviour of coals in an entrained-flow gasifier. Fuel Process. Technol. 2015, 134, 424–440. [Google Scholar] [CrossRef]
  15. Huang, D.; Zhang, H.S.; Weng, S.L.; Su, M. Dynamic modeling and simulaiton of gasifier based on volume-resistance characterisitics mehtod. Coal, Biomass and Alternative Fuels, Cycle Innovations, Electric Power. In Proceedings of the ASME Turbo Expo 2014: Turbine Technical Conference and Exposition, Dusseldorf, Germany, 16–20 June 2014; p. V03AT03A007.
  16. Zhang, H.S.; Weng, S.L.; Su, M. Dynamic modeling and simulation of distributed parameter heat exchanger. In Proceedings of the ASME Turbo Expo 2005: Power for Land, Sea, and Air, Las Vegas, NV, USA, 6–9 June 2005; pp. 327–333.
  17. Schoen, P. Dynamic Modeling and Control of Integrated Coal Gasification Combined Cycle Units. Ph.D. Thesis, Delft University of Technology, Delft, The Netherlands, 1993. [Google Scholar]
  18. Li, Z.; Wang, T.J.; Han, Z.M.; Zheng, H.T.; Ni, W.D. Study on mathematical model of texaco gasifier-modeling. Power Eng. 2001, 21, 1161–1165. [Google Scholar]
  19. Wen, C.Y.; Chaung, T.Z. Entrainment coal gasification modeling. Ind. Eng. Chem. Des. Dev. 1979, 18, 684–694. [Google Scholar] [CrossRef]
  20. Tang, K.F. The Modeling and Simulation of the IGCC System Based on a Shell Gasifier. Ph.D. Thesis, Shanghai Jiao Tong University, Shanghai, China, 2013. [Google Scholar]
  21. Jiao, S.J. Operating Method, Performance and System Research of Integrated Gasification Combined Cycle (IGCC), 1st ed.; China Electric Power Press: Beijing, China, 2014. [Google Scholar]
Figure 1. Schematic diagram of the compartment method.
Applsci 06 00292 g001
Figure 2. The layout of the integrated gasification combined cycle (IGCC) system.
Applsci 06 00292 g002
Figure 3. Diagram of the module structure in one compartment.
Applsci 06 00292 g003
Figure 4. Diagram of the gasifier compartment with the volume-resistance (V-R) model.
Applsci 06 00292 g004
Figure 5. Diagram of data flow direction of the IGCC system.
Applsci 06 00292 g005
Figure 6. Pressure distribution.
Applsci 06 00292 g006
Figure 7. Pressure dynamic response.
Applsci 06 00292 g007
Figure 8. Flow rate dynamic responses with two models (no-pressure model and V-R model).
Applsci 06 00292 g008
Figure 9. Dynamic responses for the output power of the gas turbine and steam turbine.
Applsci 06 00292 g009
Figure 10. Dynamic responses for the gas turbine: (a) output power and turbine inlet pressure; (b) turbine outlet temperature and turbine outlet mass flow rate.
Applsci 06 00292 g010
Figure 11. Dynamic response for the steam turbine.
Applsci 06 00292 g011
Table 1. Proximate analysis and ultimate analysis of coal (dry basis).
Proximate AnalysisUltimate Analysis
MoistureAshVolatatilesFixed CarbonCHNSClO
1%7%34%59%75.07%4.49%0.96%0.42%0.01%12.05%
Table 2. Comparison of steady state results for syngas (El Cerrejon Coal).
Syngas at Outlet/Molar FractionCOH2CO2H2O
lumped model65.3%29.4%0.25%0.42%
No-Pressure model66%28.4%0.93%1.25%
V-R model65.7%28.6%0.94%1.31%
Experimental result63.1%30%0.8%1.5%

