Article

A Synthetic Data Generation Framework for the Development of Computer Vision Applications in Manufacturing


by
Kosmas Alexopoulos
1,2,*,
Christos Manettas
1,
Dimitrios Tsikos
1 and
Nikolaos Nikolakis
1
1
Laboratory for Manufacturing Systems & Automation (LMS), Department of Mechanical Engineering & Aeronautics, University of Patras, Rion, 26504 Patras, Greece
2
Department of Digital Industry Technologies, National and Kapodistrian University of Athens, 34400 Psahna, Greece
*
Author to whom correspondence should be addressed.
Appl. Sci. 2026, 16(9), 4388; https://doi.org/10.3390/app16094388
Submission received: 2 March 2026 / Revised: 22 April 2026 / Accepted: 24 April 2026 / Published: 30 April 2026

Abstract

Machine learning techniques are increasingly used for computer vision applications in manufacturing. Synthetic data, generated through realistic simulations, are utilized to accelerate the data collection process while optimizing accuracy and precision of ML models. However, in manufacturing there is usually the need for the development of several CV applications that support different production steps. This obstacle requires a systematic approach for generating synthetic datasets that can be used for developing effective CV systems. Hence, this work presents a pipeline for generating photorealistic synthetic datasets, using a set of digital tools such as 3D modeling, photorealistic rendering, automated labeling, and ML training tools. The proposed framework is tested and validated in a robot-assisted packaging case in the dairy industry. The industrial use case provides a pilot-level demonstration that the synthetic dataset generation framework can support the development of CV modules across several production steps and thus it can aid in accelerating commissioning and reconfiguration of industrial automation setups. Moreover, the pilot validation indicates that object detection and recognition models trained on synthetic data can provide sufficient performance for the specific requirements of the examined packaging scenario.

1. Introduction

Data-driven artificial intelligence (AI) technologies, such as machine learning (ML) and deep learning (DL), are rapidly gaining traction in manufacturing as part of the broader digital transformation of industry, associated with the concepts of Industry 4.0 and the emerging Industry 5.0 paradigm [1,2,3]. However, the effectiveness of these technologies largely depends on the availability of reliable training data. In industrial environments, the collection of such datasets is often limited by factors such as restricted access to production lines, variability of operating conditions, and the low frequency of certain events or defects. In addition, the preparation of training datasets typically requires extensive manual annotation, a process that demands domain expertise and considerable time, especially for image-based applications. As a result, dataset creation becomes costly and may introduce inconsistencies or human errors [4]. These challenges are exacerbated in cases where data are missing, unprocessed, noisy, or poorly annotated. Under these conditions, traditional AI approaches that rely only on real-world data are often insufficient for industrial needs. To address these limitations, methods that facilitate the creation of reliable datasets, such as data augmentation and synthetic data generation, have been proposed to support the wider adoption of AI technologies in manufacturing environments [5,6,7]. On the former occasion, augmented data have been proven critical for the assistance of AI applications as they step on real datasets and expand the available datasets with the provision of unprecedented data from randomization processes, offering the opportunity to eliminate category imbalances or bias [7]. On the latter occasion, synthetic data have emerged as a solution not only when data are unavailable but also when data are scarce, imbalanced, or sensitive [8]. Based on simulations (either graphical or numerical) synthetic data are fully controllable and offer the opportunity to researchers to shape the generated dataset according to their exact needs in terms of data size, categorization, bias, annotation, computational usage and training time, parametrization, inclusion and occlusion [9]. Synthetic data, despite being a long-established concept, has only recently gained appeal among the scientific community, while their application in edge computing applications, such as computer vision, has flourished gradually over the last decade; however, deployment in manufacturing remains comparatively less explored. As reported in the literature review [8], most computer vision-related synthetic data applications in manufacturing focus on automating single production steps and the simulation of real-world environments where data collection is unfeasible or time-consuming. This reveals a specific gap: end-to-end, multi-step pipelines validated on real production lines are underrepresented. Exploiting the aforementioned statement, the current work presents a synthetic data generation and AI model training framework that systematically integrates contemporary computer vision applications into manufacturing systems while considering the professionals’ and production needs of industrial sites. The challenges posed by the wide range of environmental variables across different manufacturing processes and production steps are extensive [10,11]. Factors such as lighting variations, different products of interest, operation speed, occlusions, and diverse material properties create significant hurdles for traditional computer vision approaches [12] and often prevent consistent performance across scenarios. The proposed framework is applicable across multiple use cases, including quality inspection, robotic assistance, and product identification. It enables comprehensive AI model training and demonstrates robust performance under real-world conditions, while offering reduced training time, increased flexibility in data acquisition, and performance comparable to approaches based on physical data. The framework can support integration of computer vision to different production tasks, enabling easy-to-configure product, lighting, material, AI model and environment customization. Further contributions of this work are summarized as follows:
  • Proposes a framework of software tools and a dataflow for synthetic data (images) generation that can be used for training and integrating ML/DL models in several production steps that require computer vision (CV) support.
  • Validates the framework’s general application through implementation in three different steps of an industrial case (mixed packaging) from the dairy industry, a sector that synthetic data has limited applications so far [13].
  • Provides pilot-level evidence that object detection and recognition algorithms trained on synthetic image datasets can support practical CV tasks in a real manufacturing scenario.
  • The proposed framework, driven by synthetic data generation and AI model training, presents increased data reusability, low development costs, reduced training time and automatic labeling of data.

2. Literature Review

Although AI has been studied for decades, recent advancements have made it more affordable and mature, enabling its integration into manufacturing [1]. Recently, numerous AI applications (computer vision, predictive maintenance, etc.) have been developed to meet a wide range of manufacturing needs (i.e., product design, quality inspection and decision support). Regarding quality assessment, Kardovskyi and Moon [14] proposed a computer vision-based quality inspection system for steel bar installation. In a similar direction, Alexopoulos et al. [15] presented a CV system that uses a convolutional neural network (CNN) for the automated estimation of the fill level in industrial waste containers of metal scrap.
The industrial robotics sector has significantly benefited from ML implementations. Andhare and Rawat [16] and Mathur et al. [17] investigated the development of a CV-driven robotic operation for small-scale picking tasks of objects with limited success. Chen et al. [18] developed and evaluated the detection of the picking point of tea buds along with imaging parameters that influence proper detection. Prezas et al. [19] proposed an ML-based perception system that employs a 3D vision sensor to perform online process quality control of large-part assembly with the aim of execution autonomy for a robotic manipulator that handles glue dispensing on diverse types of aluminum profiles.
Despite the advanced research and recent implementations of ML in manufacturing, laborious data collection and annotation are barriers which influence the quality, cost and eventually the deployment of ML projects [20]. Traditional data collection refers to in vivo data that is captured from real-life situations that were not primarily created or modified for the purpose of capturing training data. Researchers have acknowledged the limitations of in vivo data and have turned to alternative data acquisition approaches, namely in vitro and in silico data [21]. In vitro data refers to data captured using physical sensors under lab conditions, while in silico data, as known as synthetic data, are generated by simulations [22].
Synthetic data generation, offering low cost, unlimited dataset size creation and automatic labeling, has attracted the interest of computer vision researchers. Some applications involve rendered images created by 3D models, thus providing the ability to create 3D synthetic, online repositories with millions of images classified in thousands of classes [23]. Singh et al. consolidated image-synthesis methods for industrial defect detection and recent advances relevant to manufacturing CV [24]. Tremblay et al. [25] thoroughly researched object-detection- and domain-knowledge-driven synthetic data generation. They used the technique of domain randomization, in which the parameters of the simulator, such as lighting, pose, object textures, etc., are randomized to force the neural network to learn essential features. Recent evidence from automotive production further shows that fully synthetic training can achieve competitive visual inspection performance on factory tasks [26]. Roberts et al. [27] presented Hyperism, a photorealistic synthetic dataset for holistic indoor scene understanding. Alexopoulos et al. [4] and Manettas et al. [8] worked on pose-estimation problems of parts towards robot manipulation by exploiting image classification algorithms built upon synthetic data. Fang et al. [5] and Bousmalis et al. [6] investigated robot grasping based on synthetic data that were created by top-notch simulators. Synthetic data were also favored in robot grasping by Josifovski et al. [28], that have detected the correct grasping bounding boxes of objects towards picking tasks. In the assembly sector, Thomas et al. [29] investigated autonomous robotic assembly using CAD design files. Motion planning was shown to be more successful based on CAD geometry rather than traditional methods. Papacharalampopoulos et al. [30] used 3D CAD of Parabolic Trough Collector reflector surface for the pre-training of neural networks used for image recognition of defects on the surface of the collector. Both Kim et al. [31] and Rožanec et al. [32] demonstrated quality inspection pipelines trained with synthetic imagery. Synthetic data have successfully emulated part defects at minimal cost while maintaining high detection accuracy. In parallel, mixed-reality systems combined with CV have been explored for quality inspection in zero-defect contexts [33].
The literature review reveals that, to the best of our current knowledge, no CV applications, which are based on synthetic data and which expand among several production steps, have been applied to the manufacturing sector. Most cases discussed in the synthetic data literature refer to stand-alone CV tasks rather than more complicated collaboration of recognition algorithms that real-world implementations require. Consequently, a gap persists in the development of systematic synthetic-data generation frameworks capable of supporting ML and DL models across diverse production phases and enhancing their generalization capacity. To address this the current work proposes a framework that mitigates inconsistency and inefficiency in computer vision applications, supporting implementations across multiple production steps. Developed through the collaborative efforts of industry and technology experts, this framework adapts to varying conditions, products, required AI models and other variables, thus reducing specialized setups, lowering costs, and improving accuracy, scalability, and integration across the production line. This synthetic data framework is validated in a robot-assisted mixed-packaging scenario in the dairy industry.

3. Materials and Methods

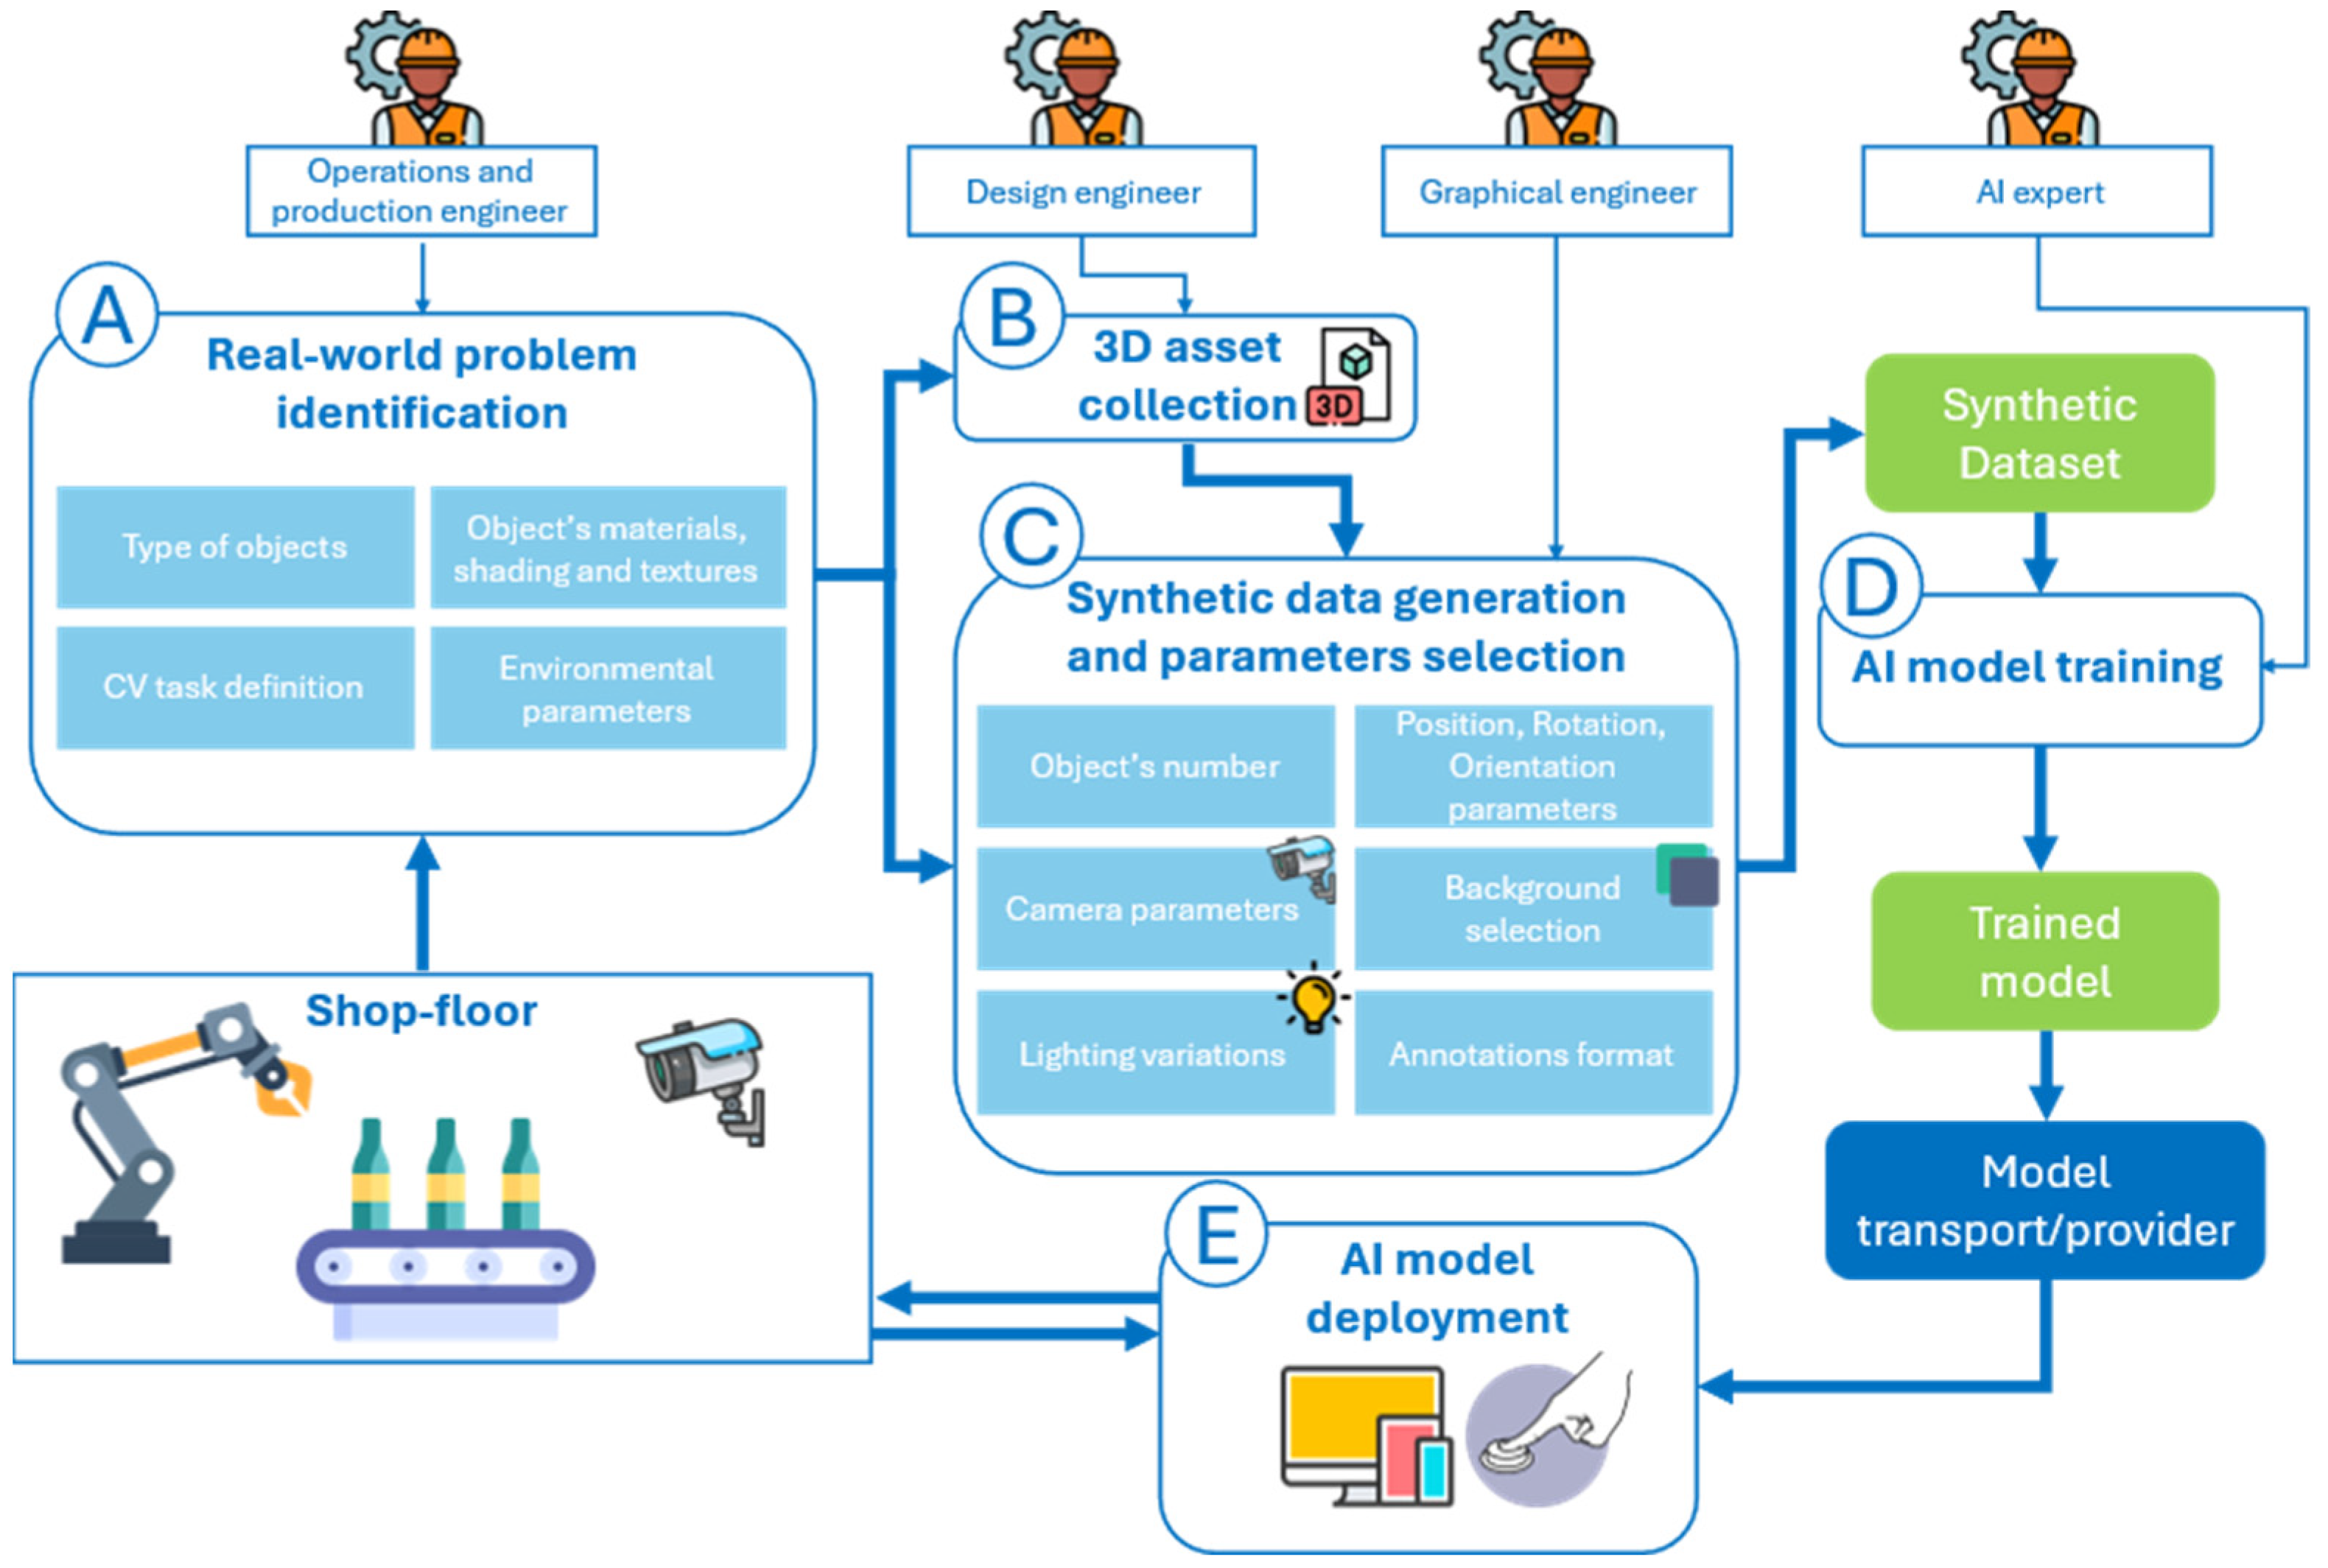
Acknowledging the value of synthetic data and the success of state-of-the-art data generation approaches [5,8,23,25] in CV applications, the current work proposes a synthetic image generation and ML model training framework that supports CV as a collaborative effort of experts. Contrary to other similar frameworks [34], this approach is specifically designed to be applicable in complex manufacturing scenarios that involve multiple process steps. In this section a framework for synthetic dataset generation and model training is presented. The proposed framework is decomposed into five steps (A–E) as presented in Figure 1 and described hereafter.
A.
Real-world problem identification: Initially, a team of experts in the manufacturing domain is set up, bringing factory operations expertise and knowhow (such as production engineers and plant managers). These professionals investigate current problems and operations including improvement margins. The team evaluates existing practices, identifies problems, and documents operations that could be optimized by CV systems. The sum of these actions results in a set of problem requirements referring to the encountered problem itself and any environmental or installation prerequisites including lighting and shades, common objects handled, potential camera position and materials. These requirements are an essential aspect of how the synthetic data generation framework will be deployed and serve as an input to the framework during the next steps.
B.
3D asset collection: Based on the requirements and specifications suggested by the domain experts, the CAD files of the objects of interest must be created along with visualization properties such as materials and textures. Consequently, a design engineer receives object specifications from step A and is responsible for delivering the three-dimensional CAD files needed for synthetic data generation in the next step. This step can be accelerated as the 3D files can be readily available in the Product Lifecycle Management (PLM) system of the organization. Alternatively, the 3D assets can be designed in a CAD software by the designer.
C.
Synthetic data generation and parameter selection: During this phase the developer receives and imports the 3D files from step B into a 3D graphics simulator with photorealistic rendering capabilities such as Blender, Unreal Engine, Unity or Omniverse. The goal of the current step is to create a dataset, involving both the synthetic images and their corresponding annotation files. To handle the variability of real-world settings, based on the requirements of step A, the proposed method relies on the technique of domain randomization [25], in which the simulation parameters (i.e., objects number and positioning, camera positioning and properties, background selection, lighting variations and annotation area selection) are randomized to generate datasets with consistent structure that can be used to train effectively ML models. The proposed method provides a set of parameters (see Group A in Table 1) that enable variation in the generated synthetic data. Group B in Table 1 contains the parameters related to the training process of an ML model.
By automatically selecting random values according to the parameters defined in Table 1, a 3D scene gets rendered, enabling virtual image capturing and labeling. Within a few hours, a dataset comprising thousands of image and annotation pairs can be generated, provided that a high-performance computational system is utilized. This dataset will be deployed in the next steps for the training and testing of an ML/DL model.
D.
AI model training: For the training phase of the pipeline, an ML expert receives the annotated dataset of step C and is responsible for training one or more AI models to identify and distinguish the information brought by the datasets. This step involves the selection of an AI model, any data preparation if needed, hyperparameter tuning and the training procedure itself which may range from a few minutes to days depending on the complexity of the problem. The training process is then followed by testing of the model, preliminary accuracy evaluation and at times, retraining with an augmented dataset. The outcome of the procedure is a trained model that consists of several files and is easily deployable by modern cloud clients.
E.
AI model deployment: A software development team undertakes the model deployment and integration phase to an operational digital platform. The team, having received the final model from step D, designs and develops a platform suitable for visualization of the predictions and action initialization (e.g., robot control movement), offering day-to-day operability. The final setup also requires the installation of sensors in the factory, interdependencies with legacy systems and other components, necessary peripherals and finally, personnel training for everyday interaction.

4. Industrial Pilot Case: Robot-Assisted Packaging

4.1. Industrial Pilot Description

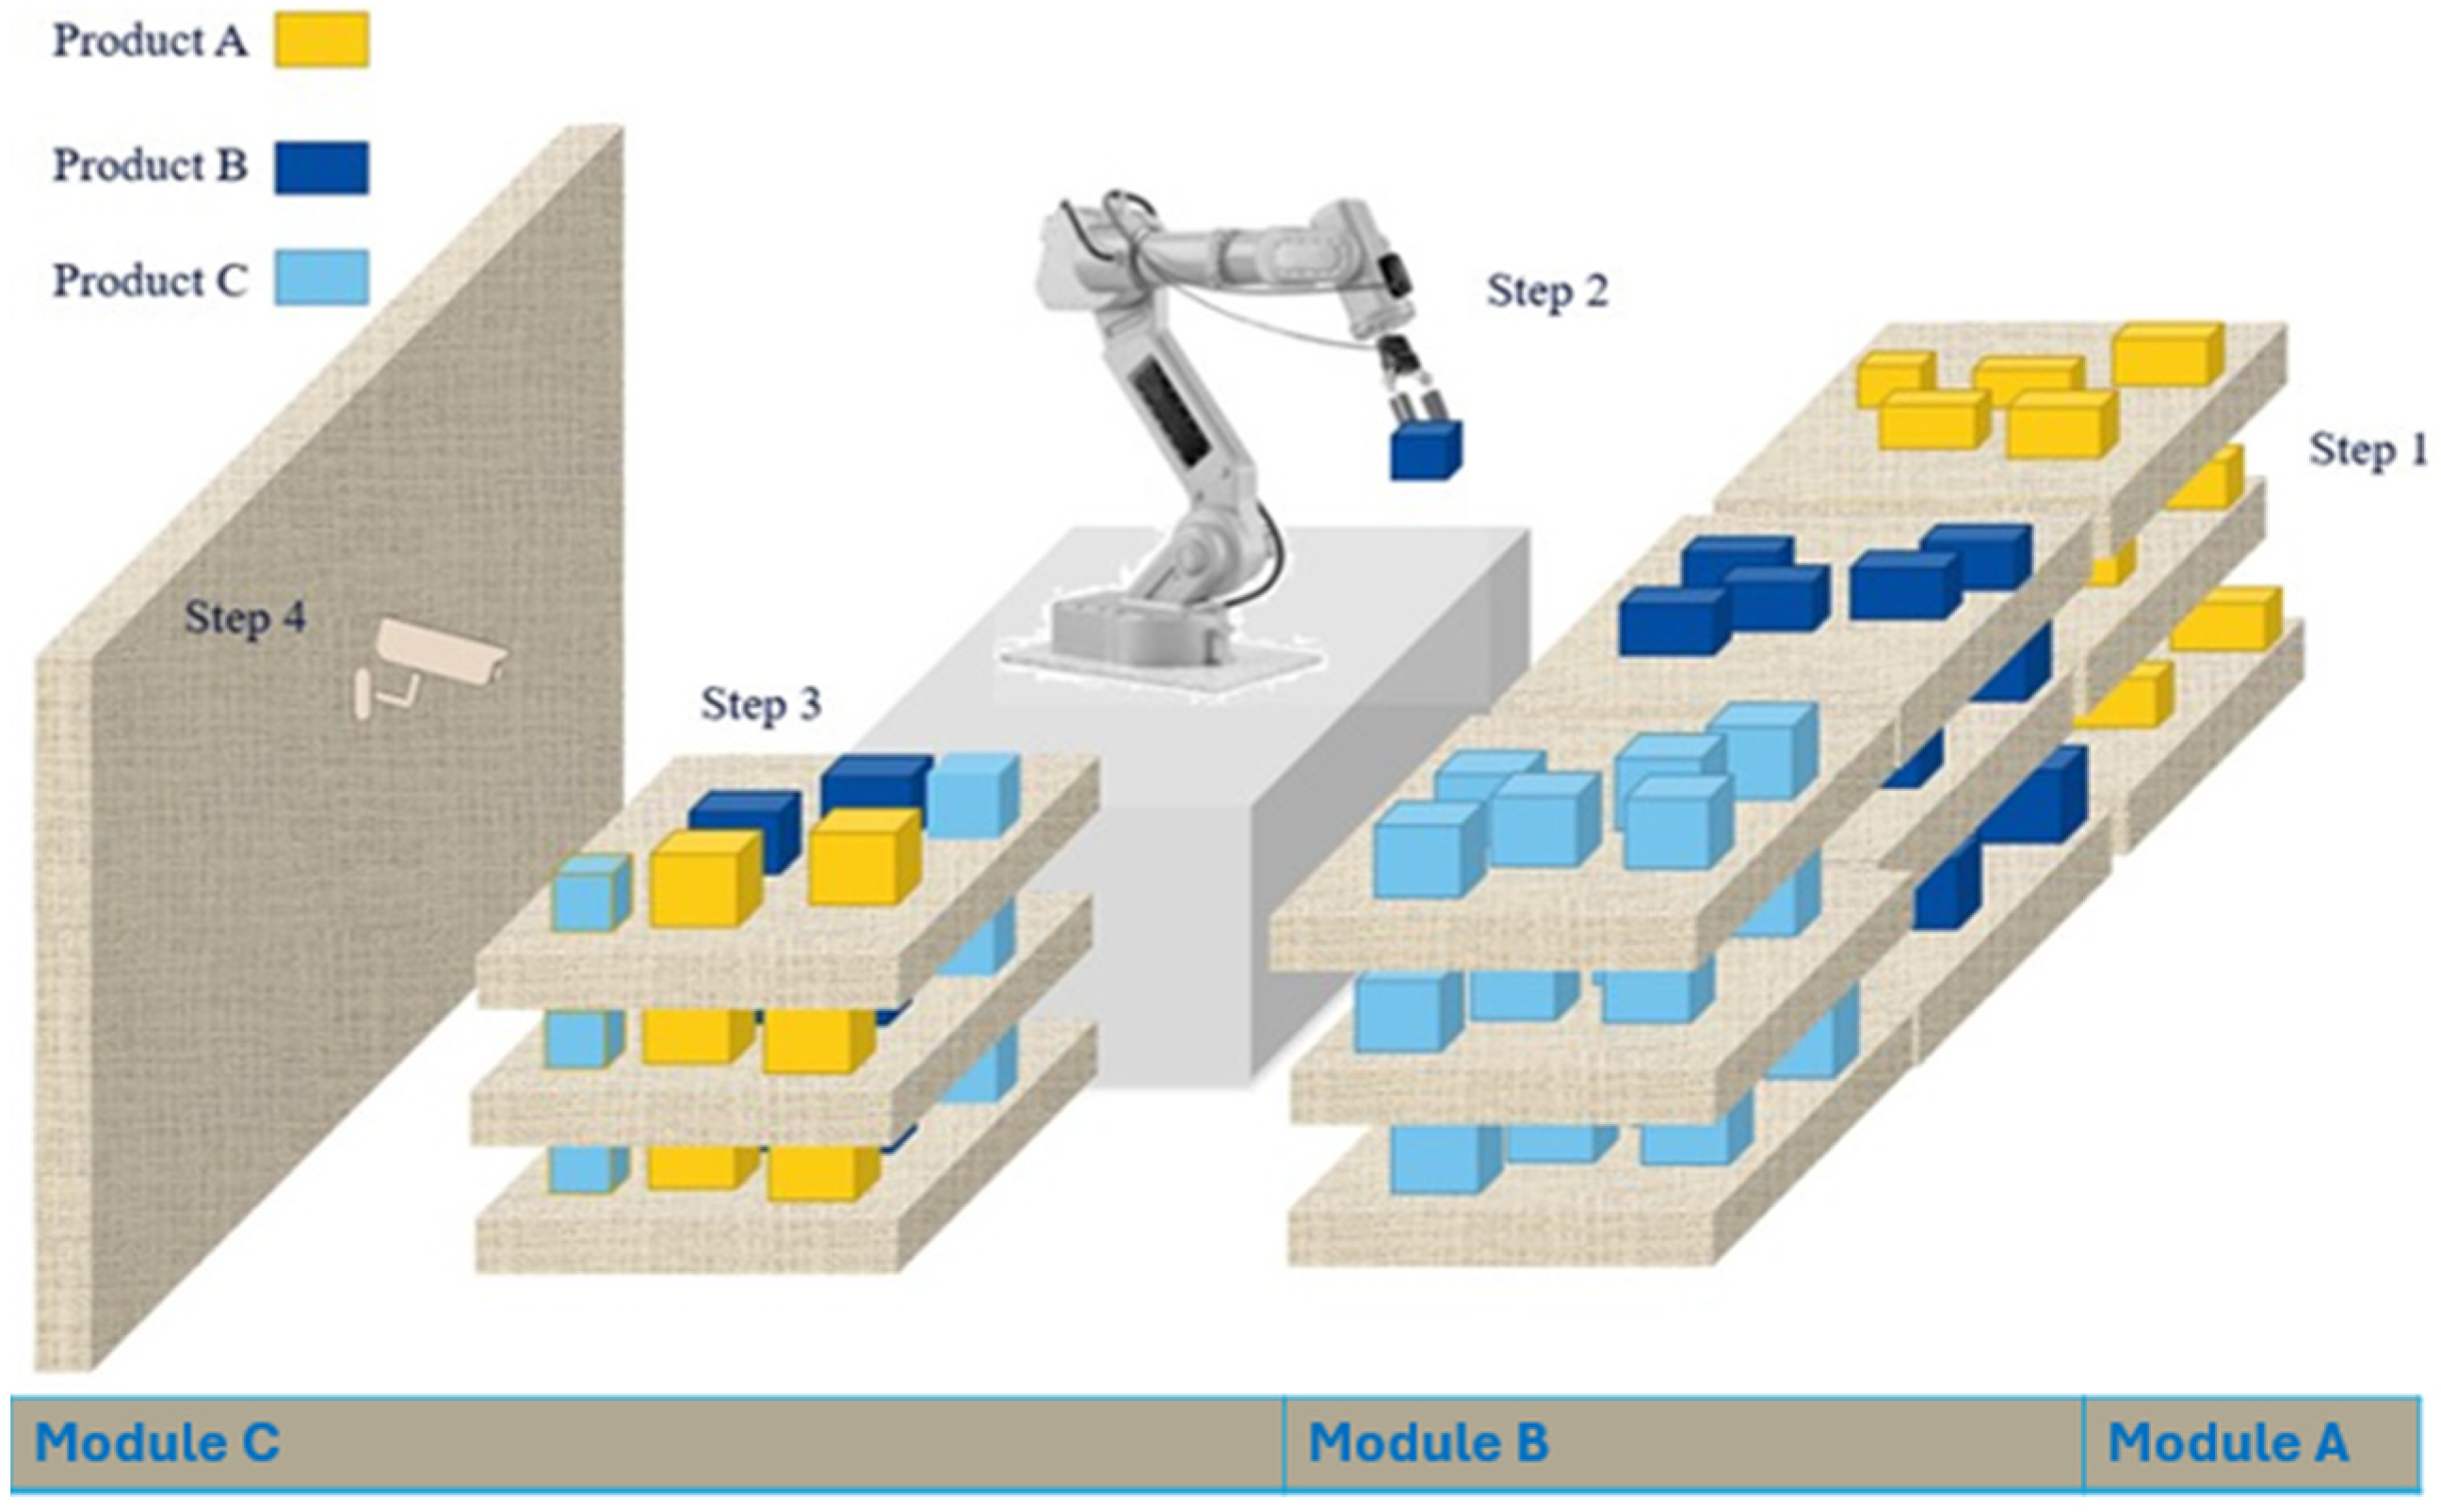
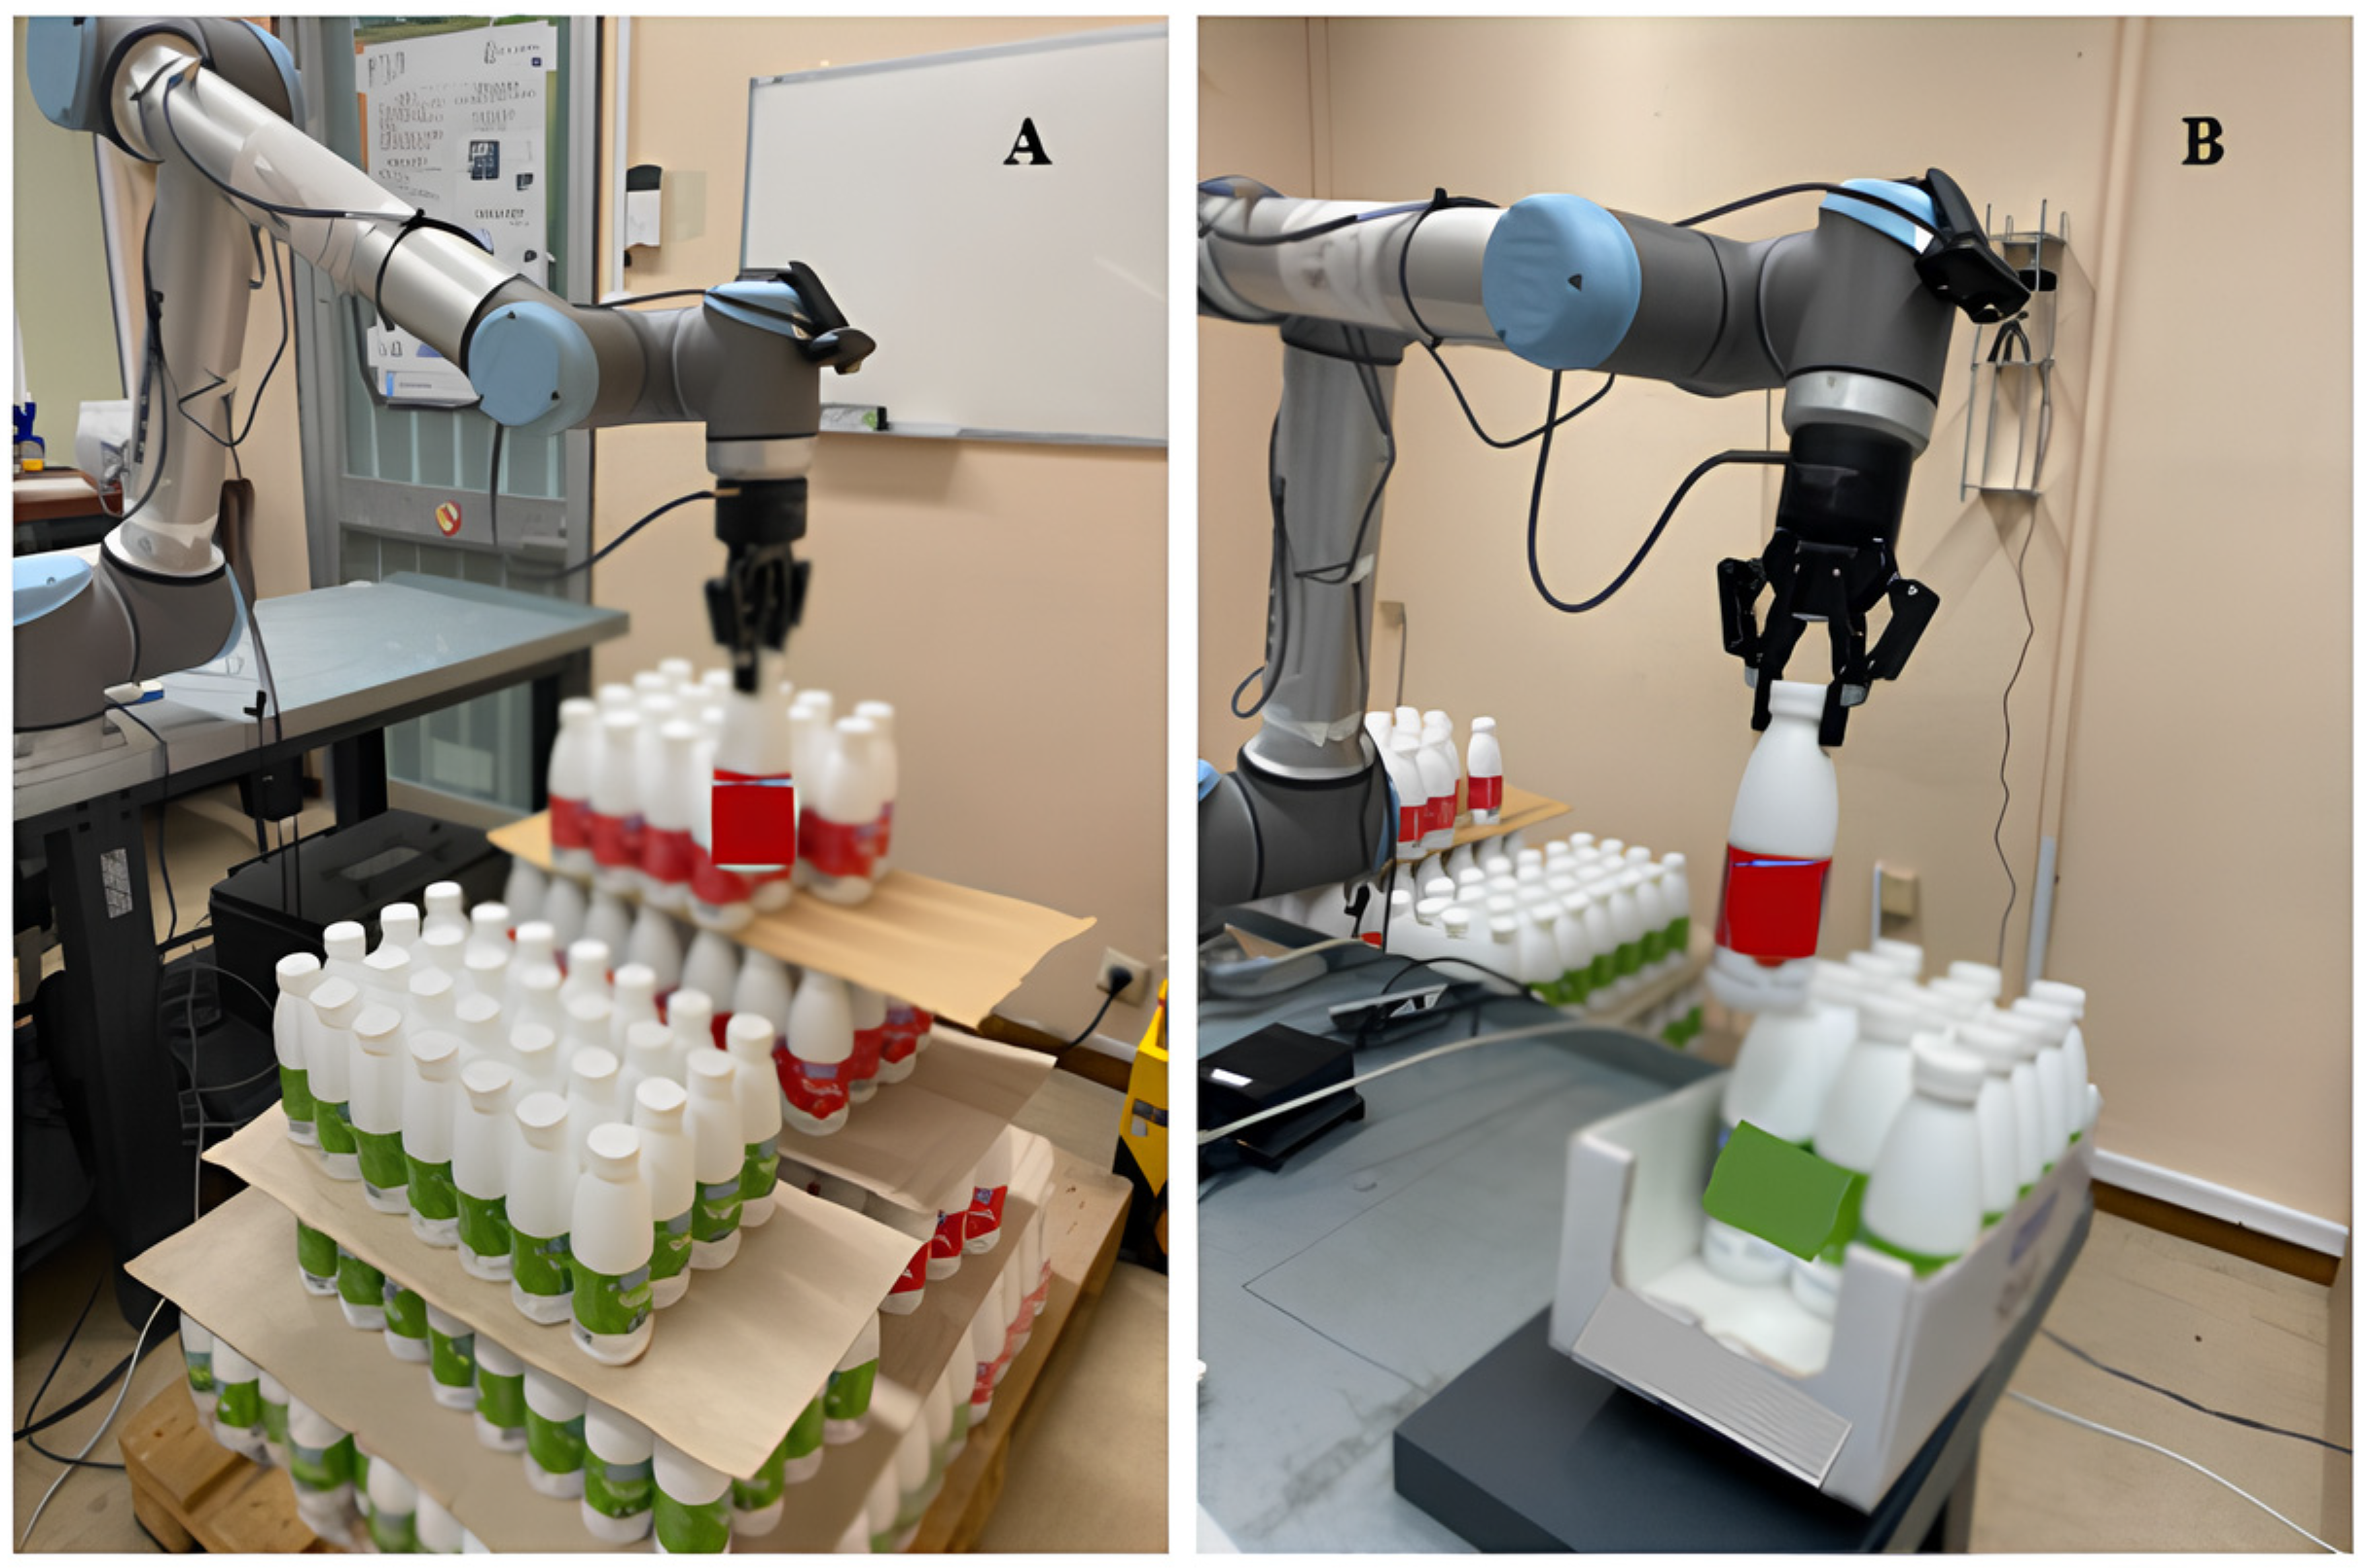
The framework presented in Section 3 has been validated on an industrial case which implements a robotics-assisted mixed-packaging solution for dairy products. As product demand is often seasonal or variable, there is a need for packaging mixed types of products. A customer order describes a set of products (bottles of milk with different variations) that need to be delivered in pallets or boxes. The aim of the mixed-packaging process is to pick bottles of both types from their pallets and create a mixed package. The mixed-packaging process usually takes place manually. The goal of the pilot case is to introduce a collaborative robot to assist in mixed packaging. In this work, the robot-assisted packaging process has been modeled into four steps (Figure 2 depicts a conceptual illustration).
  • Step 1: N pallets are located in front of a pick-and-place industrial robot. Each pallet carries a different type of a product. In this step, it is important to detect and classify the type of products carried by each pallet to plan the necessary pick and place steps that follow.
  • Step 2: The robot picks a product from one of the pallets located within its reach. In many cases the pallets, and thus the products within, are not located in fixed, preconfigured positions. This is for example the case when the pallets are brought to the packaging station by operators or AGVs with approximate placing accuracy. Consequently, in this step the challenge is to be able to detect and locate the products within the pallet that have variable, non-fixed positions.
  • Step 3: The robot places the product into a new pallet or packaging box according to the requirements of the customer.
  • Step 4: Packaging can be performed together with humans in a human–robot collaboration manner, in which the human also places products into the pallet. As a final step, a quality or error inspection process takes place. The objective of this step is to assess that the pallet has been filled with the right mix of products according to the needs of the customer. In this step it is important to identify each product that has been palletized and compare the resulting mixed order with the customer order.
Figure 3 provides an example of the packaging processes and appears with a blur effect to conceal the commercial label of the bottles
To execute the steps above, the collaborative robot requires three CV modules. All three modules were developed using the framework presented in Section 3, which was deployed to generate the necessary synthetic data and support their end-to-end development, enabling automation of the packaging process. The implemented modules are:
A.
A product recognition module that will be integrated in step 1 of the robot-assisted packaging process to detect the type of products (e.g., red- or green-labeled bottles) carried by the pallets. In this step, the two pallets that carry the bottles will be distinguished according to the product types they carry. The development of this module is discussed in Section 4.2.
B.
An object recognition system that in cooperation with a real-world coordinate-calculation algorithm will detect and calculate the position of the bottles’ caps in the pallets. This information will be used during step 2 to support the picking task performed by the robotic arm. The development of this module is discussed in Section 4.3.
C.
A quality inspection module that utilizes both vision-based object detection and business logic will ensure that the packaging process has been correctly performed. The goal of the process is to inspect the type and number of the bottles placed in the box, according to a customer order. The module consists of two detection algorithms: (a) one continuously detecting the total number of bottles inside the box and (b) one detecting the type of each bottle after it has entered the box. The development of this module is discussed in Section 4.4.
Since all the CV modules refer to the same object of interest (red- and green-labeled bottles), step B (3D asset collection) of the method remains the same for all three applications. Asset collection was managed by a design engineer that performed the 3D file creation process in commercial CAD software. During the 3D design step, a photorealistic image (via UV mapping) was applied as a label on the bottles for more accurate representation, ensuring higher quality for the generated images. The outcome of this step (3D object files) was then available for every application.
For step C (synthetic data generation and parameter selection) Blender 3D engine’s Python API [35] (Blender 2.93, Python 3.9) was used, and all processing was run on an NVIDIA RTX 3060 GPU.

4.2. Module A: Detection of the Type of Product in the Pallets

The first process of the current case study involves the detection and recognition of the product type carried by each pallet. The framework has been implemented as follows:
Step A—Real-world problem identification: The details are presented in Section 4.1 under point A.
Step B—3D asset collection: The details are presented in Section 4.1.
Step C—Synthetic data generation and parameter selection: With the graphic designer receiving the CAD files from step B, the 3D scene is recreated in the 3D graphics engine of Blender 3D [35]. Data generation parameters are set as presented in Table 2.
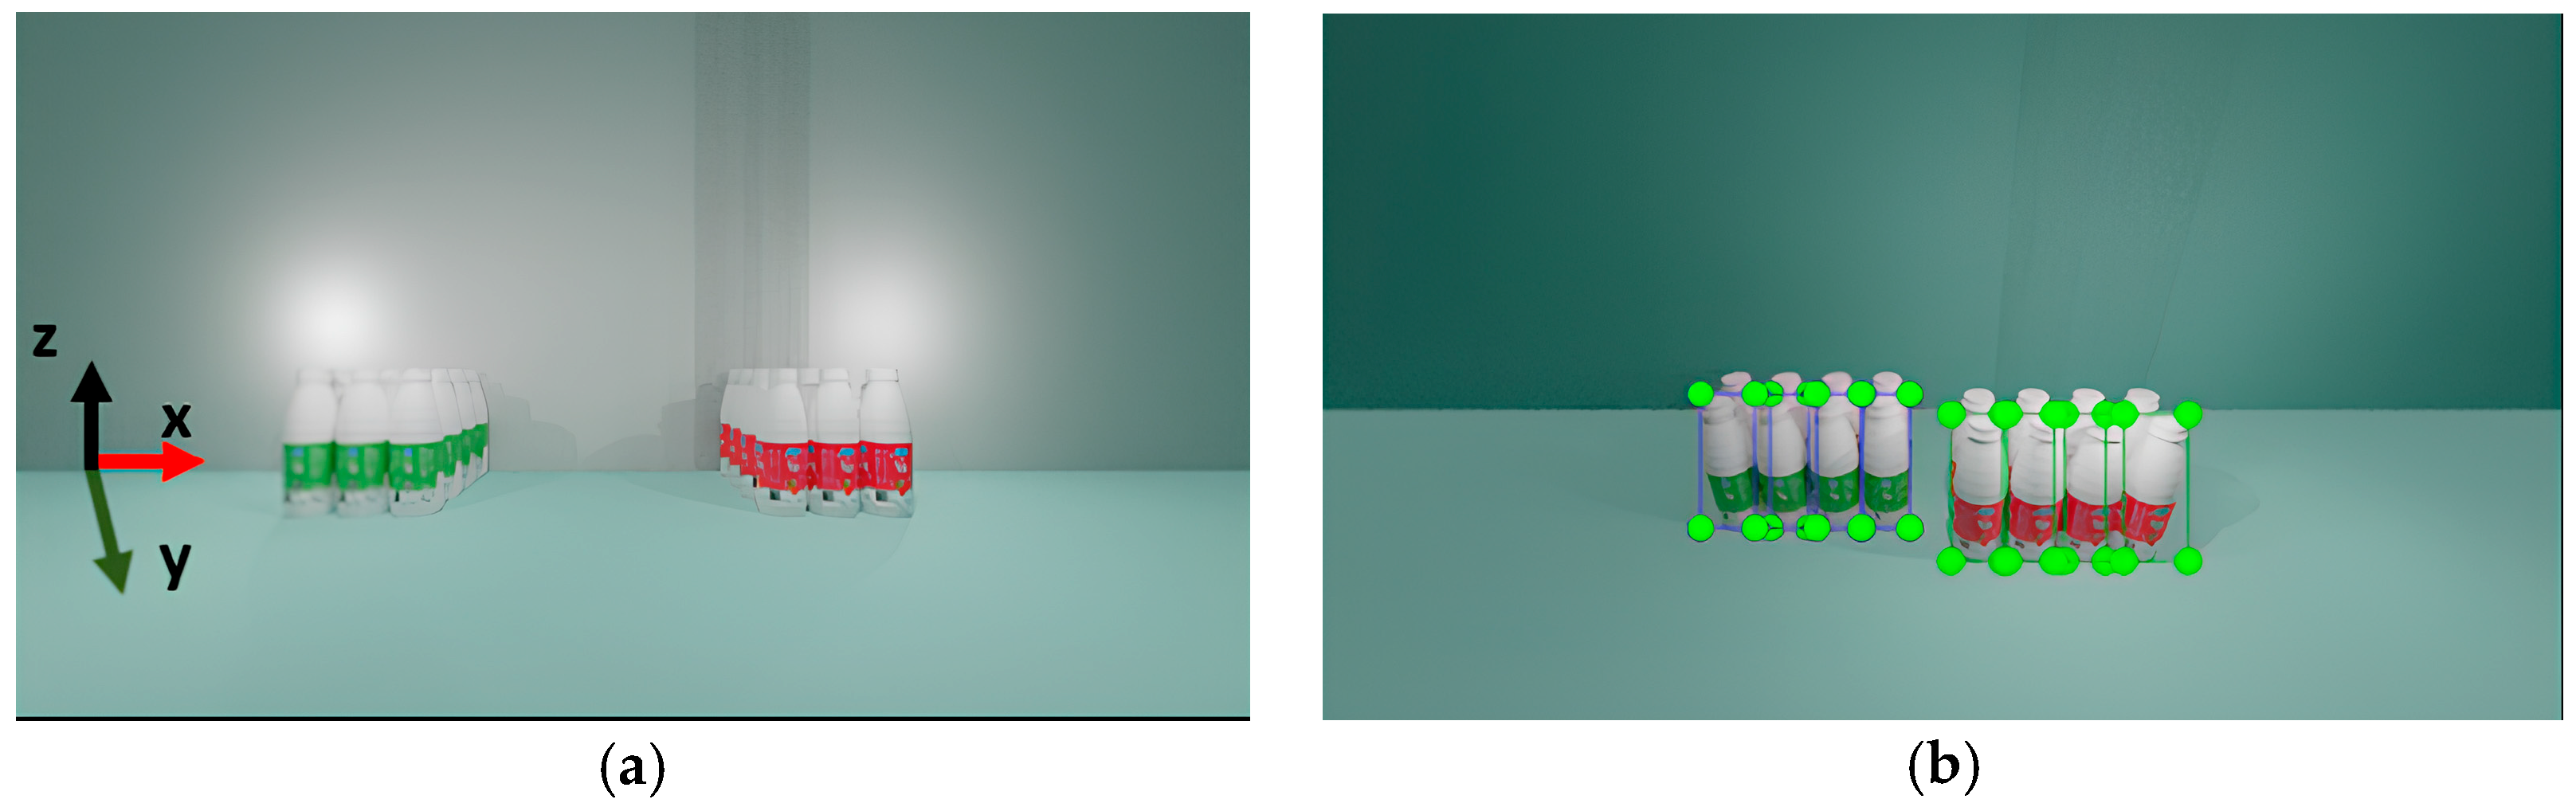
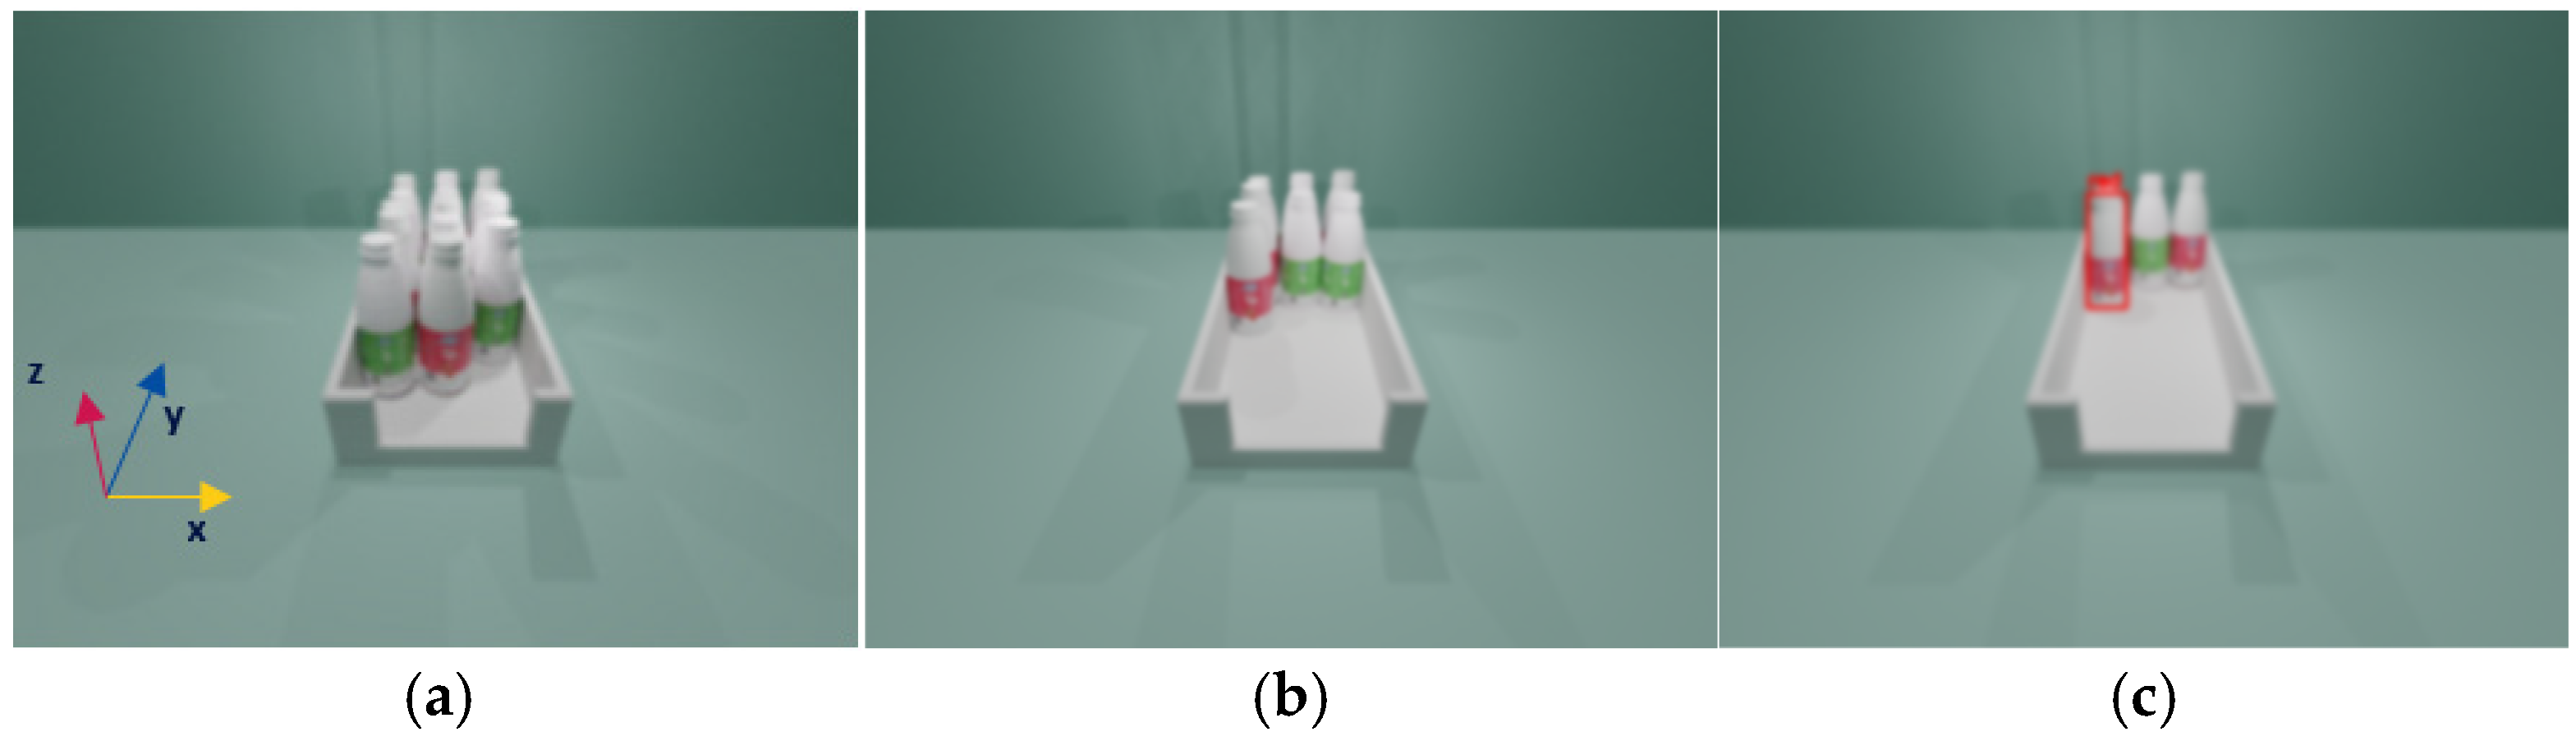
Regarding the domain randomization parameters (Group A), two bottle batches were created with each of them ranging from 0 to 60 bottles. Domain randomization was kept constant in terms of rotation, while positioning variation was enabled only in the parallel plane to the camera (see Figure 4). Background selection was kept random, reaching from a wide variety of Blender library backgrounds, while material selection remained constant and only referred to plastic (white color) that best simulates the material of the real objects. Lighting intensity and direction were selected to be variable ranging from an offset of ±60% of natural lighting. Camera position varied within a ±50% offset compared to the original position in all six degrees of freedom. As an original position, the position that best resembled the real world in terms of object and camera distance, height and perspective was set.
The rest of the data generation parameters (Group B) were selected as follows. Detection was enabled only for the objects of the front row of each batch (see Figure 4). Resolution selected was 900 × 675 pixels for the entire dataset. This image selection follows a 4:3 aspect ratio which is one of the most widely implemented aspects found in commercial webcams (e.g., a 480 p camera comes with a 4:3 aspect ratio). This decision renders the dataset suitable and similar to many commercial cameras for real-footage testing, while also avoiding potential stretching or compression of the images during training and detection stages. After applying the 3D scene parameters, a dataset of 1100 photorealistic images was rendered. Since this task is considered an object detection problem, the YOLO format labeling creation option was selected and thus, the respective label text file of each image was automatically generated. Samples with variable camera positioning and lighting are shown in Figure 4. The dataset generation phase lasted approximately 1 h.
Step D—AI model training: For training and detection purposes YOLOv8 is the model selected. As YOLO [36] models are among the most frequently deployed and high-performing object detection architectures in contemporary research, YOLOv8 serves as an appropriate and representative choice for this task. Upon literature review propositions and preliminary validation tests, the authors were led to the following training hyperparameters of Table 3. The training hyperparameters were also considered in terms of computational usage reduction, while maintaining a high training and testing performance. For the hyperparameter configuration Ultralytics YOLO Hyperaparameters Tuning [37] was used. In particular, a batch size of 64 images per batch ensures the integrity and objectivity of the trained model without leading to overfitting. As the image batch was relatively large, there was a need to subdivide it, and so a batch subdivision size of 16 elements was chosen.Burn in, decay and learning rate are values referring to the learning rhythm of the trained model. The selected values represent a moderate training rate that will avoid overfitting of the model without severely delaying the training procedure. The model is trained using a composite loss function consisting of Complete Intersection over Union (CIoU) for bounding box regression, Binary Cross Entropy (BCE) for classification, and Distribution Focal Loss (DFL) for localization. The max batch rate identifies the training time and was optimized according to tests towards the provision of the best accuracy without leading to overfitting of the algorithm. Finally, the training validation split was selected to be 90/10% of the dataset in terms of training and testing, a rather unusual rate for traditional datasets that is, however, vital since the trained model is not expected to be validated by synthetic data but rather by real images and therefore, training optimization should not be modified for synthetic data. The same principles have been followed for Section 4.3 and Section 4.4.
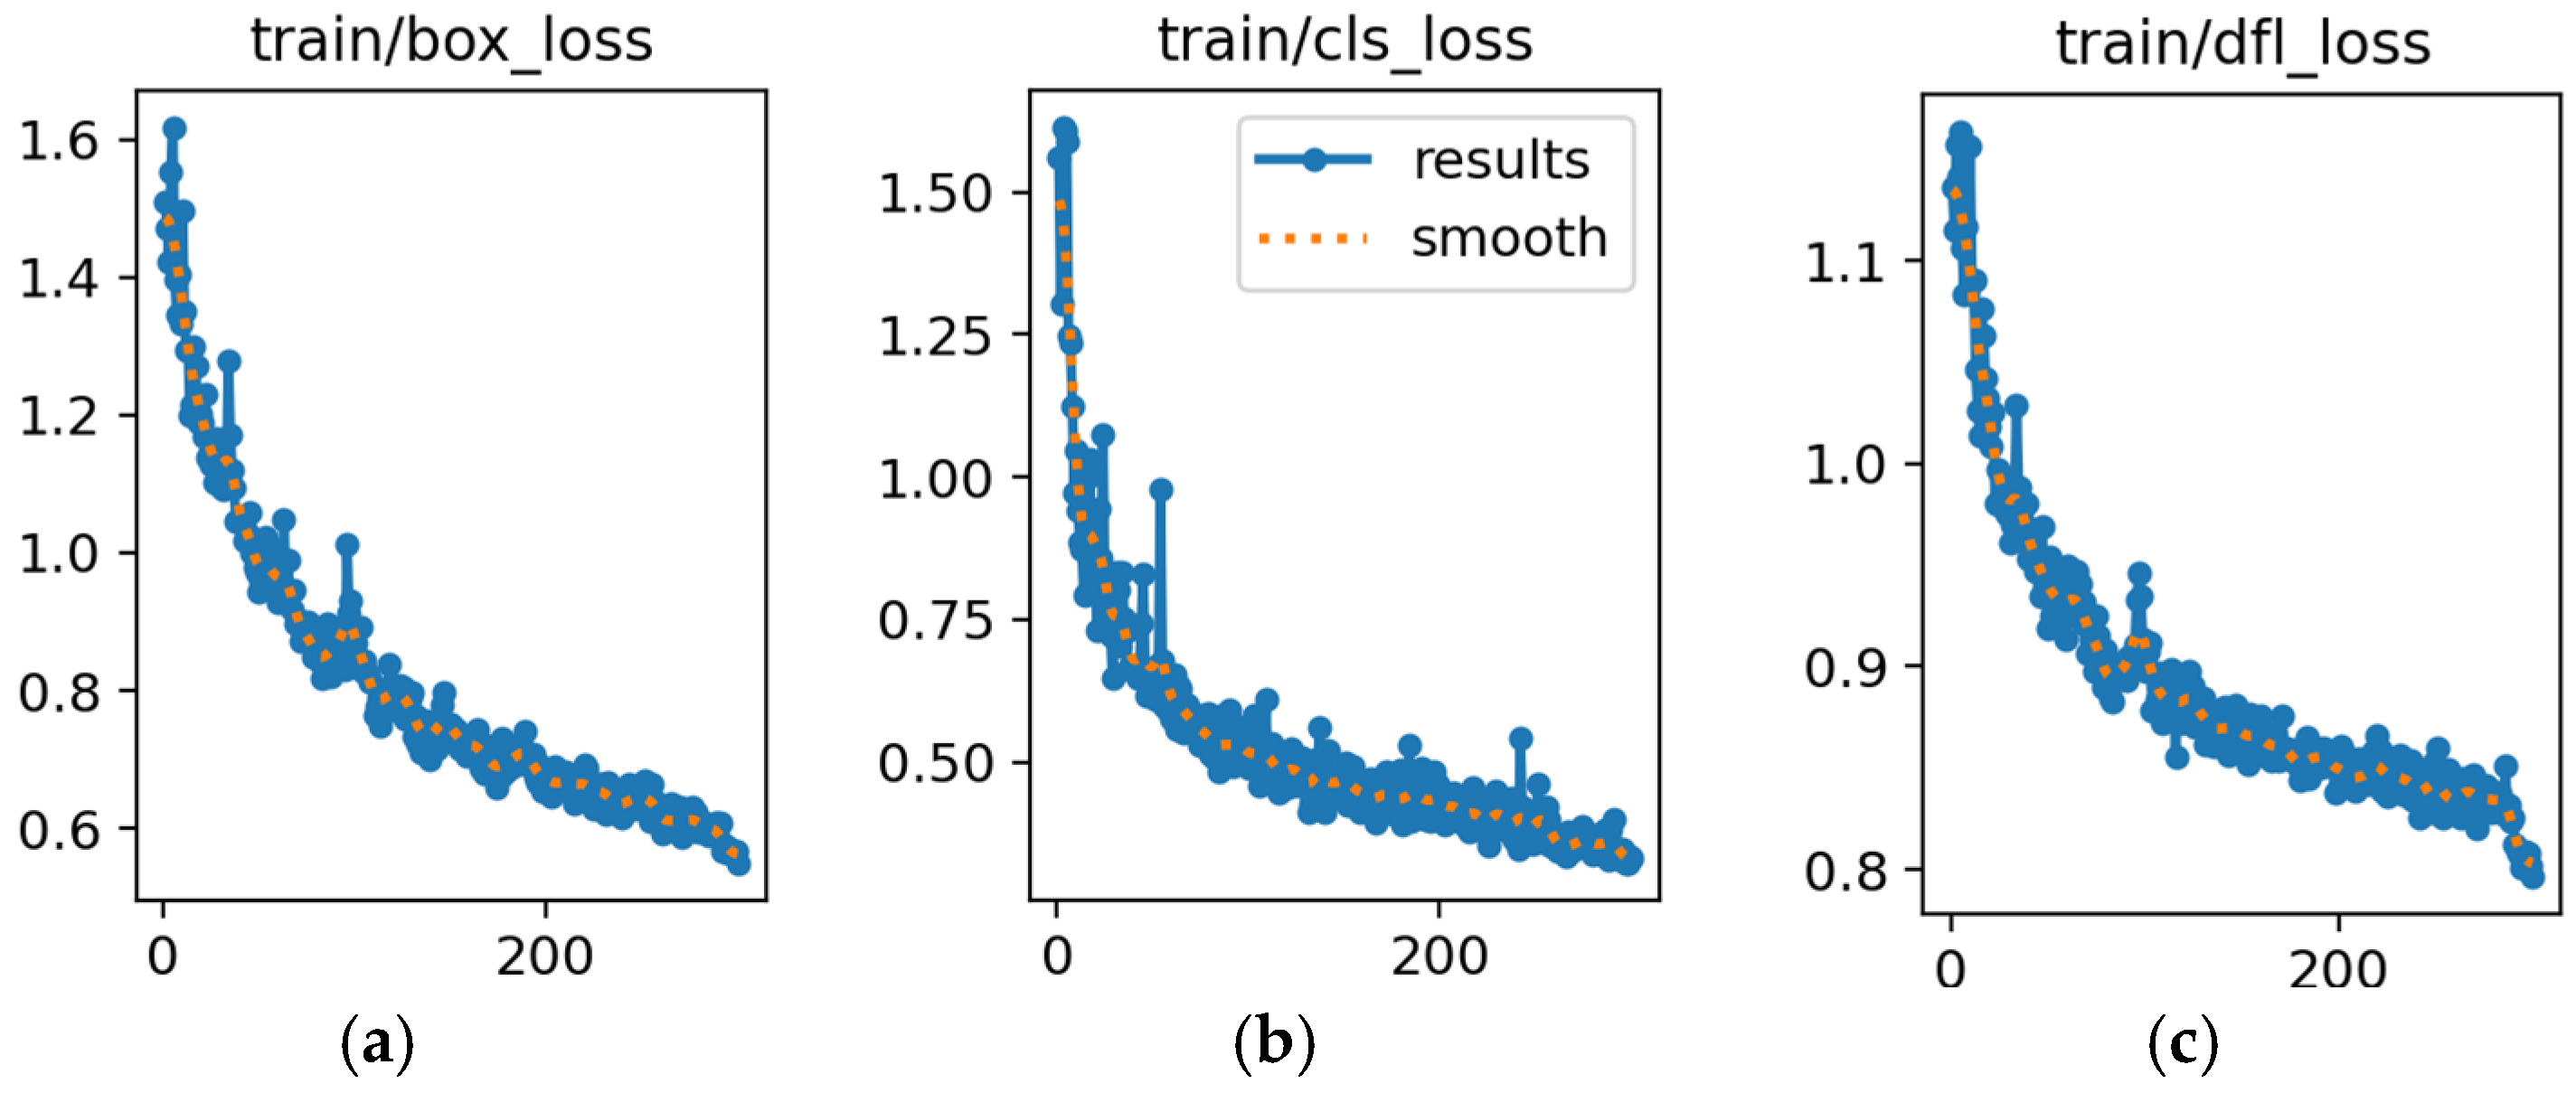
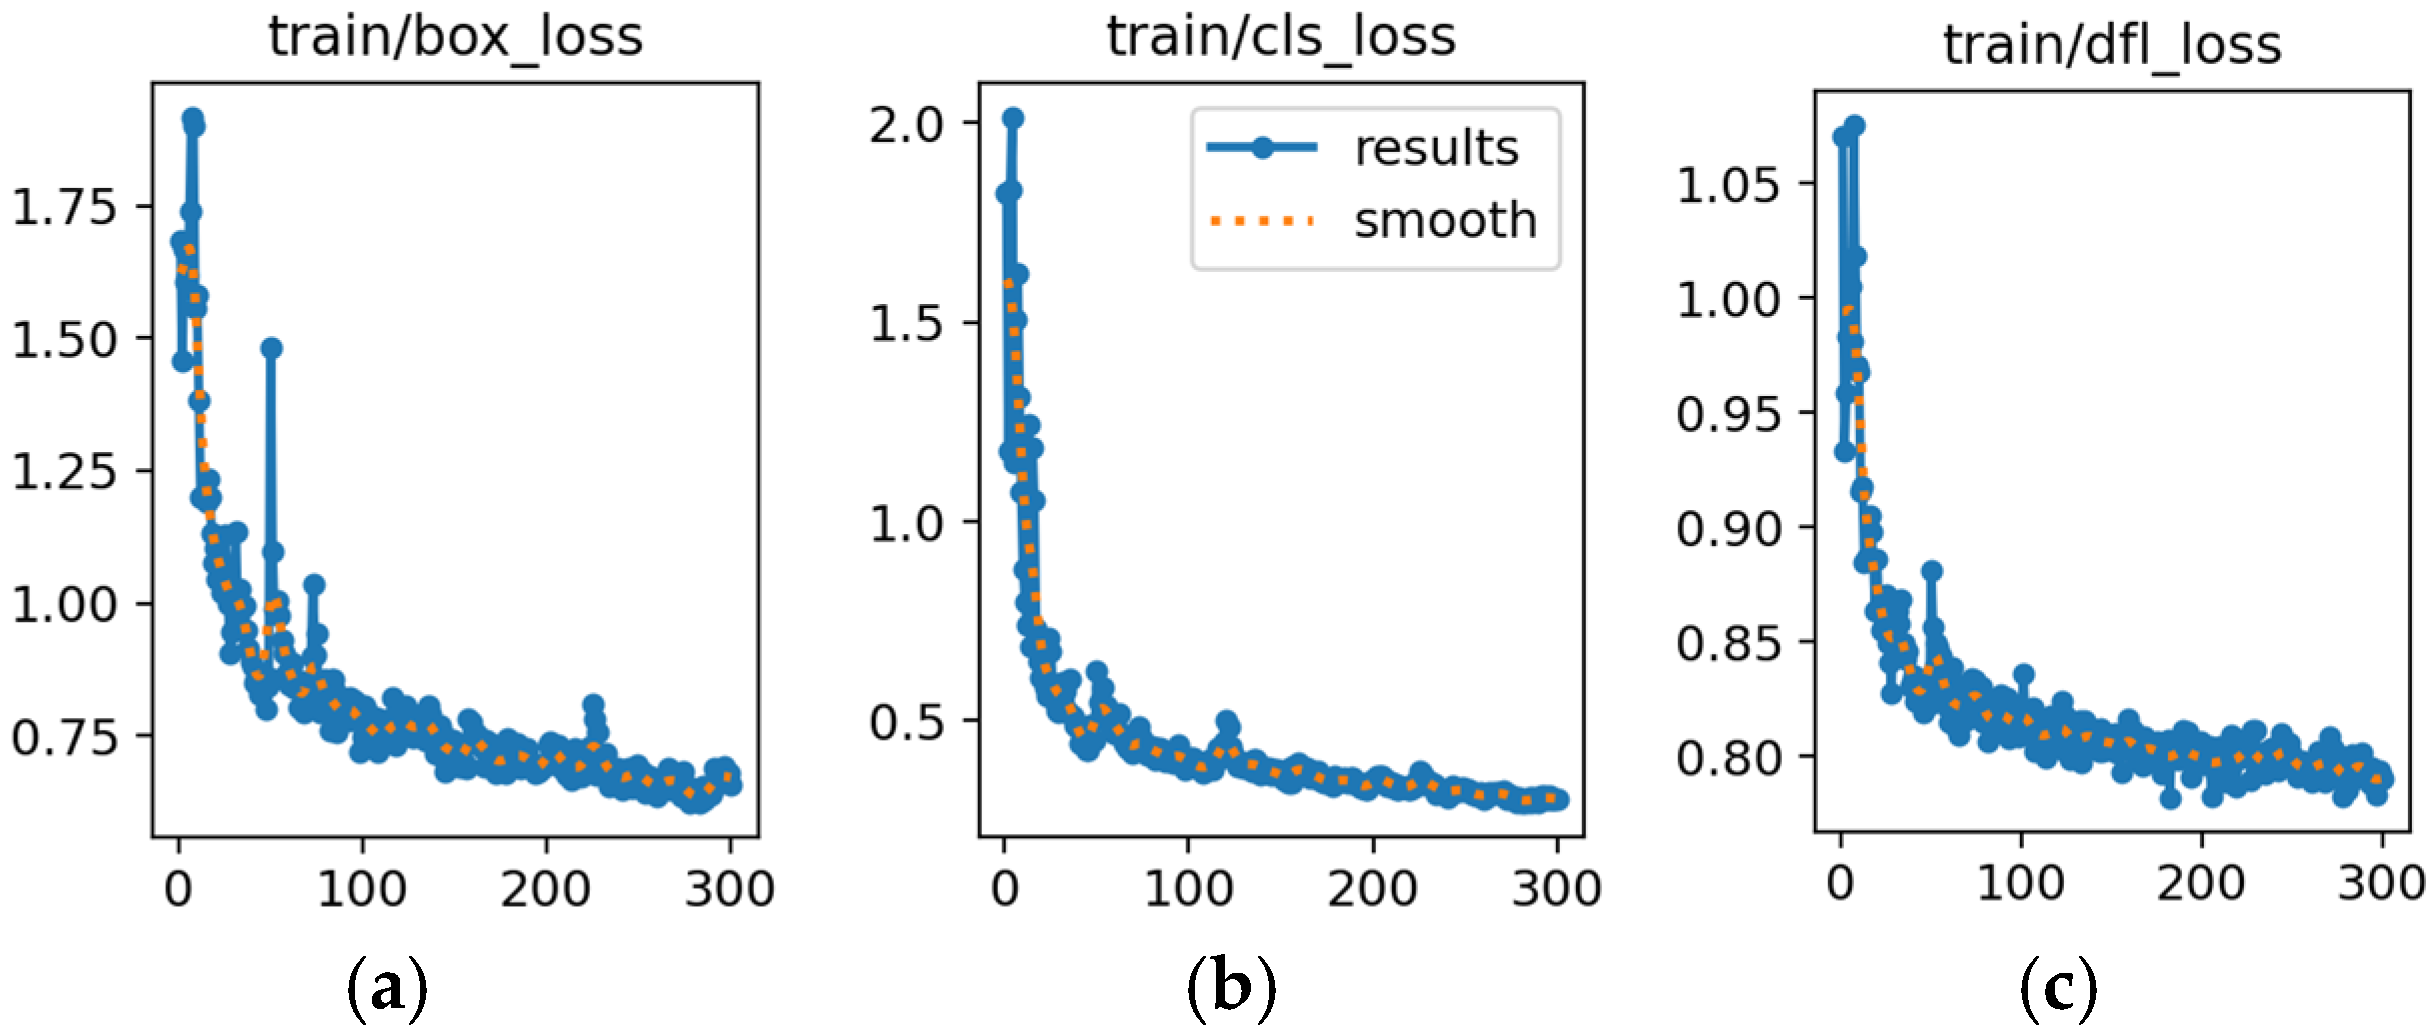
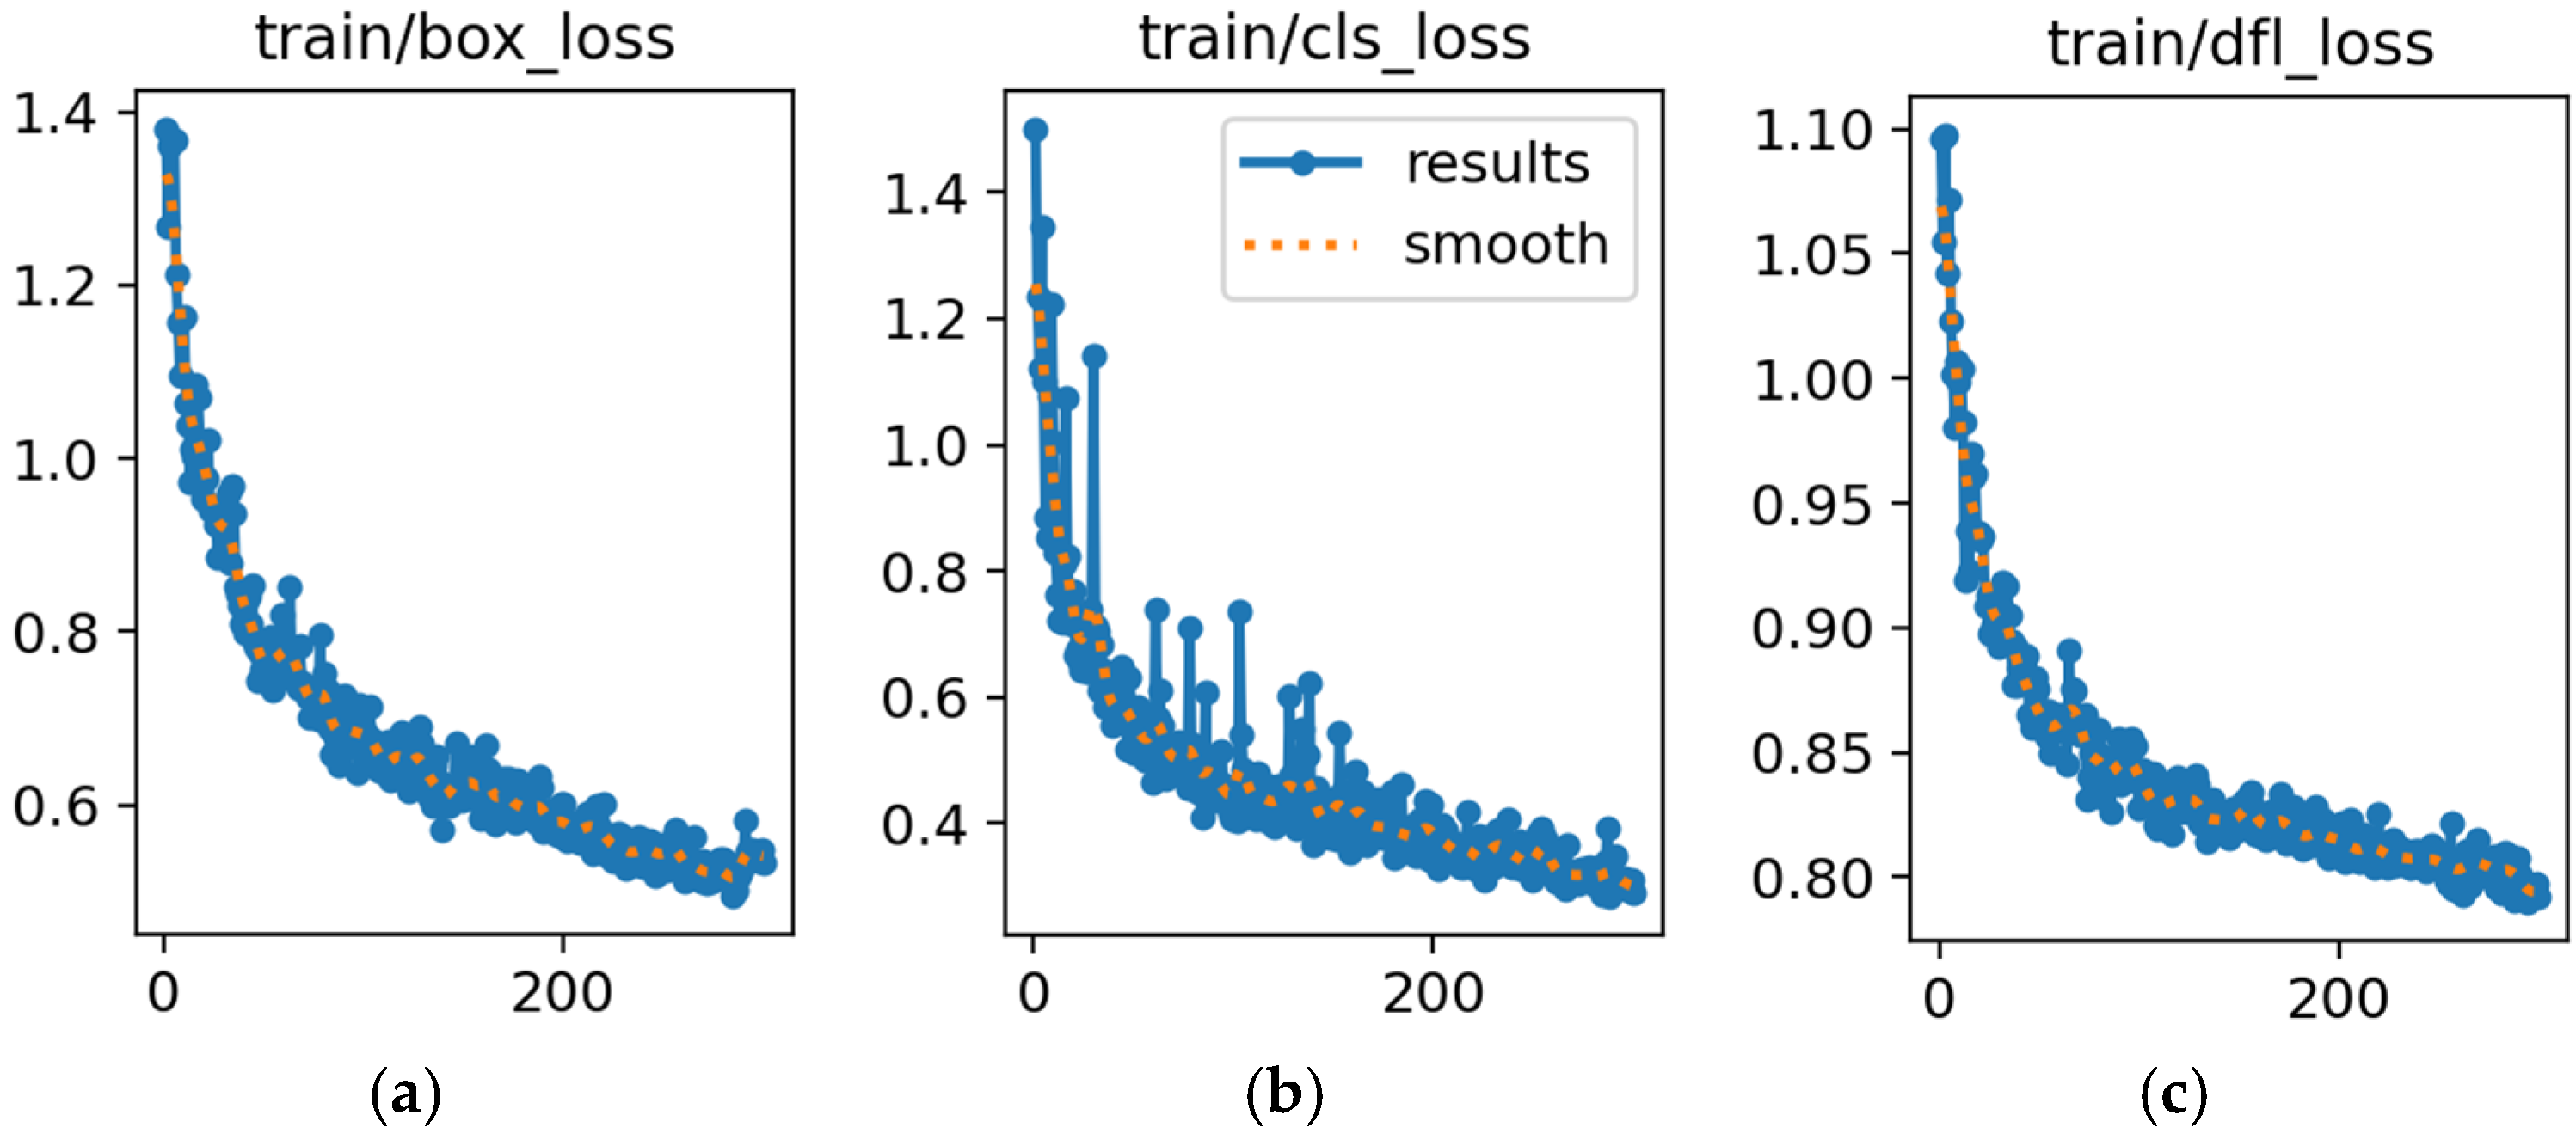
The training involved one synthetic dataset which contained 1100 images with a resolution of 900 × 675 pixels. No data augmentation was applied. According to the 90/10 split of the dataset, 1000 images were used for training while 100 were used for testing/validation. The training process concluded in 300 epochs, with the evolution of the loss components shown in Figure 5.
Step E—AI model deployment: Upon receiving the trained YOLOv8 model for product recognition (outcome of step D), the model is deployed for use within the CV system. For the CV problem of product recognition (see Figure 2) an RGB 720p camera was recommended and installed. The camera was positioned in front of the pallets, at a short stand-off distance, with a slight downward tilt (20–30° relative to the horizontal plane), capturing the front rows of the pallets where the bottle labels are visible. Wired camera connectivity was preferred via USB 3.0. The developed algorithm was based on Python scripting and in order to improve model deployment and maintenance, it was implemented as a Docker container along with its necessary libraries inside a Kubernetes 1.9 cluster [38]. The Kubernetes cluster hosted the rest of the applications that facilitated the entire automated mixed-packaging system.

4.3. Module B: Object Detection and Position Estimation

The second step of the mixed-packaging process involves the object detection and position estimation of the bottles for enabling picking by a robot. The framework of Figure 1 has been adapted and implemented as follows:
Step A—Problem identification: The details are presented in Section 4.1 under point B.
Step B—3D asset collection: The details are presented in Section 4.1.
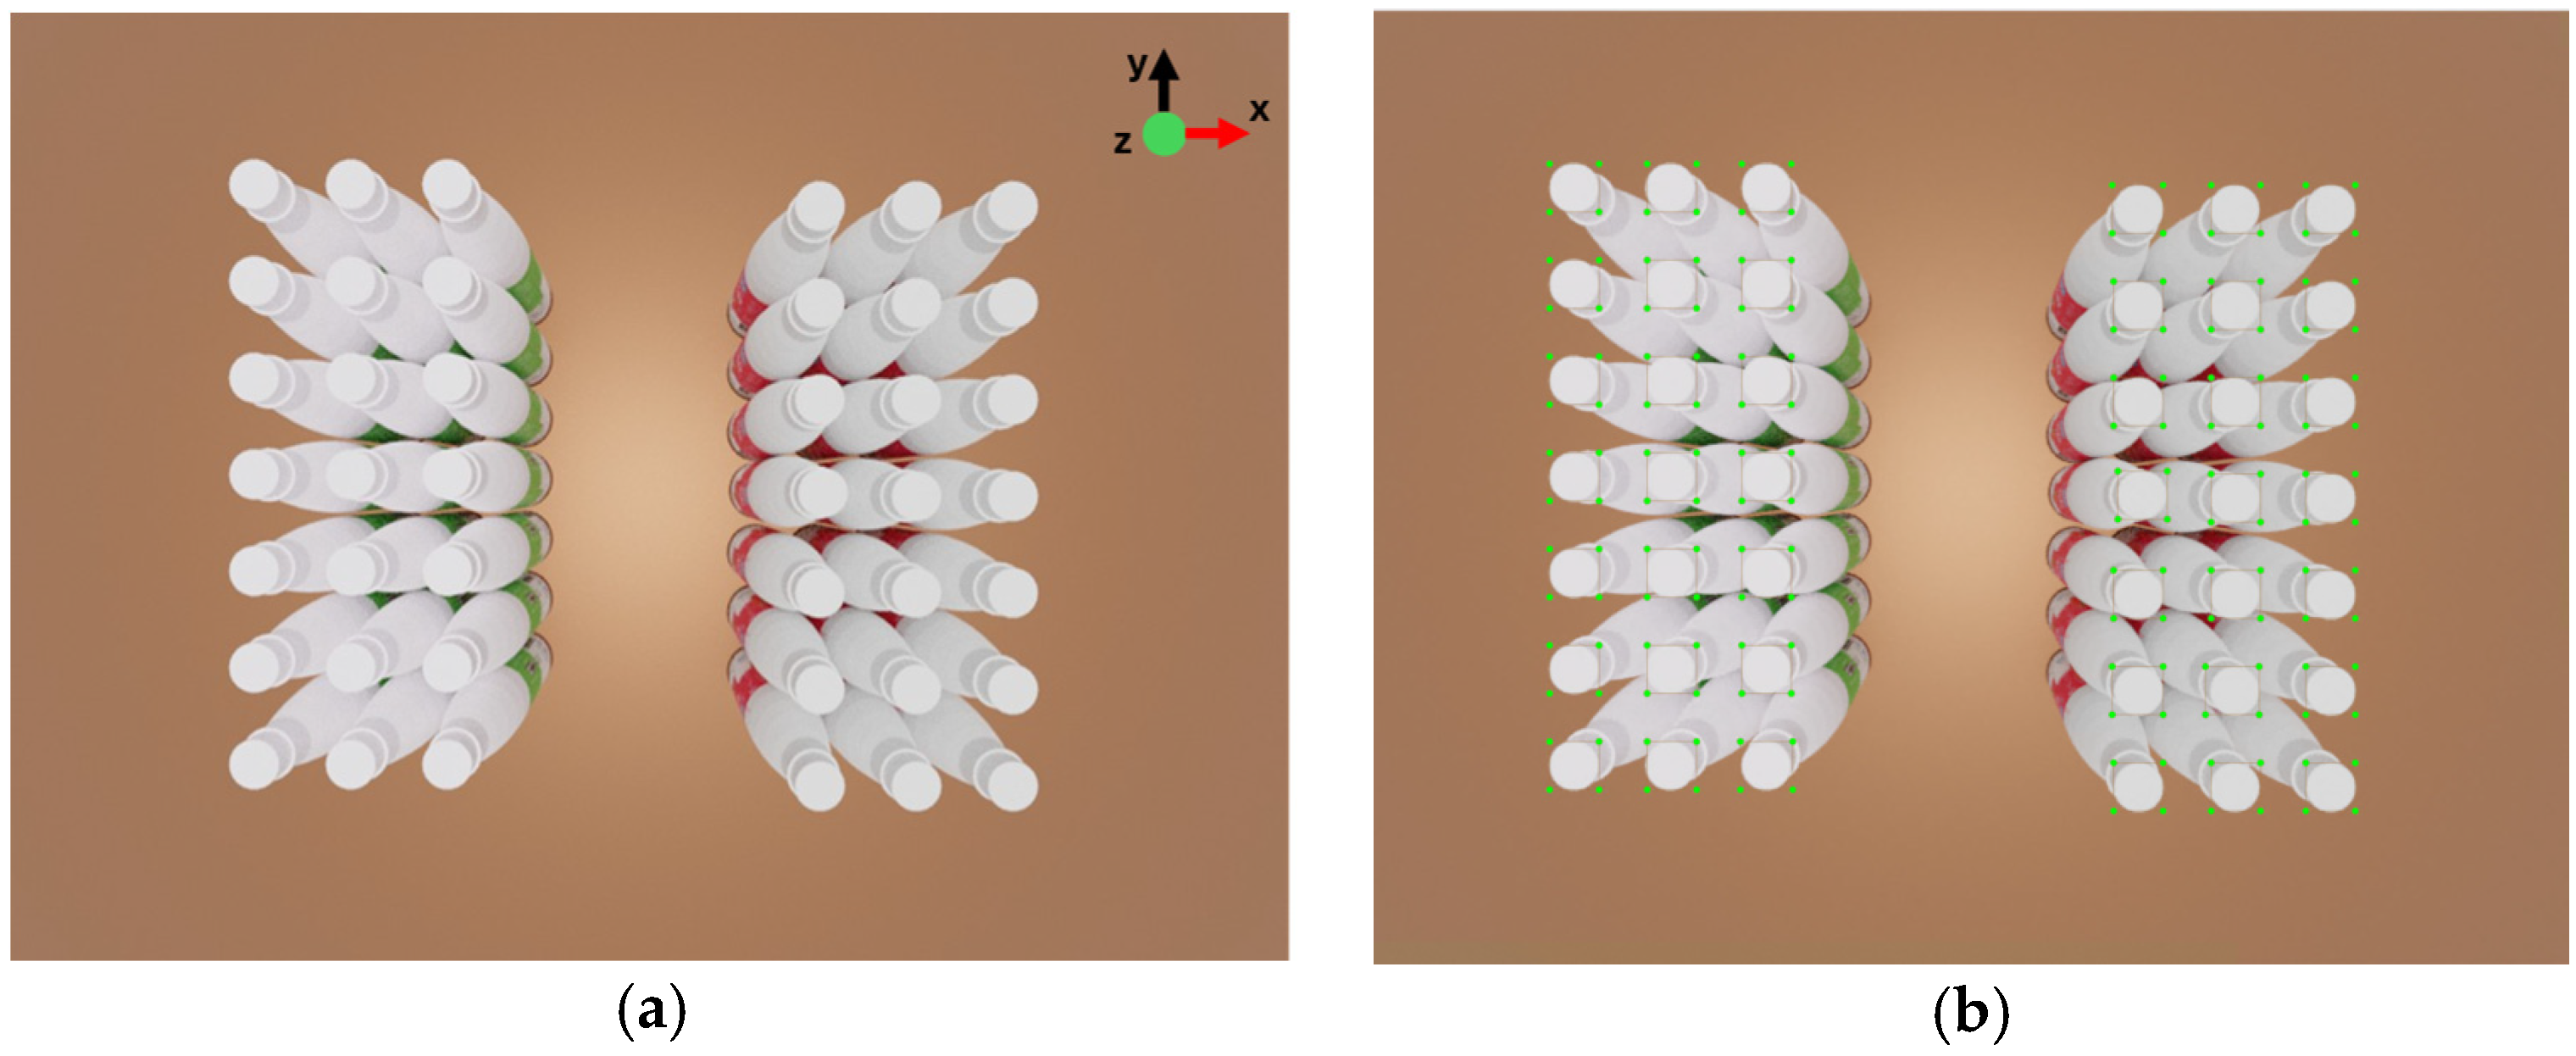
Step C—Synthetic data generation and parameter selection: With the graphic designer receiving the CAD files of step B, the theoretical problem and its specifications were transferred to the virtual world, in which Blender 3D [35] was deployed for recreating the problem virtually. The values of the parameters for generating the synthetic data are provided in Table 4. By providing different values to the parameters of Table 4, 2200 photorealistic images were generated and a sample is shown in Figure 6a. Dataset generation took approximately 2 h.
Step D—AI model training: Like the previous case, the YOLOv8 model was selected for training and detection purposes. Main training hyperparameters were selected using Ultralytics YOLO Hyperparameter Tuning and are listed in Table 5.
The synthetic dataset used for the bottle cap detection purposes comprises 2200 images with a resolution of 900 × 675 pixels and is divided into two sections for training and testing respectively, with a validation split of 90%. No data augmentation techniques were applied. The training process concluded in 300 epochs, with the loss curves monitored to ensure stable convergence and to avoid overfitting to synthetic data (see Figure 7), given that evaluation is performed on real images.
Step E—AI model deployment: The AI/DL model developed in step D was integrated in a CV system that used a 720 p RGB camera and was deployed as Docker image in a Kubernetes 1.9 cluster. The camera was mounted on the end-effector of a Universal Robots robotic arm (see Figure 3), operating close to the pallet surface, with a viewing angle oriented almost vertically (85–90° relative to the pallet plane) to enable direct observation of the bottle caps. The CV system detected the bottle caps using the model, and then used the detection data (i.e., pixel coordinates of the detection boxes) to calculate the actual coordinates of the bottle caps, so that the picking operation could be performed by the robotic arm. The coordinate estimation method is based on the calibration and perspective mapping techniques of OpenCV [39] to map pixel values to their corresponding projection with the real-world coordinate.

4.4. Module C: Packaging Quality Assessment

The third step of the mixed-packaging process refers to the quality inspection task. In this task, the quantity of each type of products that have been inserted into the mixed package is estimated by a CV module that has been developed based on the method presented in Section 3. The steps of Figure 1 have been adapted and implemented as follows:
Step A—Real-world problem identification: Details are presented in Section 4.1 under Step C.
Step B—3D asset collection: The details are presented in Section 4.1.
Step C—Synthetic data generation and parameter selection: The values of the parameters for generating the synthetic datasets are provided in Table 6. A total of 2200 photorealistic images were rendered in approximately 1.7 h.
Table 6. Synthetic data generation parameters for object recognition and position estimation.
GroupParameterDescription
ANumber of classes2; red & green bottles
Number of objects0–18; a package/box may contain from 0 to 18 bottles
Number of batches1; one box is monitored
Position randomizationLocation randomization has been selected as variable only in the xy plane (see Figure 8a); object rotation has been kept constant
Background selectionRandom selection from Blender library
Material selectionWhite plastic
Lighting adjustment±100% from natural lighting
Camera adjustment±50% of original position on 6 degrees of freedom
BDetectable objects in the sceneOnly front row bottles (Figure 8c)
Detectable object surfaces per objectWhole bottle
Annotation formatYOLO format
Image resolution900 × 675
Dataset size2200
Figure 8. Synthetic bottle mixture with (a) 14 bottles, (b) 7 bottles, and (c) corresponding labeling in the synthetic dataset.
Applsci 16 04388 g008
Step D—AI model training: Like the previous cases, YOLOv8 is the model selected for training and detection purposes. Main training hyperparameters were selected using Ultralytics YOLO Hyperparameter Tuning and are listed in Table 7.
We maintained the same training and validation split, allocating 90% of the dataset for training and 10% for validation. Similarly to the previous modules no data augmentation was applied. The training process extended over 300 epochs to ensure thorough learning and model optimization (see Figure 9).
Step E—AI model deployment: Two CV systems utilizing two 720 p RGB cameras were used. The cameras were installed above the packaging area, with a downward viewing angle relative to the box plane, ensuring coverage of the box area during the packaging process. The first CV system was used for detecting the number of bottles inside the box, while the second CV system was used for recognizing the type of the bottles that are added in the box. The CV system for recognizing the number of bottles reuses the object detection algorithm of Section 4.3. The outputs from the two CV systems are provided as inputs to a simple algorithm that calculates the number of each product type inside the package/box with the following steps.
  • The CV system that counts the number of bottles in the box takes a picture every 20 s.
  • If a new bottle has been detected, then the product type CV system is activated and detects the type of product added. The information is stored.
  • The process starts over in step 1.

5. Results

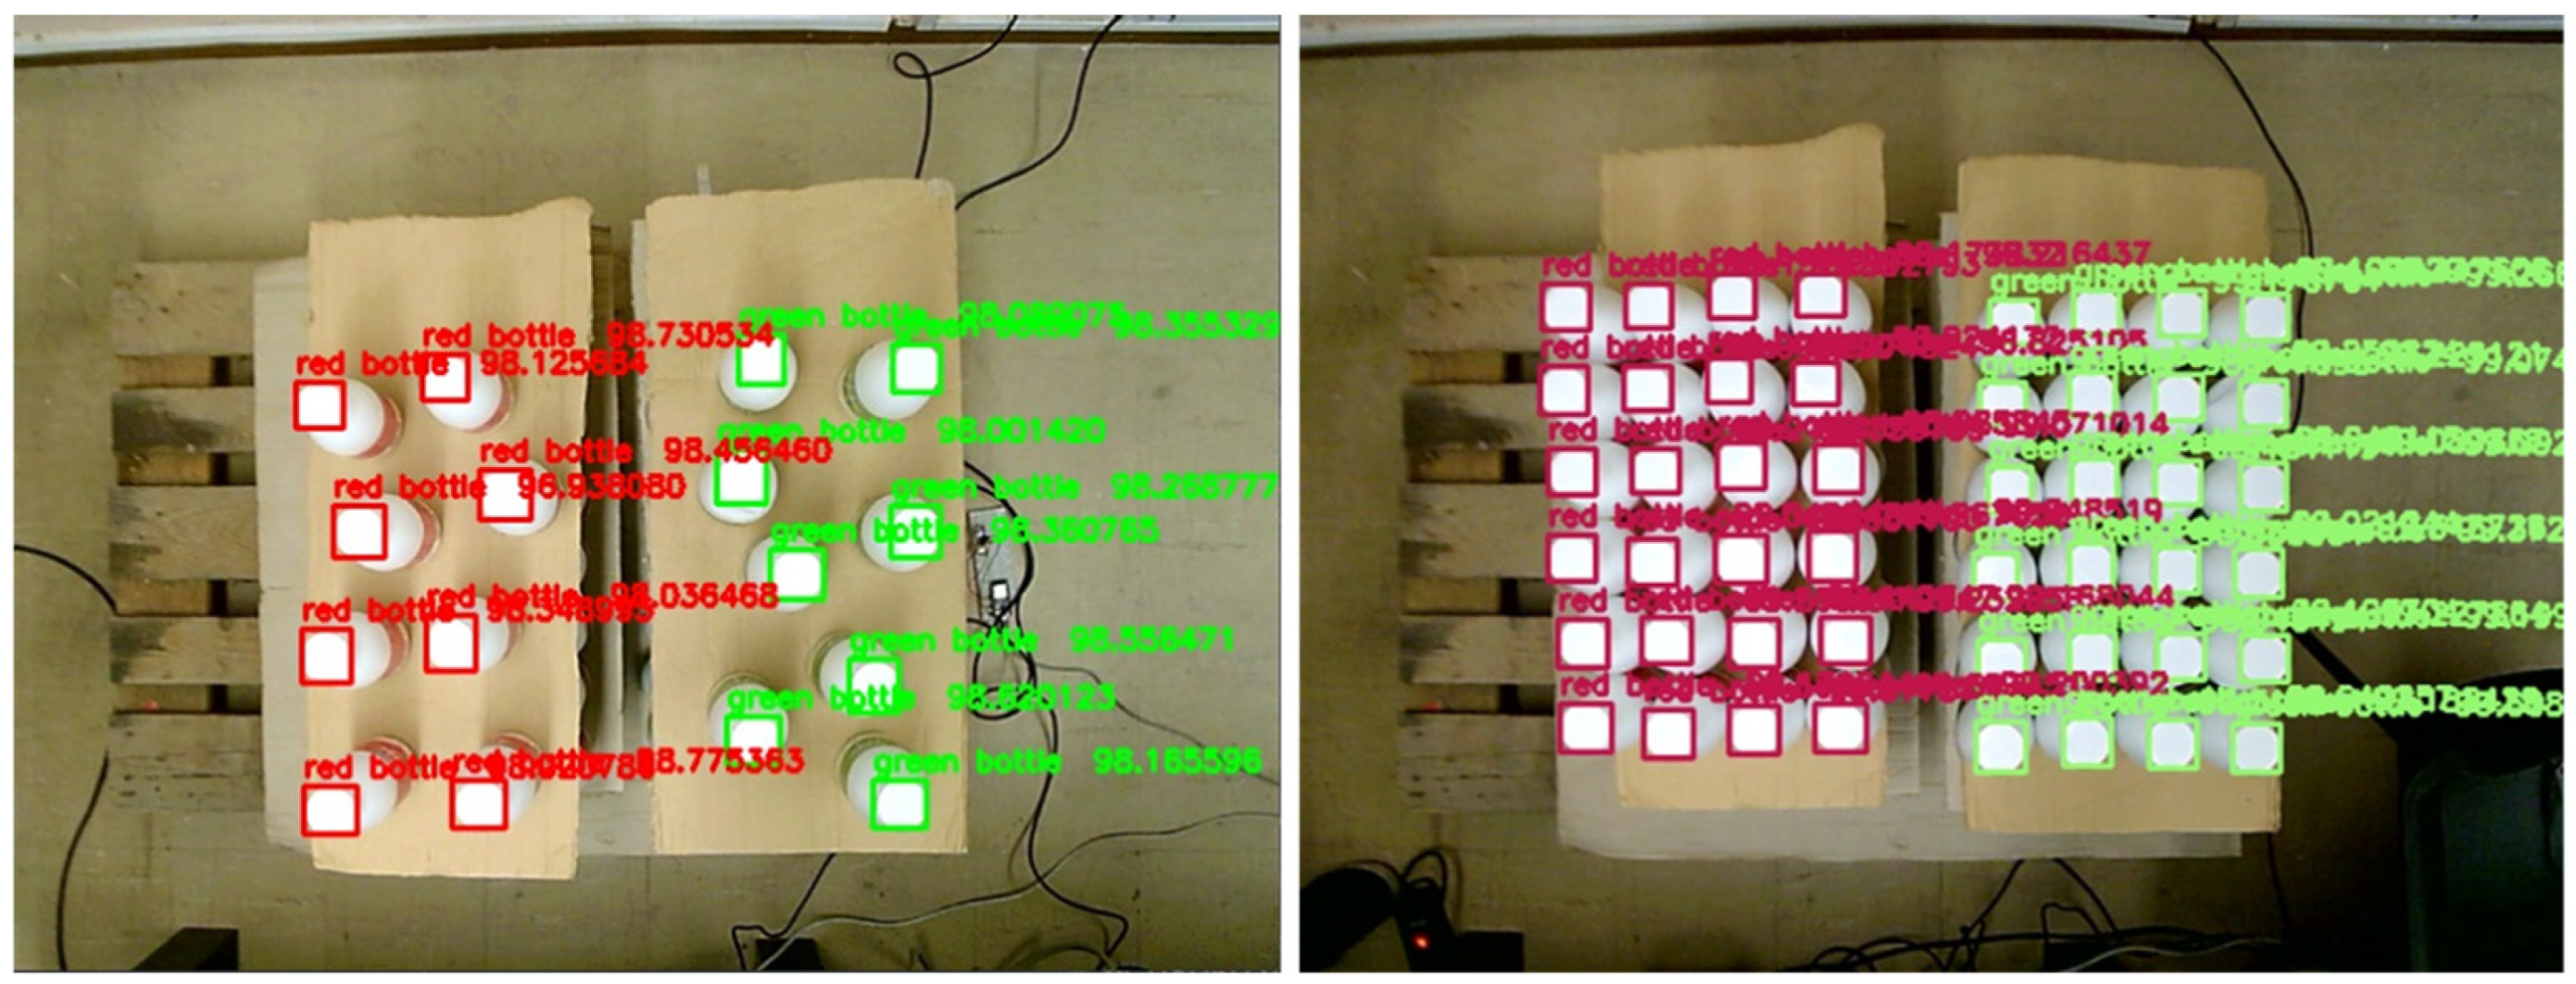
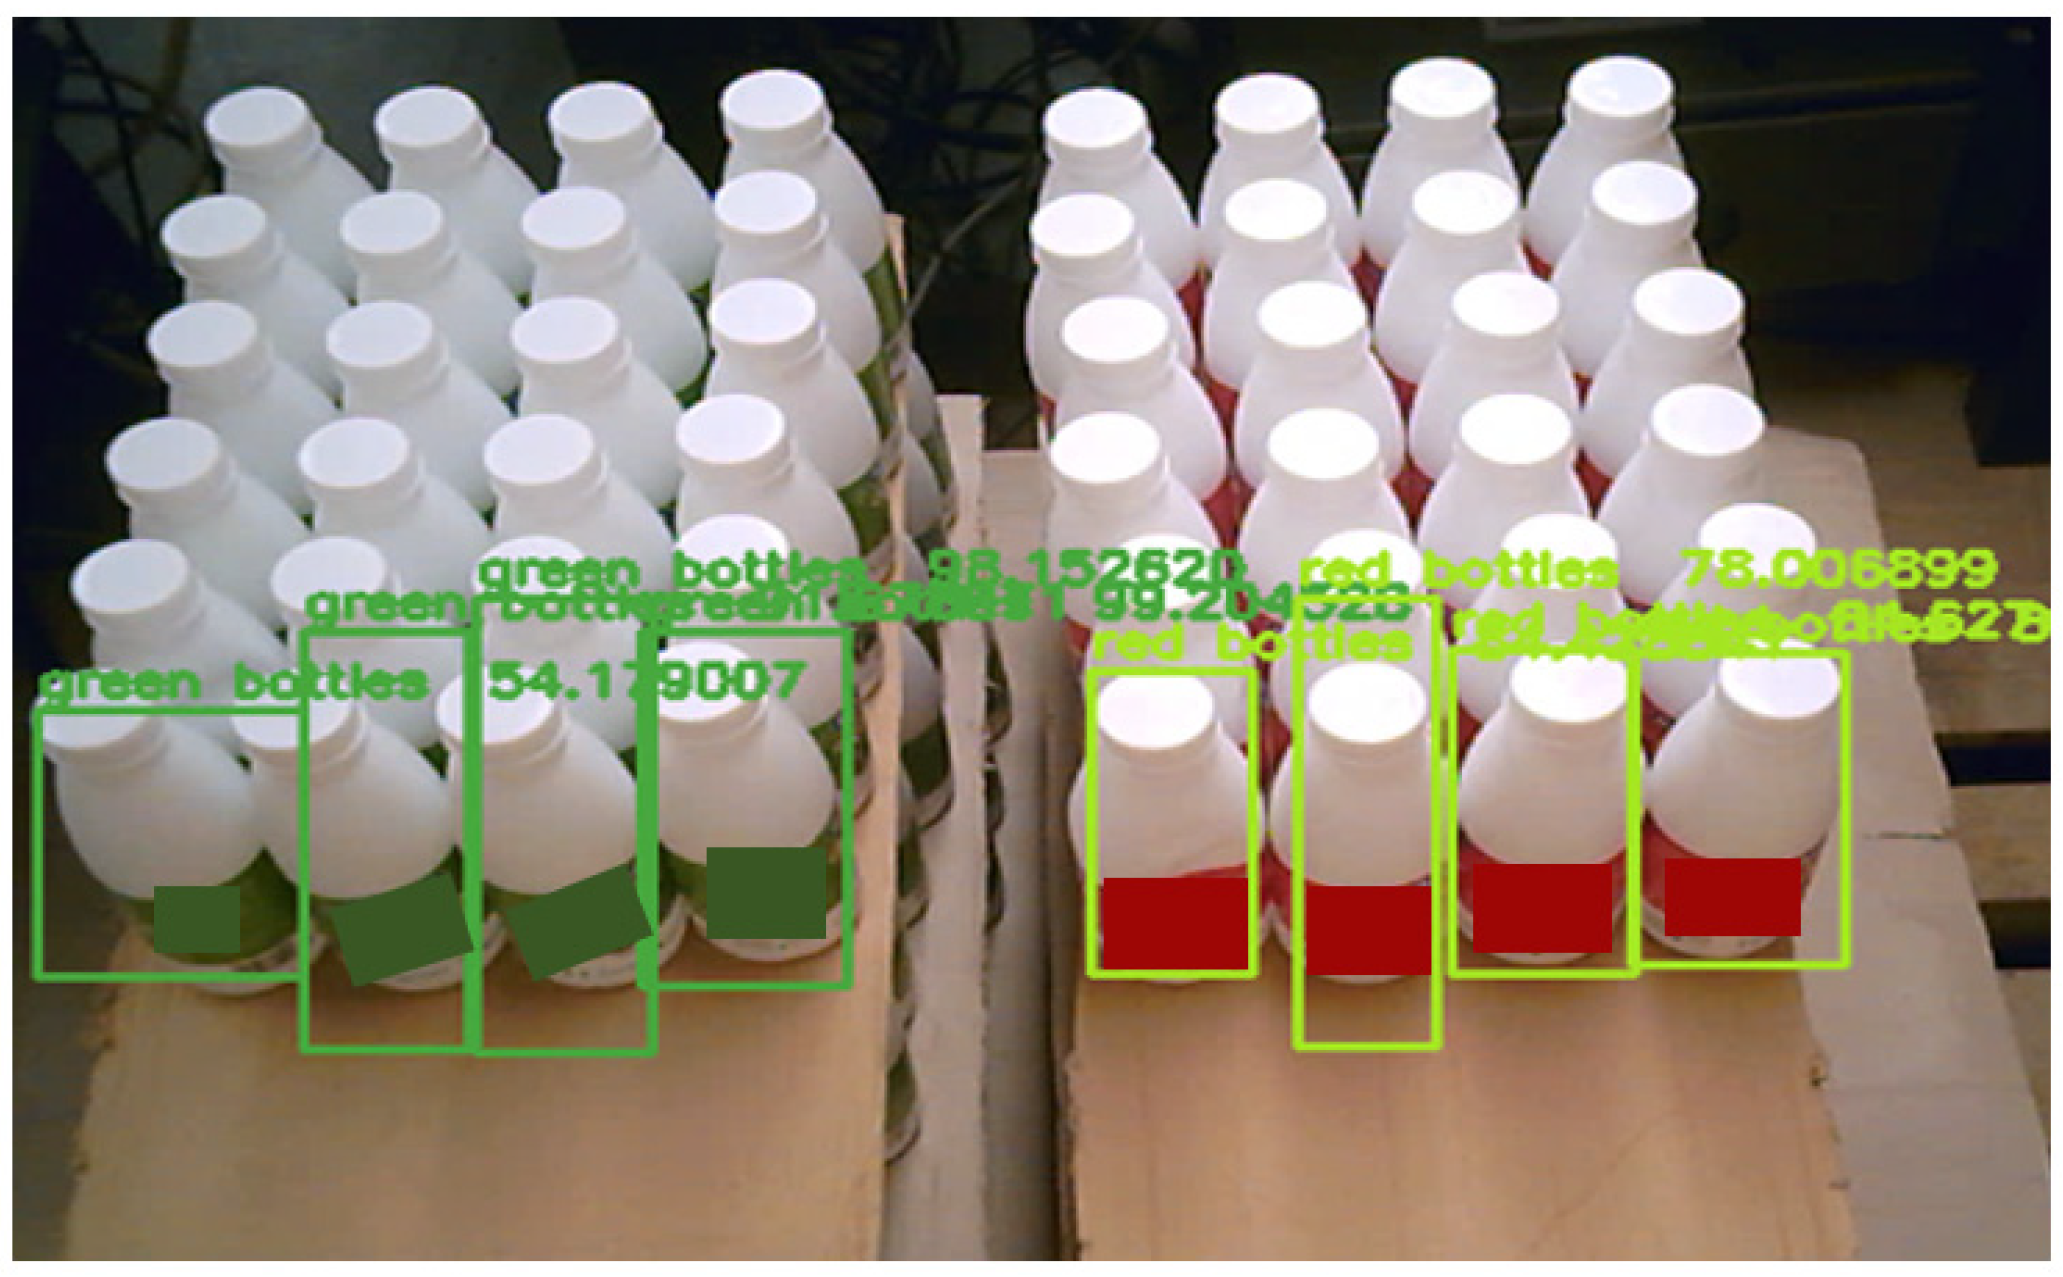
During step 1 of the packaging process, Module A is deployed to identify which pallet contains green- or red-labeled bottles. This requires detecting at least one instance of each product type on each pallet. Because the camera is positioned near the pallet center, a simple comparison of the center pixel values of the two detected bounding boxes is sufficient to determine whether the red pallet is on the left or the right. A sample of the detection output of the algorithm is provided in Figure 10. The approach was tested on several practical pilot conditions such as enhanced or decreased room brightness, different lighting direction, variable number of bottles and tight positioning of the pallets (side by side) representing actual conditions in factory environment. These tests were intended to assess feasibility in the examined setup rather than to provide a statistically exhaustive robustness evaluation. The model achieved successful detections in all cases and provided sufficient information to distinguish the pallets by product type.
In step 2, the picking robot must detect each bottle cap and localize it precisely—this is handled by Module B. To systematically evaluate the coordinate-calculation algorithm, we arranged 16 bottles (8 red, 8 green) at random positions across two pallets. Module B detects the caps (see Figure 11), estimates the center of each bounding box, and supplies these centers as inputs to the coordinate-calculation algorithm.
The calculated coordinate, versus the real positions of the bottles’ caps, as well as the Euclidian distance between the calculated and real center and the relative deviation with respect to the bottle cap diameter are provided in Table 8. Additionally, the summary error indicators are presented in Table 9. Figure 5a depicts the Cartesian system of reference based on which the position was calculated. The mean Euclidean deviation was 7.8 mm (19.5% of the bottle cap diameter), while the maximum deviation reached 13.9 mm (34.75% of the bottle cap diameter). Table 8 states that all picking attempts were successful despite the deviations. The robotic gripper used was Robotiq 2F-140. Bottle dimensions and the robotic gripper’s maximum opening width are important to assess whether a pick will be successful or not. The diameter of the bottle’s cap is 40 mm, while the robotic gripper’s maximum open width is measured at 140 mm, offering a wide picking advantage. The wide robotic gripper consists of two opposing rectangular surfaces and can achieve a successful bottle pick even with a Euclidean deviation of 20 mm from the bottle center according to laboratory tests. Any further deviation above 20 mm results in a poor bottle-picking surface (especially due to the round shape of the bottle and the perpendicular shape of the gripper) and ultimately an unsuccessful picking attempt. As stated in Table 9 maximum Euclidean deviation was 13.9 mm and thus, all picks were successful. It is also important to note that the largest deviations (13.0 mm and 13.9 mm) occurred in bottles near the image edge, where lens distortion and perspective effects intensify as objects move away from the image center. In this implementation, no explicit camera calibration or distortion correction was applied; however, the use of such techniques could further reduce these deviations.
The experiments indicated that the system provided accurate results in most conditions offering the essential detection and localization accuracy that enabled the robotic arm picking process (see Figure 12). With the detected deviation from the ideal position being adequately small, the robotic arm achieved all of its attempted picking movements at the first attempt. Furthermore, the object detection algorithm detected all the appearing bottles without any occlusions or misdetections in the scene. Moreover, the researchers monitored the efficiency of the algorithm in terms of detection time, computational usage and latency. The computationally light YOLO algorithm, as also being suitable for real-time detection, offered an inference time of below 1 sec while computational needs were limited. The inferencing algorithm was hosted by an NVIDIA Jetson Nano device, a device suitable for hosting AI-trained applications and appropriate for portable operations as it requires very limited power needs and offers limited computational power in comparison with a normal PC. Evidently, the lightweight YOLO algorithm was successfully hosted by the Jetson and validates that the algorithm’s efficiency is suitable for modern, advanced manufacturing applications.
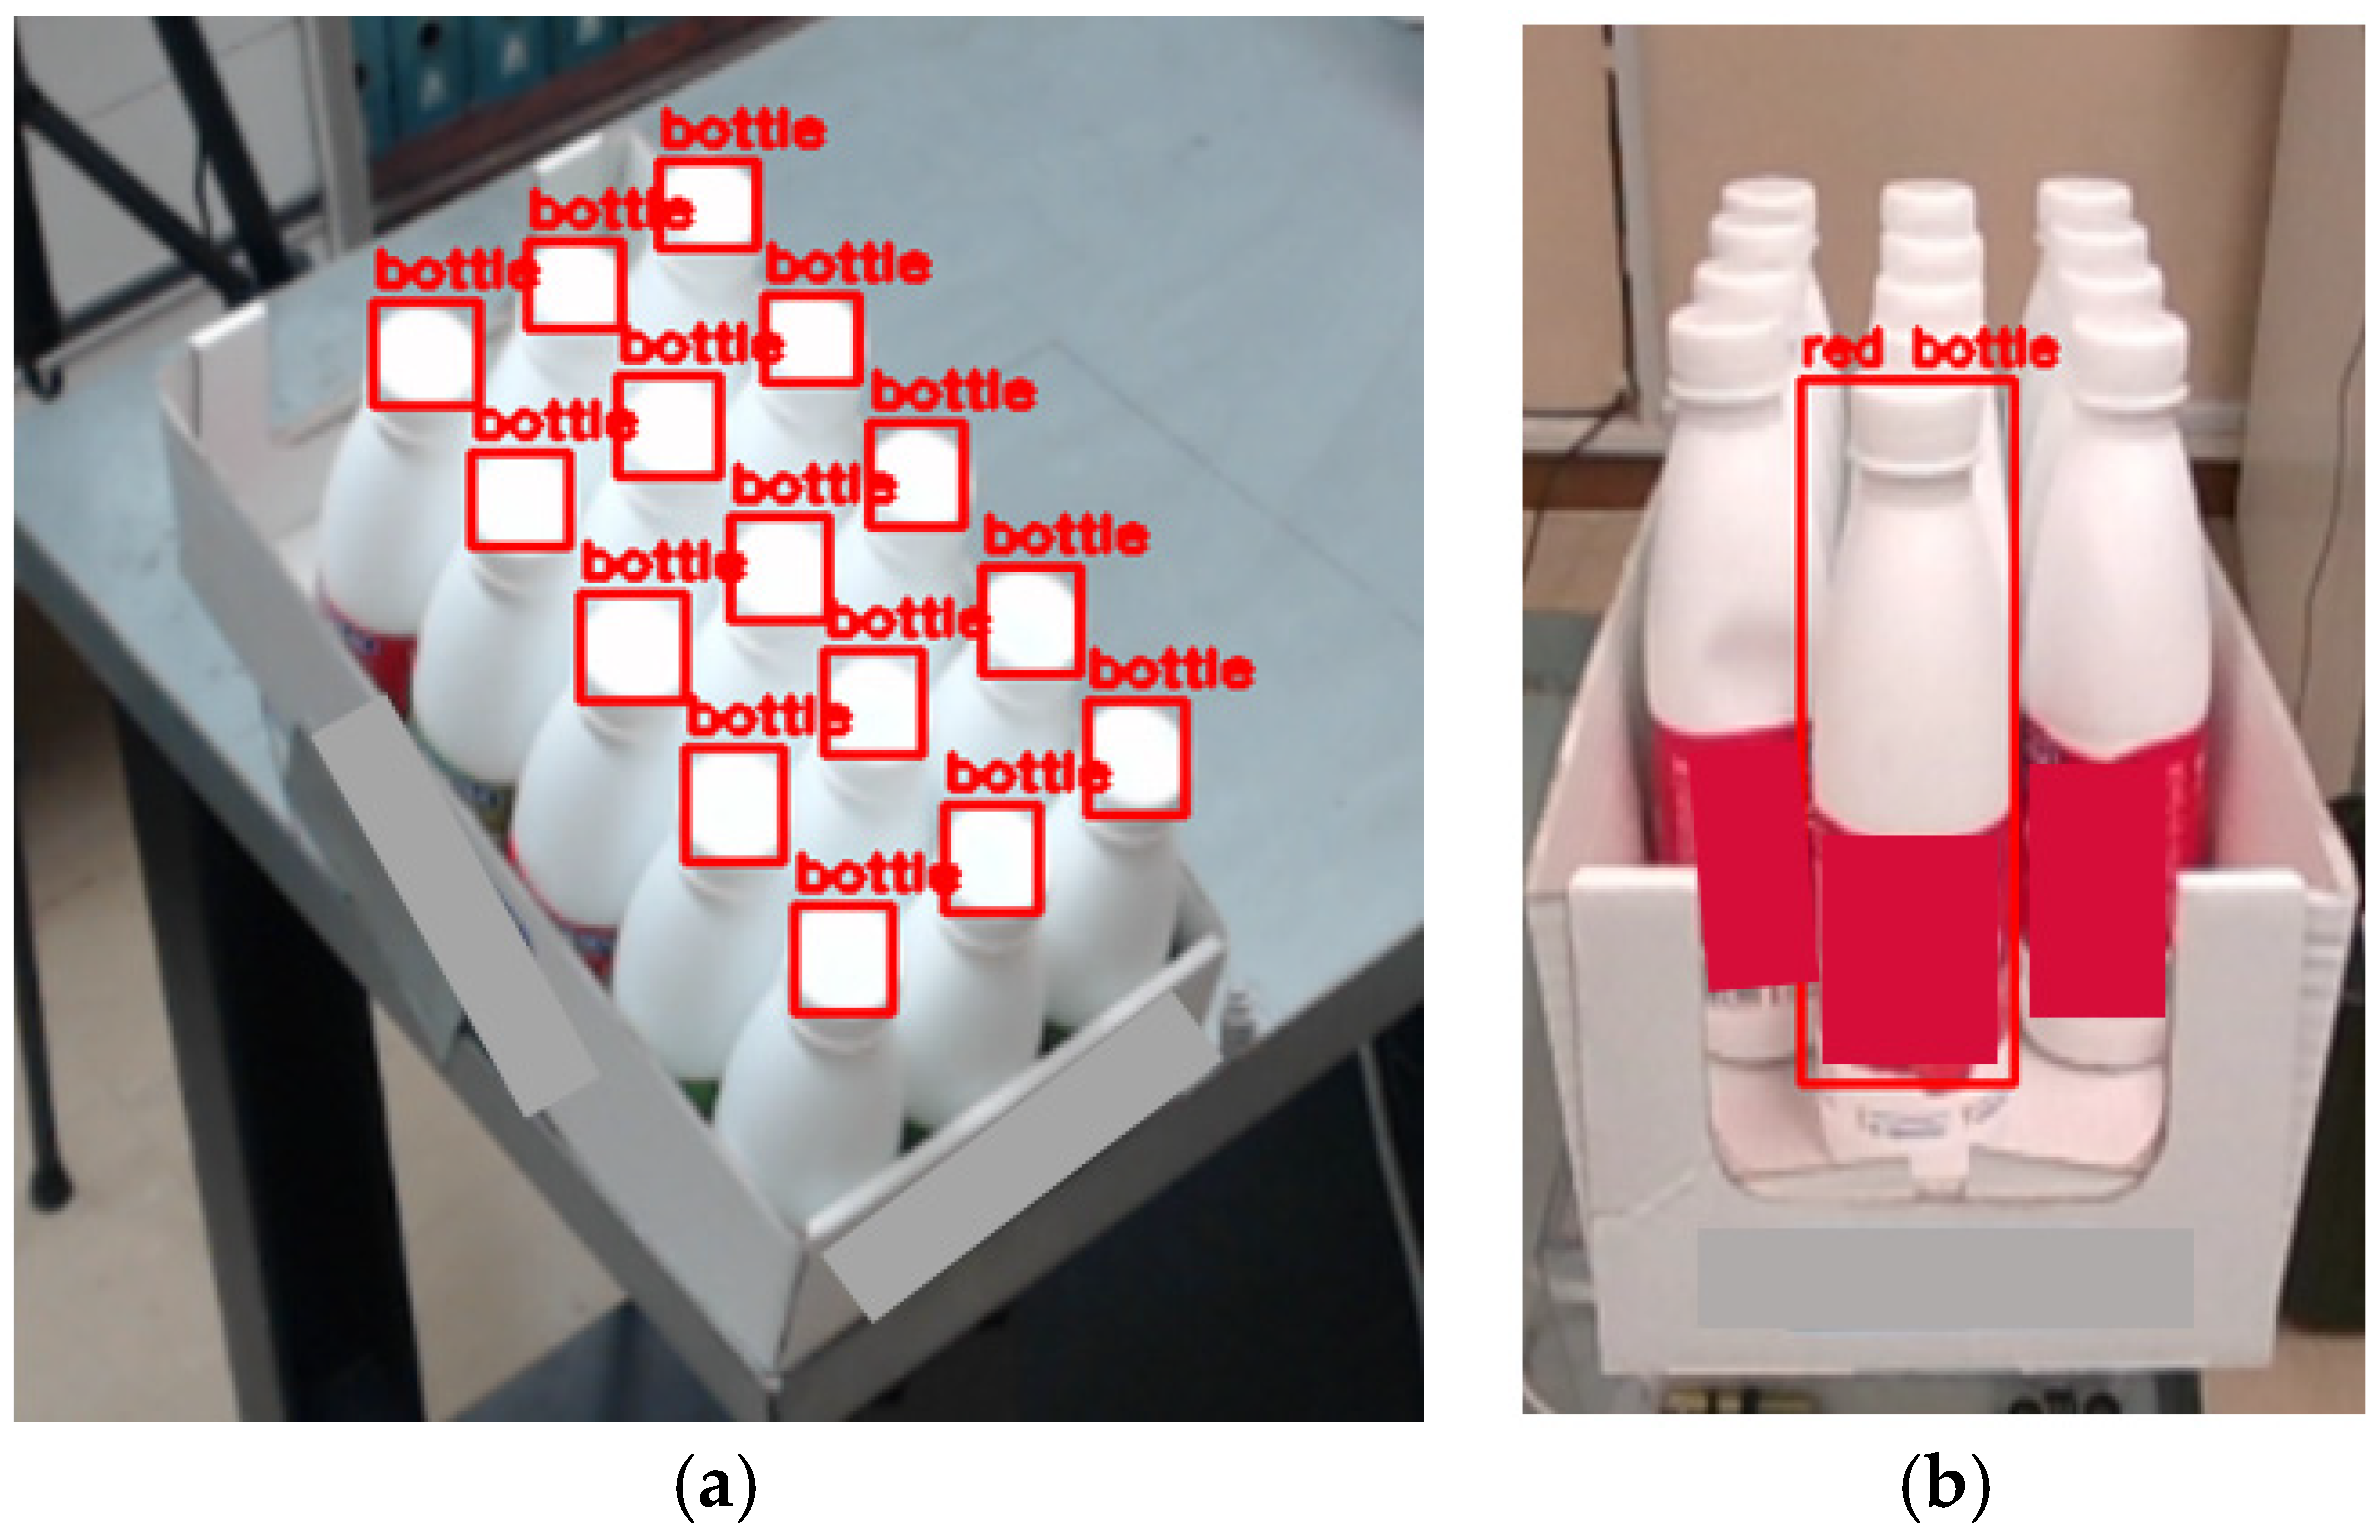
During the pick-and-place phase, Module C tracks the number of bottles inside the box and verifies the type of each bottle after placement. Samples from its deployment are provided in Figure 12. Detection accuracy was adequate for the needs of the mixed-packaging quality assessment step. Adjustments in the lighting conditions were crucial for the performance, as the white bottles along with the white and bright environment (white package and intense white lighting) rendered the detection procedure challenging for the object detection algorithm.

6. Discussion

In manufacturing, synthetic data can eliminate labor-intensive, error-prone data collection and annotation required for AI applications. Because different production steps require distinct datasets, a systematic synthetic-data generation framework—offering scalability, controlled data generation, and bias reduction—is essential for efficient, consistent data handling. This work has designed and developed such a framework, introducing a structured, end-to-end pipeline for synthetic data generation and AI model development across multiple production steps, and showcasing both its potential as well as the potential of the CV applications built on top of it, in an industrial use case that involved mixed-packaging task in the dairy industry. In the context of the industrial case, the framework supported the development of three different CV systems by reusing the flow of the development steps, the tools in each step and the ML/DL models developed. The synthetic dataset generation for all three modules was completed within a few hours of rendering time, approximately 1, 2, and 1.7 h for Modules A, B, and C respectively (as mentioned in Section 4), whereas assembling datasets of equivalent size through traditional real-world data collection and manual annotation would demand considerably greater time and human effort. This implementation demonstrated the flexibility and reusability of the framework across multiple production steps, suggesting improvements in productivity and operational costs. Moreover, it was shown that the performance of the ML/DL models is adequate for the needs of the industrial use cases. These findings indicate that the proposed approach can support practitioners and researchers in the systematic development and deployment of computer vision solutions in manufacturing, while reducing reliance on real-world data.
However, despite its effectiveness, the proposed approach presents certain limitations that must be acknowledged. The quality and generalizability of the synthetic datasets heavily depend on the realism of the virtual environment, including lighting behavior, material simulation, and accurate 3D representation of objects. Achieving realistic simulations for highly complex geometries or specialized materials may require substantial manual effort by designers. The generation of large-scale synthetic datasets can become computationally demanding, particularly when thousands of product variations must be modeled to support large-scale industrial settings. These factors may restrict scalability or limit rapid deployment in highly diversified production environments. Furthermore, the framework has been validated within a single industrial setup and has not been systematically evaluated under diverse camera configurations or more challenging illumination conditions. In addition, its validation is limited to a single industrial sector, and further assessments are required to confirm its adaptability to other manufacturing domains with different operational constraints and product characteristics. Therefore, the results should be interpreted as evidence of feasibility and pilot-level applicability within the examined packaging scenario, rather than as proof of generalizable performance across arbitrary industrial settings. The current validation also relies on a limited number of real-world test images, which precludes the computation of statistically meaningful quantitative detection metrics. Overall, while the results are promising, the general applicability of the framework requires validation across a broader range of industrial settings.
As part of future research, the authors plan to extend the validation of the framework to additional industrial domains, including logistics, component assembly, packaging lines with higher product variety, and inventory management. Such cross-domain evaluations will help assess scalability, transferability, and the robustness of domain randomization strategies when applied to different product morphologies and workflows, and will also enable the quantification of detection performance through standard metrics (i.e., precision, recall, and mean average precision), providing a statistically reliable basis for evaluating the developed CV models across diverse industrial settings. Future work will also include quantitative comparisons with traditional data collection pipelines and the use of measurable indicators to more rigorously assess the benefits of the proposed approach, as well as comparative evaluations of models trained on synthetic versus real-world data. In addition, the incorporation of generative AI approaches (e.g., GANs, diffusion models) will be explored to complement rendering-based synthetic data and automate dataset diversification, offering additional flexibility and improved realism when simulating subtle variations or extensive product catalog changes. Further enhancements will include support for advanced CV tasks such as 3D annotation, 3D object detection and semantic segmentation, enabling broader application of the framework to robotic manipulation, automated inspection, and complex assembly processes. Together, these improvements aim to transform the framework into a comprehensive, scalable synthetic-data pipeline capable of supporting an expanded range of industrial CV solutions.

Author Contributions

Conceptualization, K.A., C.M. and N.N.; Methodology, K.A., C.M. and N.N.; Software, K.A., C.M. and N.N.; Validation, K.A., C.M. and N.N.; Formal Analysis, K.A., C.M. and N.N.; Investigation, K.A., C.M. and N.N.; Resources, K.A., C.M. and N.N.; Data Curation, K.A., C.M. and N.N.; Writing—Original Draft Preparation, C.M. and D.T.; Writing—Review and Editing, K.A., C.M., D.T. and N.N.; Visualization, C.M. and D.T.; Supervision, K.A.; Project Administration, K.A. and N.N.; Funding Acquisition, K.A. All authors have read and agreed to the published version of the manuscript.

Funding

This work was partially supported by the National Recovery and Resilience Plan Greece 2.0, funded by the European Union—NextGenerationEU grant number TAEDR-0535864, project “Greece4.0”.

Institutional Review Board Statement

Not applicable.

Informed Consent Statement

Not applicable.

Data Availability Statement

The authors confirm that the data supporting the findings of this study are available upon request.

Conflicts of Interest

The authors declare no conflicts of interest.

Abbreviations

The following abbreviations are used in this manuscript:
AGVAutomated Guided Vehicle
AIArtificial Intelligence
CADComputer-Aided Design
CVComputer Vision
CNNConvolutional Neural Network
DLDeep Learning
GANGenerative Adversarial Network
MLMachine Learning
YOLOYou Only Look Once

References

  1. Chryssolouris, G.; Alexopoulos, K.; Arkouli, Z. A Perspective on Artificial Intelligence in Manufacturing; Springer: Cham, Switzerland, 2023; Volume 436, pp. 1–135. [Google Scholar] [CrossRef] [Scilit]
  2. Mishra, S.P.; Kamaraj, A.; Rajinikanth, V.; Rahul, M.R. A computer vision-based approach for identification of non-metallic inclusions in the steel industry. J. Ind. Inf. Integr. 2025, 46, 100860. [Google Scholar] [CrossRef] [Scilit]
  3. Peta, K.; Suszyński, M.; Wiśniewski, M.; Mitek, M. Analysis of Energy Consumption of Robotic Welding Stations. Sustainability 2024, 16, 2837. [Google Scholar] [CrossRef] [Scilit]
  4. Alexopoulos, K.; Nikolakis, N.; Chryssolouris, G. Digital twin-driven supervised machine learning for the development of artificial intelligence applications in manufacturing. Int. J. Comput. Integr. Manuf. 2020, 33, 429–439. [Google Scholar] [CrossRef] [Scilit]
  5. Fang, K.; Bai, Y.; Hinterstoisser, S.; Savarese, S.; Kalakrishnan, M. Multi-Task Domain Adaptation for Deep Learning of Instance Grasping from Simulation. In 2018 IEEE International Conference on Robotics and Automation (ICRA), Brisbane, QLD, Australia, 21–25 May 2018; IEEE: Piscataway, NJ, USA, 2018; pp. 3516–3523. [Google Scholar] [CrossRef] [Scilit]
  6. Bousmalis, K.; Irpan, A.; Wohlhart, P.; Bai, Y.; Kelcey, M.; Kalakrishnan, M.; Downs, L.; Ibarz, J.; Pastor, P.; Konolige, K.; et al. Using simulation and domain adaptation to improve efficiency of deep robotic grasping. In 2018 IEEE International Conference on Robotics and Automation (ICRA); IEEE: Piscataway, NJ, USA, 2018; pp. 4243–4250. [Google Scholar] [CrossRef] [Scilit]
  7. Shorten, C.; Khoshgoftaar, T.M. A survey on image data augmentation for deep learning. J. Big Data 2019, 6, 60. [Google Scholar] [CrossRef] [Scilit]
  8. Manettas, C.; Nikolakis, N.; Alexopoulos, K. Synthetic datasets for Deep Learning in computer-vision assisted tasks in manufacturing. Procedia CIRP 2021, 103, 237–242. [Google Scholar] [CrossRef] [Scilit]
  9. Nikolenko, S.I. Synthetic Data for Deep Learning; Springer: Cham, Switzerland, 2021; Volume 174, p. 348. [Google Scholar] [CrossRef] [Scilit]
  10. Wang, Y.; Jing, J.; Zhang, X. Image anomaly detection with a unified transformer model guided by dual-feature. J. Ind. Inf. Integr. 2025, 47, 100892. [Google Scholar] [CrossRef] [Scilit]
  11. Zhao, D.; Xue, D.; Wang, X.; Du, F. Adaptive vision inspection for multi-type electronic products based on prior knowledge. J. Ind. Inf. Integr. 2022, 27, 100283. [Google Scholar] [CrossRef] [Scilit]
  12. Zhou, L.; Zhang, L.; Konz, N. Computer Vision Techniques in Manufacturing. In IEEE Transactions on Systems, Man, and Cybernetics: Systems; IEEE: Piscataway, NJ, USA, 2023; Volume 53, pp. 105–117. [Google Scholar] [CrossRef] [Scilit]
  13. Zhang, Y.; Zhang, Q.; Zhang, L.; Li, J.; Li, M.; Liu, Y.; Shi, Y. Progress of machine vision technologies in intelligent dairy farming. Appl. Sci. 2023, 13, 7052. [Google Scholar] [CrossRef] [Scilit]
  14. Kardovskyi, Y.; Moon, S. Artificial intelligence quality inspection of steel bars installation by integrating mask R-CNN and stereo vision. Autom. Constr. 2021, 130, 103850. [Google Scholar] [CrossRef] [Scilit]
  15. Alexopoulos, K.; Catti, P.; Kanellopoulos, G.; Nikolakis, N.; Blatsiotis, A.; Christodoulopoulos, K.; Kaimenopoulos, A.; Ziata, E. Deep Learning for Estimating the Fill-Level of Industrial Waste Containers of Metal Scrap: A Case Study of a Copper Tube Plant. Appl. Sci. 2023, 13, 2575. [Google Scholar] [CrossRef] [Scilit]
  16. Andhare, P.; Rawat, S. Pick and place industrial robot controller with computer vision. In 2016 International Conference on Computing Communication Control and Automation (ICCUBEA); IEEE: Piscataway, NJ, USA, 2016; pp. 1–4. [Google Scholar] [CrossRef] [Scilit]
  17. Mathur, A.; Bansal, C.; Chauhan, S.; Yadav, O. A review of pick and place operation using computer vision and ros. In Computational and Experimental Methods in Mechanical Engineering: Proceedings of ICCEMME 2021; Springer Nature: Singapore, 2021; pp. 411–418. [Google Scholar] [CrossRef] [Scilit]
  18. Chen, C.; Lu, J.; Zhou, M.; Yi, J.; Liao, M.; Gao, Z. A YOLOv3-based computer vision system for identification of tea buds and the picking point. Comput. Electron. Agric. 2022, 198, 107116. [Google Scholar] [CrossRef] [Scilit]
  19. Prezas, L.; Michalos, G.; Arkouli, Z.; Katsikarelis, A.; Makris, S. AI-enhanced vision system for dispensing process monitoring and quality control in manufacturing of large parts. Procedia CIRP 2022, 107, 1275–1280. [Google Scholar] [CrossRef] [Scilit]
  20. Nandakumar, N.; Eberhardt, J. A Synthetic Image Generation Pipeline for Vision-Based AI in Industrial Applications. Appl. Sci. 2025, 15, 12600. [Google Scholar] [CrossRef] [Scilit]
  21. Liu, S.; Li, R.; Zhou, J.; Dai, C.; Yu, J.; Zhang, Q. Physics-Based Data Augmentation Enables Accurate Machine Learning Prediction of Melt Pool Geometry. Appl. Sci. 2025, 15, 8587. [Google Scholar] [CrossRef] [Scilit]
  22. Dahmen, T.; Trampert, P.; Boughorbel, F.; Sprenger, J.; Klusch, M.; Fischer, K.; Kübel, C.; Slusallek, P. Digital reality: A model-based approach to supervised learning from synthetic data. AI Perspect. 2019, 1, 2. [Google Scholar] [CrossRef] [Scilit]
  23. Ros, G.; Sellart, L.; Materzynska, J.; Vazquez, D.; Lopez, A.M. The synthia dataset: A large collection of synthetic images for semantic segmentation of urban scenes. In Proceedings of the IEEE Conference on Computer Vision and Pattern Recognition; IEEE: Piscataway, NJ, USA, 2016; pp. 3234–3243. [Google Scholar] [CrossRef] [Scilit]
  24. Singh, A.R.; Hazra, S.; Goswami, A.; Debattista, K.; Bashford-Rogers, T. A comprehensive survey of image synthesis approaches for Deep Learning-based surface defect detection in manufacturing. Comput. Ind. 2025, 173, 104360. [Google Scholar] [CrossRef] [Scilit]
  25. Tremblay, J.; Prakash, A.; Acuna, D.; Brophy, M.; Jampani, V.; Anil, C.; To, T.; Cameracci, E.; Boochoon, S.; Birchfield, S. Training deep networks with synthetic data: Bridging the reality gap by domain randomization. In Proceedings of the IEEE Conference on Computer Vision and Pattern Recognition Workshops; IEEE: Piscataway, NJ, USA, 2018; pp. 969–977. [Google Scholar] [CrossRef] [Scilit]
  26. Huber, C.; Knoll, D.; Guthe, M. Fully-Synthetic Training for Visual Quality Inspection in Automotive Production. Procedia CIRP 2025, 134, 777–782. [Google Scholar] [CrossRef] [Scilit]
  27. Roberts, M.; Ramapuram, J.; Ranjan, A.; Kumar, A.; Bautista, M.A.; Paczan, N.; Webb, R.; Susskind, J.M. Hypersim: A photorealistic synthetic dataset for holistic indoor scene understanding. In Proceedings of the IEEE/CVF International Conference on Computer Vision; IEEE: Piscataway, NJ, USA, 2021; pp. 10912–10922. [Google Scholar] [CrossRef] [Scilit]
  28. Josifovski, J.; Kerzel, M.; Pregizer, C.; Posniak, L.; Wermter, S. Object detection and pose estimation based on convolutional neural networks trained with synthetic data. In 2018 IEEE/RSJ International Conference on Intelligent Robots and Systems (IROS); IEEE: Piscataway, NJ, USA, 2018; pp. 6269–6276. [Google Scholar] [CrossRef] [Scilit]
  29. Thomas, G.; Chien, M.; Tamar, A.; Ojea, J.A.; Abbeel, P. Learning robotic assembly from cad. In 2018 IEEE International Conference on Robotics and Automation (ICRA); IEEE: Piscataway, NJ, USA, 2018; pp. 3524–3531. [Google Scholar] [CrossRef] [Scilit]
  30. Papacharalampopoulos, A.; Tzimanis, K.; Sabatakakis, K.; Stavropoulos, P. Deep Quality Assessment of a Solar Reflector Based on Synthetic Data: Detecting Surficial Defects from Manufacturing and Use Phase. Sensors 2020, 20, 5481. [Google Scholar] [CrossRef] [Scilit] [PubMed]
  31. Kim, A.; Lee, K.; Lee, S.; Song, J.; Kwon, S.; Chung, S. Synthetic Data and Computer-Vision-Based Automated Quality Inspection System for Reused Scaffolding. Appl. Sci. 2022, 12, 10097. [Google Scholar] [CrossRef] [Scilit]
  32. Rožanec, J.M.; Zajec, P.; Theodoropoulos, S.; Koehorst, E.; Fortuna, B.; Mladenić, D. Synthetic Data Augmentation Using GAN For Improved Automated Visual Inspection. IFAC-PapersOnLine 2023, 56, 11094–11099. [Google Scholar] [CrossRef] [Scilit]
  33. Karlsson, I.; Fathi, M.; Grahn, G.; Björnsson, A.; Wallin, E. Towards Zero Defect Manufacturing: Computer Vision-Enhanced Mixed Reality for Quality Inspection. Procedia CIRP 2025, 134, 1059–1064. [Google Scholar] [CrossRef] [Scilit]
  34. Rawal, P.; Sompura, M.; Hintze, W. Synthetic data generation for bridging Sim2Real gap in a production environment. arXiv 2023, arXiv:2311.11039. [Google Scholar] [CrossRef] [Scilit]
  35. Blender Foundation. Version 2.93. 2026. Available online: https://www.blender.org/ (accessed on 12 September 2025).
  36. Swathi, Y.; Challa, M. YOLOv8: Advancements and Innovations in Object Detection. In International Conference on Smart Computing and Communication; Springer Nature: Singapore, 2024; pp. 1–13. [Google Scholar] [CrossRef] [Scilit]
  37. Ultralytics. YOLOv8 Hyperparameter Tuning. 2025. Available online: https://docs.ultralytics.com/guides/hyperparameter-tuning/ (accessed on 12 September 2025).
  38. Kubernetes. Kubernetes 1.9: Apps Workloads GA and Expanded Ecosystem. Available online: https://kubernetes.io/blog/2017/12/kubernetes-19-workloads-expanded-ecosystem/ (accessed on 12 September 2025).
  39. OpenCV. OpenCV—Open Computer Vision Library. Available online: https://opencv.org/ (accessed on 12 September 2025).
Figure 1. Overview of the proposed framework.
Applsci 16 04388 g001
Figure 2. Conceptual illustration of the robot-assisted mixed-packaging steps.
Applsci 16 04388 g002
Figure 3. Robotics-assisted palletizing process setup: (A) picking from two pallets carrying two types of products (e.g., red and green bottles) and (B) packaging into a mixed-product package.
Applsci 16 04388 g003
Figure 4. Samples of the color detection syntheticdataset with variation in camera position and lighting: (a) synthetic images (b) annotated synthetic images.
Applsci 16 04388 g004
Figure 5. Training loss curves: (a) cIoU; (b) BCE; (c) DFL.
Applsci 16 04388 g005
Figure 6. (a) Sample of the synthetic dataset tailored for object detection (b) annotated sample of the synthetic dataset tailored for object detection.
Applsci 16 04388 g006
Figure 7. Training loss curves: (a) cIoU; (b) BCE; (c) DFL.
Applsci 16 04388 g007
Figure 9. Training loss curves: (a) cIoU; (b) BCE; (c) DFL.
Applsci 16 04388 g009
Figure 10. Sample result of color detection.
Applsci 16 04388 g010
Figure 11. Samples from object detection algorithm with variable number of bottles.
Applsci 16 04388 g011
Figure 12. (a) Samples of bottle-counting algorithm; (b) samples of color detection of the first row of a box.
Applsci 16 04388 g012
Table 1. Parametrization values.
GroupParameterDescription
ANumber of classesSelect the number of classes that will be included in the dataset.
Number of objectsSelect the minimum and maximum number of objects per class.
Number of batchesDefine the number of object batches per class (e.g., in the case of industrial pallets).
Position randomizationAdjust the position of the objects according to a 6-degree-of-freedom Cartesian system.
Background selectionSelect a background from a large background pool or build a custom one by UV mapping a real image.
Material selectionSelect one or more materials from a pool of materials.
Lighting adjustmentAdjust lighting position, intensity, reflections, shading and control lighting sources.
Camera adjustmentAdjust camera position as an offset of a standard, natural distance including lens properties (focal depth, angles and 6-axis Cartesian positioning).
BDetectable objects in the sceneSelect detectable objects in the image.
Detectable object surfaces per objectSelect a certain part (orientation/surface of the part) which will be detected and annotated.
Annotation formatAnnotation format depends on the chosen ML model and task.
Image resolutionSelect image resolution.
Dataset sizeNumber of images to be generated per class.
Table 2. Synthetic data generation parameters for the detection of the type of product in the pallets.
GroupParameterDescription
ANumber of classes2—red & green bottles
Number of objects0–60
Number of batches2—simulating the two pallets
Position randomizationLocation randomization has been selected as variable only in the xy plane (see Figure 4) with the whole batch moving as one object; rotation randomization has not been selected
Background selectionRandom selection from Blender 3D library
Material selectionWhite plastic
Lighting adjustment±60% from natural lighting. This involves the random positioning of 3 light sources along with randomized intensity and radius of influence.
Camera adjustment±50% of original position on 6-axis degrees of freedom
BDetectable objects in the sceneOnly the front row objects
Detectable object surfaces per objectWhole parts are visible
Annotation formatYOLO format
Image resolution900 × 675
Dataset size1100
Table 3. Training hyperparameters of YOLO model for the product detection module.
Batch size64
Batch division16
Input size900 × 675
Decay0.0005
Learning rate0.01
Burn in1000
Max batches7000
Loss function (weights)CIoU (7.5) + BCE (0.5) + DFL (1.5)
Training/validation split (%)90/10
Table 4. Synthetic data generation parameters for object recognition and position estimation.
GroupParameterDescription
ANumber of classes1 (the bottle)
Number of objects0–100
Number of batches2 (one batch representing the green and one the red products)
Position randomizationLocation randomization has been selected as variable in all 3 Cartesian axes (see Figure 5a) and it is applied to every bottle; object rotation was not randomized and was kept constant to the expected value
Background selectionRandom selection from Blender library
Material selectionWhite plastic
Lighting adjustment±0% from natural lighting; this has been achieved with three lighting sources moving and ranging in intensity and radius in a randomized manner
Camera adjustment±30% of its original position on 6-axis degrees of freedom
BDetectable objects in the sceneAll bottles
Detectable object surfaces per objectOnly the upper cross-section (bottle cap; see Figure 5b)
Annotation formatYOLO format
Image resolution900 × 675
Dataset size2200
Table 5. Training hyperparameters of YOLO model for the object detection module.
Batch size64
Batch division16
Input size900 × 675
Decay0.0005
Learning rate0.01
Burn in1000
Max batches7000
Loss function (weights)CIoU (7.5) + BCE (0.5) + DFL (1.5)
Training/validation split (%)90/10
Table 7. Training hyperparameters of YOLO model for the quality inspection module.
Batch size64
Batch division16
Input size900 × 675
Decay0.0005
Learning rate0.01
Burn in1000
Max batches7000
Loss functionCIoU (7.5) + BCE (0.5) + DFL (1.5)
Training/validation split (%)90/10
Table 8. Real-world coordinate-calculation results.
Bottle Number and TypeCalculated Position in the x and y Axes (mm)Real Position in the x and y Axes (mm)Coordinate Deviation in the x and y Axes (mm, mm)Deviation as Euclidean Distance (mm)Relative Deviation (% of Cap Diameter)Robot Pick
1—Red−835, −369−840, −3635, 67.819.5%Successful
2—Red−813, −465−819, −4666, 16.115.25%Successful
3—Red−716, −433−722, −4356, 26.315.75%Successful
4—Red−745, −320−748, −3163, 4512.5%Successful
5—Red−630, −360−634, −3604, 0410.0%Successful
6—Red−620, −457−625, −4625, 57.117.75%Successful
7—Red−501, −451−497, −4574, 67.218.0%Successful
8—Red−506, −337−508, −3332, 44.511.25%Successful
9—Green−558, −125−560, −1202, 55.413.5%Successful
10—Green−509, −10−509, −30, 7717.5%Successful
11—Green−600, −32−600, −230, 9922.5%Successful
12—Green−720, −2−720, 70, 9922.5%Successful
13—Green−686, −93−691, −875, 67.819.5%Successful
14—Green−761, −138−758, −1293, 99.423.5%Successful
15—Green−851, −124−856, −1125, 121332.5%Successful
16—Green−845, −4−850, 95, 1313.934.75%Successful
Table 9. Error indicators of the coordinate estimation algorithm.
Mean Euclidean deviation7.65 mm
Standard deviation2.68 mm
Minimum deviation4.0 mm
Maximum deviation13.9 mm
Mean relative deviation19.14%
Standard relative deviation6.7%
Disclaimer/Publisher’s Note: The statements, opinions and data contained in all publications are solely those of the individual author(s) and contributor(s) and not of MDPI and/or the editor(s). MDPI and/or the editor(s) disclaim responsibility for any injury to people or property resulting from any ideas, methods, instructions or products referred to in the content.