Article

Optimization of Gluten-Free Bread Formulation with Quercus rotundifolia Acorn Flour Using Response Surface Modelling, Digital Image Analysis, and Instrumental Texture Assessment


Faculty of Food Technology Osijek, Josip Juraj Strossmayer University of Osijek, F. Kuhaca 18, 31000 Osijek, Croatia
*
Author to whom correspondence should be addressed.
Appl. Sci. 2026, 16(9), 4284; https://doi.org/10.3390/app16094284
Submission received: 1 April 2026 / Revised: 23 April 2026 / Accepted: 25 April 2026 / Published: 28 April 2026

Abstract

This study aimed to optimize the formulation of gluten-free bread (GFB) based on rice flour (RF) and Quercus rotundifolia acorn flour (AF) by evaluating the combined effects of flour substitution (0%, 50%, and 100%) and water addition (90%, 100%, and 110%) on technological, textural, colorimetric, structural, and sensory properties. A three-level full factorial design (32) combined with response surface methodology (RSM) was used to model and optimize product quality. The developed models showed high predictive performance (R2 = 0.714–0.999; non-significant lack of fit), confirming their suitability for describing complex interactions in gluten-free systems. Water addition was the dominant factor influencing moisture, crumb structure, and textural softness, while AF mainly affected color, structure, and sensory attributes. Increasing acorn content significantly decreased lightness (L*) and increased redness (a*) and darkness index (DI), reflecting higher phenolic compound content and more intense Maillard reactions. Specific volume (1.85–2.41 cm3/g) was maximized at higher hydration levels, especially when combined with intermediate to high acorn substitution, indicating a synergistic interaction between fiber-rich flour and water availability. Texture analysis showed that AF increased hardness and reduced cohesiveness, while water addition significantly improved softness, elasticity, and overall mouthfeel. Image analysis of crumb structure demonstrated that higher hydration promoted larger pore size and porosity, whereas AF increased cell density, resulting in a finer crumb structure under low hydration conditions. Sensory evaluation confirmed that breads with high acorn content were well accepted due to their characteristic nutty flavor. Multi-response desirability optimization yielded an optimal formulation with approximately 83% AF and 108% water, representing the best achievable compromise among the evaluated quality criteria. The results demonstrate that AF can serve as a key functional ingredient in GFB, provided that hydration is carefully adjusted. This study highlights the effectiveness of RSM combined with image-based analysis as a robust approach for developing high-quality gluten-free bakery products.

1. Introduction

The global market for gluten-free (GF) products has grown significantly, driven by the rising prevalence of celiac disease and gluten sensitivities, as well as a broader public preference for specialized nutritional plans [1]. Despite this growth, gluten-free bread (GFB) often exhibits inferior technological and sensory characteristics compared to its traditional wheat-based counterparts, primarily due to the absence of the gluten matrix, which is essential for trapping gases and creating a resilient structure [2,3].
Rice flour (RF) is frequently used as a foundational ingredient in GF products because of its hypoallergenic nature, high digestibility, and mild flavor [1,4]. However, rice-based breads often have a low specific volume and poor crumb structure, necessitating the addition of improvers such as hydrocolloids or proteins to simulate the viscoelastic properties of gluten [2,5]. Nutritionally, RF is characterized by high starch content but is deficient in essential proteins, dietary fiber, and micronutrients, often resulting in products with a high glycemic index and limited nutritional value [6]. The starch in RF is especially susceptible to rapid enzymatic breakdown due to its low amylose content and the absence of structural barriers such as fiber or protein networks. This rapid starch digestibility leads to postprandial glucose responses, making these products less suitable from a metabolic and nutritional standpoint [7,8]. Furthermore, the low fiber content and lack of bioactive compounds reduce the potential health benefits compared to whole-grain or alternative flours [9,10]. These limitations have driven the search for alternative raw materials that can provide nutritional and functional enhancement [1].
Acorns from the Quercus genus are a significant nutritional resource and are increasingly recognized as a novel functional food because of their abundance of starch, minerals, and antioxidants [11,12]. The Q. rotundifolia species is notable for its favorable fatty acid profile, with a predominance of oleic and linoleic acids, and high potassium, calcium, and magnesium content [13]. AF contains significantly higher levels of fat and dietary fiber than wheat flour, offering a promising approach to improving the fiber content of GF products [1]. Functionally, AF acts as a thickener and stabilizer, and its starch, which is rich in amylose (~50%), helps create a stable crumb structure after cooling [11,14]. Its water-binding and gas-retaining capacities can significantly increase bread volume, while phenolic compounds contribute to a distinctive aroma and color that is more attractive to consumers [15,16]. Despite this, acorns remain an underutilized resource in the food industry [1].
In GF baking, water is one of the most critical parameters because it acts as a plasticizer, facilitates starch gelatinization, and determines the dough’s rheological behavior [2,17]. Because GF dough lacks a gluten network, proper hydration is essential for achieving optimal viscosity and prevent structural collapse during fermentation and baking [18,19]. Increased water levels can reduce crumb firmness and increase porosity, thereby prolonging product freshness and slowing staling [4,20,21,22].
However, if hydration is not precisely adjusted to the acorn content, the crumb may become too firm or, in the case of overhydration, structurally unstable, resulting in large voids within the crumb structure [2,23].
Although acorns have been shown to improve bread quality, the literature lacks systematic investigation of high AF levels (up to 100%) in combination with different hydration levels [15]. Most previous studies have focused on low substitution ratios, while the effect of varying water levels (90–110%) in systems with high acorn content remains underexplored. This aspect is crucial for optimizing the texture and volume of the final product [17,24].
Consequently, the objective of this research was to analyze how different ratios of RF and Q. rotundifolia AF (100:0, 50:50, and 0:100), combined with varying water addition levels (90%, 100%, and 110%), affect the technological, textural, and sensory properties of GFB. Additionally, the study sought to identify optimal formulation conditions for improved bread quality.

2. Materials and Methods

2.1. Materials

Acorn flour obtained from Quercus rotundifolia was supplied by Landratech LDA (Azambuja, Portugal), while rice flour was purchased from Nutrigold (Zagreb, Croatia). A comparative overview of the physicochemical composition of both raw flours used in the formulation is presented in Table S1. The distinct compositional differences between acorn and rice flour, particularly in dietary fiber fractions, fat content, and sugar levels, were considered relevant for interpreting their effects on dough hydration, crumb structure, and overall bread quality during response surface optimization. Additional ingredients included: whey protein concentrate (SFD Nutrition, Opole, Poland) with a protein content of 73%, xanthan gum (Nutrimed, Zagreb, Croatia), sugar (sucrose) (Viro d.d., Virovitica, Croatia), salt (sodium chloride, NaCl) (Solana Pag d.o.o., Pag, Croatia), instant dry yeast (Saccharomyces cerevisiae; di-go, Lesaffre Adriatic d.o.o., Prigorje Brdovečko, Croatia), and sunflower oil (Žito grupa, Čepin, Croatia).

2.2. Methods

2.2.1. Experimental Design and Preparation of Gluten-Free Acorn Bread (AFB)

To systematically evaluate the effects of formulation variables on the quality of GFB containing Q. rotundifolia, RSM was employed. A 32 full factorial design was used to examine the impact of two primary factors: the proportion of acorn flour (A) and the level of hydration (B) on various physical, chemical, and sensory properties. The experimental matrix and statistical evaluations were conducted using Design-Expert® software (version 12.0.3.0, Stat-Ease, Inc., Minneapolis, MN, USA).
The ranges for these variables were established through preliminary tests, in which AF content was adjusted to observe dough behavior and water levels were varied to optimize crumb consistency. RF was used to balance the flour mixture and maintain a constant total flour weight. The proportions of all supplementary ingredients—namely whey protein concentrate, xanthan gum, sugar, salt, instant yeast, and sunflower oil—were kept at a fixed level throughout the study and are reported as baker’s percentages (Table 1).
To estimate experimental error and assess model adequacy through lack-of-fit testing, the experimental plan included twelve runs, with four replicates at the center point (50% AF, 50% RF, and 100% water). The trials were conducted in a randomized order to minimize systematic bias.
The GF bread samples were prepared according to the experimental design (Table 1) using the straight dough method. Each batch used a total flour weight of 600 g, corresponding to four loaves containing 150 g flour each (RF/AF). All ingredients were mixed in a planetary mixer (Gorenje MMC800W, Velenje, Slovenia) for 2 min at low speed, followed by 6 min at high speed. The dough temperature immediately after mixing was recorded (26 °C) to ensure process reproducibility.
After mixing, the dough was divided into four equal portions, manually shaped, and placed in baking tins (15 × 8 × 5 cm). Proofing was carried out in a controlled fermentation chamber (Lievox, XEKPT-08EU-B, Unox, Cadoneghe, Italy) at 30 °C and 85% relative humidity for 50 min. The dough was then baked in a preheated deck oven (Decktop, XEKDT-01EU-S, Unox, Cadoneghe, Italy) at 200 °C for 3 min (2 min with steam and 1 min without steam), followed by 47 min at 175 °C. After baking, the loaves were removed from the tins and cooled on wooden racks at ambient temperature (22 ± 2 °C) for at least 2 h before analysis. All bread-making procedures were repeated in three separate batches, and the resulting loaves were evaluated in triplicate for each quality parameter.
The measured response variables included: physicochemical properties (moisture content, specific volume, crumb color parameters (L*, a*, b*), and calculated darkness index (DI)); textural properties (hardness, springiness, resilience, cohesiveness, and chewiness, determined instrumentally); structural properties (cell density (pores/cm2), average pore size (mm2), and porosity (%)); and sensory attributes (appearance, color, texture, odor, taste, and overall sensory score, evaluated by a trained panel).

2.2.2. Determination of Flour Chemical Composition

Standardized analytical methods were used to determine the chemical composition of the flour samples. The moisture content of the flour samples was determined according to AACC method 44-15.02 [25], while crude fat content was measured using Soxhlet extraction (AOAC 920.39) [26]. Protein content was determined by the Kjeldahl method (AOAC 979.09) [27] using 6.25 as the nitrogen-to-protein conversion factor. Total dietary fiber was quantified by an enzymatic–gravimetric method according to AOAC 991.43 [28]. Total carbohydrate percentage was calculated by subtracting the values for fat, protein, ash, and moisture from the total. Total sugar content was analyzed in accordance with the Luff–Schoorl method [29].

2.3. Quality Evaluation of AFB

Moisture content was determined using a two-stage procedure for bread samples (AACC 44-15.02) [25]
To evaluate crumb color, measurements were performed in the CIEL*a*b* color space using a colorimeter (model LS175, Shenzhen Linshang Technology Co., Ltd., Shenzhen, China). In this system, L* indicates lightness, while the a* and b* coordinates represent the red–green and yellow–blue color dimensions, respectively. A darkness index (DI) was calculated to describe overall color intensity, according to Equation (1) [30]:
D I = 100 L * 2 + a * 2 + b * 2
Before each measurement session, the instrument was calibrated using a standard white tile, and multiple readings were taken from across the crumb surface [31].
Crumb microstructure was analyzed using digital imaging. Bread slices were scanned with a flatbed scanner (Perfection V500 Photo, Seiko Epson Co., Suwa, Japan) at high resolution. Images were processed in ImageJ software (v1.54g, NIH, Bethesda, MD, USA) to select the central crumb region, convert it to grayscale, and segment the pores. Structural features including cell density (pores/cm2), average pore size (mm2), and porosity (%) were quantified from these images, providing objective information about crumb organization [32].
The specific volume of bread loaves was determined using laser topography (VolScan Profiler 300, Stable Micro Systems Ltd., Surrey, UK). Each loaf was weighed and scanned, and the software calculated the volume-to-weight ratio (cm3/g), reflecting gas retention and overall loaf expansion [32].
Texture profile analysis (TPA) of the GF bread samples was performed using an EZ Test Texture Analyzer (EL-LX, Shimadzu Corp., Kyoto, Japan). Bread loaves used for TPA measurements had dimensions corresponding to the internal dimensions of the baking tin (L/W/H 150 × 80 × 70–80 mm). For each loaf, its longitudinal midpoint was first identified, after which four slices of uniform thickness (2.5 cm) were cut: two slices on one side and two slices on the opposite side of the defined center. The crust was not removed prior to analysis. Measurements were carried out on crumb regions located approximately at the geometric center of each slice. The loaves underwent double compression to 40% of slice thickness (10 mm). Compression was performed using an aluminum cylindrical attachment with a diameter of 20 mm (Insertion Jig AL D20 346-57801-08, Shimadzu Corp., Kyoto, Japan). Trapezium X software (v2.0.2, Shimadzu Corp., Kyoto, Japan) was used to collect force–time data at a constant crosshead rate of 1 mm/s and a trigger sensitivity of 0.05 N. A 5 s delay separated the two compression cycles. Analysis of the resulting curves provided values for hardness, springiness, cohesiveness, resilience, and chewiness. All analyses were conducted on samples from three independent baking batches.
The sensory evaluation of AFB was conducted by a panel of 30 assessors (mean age: 29 years) with prior experience in sensory analysis. The panelists, comprising staff and students of the Faculty of Food Technology Osijek, routinely participate in sensory testing as part of research and educational activities. The primary aim of this assessment was to support formulation optimization and enable comparative evaluation among experimental bread samples under controlled laboratory conditions, rather than to establish population-level consumer acceptability. Panelists were selected based on the absence of conditions that could interfere with sensory perception, such as anosmia or color vision deficiencies, and no reported dislike of gluten-free bakery products. A total of 12 samples representing different formulations were evaluated. Panelists were served half a slice of bread (approximately 10–15 g), prepared with a mechanical slicer to ensure uniform thickness. Sensory evaluation was conducted using a 9-point hedonic test with attribute-oriented instructions for the five main attributes: appearance, color, texture, taste, and odor. Each sensory attribute was evaluated separately on a 9-point hedonic scale, where 1 corresponded to “dislike extremely,” 5 to “neither like nor dislike,” and 9 to “like extremely.” Sensory attributes served as structured perceptual cues guiding evaluation, rather than as separately measured intensity variables. Before evaluation, panelists received brief guidance on the sensory focus of each attribute in the context of bread evaluation. Appearance referred to visual shape, crust uniformity, and presence of surface cracks; color to the uniformity and degree of liking of both crust and crumb color; odor to aroma and presence of off-odors; taste to degree of liking, with bitterness and astringency as internal reference points for assessors; and texture to crumb porosity, softness, elasticity, and mouthfeel. Although the panel consisted of assessors with prior experience in sensory testing, their expertise was used to provide consistent hedonic ratings suitable for formula optimization, as supported by Lawless and Heymann (2010) [33]. The overall sensory score should be interpreted as a relative measure within this panel rather than as a direct indicator of general consumer acceptance. Panelists were invited to provide qualitative observations on specific flavor notes, such as bitterness, astringency, or nutty aromas introduced by AF, to complement the quantitative data [31]. The evaluation was organized into two consecutive blocks of six samples each, separated by a mandatory rest break of approximately 10 to 15 min. All bread samples were baked one day prior to sensory evaluation to ensure consistent sample conditions. The evaluation took place in a dedicated sensory laboratory under standardized neutral white lighting (6500 K) to ensure accurate perception of color and other visual properties. Bread samples were presented simultaneously in randomized positions, coded with random three-digit numbers. Panelists were instructed to cleanse their palates with water between samples. Evaluations were conducted during mid-morning hours to minimize variability related to circadian influences on sensory perception. All panelists provided informed consent in accordance with European Union ethical guidelines for human research. Before the assessment, participants received a brief introduction to the study and the samples to ensure familiarity with the testing procedure.

2.4. Extraction of Phenolic Compounds from AFB

To ensure maximum recovery of bioactive substances, the baked gluten-free bread was pulverized into a uniform, fine powder using a knife mill (Grindomix GM200, Retsch GmbH, Haan, Germany) operated at 10,000 min−1, achieving particle sizes below 200 µm to optimize the release of bioactive compounds. Until required for subsequent analysis, the processed powder was stored in vacuum-sealed containers at −18 °C. For each extraction, 10 mg of ground bread was accurately weighed using an analytical balance (AB204-S, Mettler-Toledo GmbH, Greifensee, Switzerland), and 10 mL of demineralized water was added. After thorough vortexing with a Vibromix 10 (Domel Tehtnica d.o.o., Železniki, Slovenia), the suspension was treated with ultrasound in a water bath (Digital Pro+, Vevor, Shanghai, China) at 30 °C and 40 kHz for 40 min to optimize the extraction yield. Following sonication, samples were centrifuged in a Multifuge 3L-R (Heraeus Instruments GmbH, Hanau, Germany) at 4000× g for 10 min. The supernatants, which comprised the total polyphenol extract (TPE), were immediately collected for further testing. To remove tannins, 5 mL of TPE was treated with 50 mg of polyvinylpolypyrrolidone (PVPP, Sigma-Aldrich, St. Louis, MO, USA), intermittently shaken for 15 min, and centrifuged at 4000× g for 10 min to obtain the tannin-free extract (TPE-PVPP) (Lukinac et al., 2026) [31].

2.5. Antioxidant Capacity of Bread Samples

The total phenolic content (TPC) in the AFB extracts was quantified using the Folin–Ciocalteu colorimetric method, following the procedures described by Lukinac et al. [31]. Briefly, 100 μL of either the total polyphenol extract (TPE) or the tannin-free fraction (TPE-PVPP) was mixed with an equal volume of Folin–Ciocalteu reagent (Sigma-Aldrich, St. Louis, MO, USA and allowed to react in the dark for 5 min. Then, 900 μL of distilled water and 900 μL of sodium carbonate (Sigma-Aldrich, St. Louis, MO, USA) solution were added. After a 30 min incubation at room temperature in the dark, the absorbance was measured at 765 nm using a UV–VIS spectrophotometer (model UV-1280, Shimadzu Corporation, Kyoto, Japan). TPC concentrations were calculated using a gallic acid calibration curve and reported as gallic acid equivalents (GAE). The tannin content was determined by subtracting the non-tannin phenolic content (NTPC) from the TPC (Lukinac et al., 2026) [31].
The antioxidant capacity of the aqueous extracts was assessed using in vitro techniques, including the ferric reducing antioxidant power (FRAP) and DPPH radical scavenging assays. For the DPPH assay, 100 μL of the extract was mixed with 3.9 mL of DPPH solution (2,2-diphenyl-1-picrylhydrazyl (DPPH), Sigma-Aldrich, St. Louis, MO, USA) and kept in the dark at room temperature for 30 min. The decrease in absorbance at 517 nm was measured, and the scavenging activity was expressed as Trolox equivalents (TE) [31].
The reducing power of the extracts was evaluated using a modified FRAP procedure. The FRAP reagent was prepared by mixing 300 mM acetate buffer (pH 3.6), 10 mM TPTZ (2,4,6-tris(2-pyridyl)-s-triazine (TPTZ), Sigma-Aldrich, St. Louis, MO, USA in 40 mM HCl), and 20 mM FeCl3·6H2O (iron (III) chloride hexahydrate (FeCl3·6H2O), Sigma-Aldrich, St. Louis, MO, USA) in a volumetric ratio of 10:1:1 (v/v/v). Then, 3 mL of this reagent was combined with 100 μL of the aqueous extract and incubated in a thermostated water bath at 37 °C for 10 min. Absorbance was measured at 594 nm using UV–VIS spectrophotometry, and the final antioxidant capacity was reported as Trolox equivalents (TE) [31].

2.6. In Vitro Starch Digestibility

The in vitro starch digestibility of the gluten-free bread samples was evaluated using the Megazyme K-DSTRS assay protocol [34]. This method quantitatively determines the fractions of rapidly digestible starch (RDS), slowly digestible starch (SDS), total digestible starch (TDS), and resistant starch (RS) based on their respective rates of enzymatic hydrolysis.
Following the established protocol, 0.5 g of the ground bread sample was placed in a reaction tube and pre-moistened with 0.5 mL of 95% (v/v) aqueous ethanol. Subsequently, 17.5 mL of sodium maleate buffer (50 mM, pH 6.0, supplemented with 2 mM CaCl2) was added, and the suspension was allowed to equilibrate for 5 min at 37 °C while being stirred continuously at 170 rpm. The digestion process was initiated by adding 2.5 mL of an enzyme mixture containing pancreatic α-amylase (PAA, Megazyme Ltd., Bray, Ireland) and amyloglucosidase (AMG, Megazyme Ltd., Bray, Ireland). To quantify the different digestible starch fractions, 1.0 mL samples were collected at specific time intervals: 20 min for RDS, 120 min for SDS, and 240 min for TDS. Each aliquot was immediately combined with 20.0 mL of 50 mM acetic acid and stirred vigorously to halt all enzymatic activity. Aliquots (2 mL) of these solutions were then centrifuged in microfuge tubes at 13,000 rpm for 5 min. After separation, 0.1 mL of the supernatant was incubated with a dilute AMG solution (110 U/mL) to ensure complete conversion of maltosaccharides to glucose. Finally, the glucose level was determined by measuring the absorbance at 510 nm using GOPOD reagent (Megazyme Ltd., Bray, Ireland) against a reagent blank.
The resistant starch (RS) content was determined from the residue remaining after 240 min of digestion. A 4.0 mL aliquot of the final reaction mixture was mixed with an equal volume of ethanol (95% v/v) to precipitate the starch, followed by centrifugation and washing steps to remove free glucose. The resulting pellet was dissolved in 1.7 M NaOH in an ice bath, neutralized with sodium acetate buffer (pH 3.8), and hydrolyzed to glucose using AMG. The released glucose was measured with GOPOD reagent as described above. All starch fractions were calculated as anhydroglucose using a conversion factor of 0.9 [34].

2.7. Data Modeling and Optimization of Gluten-Free Bread

Design-Expert software (version 12.0.3.0, Stat-Ease Inc., Minneapolis, MN, USA) was used to process the experimental results. To assess how the proportion of AF (0, 50, and 100%) and water addition (90, 100, and 110%) influenced the quality of the AFB, a 32 full factorial design (FFD) was implemented. The inclusion of central point replicates allowed for the estimation of experimental error and verification of model fitness.
The study employed RSM to model the relationships between the independent variables and response parameters, including color parameters (L*, a*, b*, DI), expansion (specific volume), textural attributes (hardness, springiness, resilience, cohesiveness, chewiness), crumb grain descriptors (cell density, average pore size, porosity), and sensory profiles. Each response was subjected to regression analysis, and ANOVA was used to evaluate the significance of the model components. Model adequacy was evaluated using coefficients of determination (R2, adjusted R2, and predicted R2), lack-of-fit assessments, and adequate precision. To illustrate the individual and synergistic effects of the ingredients, 3D response surface plots were generated.
Simultaneous optimization of multiple responses was carried out using the desirability function technique. This involved defining individual desirability functions (d) for each response, which were then scaled from 0 (undesirable) to 1 (optimal). The total desirability (D) for the formulation was determined by calculating the geometric mean of these individual functions.
During optimization, AF content and water addition were constrained within the experimental domain. Specific volume, springiness, porosity, and overall sensory score were maximized, while hardness was minimized. Other responses were kept within their experimental ranges to preserve realistic product characteristics. The highest importance was assigned to overall sensory score, reflecting its key role in determining product success. The ideal formulation was determined by identifying the point with the maximum overall desirability score.

2.8. Statistical Analysis

Bread samples were produced in three independent batches, and all measurements were performed in triplicate for each batch. Results are presented as mean ± standard deviation (SD). All statistical analyses were performed using Statistica® software (version 14.0.0.15, TIBCO Software Inc., Palo Alto, CA, USA).
The influence of the independent variables—AF incorporation level (0%, 50%, and 100%) and water addition level (90%, 100%, and 110%)—on the quality characteristics of the gluten-free bread was evaluated using RSM based on a 32 FFD. The suitability of the regression models and the significance of their various terms (linear, interaction, and quadratic) were established through ANOVA using the Design-Expert® platform (v. 12.0.3.0, Stat-Ease Inc., Minneapolis, MN, USA). To validate the accuracy of the results, lack-of-fit evaluations were conducted, and R2, adjusted R2, and predicted R2 values were determined. Additionally, adequate precision and the coefficient of variation (CV %) were monitored to confirm that the models could reliably navigate the experimental design space.
Statistical differences between the optimized acorn-enriched formulation and the 100% rice flour control (Section Quality and Sensory Evaluation of Optimized GFB and Control Bread2) were determined using an independent samples t-test. All results were evaluated at a 95% confidence interval, with the significance level set at p < 0.05.

3. Results and Discussion

The response surface behavior observed in this study should be interpreted in light of the markedly different physicochemical compositions of the two raw flours used (Table S1). Compared with RF, AF had substantially higher fat content (10.9% vs. 0.9%), total sugars (9.8% vs. 0.7%), and total dietary fiber, particularly the insoluble fraction (6.3% vs. 0.9%), while it contained lower protein content (3.7% vs. 8.3%). These compositional differences provide the physicochemical basis for the variations observed in hydration requirements, crumb structure, color development, texture, and sensory performance across the RSM design space.

3.1. Statistical Analysis and Model Adequacy

The application of RSM enabled a comprehensive evaluation of the effects of AF (A) and water addition (B) on multiple quality attributes of AFB. All fitted models were statistically significant (p < 0.05), with coefficients of determination (R2) ranging from 0.7143 (odor) to 0.9991 (DI), indicating that a substantial proportion of the experimental variability was explained (Table 2). According to Madhuresh et al. (2013) [5] and Rodríguez-España et al. (2025) [3], R2 values exceeding 0.70–0.80 indicate that the models are adequate for representing data within the experimental domain of GF systems.
The non-significant lack-of-fit (p > 0.05) for all responses confirm that the selected models adequately describe the experimental data, which is essential to ensure that the optimization process is reliable and not misleading [16,20]. The close agreement between adjusted and predicted R2 values for most responses (generally within a difference of less than 0.2) indicates good predictive ability [3]. The signal-to-noise ratio was also satisfactory, as the adequate precision values (8.19–85.77) were well above the recommended threshold of 4. Consequently, these results confirm the suitability of the models for navigating the design space with high reliability.
Quadratic models were required for the majority of responses, reflecting the inherent non-linearity of GF systems, where complex interactions between the fiber- and lipid-rich AF matrix (Table S1) and added water generate non-linear response surfaces [18,21]. However, linear models were sufficient for moisture, average pore size, and odor, while two-factor interaction (2FI) models were selected for resilience and cell density, suggesting simpler relationships for these specific responses within the studied factor range [5].

3.2. Effect of AF and Water Addition on Response Variables

3.2.1. Moisture Content

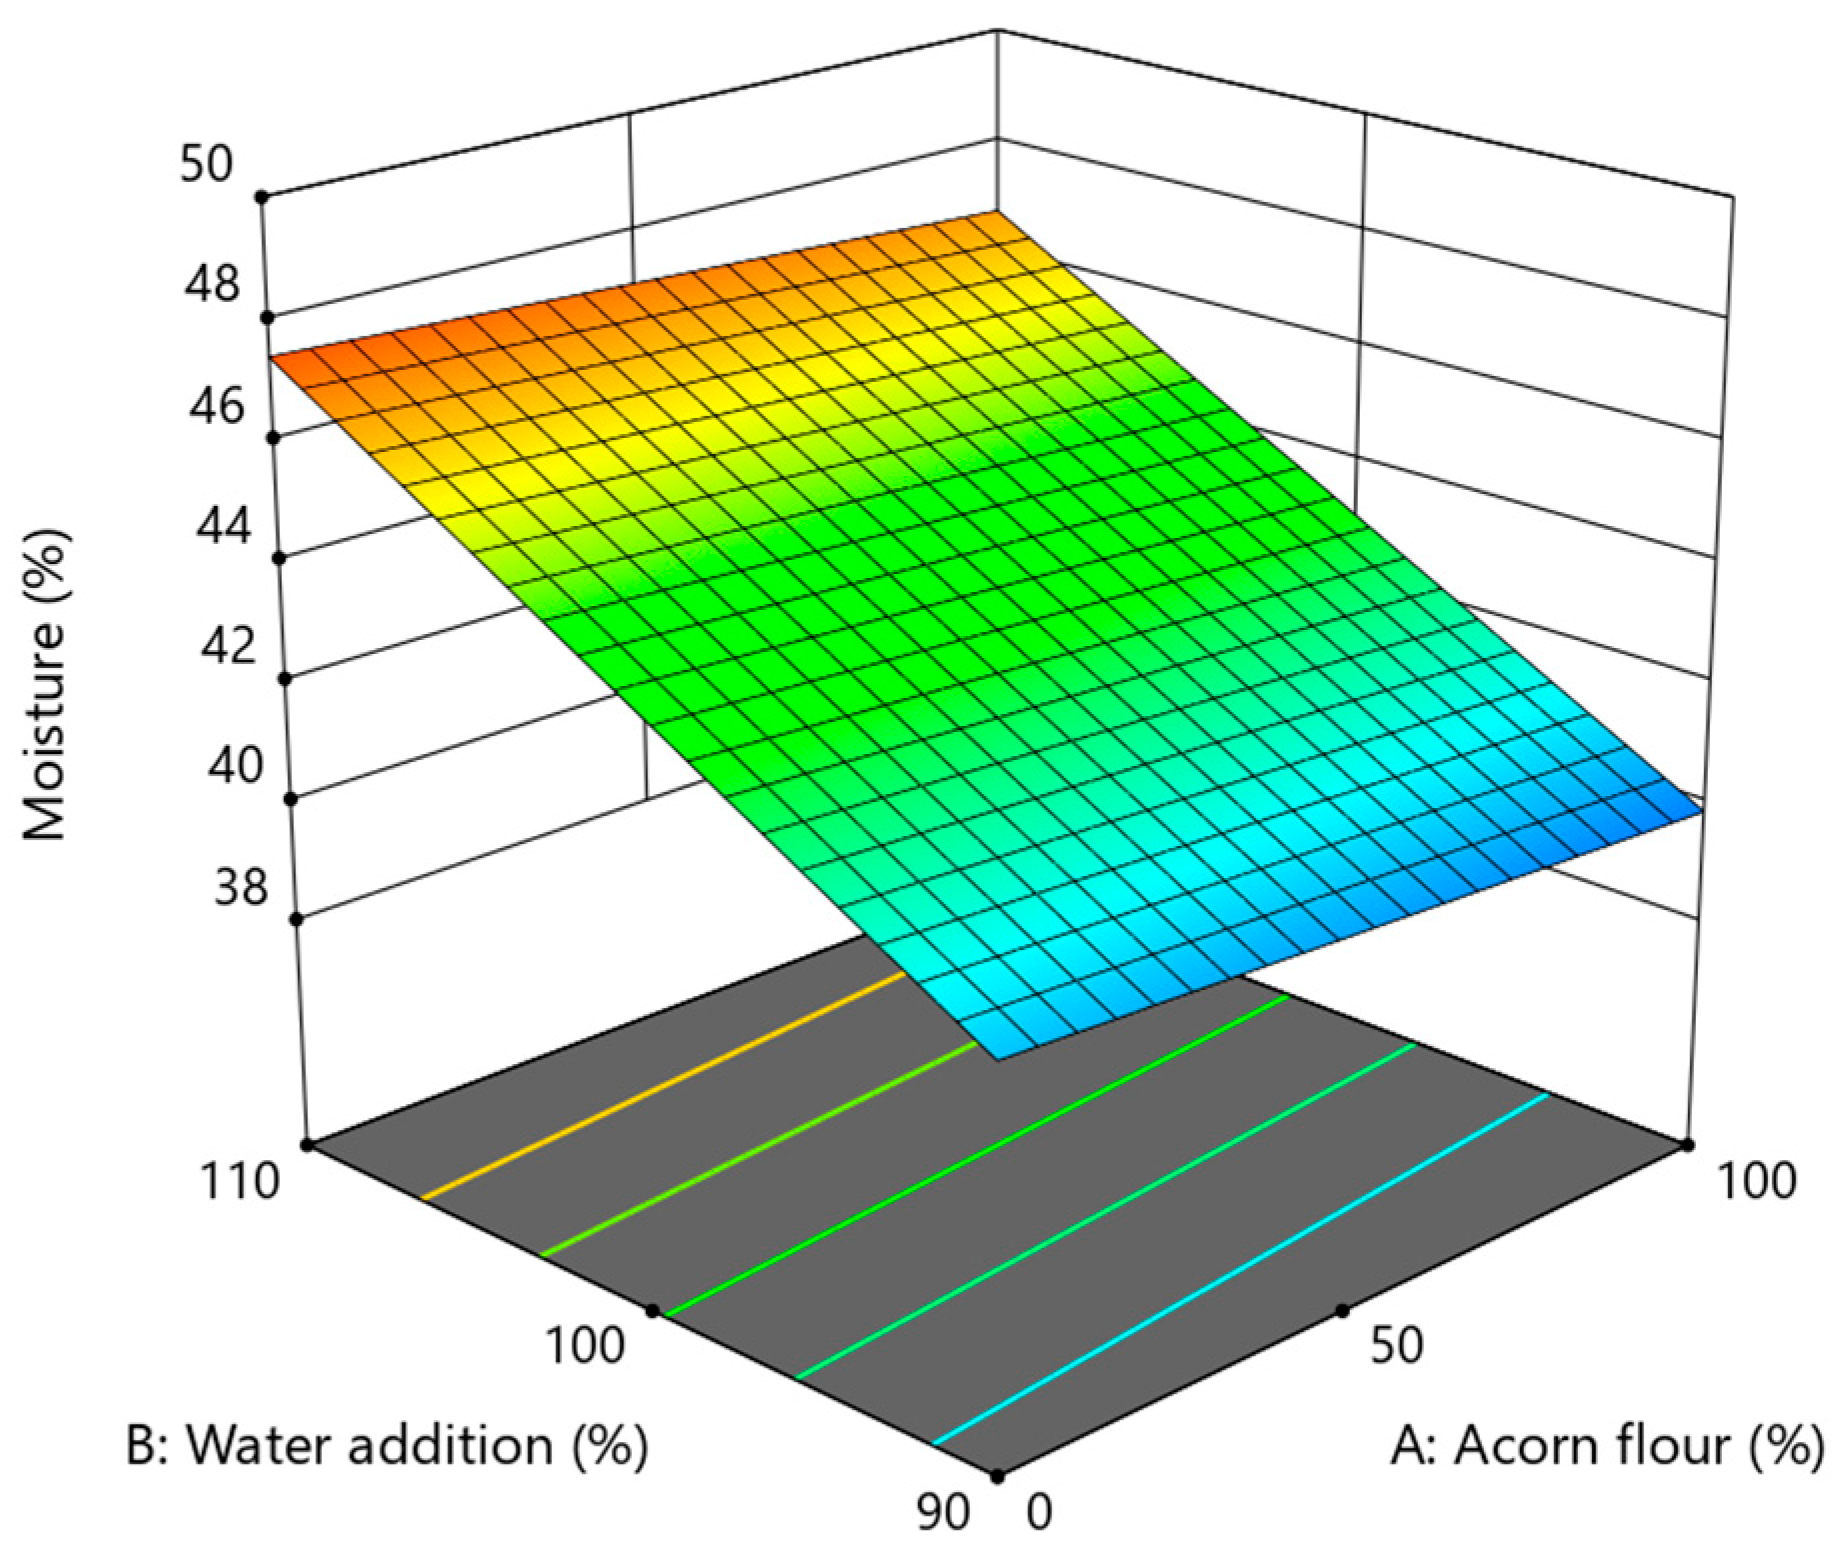
The moisture content of the AFB ranged from 38.80% to 48.14% (Table S22), with the trend clearly illustrated by the response surface shown in Figure 1. ANOVA results confirmed that the linear model was statistically significant (p = 0.0012), with water addition (B) identified as the only significant factor (p = 0.0004), exerting a strong positive linear effect (Table S2). Interestingly, the proportion of AF (A) did not significantly influence the final moisture content (p = 0.5969), despite the high total fiber content (11.40 g/100 g) and the substantial water-binding capacity (1.19 g/g) characteristic of Q. rotundifolia flour [13]. This suggests that, within the studied experimental domain, crumb moisture is primarily governed by the total amount of added water rather than the intrinsic water-binding capacity of the AF components. Similar behavior has been observed in other GFB systems based on legume and cereal flours, where water availability and its subsequent plasticizing effect tend to dominate over compositional differences in the flour matrix [17,21]. In highly hydrated GF batters, such as those with hydration levels of 90–110% used in this study, the abundance of unbound water likely masks the competitive moisture binding by fibers and starch [2,20]. The relationship between the factors and moisture content is described by a linear equation in terms of coded factors (Equation (S1)).

3.2.2. Color Parameters and Darkness Index

Color is a primary determinant of consumer acceptance in the bakery industry, particularly for GFB, which is often criticized for its characteristically pale and less appealing appearance [1,16]. In this study, the incorporation of AF (A) and water addition (B) resulted in significant changes in the crumb color profile.
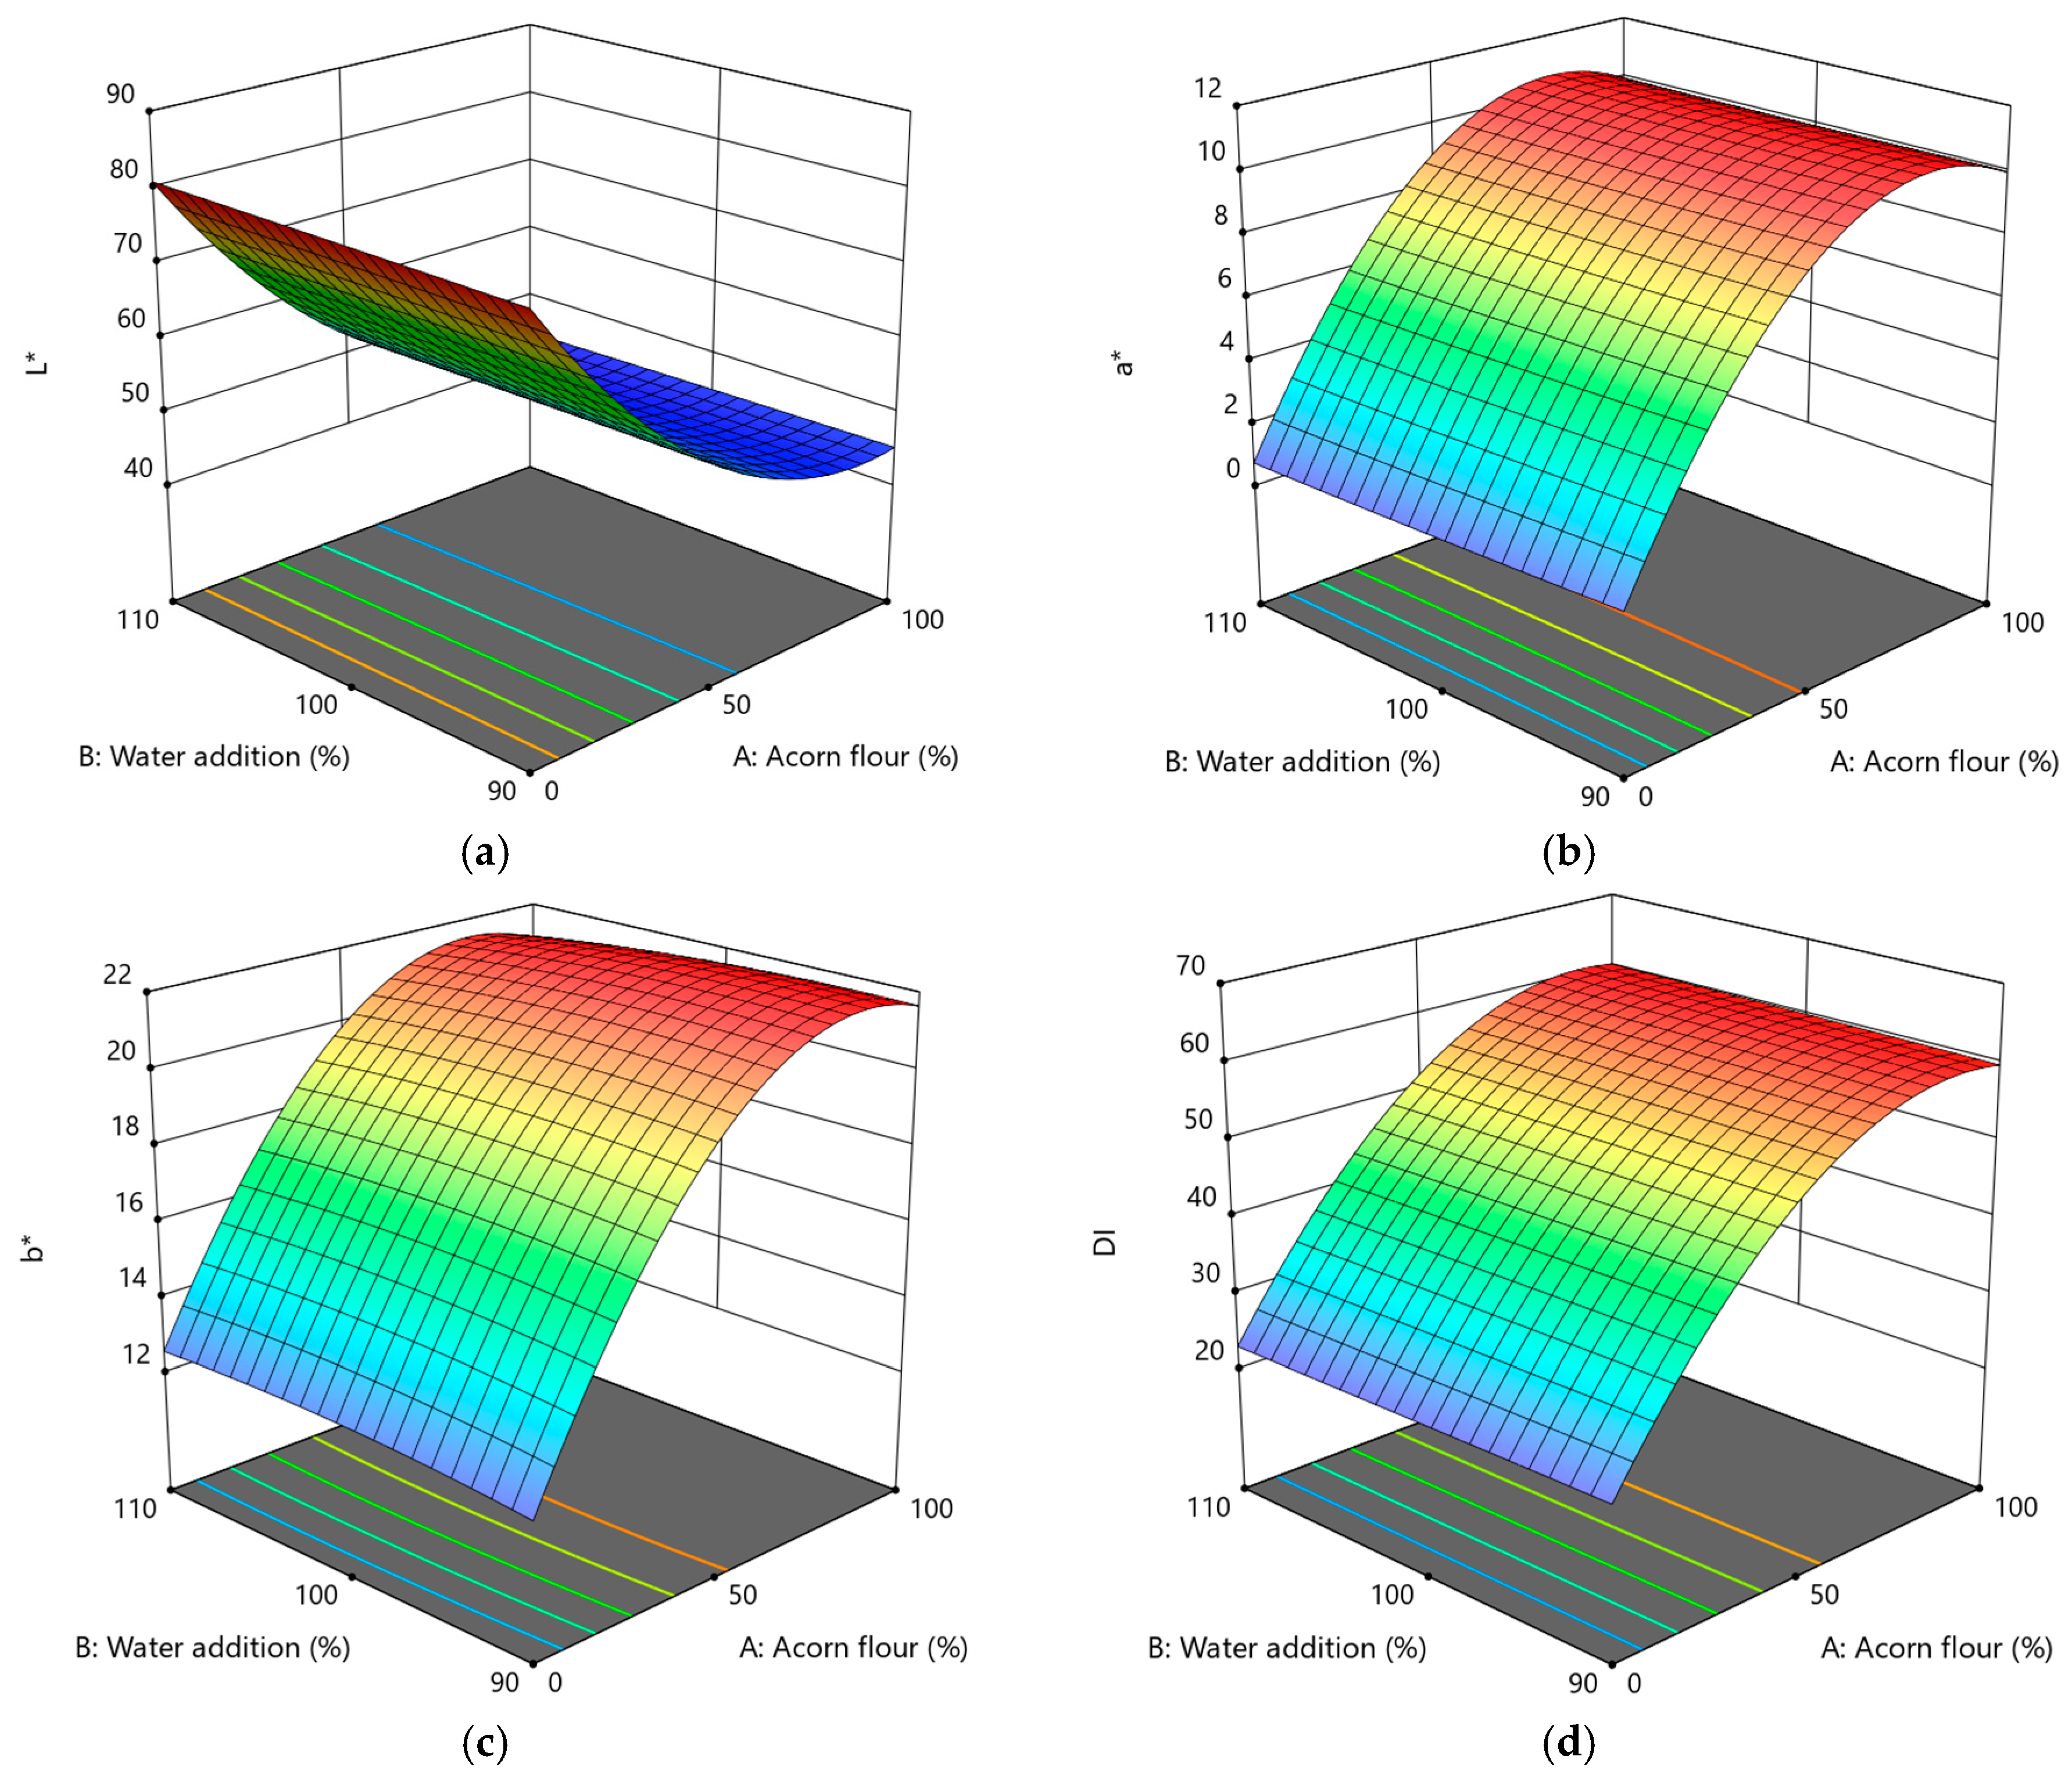
The lightness (L*) decreased significantly from 80.91 to 44.22 (Figure 2a, Table S23) as AF levels increased (p < 0.0001, Table S3). The ANOVA in Table S3 revealed that both linear (A) and quadratic (A2) terms of AF were highly significant (p < 0.0001), with the mathematical relationship defined by Equation (S2). The significant positive quadratic term (A2) indicates a plateauing effect in darkening at higher substitution levels, a trend also reported in GFB enriched with chestnut flour [16,23].
The redness (a*) coordinate increased significantly from 0.67 to 10.04 (Figure 2b, Table S22) with increasing acorn substitution level (p < 0.0001, Table S4). Similarly, the yellowness (b*) values (12.11 to 21.66, Figure 2c, Table S22) were strongly influenced by AF (p < 0.0001, Table S5). A significant negative interaction effect (AB, p = 0.0496) was identified for the b* coordinate, suggesting that higher water addition slightly attenuates the increase in yellowness at high levels of acorn substitution. This may be due to increased moisture content on the bread surface, which affects heat and mass transfer during baking, thereby influencing pigment concentration and surface color development [20,22].
The darkness index (DI), which reached a maximum of 60.46 in the 100% acorn formulation (Figure 2d, Table S22), confirmed the marked shift toward a darker, wholegrain-like appearance. While traditional GFB based on rice and potato starch often lacks color, the use of Q. rotundifolia provides a natural solution for achieving a rustic appearance that consumers associate with health and fiber content [14,35]. The specific phenolic profile of Q. rotundifolia—rich in gallic and syringic acids—facilitates the formation of complex-colored compounds during baking that are not present in typical cereal or pseudocereal GF flours [3,14]. These instrumental changes were reflected in the sensory evaluation, where the darker and more rustic appearance of AFB was rated higher than the control [1].
This browning is attributed to the high concentration of total phenolic compounds and tannins in Q. rotundifolia [1,12], which undergo phenolic oxidation during baking [13], as well as increased Maillard reactions associated with the higher sugar content of AF. Similar darkening has been reported for GFB enriched with carob or buckwheat flour [3,23].

3.2.3. Specific Volume

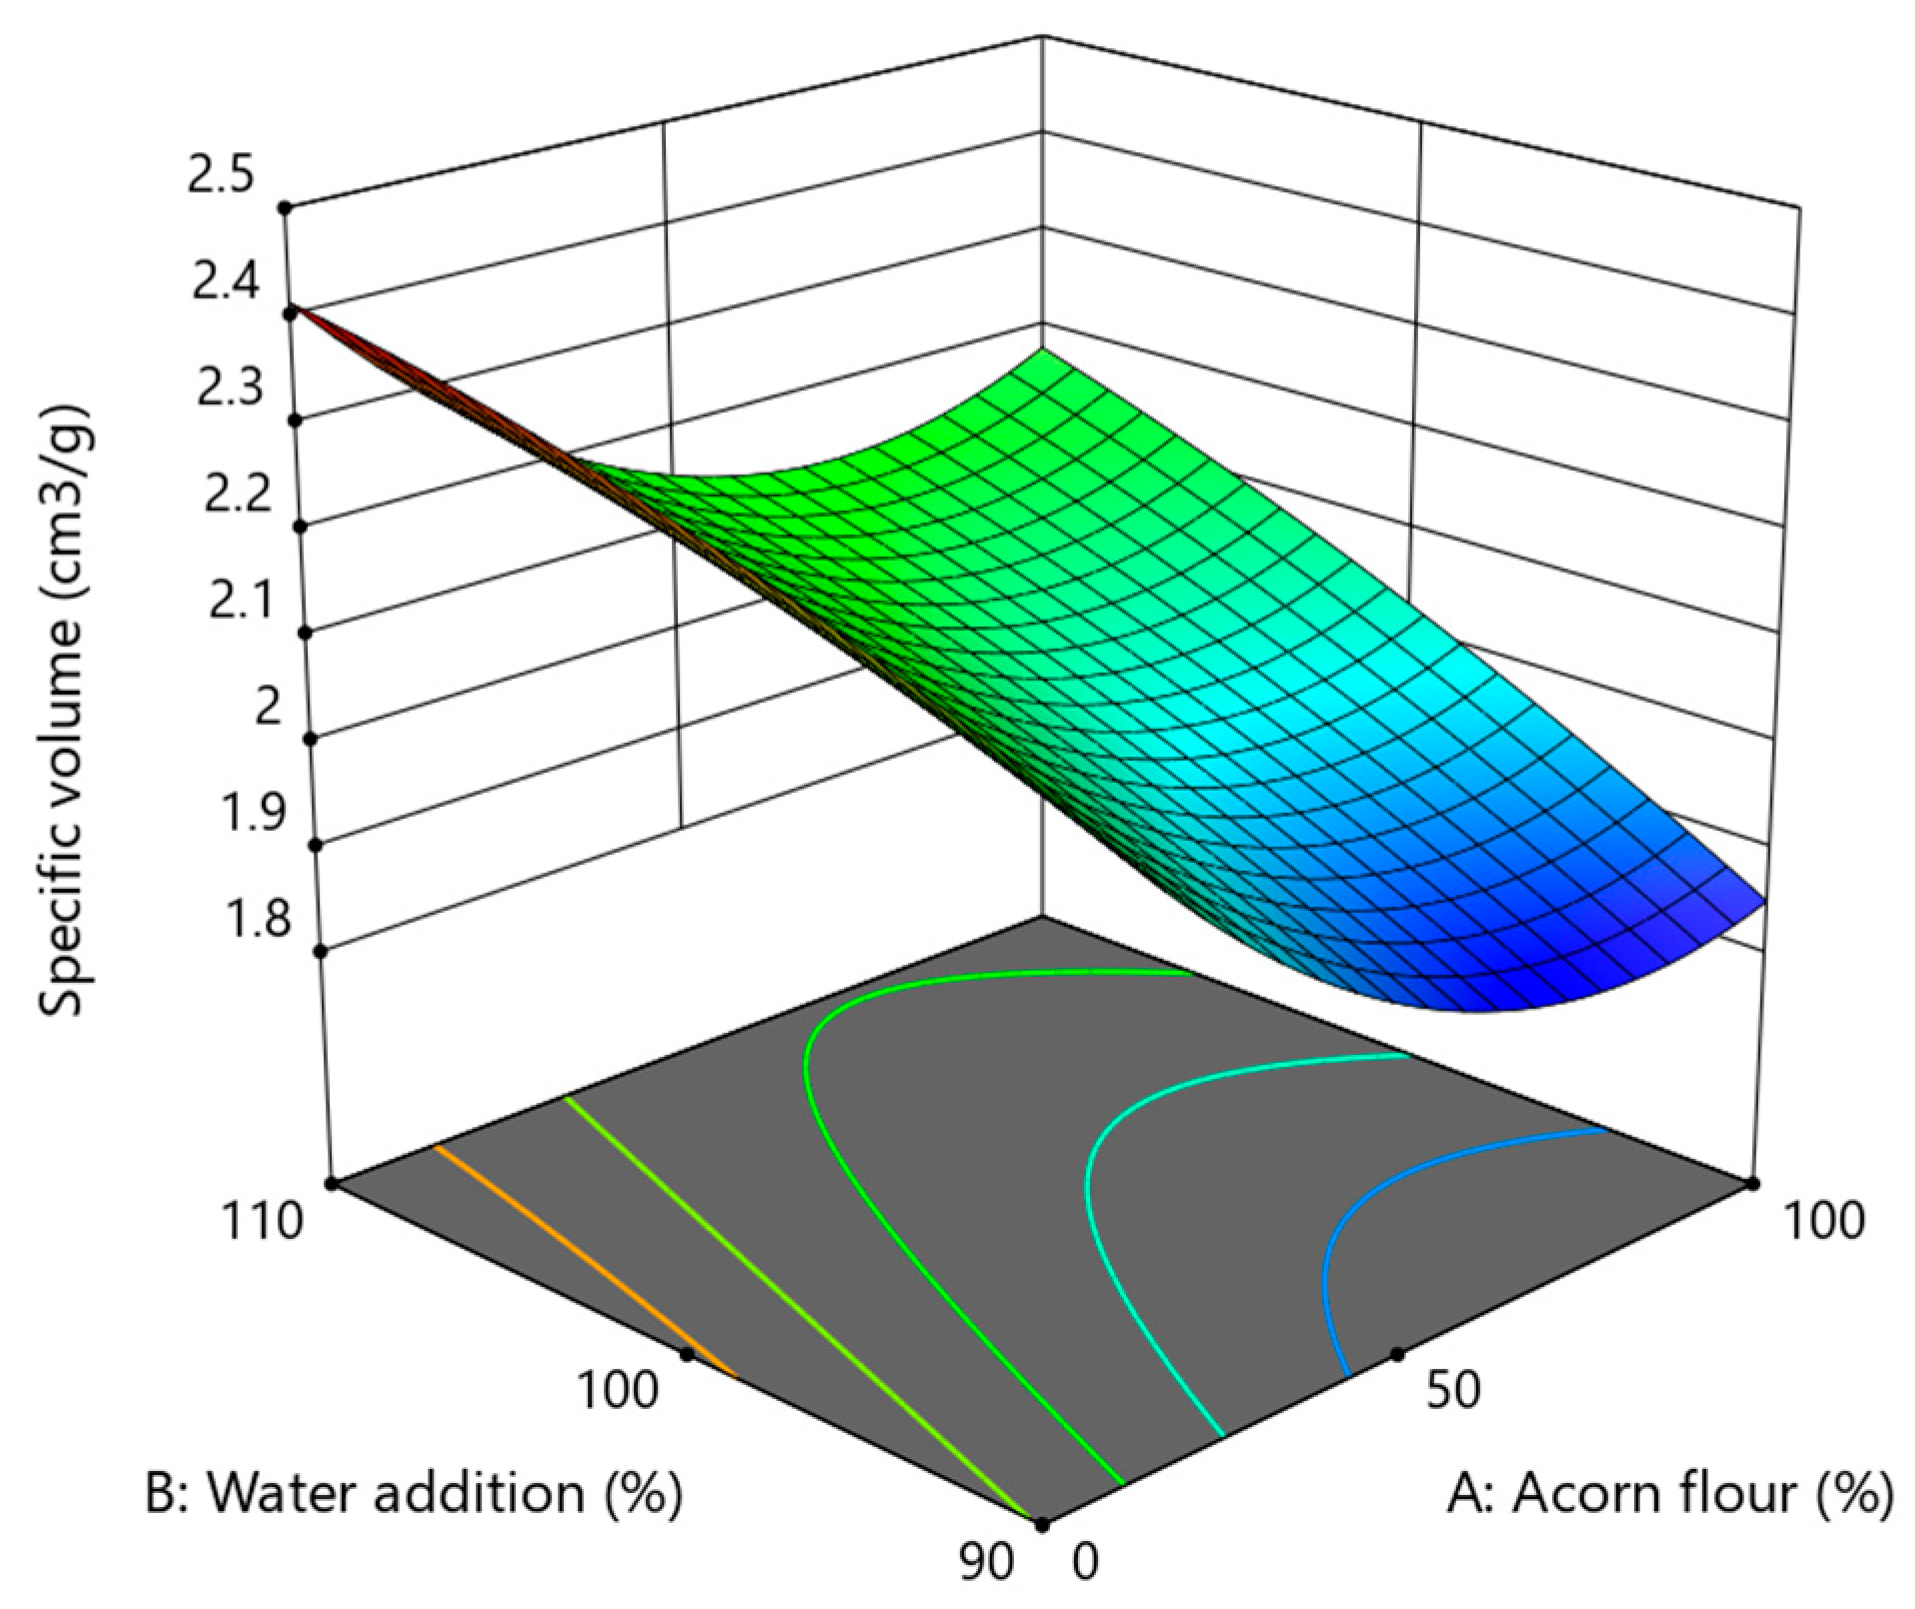
Specific volume is a primary indicator of GFB quality, directly reflecting the dough’s gas-retention capacity and the resulting crumb aeration [2,3]. In this study, the specific volume of AFB ranged from 1.85 to 2.41 cm3/g, as shown in the response surface plot (Figure 3, Table S22). Statistical validation using ANOVA confirmed that the quadratic model was statistically significant (p < 0.0001, Table S7). The results showed that loaf expansion was significantly affected (p < 0.05) by both independent variables (AF and water), their interaction (AB), and the quadratic effect of AF (A2).
The proportion of AF (A) showed a significant negative linear effect and a strong positive quadratic effect (A2, p < 0.0001), indicating that while initial substitution levels may hinder expansion, moderate to high levels can promote volume recovery when sufficient hydration is provided. This behavior is likely associated with the markedly different composition of acorn flour compared with rice flour, particularly its substantially higher fat and insoluble dietary fiber content (Table S1), which influences dough rheology, water distribution, and gas cell stability during proofing and baking [11,14].
Water addition (B) had a dominant positive linear effect (p < 0.0001), acting as a powerful plasticizer that reduces batter viscosity. This effect is especially important in acorn-enriched systems due to the high insoluble fiber content of AF (6.3%), which increases water demand compared with RF (0.9% insoluble fiber) [2,17]. The significant positive interaction (AB, p = 0.0104) indicates a synergistic effect between AF content and water addition, confirming that maximum volume is achieved when high substitution levels of AF are combined with high hydration (110%). This interaction highlights the importance of adequate hydration to ensure proper swelling of acorn fibers and starch, thereby mitigating the structure-weakening effects associated with high-fiber formulations [20,21]. The relationship between formulation variables and specific volume is described by the quadratic equation in coded factors (Equation (S6)).

3.2.4. Textural Properties

Texture is one of the most critical quality attributes of GFB, as the absence of a viscoelastic gluten network typically results in products that are rigid, brittle, and prone to rapid staling [3,17]. In this study, instrumental texture profile analysis (TPA) provided comprehensive data on the mechanical behavior of the acorn-enriched crumb.
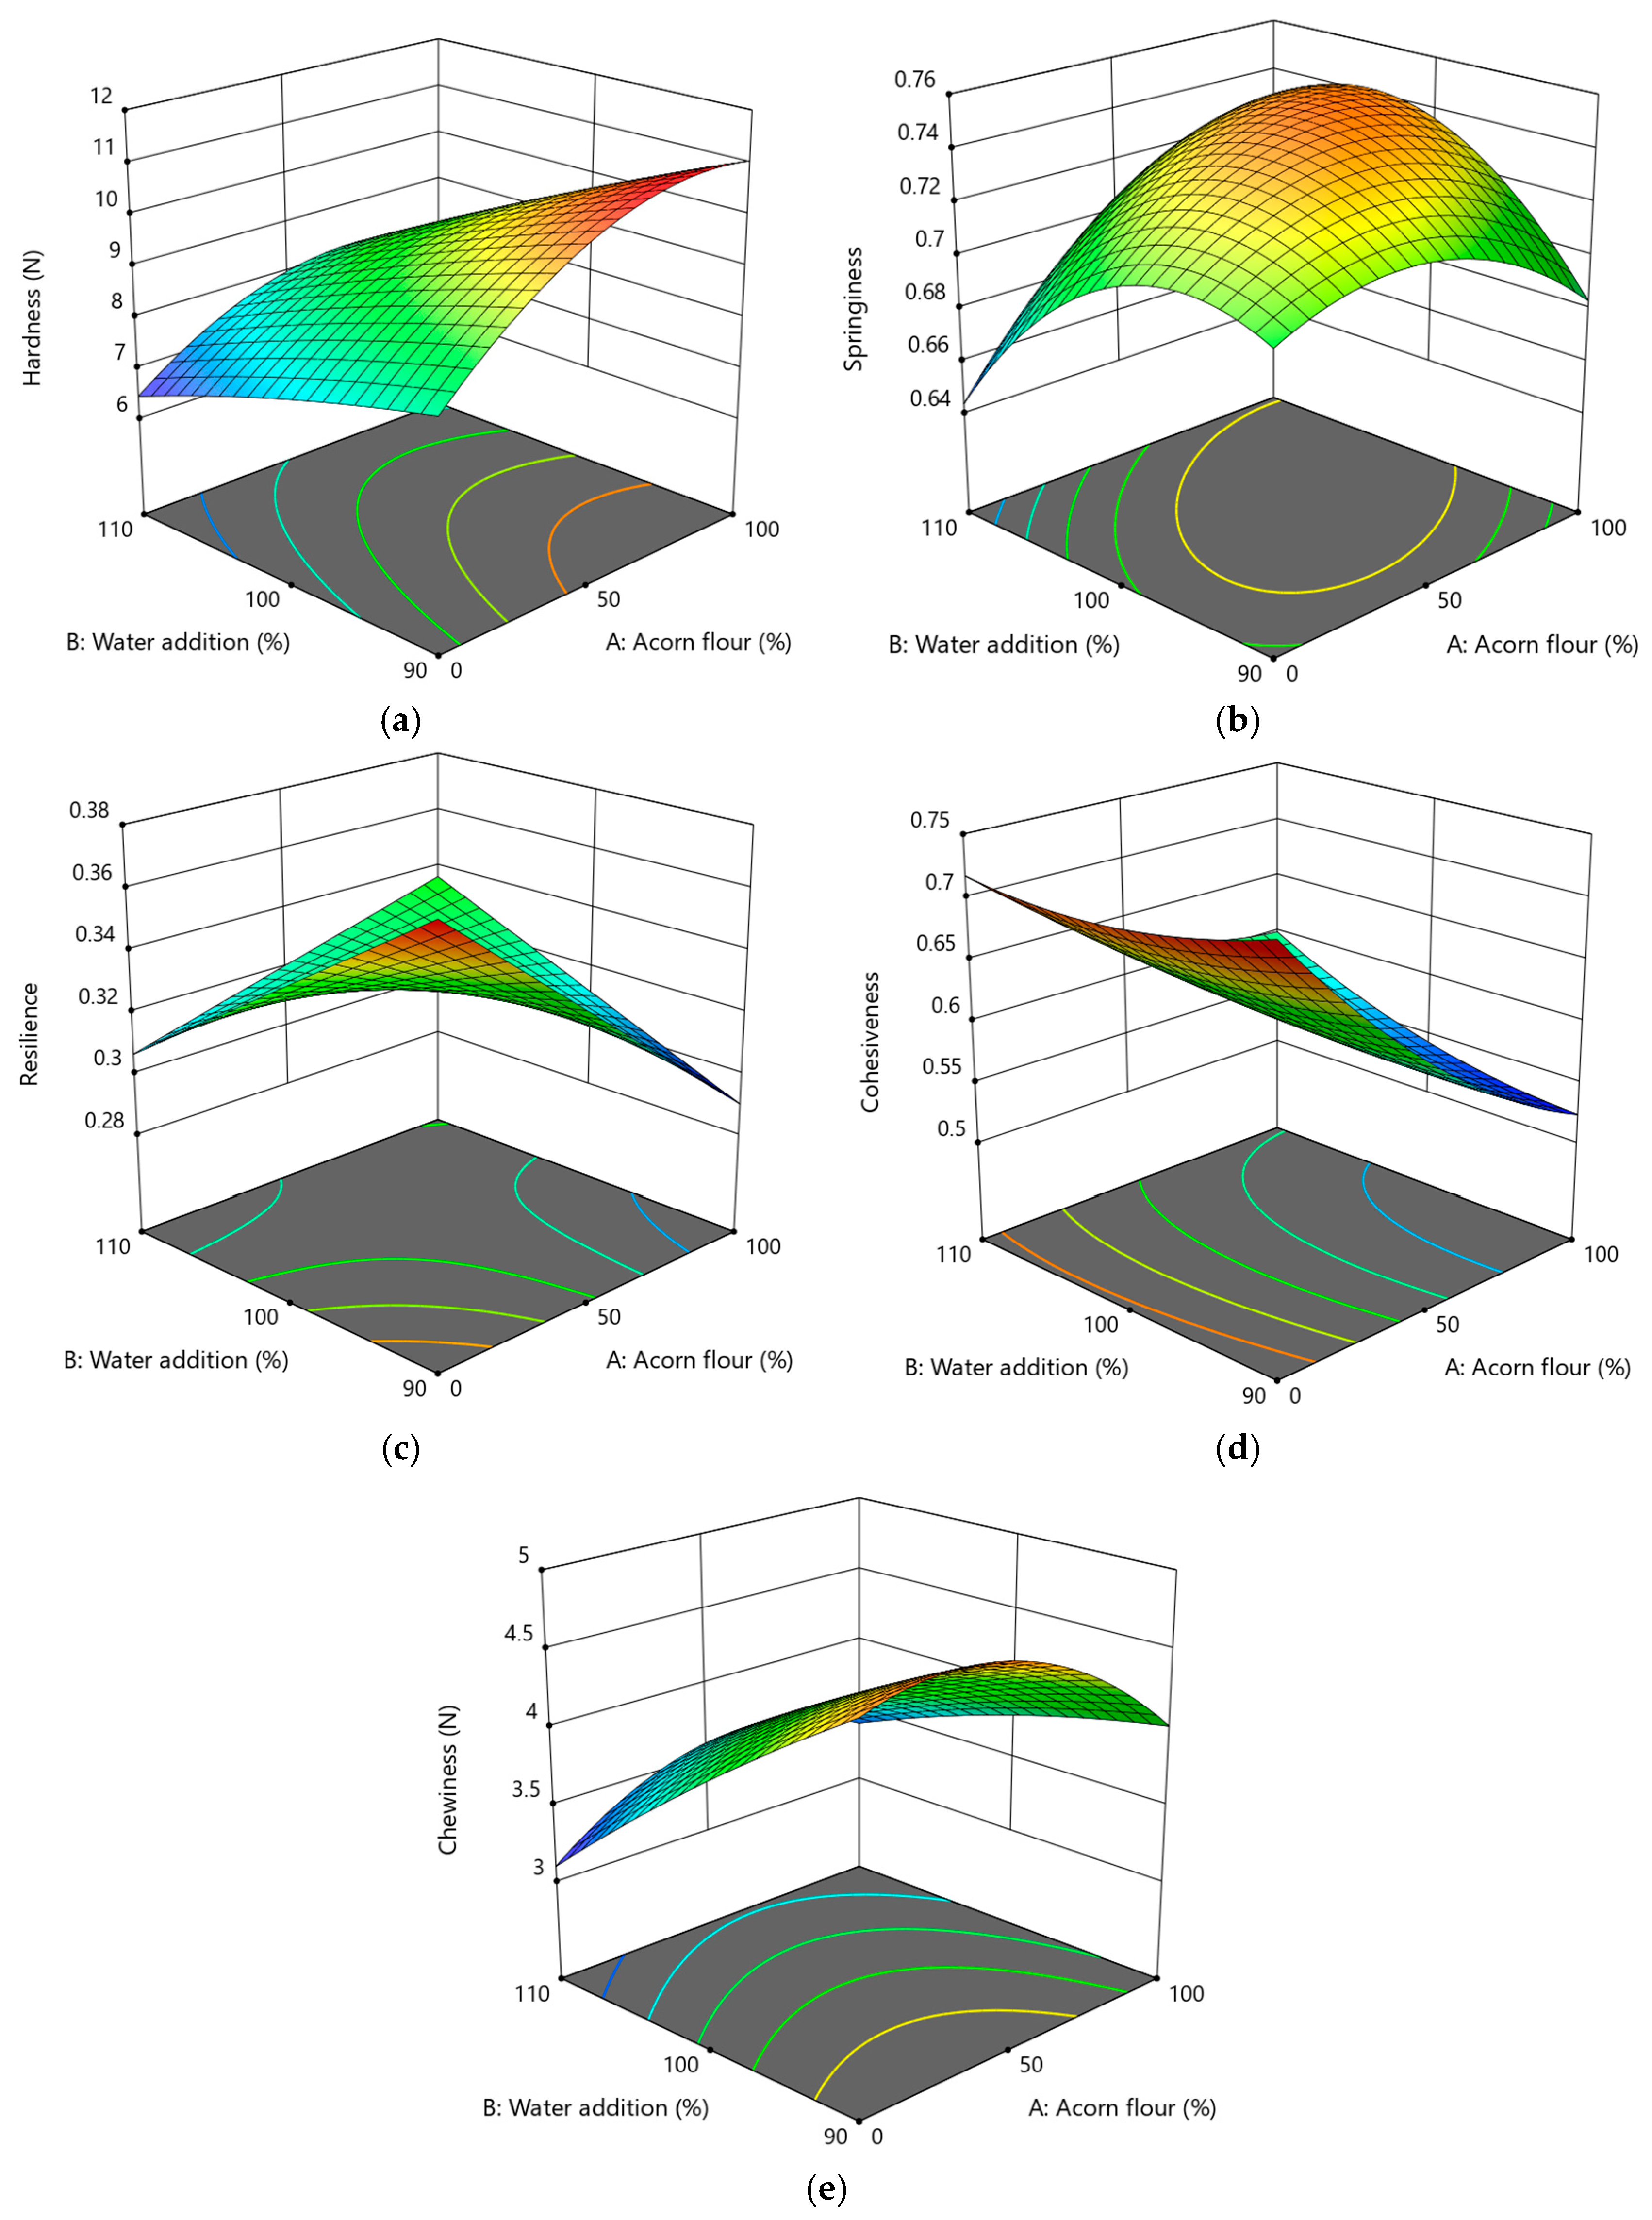
Crumb hardness, defined as the peak force during the first compression cycle, ranged from 6.68 N to 10.90 N (Figure 4a, Table S22). The ANOVA results in Table S8 confirmed that the quadratic model was statistically significant (p = 0.0003), with both AF substitution (A) and water addition (B) as primary determinants of crumb firmness. Increasing AF levels significantly increased hardness (p = 0.0004), consistent with the compositional characteristics of AF (Table S1), particularly its high insoluble dietary fiber content (6.3%) and elevated lipid fraction (10.9%) compared with RF [15]. These components likely interfere with the continuity of the starch–xanthan gum matrix, resulting in a denser and firmer crumb structure [14,20].
In contrast, water addition (B) acted as a strong softening agent (p = 0.0001). The requirement for increased hydration is directly supported by the flour composition data in Table S1, as the higher fiber content of AF necessitates additional water to maintain crumb softness and elasticity [2,17,21]. The significant negative quadratic term for AF (A2, p = 0.0057) indicates that the rate of hardening tends to plateau at higher substitution levels. This behavior may be related to the compositional characteristics of AF; acorn lipids and proteins have been suggested to act as natural surface-active compounds, potentially contributing to gas–cell stabilization, although this mechanism was not directly examined in this study [11]. The relationship between formulation variables and hardness is described by Equation (S7) in terms of coded factors.
Springiness and resilience are critical indicators of gluten-free bread quality, reflecting the ability of the structure to recover after deformation [3,20]. Springiness values ranged from 0.64 to 0.76 (Figure 4b, Table S22), while resilience varied from 0.29 and 0.38 (Figure 4c, Table S22).
ANOVA results indicated that the quadratic model for springiness was significant (p = 0.0013, Table S9), while a 2FI model best described resilience (p = 0.0063, Table S10). A defining feature for both responses was the highly significant positive interaction effect (AB) (p < 0.01).
The interaction between AF (A) and water addition (B) indicates that higher hydration levels (up to 110%) are essential for acorn-rich formulations to maintain elastic recovery. In fiber-enriched rice-based systems, water acts as a critical plasticizer that compensates for the lack of a gluten network by ensuring proper hydration of insoluble fibers and starch, thereby preventing the brittle and crumbly texture often associated with dry gluten-free bread products [20,23]. This is consistent with findings in pulse-based formulations, where increased water availability was necessary to achieve a spongy and flexible crumb matrix [17].
Additionally, the insoluble fibers in Q. rotundifolia provide secondary structural support to the dough matrix, helping to trap CO2 bubbles and maintain the crumb’s shape during baking [35]. However, the significant negative quadratic term for water addition on springiness (B2, p = 0.0026) suggests a technological limit; excessive hydration beyond the optimal point can dilute the structure-forming components, leading to a loss of elasticity [17,18]. The mathematical relationships for these parameters are described by Equations (S8) and (S9) in terms of coded factors.
Cohesiveness reflects internal integrity of the crumb and its resistance to disintegration [3,20]. In this study, cohesiveness values ranged from 0.52 to 0.73, as shown by the response surface in Figure 4d and Table S22.
The ANOVA results in Table S11 confirmed that the quadratic model was highly significant (p < 0.0001). The proportion of AF (A) had a dominant and highly significant negative linear effect (p < 0.0001), indicating a substantial decline in internal crumb strength as acorn levels increased. This trend has been reported in the literature for ingredients rich in insoluble fibers and fats incorporated into starch-hydrocolloid systems, where disruption of the polymeric matrix and weakening of starch–starch interactions have been observed [3,15,22]. Based on the composition of AF, its hydrophobic components and high fiber content may limit water availability for starch gelatinization and hydrocolloid hydration; however, these mechanisms were not directly evaluated in this study [15,19].
However, the significant positive interaction effect (AB, p = 0.0049) shows that optimizing water addition (B) can effectively mitigate this loss of structural integrity. At higher substitution levels, hydration improves phase distribution and promotes the formation of a more continuous matrix [2,17,19]. The mathematical relationship between the formulation variables and crumb cohesiveness is described by the quadratic equation in terms of coded factors (Equation (S10)).
Chewiness represents the energy required to masticate the bread and is a function of hardness, cohesiveness, and springiness [3,20]. In this study, chewiness values ranged from 3.23 N to 4.93 N, as shown in the response surface plot in Figure 4e and Table S22.
The ANOVA results in Table S12 confirmed that the quadratic model was significant (p = 0.0068). The analysis revealed that water addition (B) was the dominant factor influencing this response (p = 0.0009), exerting a strong negative linear effect. This indicates that increasing hydration significantly reduces the mechanical work required to break down the crumb during consumption. Water acts as a primary plasticizer in the GFB matrix, facilitating a more aerated and less dense structure that offers lower resistance during mastication [2,17,21].
While the linear effect of AF (A) was not statistically significant (p = 0.3447), its quadratic term (A2) showed a significant effect (p = 0.0400). This suggests a non-linear relationship in which the impact of acorn solids on masticatory energy stabilizes at higher substitution levels. The high insoluble fiber and lipid content of Q. rotundifolia introduce structural complexity that typically increases the work of mastication by disrupting the starch–xanthan gum matrix [13,20]. However, the results confirm that high hydration levels (up to 110%) play a critical compensatory role, managing this complexity and ensuring a product that remains sufficiently soft and easy to chew [2,3]. The relationship between formulation variables and chewiness is mathematically described by Equation (S11) in terms of coded factors.

3.2.5. Crumb Structure

The internal morphology of the bread crumb, often referred to as crumb grain, is a critical quality attribute that determines visual appearance and consumer acceptance [23,36]. In this study, crumb structure was quantitatively assessed using image analysis, providing objective data on pore distribution and crumb porosity.
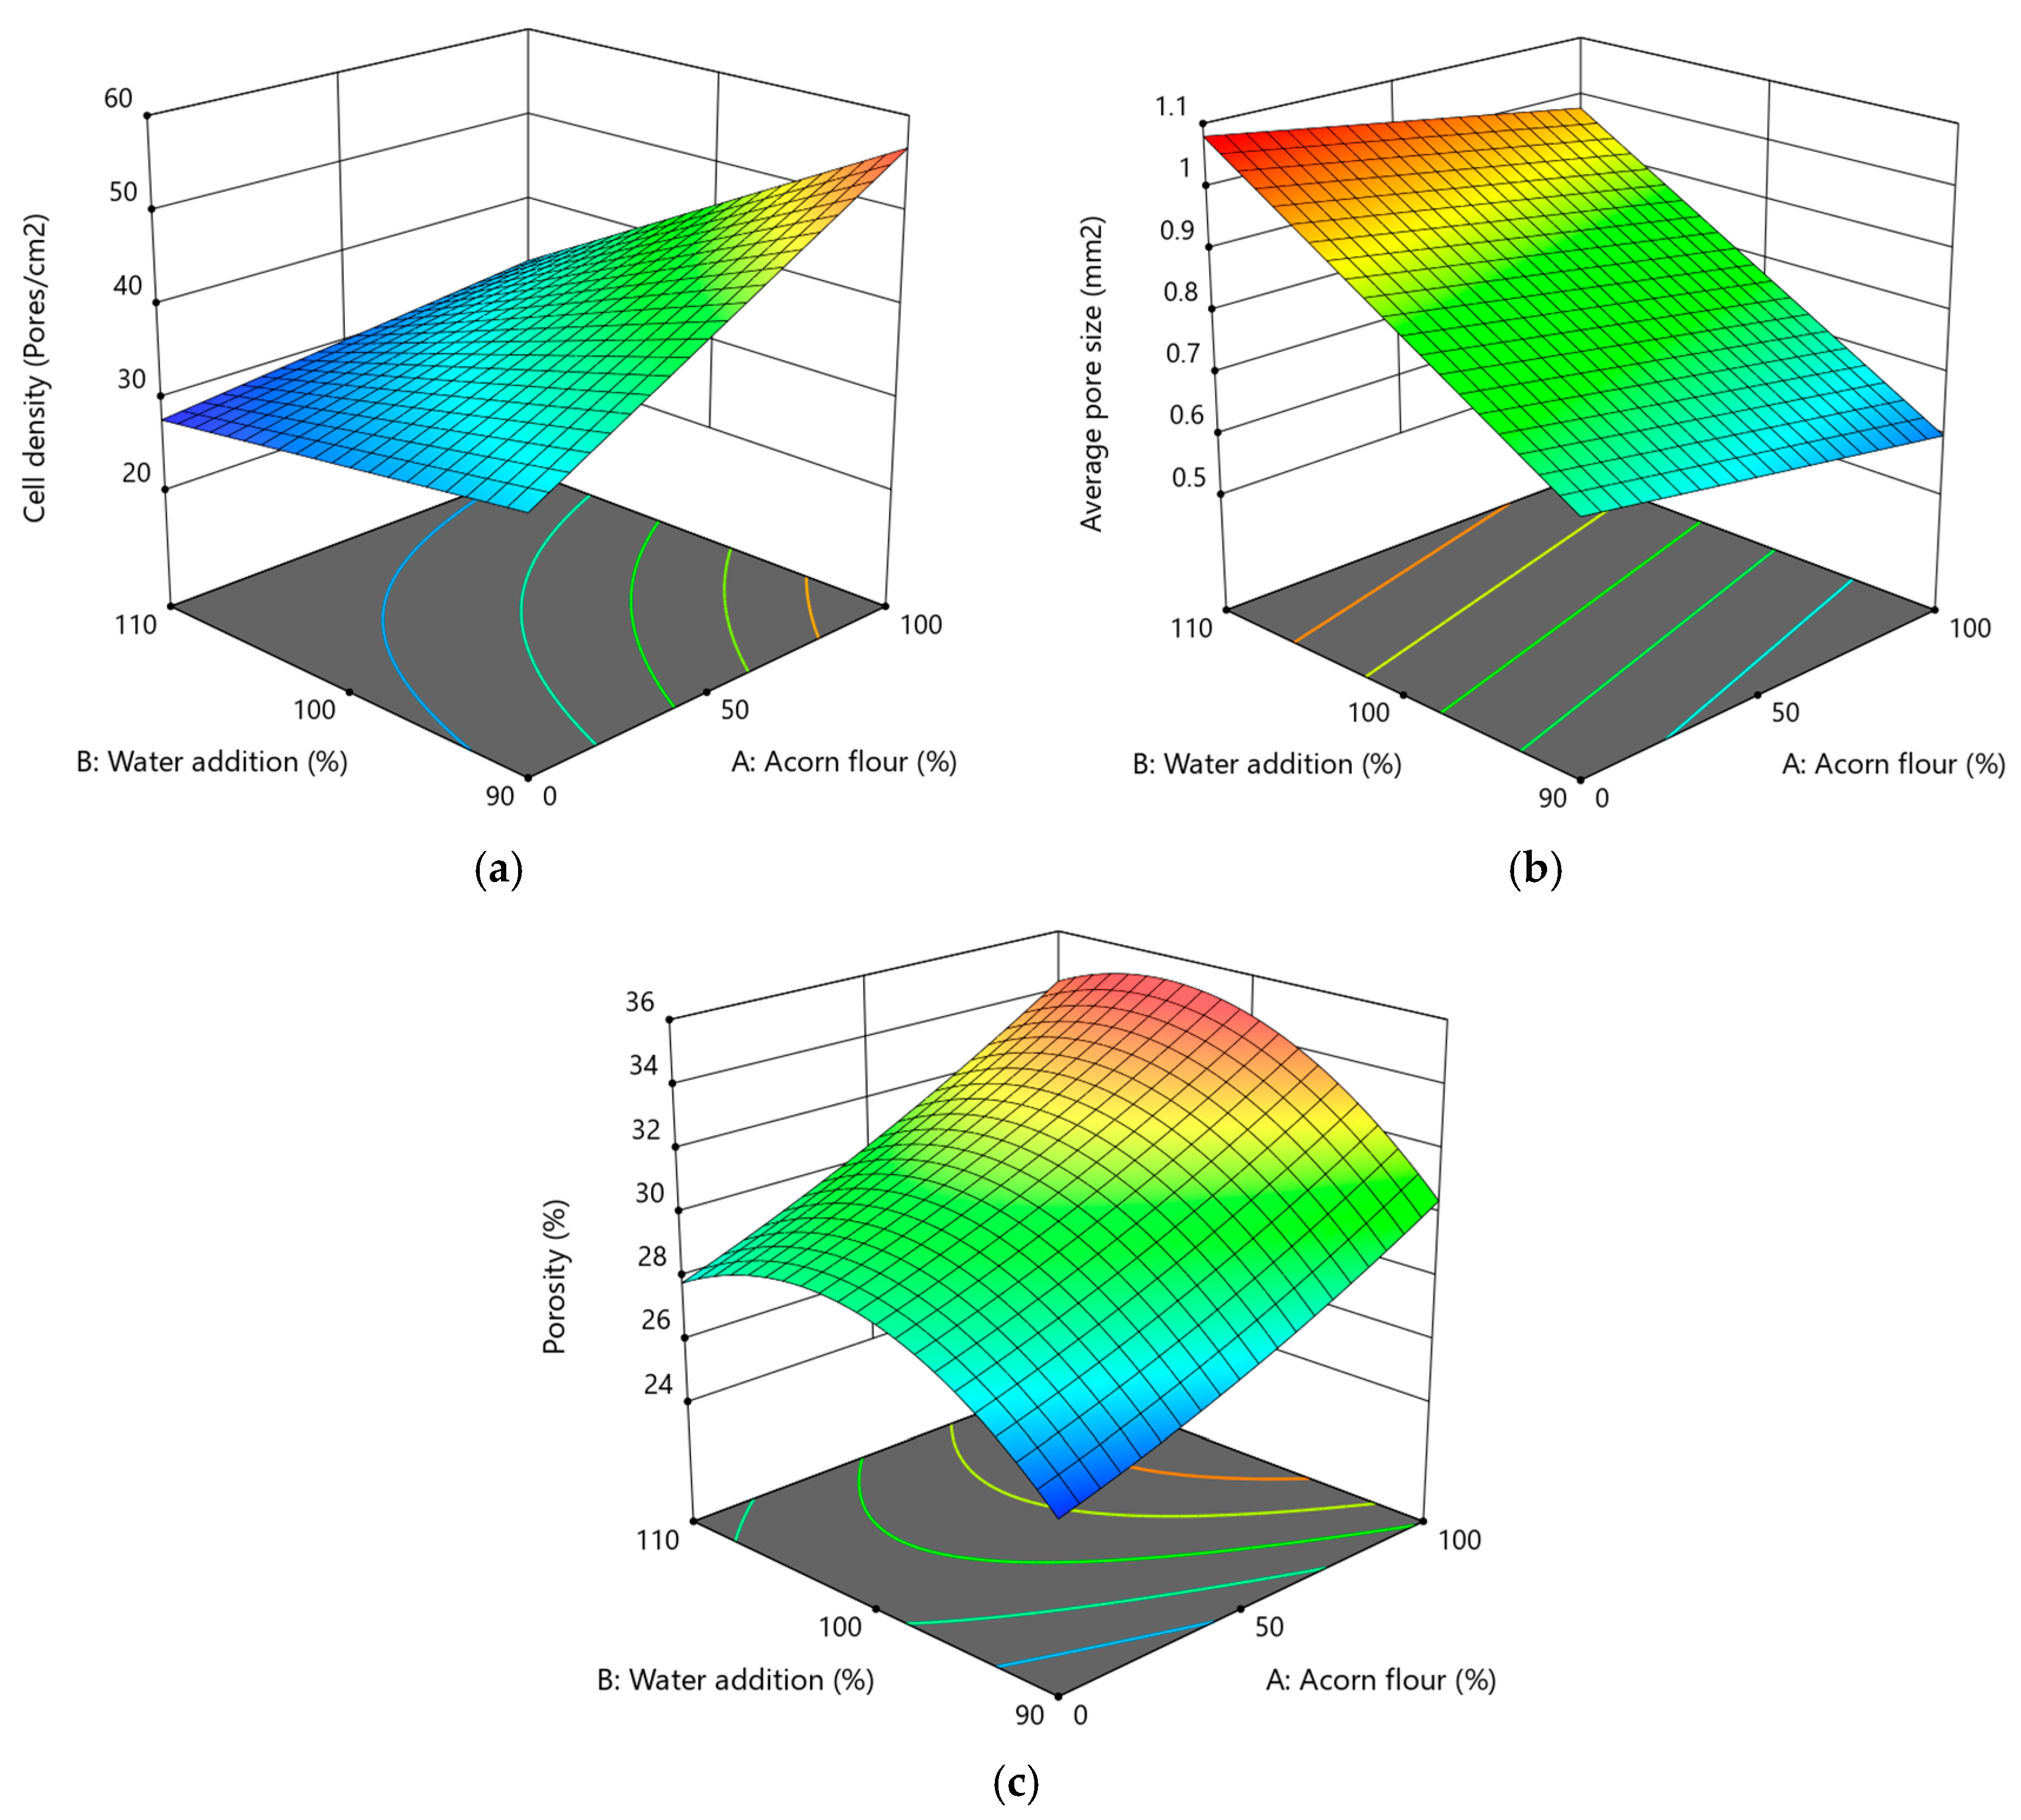
Cell density of the AFB ranged from 27.81 to 56.84 pores/cm2 (Figure 5a, Table S23). The 2FI model was highly significant (p < 0.0001, Table S13), showing that AF substitution (A) and water addition (B) had opposing linear effects on cell density. Increasing the proportion of AF significantly increased cell density (p = 0.0001), which can be attributed to the compositional differences presented in Table S1, particularly the substantially higher insoluble fiber content of AF. This higher fiber fraction increases batter viscosity and restricts gas bubble expansion, resulting in a finer crumb structure with more numerous but smaller pores. Water addition significantly reduced cell density (p = 0.0001). The significant negative interaction effect (AB, p = 0.0077) indicates that the effect of AF on refining crumb structure is most pronounced at lower hydration levels. This trend aligns with findings in high-fiber systems, where increased fiber content leads to a denser crumb with smaller and more numerous air cells [20,22]. At low water levels, the increased viscosity of the acorn-enriched batter—driven by the high water-binding capacity of Q. rotundifolia fiber—limits the expansion of gas nuclei, resulting in a more compact and finely structured matrix [21,23]. The mathematical relationship is defined by Equation (S12) in terms of coded factors.
The internal microstructure of the crumb, particularly the size and distribution of gas cells, significantly affects the perceived quality and mouthfeel of GFB [23,36]. In this study, the average pore size of the AFB ranged from 0.53 mm2 to 1.07 mm2, as shown in the response surface in Figure 5b (Table S23).
ANOVA results, presented in Table S14, confirmed that the linear model was highly significant (p = 0.0005) and that this structural attribute was primarily governed by water addition (B) (p = 0.0002). In contrast, the proportion of AF (A) did not have a statistically significant influence on pore size (p = 0.1318) within the studied range.
Higher hydration levels are known to reduce batter viscosity, thereby lowering the mechanical resistance to the expansion of CO2 bubbles during proofing and the early stages of baking [2,17]. This effect is particularly relevant in AF-rich formulations due to their higher water-binding capacity, which is associated with the increased fiber content. This reduction in viscosity promotes the coalescence of smaller bubbles into larger pores, resulting in a more open and aerated crumb structure, typical of artisanal-style breads [23,37].
While previous studies in pulse-based systems have observed a quadratic limit where excessive water addition causes bubble instability and structural collapse [17,18], the average pore size in this AF system followed a linear trend across the 90–110% hydration range (Equation (S14)). This suggests that the starch–xanthan gum matrix maintains sufficient integrity to support pore expansion without premature coalescence. Based on literature evidence, the lipid and amylose content of AF have been proposed as potential contributing factors to such stabilization, though this was not directly investigated here [11,14]. The mathematical relationship is described by the linear equation in coded factors (Equation (S13)).
Porosity, which quantifies the total volume fraction of air cells within the crumb, is a key indicator of aeration and perceived lightness in GFB [23,36]. In this study, porosity ranged from 25.20% to 34.80%, as shown in Figure 5c (Table S23).
The ANOVA results in Table S15 confirmed that the quadratic model was highly significant (p = 0.0003). The analysis showed that porosity was significantly influenced by both primary factors, with AF substitution (A) having a dominant positive linear effect (p < 0.0001). Water addition (B) also had a significant positive linear effect (p = 0.0017). Unlike cell density, the interaction effect (AB) was not statistically significant for porosity (p = 0.3910), indicating that AF and hydration independently contribute to gas retention within the studied domain.
The substantial improvement in porosity at higher AF levels may be explained by the combined effect of increased lipid content and optimized hydration, as indicated by the compositional differences in Table S1. The increased lipid fraction may contribute to improved gas–cell stabilization, while sufficient water addition supports pore expansion and matrix continuity. According to published literature, AF’s high lipid content and specific proteins have been proposed to act as natural surfactants capable of stabilizing gas–cell interfaces and preventing bubble coalescence, similarly to egg white proteins or added emulsifiers in other GF systems [3,12,14,38]. Additionally, the reportedly high amylose content of acorn starch (~50%) has been associated in the literature with the formation of a more rigid crumb structure upon cooling [11,14].
However, the significant negative quadratic term for water (B2, p = 0.0015) highlights a technological limitation, as excessive hydration can reduce porosity by diluting the structure-forming matrix and causing potential bubble instability [17,18]. These results confirm that AF is not merely a nutritional filler but also a functional structure-forming agent component that significantly enhances the physical aeration of gluten-free bread [1]. The mathematical relationship is described by the quadratic model expressed in coded factors (Equation (S14)).

3.2.6. Sensory Evaluation

Sensory quality remains the primary challenge in developing GF products, as the absence of a viscoelastic protein network often results in inferior mouthfeel, a pale appearance, and bland flavor profiles [17,37]. In this study, the incorporation of AF (A) and the optimization of water addition (B) significantly affected all sensory attributes, generally enhancing the bread’s profile compared to traditional rice-based formulations [1].
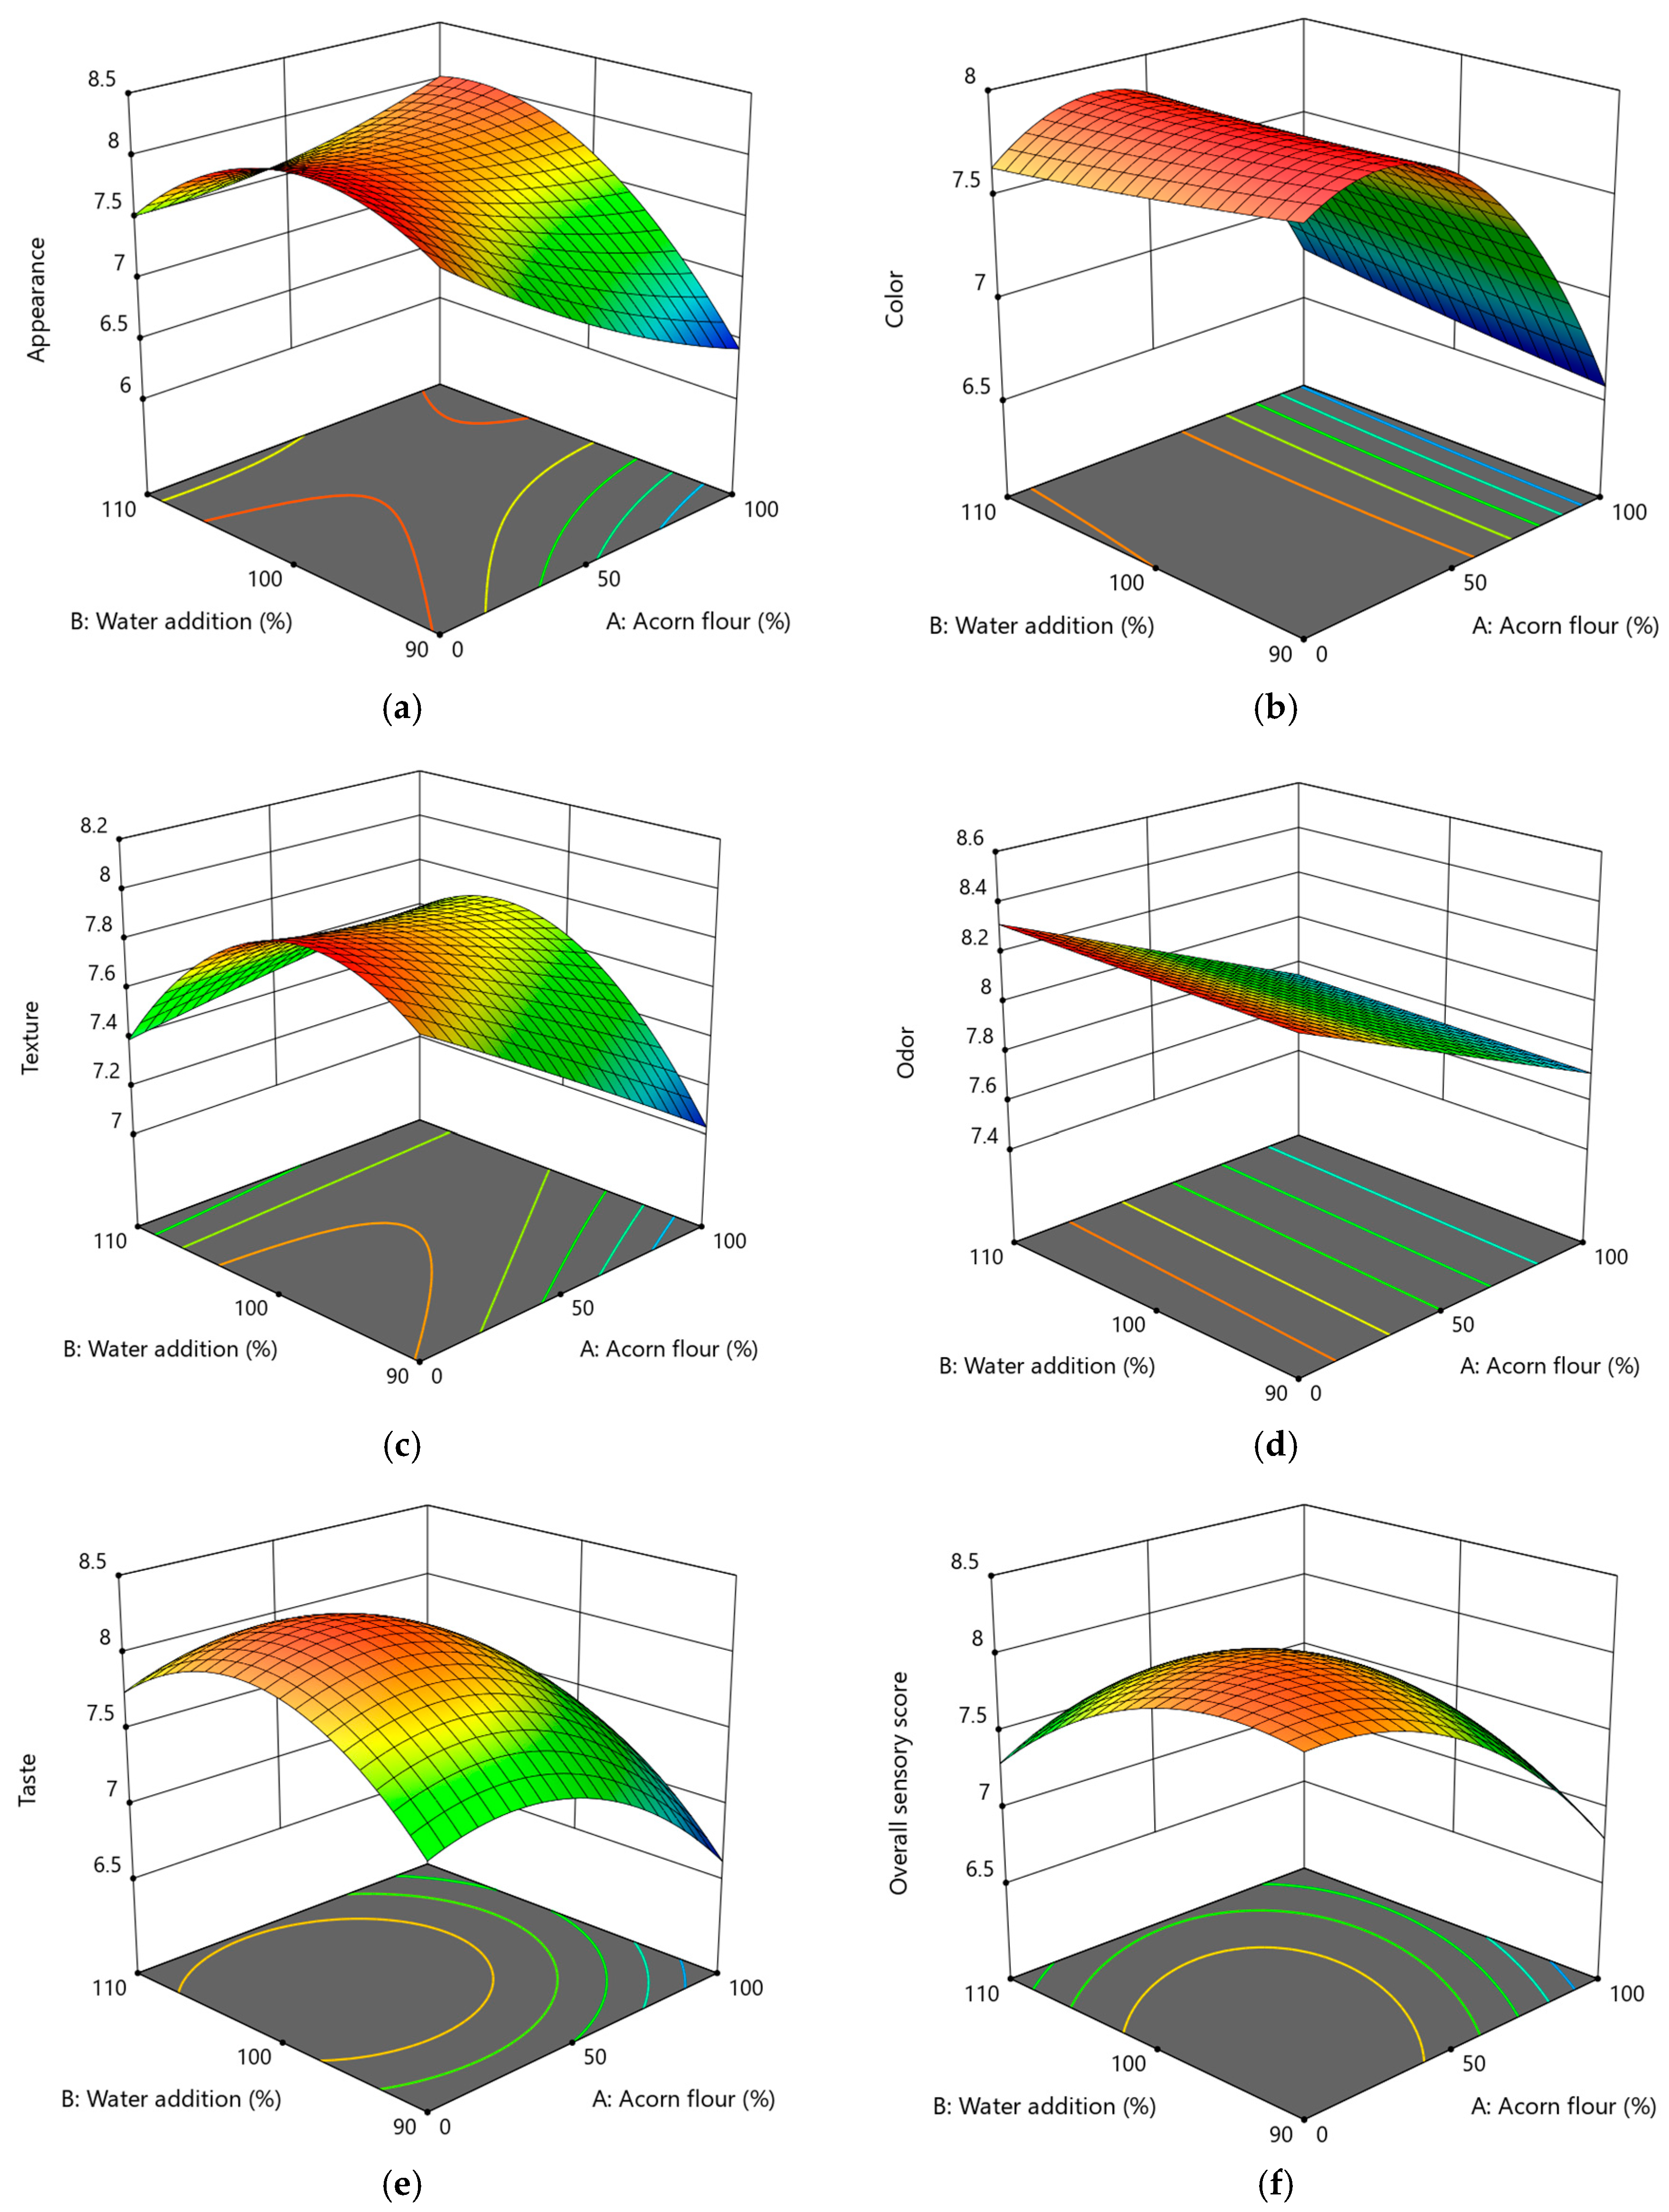
The sensory ratings for appearance ranged from 6.4 to 8.1, as shown in the response surface in Figure 6a, Table S24. ANOVA results (Table S16) identified a highly significant interaction effect (AB, p < 0.0001) and a negative quadratic effect of water (B2, p = 0.0002). This indicates that the visual appeal of the bread depends on a delicate balance between AF content and hydration levels, which is essential for proper loaf expansion and crust development [2]. The relationship for appearance is defined by Equation (S15) in coded factors terms.
Color acceptability is a primary determinant of consumer preference for GFB, which has historically been criticized for its characteristically pale, starch-like appearance [1,20]. In this study, sensory ratings for crumb color ranged from 6.6 to 7.9, as shown in the response surface in Figure 6b, Table S24.
The ANOVA results (Table S17) confirmed that the quadratic model was significant (p < 0.0001). Color acceptability was predominantly driven by the level of AF substitution (A), with both linear and quadratic terms being highly significant (p < 0.0001). In contrast, water addition (B) and the interaction effect (AB) did not have a statistically significant influence on this sensory attribute (p > 0.05).
While instrumental color analysis showed a marked decrease in lightness (L*) and a substantial increase in the darkness index (DI), sensory panelists responded positively to the darker crumb. This shift toward “rustic,” “wholegrain-like,” and “artisan-style” visual attributes is considered a significant quality improvement in the GF market [14,20]. The pronounced browning is attributed to enhanced Maillard reactions and high phenolic content—particularly gallic and syringic acids—as well as the tannin-rich profile of Q. rotundifolia acorns, which facilitate phenolic oxidation during baking [12,14].
Consumers’ association of darker colors with high fiber content and traditional bread aesthetics likely contributed to the high scores, even at substitution levels where the bread was instrumentally very dark [1,16]. The relationship between formulation variables and sensory color scores is mathematically defined by the following quadratic equation in coded factors (Equation (S16)).
Sensory texture is a critical attribute for the commercial viability of GFB, as consumers specifically seek products that mimic the elastic and cohesive mouthfeel characteristic of gluten-containing breads [3,17]. In this study, sensory texture scores ranged from 7.0 to 8.0, with the highest ratings observed in formulations combining high levels of AF with high hydration, as shown in the response surface in Figure 6c, Table S24.
The ANOVA results (Table S18) confirmed that the quadratic model was significant (p = 0.0016), with the level of AF substitution (A) (p = 0.0084) and the AB interaction (p = 0.0019) identified as dominant factors influencing texture acceptability. The highly significant positive interaction (AB) suggests that higher hydration levels (up to 110%) are essential to maintain a spongy and moist crumb structure at elevated AF levels. This synergistic effect occurs because the added water ensures proper hydration of acorn fibers and the starch–xanthan gum matrix, thereby preventing the brittle and dry texture common in many GF formulations [20,23].
These findings are consistent with the work of Santos et al. (2021) [17], who identified dough hydration as the primary determinant of texture acceptability in legume-based GFB, where moisture acts as a plasticizer to improve crumb flexibility. Furthermore, the increased porosity and average pore size observed in the instrumental microstructure analysis likely contributed to the open and aerated crumb structure, which was positively perceived by the sensory panel. However, the significant negative quadratic effect of water (B2, p = 0.0008) indicates that excessive hydration beyond the studied range could lead to a loss of structural integrity and a decline in texture scores. The relationship between formulation variables and sensory texture is defined by Equation (S17) in terms of coded factors:
Odor is a fundamental sensory attribute that significantly influences the initial perception and eventual consumption of bakery products [3]. In this study, the sensory scores for odor ranged from 7.6 to 8.3 (Figure 6d, Table S24), indicating that all formulations—regardless of the AF substitution level—received consistently high scores from the panel, suggesting broad acceptability within the tested group.
The ANOVA results, presented in Table S19, confirmed that the linear model was significant (p = 0.0036). The analysis showed that AF substitution (A) was the only significant factor (p = 0.0011) influencing the odor profile, while water addition (B) did not have a statistically significant effect (p = 0.7869). The mathematical relationship between the variables and the sensory odor scores is defined by the following linear equation in terms of coded factors (Equation (S18)).
AF incorporation contributed a distinctive nutty and roasted aromatic profile, characteristic of Q. rotundifolia [1,14]. Unlike many other oak species whose acorns are characteristically bitter due to high tannin concentrations, acorns from Southern Europe (specifically the Q. rotundifolia) are recognized for their relative sweetness and lower astringency [13,39]. This makes them a premium functional ingredient for human consumption, capable of enriching the sensory complexity of GFB [12].
While the linear coefficient for factor A is negative (−0.2833), indicating a slight numerical decrease in scores compared to the highly neutral rice-based control (which scored 8.3), the scores for 100% acorn loaves remained exceptionally high (~7.6–7.8), as shown in Figure 6d. This suggests that panelists, while accustomed to a neutral RF baseline, appreciated rustic, wholegrain-like aromatic notes introduced by the acorn flour [1,35]. These aromatic properties, likely enhanced by Maillard reaction products and phenolic compounds, help mask the bland and starchy notes typical of GF formulations [3,12].
Taste is a critical determinant of consumer loyalty, as GF products are often described as having a “starchy” or “bland” flavor profile due to their high reliance on refined starches [3,17]. In this study, sensory taste scores ranged from 6.6 to 8.3, as shown by the response surface in Figure 6e, Table S24.
The ANOVA results in Table S20 confirmed that the quadratic model was highly significant (p < 0.0001), capturing the complex flavor dynamics of the acorn-enriched system. The analysis showed that both AF substitution (A) and water addition (B) had significant linear and quadratic effects on taste scores (p < 0.01), while their interaction effect (AB) was not statistically significant (p = 0.3680). The mathematical relationship is described by the following quadratic equation in terms of coded factors (Equation (S19)).
Panelists strongly preferred the complex nutty and toasted flavor of acorn-enriched bread compared to the neutral rice-based control. This aligns with recent literature suggesting that functional alternative flours, such as those from Q. rotundifolia, can effectively mask the common “off-flavors” of gluten-free ingredients while providing a sensory experience comparable to traditional whole-wheat products [3,12].
The specific flavor profile of Q. rotundifolia acorn is advantageous; unlike many bitter oak species, these acorns are known for their relative sweetness and lower tannin-induced astringency, making them a premium ingredient for human consumption [13,39]. The significant negative quadratic effect for AF (A2, p = 0.0007) indicates a sensory “sweet spot” around 80–82% substitution, where desirable aromatic notes are maximized without the over-intensification of tannins that could lead to bitterness at 100% substitution. Furthermore, the significant quadratic effect of water (B2, p = 0.0002) suggests that proper hydration is essential not only for texture but also for the perception of flavor and mouthfeel, as moisture acts as a vehicle for aromatic compounds and prevents a dry, “starchy” sensation [2,17].
Overall sensory score represents the integrated consumer perception of all sensory attributes and is the definitive indicator of the commercial potential of a new product [3,17]. In this study, the overall sensory scores of the acorn-enriched gluten-free loaves ranged from 6.8 to 8.2 (Figure 6f, Table S24).
ANOVA (Table S21) showed that the quadratic model was significant (p = 0.0024). AF (A) had a significant negative linear (p = 0.0025) and quadratic effect (p = 0.0106), indicating an optimal substitution range. Although acorn flour improves aroma and color, scores declined at 100% substitution due to increased tannin intensity and potential matrix weakening [1,12].
Water addition (B) showed a significant negative quadratic effect (p = 0.0202), while its interaction with AF (AB) was highly significant and positive (p = 0.0086). This synergistic interaction confirms that the highest sensory scores were achieved when higher substitution levels were balanced with increased hydration (110%), which likely mitigated fiber-induced crumb hardening and contributed to a moist and elastic texture [2,17]. Numerical optimization identified 82.01% AF and 108.36% water as the optimal formulation. This balance maximizes both functional and nutritional benefits (dietary fiber, unsaturated fatty acids) and sensory acceptability [5,13]. The relationship is defined by Equation (S20) in coded factor terms.
These results demonstrate that Q. rotundifolia is a promising functional ingredient for high-quality GF products, capable of delivering both enhancement and strong sensory performance under controlled formulation conditions [1,12].

3.3. Optimization of GFB Formulation

The optimization of GFB enriched with Q. rotundifolia AF was performed using a multi-response desirability function approach, aiming to simultaneously maximize technological performance and sensory quality, while also increasing AF proportion. Due to the complex interactions between formulation variables, the quality of the final product results from the combined effects of AF content (A) and water addition (B), rather than a single parameter.
AF content (0–100%) and water addition (90–110%) were constrained within the experimental domain. Among the responses, specific volume, springiness, porosity, and overall sensory score were set to be maximized, while hardness was minimized. Other parameters, including moisture content, color coordinates (L*, a*, b*), darkness index (DI), resilience, cohesiveness, chewiness, and crumb structure descriptors (cell density and average pore size), were constrained to remain within their experimentally observed ranges, in order to preserve realistic product characteristics. The highest importance was assigned to overall sensory score, reflecting its critical role in consumer acceptance.
Among the various potential solutions generated during the optimization process, the formulation with a desirability index of 0.627 was selected as the optimal compromise. This optimal point corresponds to an AF substitution level of 83.17% and a water addition level of 107.63%. The predicted performance at this point includes a specific volume of 2.11 cm3/g, hardness of 8.53 N, porosity of 33.60%, and an overall sensory score of 7.56. The predicted DI of 60.40 confirms that the optimized bread maintains the desirable rustic, “wholegrain-like” appearance favored by the sensory panel. These findings demonstrate that Q. rotundifolia AF can be effectively used as a functional ingredient in GFB formulations, allowing high substitution levels without compromising product quality. This approach not only enhances the nutritional and functional profile of the final product but also achieves technological performance comparable to or exceeding that of conventional starch-based GF systems [12,15].
The desirability surface indicated that optimal solutions are located in the region of simultaneously high AF content and high water addition, confirming a strong synergistic interaction between these variables. At elevated substitution levels, the structural weakening effect of AF—primarily due to its high fiber and lipid content—is effectively compensated by increased water availability, which enhances starch gelatinization, reduces batter viscosity, and promotes gas cell expansion. This interaction is consistent with the significant effects observed for specific volume (p < 0.0001 for both A and B) and porosity (p < 0.05 for A, B, and AB), confirming that adequate hydration is essential for maintaining structural integrity in fiber-enriched GF systems [20,21].
Color parameters of the optimized bread (L* = 44.54; a* = 10.61; DI = 60.40) reflect the expected dark appearance associated with high AF content. Although increased darkness is typically considered a limiting factor in bakery products, sensory results indicate that this did not negatively affect consumer perception. On the contrary, the optimized formulation achieved high sensory scores, including an overall sensory score of 7.56, with favorable ratings for appearance (7.94), odor (7.84), taste (7.65), and texture (7.67). This confirms that the characteristic color and flavor of AF are well accepted when balanced with appropriate textural properties.
Crumb structure parameters further support the technological suitability of the optimized formulation. The predicted cell density (34.44 pores/cm2) and average pore size (0.95 mm2) indicate a moderately open and homogeneous crumb structure, while the high porosity confirms efficient gas retention during baking. These results are consistent with the observed interaction effects between formulation variables, where water addition promotes pore expansion and AF contributes to structural stabilization.
The reliability of the optimization was confirmed through model validation. Predicted values for all responses were associated with narrow confidence intervals and acceptable prediction intervals, indicating high model precision. The absence of significant deviations between predicted and observed ranges confirms the robustness of the developed models. Minor variability observed in parameters such as cell density and chewiness can be attributed to the inherent heterogeneity of GF dough systems, particularly during fermentation and baking.
Overall, the results show that AF can be successfully incorporated at very high levels (83.17%) in GFB formulations, provided that water addition is simultaneously increased (107.63%) to ensure optimal dough hydration and structural development. These findings are consistent with previous studies emphasizing the critical role of water management in GF systems enriched with fiber-rich ingredients, where adequate hydration is essential to counteract the weakening of the starch matrix and ensure acceptable product quality [19,20].

Quality and Sensory Evaluation of Optimized GFB and Control Bread

The quality properties of the optimized acorn gluten-free bread (AFB) and the control rice-based bread (RFB) are summarized in Table 3. The results indicate that shifting from a purely rice-starch system to a high-substitution acorn formulation significantly changes the technological and sensory profile of the final product (p < 0.05).
The moisture content of the optimized AFB (45.95%) was significantly higher than that of the control (42.02%, p = 0.014). This increase is primarily due to the higher dough hydration required for the acorn formulation (108% vs. 100%). Additionally, the high total dietary fiber content of Q. rotundifolia flour, particularly the insoluble fraction, provides substantial water-binding and swelling capacities, effectively trapping water within the crumb matrix during baking [13,17]. Similar trends have been observed in chickpea-based GFB, where high hydration levels are necessary to ensure crumb softness and extended shelf life [17].
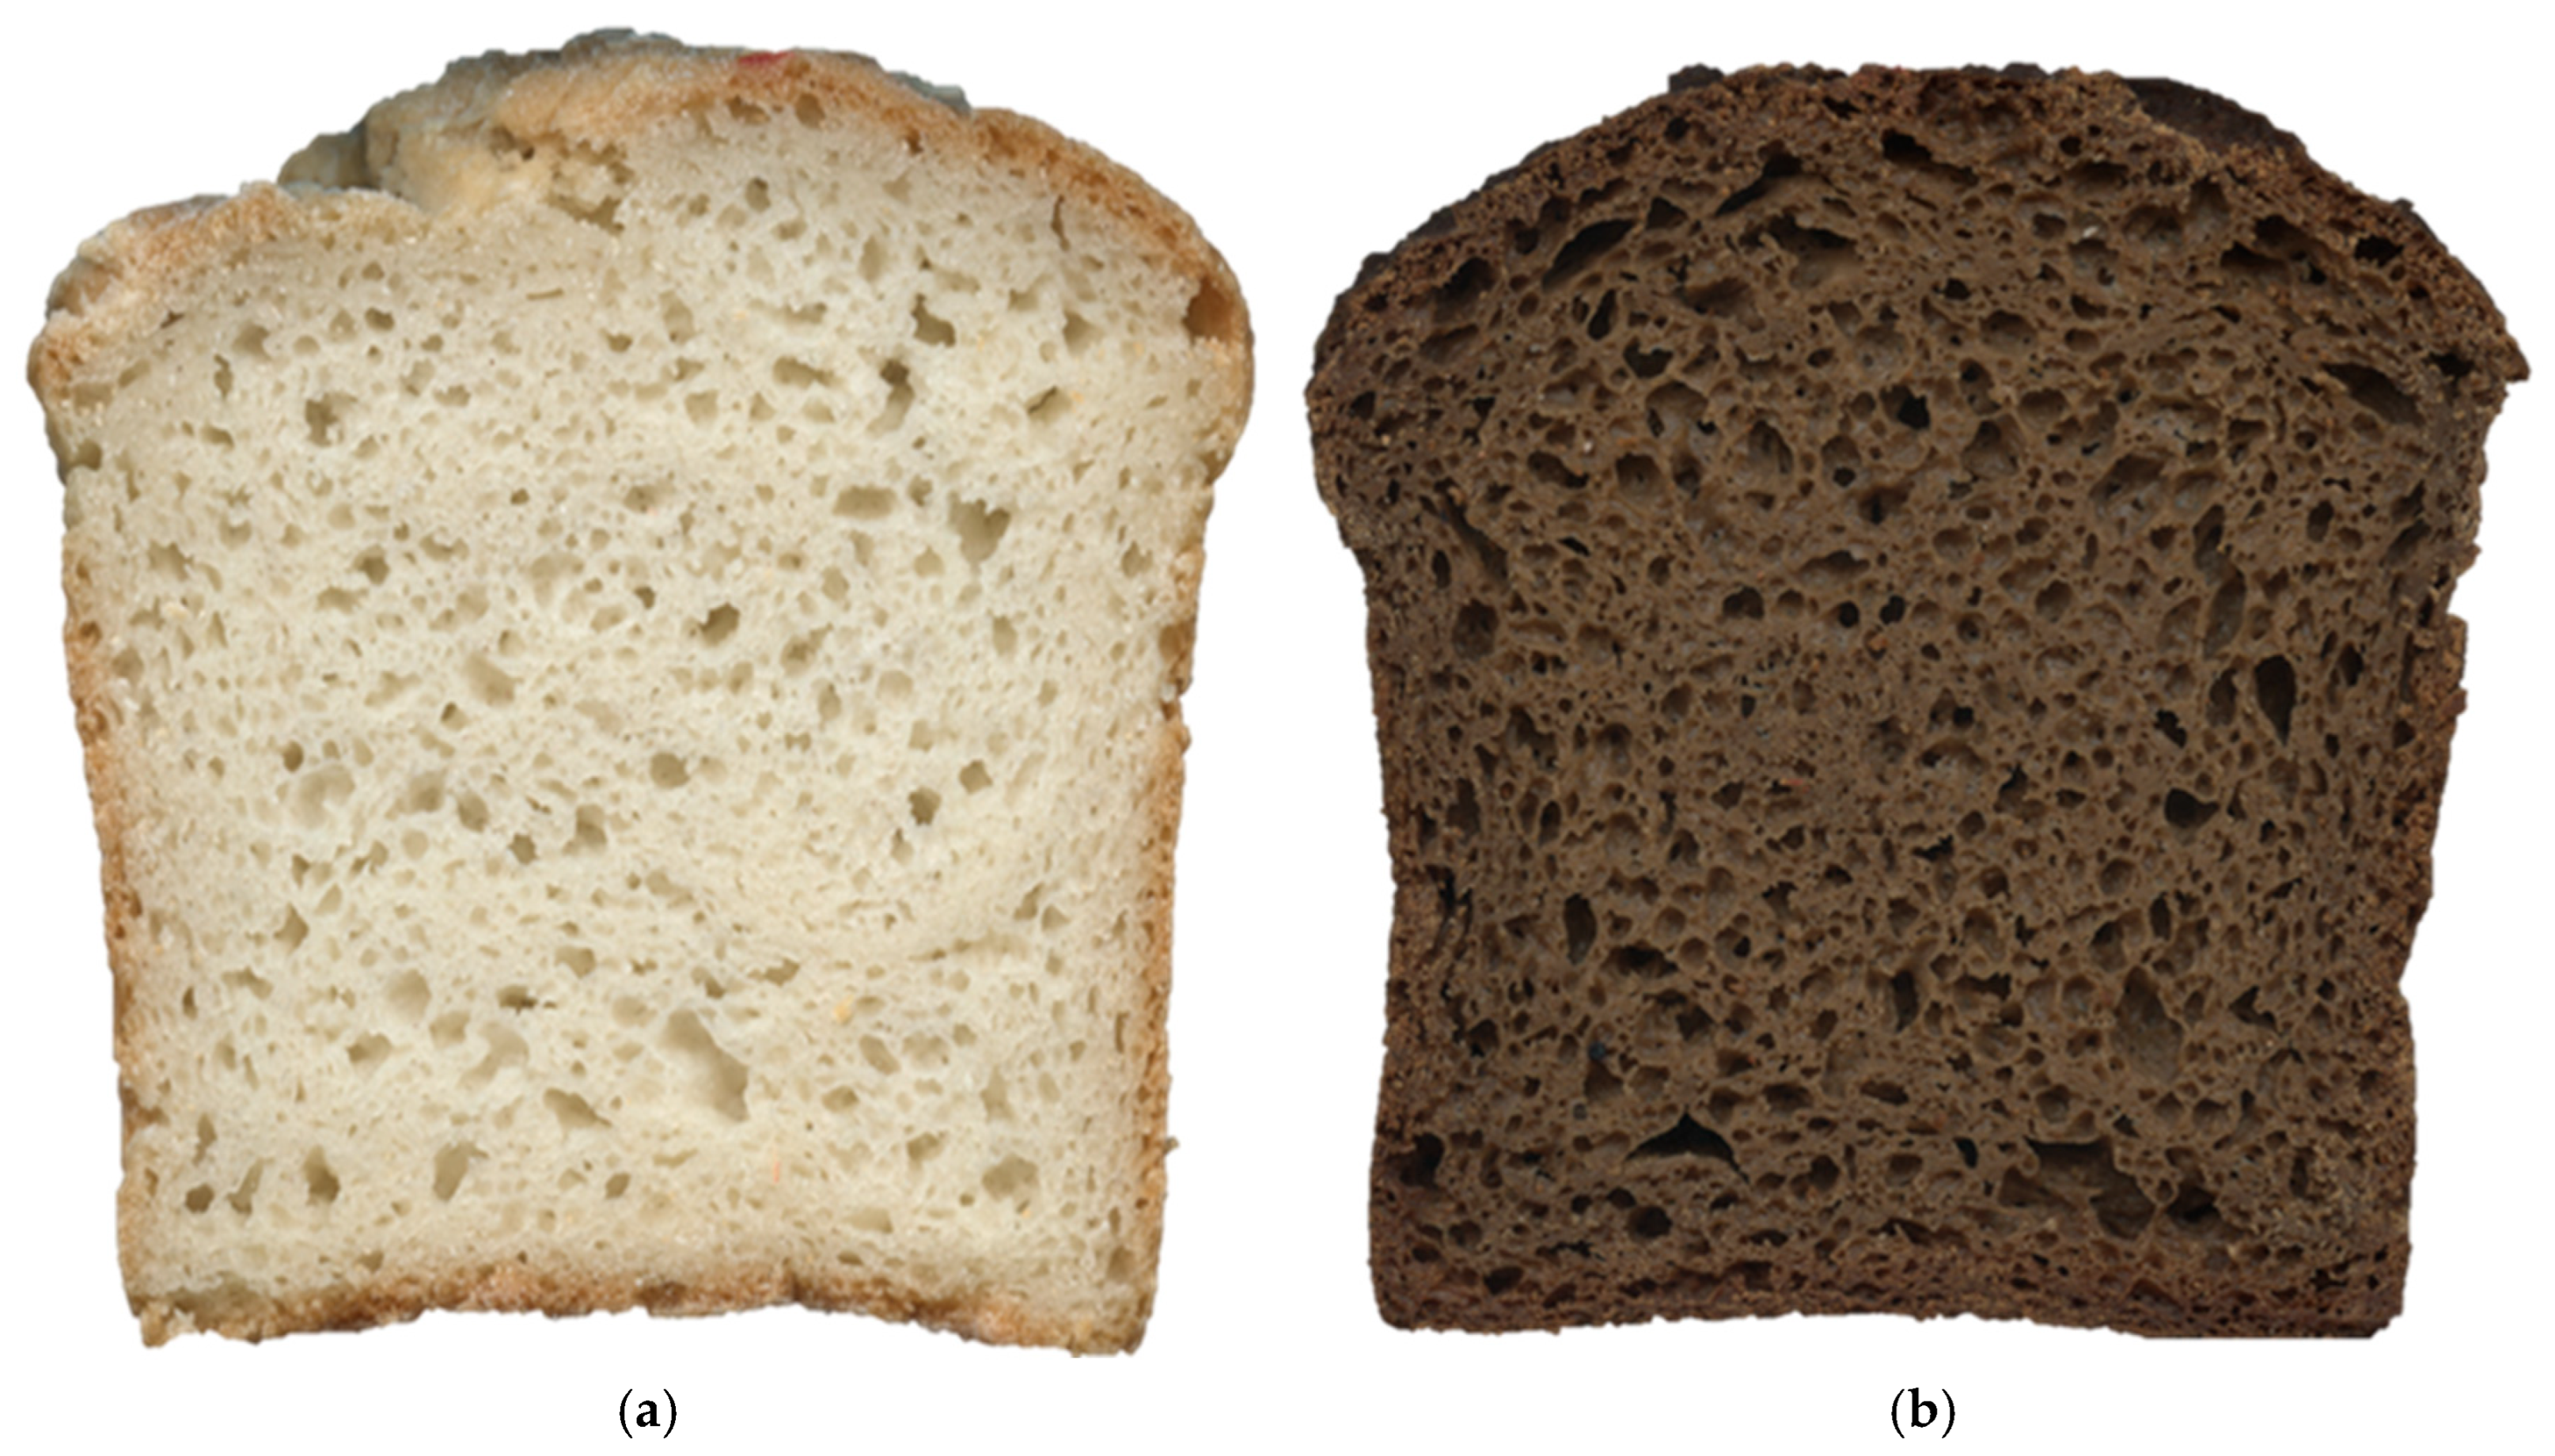
The incorporation of AF caused significant changes in all color parameters (p < 0.001). Lightness (L*) decreased from 80.57 to 43.30, while the darkness index (DI) increased nearly threefold, from 23.31 to 60.95. The AFB also showed significantly higher redness (a* = 9.85) and yellowness (b* = 20.07). As shown in the cross-sectional view of Figure 7, the optimized AFB (Figure 7b) achieved a desirable rustic, whole-wheat-like color, effectively overcoming the typically pale and unappealing appearance of the rice-based control bread (Figure 7a).
This intense darkening is characteristic of Q. rotundifolia flour, driven by high concentrations of phenolic compounds (e.g., gallic and syringic acids) and tannins, which undergo phenolic oxidation at baking temperatures [1,12]. The total phenolic content (TPC) of the optimized AFB (12.46 mg GAE/g) was nearly eight times higher than that of the rice-based control (1.6 mg GAE/g, p < 0.001, Table 4). This substantial enrichment is directly attributed to the phytochemical density of Q. rotundifolia, which has been reported to contain up to ten times the phenolic content of other gluten-free sources such as black rice [1,13].
A significant portion of this profile consists of tannins (4.78 mg GAE/g), which were completely undetected in the control bread. The non-tannin phenolic fraction also increased significantly (from 1.6 to 7.68 mg GAE/g), likely due to high concentrations of specific acids such as gallic and syringic acids, hallmark constituents of Q. rotundifolia acorns [12,13]. These results underscore the effectiveness of RSM-based optimization in transitioning AF from a minor enrichment additive into a major functional ingredient [31].
The increase in bioactive compounds led to a substantial increase in antioxidant capacity (Table 4). The DPPH radical scavenging activity increased approximately 250-fold (from 0.38 to 97.96 µmol TE/g), while the FRAP reducing power showed a 46-fold increase (from 3.0 to 138.01 µmol TE/g, p = 0.004). These findings confirm that the antioxidant potential of acorn phenolics remains highly stable under thermal processing conditions during baking [12,31]. Such high antioxidant capacity is critical for providing coeliac patients with dietary protection against oxidative stress, a benefit often missing in conventional, refined gluten-free products [1,40].
The incorporation of AF significantly altered the in vitro starch digestibility of the bread, suggesting a more favorable glycemic response (Table 4). The rapidly digestible starch (RDS) fraction, responsible for sharp postprandial glucose spikes, decreased significantly from 59.4% to 43.81% (p = 0.002). Conversely, the resistant starch (RS) fraction—which resists small intestine digestion and promotes colonic health—increased more than sixfold (from 0.23% to 1.42%, p = 0.004). Consequently, the total digestible starch (TDS) was significantly lower in the acorn-enriched formulation (47.37% vs. 61.31%, p = 0.005).
It is important to note that, since no specific structural or molecular analyses were performed in this study, the following mechanisms are proposed based on compositional data and literature evidence, rather than direct experimental confirmation. Several mechanisms may potentially contribute to this improved digestibility profile:
  • Potential Role of High Amylose Content: The starch of Q. rotundifolia is reportedly rich in amylose (~50%), which has been associated in the literature with greater resistance to enzymatic hydrolysis and a lower degree of gelatinization compared to rice starch. However, the specific amylose-to-amylopectin ratio in the final baked product and its direct effect on digestibility were not structurally characterized in this study [14,37,41].
  • Potential Role of Fiber–Starch Interactions: The high insoluble fiber content of AF (6.3 g/100 g) may hypothetically reduce starch digestibility by physically entrapping starch granules within a more compact matrix, potentially acting as a barrier to α-amylase and α-glucosidase access. This mechanism, however, is inferred from compositional data and published literature on fiber-rich systems; no direct microstructural evidence was obtained in the present study [22,42].
  • Potential Role of Phenolic Inhibition: High levels of tannins and other polyphenols may hypothetically delay glucose bioavailability, possibly by inhibiting digestive enzymes or interacting with the starch–xanthan gum matrix to form denser, less accessible networks. Such interactions have been reported in the literature for polyphenol-rich systems but were not directly demonstrated in the present macroscopic study and should therefore be considered speculative [43,44].
While there was a notable increase in slowly digestible starch (SDS) from 0.99 to 3.25, this trend was not statistically significant (p = 0.187), suggesting that the primary nutritional benefit of this formulation lies in the reduction in the RDS fraction and the elevation in RS. It should be explicitly acknowledged that this study did not include specific structural or molecular analyses (e.g., starch granule imaging, enzyme kinetics, or polyphenol-starch binding assays), so the mechanistic explanations above are limited to macroscopic observations and literature-based hypotheses. Future studies using these techniques are necessary to confirm the molecular basis of the observed digestibility improvements. Overall, the optimized AFB offers a technologically robust and sensorially acceptable alternative that provides a significantly slower starch digestibility pattern, making it a potentially more favorable option for managing postprandial glycemia in the gluten-free diet [3,37].

4. Conclusions

This study showed that Q. rotundifolia AF can be successfully used as a major ingredient in GFB formulations, provided that hydration is carefully optimized. RSM was an effective tool for modeling and optimizing the complex interactions between flour composition and water addition.
AF significantly affected color, texture, crumb structure, and sensory attributes, while water addition was the key factor controlling moisture, softness, and structural development. The strong interaction between these two variables underscores the need for simultaneous optimization, especially in fiber-rich GF systems.
The optimal formulation, with high acorn substitution (~83%) and elevated hydration (~108%), achieved a desirable balance between technological performance and sensory quality, including improved volume, softer texture, and high overall sensory score. The optimized bread showed a nearly eightfold increase in total phenolic content and significantly greater antioxidant capacity compared to the rice-based control.
These findings support the potential of AF as a sustainable and nutritionally valuable ingredient for GF bakery products. While the mechanistic basis of several observed effects remains to be confirmed through future structural and molecular analyses, the macroscopic and functional data presented here provide a preliminary framework for further investigation and eventual industrial application.

Supplementary Materials

The following supporting information can be downloaded at: https://www.mdpi.com/article/10.3390/app16094284/s1. Table S1 presents the physicochemical composition of raw flours used for gluten-free bread formulation, Tables S2–S20 provide the Analysis of Variance (ANOVA) data for the statistical models (linear, quadratic, or 2FI) used to evaluate the effects of acorn flour and water levels on various bread quality attributes: Table S2 (Moisture); Tables S3–S6 (Color parameters L*, a*, b*, and DI); Table S7 (Specific volume); Tables S8–S12 (Instrumental texture properties: hardness, springiness, resilience, cohesiveness, and chewiness); Tables S13–S15 (Crumb structure descriptors: cell density, pore size, and porosity); and Tables S16–S21 (Sensory evaluation scores: appearance, color, texture, odor, taste, and overall sensory score); Tables S22–S24 present the physicochemical, textural, colorimetric, crumb microstructure, and sensory properties of gluten-free bread formulations across the 32 full factorial experimental design.

Author Contributions

Conceptualization, J.L. and M.J.; methodology, J.L., P.L. and M.J.; validation, J.L. and M.J.; formal analysis, J.L., P.L. and M.J.; investigation, J.L. and M.J.; resources, J.L. and M.J.; data curation, J.L. and M.J.; writing—original draft preparation, J.L. and M.J.; writing—review and editing, J.L. and M.J.; visualization, M.J. and J.L.; supervision, J.L. and M.J.; project administration, J.L. and M.J.; funding acquisition, J.L. and M.J. All authors have read and agreed to the published version of the manuscript.

Funding

This research was carried out within the framework of the MEDACORNET (Rescuing acorns as a Mediterranean traditional superfood; Project ID1838) project. The MEDACORNET is part of the PRIMA program supported by the European Union. This project received funding from Ministry of Science, Education and Youth of the Republic of Croatia (MSEY) as part of the PRIMA program.

Institutional Review Board Statement

The study was conducted in accordance with the Declaration of Helsinki, and approved by the Institutional Ethics Committee for Research on Humans, Osijek, Croatia (approval number 2158-82-01-26-08; approval date: 20 February 2025).

Informed Consent Statement

Informed consent was obtained from all subjects involved in the study.

Data Availability Statement

The data that support the findings of this study are available from the corresponding author, upon reasonable request.

Conflicts of Interest

The authors declare no conflicts of interest.

Abbreviations

The following abbreviations are used in this manuscript:
a*Red–green coordinate (CIELAB)
AACCAmerican Association of Cereal Chemists (now Cereals & Grains Association)
AFAcorn flour
AFBAcorn flour bread
ANOVAAnalysis of variance
AOACAssociation of Official Agricultural Chemists
b*Yellow–blue coordinate (CIELAB)
CIECommission Internationale de l’Éclairage (International Commission on Illumination)
CV %Coefficient of variation
DIDarkness index
DPPH2,2-diphenyl-1-picrylhydrazyl (radical scavenging assay)
FFDFull factorial design
FRAPFerric Reducing Antioxidant Power
GAEGallic acid equivalents
GFGluten free
GFBGluten free bread
L*Lightness (CIELAB)
NTPCNon-tannin phenolic compounds
PVPPPolyvinylpolypyrrolidone
R2Coefficient of determination
RFRice flour
RFBRice flour bread
RSMResponse surface methodology
SDStandard deviation
TPATexture profile analysis
TPCTotal polyphenol content
TPETotal polyphenol extract
TPTZ2,4,6-tris(2-pyridyl)-s-triazine

References

  1. Beltrão Martins, R.; Gouvinhas, I.; Nunes, M.C.; Alcides Peres, J.; Raymundo, A.; Barros, A.I.R.N.A. Acorn Flour as a Source of Bioactive Compounds in Gluten-Free Bread. Molecules 2020, 25, 3568. [Google Scholar] [CrossRef]
  2. McCarthy, D.F.; Gallagher, E.; Gormley, T.R.; Schober, T.J.; Arendt, E.K. Application of Response Surface Methodology in the Development of Gluten-Free Bread. Cereal Chem. 2005, 82, 609–615. [Google Scholar] [CrossRef]
  3. Rodríguez-España, M.; Figueroa-Hernández, C.Y.; Suárez-Quiroz, M.L.; Canelo-Álvarez, F.; de Dios Figueroa-Cárdenas, J.; González-Ríos, O.; Rayas-Duarte, P.; Hernández-Estrada, Z.J. Optimization of Gluten-Free Bread Formulation Using Whole Sorghum-Based Flour by Response Surface Methodology. Foods 2025, 14, 3113. [Google Scholar] [CrossRef]
  4. Banu, I.; Aprodu, I. Investigations on Functional and Thermo-Mechanical Properties of Gluten Free Cereal and Pseudocereal Flours. Foods 2022, 11, 1857. [Google Scholar] [CrossRef]
  5. Madhuresh, D.; Hn, M.; Singh Deora, N.; Baik, O.D.; Meda, V. A Response Surface Methodology (RSM) for Optimizing the Gluten Free Bread Formulation Containing Hydrocolloid, Modified Starch and Rice Flour. In Proceedings of the CSBE/SCGAB 2013 Annual Conference; The Canadian Society for Bioengineering la Société Canadienne de Génie Agroalimentaire et de Bioingénierie, Saskatoon, SK, Canada, 7–10 July 2013. [Google Scholar]
  6. Freire, B.; Prinyawiwatkul, W.; Negrete, A.M.; Golub, E.; King, J.M. Development of Gluten-Free Bread with High-Protein Rice Flour and Effects of Alpha-Amylase Enzyme on Bread Properties. J. Food Sci. 2025, 90, e70733. [Google Scholar] [CrossRef]
  7. Yang, Z.; Lin, J.; Xu, C.; Xing, X.; Yang, H.; Wang, Z. Starch Digestion Characteristics of Different Starch Sources and Their Effects on Goslings’ Apparent Nutrient Utilization. Vet. Sci. 2025, 12, 630. [Google Scholar] [CrossRef]
  8. Zhang, Y.; Dou, B.; Jia, J.; Liu, Y.; Zhang, N. A Study on the Structural and Digestive Properties of Rice Starch–Hydrocolloid Complexes Treated with Heat–Moisture Treatment. Foods 2023, 12, 4241. [Google Scholar] [CrossRef] [PubMed]
  9. Shevchenko, A.; Litvynchuk, S. Influence of Rice Flour on Conformational Changes in the Structure of Wheat Bread and Its Nutritional Value. Food Environ. Saf. J. 2023, 22, 5–14. [Google Scholar] [CrossRef]
  10. Bas-Bellver, C.; Barrera, C.; Betoret, N.; Seguí, L.; Harasym, J. White Cabbage Waste Powder Improves Gluten-Free Rice-Based Breadsticks Functional and Nutritional Characteristics. LWT 2024, 212, 117008. [Google Scholar] [CrossRef]
  11. Aziz, A.; Khan, N.M.; Ali, F.; Khan, Z.U.; Ahmad, S.; Jan, A.K.; Rehman, N.; Muhammad, N. Effect of Protein and Oil Volume Concentrations on Emulsifying Properties of Acorn Protein Isolate. Food Chem. 2020, 324, 126894. [Google Scholar] [CrossRef] [PubMed]
  12. Szabłowska, E.; Tańska, M. Acorns as a Source of Valuable Compounds for Food and Medical Applications: A Review of Quercus Species Diversity and Laboratory Studies. Appl. Sci. 2024, 14, 2799. [Google Scholar] [CrossRef]
  13. Beltrão Martins, R.; Gouvinhas, I.; Nunes, M.C.; Ferreira, L.M.; Peres, J.A.; Raymundo, A.; Barros, A.I.R.N.A. Acorn Flour from Holm Oak (Quercus rotundifolia): Assessment of Nutritional, Phenolic, and Technological Profile. Curr. Res. Food Sci. 2022, 5, 2211–2218. [Google Scholar] [CrossRef] [PubMed]
  14. Beltrão Martins, R.; Garzón, R.; Peres, J.A.; Barros, A.I.R.N.A.; Raymundo, A.; Rosell, C.M. Acorn Flour and Sourdough: An Innovative Combination to Improve Gluten Free Bread Characteristics. Eur. Food Res. Technol. 2022, 248, 1691–1702. [Google Scholar] [CrossRef]
  15. Beltrão Martins, R.; Nunes, M.C.; Ferreira, L.M.M.; Peres, J.A.; Barros, A.I.R.N.A.; Raymundo, A. Impact of Acorn Flour on Gluten-Free Dough Rheology Properties. Foods 2020, 9, 560. [Google Scholar] [CrossRef]
  16. Demirkesen, I.; Sumnu, G.; Sahin, S.; Uysal, N. Optimisation of Formulations and Infrared-Microwave Combination Baking Conditions of Chestnut-Rice Breads. Int. J. Food Sci. Technol. 2011, 46, 1809–1815. [Google Scholar] [CrossRef]
  17. Santos, F.G.; Fratelli, C.; Muniz, D.G.; Capriles, V.D. The Impact of Dough Hydration Level on Gluten-Free Bread Quality: A Case Study with Chickpea Flour. Int. J. Gastron. Food Sci. 2021, 26, 100434. [Google Scholar] [CrossRef]
  18. Sabanis, D.; Tzia, C. Selected Structural Characteristics of HPMC-Containing Gluten Free Bread: A Response Surface Methodology Study for Optimizing Quality. Int. J. Food Prop. 2011, 14, 417–431. [Google Scholar] [CrossRef][Green Version]
  19. Cappai, M.G.; Alesso, G.A.; Nieddu, G.; Sanna, M.; Pinna, W. Electron Microscopy and Composition of Raw Acorn Starch in Relation to in Vivo Starch Digestibility. Food Funct. 2013, 4, 917–922. [Google Scholar] [CrossRef]
  20. Sabanis, D.; Lebesi, D.; Tzia, C. Development of Fibre-Enriched Gluten-Free Bread: A Response Surface Methodology Study. Int. J. Food Sci. Nutr. 2009, 60, 174–190. [Google Scholar] [CrossRef]
  21. Cappa, C.; Lucisano, M.; Mariotti, M. Influence of Psyllium, Sugar Beet Fibre and Water on Gluten-Free Dough Properties and Bread Quality. Carbohydr. Polym. 2013, 98, 1657–1666. [Google Scholar] [CrossRef]
  22. Verbeke, C.; Debonne, E.; Versele, S.; Van Bockstaele, F.; Eeckhout, M. Technological Evaluation of Fiber Effects in Wheat-Based Dough and Bread. Foods 2024, 13, 2582. [Google Scholar] [CrossRef]
  23. Tsatsaragkou, K.; Gounaropoulos, G.; Mandala, I. Development of Gluten Free Bread Containing Carob Flour and Resistant Starch. LWT 2014, 58, 124–129. [Google Scholar] [CrossRef]
  24. Rodrigues, C.V.; Maia, M.L.; Babo, P.; Pintado, M. Impact of Leaching on the Nutritional Composition of Acorn Species. J. Food Compos. Anal. 2026, 149, 108788. [Google Scholar] [CrossRef]
  25. AACC. International Method 44-15.02. Moisture—Air-Oven Methods. In Approved Methods of Analysis; Cereals & Grains Association: St. Paul, MN, USA, 2013. [Google Scholar]
  26. AOAC 920.39; Fat (Crude) or Ether Extract (Soxhlet). Official Methods of Analysis of AOAC International, 22nd ed.; AOAC International: Rockville, MD, USA, 2023.
  27. AOAC 979.09; Protein (Crude) via Kjeldahl. Official Methods of Analysis of AOAC International, 22nd ed.; AOAC International: Rockville, MD, USA, 2023.
  28. AOAC 991.43; Total Dietary Fiber. Official Methods of Analysis of AOAC International, 22nd ed.; AOAC International: Rockville, MD, USA, 2023.
  29. Eurofins Food & Feed Testing. Measurement of Total Sugars by Luff–Schoorl for Food, Feed and Pet Food (Test Code HEC6A): Based on EC 152/2009 (App. III-J), GAFTA 10:1, NEN 3571 and ICUMSA Method GS8-5; Eurofins: Heerenveen, The Netherlands, 2018. [Google Scholar]
  30. Švec, I.; Hradecká, B.; Skřivan, P.; Sluková, M.; Štětina, J.; Beňo, F.; Hajšlová, J. Color and Texture of Wheat and Whole Grain Wheat Salty Crackers—Technological Aspects of Cricket Powder Addition. Appl. Sci. 2025, 15, 9914. [Google Scholar] [CrossRef]
  31. Lukinac, J.; Medaković, D.; Koceva Komlenić, D.; Šušak, A.; Jukić, M. Application of Quercus Pubescens Acorn Flour and Xanthan Gum in Gluten-Free Cookies: RSM Optimization and Quality Evaluation. Foods 2026, 15, 966. [Google Scholar] [CrossRef] [PubMed]
  32. Lončarić, P.; Jukić, M.; Cozmuta, A.M.; Cozmuta, L.G.M.; Uivarasan, A.M.; Pichler, A.; Lučan Čolić, M.; Lukinac, J. FTIR-Based Study of Starch Retrogradation and Protein Structure in Chickpea-Enriched Gluten-Free Bread During Storage. Foods 2026, 15, 412. [Google Scholar] [CrossRef]
  33. Lawless, H.T.; Heymann, H. Acceptance Testing. In Sensory Evaluation of Food; Food Science Text Series; Springer: New York, NY, USA, 2010; pp. 325–347. [Google Scholar]
  34. Megazyme. Digestible and Resistant Starch Assay Protocol (K-DSTRS); Megazyme: Wicklow, Ireland, 2023. [Google Scholar]
  35. Djeukeu, W.A.; Assiene, J.A.A.; Dongho, F.F.D.; Boudjeka, V.G.; Demasse, A.M.; Nyangono, F.C.B.; Fongzossie, E.F.; Gouado, I. Improving Gluten-Free Bread Volume Using Additives: A Review. Food Chem. Adv. 2024, 5, 100738. [Google Scholar] [CrossRef]
  36. Scanlon, M.G.; Zghal, M.C. Bread Properties and Crumb Structure. Food Res. Int. 2001, 34, 841–864. [Google Scholar] [CrossRef]
  37. España-Fariñas, M.P.; Méndez-Sánchez, E.M.; Pereira-Lorenzo, S.; Romero-Rodríguez, M.Á. Glycemic Response and Starch Digestibility in Traditional and Industrial Breads from the Galician Market (NW Spain). Appl. Food Res. 2025, 5, 101483. [Google Scholar] [CrossRef]
  38. Emire, S.A.; Tiruneh, D.D. Optimization of Formulation and Process Conditions of Gluten-Free Bread from Sorghum Using Response Surface Methodology. J. Food Process. Technol. 2012, 3, 155. [Google Scholar] [CrossRef]
  39. Vinha, A.F.; Barreira, J.C.M.; Ferreira, I.C.F.R.; Oliveira, M.B.P.P. Therapeutic, Phytochemistry, and Pharmacology of Acorns (Quercus Nuts): A Review. In Bioactive Compounds in Underutilized Fruits and Nuts; Springer: Berlin/Heidelberg, Germany, 2020; pp. 1–15. [Google Scholar]
  40. Tejerina, D.; García-Torres, S.; Cabeza de Vaca, M.; Vázquez, F.M.; Cava, R. Acorns (Quercus rotundifolia Lam.) and Grass as Natural Sources of Antioxidants and Fatty Acids in the “Montanera” Feeding of Iberian Pig: Intra- and Inter-Annual Variations. Food Chem. 2011, 124, 997–1004. [Google Scholar] [CrossRef]
  41. Arif, M.R.; Hussain, A.; Najam, A.; Ashfaq, M.; Bakhtawar, F.; Zulfiqar, N.; Gorsi, F.I.; Firdous, N.; Elkhedir, A.E.; Wang, Y. A Review on Gluten-Free and Low-Glycemic Index Bakery Products, Especially Corn Based Breads, Noodles, and Multigrain Flours. Discov. Appl. Sci. 2025, 7, 541. [Google Scholar] [CrossRef]
  42. Ghazvini, M.; Ghanbari-Gohari, F.; Foshati, S.; Akhlaghi, M. Effect of Rye Consumption on Markers of Glycemic Control: Evidence on the “Rye Factor”: A Systematic Review and Meta-Analysis of Randomized Controlled Trials. Nutr. Metab. 2025, 22, 27. [Google Scholar] [CrossRef]
  43. Nam, S.; Ozturk, O.K.; Lim, J. Interaction Effects of Tannic Acid and Gluten on Bread-Making and Its Starch Digestion. Foods 2025, 14, 233. [Google Scholar] [CrossRef] [PubMed]
  44. Qin, Y.; Yu, H.; Yang, Z.; Cui, R.; Chi, H.; Brennan, M.; Brennan, C. Impact of Osmanthus Flour and Black Rice Flour on the Baking Quality and Volatile Aroma Compounds of Wheat Bread. J. Future Foods, 2025; in press. [CrossRef]
Figure 1. Response surface plot of the fitted model showing the effects of acorn flour (A) and water addition (B) on the moisture content of acorn gluten-free bread (AFB).
Applsci 16 04284 g001
Figure 2. Visual representation of the impact of acorn flour (A) and hydration level (B) on the colorimetric profile and darkness index of gluten-free acorn bread: (a) lightness (L*); (b) red–green value (a*); (c) yellow–blue value (b*); and (d) darkness index (DI).
Applsci 16 04284 g002
Figure 3. Predicted specific volume of acorn-enriched gluten-free bread as a function of acorn flour content (A) and water addition (B), shown as a response surface plot.
Applsci 16 04284 g003
Figure 4. Impact of acorn flour (A) and added water (B) on the instrumental texture profile of acorn-based gluten-free bread, visualized with response surface plots: (a) Hardness (N); (b) Springiness; (c) Resilience; (d) Cohesiveness; (e) Chewiness (N).
Applsci 16 04284 g004
Figure 5. Predicted response surfaces showing the combined effects of acorn flour (A) and added water (B) on the visual texture of the crumb: (a) cell density (Pores/cm2); (b) average pore size (mm2); (c) porosity.
Applsci 16 04284 g005
Figure 6. Response surface visualization of the relationship between acorn flour (A), water addition (B), and the sensory perception of acorn gluten-free bread: (a) Appearance; (b) Color; (c) Texture; (d) Odor; (e) Taste; (f) Overall sensory score.
Applsci 16 04284 g006
Figure 7. Cross-section view of bread samples: (a) control GF bread (100% rice flour, 100% water); (b) optimized AFB (acorn flour bread) (83% acorn flour, 17% rice flour; 108% water).
Applsci 16 04284 g007
Table 1. Full factorial experimental design for AFB formulations with coded and actual levels of independent variables (AF and water).
RunA: AF (Coded)Acorn Flour (%)Rice Flour (%)B: Water (Coded)Water (%)
1−10100−190
205050−190
3+11000−190
4−101000100
5050500100
6+110000100
7−10100+1110
805050+1110
9+11000+1110
10050500100
11050500100
12050500100
AFB—acorn flour bread. All formulations were prepared on a constant flour basis (100% total flour = acorn flour + rice flour). Rice flour percentage represents the complementary fraction to acorn flour to maintain a constant total flour basis (100%). Acorn flour (AF) substitution (A) and water addition (B) represent the independent variables of the experimental design. The fixed formulation consisted of whey protein concentrate (15%), xanthan gum (4%), instant yeast (3%), sunflower oil (8%), sugar (3%), and sodium chloride (3%), which remained constant across all experimental runs. Runs 5, 10, 11, and 12 are replicates of the central point (50% acorn flour, 50% rice flour, 100% water) used to estimate experimental error in the RSM design.
Table 2. Model adequacy statistics for responses used in multi-response optimization of GFB.
ResponseModel TypeR2Adjusted R2Predicted R2CV %
Moisture (%)Linear0.77640.72670.62363.48
L*Quadratic0.99880.99790.99731.16
a*Quadratic0.99880.99780.99072.47
b*Quadratic0.99880.99780.99010.9406
DIQuadratic0.99910.99830.99751.30
Specific volume (cm3/g)Quadratic0.99370.98850.97870.8506
Hardness (N)Quadratic0.96210.93060.78843.98
SpringinessQuadratic0.93970.88950.75981.48
Resilience2FI0.76880.68210.64814.24
CohesivenessQuadratic0.98390.97060.86151.85
Chewiness (N)Quadratic0.89460.80670.39535.61
Cell density (Pores/cm2)2FI0.93060.90460.81696.83
Average pore size (mm2)Linear0.81700.77630.61849.03
Porosity (%)Quadratic0.96280.93190.79602.39
AppearanceQuadratic0.97610.95620.83701.36
ColorQuadratic0.97840.96030.92351.35
TextureQuadratic0.93580.88230.84041.25
OdorLinear0.71430.65080.53431.83
TasteQuadratic0.97650.95690.92811.34
Overall sensory scoreQuadratic0.92600.86440.85252.04
GFB—gluten-free bread; 2FI—Two-Factor Interaction Model; L*—lightness; a*—red-green coordinate; b*—yellow-blue coordinate; DI—Darkness index; R2—coefficient of determination; Adjusted R2—adjusted coefficient of determination; Predicted R2—predicted coefficient of determination; CV %—coefficient of variation.
Table 3. Quality properties (moisture, color, texture and porosity) of control (100% rice flour, 100% water) and optimized AFB (83% acorn flour, 17% rice flour; 108% water).
ParameterControl Bread 1AFB 1tp
Moisture (%)42.02 ± 1.3045.95 ± 1.014.140.014 *
L*80.57 ± 1.7143.30 ± 0.62−35.49<0.001 *
a*0.78 ± 0.169.85 ± 0.1180.61<0.001 *
b*12.84 ± 0.3220.07 ± 0.2929.03<0.001 *
Darkness index23.31 ± 1.5460.95 ± 0.5040.29<0.001 *
Specific volume (cm3/g)2.35 ± 0.022.13 ± 0.06−6.190.003 *
Hardness (N)7.36 ± 0.178.20 ± 0.166.170.004 *
Springiness0.71 ± 0.010.72 ± 0.010.550.609
Resilience0.36 ± 0.010.31 ± 0.01−8.270.001 *
Cohesiveness0.72 ± 0.010.58 ± 0.01−16.58<0.001 *
Chewiness (N)3.77 ± 0.173.39 ± 0.06−3.620.022 *
Cell density (Pores/cm2)33.10 ± 0.2229.69 ± 0.23−18.66<0.001 *
Average pore size (mm2)0.87 ± 0.011.12 ± 0.0132.61<0.001 *
Porosity (%)28.65 ± 0.3633.34 ± 0.1520.84<0.001 *
AFB—acorn flour bread. 1 Values are mean ± SD. * p < 0.05; Student’s t-test.
Table 4. Functional properties (polyphenol content, antioxidant capacity and starch digestibility) of control (100% rice flour, 100% water) and optimized AFB (83% acorn flour, 17% rice flour; 108% water).
Parameter (Dry Matter)Control Bread 1AFB 1tp
Total phenolic content (mg GAE/g)1.6 ± 0.0512.46 ± 0.3246.67<0.001 *
Non-tannin phenolic content (mg GAE/g)1.6 ± 0.057.68 ± 0.3325.690.002 *
Tannin content (mg GAE/g)n.d.4.78 ± 0.6610.310.009 *
DPPH radical scavenging activity (µmol TE/g)0.38 ± 0.1497.96 ± 0.59229.23<0.001 *
FRAP antioxidant capacity (µmol TE/g)3.0 ± 2.75138.01 ± 11.0116.820.004 *
RDS59.4 ± 0.5043.81 ± 0.70−25.720.002 *
SDS0.99 ± 0.533.25 ± 1.531.970.187
TDS61.31 ± 1.1747.37 ± 0.67−14.600.005 *
RS0.23 ± 0.091.42 ± 0.0616.140.004 *
Total Starch61.54 ± 0.8748.79 ± 0.73−15.850.004 *
AFB—acorn flour bread. 1 Values are mean ± SD. RDS—rapidly digestible starch, SDS—slowly digestible starch, TDS—total digestible starch, RS—resistant starch. * p < 0.05; Student’s t-test.
Disclaimer/Publisher’s Note: The statements, opinions and data contained in all publications are solely those of the individual author(s) and contributor(s) and not of MDPI and/or the editor(s). MDPI and/or the editor(s) disclaim responsibility for any injury to people or property resulting from any ideas, methods, instructions or products referred to in the content.