1. Introduction
Most fiber Bragg grating (FBG) interrogation systems operate in the telecommunication bands near 1310 nm and 1550 nm. Owing to decades of technological development and large-scale deployment in optical communications, components in these bands—including light sources, modulators, and detectors—are highly standardized and commercially mature. Therefore, systems built around these wavelength bands are not only easier to miniaturize and integrate in a compact form, but also offer clear advantages in terms of cost control [
1,
2,
3,
4,
5,
6,
7].
In contrast, operation in the 850 nm band presents distinct challenges. Optical fiber attenuation is significantly higher at this wavelength, limiting its suitability for long-distance sensing applications. Moreover, due to coupling efficiency and packaging constraints, the 850 nm band is more commonly associated with multimode fiber systems rather than standard single-mode communication platforms. Consequently, interrogation components specifically optimized for 850 nm FBG systems are less developed, and certain key devices often rely on customized or non-standard solutions, resulting in higher system costs compared with telecommunication-band implementations. As reported by Stefani et al., 850 nm FBGs differ from conventional communication-band gratings in terms of fiber type, modal characteristics, and fabrication processes [
8]. As a result, interrogation systems in this wavelength region cannot directly leverage the mature component ecosystem established for telecommunication applications. In this context, simply adapting conventional communication-based interrogation architectures is unlikely to fully realize the potential advantages of the 850 nm band.
Notably, in applications such as biomedical sensing, short-range strain measurement, and high-precision industrial monitoring, multimode fibers operating at the 850 nm wavelength exhibit pronounced performance advantages [
9,
10]. First, from a tissue optical properties perspective, 850 nm lies within the near-infrared optical window (typically between 650 and 950 nm), where tissue absorption and scattering are relatively low. This results in significantly reduced optical attenuation within tissues, enabling greater penetration depth and higher signal-to-noise ratio. Extensive research in tissue optics and in vivo imaging has demonstrated that optical signals within this wavelength range can remain effective over distances of several millimeters to several centimeters. In contrast, studies such as those by Zhang et al., based on hyperspectral imaging and Monte Carlo simulations over the 900–1650 nm range, show that in the 1400–1500 nm and near 1550 nm regions, tissue penetration depth sharply decreases due to the strong absorption of water [
11]. Therefore, for biomedical sensing systems, the 850 nm band provides more favorable tissue propagation properties. Second, from a device implementation perspective, 850 nm light sources can be fabricated using mature GaAs/AlGaAs semiconductor materials, which are easily compatible with low-cost LEDs and VCSELs. These sources offer advantages such as low cost, small size, and high ease of miniaturization and integration. Furthermore, their mode of emission is well-matched with multimode fiber cores, ensuring efficient coupling and reducing system complexity while enhancing signal stability. In contrast, 1550 nm light sources typically rely on InP/InGaAsP material systems and high-cost laser diodes, which demand more stringent packaging and coupling requirements. Finally, optical fibers and devices operating at 850 nm maintain excellent flexibility and stability even in confined spaces or when bent, making them ideal for implantable, wearable, and short-range industrial monitoring applications. Given these considerations, the 850 nm wavelength not only exhibits superior tissue transmission characteristics but also demonstrates remarkable advantages in terms of device cost, system integration, and application adaptability.
The existing FBG demodulation methods can generally be classified into spectral analysis-based, filter-based, and interferometric approaches. Wang et al. proposed a novel edge filter formed by cascading dispersion-compensating fiber (DCF) and no-core fiber (NCF), in which the dominant dispersion response of the DCF is more readily achieved in the telecommunication bands [
12]. Mao et al. developed a fast interrogation scheme based on a wavelength-swept laser, employing a distributed feedback (DFB) semiconductor laser as the sweeping source for real-time measurement of dynamic FBG wavelength shifts [
13]. Das and Chandra utilized a Mach–Zehnder interferometer to demodulate the FBG reflection spectrum and demonstrated sub-picometer resolution of Bragg wavelength shifts [
14]. He et al. proposed a hollow-core Fabry–Perot interferometer (FPI) sensor for discriminative temperature and humidity measurement, in which the wavelength shift of the interference dip was used for temperature demodulation, while the corresponding intensity variation was employed for humidity sensing [
15]. Dan et al. proposed a harmonic Vernier amplification scheme based on an in-fiber FPI in which an FFT-assisted demodulation framework was employed to separate spectral components in the spatial-frequency domain [
16]. Zhang et al. presented an interrogation system incorporating a tunable Fabry–Perot (F–P) filter and achieved high-precision wavelength localization using an FPGA–ARM control platform combined with a peak identification algorithm [
17]. Wang et al. presented an FBG sensing/interrogation system in the 1550 nm band, employing a tunable F–P filter–based wavelength scanning interrogator (SM-130) to track the Bragg wavelength variations, thereby enabling reliable wavelength demodulation for practical sensing measurements [
18].
Owing to the maturity of the existing technologies and the availability of dedicated components, these interrogation methods offer superior advantages in the telecommunication bands. More recently, Jiao et al. proposed a Charge-Coupled Device (CCD) interrogation scheme for acquiring the reflection spectra of FBG sensor arrays and applied machine learning algorithms, including a deep belief network (DBN) and sparrow search algorithm (SSA), to achieve high-precision central wavelength detection in the 1530–1565 nm range [
19]. Fundamentally, the CCD-based approach focuses on wavelength demodulation and does not impose strict constraints on the light source type or operating wavelength band. As a broadband spectral acquisition technique, this method can in principle cover a wide spectral range extending from the visible to the near-infrared, with the actual range determined by factors such as the grating characteristics, detector response, and source bandwidth. In practice, however, commercially available CCD spectrometers are still used predominantly in telecommunication bands. Nevertheless, unlike interrogation schemes that rely heavily on telecom-specific components, the principal advantage of the CCD spectrometer-based method lies in the flexibility of its system architecture and its adaptability across multiple wavelength bands. Specifically, its operating wavelength range is determined primarily by the choice of components rather than by a fixed system configuration, which allows the system to be custom-designed and optimized for the 850 nm band. By selecting appropriate light sources, detectors, and other components, and by designing a compatible optical path, a high-performance interrogation system can be realized without relying on telecommunication-specific devices. For example, high-numerical-aperture (NA) collection optics can be introduced to improve the coupling efficiency of multimode fibers.
Given the need for a spectrometer architecture with a high degree of flexibility and design freedom, the implementation of its core dispersive imaging module requires an optical configuration that can balance performance with design versatility. The Czerny–Turner (C–T) configuration remains a classical choice for imaging spectrometers owing to its relatively simple structure, mature aberration correction methods, and ease of alignment [
20]. However, conventional C–T configurations exhibit several inherent limitations in both design and practical application. First, the off-axis layout introduces significant astigmatism, resulting in a separation between the tangential and sagittal focal planes. First, the off-axis layout introduces significant astigmatism, resulting in a separation between the tangential and sagittal focal planes. Consequently, spectral lines appear elliptically elongated on the detector, reducing energy concentration and limiting the achievable spectral resolution. To mitigate this effect, Li et al. introduced a cylindrical lens in front of the detector and adjusted its tilt angle to intentionally generate compensating astigmatism, thereby achieving controlled astigmatism correction at the image plane [
21]. Feng et al. further analyzed the tangential and sagittal image distance relationships among optical elements using the Coddington equations, significantly reducing astigmatic aberrations through systematic modeling [
22]. Second, there is an inherent design trade-off between high optical throughput (low F-number) and high spectral resolution. Increasing the numerical aperture usually aggravates off-axis aberrations, whereas suppressing these aberrations often comes at the expense of optical throughput. To alleviate this trade-off, Wu et al. proposed an improved C–T configuration in which a hemispherical lens was introduced behind the slit, thereby increasing the numerical aperture while partially correcting astigmatism [
23]. However, the achieved numerical aperture (NA = 0.16) is still insufficient to meet the output aperture required by standard multimode fibers (NA = 0.20–0.22). In addition, the hemispherical lens discussed in that work mainly functions as a beam-compression element and does not make a substantive contribution to the overall optimization of system aberrations.
To overcome the aforementioned limitations and fully exploit the potential of the C–T configuration in the target wavelength band, this study adopts a multi-level optimization strategy. At the optical structure level, a compact folded collimation unit was constructed by combining a plano-convex lens with a concave spherical mirror. This hybrid collimation scheme improves coupling efficiency. By placing the plano-convex lens directly at the fiber output coupling position, the divergent beam emitted under a high numerical aperture can be effectively accommodated. At the aberration correction level, the initial optical layout was first determined through design, with appropriate off-axis angles and lens curvature radii selected accordingly. The surface curvatures and relative positions of the optical elements were then treated as key optimization variables to suppress aberrations while maintaining a compact system configuration. At the algorithmic level, system astigmatism was first constrained to an acceptable resolvable range during the optical design stage, after which the demodulation model was calibrated using a fitting-based approach. Gaussian fitting was employed to extract stable local peak positions from non-ideal spectral line profiles, while polynomial fitting was used to characterize the overall nonlinear dispersion and systematic errors. By combining these two methods, algorithm-level compensation of residual aberrations in the compact C–T optical path was achieved.
The core innovation of this study lies in the development of an optimized demodulation system design specifically for the 850 nm wavelength band. The system incorporates an innovative hybrid collimation scheme and optical aberration compensation method, aiming to enhance the spectral resolution at 850 nm. Specifically, the system design combines a plano-convex lens with a concave mirror to achieve efficient collimation of the 850 nm light beam, thereby minimizing losses during light transmission. Furthermore, considering the specific optical characteristics of the 850 nm wavelength band, we developed an optical aberration compensation calculation method to correct aberrations during light transmission, thus improving the imaging performance of the system. Through these design improvements, we have realized a relatively stable and efficient demodulation system, which is capable of providing effective support for applications in biomedical sensing, short-range strain monitoring, and precision industrial inspection.
The remainder of this paper is organized as follows.
Section 2 introduces the working principle of the interrogation system and the theoretical framework for the free-space optical design, including key equations such as the Coddington equations for astigmatism correction, as well as the spectral peak extraction and mapping methods based on Gaussian and polynomial fitting.
Section 3 presents the optical design and optimization process carried out using ZEMAX OpticStudio 19.4 Premium, including the selection of initial parameters and the configuration of optimization variables.
Section 4 provides validation and discussion of the system, including simulation results, experimental setup, calibration results (wavelength–pixel and strain–wavelength relationships), interrogation experiments, and performance analysis. Finally,
Section 5 summarizes the main conclusions and highlights the practical significance of the proposed system.
2. Materials and Methods
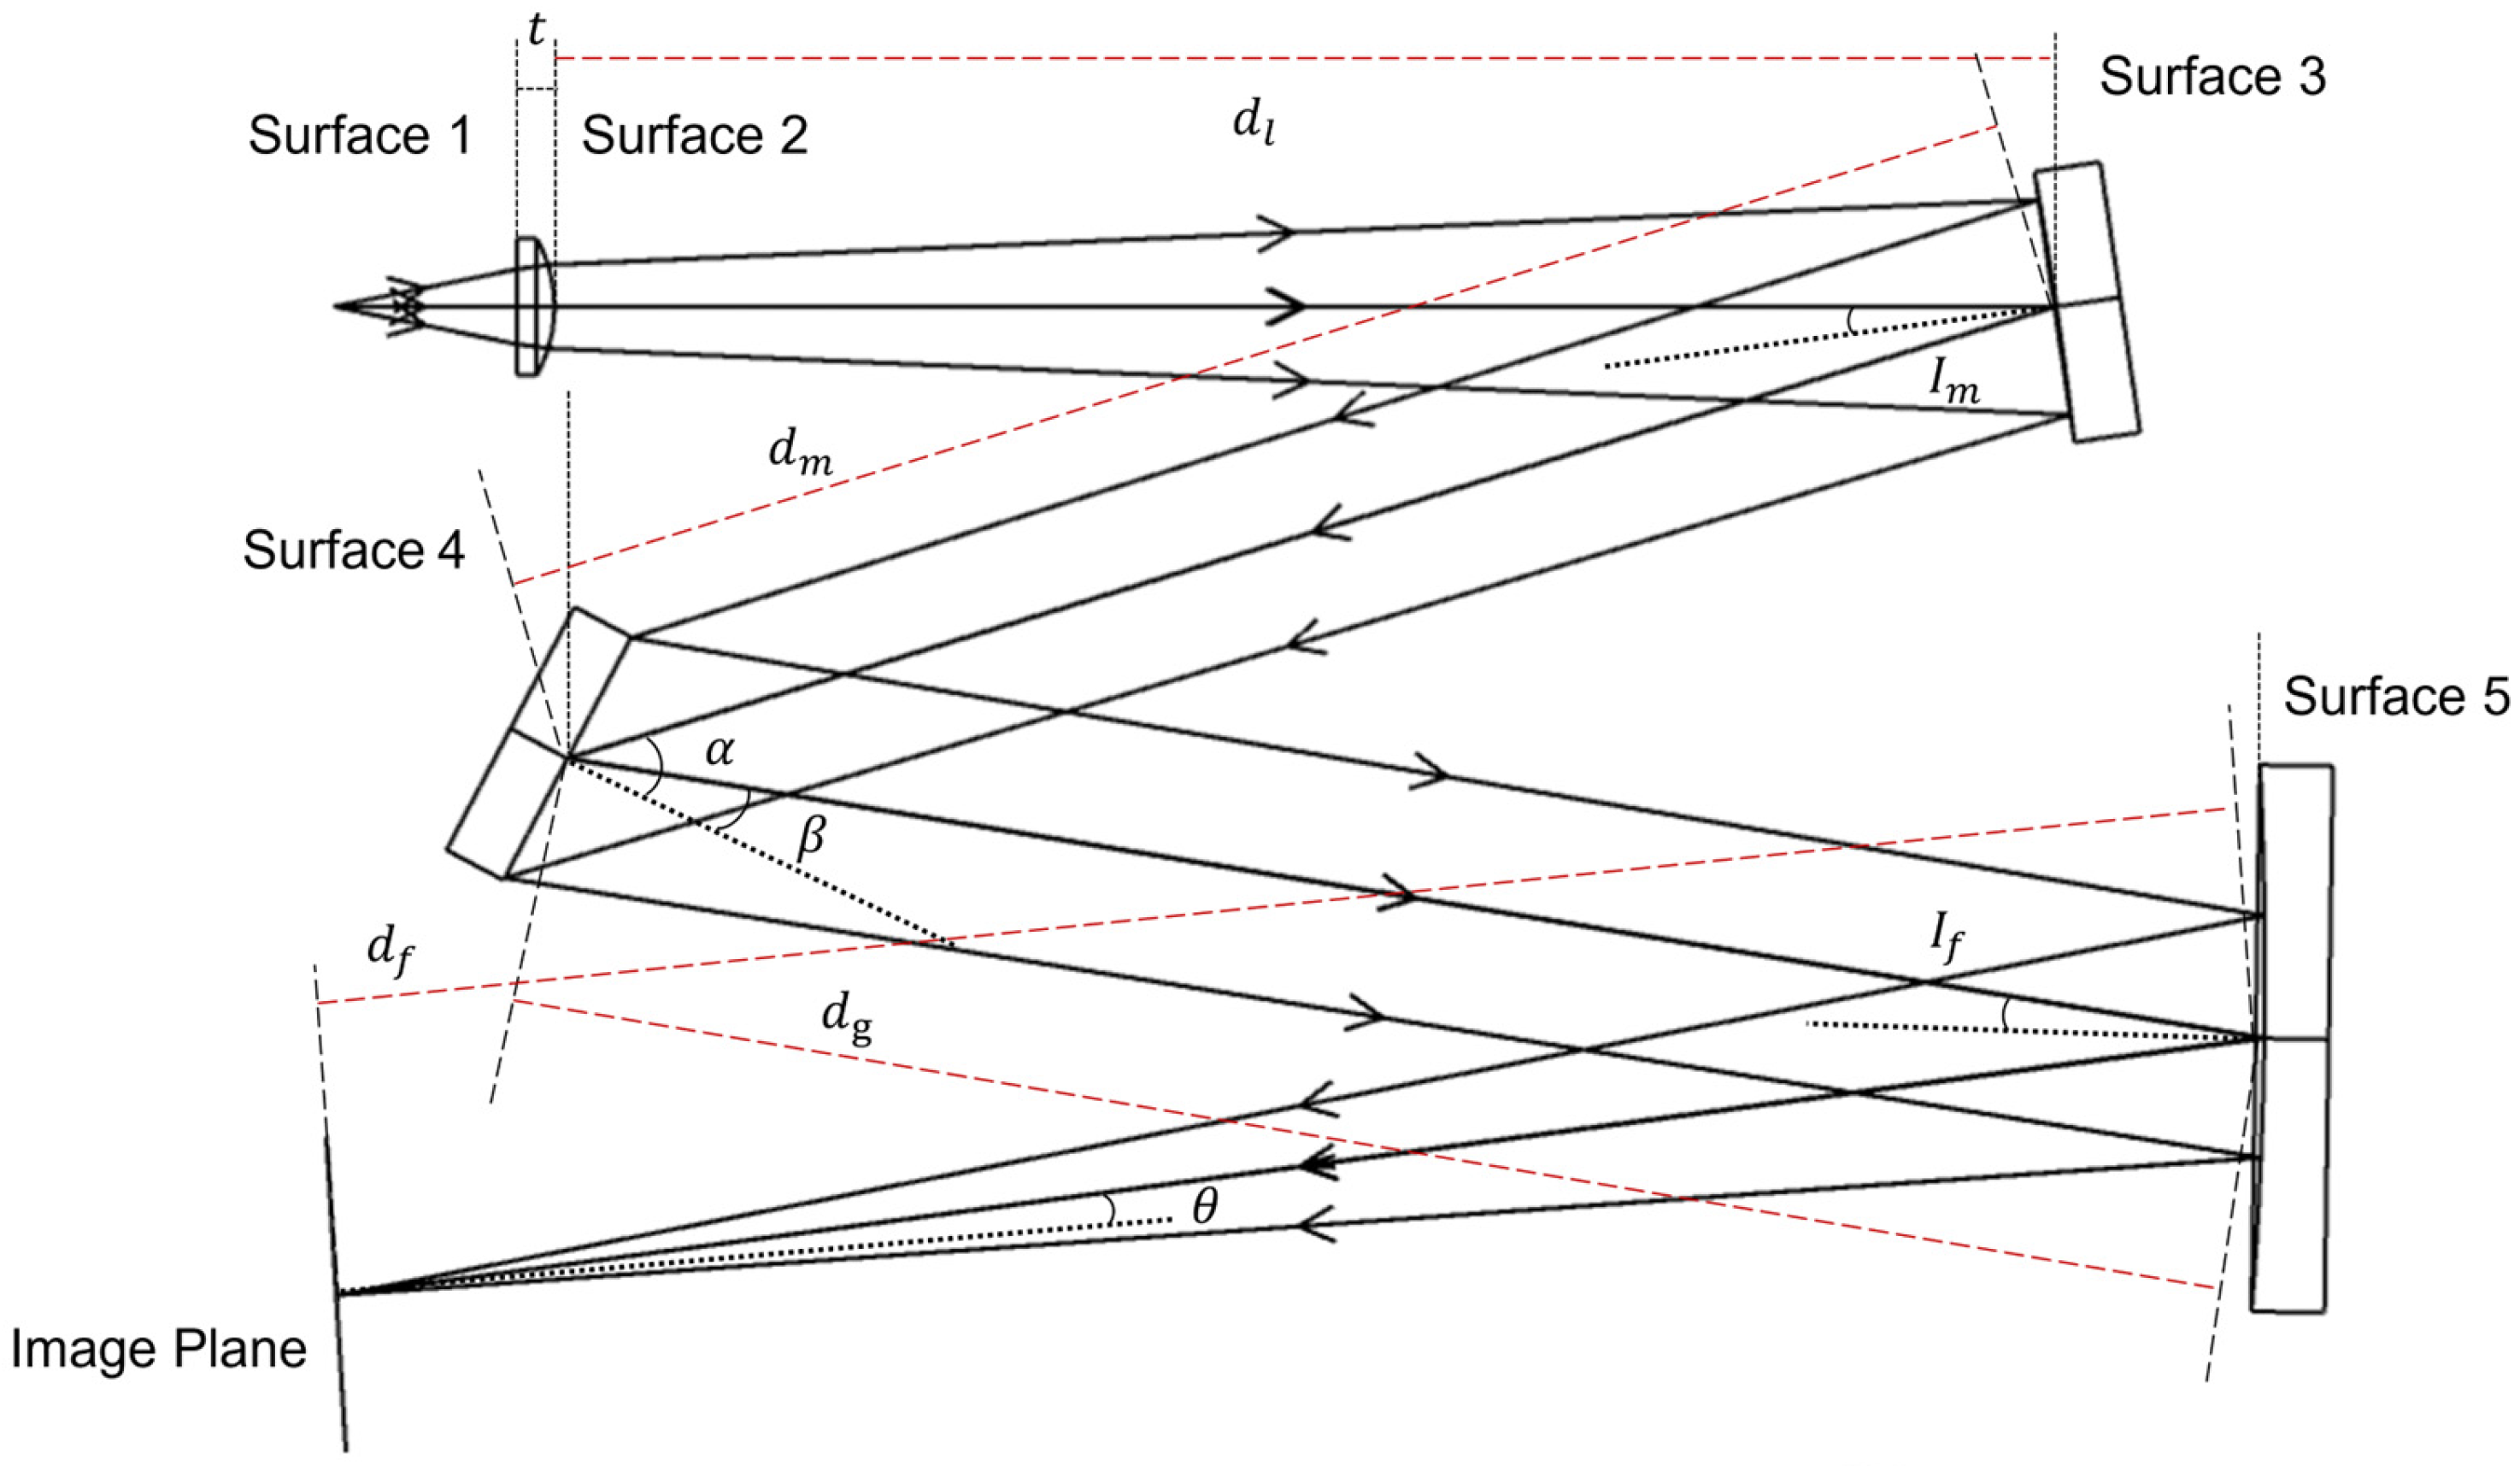
This work proposes an FBG interrogation method based on spectral imaging. The core idea is to convert the wavelength shift of the reflected FBG spectrum into a spatial displacement on the detector plane through a dispersive imaging system, and then recover the wavelength information by image-based peak localization and calibration. In this way, the Bragg wavelength variation induced by external perturbations can be demodulated through the spectral image captured by the detector. The key optical component of the proposed method is a Czerny–Turner (C–T) spectrometer, which performs wavelength-to-space conversion and determines the spectral dispersion and resolution characteristics of the system. The spectral imaging module proposed in this system is built based on the C–T optical layout, with the specific structure shown in
Figure 1.
To quantitatively evaluate the impact of astigmatism on system performance, the Coddington equation is used [
24]:
where
and
are the refractive indices of the incident and outgoing media, respectively;
and
are the angles of incidence and refraction (reflection),
and
are the meridional and sagittal object distances;
and
are the corresponding image distances, and
is the curvature radius of the optical surface. For surface 1, which is the front surface of the plano-convex lens:
At this stage, the image distances in the two principal directions are no longer strictly equivalent. This discrepancy is not caused by astigmatism, but rather arises from the different angular weightings associated with different positions relative to the optical axis. Considering the propagation thickness
inside the lens, the sagittal and meridional image distances can be expressed as
, respectively. For surface 2, corresponding to the rear surface of the plano-convex lens:
The imaging relationships of the lens section can be fully described by the Coddington equations, in which the terms associated with the curvature of the refracting surface can be expressed using the equivalent focal length
:
while the terms containing the object distance and inclination information are retained in their explicit form. This form of expression preserves accuracy while avoiding unnecessary geometrical complexity. It should be noted that the equivalent focal length only characterizes the on-axis focusing capability and does not carry information related to the tangential and sagittal differences. Accordingly, the imaging relation of the rear surface of the lens can be rewritten as:
In the subsequent derivations, only the convergence terms associated with the surface curvature are expressed in terms of the equivalent focal length, while the remaining angular weighting terms are retained in their original Coddington form. The object distances before the mirror are given by
and
. For surface 3, corresponding to mirror 1:
If only a single equivalent focal length
is used to control the astigmatic input conditions of the preceding optical subsystem:
To achieve unified system-level modeling, an equivalent focal length
is employed to characterize the hybrid collimation section, thereby providing a complete description of the imaging behavior of the preceding optical path. Since the object distance of the reflective element is determined by the output of the refractive stage, its imaging relationship is implicitly governed by
. Therefore, no additional equivalent focal length parameter for the mirror is required to achieve a unified description of the system astigmatic behavior. Because the diffraction grating introduces unequal angular propagation between the incident and diffracted beams in the tangential direction, its influence on the system imaging performance is incorporated by applying an angle-dependent correction factor
to the tangential equivalent object distance. For surface 5, corresponding to mirror 2:
Based on the equivalent object distances
and
, the overall sagittal and tangential image distance relationships of the system are given by:
When the values of and are approximately equal, it indicates that the sagittal and tangential image distances of the system are nearly identical, and thus the system astigmatism is approximately eliminated.
In imaging-based spectral demodulation systems, both the measurement of wavelength shifts in FBGs and the establishment of the wavelength-to-pixel mapping in imaging spectrometers fundamentally rely on the accurate extraction of spectral peak features. For the reflected spectrum of an FBG, the spectral distribution around the central wavelength is jointly determined by the grating reflection characteristics, the spectral bandwidth of the light source, and the resolution of the spectral acquisition system. Considering the effects of the grating reflection bandwidth and system noise, the reflected spectrum can be approximately described by a Gaussian function. Similarly, in imaging spectrometer systems, owing to the imaging properties of the optical system and the finite sampling resolution of the detector, the response of a single wavelength on the detector typically appears as a broadened spectral line. Taking into account the system point spread function and noise, this spectral line distribution can also be well approximated by a Gaussian function. The mathematical expression of the Gaussian function is given by:
where
represents the measured signal intensity,
is the independent variable,
denotes the peak amplitude, is the peak center position, characterizes the spectral broadening, and represents the background term. When this model is applied to the analysis of FBG reflection spectra, corresponds to the wavelength and represents the reflected optical power at the corresponding wavelength. When applied to data processing in imaging-based spectrometer systems, denotes the pixel position on the detector and represents the grayscale value at the corresponding pixel.
For FBG sensing applications, the central reflection wavelength shifts in response to variations in external physical quantities, such as stress or strain. Within a certain operating range, the wavelength shift typically exhibits a good monotonic relationship with the applied physical quantity; however, due to factors such as packaging methods, material properties, and experimental conditions, a certain degree of nonlinearity may be present. Therefore, polynomial functions are employed to fit the relationship between the external physical quantity and the central wavelength of the FBGs, so that the overall variation trend can be effectively described. The general mathematical form of the polynomial function can be written as:
where
denotes the output physical quantity,
represents the input feature parameter,
are the polynomial fitting coefficients, and
is the order of the polynomial. The polynomial coefficients can be obtained by fitting the experimental data using the least-squares method. The selection of the polynomial order should take into account both fitting accuracy and model stability, in order to avoid overfitting caused by excessively high-order polynomials. When this model is applied to FBG sensing applications, it is used to describe the mapping relationship between the external physical quantity and the central wavelength of the fiber Bragg grating. In this case,
represents the wavelength and
represents the external physical quantity. When applied to data processing in imaging-based spectrometer systems, the model is used to describe the mapping relationship between the wavelength and the detector pixel position, where
denotes the pixel position and
denotes the wavelength.
3. Design
To verify the feasibility of the imaging-based spectral demodulation architecture and to provide a theoretical basis for the selection of experimental system parameters, the system was modeled and simulated using the optical design software ZEMAX OpticStudio 19.4 Premium. The incident light was assumed to originate from a multimode optical fiber, with the numerical aperture set to NA = 0.2. To balance design margin and flexibility for subsequent experimental adjustment, the operating spectral range was set to 800–900 nm. After comprehensive consideration of spectral resolution, bandwidth coverage, and system stability, a diffraction grating with a groove density of 1200 lines/mm was selected. The grating satisfies the classical grating equation:
where
denotes the diffraction order,
is the incident wavelength,
represents the grating constant, and
and
are the incidence and diffraction angles, respectively. To effectively suppress stray light, a certain separation between mirror 1 and mirror 2 in the tangential plane is required. Accordingly, the grating incidence angle
was set to
. For a central wavelength of 850 nm, a grating constant of 1/1200 mm, and a diffraction order of m = 1, the corresponding diffraction angle of the central wavelength was calculated to be
. The focal length of the focusing optical element can be approximately determined based on the detector size and the angular dispersion characteristics of the diffraction grating. The relationship between the focal length of mirror 2 and the image-plane width is given by [
25]:
where
denotes the focal length of mirror 2,
and
represent the upper and lower limits of the operating spectral range, respectively, and
denotes the image-plane width. The pixel size of the CCD directly affects the wavelength sampling accuracy, signal-to-noise ratio, and the alignment and assembly tolerance of the system. Considering the system dispersion capability, spectral linewidth, and signal-to-noise ratio requirements, a linear CCD with a pixel width of 8 µm was selected in this study. Accordingly, the focal length of mirror 2 satisfies
.By choosing a focal length of 200 mm for mirror 2, the resulting image-plane width is approximately 25.91 mm, corresponding to about 3238 pixels. Therefore, a linear CCD with 3648 pixels was adopted. For the collimation system, a geometric relationship exists among the output beam diameter
, the fiber numerical aperture NA, and the system equivalent focal length
:
Considering the divergent characteristics of the fiber-coupled incident beam, in order to ensure that the spectral information within the target wavelength range is approximately incident normal to the CCD detector at the image plane, thereby improving detector utilization efficiency and reducing geometric distortion, the required output beam diameter of the collimation section was estimated to be approximately 25 mm. Accordingly, the equivalent focal length of the collimation optics was estimated to be about 62.5 mm. When the system further operates under collimated or far-field conditions, that is, with the object distance approaching infinity, small incidence angles, and the tangential and sagittal directions becoming approximately coincident, the above generalized imaging relationship naturally degenerates into an on-axis equivalent imaging model. Under this limiting condition, the formulation described by the Coddington equation can be simplified to the classical expression of the system equivalent focal length
:
where
denotes the separation between the lens and the mirror. Considering component availability and overall implementation cost, the collimation unit was composed of a plano-convex lens with a focal length of
and a concave mirror with a focal length of
. The determined parameters were used as the initial structural design parameters of the system, and their specific values are summarized in
Table 1. Accordingly, the initial value of
was estimated to be 133 mm. The distance
between Mirror 1 and the diffraction grating directly affects the convergence condition of the incident beam at the grating, thereby determining the collimation quality and the level of coma in the system. The distance
between the diffraction grating and Mirror 2 governs the refocusing characteristics of the diffracted beam and has a significant influence on the image plane position, astigmatism, and spectral line broadening. To ensure that the incident light at the grating is approximately collimated and to achieve stable spectral imaging performance, the distance from the collimating mirror to the grating was initially set to be approximately equal to the focal length of the collimating mirror, while the distance from the grating to the focusing mirror was set to be approximately equal to the focal length of the focusing mirror. In this system, the focal lengths of Mirrors 1 and 2 are 180 mm and 200 mm, respectively, and the corresponding initial structural distances were determined accordingly. According to the Shafer equation, the coma of the central wavelength can be eliminated using the following expression [
26]:
In an M-type C–T optical configuration, improvements in spectral resolution generally cause the optimized system geometry to evolve toward a more balanced layout, where the distances between key optical elements tend to approach similar values. Accordingly, it can be anticipated that the parameter , initially set to 133 mm, will exhibit an increasing trend during the subsequent optimization, whereas , initially set to 180 mm, will decrease correspondingly. In addition to the optical design constraints, the installation space required by the mechanical structure must also be taken into account. According to the actual structural layout, the distance from the lens center to the edge of the mount is approximately 10 mm, while the distance from the grating center to its edge is approximately 15 mm. Furthermore, after considering the minimum safety clearance required between adjacent elements, the distance between the lens and the grating was approximately set to 45 mm. Based on the above geometric constraints, namely that tends to increase, tends to decrease, and remains greater than 45 mm, the geometric relationship can be reasonably established. In the triangle defined by sides , and , the included angle was estimated to lie within a reasonable range of to . Here, the included angle refers to the angle formed by the incident ray and the reflected ray at reflective mirror 1. Based on a comprehensive consideration of system compactness, mechanical feasibility, and optimization convergence stability, the included angle was ultimately set to , and the initial value of was therefore taken as . For the collimation unit composed of a lens–mirror combination, the system can be equivalently treated as a single collimating mirror with an effective radius of curvature. Therefore, the Shafer equation can still be applied for system-level coma balancing analysis. Based on this assumption, the corresponding value of was calculated to be .
Because the optimal image planes at different wavelengths do not coincide exactly, the CCD should be tilted by an angle
. This arrangement allows the detector plane to better match the actual focal surface of the system, thereby improving spectral consistency across the full wavelength range. After the optical components were determined, the remaining adjustable variables in the optical layout were treated as optimization parameters. During the optimization process, the aberration-correction conditions derived from the theoretical analysis were introduced into the merit function editor as constraint terms. The optimal values of these parameters were then obtained through multivariable joint optimization, and the results are summarized in
Table 2.
4. Verification and Discussion
4.1. Simulation-Based Validation Using ZEMAX
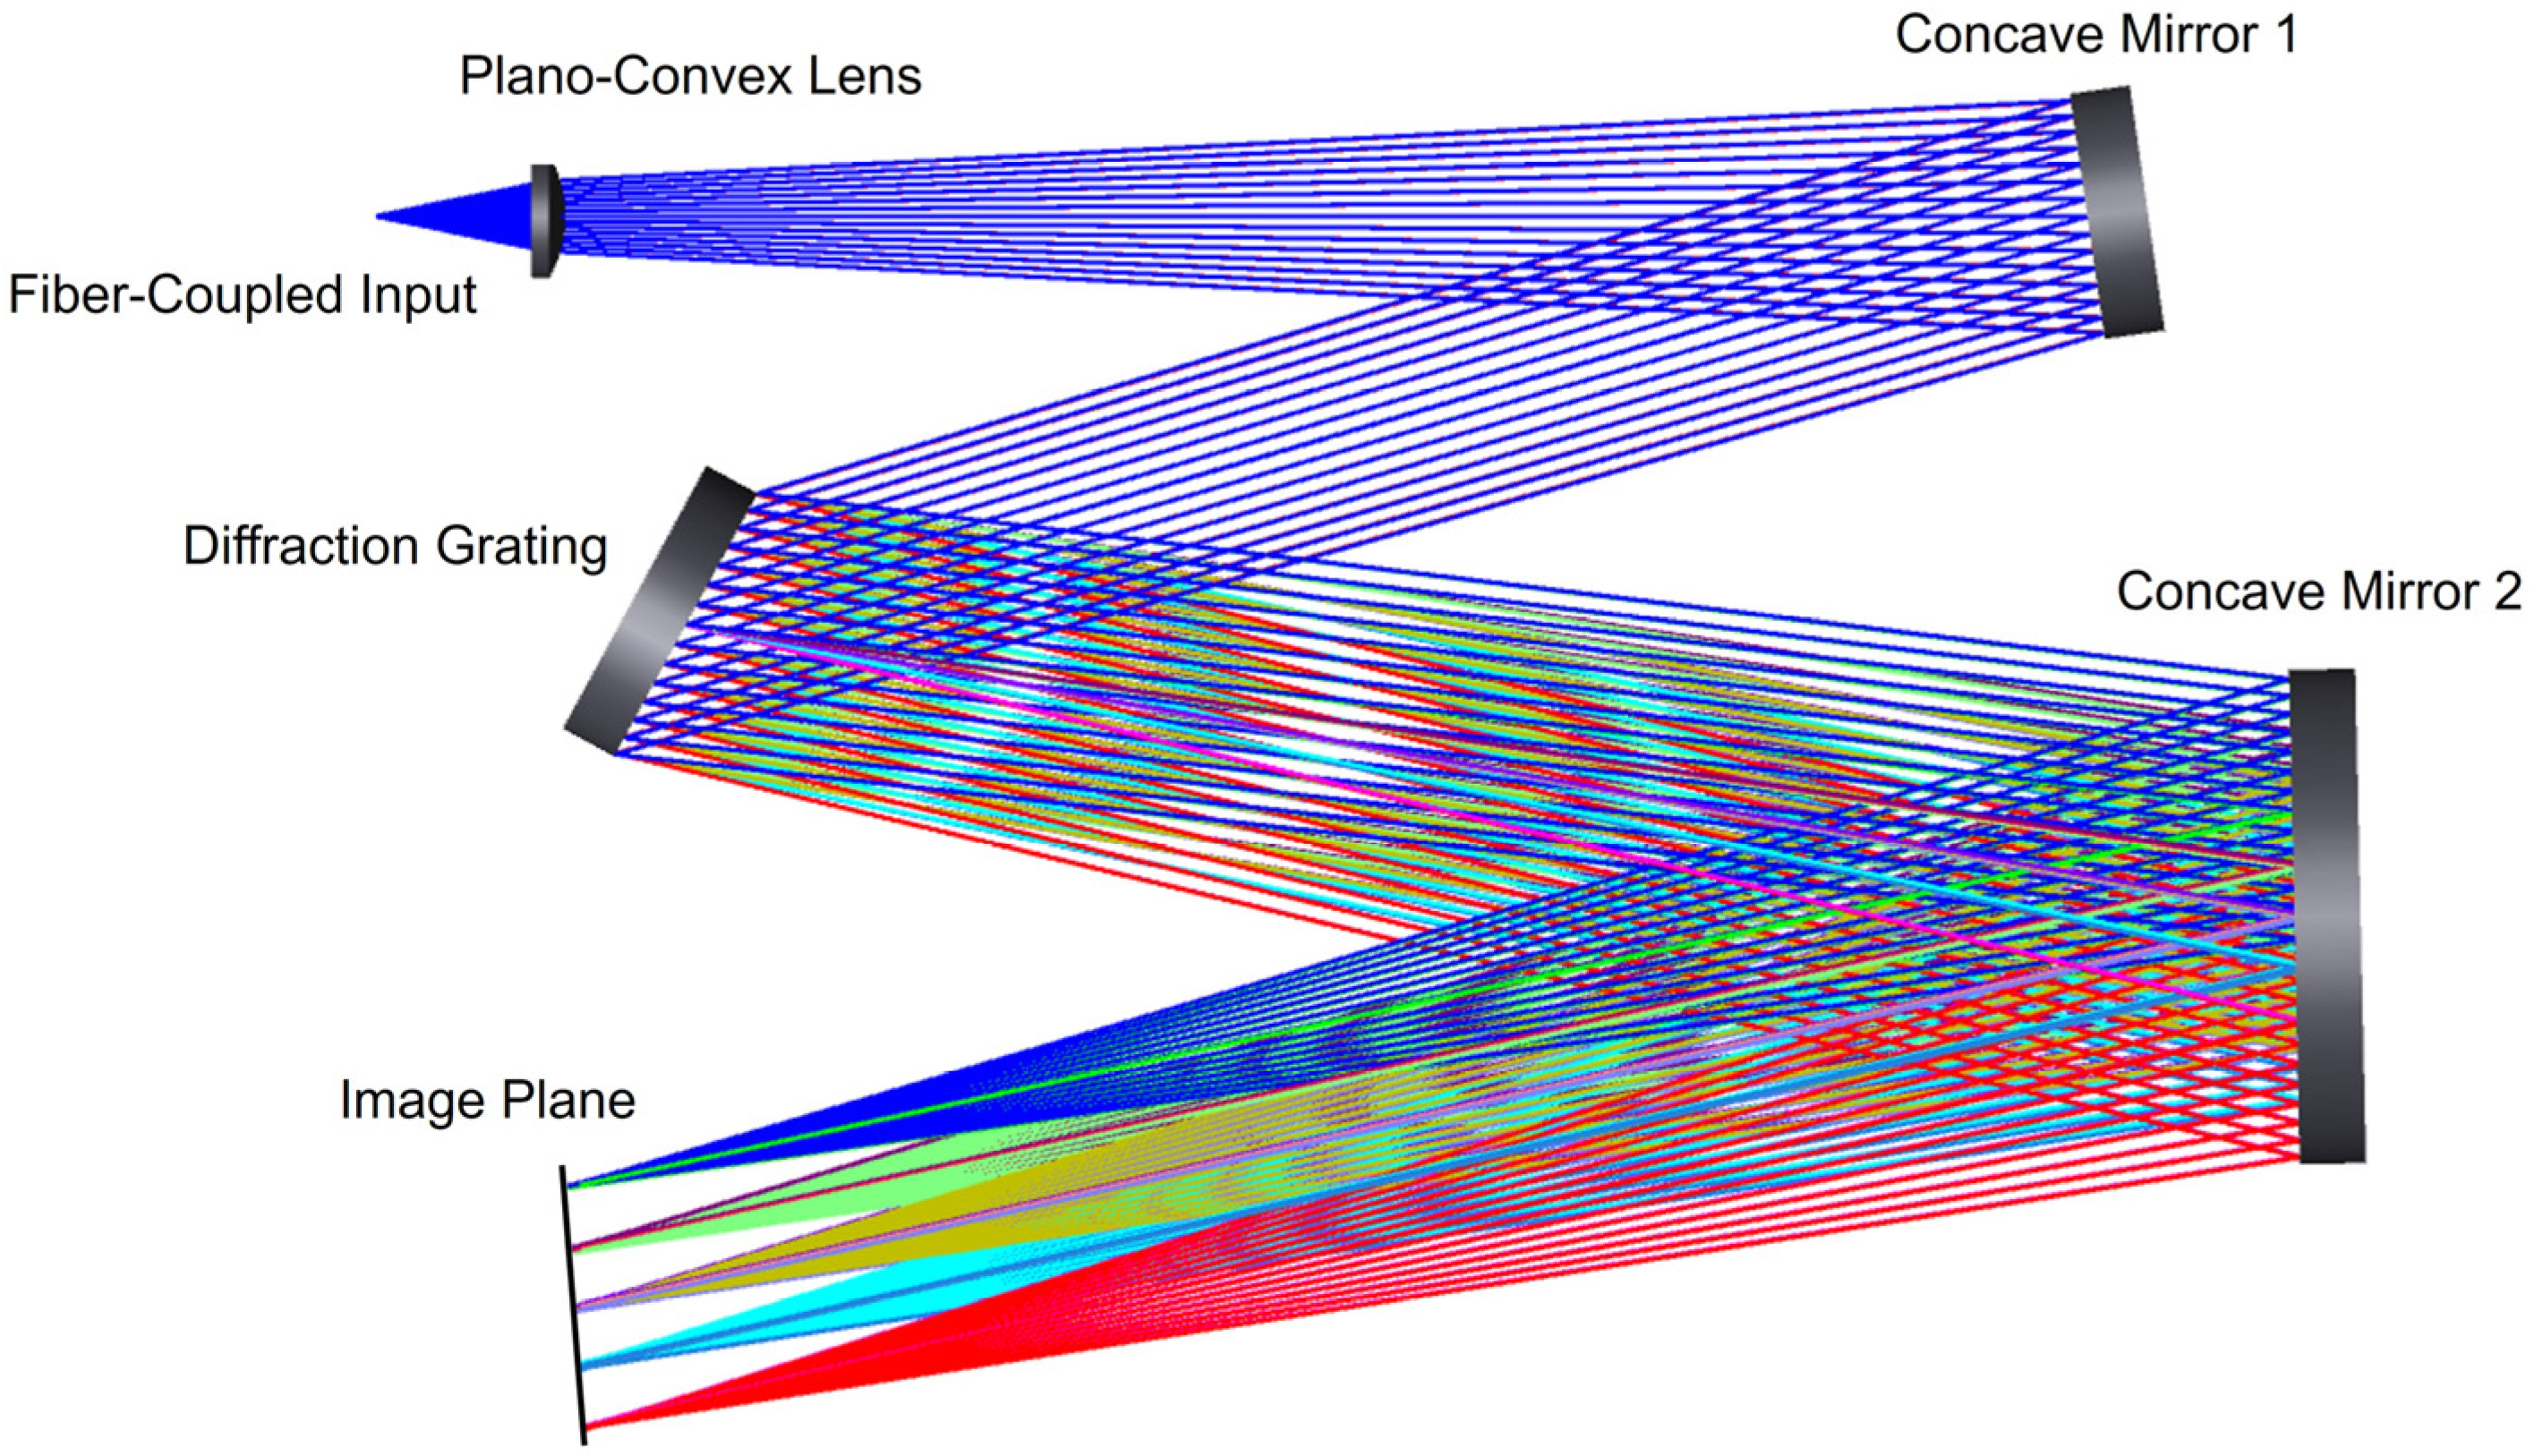
The designed Czerny–Turner spectrometer optical layout is illustrated in
Figure 2, showing the optical input, plano-convex lens, concave mirrors, diffraction grating, and CCD detector. This figure represents a ZEMAX simulation result, obtained using the fixed parameters from
Table 1 and the optimized parameters from
Table 2. The layout demonstrates that optical components with different wavelengths are mapped onto the detector image plane with a stable and monotonic spatial distribution, thereby confirming the theoretical feasibility of the imaging-based spectroscopic interrogation scheme. In addition, the wavelength dispersion characteristics obtained from the simulation are consistent with the aforementioned theoretical analysis, providing a reliable design basis for subsequent wavelength–pixel calibration and experimental system implementation.
To mitigate spectral line broadening caused by optical aberrations near the band edges, the full 100 nm design bandwidth was not utilized in the experiments. Instead, the measurement range was restricted to the 830–880 nm region, where the optical performance is superior.
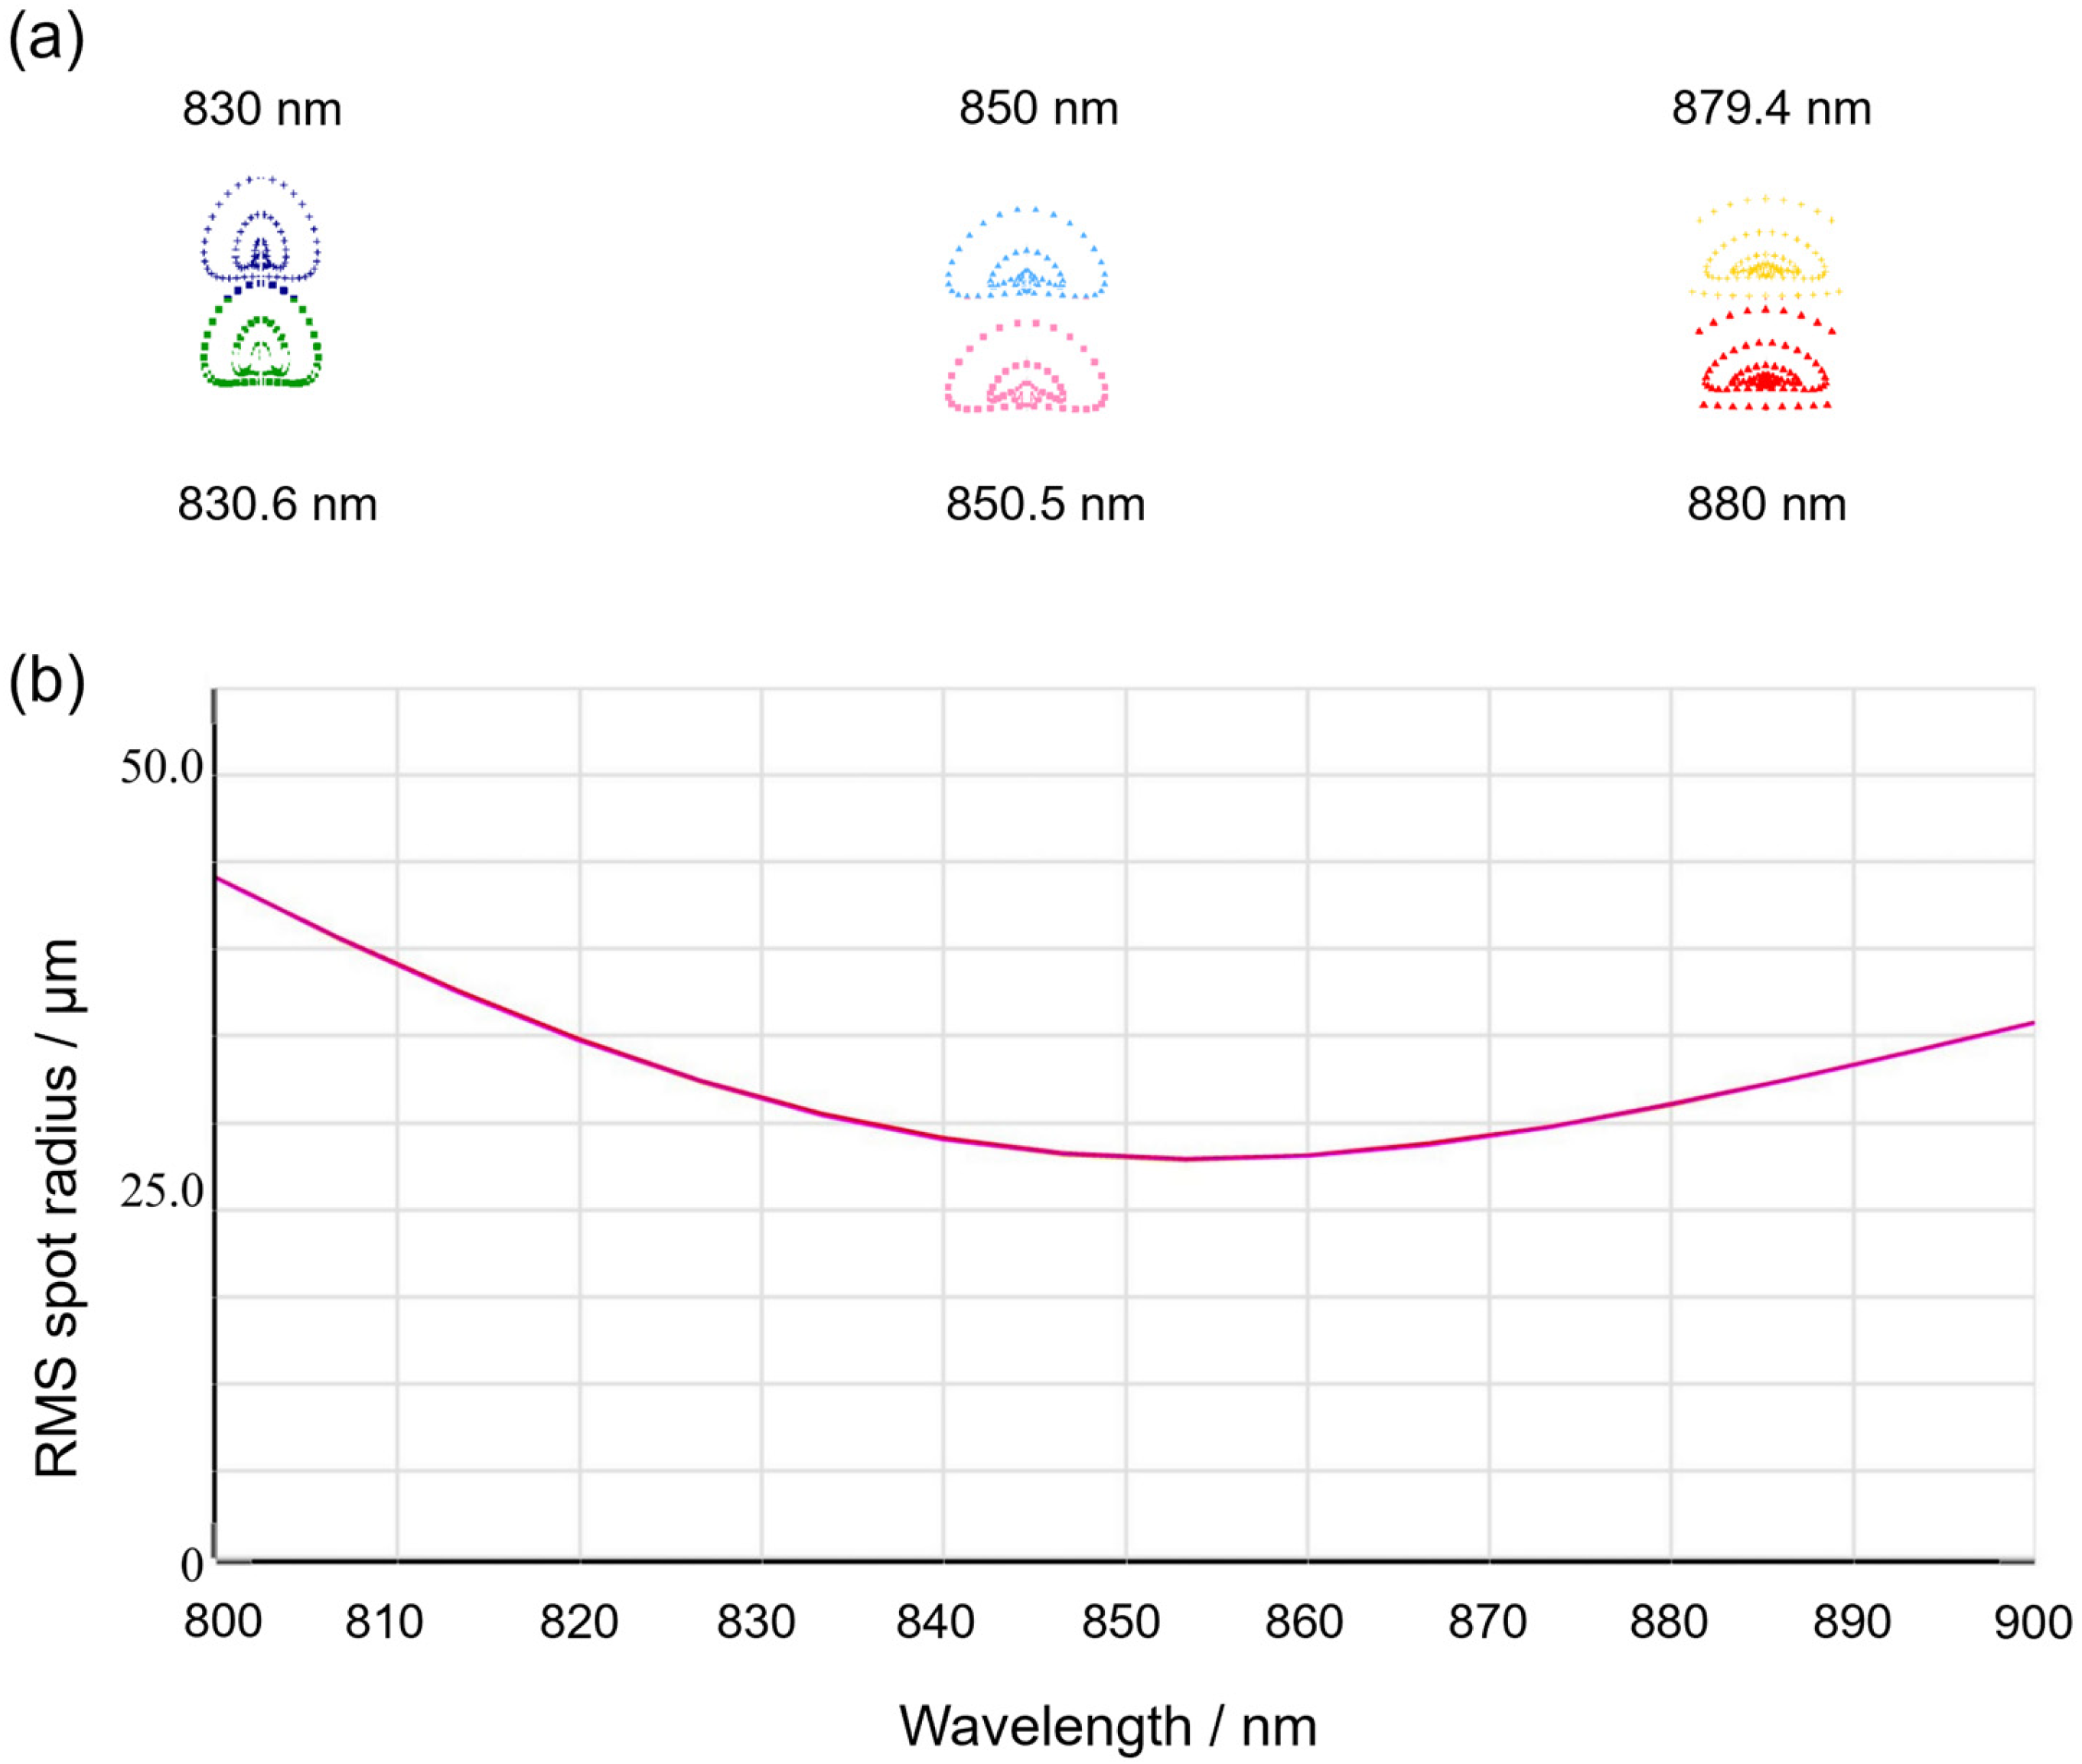
Figure 3a presents the spot diagrams for three sets of adjacent wavelengths, corresponding to 830/830.6 nm, 850/850.5 nm, and 879.4/880 nm, respectively. It can be seen that, for adjacent wavelengths differing by only 0.5–0.6 nm, the corresponding spots on the detector plane already exhibit clearly distinguishable positional shifts. Meanwhile, the spot shapes remain highly consistent, with no evident broadening or distortion. These results indicate that the designed dispersive system exhibits high imaging quality and stable linear dispersion over the 830–880 nm operating band, meeting the requirement for resolving small wavelength differences.
Figure 3b presents the variation in the Root Mean Square (RMS) spot radius over the 800–900 nm wavelength range. The RMS spot radius reaches a minimum of approximately 23 μm near 850 nm, indicating that the system achieves its best focusing performance in this spectral region. Near the band edges at 800 nm and 900 nm, the RMS spot radius increases to approximately 40 μm and 30 μm, respectively, owing to the accumulation of residual aberrations under broadband operation. Within the target operating band of 830–880 nm, however, the RMS spot radius remains below 30 μm and varies relatively smoothly, indicating that the system maintains good and stable imaging quality over the effective interrogation range. The minimum RMS spot radius is slightly larger than the size of a single CCD pixel, so the spot extends over multiple pixels on the image plane, which is beneficial for subsequent sub-pixel peak fitting.
4.2. FBG Strain–Wavelength Calibration and Error Analysis
To evaluate the interrogation performance of the proposed system in the 830–880 nm spectral range under axial strain loading, four FBGs with nominal Bragg wavelengths distributed within this range were selected as test samples. A point-by-point inscription technique was employed, in which the grating period was directly defined by precisely controlling the spacing between adjacent written points. This approach enables flexible wavelength design in the 850 nm band and facilitates wavelength allocation for multiple FBGs. The gratings were inscribed in a YOFC OM2 (50/125 μm) bending-insensitive graded-index multimode fiber (Yangtze Optical Fibre and Cable Joint Stock Limited Company, Wuhan, China) with a numerical aperture of 0.200 ± 0.015. The fiber exhibits an attenuation of ≤2.3 dB/km and an overfilled modal bandwidth of ≥500 MHz·km at 850 nm, making it suitable for FBG inscription and interrogation in the 830–880 nm spectral range.
Prior to the interrogation experiments, the central-wavelength responses of all FBGs were pre-calibrated using a commercial optical spectrum analyzer to provide reliable reference wavelengths. The reference instrument was a Yokogawa AQ6370D optical spectrum analyzer (Yokogawa Electric Corporation, Tokyo, Japan), featuring an operating wavelength range of 600–1700 nm, which covers the 850 nm band investigated in this work. The instrument has a wavelength accuracy of ±0.1 nm, selectable wavelength resolution settings of 0.05, 0.1, 0.2, 0.5, 1.0, and 2.0 nm, and a minimum sampling resolution of 0.001 nm. During the experiment, the axial strain was increased stepwise from 0 to 2000 με. At each strain level, after the loading condition had stabilized, the reflection spectra of the FBGs were successively acquired, and the corresponding central wavelength was extracted as the measurement result for that strain point. Ten repeated measurements were performed at each strain level, with an interval of approximately 60 s between consecutive measurements, in order to reduce the influence of short-term fluctuations. The repeated measurements were then statistically analyzed to obtain the mean central wavelength at each strain level together with its 95% bias-corrected and accelerated (BCa) bootstrap confidence interval, on the basis of which the strain–wavelength calibration curves of the four FBGs were established.
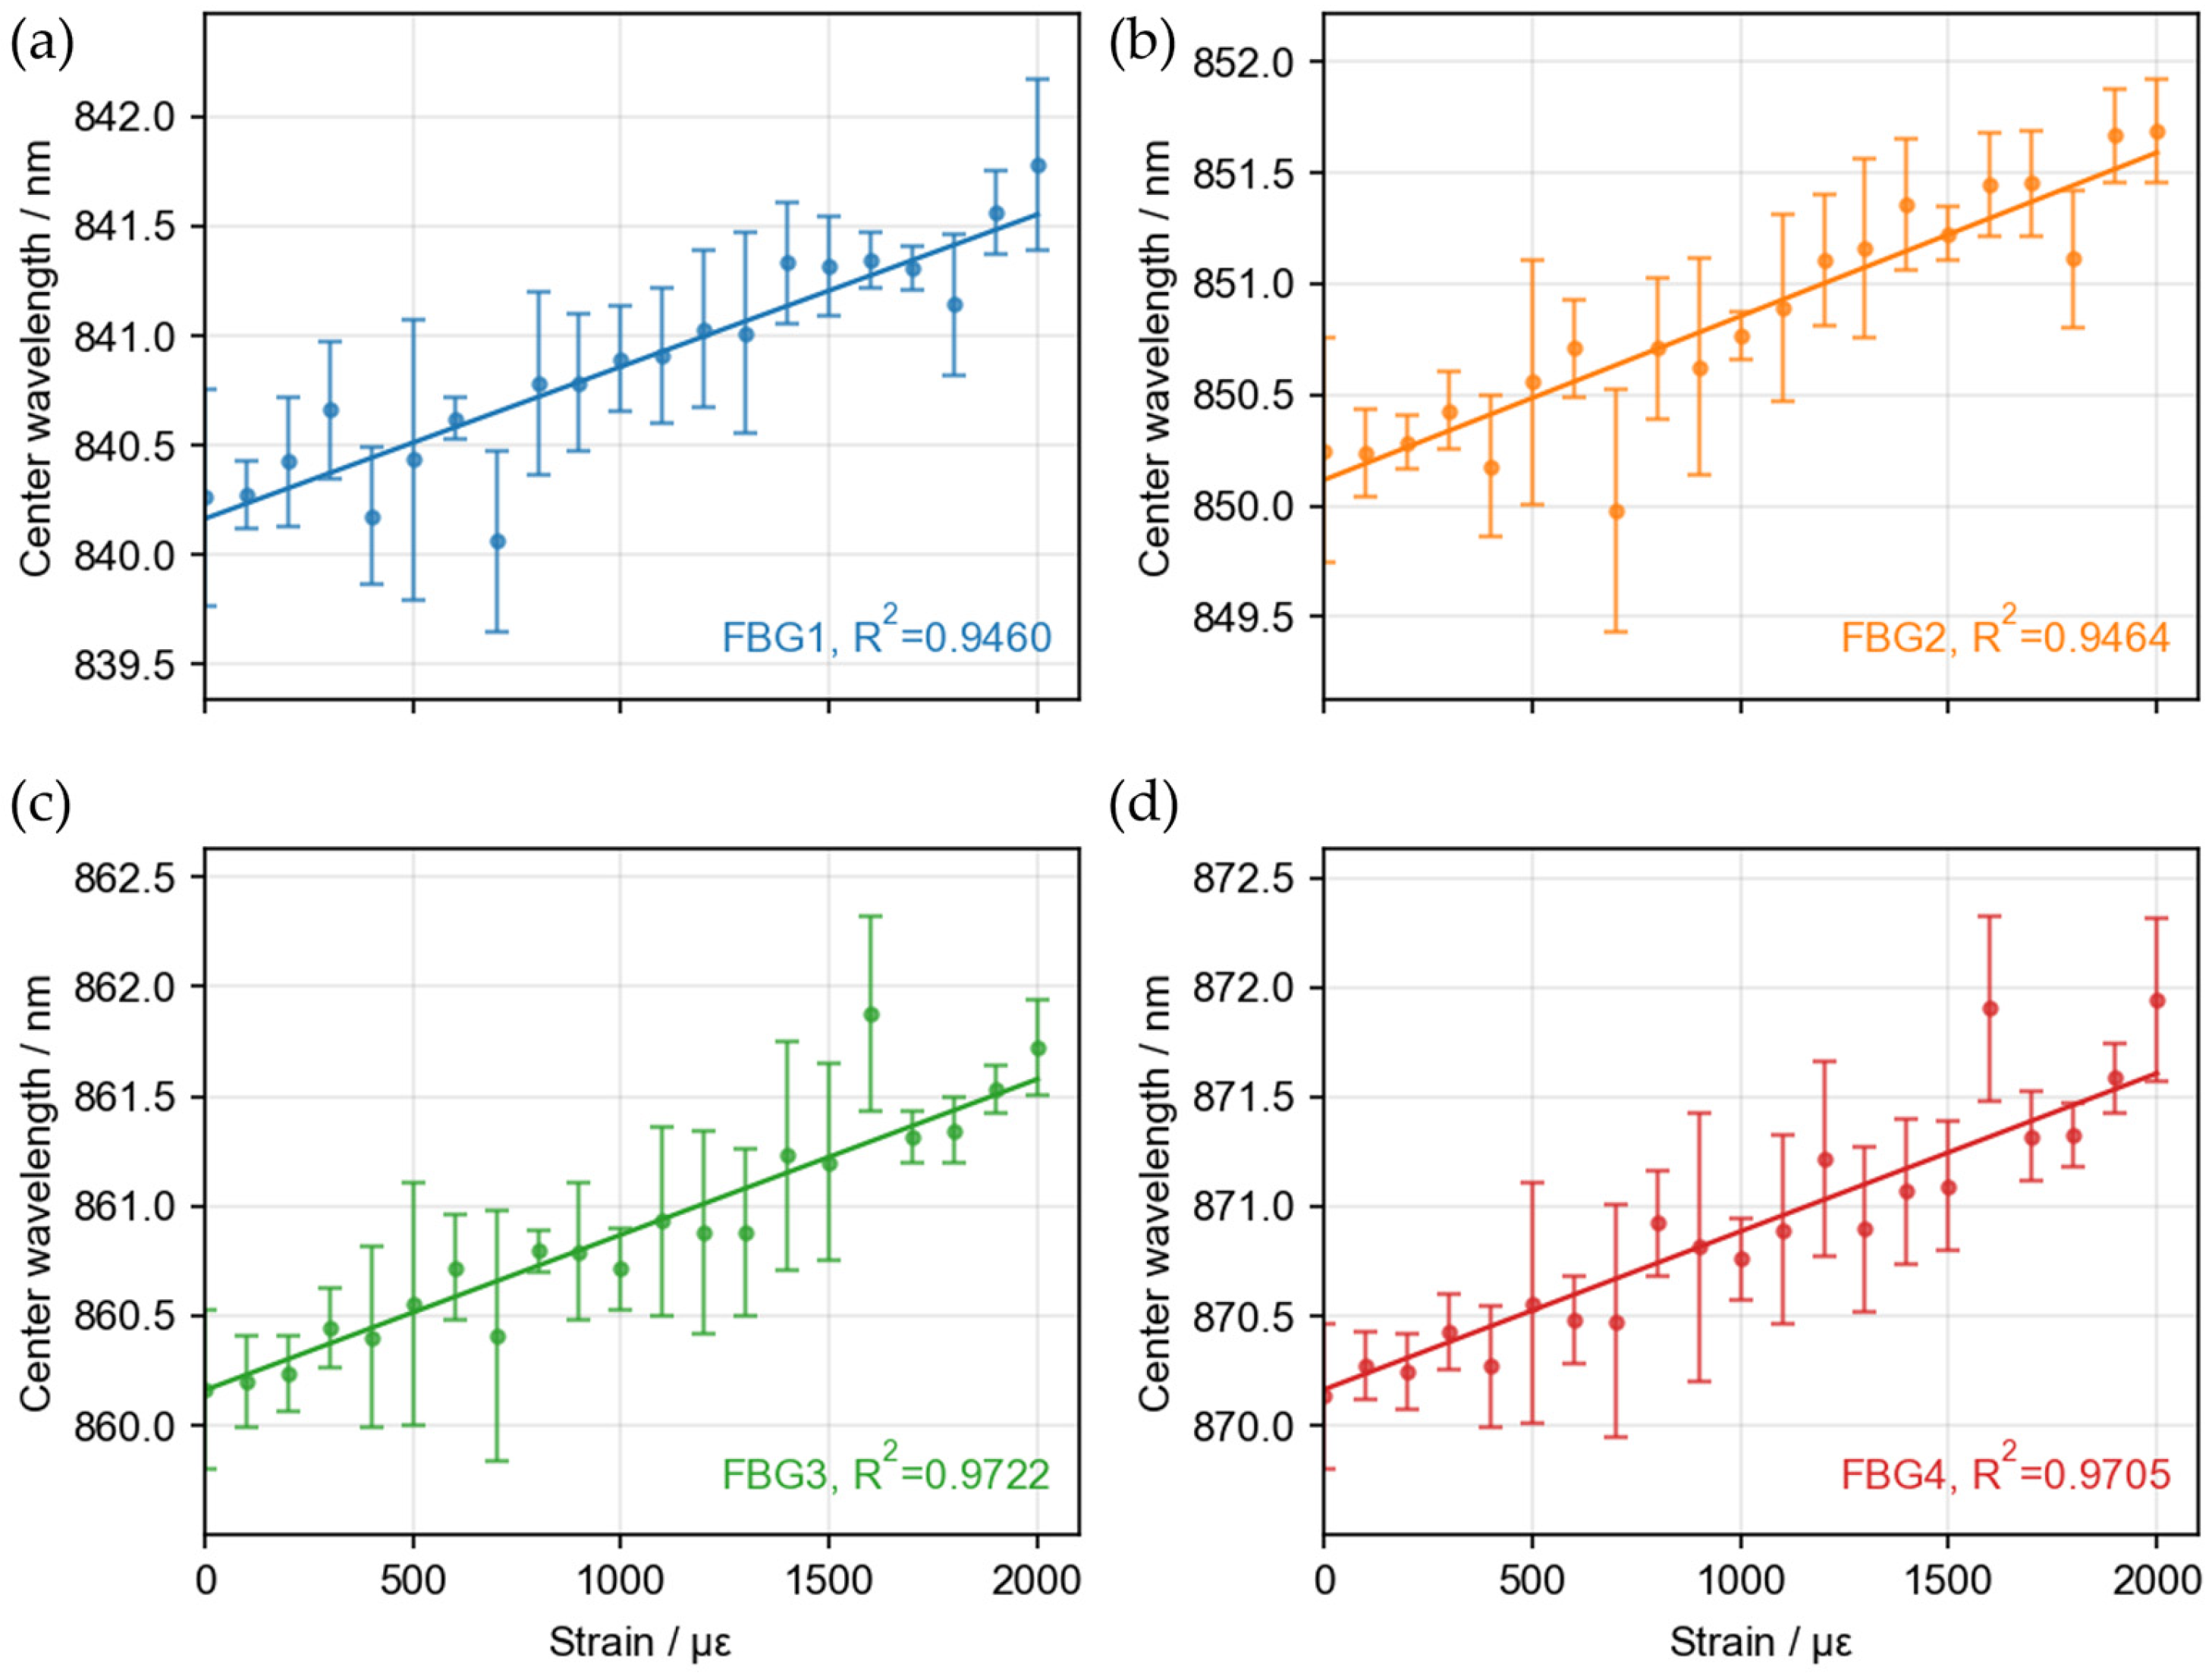
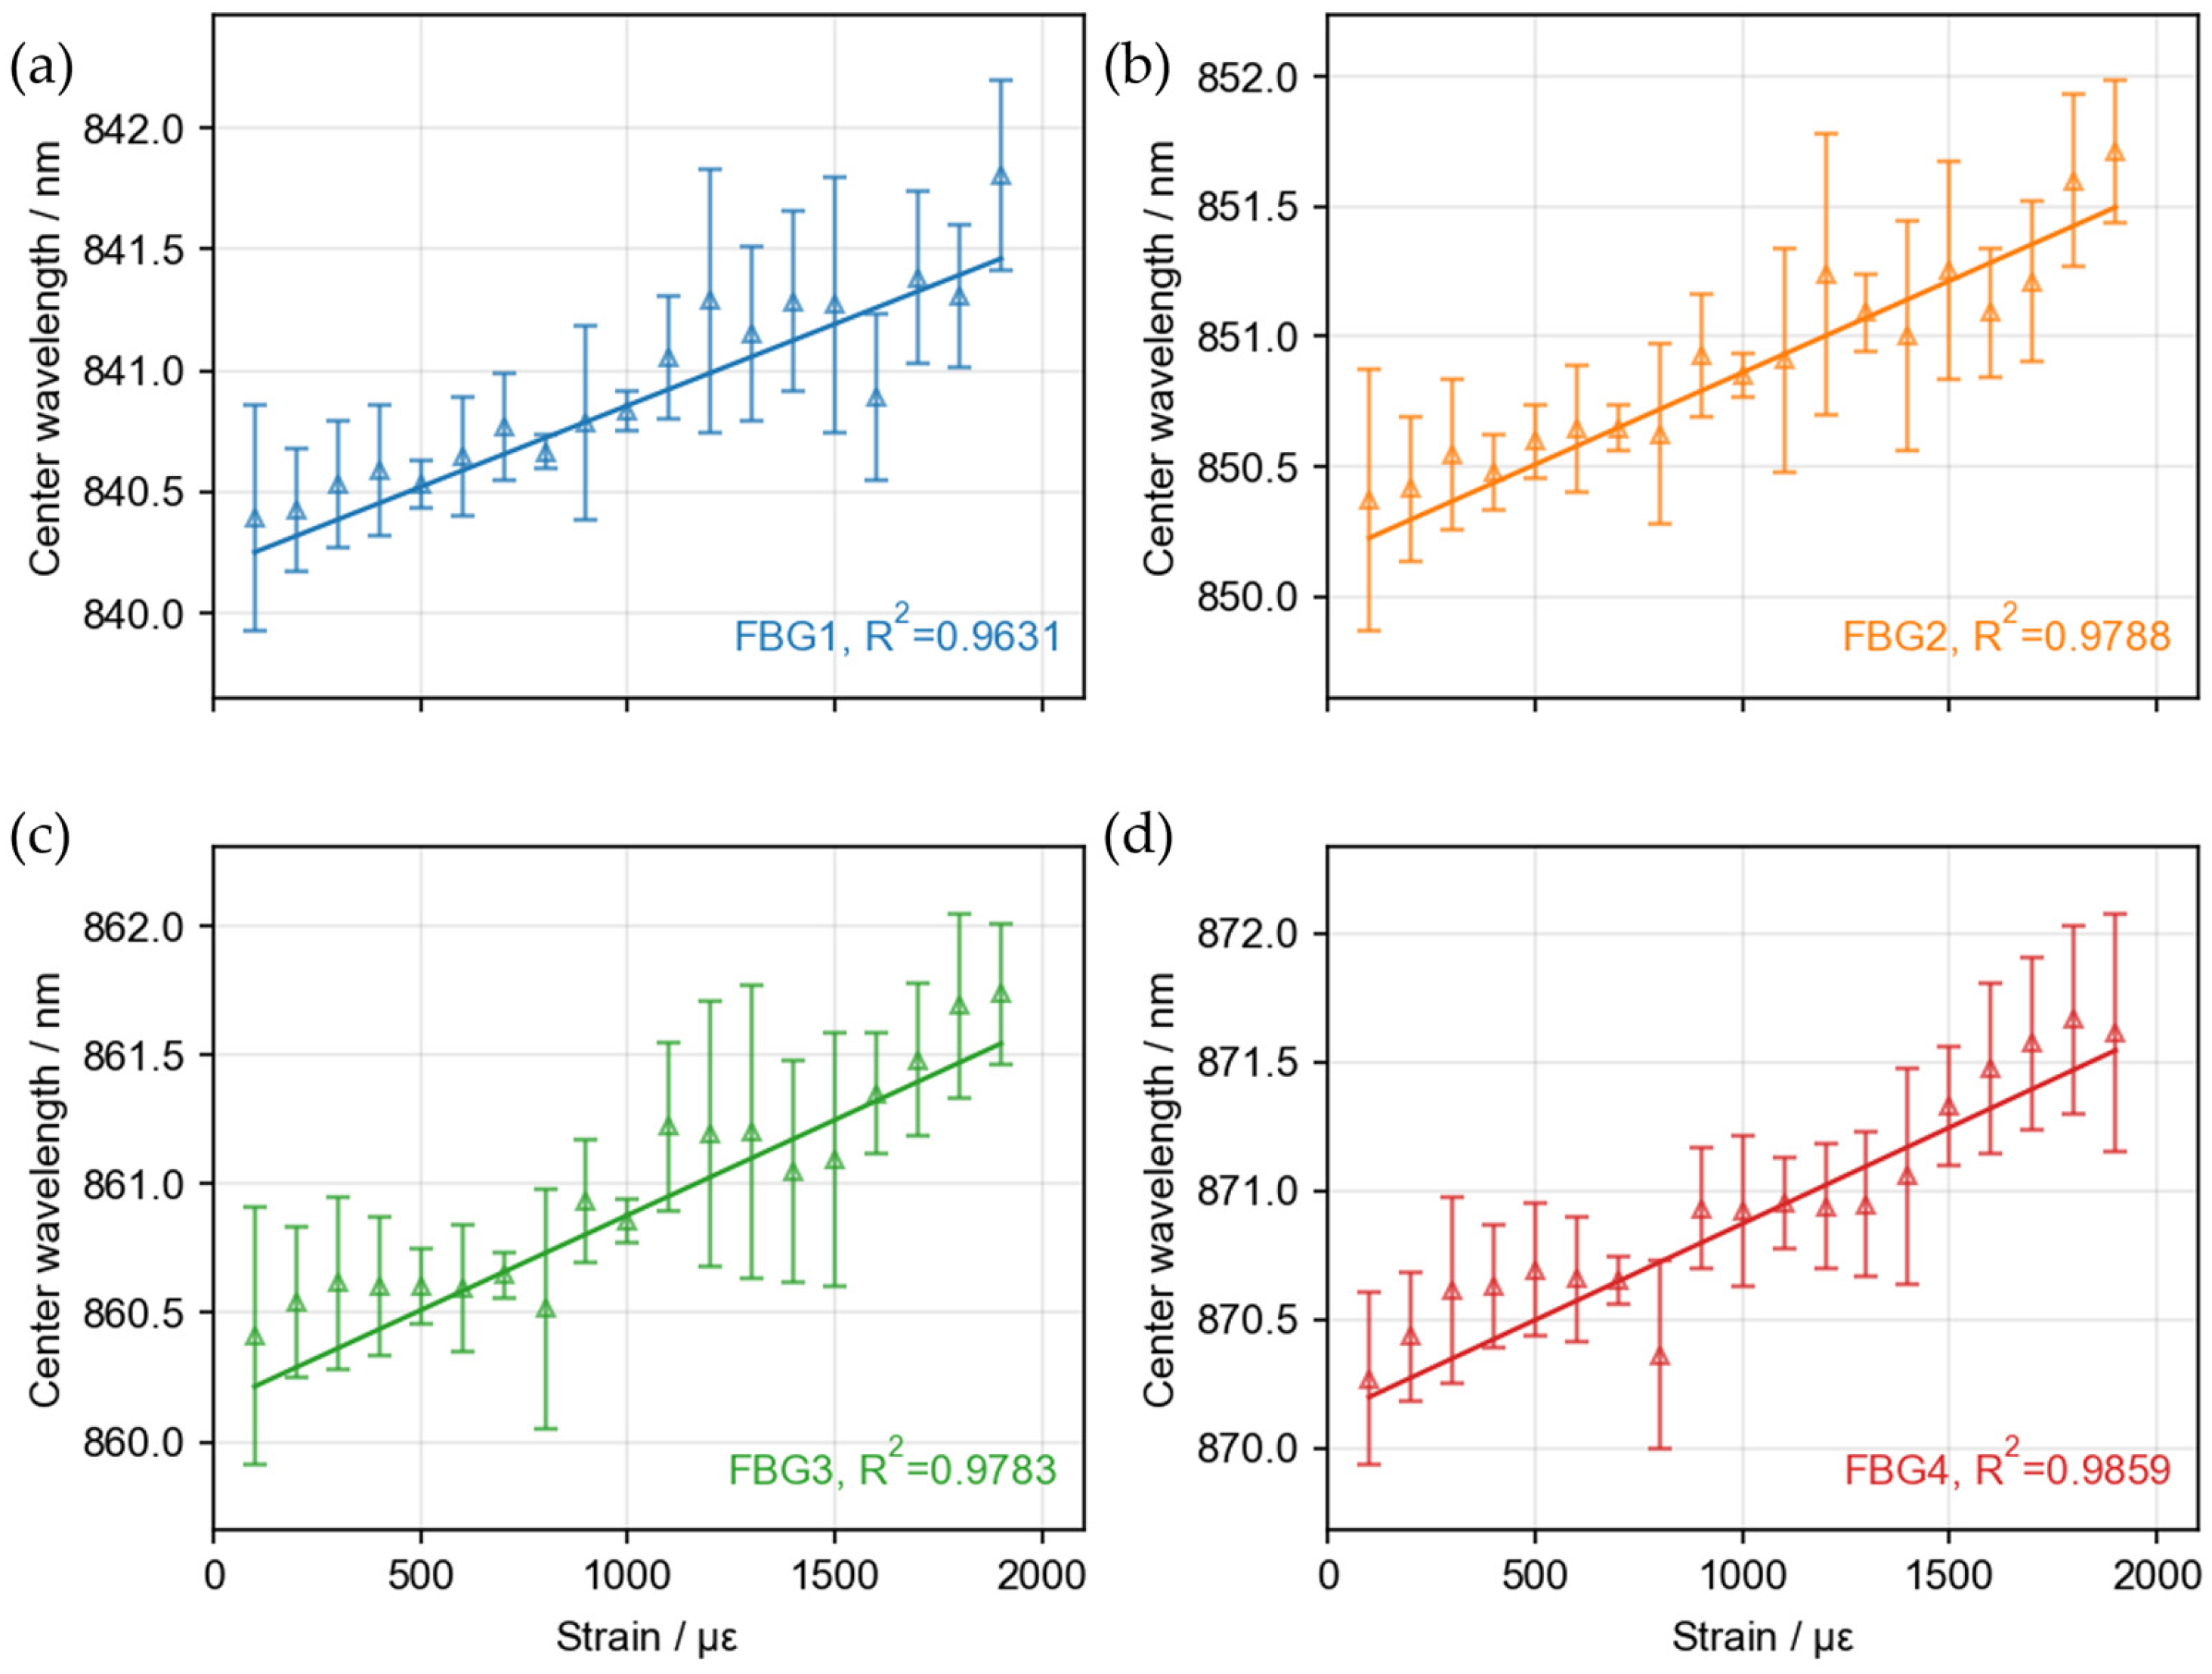
Figure 4a–d presents the central wavelength responses of the four FBGs during the loading phase, where the filled circles denote the loading data. As the axial strain increases, the central wavelength of each FBG exhibits a clear approximately linear shift. The error bars represent the 95% BCa bootstrap confidence intervals of the mean central wavelength at each strain level, while the solid lines denote the first-order linear fits to the loading data, with the corresponding coefficients of determination indicated in the plots. After completion of the loading calibration, stepwise unloading measurements were further carried out over the same strain range to evaluate the reversibility and consistency of the calibration relationship.
Figure 5a–d presents the strain–wavelength responses of the four FBGs during the unloading phase, where the open triangles denote the unloading data, and the remaining statistical and fitting conventions are identical to those used in
Figure 4. The loading and unloading results are generally consistent, indicating that the established calibration relationship possesses good linearity, stability, and repeatability. Overall, these results confirm the consistency and reversibility of the strain response of the four FBGs within the 830–880 nm spectral range, yielding the strain–wavelength calibration curves that provide a reliable basis for subsequent interrogation performance evaluation and sensitivity fitting analysis.
The strain sensitivity
was obtained from the slope of the linear regression between the Bragg–wavelength shift
(relative to the baseline) and the applied axial strain
, i.e.,
(pm/με), where
is the effective photoelastic coefficient. For silica-based FBGs,
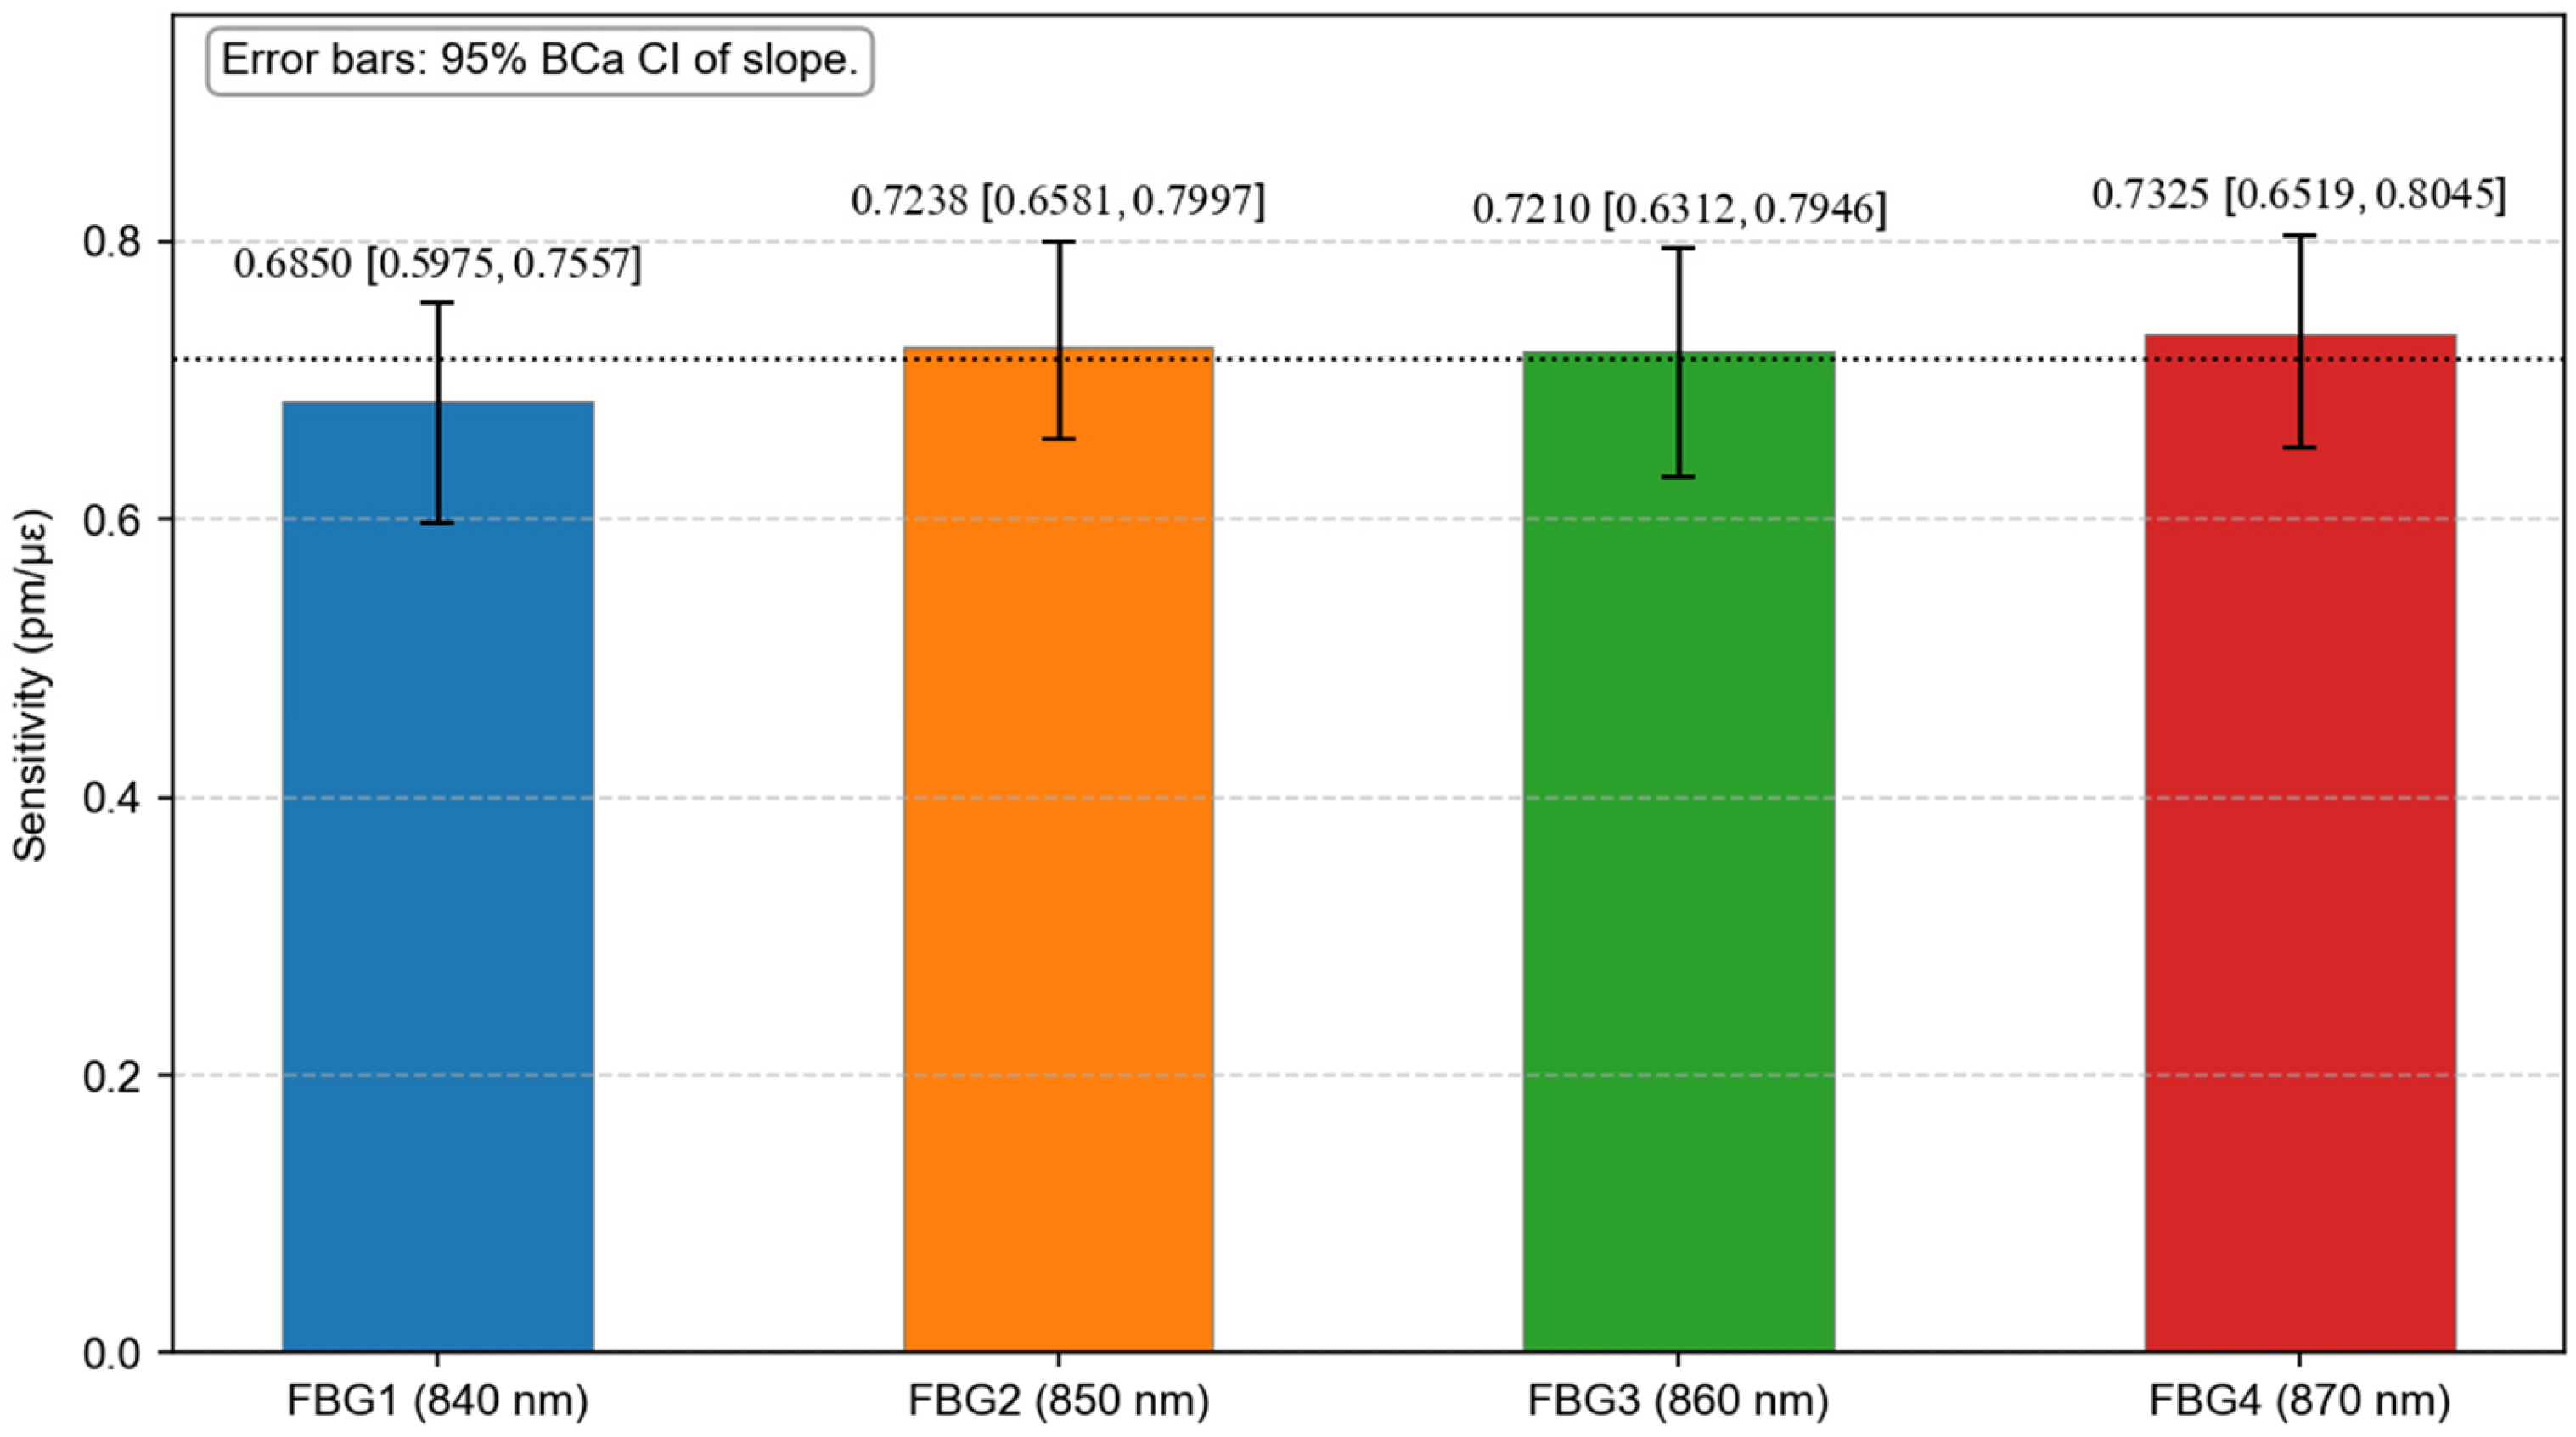
is typically taken as approximately 0.22. This parameter characterizes the wavelength response to small strain variations. Therefore, over the 840–870 nm wavelength range investigated in this work, the theoretical strain sensitivity is approximately 0.6552–0.6786 pm/με. This indicates that the strain sensitivity is expected to increase slightly with the Bragg wavelength, and these values can serve as the theoretical reference for comparison with the experimentally measured sensitivities. The sensitivity results obtained from the calibration experiments for the FBGs with central wavelengths distributed over the 830–880 nm range are presented in
Figure 6. The strain sensitivities of the four FBGs are approximately 0.6850, 0.7238, 0.7210, and 0.7325 pm/με, respectively. For comparison, according to the classical strain response model of silica-based FBGs, the theoretical strain sensitivity is approximately 0.6630 pm/με at 850 nm, while the corresponding theoretical range over the 840–870 nm wavelength interval considered in this work is about 0.6552–0.6786 pm/με. It can therefore be seen that the experimentally obtained sensitivities are slightly higher than the first-order theoretical estimates given by the ideal model, but remain in the same overall range. This discrepancy may arise from the combined effects of the multimode graded index fiber structure, the point-by-point inscription process, residual stress, strain-transfer conditions, and experimental uncertainties in peak extraction and linear fitting. First, the gratings in this work were inscribed in a YOFC OM2 (50/125 μm) bending-insensitive graded index multimode fiber rather than in a standard single-mode fiber. As a result, the actual material doping profile, graded index structure, multimode propagation characteristics, and bend-insensitive design may lead to an effective strain response that deviates from that predicted by the ideal single-mode silica FBG model. Second, the point-by-point inscription process may introduce local variations in refractive index modulation and residual stress, which can also affect the strain response. In addition, the clamping and loading conditions, strain transfer efficiency, axial alignment, and experimental uncertainties in peak extraction and linear fitting may all contribute to the final fitted sensitivities. The four FBGs centered at 840, 850, 860, and 870 nm were employed primarily as sampling points to evaluate the interrogation performance at different wavelengths within the useful bandwidth. For a single FBG, the measurable strain range should be more reasonably constrained by the mechanical allowable strain of the fiber/grating rather than by the total optical bandwidth of the system. Considering that the adopted YOFC OM2 multimode fiber is specified with a proof test of at least 1.0%, a strain level on the order of 10,000 με may be taken as a conservative engineering reference for the potential measurement range of a single FBG. Combined with the experimentally obtained sensitivities of approximately 0.6850–0.7325 pm/με, this corresponds to a wavelength excursion of about 6.85–7.33 nm for one FBG. It should be emphasized that the strain range experimentally validated in the present work is 0–2000 με; therefore, the larger range discussed above is only an order-of-magnitude estimate rather than an experimentally demonstrated operating limit. Temperature cross-sensitivity may also affect the wavelength response of FBGs. To minimize the influence of temperature, the strain calibration experiments in this work were carried out under quasi-constant ambient conditions without intentional thermal perturbation. Under these conditions, the contribution of temperature variation to the fitted strain sensitivities is considered to be small. Overall, these results indicate that the four FBGs exhibit stable, repeatable, and approximately linear strain responses within the 830–880 nm spectral range, thereby providing a reliable calibration basis for the subsequent evaluation of the interrogation performance.
Considering that only 10 repeated measurements were performed at each strain level, and that the repeated measurement data at some strain points did not strictly satisfy the normality assumption, 95% BCa bootstrap confidence intervals were adopted in this subsection to quantify the uncertainty of the mean central wavelength at each strain level. Compared with parametric interval estimation methods, the BCa bootstrap approach relies less strongly on the underlying data distribution and is therefore more suitable for the present small-sample repeated measurement scenario, providing a more robust representation of the calibration error bars. It should be noted that the BCa confidence intervals were used here to characterize the uncertainty of the mean estimates at individual strain points, whereas the subsequent RMS values were retained only as descriptive metrics of error magnitude and fitting residuals to characterize the deviation of the experimental data from the ideal linear relationship or the reference values, rather than as the sole statistical metric based on a Gaussian error assumption.
4.3. Wavelength–Pixel Calibration and Experimental Performance Validation of the C–T Spectrometer
To experimentally verify the actual optical performance of the designed C–T spectrometer within the target wavelength band and to establish the wavelength–pixel mapping required for subsequent interrogation, a NKT Photonics SuperK COMPACT (NKT Photonics A/S, Birkerød, Denmark) broadband light source combined with a SuperK SELECT tunable optical filter (NKT Photonics A/S, Birkerød, Denmark) was employed to generate a series of narrowband input signals with known central wavelengths. In the wavelength–pixel calibration experiment, a broadband light source combined with a tunable optical filter was employed to generate 21 known central wavelengths within the target spectral range as calibration points. Each selected wavelength was sequentially launched into the optical system, and the corresponding spectral images were recorded by the C–T imaging spectrometer. Gaussian fitting was then applied to each spectral peak to accurately determine the peak pixel position. Based on the known wavelengths and their corresponding peak pixel positions, a calibration mapping relationship between the wavelength
and the pixel position
of the C–T spectrometer was established
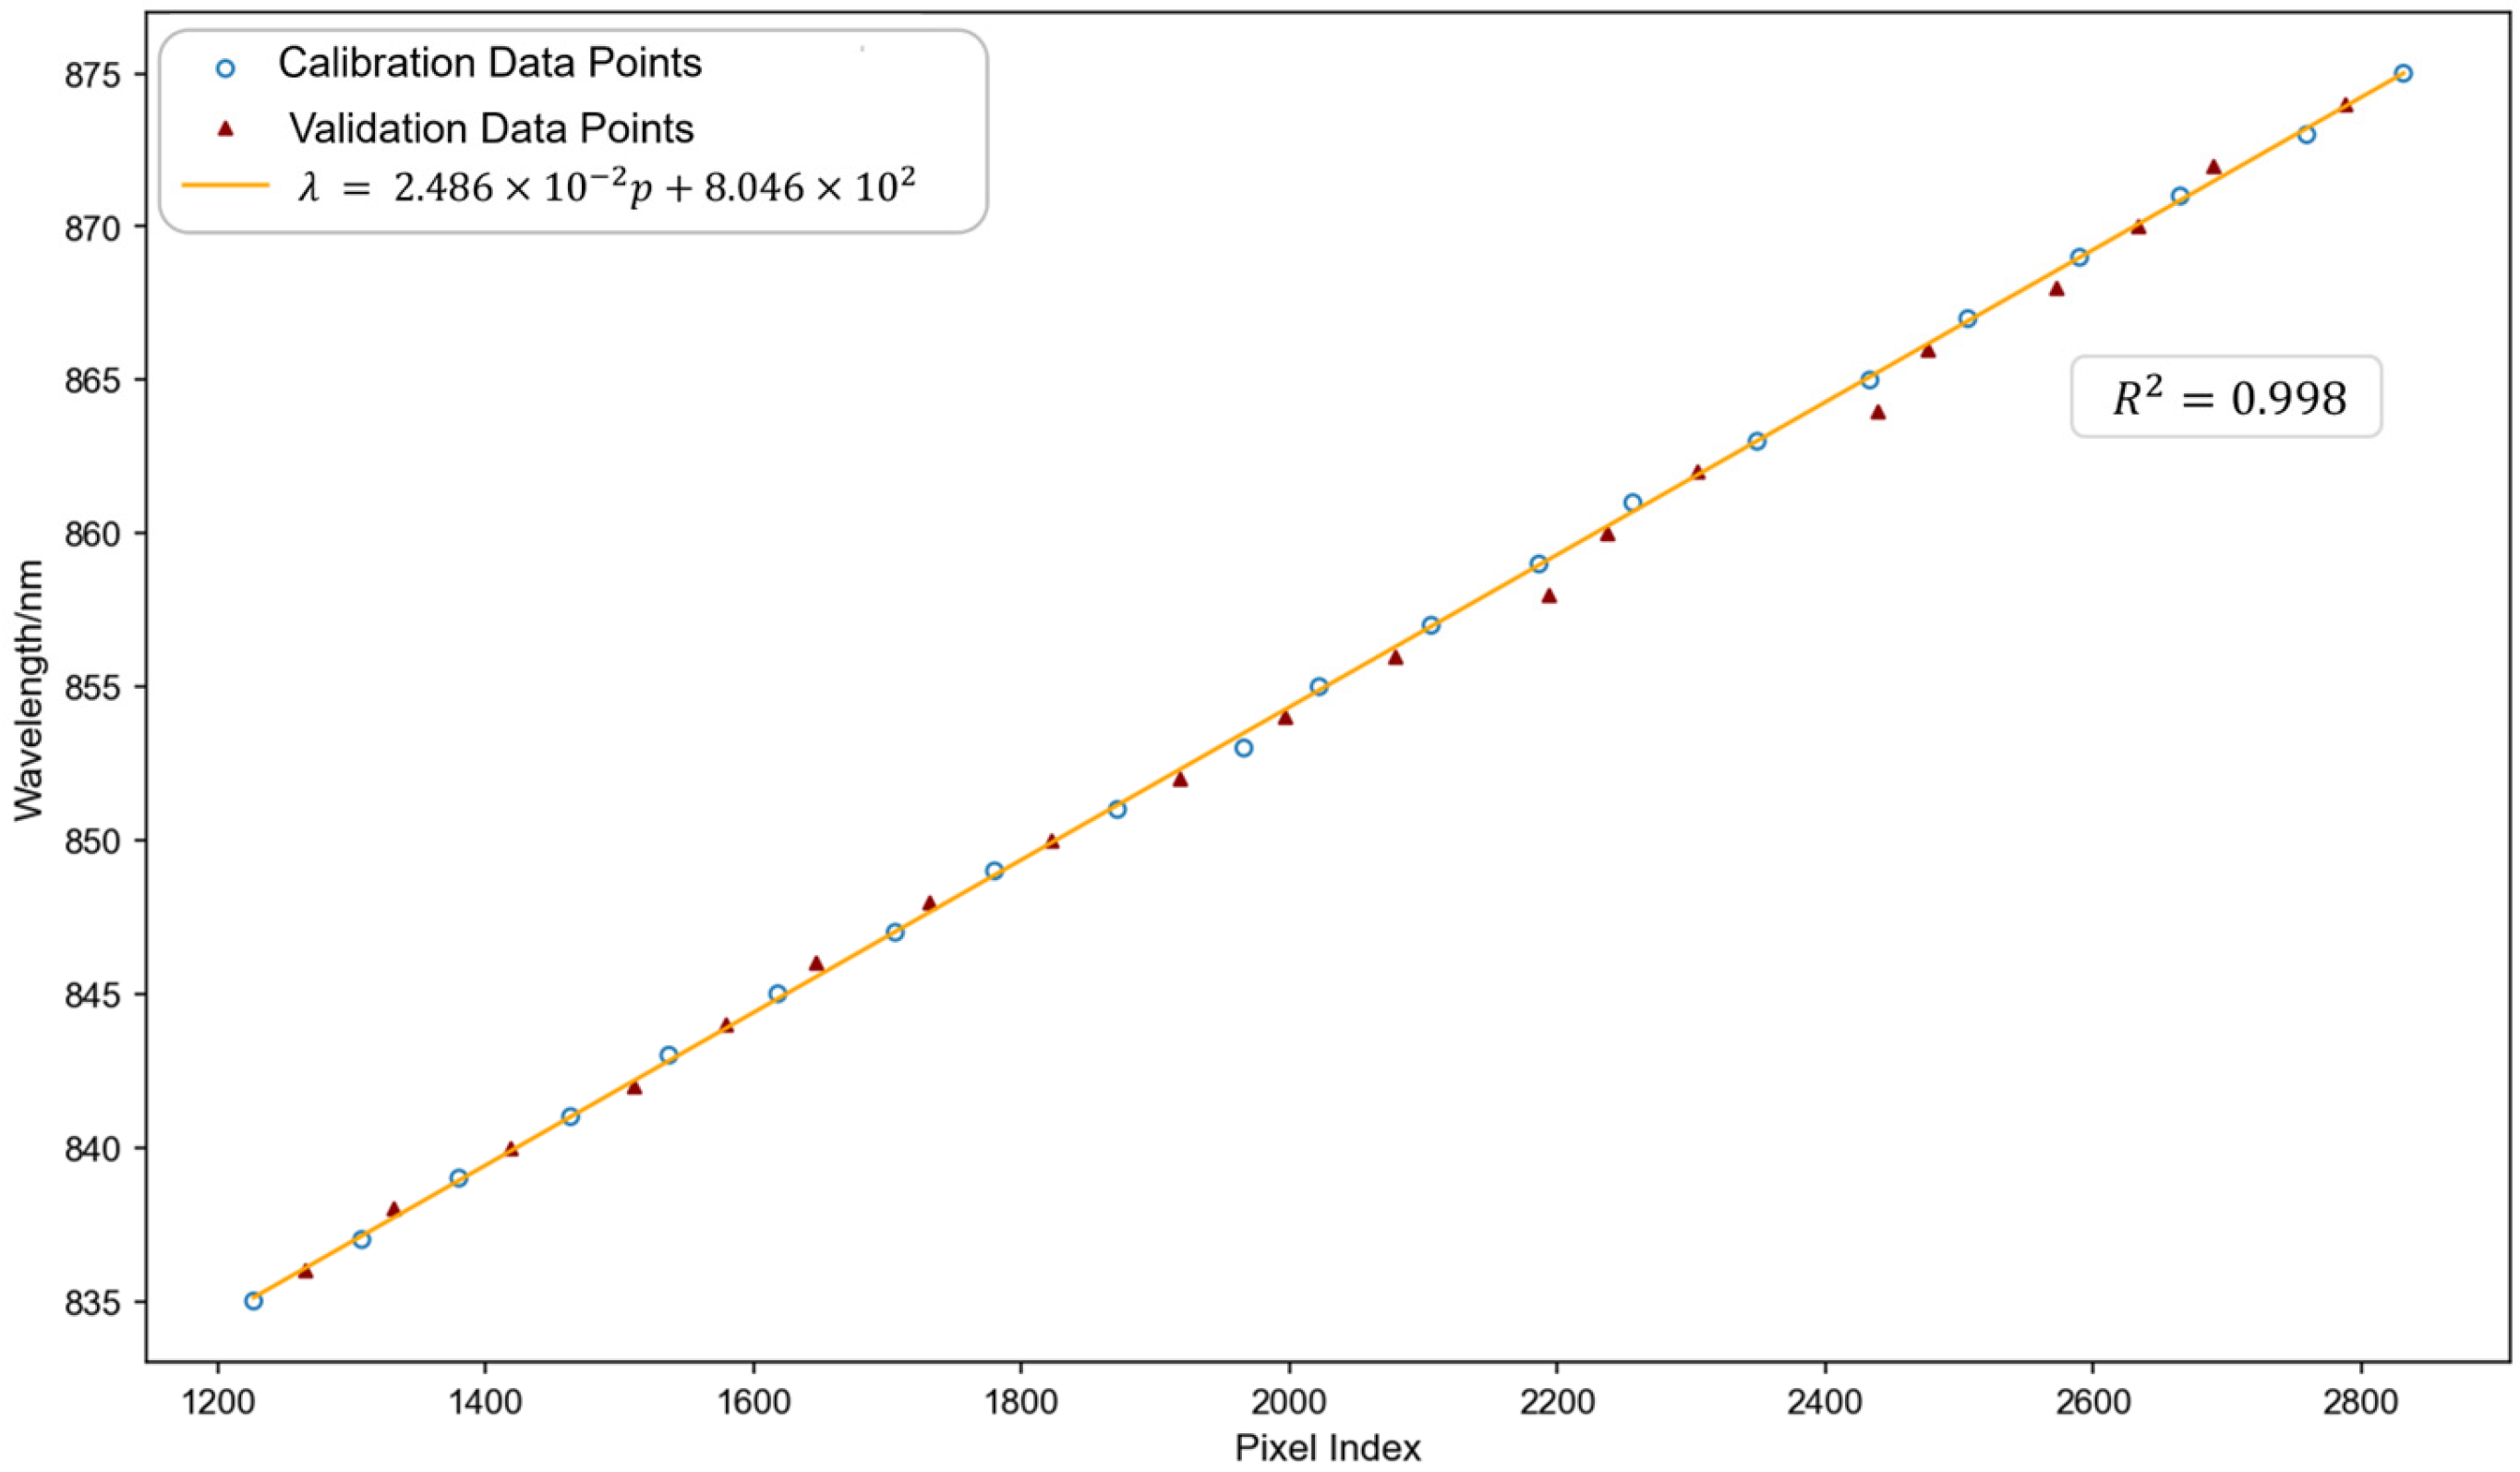
. To evaluate the predictive accuracy and stability of the established wavelength–pixel mapping model, an additional set of 20 known wavelengths was selected as validation points. These validation wavelengths were not involved in the fitting procedure and were used solely for model accuracy assessment and residual analysis. The validation wavelengths were generated using the same broadband light source and tunable optical filter, and the corresponding peak pixel positions were extracted following the identical spectral acquisition and Gaussian fitting procedure employed during the calibration stage. The fitting results are presented in
Figure 7, where the solid line represents the polynomial fitting curve, circular markers denote the calibration data points, and triangular markers indicate the validation data points. The fitted curve spans the entire operating wavelength range. Both the calibration and validation data are closely distributed around the fitted curve without observable systematic deviation. According to the fitting results, the coefficient of determination (
R2) reaches 0.998, indicating that the established wavelength–pixel mapping model exhibits excellent predictive accuracy.
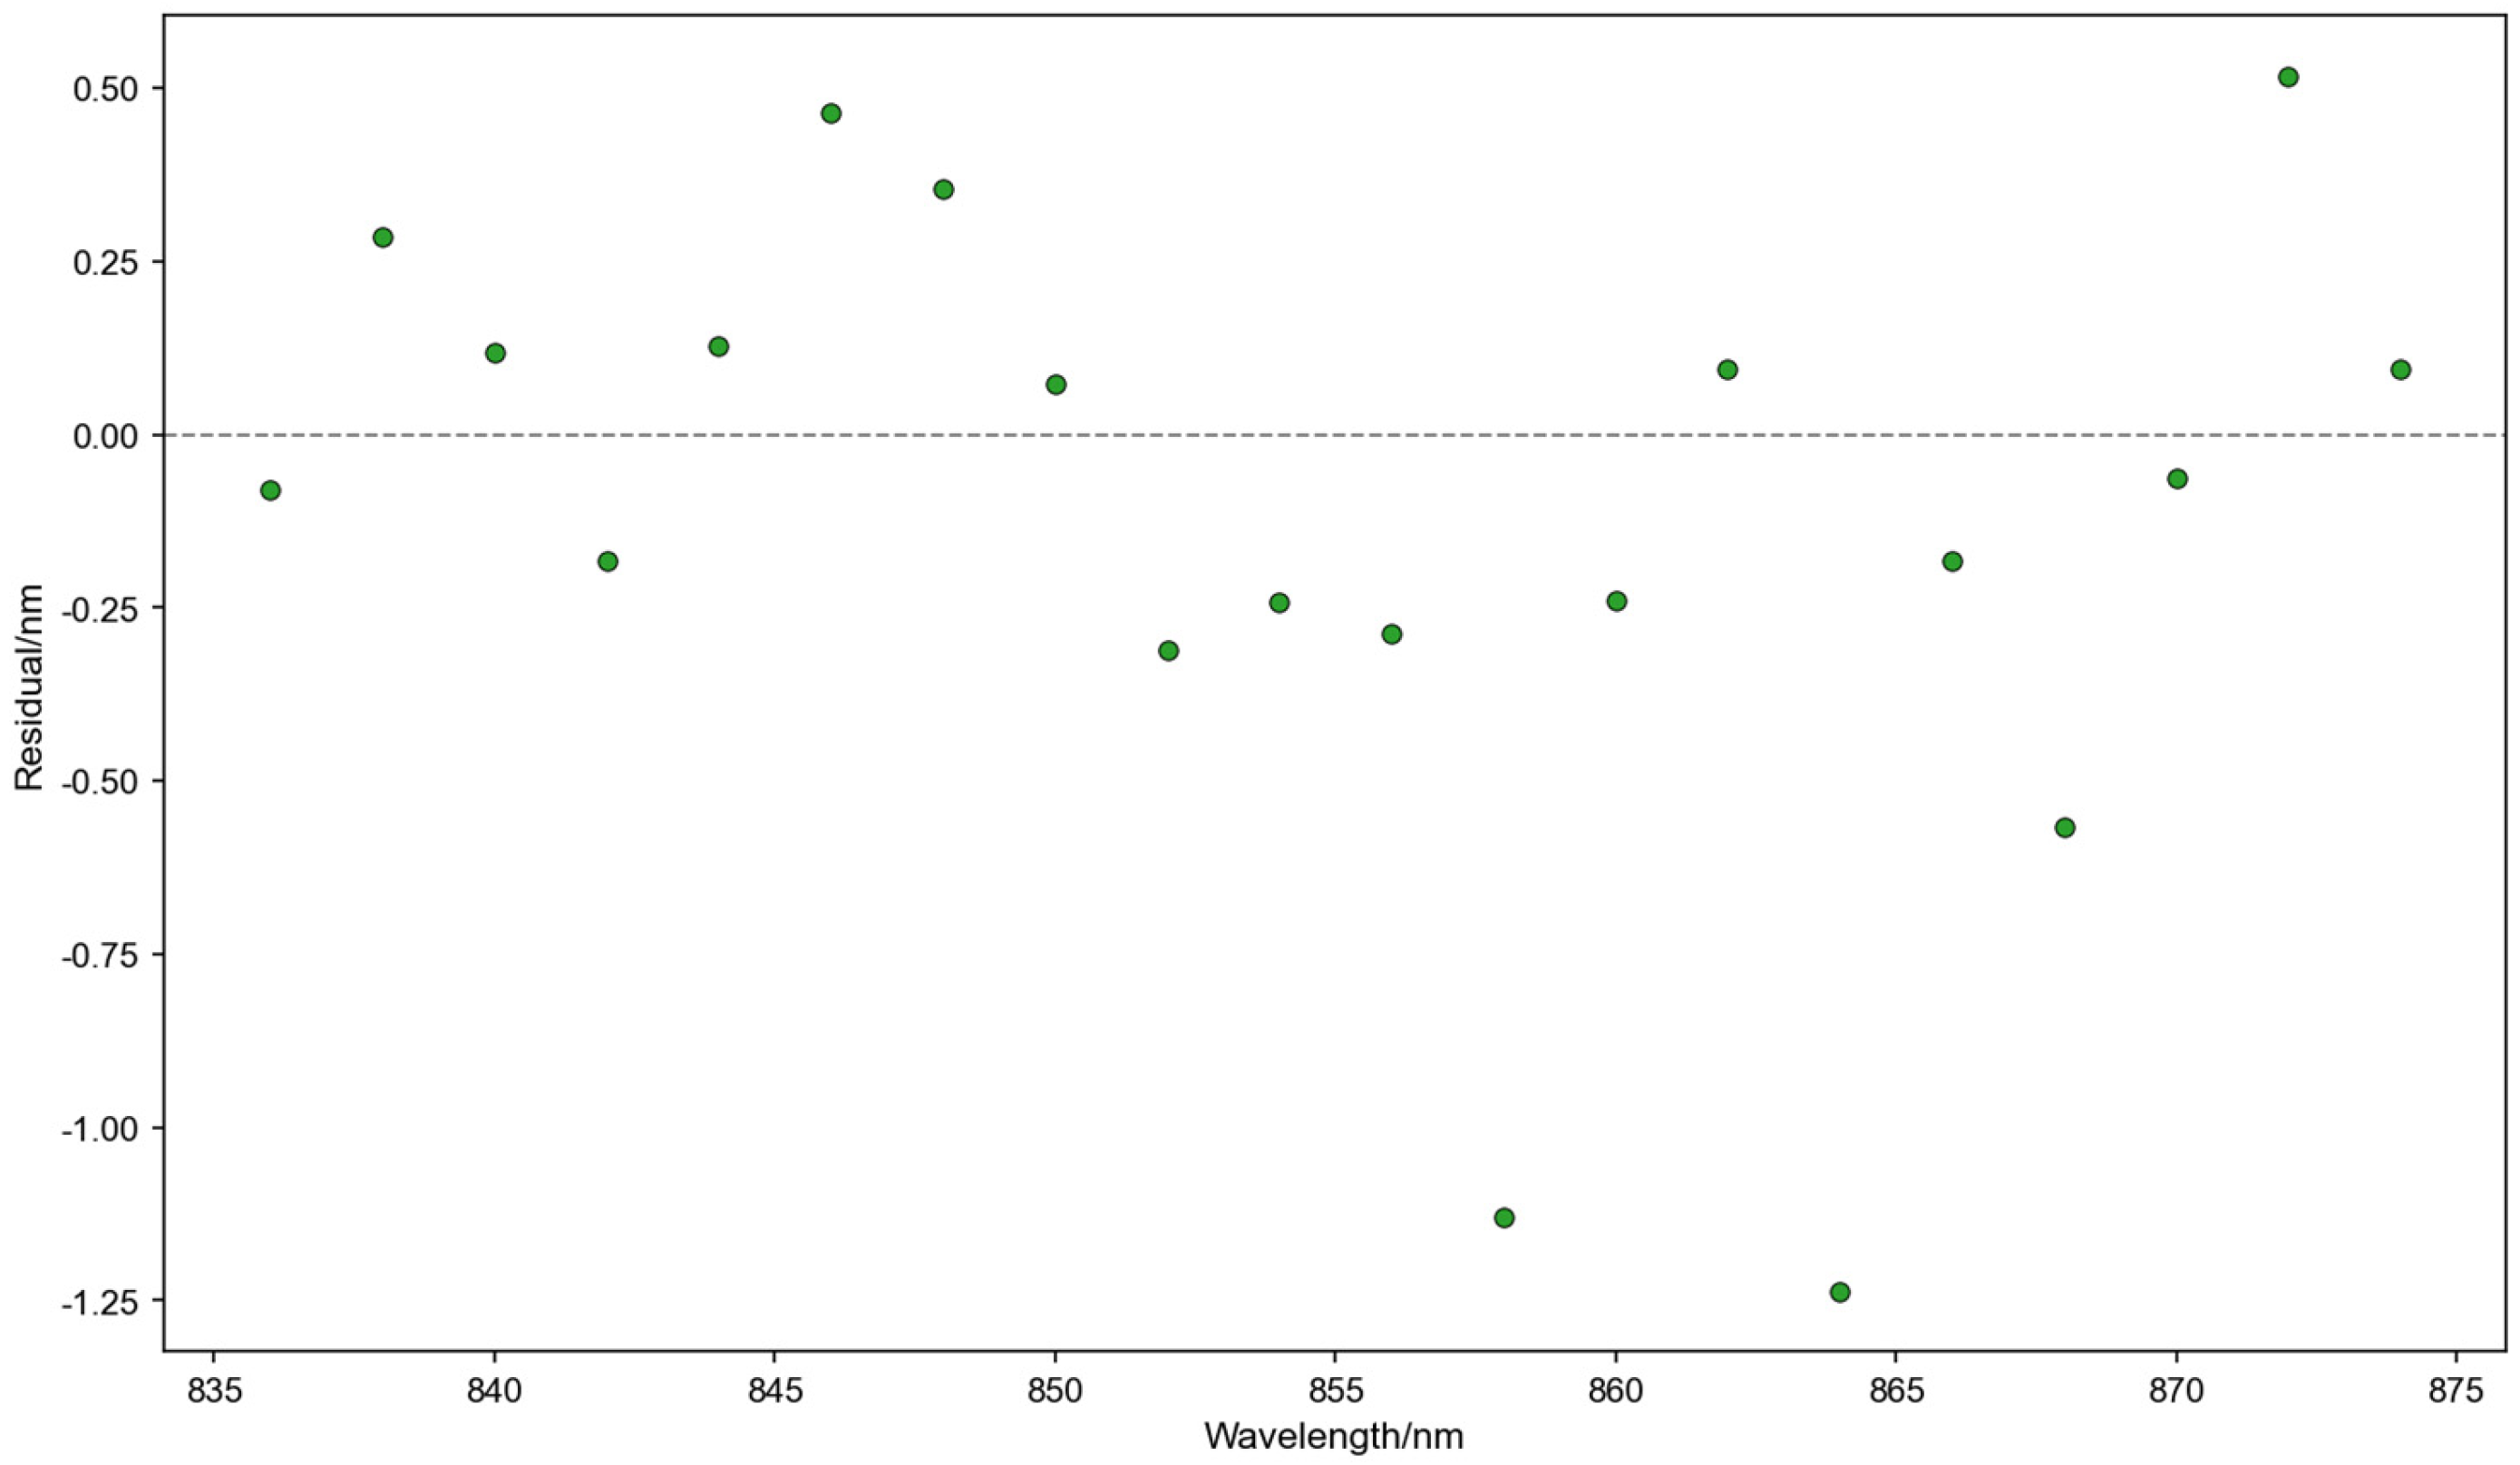
To further assess the accuracy of the wavelength–pixel calibration in a quantitative manner, the fitting residuals of the validation data were analyzed, and the resulting residual distribution is presented in
Figure 8. The residual
is defined as the difference between the reference wavelength
provided by the broadband light source combined with a tunable filter and the fitted wavelength
calculated from the pixel index
using the calibration equation (
. The residual
denotes the global validation residual of the wavelength–pixel calibration model, rather than the end-to-end demodulation error of the FBG interrogator. Therefore, this metric is mainly used to assess the wavelength-mapping capability of the C–T spectrometer, the spectral peak localization performance, and the consistency of the calibration model across the whole band. Statistical analysis of the residuals indicates that the maximum absolute error is 1.24 nm, while global validation RMS residual of the wavelength–pixel calibration model is 0.46 nm. It can be observed that the wavelength fitting residuals remain within a small range across the entire operating band and do not exhibit any evident systematic bias or monotonic trend. This residual accuracy provides a reliable basis for the wavelength–pixel calibration and meets the wavelength measurement requirements for subsequent FBG demodulation experiments.
In addition, although a separate dedicated two-dimensional Point Spread Function (PSF) measurement was not carried out in this work, the above narrowband-input experiment provides an experimental validation of the actual image formation performance of the spectrometer in terms of spectral peak compactness, peak localization capability, and wavelength-mapping accuracy. The narrowband spectral peaks could be stably identified and accurately fitted throughout the target band, while the validation residuals remained small and free of obvious systematic deviation. These results indicate that the realized optical performance of the spectrometer is generally consistent with the ZEMAX-optimized design. Therefore, this experiment serves as an experimental support for the effectiveness of the optical optimization, even though it is not a standalone full-field PSF metrology measurement.
4.4. Experimental Setup and Parameter Configuration of the Interrogation System
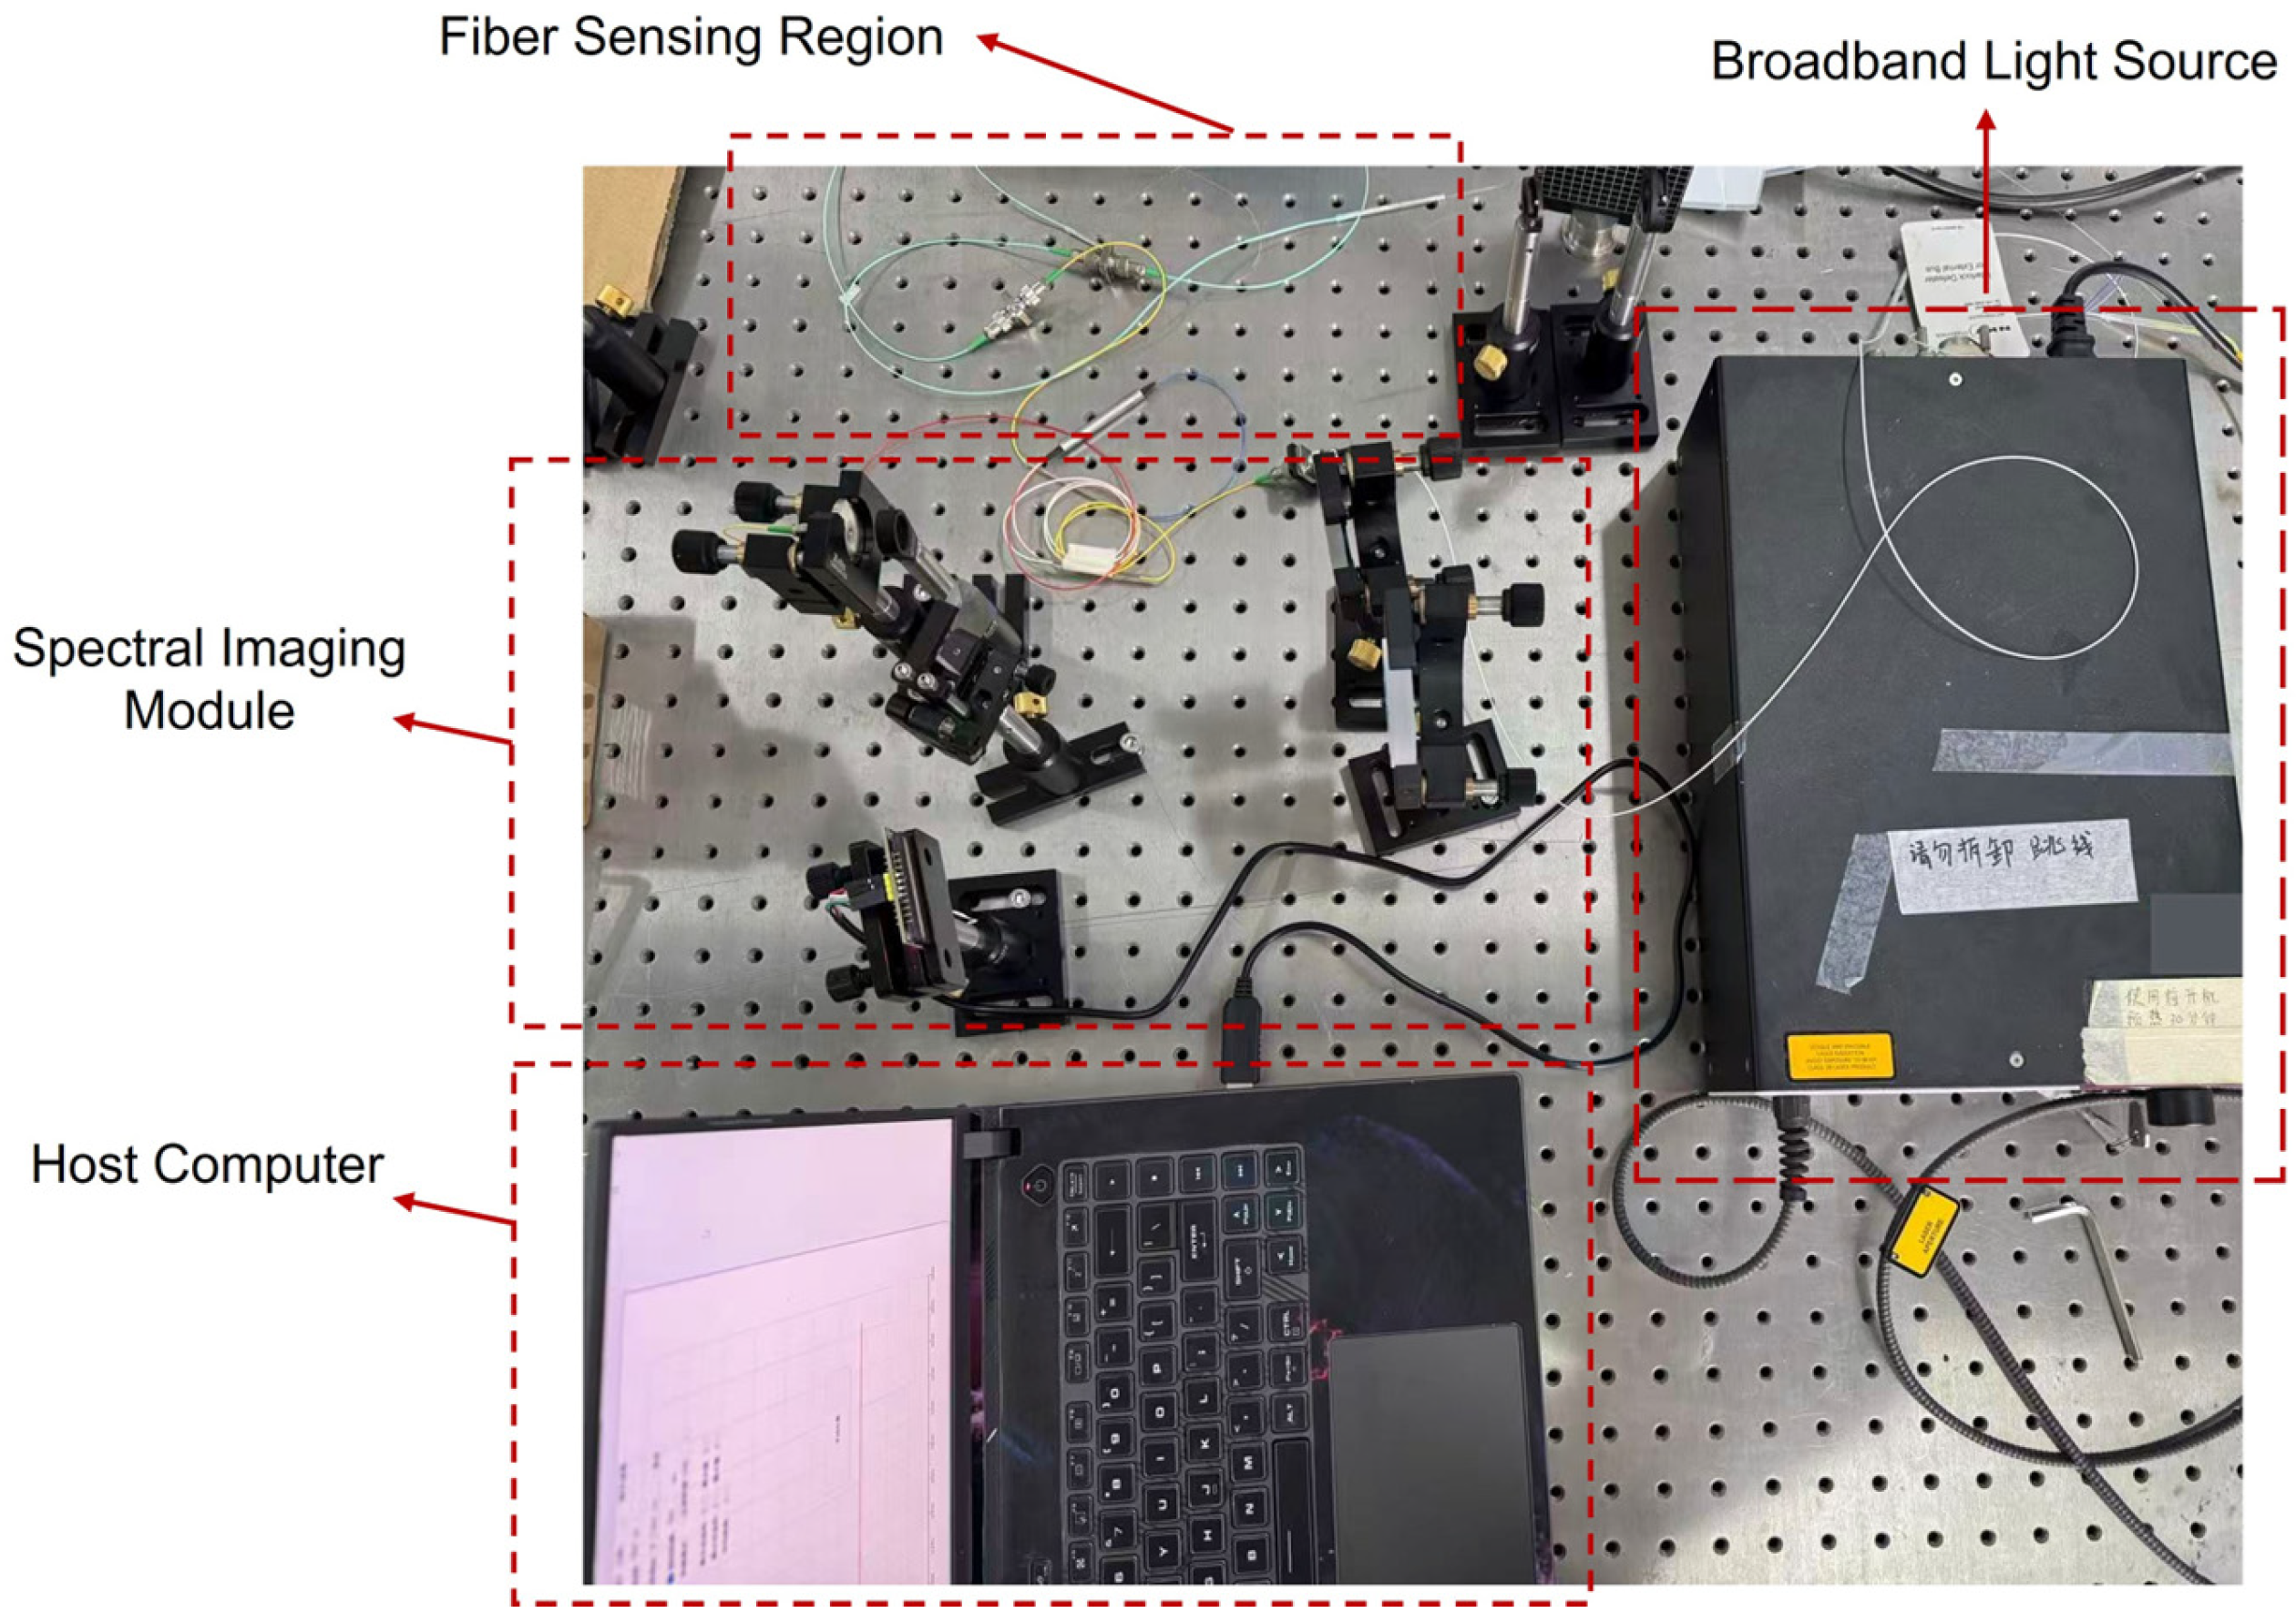
To verify the feasibility of the proposed spectral interrogation scheme, an experimental FBG interrogation system based on spatial dispersion and imaging was established. The system mainly consists of a broadband light source, the FBG under test, a dispersive imaging module, a detector, and a data acquisition and processing unit, and its overall optical layout is shown in
Figure 9. In the experiments, the broadband source was a NKT Photonics SuperK COMPACT supercontinuum light source. The spectral images were recorded by a CCD detector under a fixed integration time of 500 μs. Under the current experimental configuration, the total time per measurement cycle is jointly determined by the CCD integration time, detector readout time, and demodulation processing time. With an integration time of 500 μs, a readout time of approximately 20 ms, and a processing time on the order of a few milliseconds, the total cycle time is about 23.5–25.5 ms. Therefore, the maximum sampling rate of the system is approximately 40–43 Hz, which can be conservatively stated as about 40 Hz.
In the experiment, the optical signal emitted by the broadband source was coupled into the FBG, where the wavelength components satisfying the Bragg condition were selectively reflected. These reflected components then formed a narrowband reflection spectrum with a well-defined central wavelength. In the dispersive imaging module, different wavelength components are spatially separated by the diffraction grating and subsequently focused onto the detector image plane, enabling spatially resolved recording of the spectral information. To ensure system stability and experimental repeatability, all optical components were rigidly mounted on an optical platform, and careful collimation and optical axis alignment were carried out prior to the measurements. Moreover, all optical components used in the setup were commercially available off-the-shelf components rather than custom-fabricated elements, which helps keep the system cost low and enhances its practical applicability.
4.5. Demodulation Validation Against Calibrated Reference Values
After completing the above two calibration procedures, the strain–center wavelength relationship of the FBGs used and the wavelength–pixel relationship of the C–T spectrometer were obtained. Based on these results, stable and reliable system parameters were established and adopted as calibration references for the subsequent demodulation validation experiments. Subsequently, FBG demodulation experiments using the C–T spectrometer were conducted to validate the proposed measurement and processing approach, with a particular focus on evaluating the demodulation performance and stability of the system under practical signal conditions.
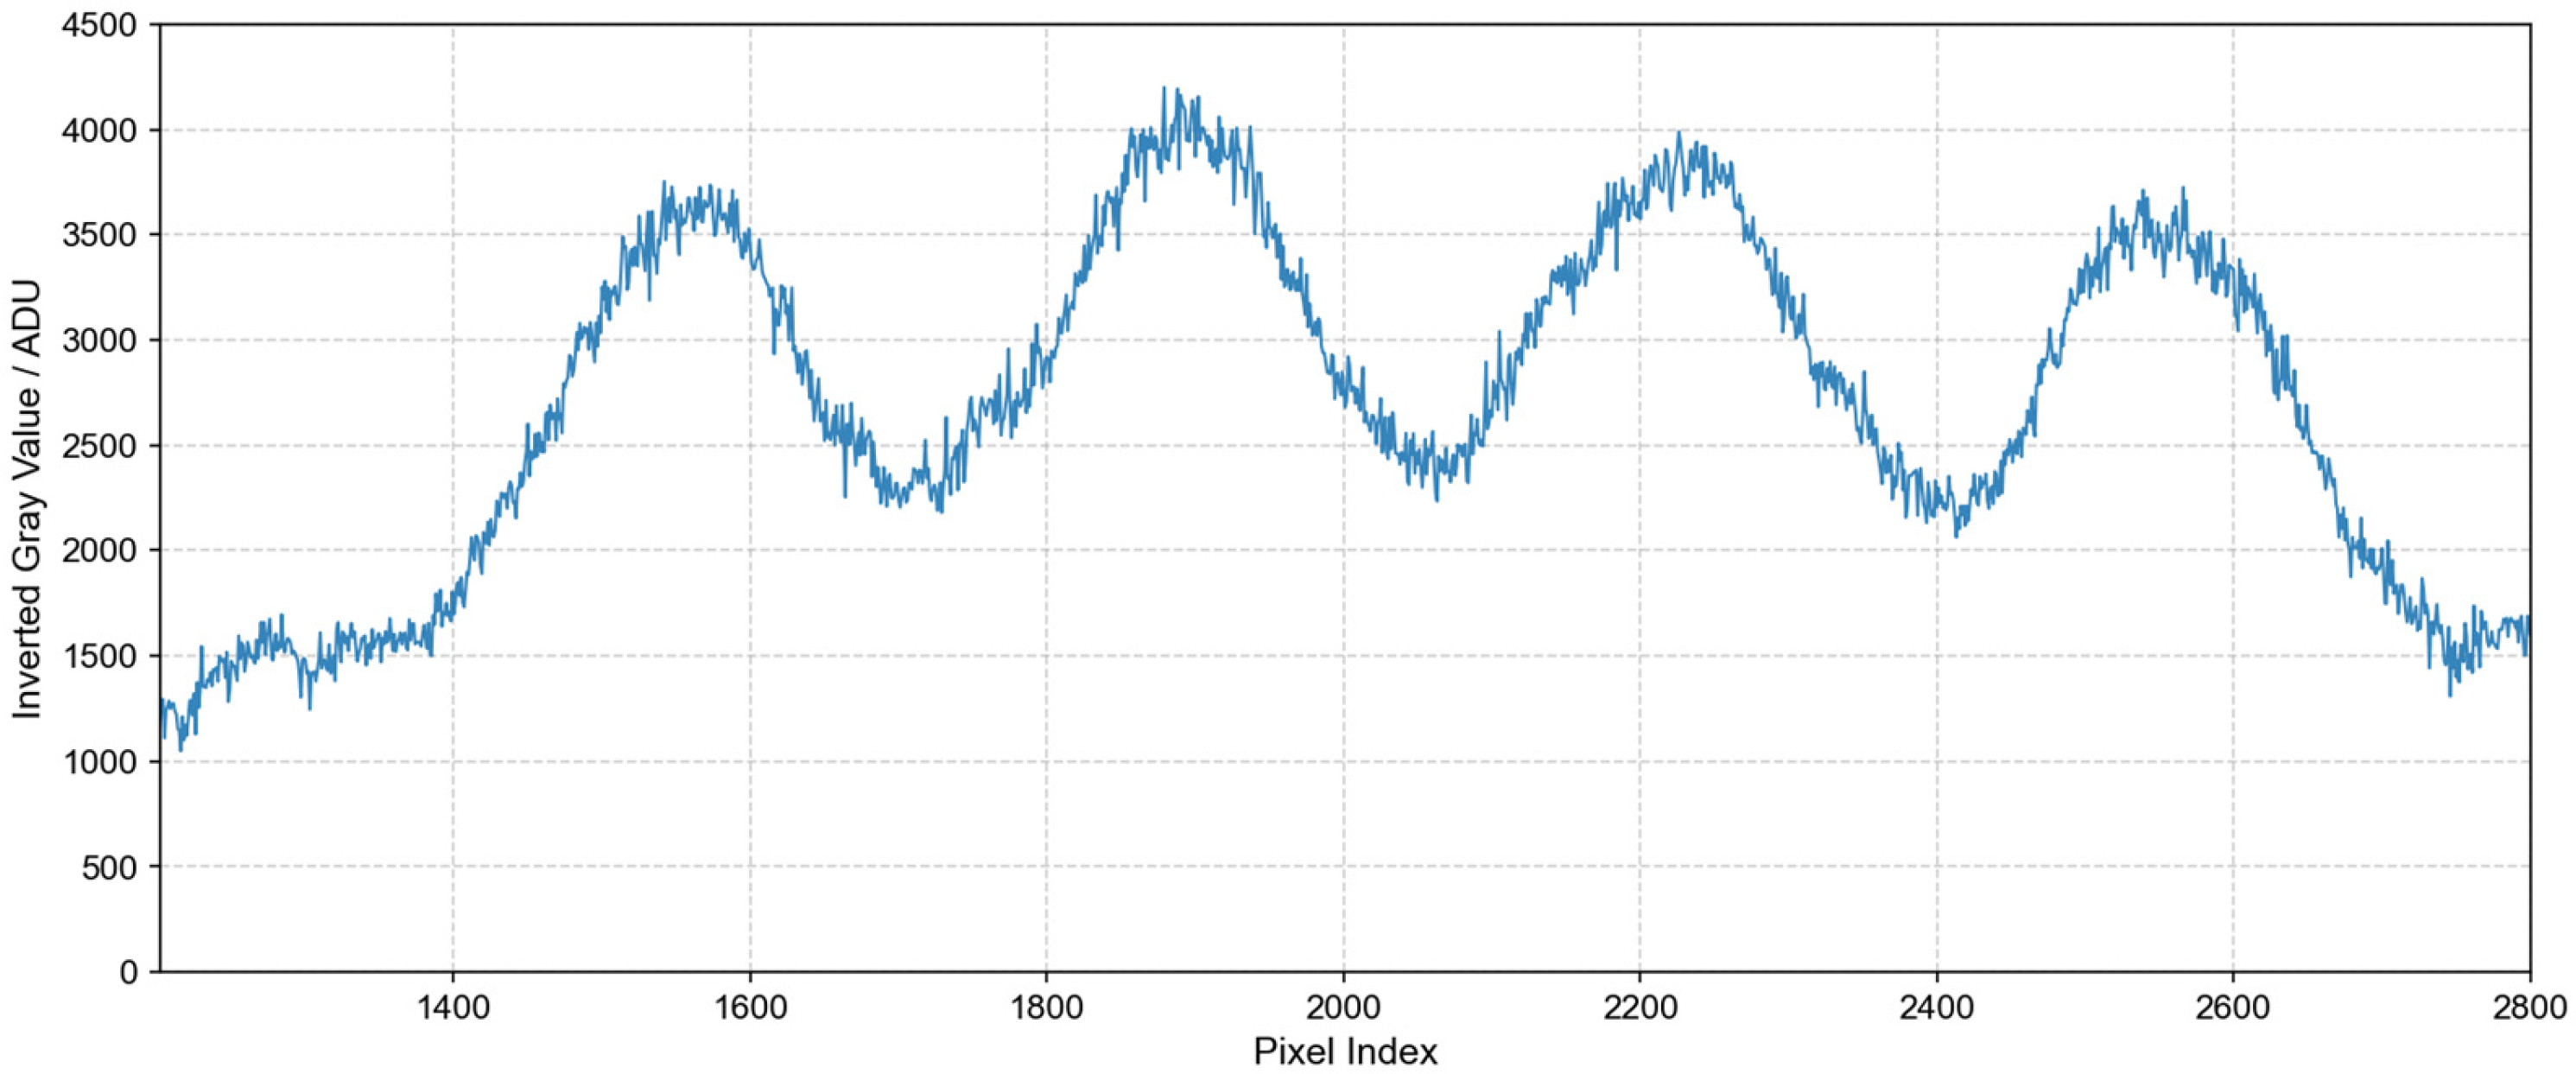
In the experimental setup, light from a broadband source was coupled via optical fiber into an array of four cascaded FBGs. The reflected signals from the FBGs were guided through optical fibers into the C–T spectrometer system and captured by the CCD, thereby forming the experimental configuration required for FBG interrogation. Single-frame spectral acquisition was then performed for the FBG array to verify the spectral separation capability of the cascaded FBGs under identical CCD exposure conditions. During the experiment, all gratings were kept in an unloaded state and were only affected by ambient temperature variations. For visualization purposes, the spectral data acquired by the CCD were subjected to grayscale inversion, such that higher optical intensities correspond to larger display values. This operation was applied solely for visualization and does not affect the raw data or subsequent demodulation calculations. Within the wavelength range of 830–880 nm, four distinct spectral peaks can be simultaneously observed, as shown in
Figure 10. The spectral peaks are distributed along the wavelength axis with clearly defined profiles. Due to the use of multimode FBGs, the edges of adjacent peaks exhibit slight overlap; however, the main peaks remain well separated. This minor overlap does not affect the extraction of the central wavelengths, nor does it compromise the accuracy or stability of the subsequent demodulation results.
To further quantify the spectral interaction between adjacent peaks in the cascaded FBG array, the adjacent-FBG spectral crosstalk was analyzed. Let
denote the reflection spectrum of the u-th FBG, and let
denote the corresponding receiving band determined by the midpoints between adjacent center wavelengths. Within this band, the useful integrated energy of the u-th FBG is defined as
, whereas the leakage energy contributed by an adjacent FBG
into the same band is defined as
, Accordingly, the adjacent FBG crosstalk is defined as the integrated leakage ratio,
, which can also be expressed in dB as
. Here, the receiving band
is determined by the midpoints between adjacent FBG center wavelengths. This metric characterizes the leakage of adjacent spectra into the decision band of the target FBG and is therefore suitable for evaluating the spectral separation quality under the present wavelength allocation scheme. Based on the above definition, the adjacent FBG crosstalk was calculated from the experimental spectra shown in
Figure 10. The results indicate that the crosstalk between adjacent FBGs is approximately −19.5 dB to −18.8 dB, corresponding to a linear leakage ratio of about 1.1–1.3%. This shows that, under the present center wavelength allocation and spectral-width conditions, the leakage energy contributed by adjacent spectra into the target decision band remains low. Although slight overlap exists at the edges of neighboring peaks, it does not significantly affect the extraction of the center wavelengths or the subsequent wavelength demodulation results. These results further confirm that the adopted wavelength allocation scheme provides good spectral separation over the 830–880 nm range.
The SNR of the CCD spectral image was estimated as the ratio between the effective peak amplitude and the RMS noise level. Using the maximum value of the smoothed spectral profile relative to the 5th percentile baseline as the signal amplitude, and combining the two independent Gaussian noise terms in quadrature, the typical SNR corresponding to
Figure 10 was estimated to be about 20–23 (approximately 26–27 dB).
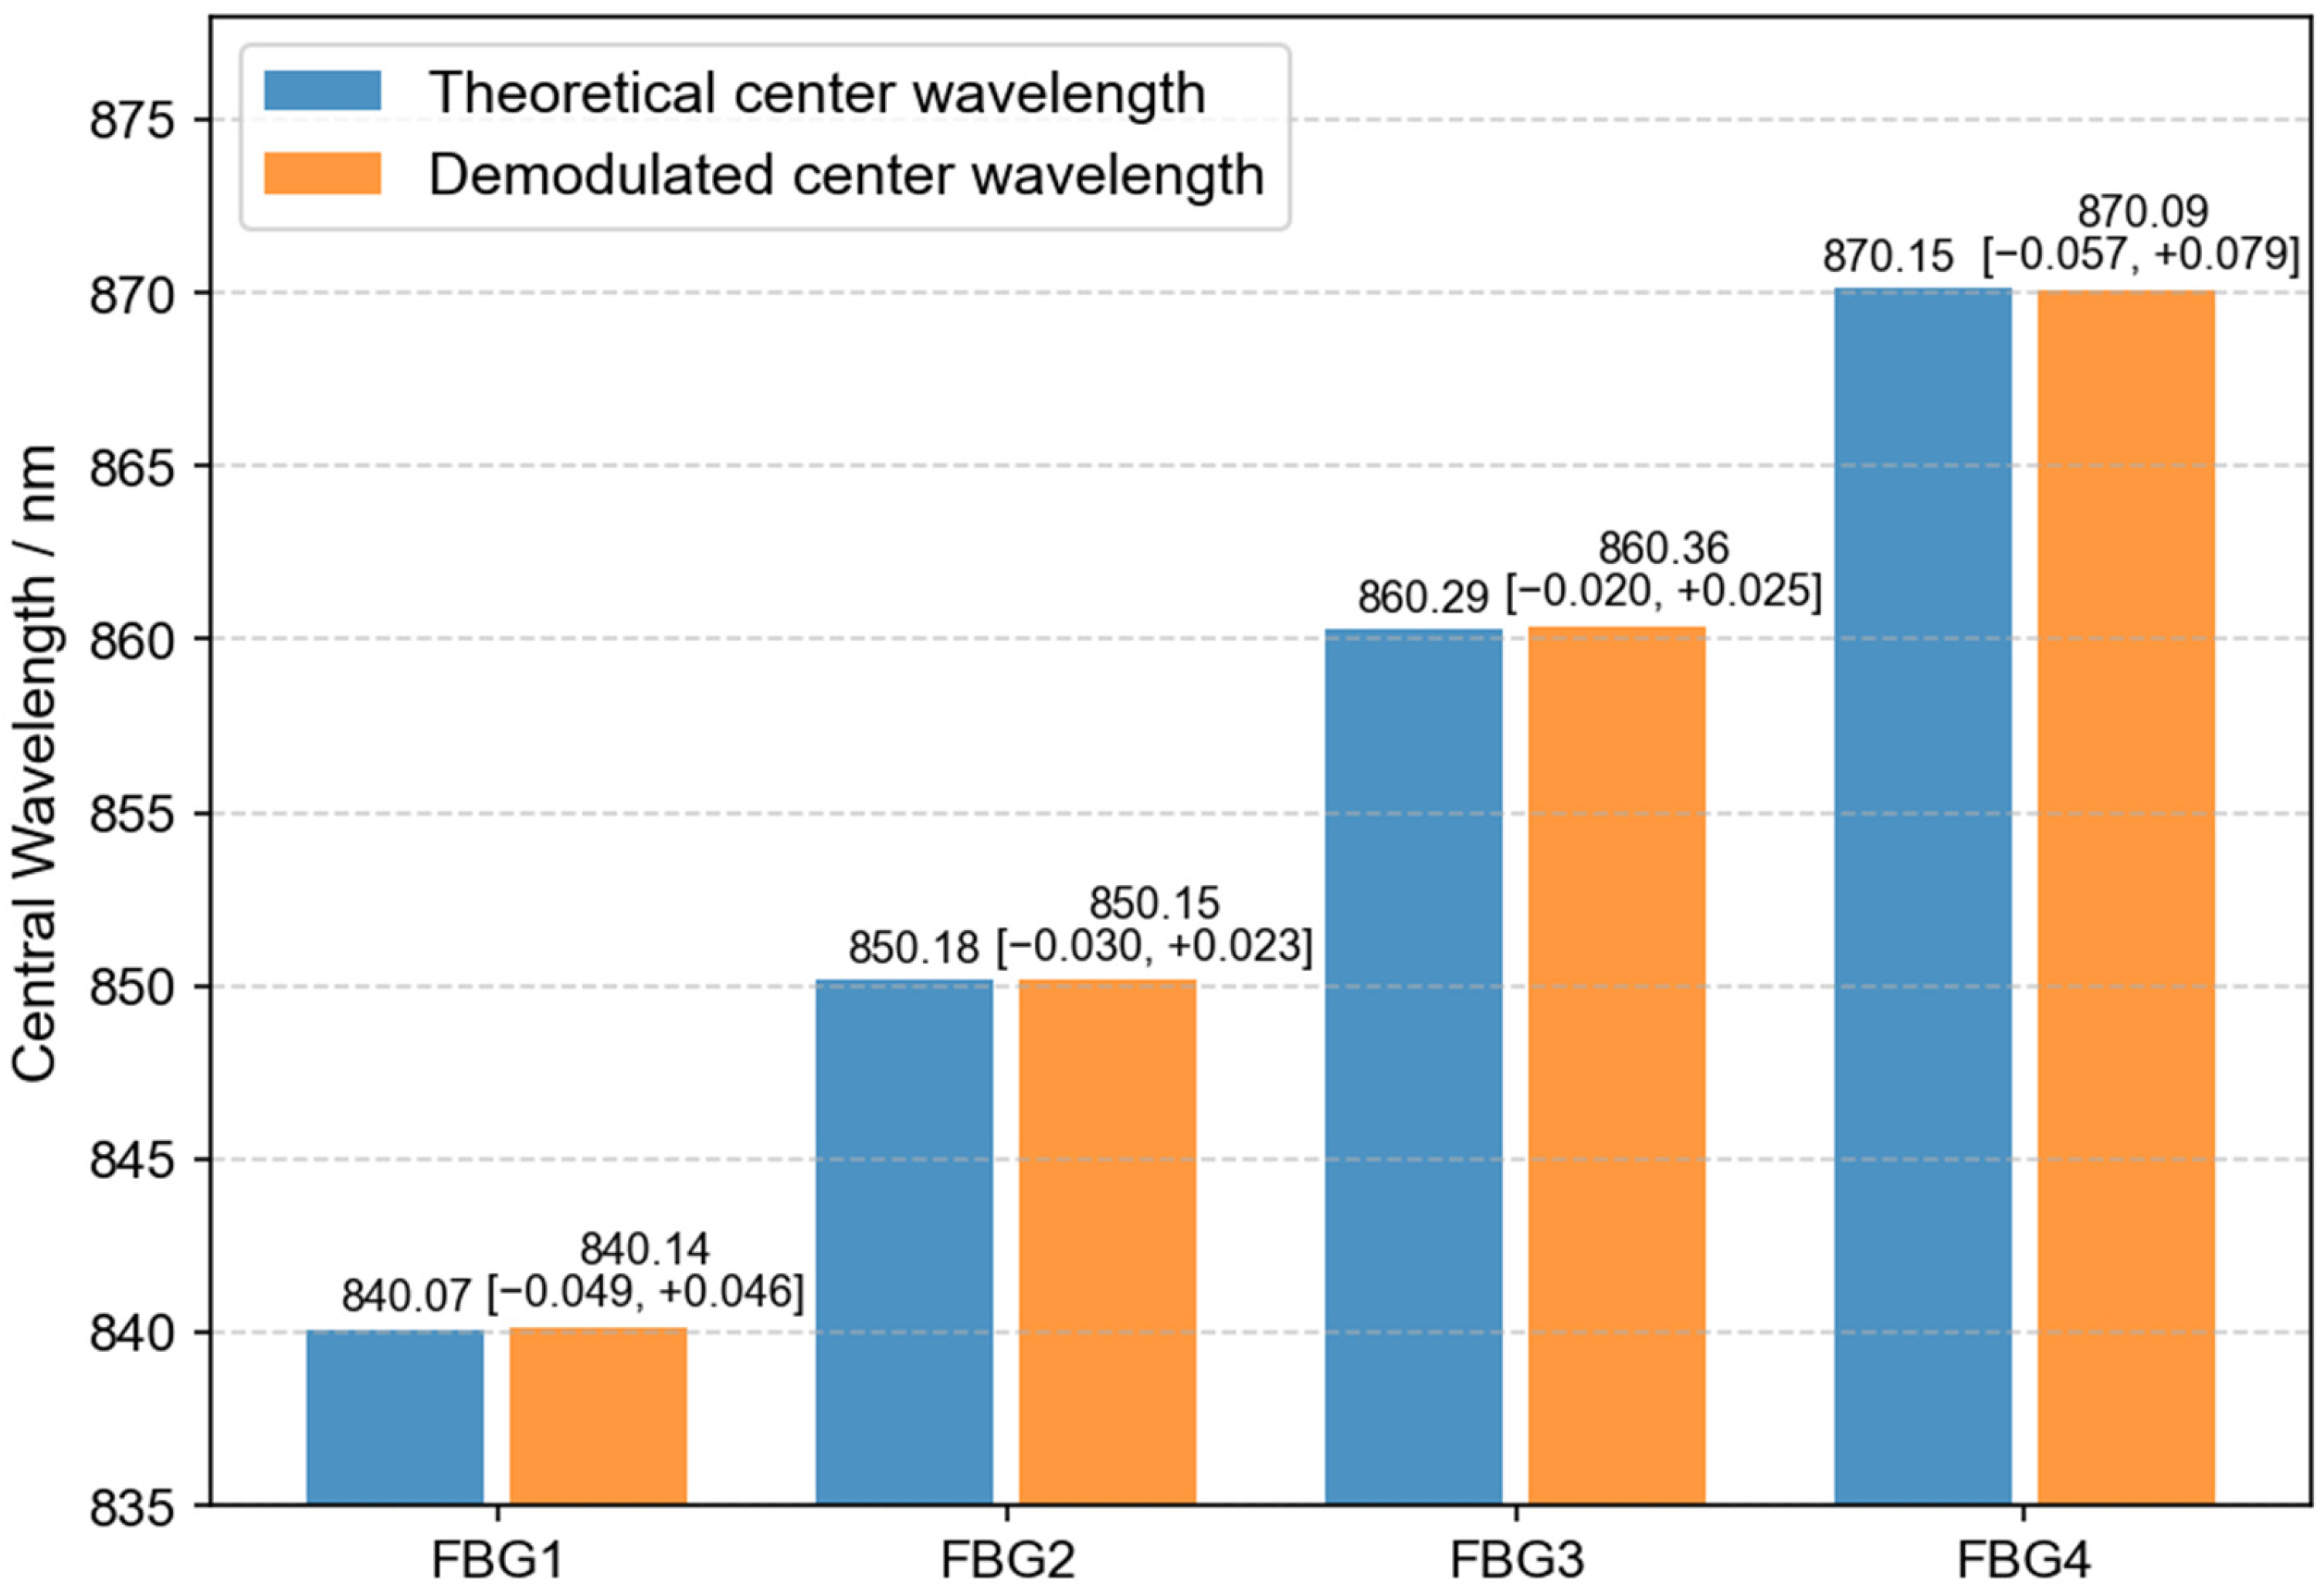
Under zero-strain baseline conditions, the reflected spectral peaks of the four cascaded FBGs were acquired, and wavelength demodulation was performed to extract the center wavelength of each FBG in real time. For each FBG, 10 repeated measurements were carried out under identical acquisition conditions, with an interval of approximately 60 s between consecutive measurements, and the demodulated center wavelengths were then compared with the corresponding calibrated reference values to evaluate the demodulation accuracy.
Figure 11 shows the comparison between the wavelength-demodulated center wavelengths and the calibrated reference values of the four FBGs. The values above the orange bars represent the mean ± 95% BCa bootstrap confidence interval of the demodulated center wavelengths. It can be seen that the demodulated wavelengths of all four FBGs are in close agreement with the corresponding reference values, with deviations approximately ranging from 0.03 to 0.07 nm. The spectral peaks of the four FBGs remain clearly separated, with no overlap-induced misidentification observed, further demonstrating that the proposed system can achieve reliable wavelength demodulation and consistent discrimination of multiple cascaded FBGs under identical acquisition conditions.
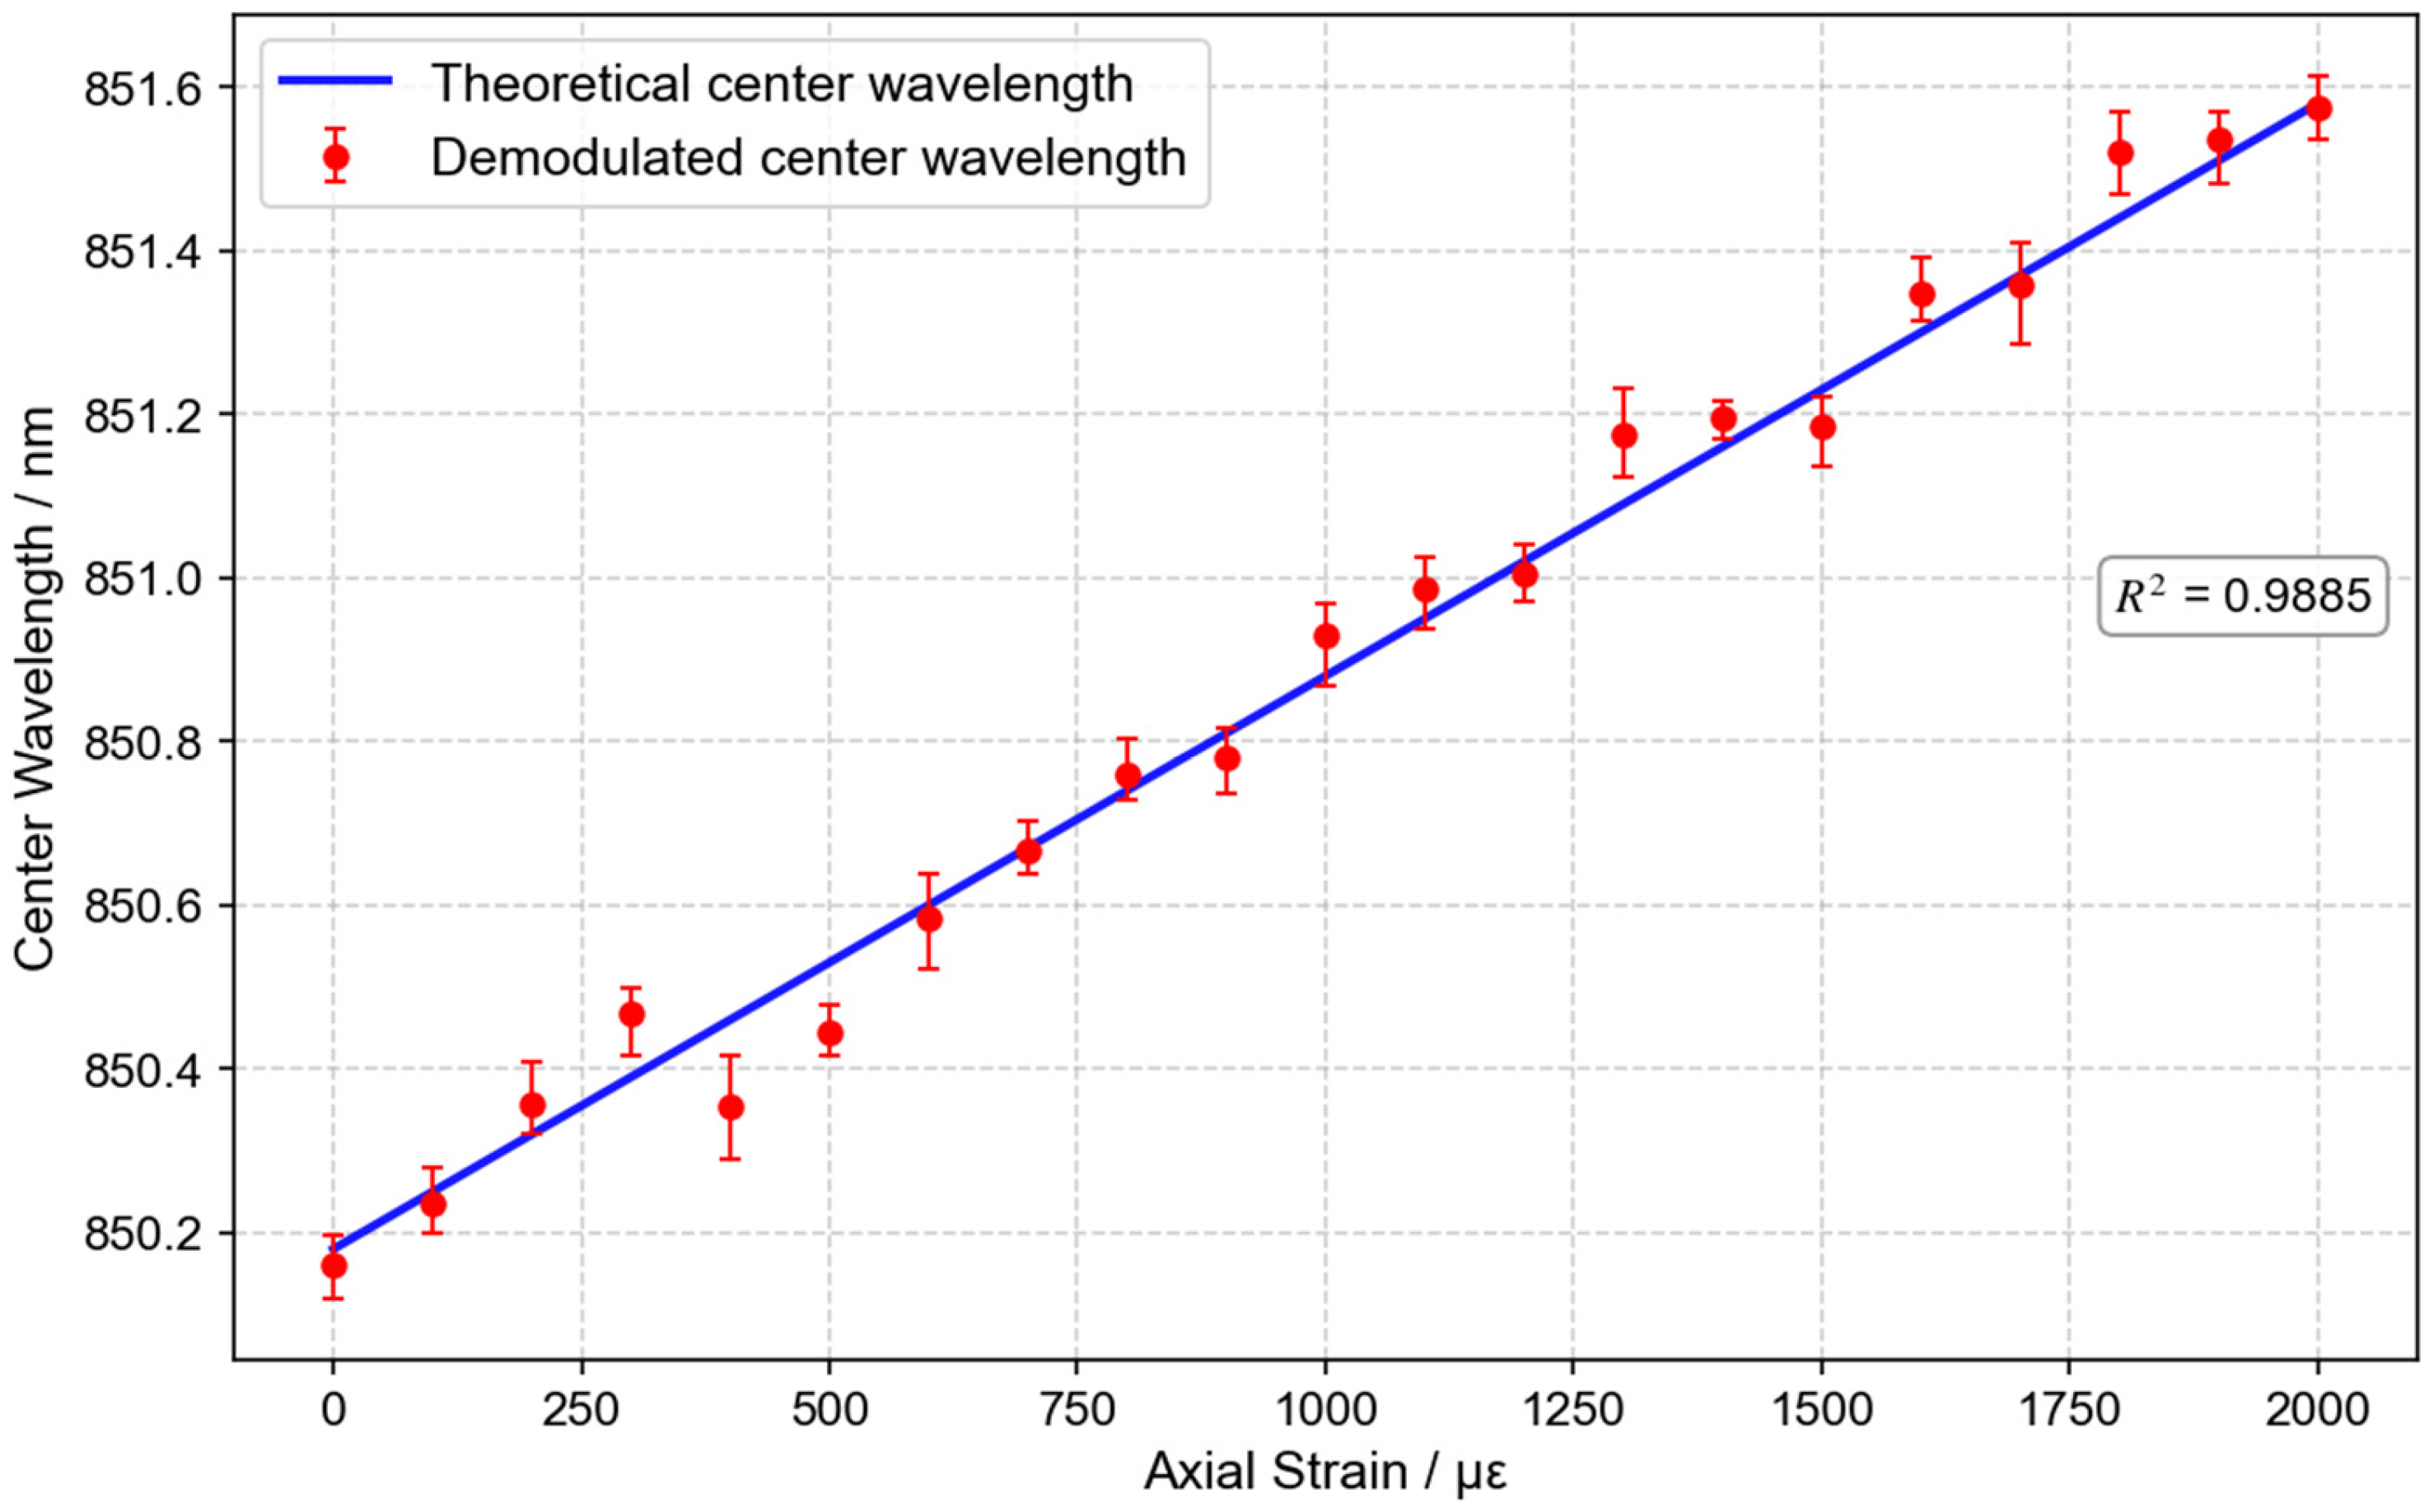
Under the condition that axial strain was applied only to a single FBG (FBG2 as an example), the wavelength demodulation results of the center wavelength as a function of strain are shown in
Figure 12. In the experiment, axial strain was gradually applied over the range of 0–2000 με, while the remaining FBGs were kept undisturbed. At each strain level, 10 repeated measurements were performed under identical acquisition conditions, with an interval of approximately 60 s between consecutive measurements. The solid line in the figure represents the calibrated reference variation in the center wavelength derived from the strain–wavelength calibration relationship, whereas the red markers denote the wavelength demodulated center wavelengths obtained using the CCD-based system. The error bars represent the 95% BCa bootstrap confidence intervals of the repeated demodulated results at each strain level. As can be observed, the demodulated center wavelength follows the calibrated reference curve closely, with only small dispersion, indicating that the proposed demodulation method can stably and accurately track the strain-induced wavelength shift of a single FBG while the other cascaded FBGs remain undisturbed.
The wavelength demodulation results demonstrate that the proposed system can accurately capture the variation trend of the FBG center wavelength, with the demodulated values showing good consistency with the applied external parameter. When axial strain was applied to only one FBG, the CCD-based demodulation system stably tracked the corresponding wavelength shift while the other cascaded FBGs remained undisturbed. The demodulated results are in close agreement with the calibrated reference curve, with a coefficient of determination of approximately 0.9885 and only small dispersion. Furthermore, linear fitting of the demodulated wavelength–strain relationship gives a sensitivity of 0.7209 pm/με. Compared with the calibrated reference value of 0.7238 pm/με, the discrepancy is considered reasonable and can be attributed to the fact that the two values were obtained from different measurement chains and fitting procedures. Specifically, the calibrated sensitivity was derived from the strain–wavelength calibration, whereas the demodulated sensitivity was obtained from the CCD-based wavelength demodulation results. The latter is additionally influenced by wavelength–pixel mapping error, peak-fitting uncertainty, detector noise, and the dispersion of repeated measurements, all of which may introduce a slight deviation in the fitted slope.
To provide a more comprehensive quantitative evaluation of the demodulation performance of the system, both the accuracy error and the repeatability error were analyzed in this study to characterize the average accuracy and repeat measurement stability of the system, respectively. At each fixed strain level, 10 independent repeated measurements were performed. A total of 21 strain points were investigated over the entire loading range. For the accuracy evaluation, at each strain point, the ten repeated interrogated wavelength values were first averaged. The average interrogated wavelength at the
-th strain point is denoted as
. Accordingly, the mean wavelength error was defined as the average deviation between
and the corresponding theoretical calibrated reference wavelength
over all strain points (
). The quantity
was used to characterize the overall interrogation bias. In addition, the RMS error was introduced to reflect the typical magnitude of the error and to avoid underestimation caused by the cancellation of positive and negative deviations. It was defined as
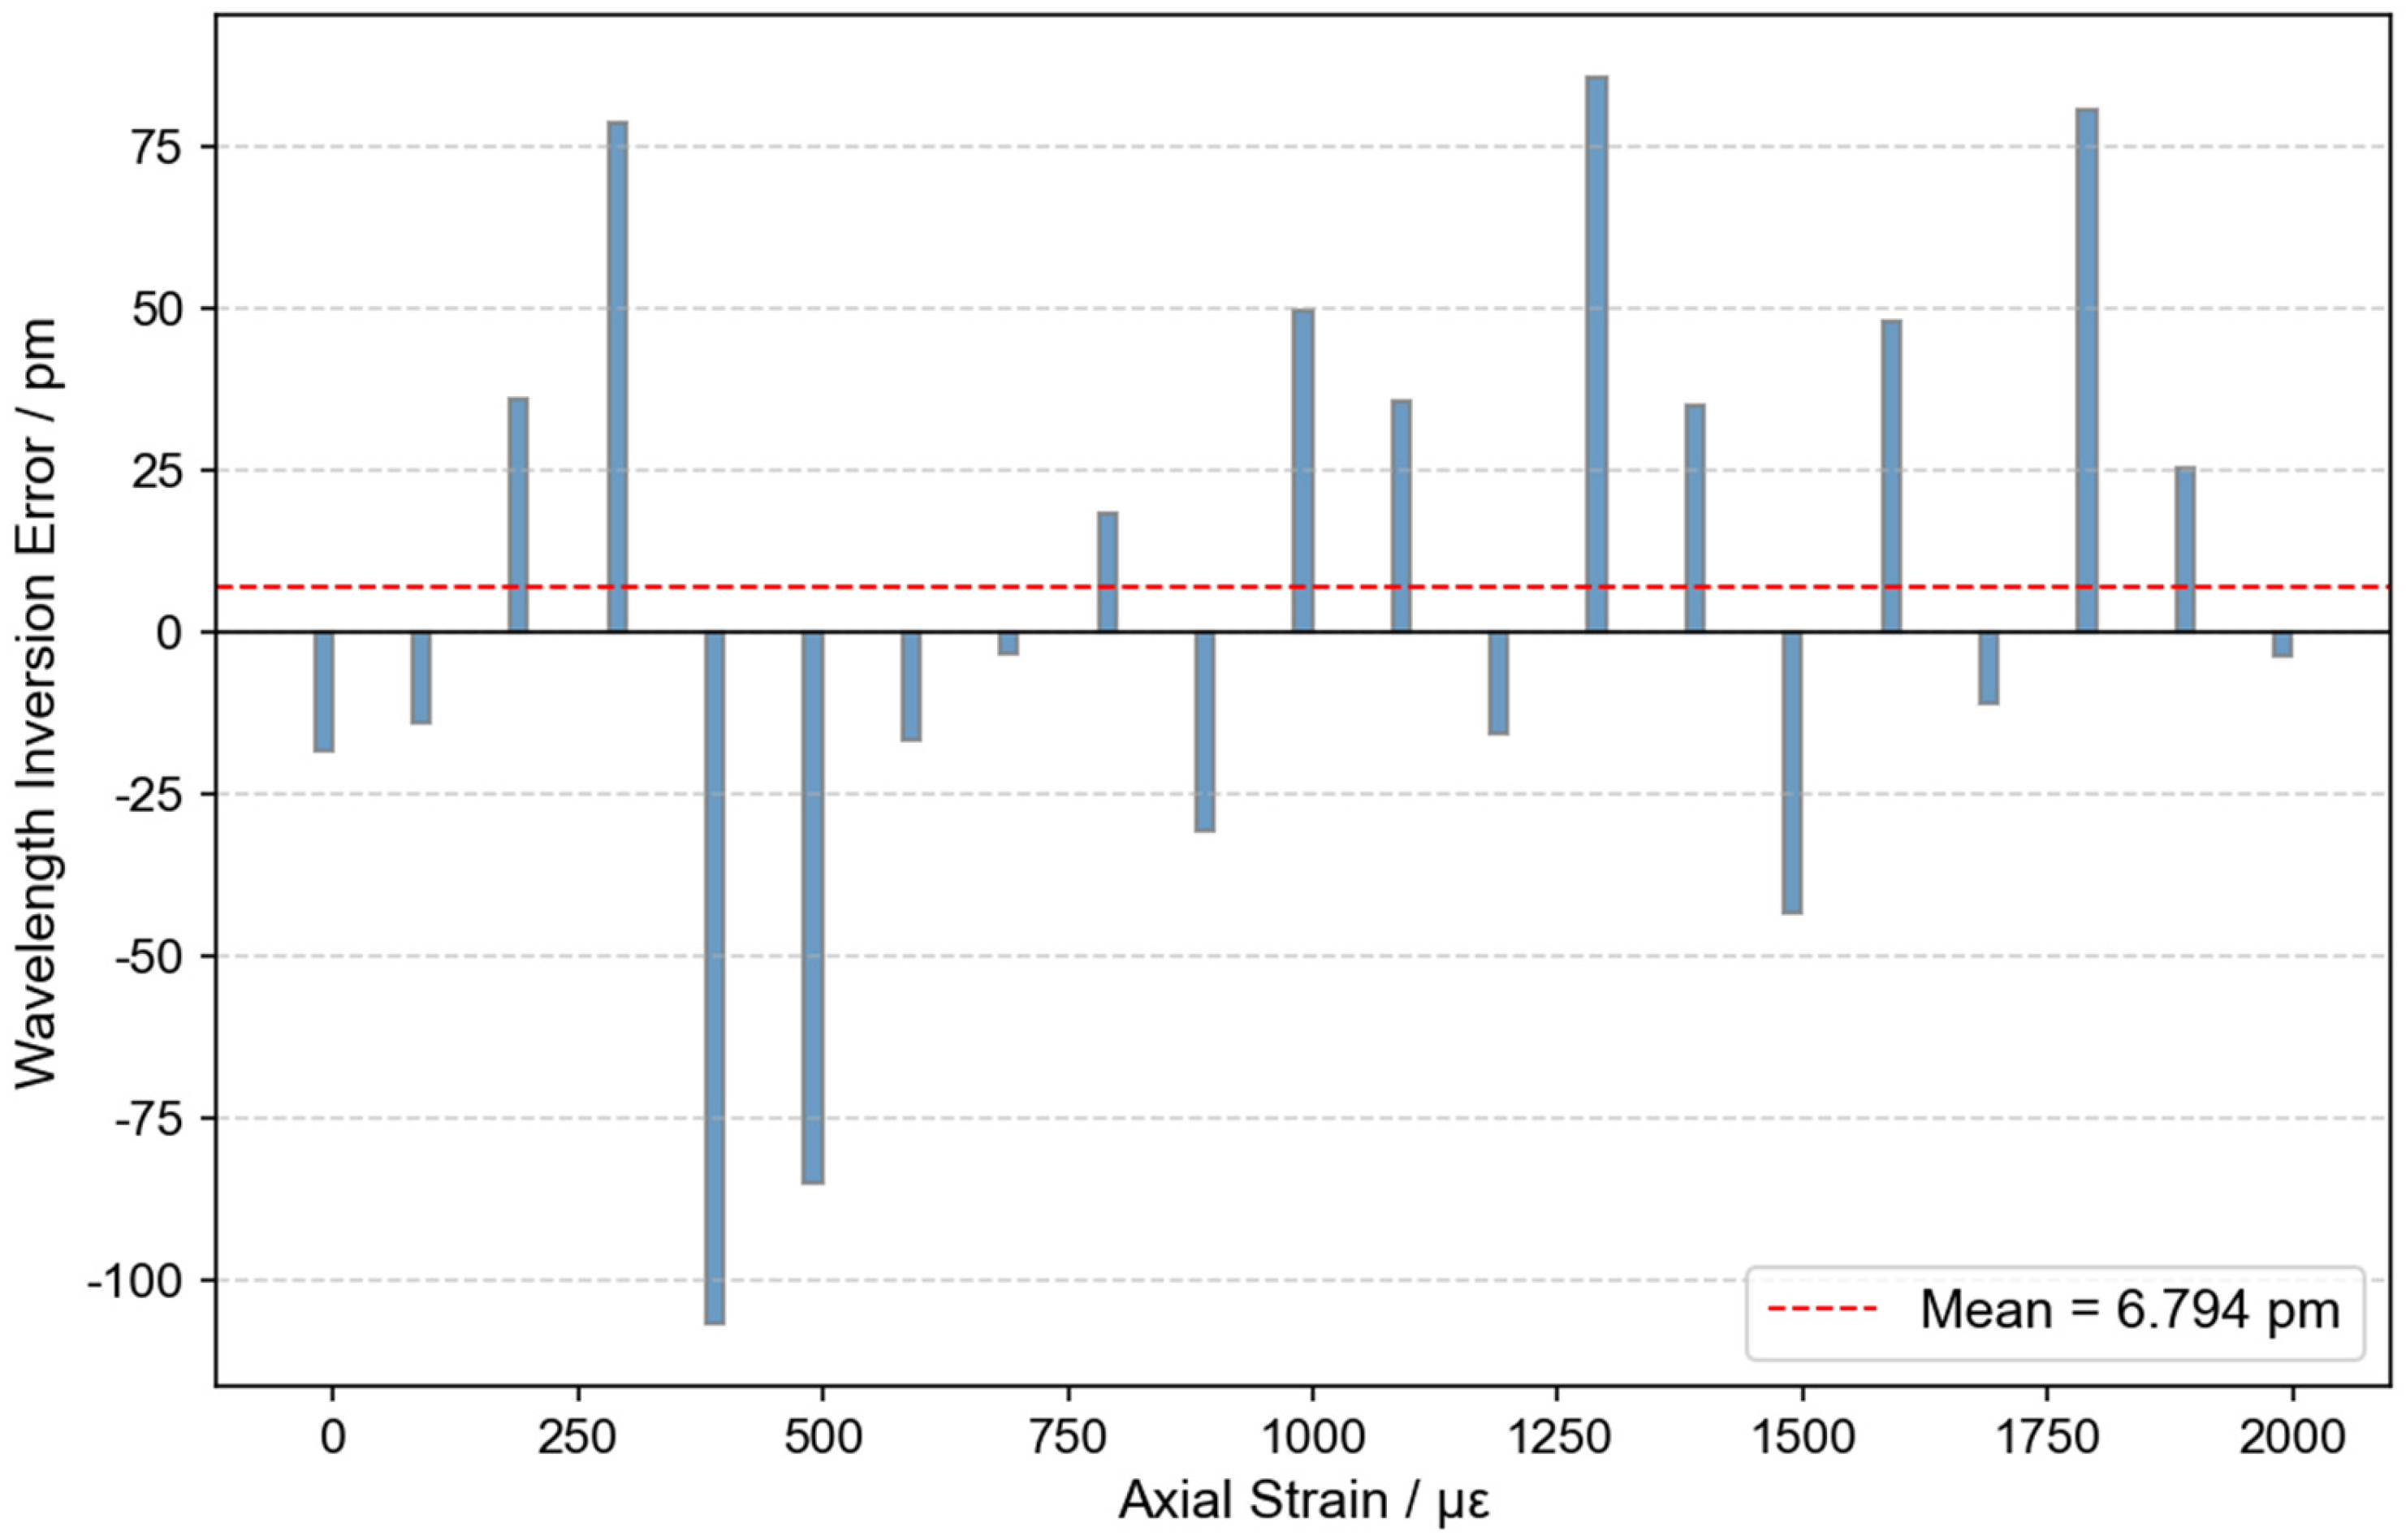
. The statistical results of the accuracy evaluation are shown in
Figure 13. The results indicate that the mean error
of all strain points is approximately 6.8 pm, suggesting that the overall systematic bias of the proposed system is relatively small. The corresponding system-level wavelength demodulation RMS error
is approximately 49.9 pm, indicating that the typical error level over the entire strain range remains within a relatively low range.
On the basis of the above analysis of average accuracy, the repeatability of the system under the same experimental conditions, i.e., its short-term repeat-measurement stability, was further evaluated. For each strain point, the demodulated wavelength obtained in the
repeated measurement is denoted as
, and its sample mean is
. Accordingly, the standard deviation at each strain point was calculated as
. The 10 repeated measurements at each of the 21 strain points were then arranged sequentially to obtain a total of 210 measurement data points. Let the interrogated wavelength of the
-th data point be denoted as
, and its sample mean is expressed as
The repeatability-related RMS error over all measurement points was defined as
, and the repeatability standard deviation was defined as
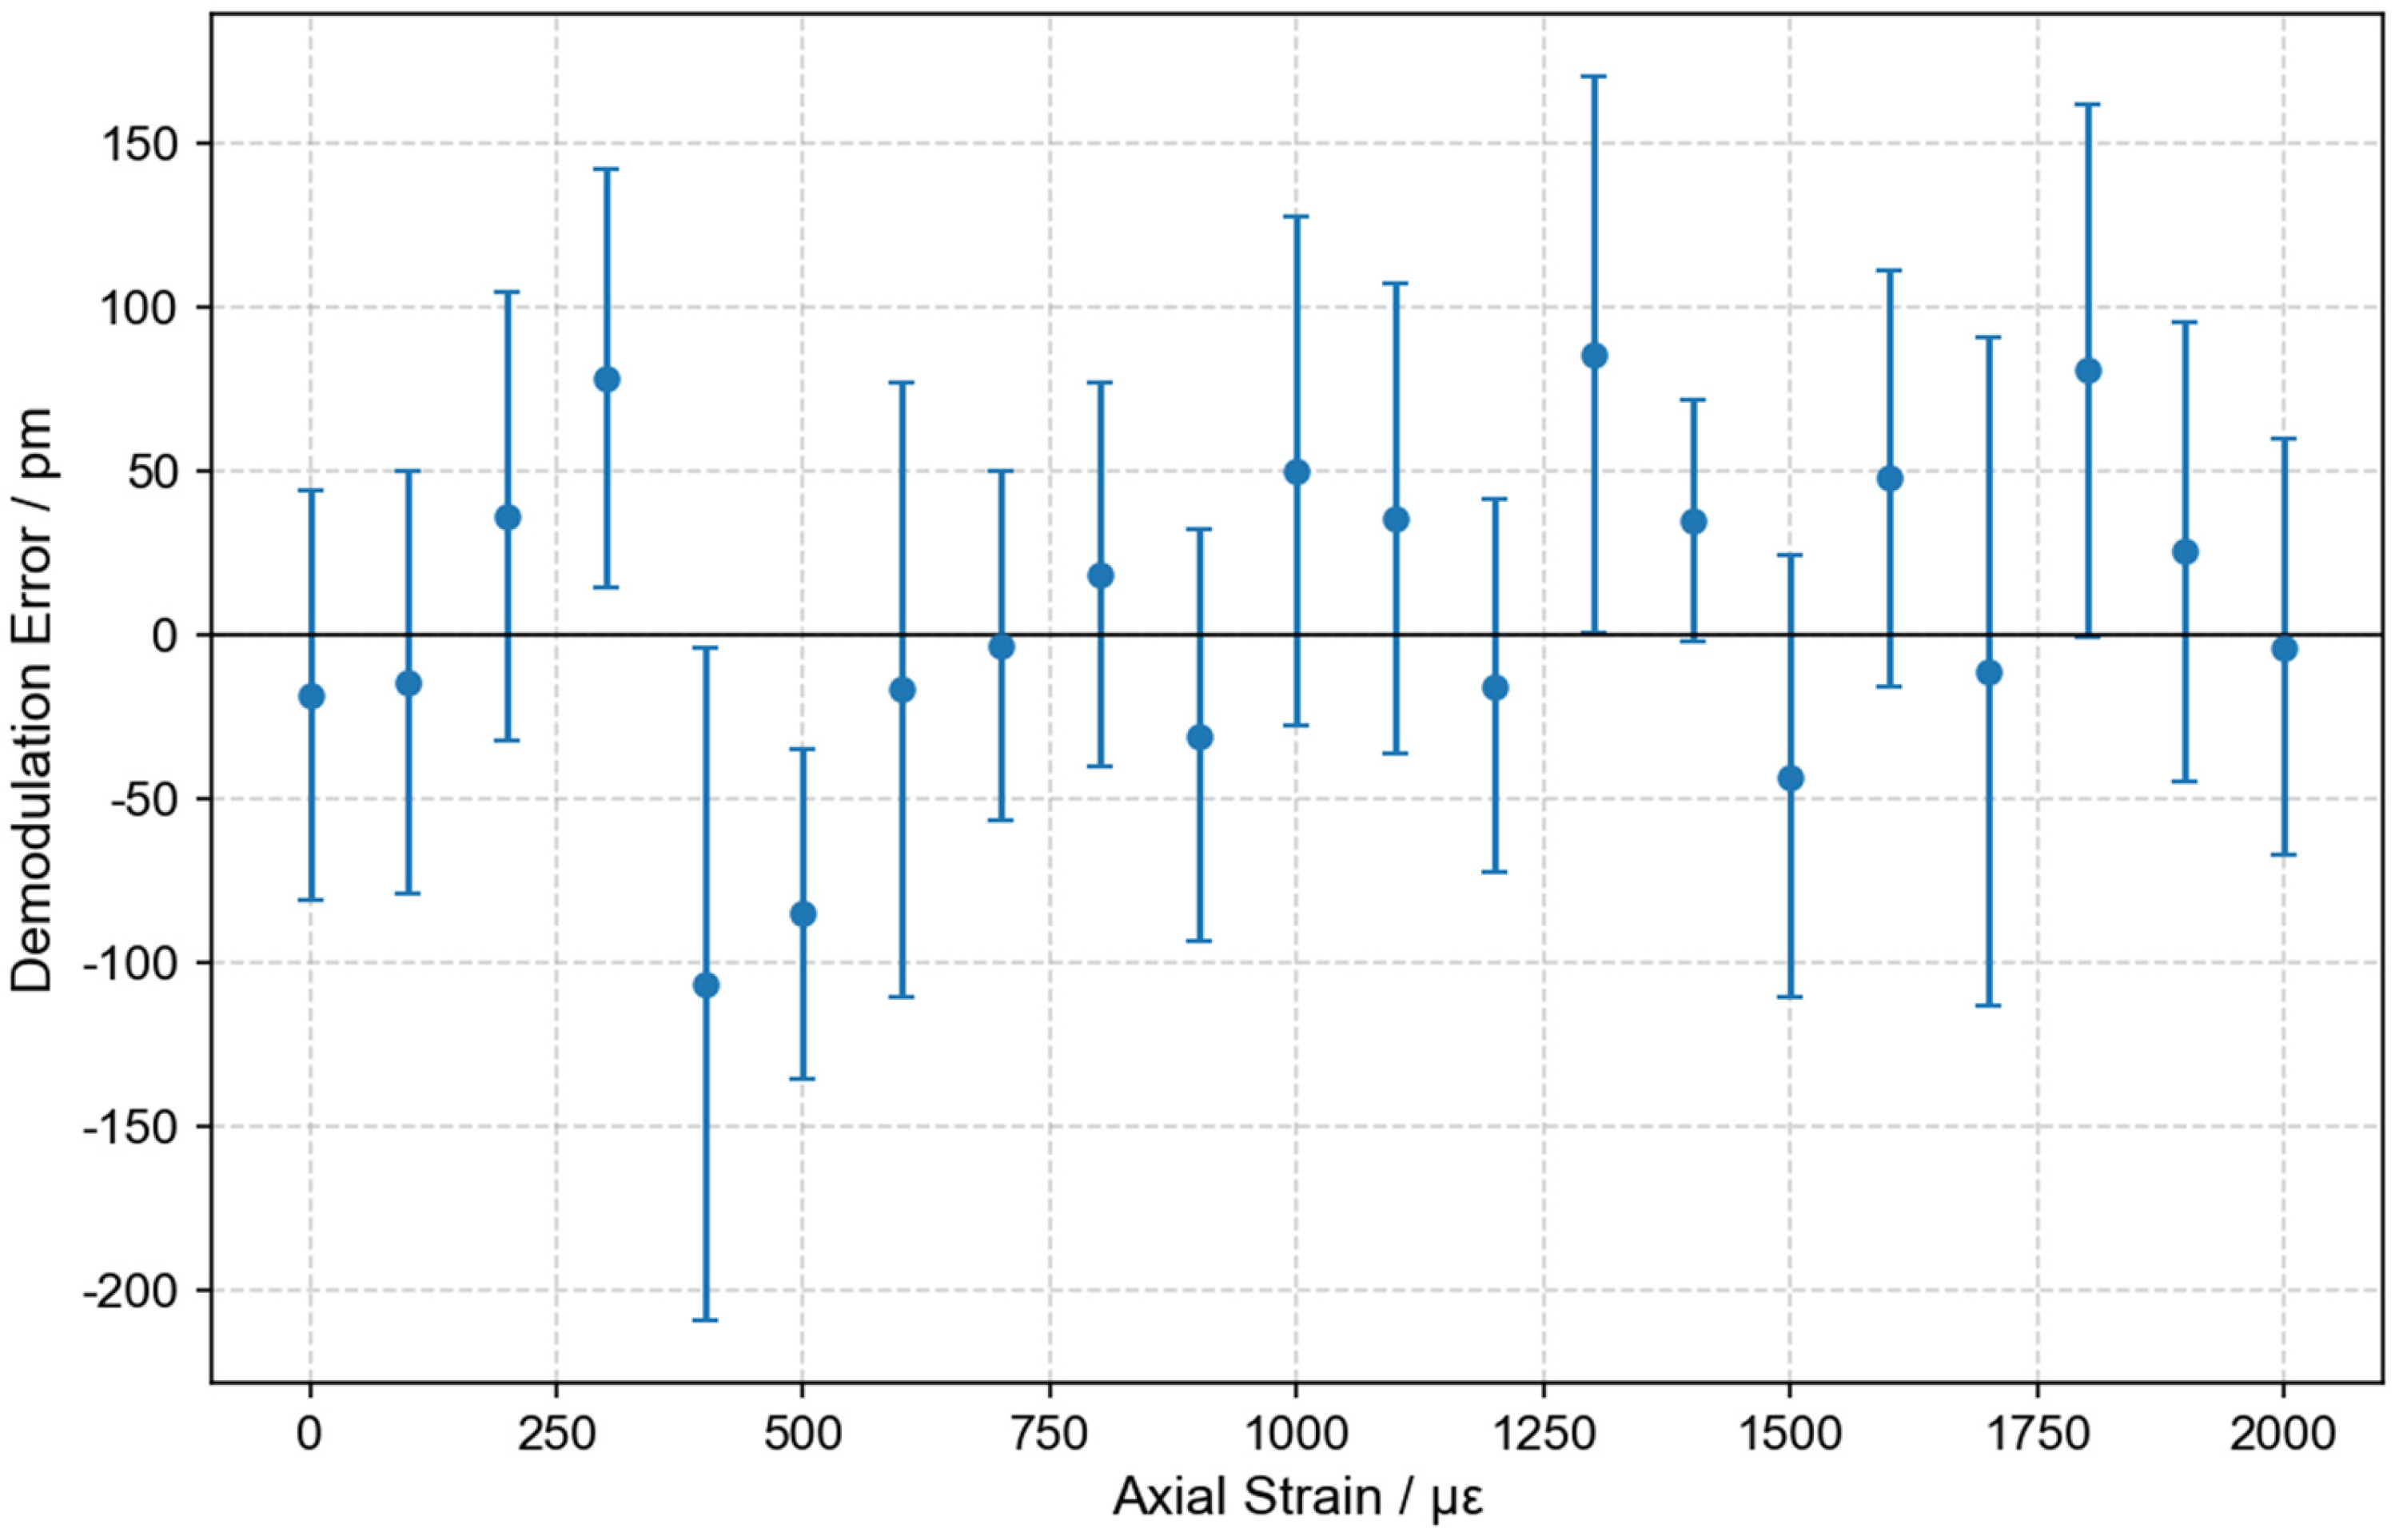
. The repeatability statistics are presented in
Figure 14. In the figure, the dots represent the mean error
of the 10 repeated measurements at each strain level, while the error bars denote the standard deviation
of the ten measurements at the corresponding strain point. The statistical results show that the overall RMS error relative
to the reference wavelength is approximately 86.9 pm, whereas the standard deviation relative to the sample mean
is approximately 69.3 pm. These results indicate that, compared with the error statistics obtained after averaging ten repeated measurements, individual interrogation results exhibit a certain degree of dispersion. This dispersion arises from the combined effects of detector noise, optical sampling resolution, fitting algorithm error, and small environmental perturbations during the experiment. Nevertheless, the overall dispersion remains controllable and does not show any significant amplification trend under repeated measurements, demonstrating that the proposed system possesses good short-term stability and repeatability.
Overall,
Figure 13 quantitatively characterizes the system accuracy based on the averaged measurement results, mainly reflecting the mean deviation of the interrogated results, whereas
Figure 14 quantitatively evaluates the system repeatability based on all individual measurements, thereby reflecting the short-term stability of single-shot interrogation. Separately evaluating the average accuracy and the single-measurement repeatability helps provide a more comprehensive characterization of the overall system performance.
4.6. Interpretation of Calibration Errors and System-Level Demodulation Errors
It should be emphasized that the error quantities reported in different parts of this work correspond to different stages of the measurement chain and therefore should not be directly interpreted as the same physical metric.
First, the strain–wavelength calibration error of the FBGs characterizes the uncertainty of the reference relationship between axial strain and Bragg wavelength established using the Yokogawa AQ6370D optical spectrum analyzer. In the present work, the calibrated strain sensitivities of the four FBGs are approximately 0.6850–0.7325 pm/με, with the calibrated sensitivity of FBG2 being 0.7238 pm/με. This part mainly reflects the uncertainty of the reference calibration itself, including repeated measurement dispersion, fitting uncertainty, and the practical limitations of the reference instrument. It does not directly represent the performance of the proposed CCD-based wavelength demodulation system.
Second, the wavelength–pixel calibration error of the C–T spectrometer characterizes the residual error of the wavelength–pixel mapping model established for the imaging spectrometer. In this work, the global validation RMS residual of the wavelength–pixel calibration model is approximately 0.46 nm. This quantity mainly reflects the mapping accuracy between the detector pixel position and the input wavelength and therefore belongs to the spectrometer calibration stage. It is not equivalent to the final end-to-end demodulation error observed in the strain experiments.
By contrast, the system-level demodulation errors reported later in the manuscript are all defined with respect to the calibrated reference values. Specifically, the mean wavelength error is approximately 6.8 pm, which characterizes the overall systematic bias of the demodulated wavelengths relative to the reference values; the corresponding system-level wavelength demodulation RMS error is approximately 49.9 pm, which reflects the typical magnitude of the reference-relative demodulation deviation after averaging the repeated measurements at each strain point. In addition, when all repeated measurements are considered individually, the repeatability-related RMS error is approximately 86.9 pm, and the repeatability standard deviation is approximately 69.3 pm. These latter two quantities characterize the overall dispersion and short-term repeated-measurement stability of the demodulated results under identical experimental conditions.
Therefore, the later reported demodulation metrics should be interpreted as reference-relative system-level error indicators, rather than the absolute wavelength accuracy, absolute spectral resolution, or intrinsic repeatability limit of the CCD-based interrogator itself. Their values are influenced by the combined effects of wavelength–pixel calibration residual, Gaussian peak-fitting uncertainty, CCD noise, finite optical sampling resolution, small environmental perturbations, and the uncertainty carried by the adopted strain–wavelength reference calibration.
At the same time, the overall error or uncertainty of the interrogator should not be interpreted as a simple sum of the above quantities. This is because several contributions are not independent, and part of the influence of wavelength–pixel calibration residual, peak-fitting uncertainty, detector noise, and small environmental drift is already embedded, to some extent, in the experimentally observed demodulation RMS metrics. Likewise, the uncertainty of the adopted reference calibration also propagates into the final comparison. Therefore, a naive direct summation would lead to double counting. In the present work, the individual calibration errors are reported to identify the major uncertainty sources at different stages, whereas the system-level demodulation metrics are used as practical end-to-end indicators of the relative performance of the proposed method.
Overall, the FBG calibration error, the wavelength–pixel calibration error, and the system-level demodulation errors play different roles in this study: the first establishes the strain-wavelength reference, the second establishes the wavelength-mapping basis of the C–T spectrometer, and the last reflects the practical relative performance of the proposed wavelength demodulation method with respect to those calibrated references.
4.7. Discussion on Performance and Applications
Currently, the vast majority of commercially available FBG interrogators are based on the 1550 nm wavelength, leveraging the mature ecosystem of components and technological advancements developed in the telecommunications industry, achieving extremely high precision and stability. These devices are widely used in fields such as structural health monitoring, long-distance industrial monitoring, and dynamic load measurements. We compare key parameters of several commercially available FBG interrogators operating in the 1550 nm wavelength range in
Table 3. The table highlights important specifications such as wavelength range, resolution, repeatability, sampling rate, dynamic range, and typical applications for each interrogator, helping to understand their relative capabilities and suitability for different use cases.
As shown in
Table 3, commercially available FBG interrogators operating in the 1550 nm wavelength range have reached a high level of technological maturity, exhibiting excellent performance in terms of resolution, stability, dynamic range, and sampling rate. In terms of resolution, these systems generally achieve picometer-level wavelength interrogation accuracy, with some devices offering even higher precision, thereby meeting the requirements of high-accuracy strain and temperature measurements. Regarding repeatability, typical values are on the order of ±3–5 pm, indicating good measurement consistency and system stability. In addition, the sampling rates of systems such as those from BaySpec, Ibsen, and Idil can reach the kHz level, making them suitable for dynamic load and vibration measurements. Their dynamic range typically falls within 15–40 dB, allowing reliable operation over a wide range of signal intensities. Overall, these 1550 nm commercial interrogators benefit from the mature component ecosystem and system architectures developed in the telecommunications industry, enabling high-performance operation. In contrast, the 850 nm interrogation system developed in this work still exhibits noticeable performance gaps compared with these mature commercial products, particularly in terms of resolution, repeatability, dynamic range, and sampling capability. This performance gap arises not only from differences in system implementation and component maturity, but also from inherent differences in the sensing and demodulation mechanisms between the two wavelength bands. From a fundamental perspective, optical fiber transmission loss generally decreases with increasing wavelength; therefore, attenuation at 1550 nm is significantly lower than at 850 nm, which is more favorable for maintaining higher signal quality and signal-to-noise ratio during propagation. Furthermore, under the same physical perturbation, the Bragg wavelength shift of an FBG is approximately proportional to its center wavelength. As a result, FBGs operating at 1550 nm typically exhibit larger wavelength shifts than those at 850 nm. This implies that, under the same detector pixel resolution and spectral analysis conditions, wavelength variations induced by strain or temperature can be more readily resolved at 1550 nm. In addition, 850 nm systems are more commonly associated with multimode fiber operation, where modal dispersion and fluctuations in mode distribution are more pronounced, making stable spectral extraction and accurate peak localization more challenging. Overall, the inferior performance of 850 nm interrogators at the current stage has a clear physical and mechanistic basis when compared with their 1550 nm counterparts.
However, in certain application scenarios, the 850 nm wavelength band still offers unique advantages that are difficult to replace with the 1550 nm band. First, in biomedical detection and in vivo/on-skin sensing applications, 850 nm lies within the near-infrared optical window of biological tissues, where absorption and scattering are relatively low, enabling greater effective penetration depth and higher signal-to-noise ratio. Second, in scenarios such as short-range strain monitoring, flexible and wearable sensing, and measurements within confined spaces, system design places greater emphasis on device miniaturization, flexibility, ease of fiber coupling, and overall cost, rather than extreme performance under long-distance transmission conditions. For these applications, the variations in the measured physical quantities are typically more pronounced, and the required measurement resolution is determined primarily by practical engineering needs rather than the pursuit of sub-picometer or picometer-level extreme precision. Instead, these applications prioritize metrics such as penetration depth, signal-to-noise ratio, system integration, low power consumption, and cost-effective deployment, rather than ultimate wavelength demodulation accuracy. Therefore, as long as the system can achieve stable wavelength resolution and repeatability on the order of hundreds of picometers, it is sufficient to enable reliable detection and discrimination of physical parameter variations.
Compared with the mature commercial ecosystem at 1550 nm, publicly available commercial FBG interrogators operating in the 850 nm band remain relatively limited. A representative example is the FiSpec FBG X400 (FiSens GmbH, Brunswick, Germany), whose published specifications indicate an operating wavelength range of 808–880 nm, four channels, support for up to 30 FBGs per channel, and a simultaneous sampling range of 1–200 Hz. Its advertised application scenarios include process control, predictive maintenance, condition monitoring, and thermal mapping. The product is positioned as an integrated industrial interrogator with embedded processing and high thermal stability. However, such commercial 850 nm products are typically specialized industrial instruments, and their commercial acquisition cost is relatively high.
In contrast, the system proposed in this work is not intended to compete directly with highly integrated commercial products in every specification. Rather, it aims to demonstrate a practical and cost-conscious technical route for 850 nm FBG sensing. The present system is implemented using mature commercial optical components together with a CCD-based Czerny–Turner imaging spectrometer architecture. Under the experimentally validated conditions, the system achieved a system-level wavelength demodulation RMS error of 49.9 pm relative to the calibrated reference values, a repeatability-related RMS error of 86.9 pm, and a repeatability standard deviation of 69.3 pm. These results indicate that the proposed system is sufficient to support reliable detection and discrimination of physical-parameter variations in the targeted application scenarios. Moreover, because the entire system is constructed from mature, readily available standard components, the proposed approach also offers potential advantages in terms of implementation cost, system stability, and flexible integration. Overall, although spectrometer-based interrogators in the telecommunication bands still represent the mainstream standard for ultra-high-precision measurements, the proposed 850 nm system provides a practically viable solution for applications.
5. Conclusions
This study presents an 850 nm FBG spectral interrogation system based on imaging spectroscopy, whose performance was validated through theoretical analysis, ZEMAX optical simulations, and experiments. By adopting an optimized Czerny–Turner spectral imaging configuration, the system achieved stable imaging and favorable linear dispersion over the 840–880 nm wavelength range, and successfully realized simultaneous spectral acquisition and spectral separation of four cascaded FBGs.
Experimentally, the proposed system exhibited a mean wavelength demodulation error of 6.8 pm, representing the overall systematic deviation relative to the calibrated reference values. The corresponding system-level RMS wavelength demodulation error was 49.9 pm, which characterizes the typical reference-relative demodulation deviation. When all repeated measurements were considered individually, the repeatability-related RMS error was 86.9 pm, and the repeatability standard deviation was 69.3 pm, reflecting the overall dispersion and short-term measurement stability under identical experimental conditions. In addition, the calibrated strain sensitivities of the four cascaded FBGs ranged from 0.6850 to 0.7325 pm/με, with FBG2 showing a sensitivity of 0.7238 pm/με. It should be emphasized that these error metrics correspond to different stages of the measurement chain. The strain–wavelength calibration uncertainty reflects the quality of the adopted reference calibration, the wavelength–pixel calibration residual reflects the mapping accuracy of the imaging spectrometer, and the system-level demodulation metrics characterize the practical end-to-end performance of the proposed method relative to the calibrated references. Therefore, these quantities should not be interpreted as the same physical metric or combined through direct summation.
Overall, the results demonstrate that the proposed system provides a feasible technical route for high-precision FBG sensing in the 850 nm non-telecommunication band, with promising potential for short-range applications in biomedical sensing and structural monitoring.