1. Introduction
The recent technological developments are occurring at an unprecedented rate, substantially transforming the digital landscape. Therefore, mobile devices have become essential parts of daily life. Social media platforms, accessible from nearly anywhere with an internet connection, have increasingly influenced users’ lifestyles and communication habits [
1]. Traditional media has progressively lost ground to social media across numerous aspects of public and private life. As a result, people rely on these platforms to share personal experiences, sustain social contacts, and obtain real-time news and information.
As a result of these changes, the number of people using the internet around the world had grown to 5.56 billion by February 2025, and the number of people using social media had grown to 5.24 billion. These statistics demonstrate that approximately 67.9% of the world’s population is internet users, whereas social media users represent 63.9% [
2].
Another significant impact of social media is the transformation of users’ consumption habits. Specifically, users’ attention spans have decreased, leading to the increasing popularity of short-form content. Instagram has launched “Reels”, while YouTube has introduced “Shorts” as dedicated spaces for users to create and share short-form videos. Moreover, platforms such as TikTok, which are solely focused on short-form videos, have experienced a surge in popularity. According to data from Statista, as of 2025, YouTube has approximately 2.5 billion monthly active users [
3].
Due to the multimodal nature of short-format content, marketing content produced in this format has been observed to extend beyond the intended use of the platform. In this context, Xiao et al. [
4] demonstrated that each of the textual, audio, and visual attributes affects consumer engagement differently, and therefore, treating short-form video content as a single input ignores the meaningful signals specific to the different modes it contains. This observation highlights the importance of separating and optimally weighting the contributions of different modes to arrive at a result for popularity estimation in short-form content.
Following these transformations and developments, YouTube has evolved beyond merely serving as an entertainment platform to also serve as a platform for news [
5], education [
6], social commentary, and product marketing [
7]. As Sharma [
8] stated, access to YouTube, particularly Shorts, has become an essential part of modern routines during and after the COVID-19 pandemic. The rise of Shorts is also reshaping user behavior and content creation, with research by Violot et al. (2024) showing that Shorts significantly outperform regular videos in terms of user engagement, indicating a fundamental shift in content consumption preferences [
9].
Given this, the detection of popular content on social platforms has become a critical research area. Short-form video content is subject to rapid engagement cycles, with popularity often spiking and then decaying within hours. As Cho et al. (2024) demonstrate, deep learning models that analyze multimodal data can effectively predict whether a Short will go viral or not [
10]. Wu et al. (2018) emphasize that traditional metrics like views are insufficient alone and there is a need for richer engagement modeling, including watch time, like-to-view ratios, and comment sentiment [
11].
Simultaneously, the increasing volume of visual, textual, and behavioral data generated and processed on social media platforms has made privacy and security issues a key element in consumer technology research. Scientific studies in this area reveal that users from diverse regions and demographic groups express significant concerns about how their data is collected and processed on these platforms [
12], while the proliferation of image-capturing devices has spurred research into lightweight encryption methods designed for visual data in smart home and IoT environments [
13]. These parallel developments highlight the need for any framework working with user-generated, multimodal content to address both data utility and user privacy simultaneously.
The contributions of research on popularity prediction in social media and short-form video platforms have been constrained, as most methodologies depend on unimodal data or fail to employ cross-modal interaction mechanisms capable of capturing dependencies between modalities. Moreover, the absence of systematic ablation studies to validate architectural choices often reduces the interpretability and reliability of proposed approaches.
To overcome these limitations, this study proposes FUSEPOP (Multimodal Fusion with Co-Attention and Stacked Ensemble), an advanced ensemble framework that utilizes visual information (thumbnails), textual data (titles and descriptions), and statistical metadata. The proposed architecture employs a rigorous stacked generalization strategy trained via stratified 5-fold cross-validation to prevent data leakage and ensure robust generalization across diverse video categories. Within this hierarchical structure, a data-driven logistic regression meta-learner dynamically synthesizes the predictive probabilities from Random Forest, XGBoost, and Neural Network base classifiers, effectively weighing their contributions based on instance-level confidence. A defining characteristic of the proposed approach is the strategic handling of class imbalance without relying on synthetic data augmentation techniques; instead, the framework integrates amplified class weights with a focal loss mechanism, which penalizes the model for misclassifying minority samples. The obtained results demonstrate that the proposed architecture effectively tackles the short-form content popularity prediction problem on social networks. The main contributions of this study to the literature are as follows:
Deviating from conventional approaches that rely on computationally expensive video content analysis, this study strategically prioritizes thumbnail imagery, identifying it as the critical determinant of initial user engagement. Accordingly, a dataset of 12,589 thumbnails was retrieved, pre-processed, and aligned with textual metadata to serve as the foundational input for the proposed model.
We develop a novel architecture that integrates textual and visual features using a co-attention mechanism. This approach effectively captures intermodal dependencies and has demonstrated a superior predictive performance, improving the Avg-F1 score by an average of 25.8% over the mean of existing models in the literature while outperforming the strongest single prior model, AMPS, by 18.7%.
To address severe data imbalance without introducing synthetic noise, we implemented a robust strategy combining amplified class weights with a focal loss function, significantly enhancing the model’s sensitivity to the minority class while maintaining high precision.
We construct a stacked generalization framework utilizing a logistic regression meta-learner, which integrates predictions from random forest, XGBoost, and neural network classifiers. This hierarchical approach outperforms single-model baselines by an average of 4.75% in terms of Avg-F1 score.
We conduct comprehensive ablation studies to quantify the impact of specific components and fusion strategies. These experiments empirically validated the efficacy of the proposed FUSEPOP framework, proving that the stacked ensemble architecture provides a quantifiable performance gain over individual base classifiers.
These contributions collectively provide a comprehensive and reliable framework for predicting video popularity, addressing key limitations in the existing literature.
The remainder of this study is organized as follows:
Section 2 provides a thorough overview of relevant research in the field, outlines the methodologies employed, and discusses the findings reported in prior studies.
Section 3 provides a detailed overview of the materials, methods, and data used in this research, as well as in-depth explanations of the proposed approach.
Section 4 presents the experimental results obtained by the proposed model and provides a detailed comparison with the existing literature.
Section 5 provides the discussion and interprets the findings of the experimental studies conducted in this research. The limitations of this work and directions for future research are addressed in
Section 6. Finally,
Section 7 concludes the paper.
2. Literature Review
Predicting the popularity of social media content has emerged as a central research challenge at the intersection of data mining, computer vision, and computational social science. The core difficulty lies in identifying which combination of intrinsic content signals and platform behavioral features most reliably indicates virality and sustained engagement [
14]. Over the past decade, the field has evolved through three discernible phases: an early period dominated by metadata-centric and statistical approaches, a middle period characterized by deep visual and multimodal fusion architectures, and a recent phase defined by attention-based, platform-specific, and temporally aware models [
15]. Despite this progress, critical gaps remain in modeling short-form video platforms, particularly in the fusion of heterogeneous feature streams under severe class imbalance. The following review traces this evolution thematically, situating each contribution within the broader methodological landscape and identifying limitations that motivate the present work.
2.1. Metadata-Centric and Statistical Foundations
The earliest systematic efforts in video popularity prediction relied exclusively on platform-provided metadata, establishing the feasibility of the task while exposing the ceiling imposed by unimodal feature sets. Vallet et al. were among the first to approach this problem at scale in 2015, constructing a cross-platform framework that combined YouTube and X data to distinguish popular, viral, and simultaneously viral-and-popular videos using gradient-boosted decision trees [
16]. Gradient boosted decision trees represent a well-established ensemble methodology with broad applicability across classification tasks [
17]. By achieving an AUC of 0.91, they demonstrated that engagement signals from one platform carry predictive value for another. The exclusive reliance on behavioral metadata without any content-level features, however, limits the applicability of this framework to cold-start scenarios where engagement history is unavailable.
Figueiredo et al. addressed the temporal dimension of popularity in 2016 through TrendLearner, which extracts canonical popularity trajectory shapes from YouTube time series via K-spectral clustering [
18]. By concatenating centroid shapelet membership probabilities with video and referrer features and classifying via extremely randomized trees, the method achieved Macro F1 scores of 0.61 and 0.70 on the Top and Random YouTube datasets, respectively. TrendLearner demonstrated that temporal shape carries discriminative power independent of content, yet its dependence on sufficiently long observation windows makes it poorly suited to early or pre-publication prediction scenarios, a limitation that becomes especially acute in the fast-paced dynamics of short-form video feeds.
Another study was conducted by Hoiles, Aprem, and Krishnamurthy in 2017, who analyzed approximately six million YouTube videos across 25,000 channels collected over eight years through the BroadbandTV platform, empirically examining the sensitivity of meta-level features and social dynamics using Granger causality analysis [
19]. Their principal finding was that first-day view counts and subscriber numbers were the strongest predictors of long-term popularity across all model configurations tested, while post-publication metadata modifications, particularly title reformulations and thumbnail replacements, produced measurable gains in search-based and recommendation-based traffic, respectively. Although this work established metadata optimization as a practically actionable lever, the authors explicitly note that their conclusions are specific to the BBTV dataset and may not generalize beyond it, and the study does not model visual or textual content directly. These constraints become especially consequential on short-form platforms where algorithmic recommendation cycles operate at a significantly compressed timescale and content quality signals compete directly with metadata for predictive weight.
Nisa et al. revisited metadata-based classification in 2021, framing YouTube popularity prediction as a supervised binary task and demonstrating that a carefully tuned XGBoost model achieves an accuracy of 0.88 and an F1-score of 0.72 on the popular class [
20]. Their feature fusion strategy, which collapsed likes, dislikes, and comment counts into a single composite engagement score via nonlinear min-max normalization, proved more discriminative than raw feature concatenation. Nevertheless, the persistent gap between majority and minority class performance underscores the severity of class imbalance in popularity datasets, and the absence of visual or textual content features places a structural ceiling on predictive performance that no degree of hyperparameter tuning can overcome.
Halim, Hussain, and Ali extended the metadata paradigm to seven geographic regions in 2022, using a 40-day YouTube corpus augmented with comment-level sentiment scores [
21]. Applying five complementary feature selectors before training linear SVMs, k-nearest neighbors, and multilayer perceptrons, they demonstrated that content-agnostic signals are competitive across diverse cultural and linguistic contexts, achieving classifier accuracies between 0.922 and 0.930. The critical contribution of this work is its demonstration of geographic variability in feature importance, a finding that complicates the assumption of universal feature rankings implicit in many single-region studies. Its limitation, however, is the omission of any visual modality, which leaves the contribution of thumbnail and frame-level features to cross-regional generalization unexplored.
Taken together, these metadata-centric studies establish that platform behavioral signals and engagement metadata carry substantial predictive power but impose a performance ceiling that multimodal approaches must surpass. Across this cluster of works, the best reported accuracy on binary classification tasks is 0.88 [
20], providing a concrete baseline against which content-aware models should be evaluated.
2.2. Visual and Multimodal Feature Integration
Trzcinski and Rokita operationalized this insight in 2017 by framing popularity as a regression problem and proposing Popularity-SVR, which applies Support Vector Regression with a Gaussian Radial Basis Function kernel to social media video datasets [
22]. The method combines early temporal signals with a rich set of visual features, including color histograms, facial cues, text overlays, scene dynamics, and ResNet-152-derived deep representations extracted from video thumbnails. Evaluated on the Top and Random YouTube datasets with 16,132 and 5811 videos respectively, Popularity-SVR achieved Spearman rank correlations of 0.935 and 0.907. A key finding of this work is that temporal and social features substantially outperform visual ones as standalone predictors, with deep visual features alone reaching a Spearman correlation of only 0.14; however, combining all three feature types yields the strongest overall performance. This result establishes an important methodological principle: visual features are most valuable as a pre-publication complement to temporal signals rather than as an independent predictor, a finding with direct implications for the design of cold-start popularity models.
Abousaleh et al. substantially advanced multimodal image popularity modeling in 2021 through Visual Social CNN, which jointly processes visual descriptors and social context features with late fusion and PCA-based dimensionality reduction [
23]. Evaluated on a benchmark of approximately 432,000 Flickr posts, the framework achieved a Spearman rank correlation of 0.901, outperforming prior multimodal systems and confirming that heterogeneous social sensory data contributes independently of visual content quality [
24]. The adoption of attention mechanisms in related architectures has since demonstrated that selectively weighting feature contributions further reduces noise and improves rank correlation in this setting [
25]. A notable limitation of VSCNN is its evaluation on static image posts, leaving open the question of whether its fusion strategy generalizes to temporally structured video content.
Sarkar et al. extended multimodal prediction to video in 2023 through ViViD, a hierarchical network that fuses thumbnail features, title embeddings, audio elements, and video frame sequences for saturated view count prediction [
26]. The model encodes title text using BERT [
27], extracts thumbnail features via MobileNetV2, processes chroma-based audio features from the first 30 s of the audio track, and captures spatiotemporal video features using a ConvLSTM over 30 sampled frames. Achieving 73.41% mean classification accuracy on the Trending YouTube Video Statistics dataset, with ablation studies confirming that audio and video modalities are the most consequential for prediction, ViViD demonstrated the importance of modality completeness in hierarchical fusion. Its reliance on video and audio content from the first 30 s of each clip, however, introduces non-trivial computational requirements and limits applicability to platforms where audio tracks are unavailable or non-informative, as is frequently the case in short-form vertical video.
Comparing across this thematic cluster, the consistent finding is that visual features, whether handcrafted or deep, still or video, provide reliable gains over metadata-only baselines. The specific fusion strategy, however, remains an open design question, with no single approach demonstrably superior across platforms and prediction horizons [
15].
2.3. Attention-Based and Short-Form Video Approaches
The introduction of the transformer architecture [
28] fundamentally reshaped multimodal popularity modeling by enabling learned, dynamic weighting of cross-modal dependencies. The most directly relevant application of this paradigm to the present work is AMPS, proposed by Cho, Jeong, and Park in 2024, which specifically targets YouTube Shorts popularity prediction using a multimodal architecture that fuses frame embeddings, text encodings, and metadata features through self- and co-attention mechanisms [
10]. Trained and evaluated on a purpose-built corpus of 13,011 Korean YouTube Shorts, AMPS achieved 79.7% accuracy and consistently outperformed classical machine learning baselines, with ablation studies confirming the critical contribution of attention-based cross-modal interaction. While AMPS represents the most targeted prior work in the short-form video domain, its design does not explicitly address the severe class imbalance inherent in popularity datasets, nor does it explore ensemble-based or meta-learning strategies to improve decision boundary calibration.
Subsequent attention-based work incorporated temporal and graph-structured inductive biases to capture cascade dynamics. Zhang et al. proposed THGFormer in 2024, integrating time-aware hypergraph learning into the multimodal prediction pipeline to model higher-order temporal co-occurrence patterns among content items [
29]. Although evaluated on general social media content rather than short-form video specifically, THGFormer demonstrates that temporal context beyond simple publish-time features provides a meaningful discriminative signal. Its main limitation is the requirement for propagation history at inference time, which is unavailable in pre-publication prediction scenarios.
Platform-specific investigations have further enriched the short-form video literature. Javed et al. in 2025 combined YouTube metadata with comment-level sentiment features on the author-curated PAK VIDEOS dataset of 22,968 Pakistani trending videos, showing that an XGBoost classifier enriched with sentiment signals reaches 84.3% accuracy and outperforms random forest, gradient boosting, and SGD baselines under the same evaluation protocol [
30]. This work explicitly demonstrated the limitations of visual-free approaches, reinforcing the case for multimodal designs. Masood et al. extended content-level analysis to TikTok in 2025 through a Video-LLaMA-based video content analysis framework combined with a random forest classifier, modeling per-user watch-versus-swipe decisions over large-scale donated interaction logs [
31]. Their findings indicate that automated video-content features meaningfully complement interaction signals, and that users are highly sensitive to temporal and content-level cues rather than to passive engagement metrics alone.
These findings carry direct implications for popularity model design, as features that proxy algorithmic reward signals should be prioritized over those that reflect passive audience reactions. Understanding these platform-algorithmic dynamics is increasingly recognized as essential for interpreting public responses to trending content [
32] and for assessing the broader societal implications of engagement-driven recommendation systems [
33]. Giankos et al. further confirmed the commercial relevance of reliable popularity prediction by demonstrating that keyword-optimized Shorts campaigns yield significantly greater brand recall in fisheries marketing [
34], reaffirming the centrality of metadata optimization across diverse application verticals [
35].
2.4. Research Gap and Positioning of the Present Work
The reviewed literature reveals several structural limitations that collectively motivate the present work. From a definitional standpoint, most existing studies operationalize popularity as a raw view count and determine the popularity threshold manually, introducing inconsistency across studies and making cross-study comparison unreliable. This absence of a standardized labeling protocol undermines the comparability of reported metrics across the field.
At the architectural level, existing multimodal approaches typically rely on straightforward feature concatenation, treating visual, textual, and metadata features as equal contributors to the final prediction. This assumption rarely holds in practice, as metadata features such as subscriber counts and historical engagement metrics tend to dominate the learning process, overshadowing the more nuanced signals embedded in thumbnails and textual descriptions. No prior work has proposed a principled fusion strategy that actively balances modality contributions while preserving the predictive power of high-information features. Early fusion [
21], late fusion [
23], and hierarchical attention [
26] have each been explored in isolation, but no study has systematically compared these strategies on a unified short-form video benchmark.
Regarding class imbalance, the prevailing solution in the literature has been synthetic oversampling, particularly SMOTE and its variants [
36]. These techniques introduce artificial samples that may not accurately represent the true data distribution; however, they potentially degrade model precision on the minority class. Alternative strategies that operate on the original data distribution while still addressing distributional skew have received limited attention, particularly in the short-form video domain.
At the dataset level, the only directly comparable short-form video study is AMPS [
10], which does not address class imbalance, does not explore ensemble calibration strategies, and provides thumbnail images only as URLs rather than materialized image data, precluding genuine visual feature extraction. No prior work on this dataset has investigated whether weighted ensemble or meta-learning strategies can systematically improve minority-class recall under the approximately 15:85 popular-to-non-popular ratio characteristic of the corpus.
The present work addresses these gaps through FUSEPOP, a multimodal fusion framework that materializes thumbnail images from the original AMPS URL references to enable genuine image-text-metadata fusion, employs co-attention and cross-modal interaction mechanisms to prevent metadata feature dominance, and applies a stacked ensemble with a meta-learner layer to improve minority-class recall without relying on synthetic oversampling.
Table 1 synthesizes the datasets, feature sets, modeling choices, and headline metrics for all reviewed works, situating FUSEPOP within the cumulative landscape of the field.
3. Methodology
Predicting the popularity of social media content, particularly on short-form video platforms such as YouTube Shorts, remains a challenging task, given how visual, textual, and contextual metadata signals jointly influence user engagement [
37,
38]. Earlier studies have approached this by combining frame-based visual features, textual cues, and metadata using fusion architectures or attention mechanisms. While these methods have pushed the field forward, they often treat full video frames equally, emphasize temporal dynamics, or incur high computational costs.
In contrast, our methodology centers on the thumbnail, the visual cue most immediately perceived by users, integrated with textual and metadata modalities in a unified framework. Each modality is processed via dedicated encoders and refined with modality-specific self-attention layers before being merged through a multimodal fusion mechanism designed to prevent modality dominance. Unlike static voting ensembles, the resulting multimodal representation is classified via a stacked generalization architecture where a meta-learner dynamically synthesizes predictions from complementary base learners. This hierarchical design combines the robust feature extraction of deep neural networks with the decision stability of tree-based models, effectively addressing class imbalance without the need for synthetic data augmentation. Our architecture surpasses prior approaches in accuracy and F1-score while maintaining computational efficiency. Additionally, this section provides a comprehensive explanation of the methodologies employed in this research. It details the dataset used in the experiments, the preprocessing procedures, and the specific design of the proposed stacked model. Furthermore, it outlines the evaluation metrics adopted to assess the model’s predictive performance and validate its effectiveness.
3.1. Dataset
The dataset employed in this study originates from the AMPS short-form video dataset developed by Cho et al. [
10], which was specifically curated to analyze and predict the popularity of short-form content on YouTube Shorts. The original dataset was constructed using the YouTube Data API v3, and it contains a total of 13,011 unique YouTube Shorts covering a wide variety of content types within the South Korean region, where the collection was geographically restricted to control for cultural variation.
To define popularity, researchers introduced an improved popularity score based on normalized average daily views per subscriber, ensuring fair comparison across channels of varying audience sizes. The top 15% of videos representing approximately 85% of total engagement were annotated as popular (label = 1), whereas the remaining 85% were labeled non-popular (label = 0). This labeling strategy provides a realistic representation of real-world distribution and addresses the long-tail imbalance typical of online content performance. A concise summary of the original AMPS dataset and its key characteristics is presented in
Table 2 to provide an overview of the data sources and feature composition prior to the preprocessing and augmentation procedures described in the following section.
As can be seen from
Table 2, the dataset comprises 13,011 short-form videos collected via the YouTube Data API v3 within the South Korean region. Each record includes metadata such as video- and channel-level statistics, textual information from titles and descriptions, and URLs referencing the thumbnails that visually represent the videos. Popularity labels were assigned using a CDF-based normalization of daily views per subscriber, resulting in a binary class distribution of approximately 15% popular and 85% non-popular videos. This structure provided a robust foundation for the multimodal analysis conducted in this study.
3.2. The Proposed Model
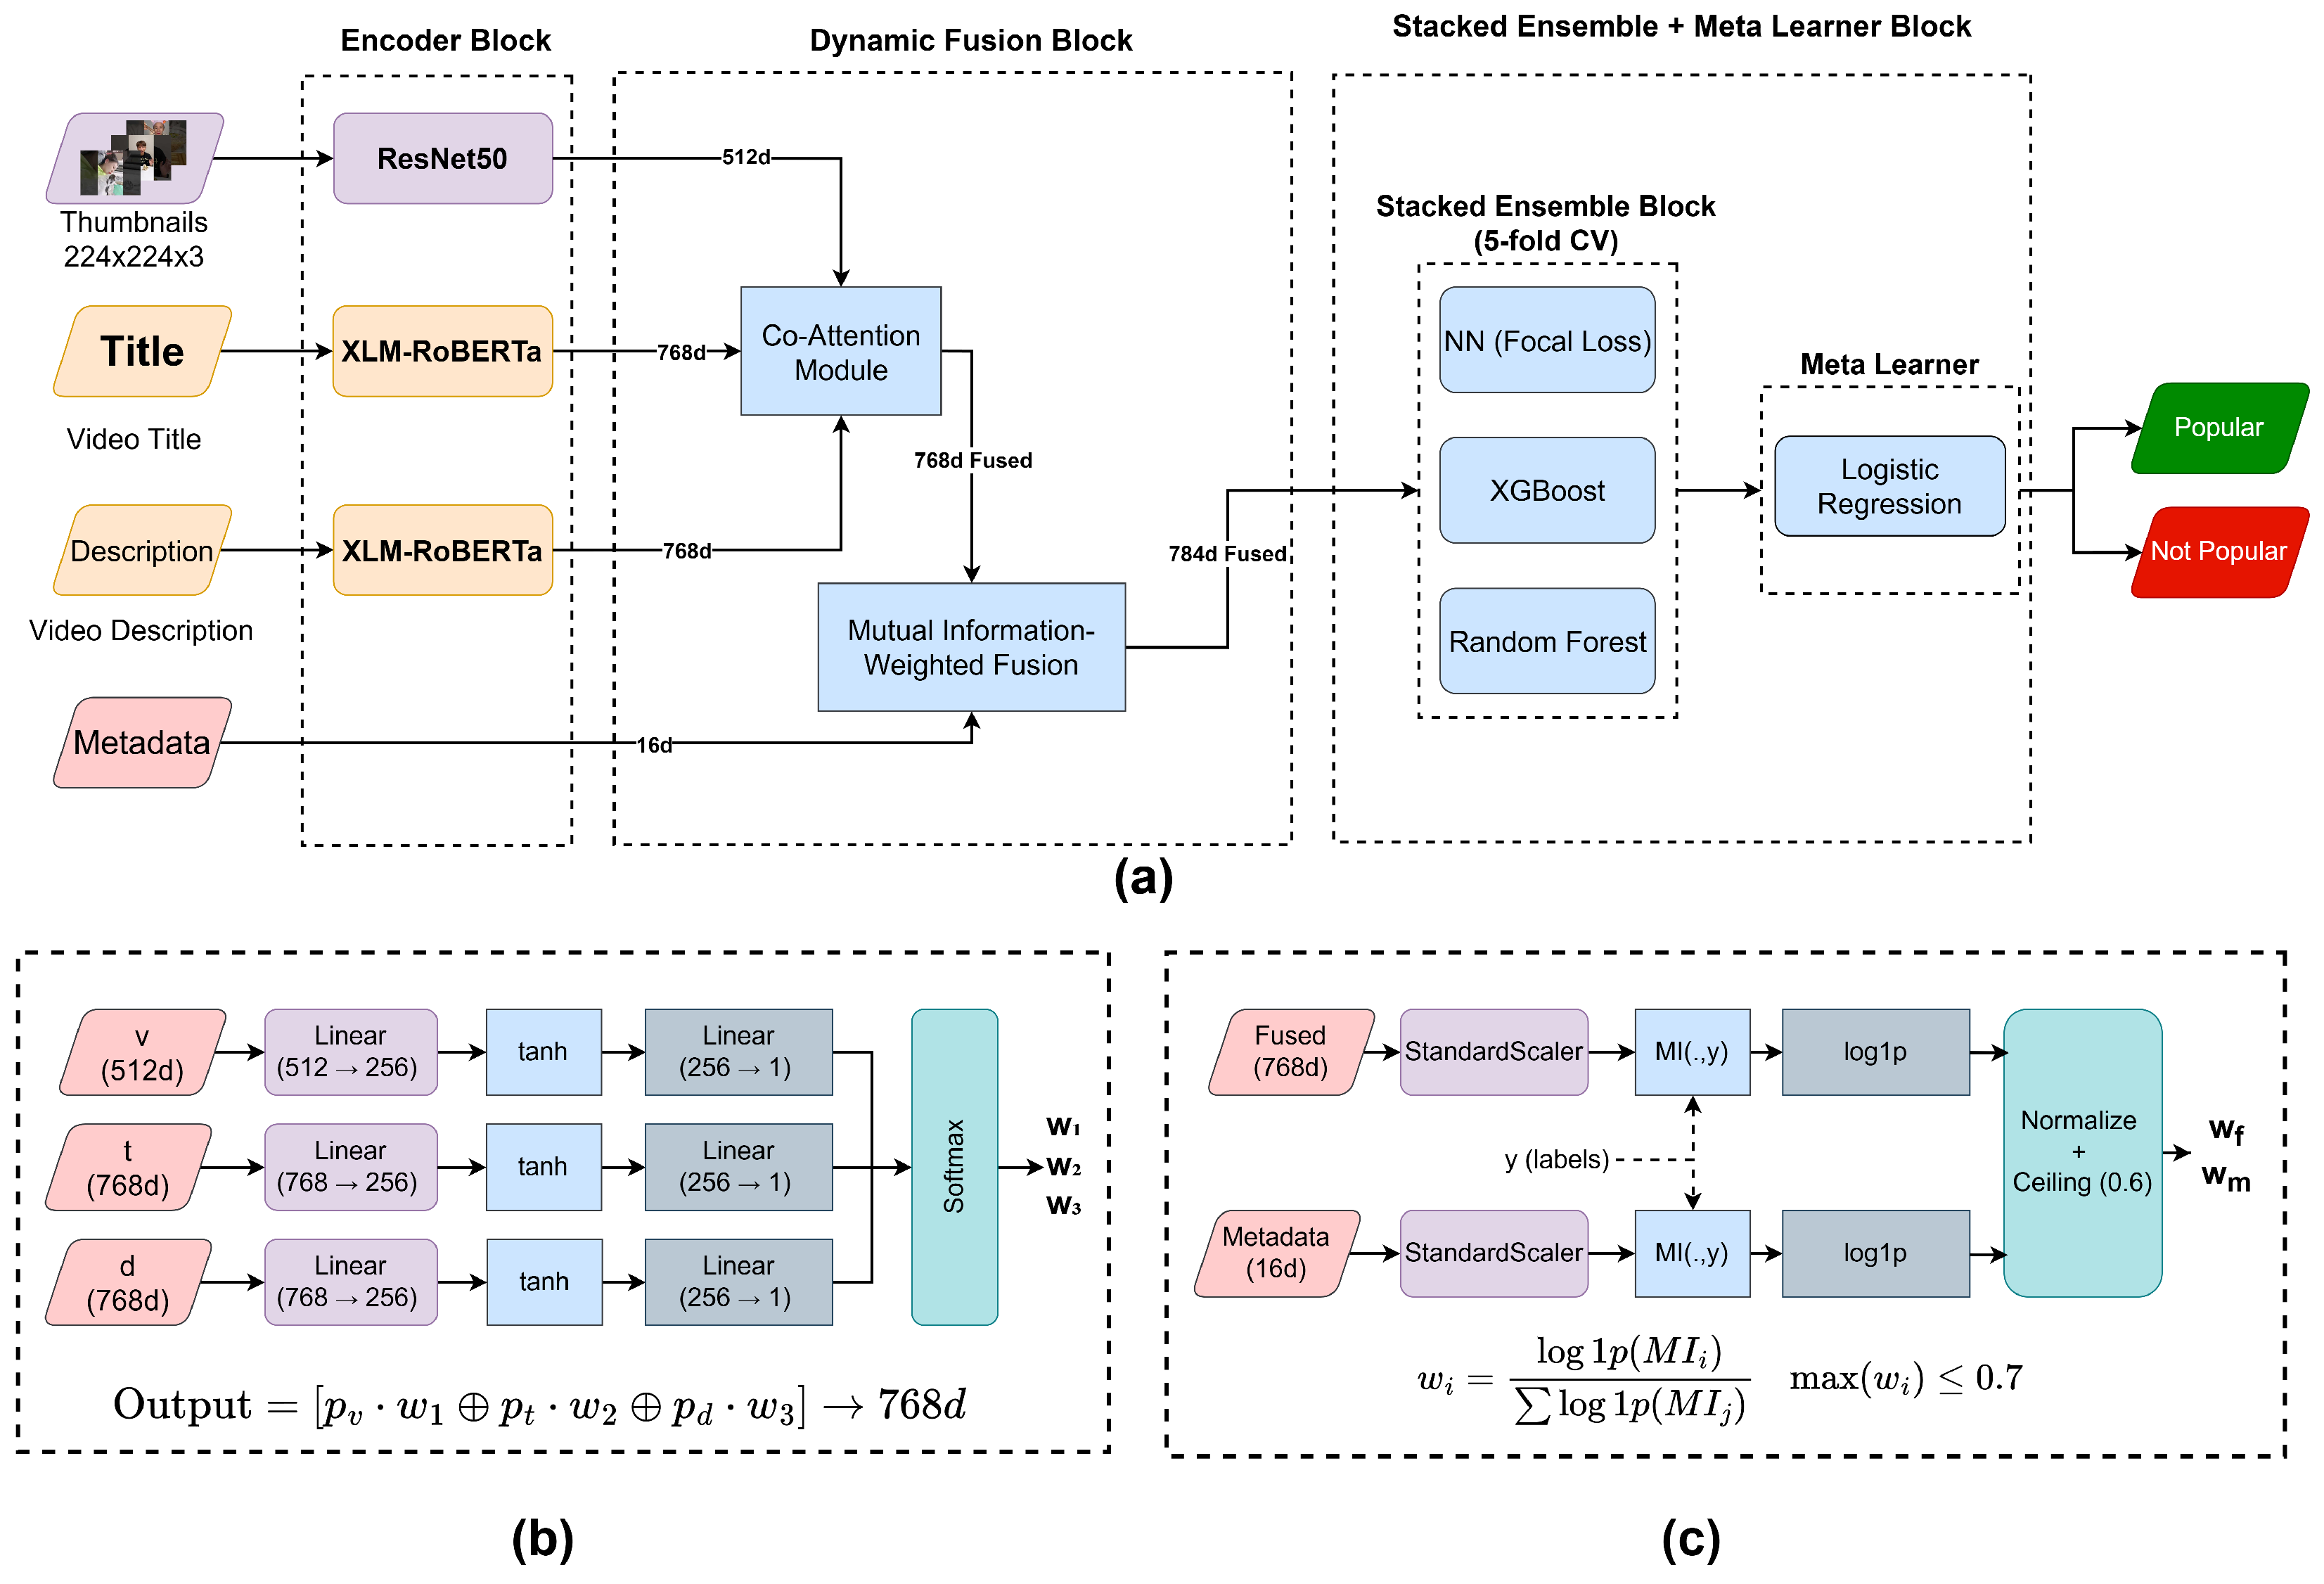
The FUSEPOP model extracts complementary signals from three sources: thumbnail images, titles/descriptions of the Shorts videos, and metadata, as illustrated in
Figure 1a. Co-attention-guided fusion combines these representations so that the model can focus on the most useful modality for each video instance and reduce cross-modal interference. After the fused feature vector, a stacked ensemble of three learners, namely, a multi-layer perceptron, XGBoost, and a random forest, produces predictions. A logistic regression meta-learner is then trained on out-of-fold base predictions and combines them into the final decision, improving stability and precision.
3.3. Preprocessing
The preprocessing stage constitutes a critical component of the proposed methodology, ensuring the consistency, completeness, and multimodal alignment of the dataset prior to model training. Through this stage, the visual, textual, and metadata modalities were systematically cleaned, standardized, and transformed to establish a coherent and high-quality input foundation for subsequent feature extraction and fusion.
Building upon the original AMPS dataset, all preprocessing procedures in this study were designed to transform the raw multimodal inputs into structured and learning-ready formats. These steps included downloading and materializing thumbnail images, cleaning and tokenizing textual fields, and normalizing video- and channel-level metadata. Particular attention was given to the synchronization of modalities, ensuring that each visual, textual, and metadata instance corresponded precisely to the same video identifier. This step was essential to prevent modality misalignment and to guarantee the integrity of multimodal fusion during training and evaluation.
3.3.1. Visual Preprocessing
Visual modality represents the most critical component of this study, as thumbnails are the first visual cues that attract user attention and largely influence engagement behavior. While the original AMPS dataset contained only the thumbnail URLs, this research extended it by downloading, validating, and integrating the actual thumbnail images corresponding to each video record. This enhancement allowed the incorporation of concrete visual data into the multimodal framework, thereby enabling genuine visual-text-metadata fusion.
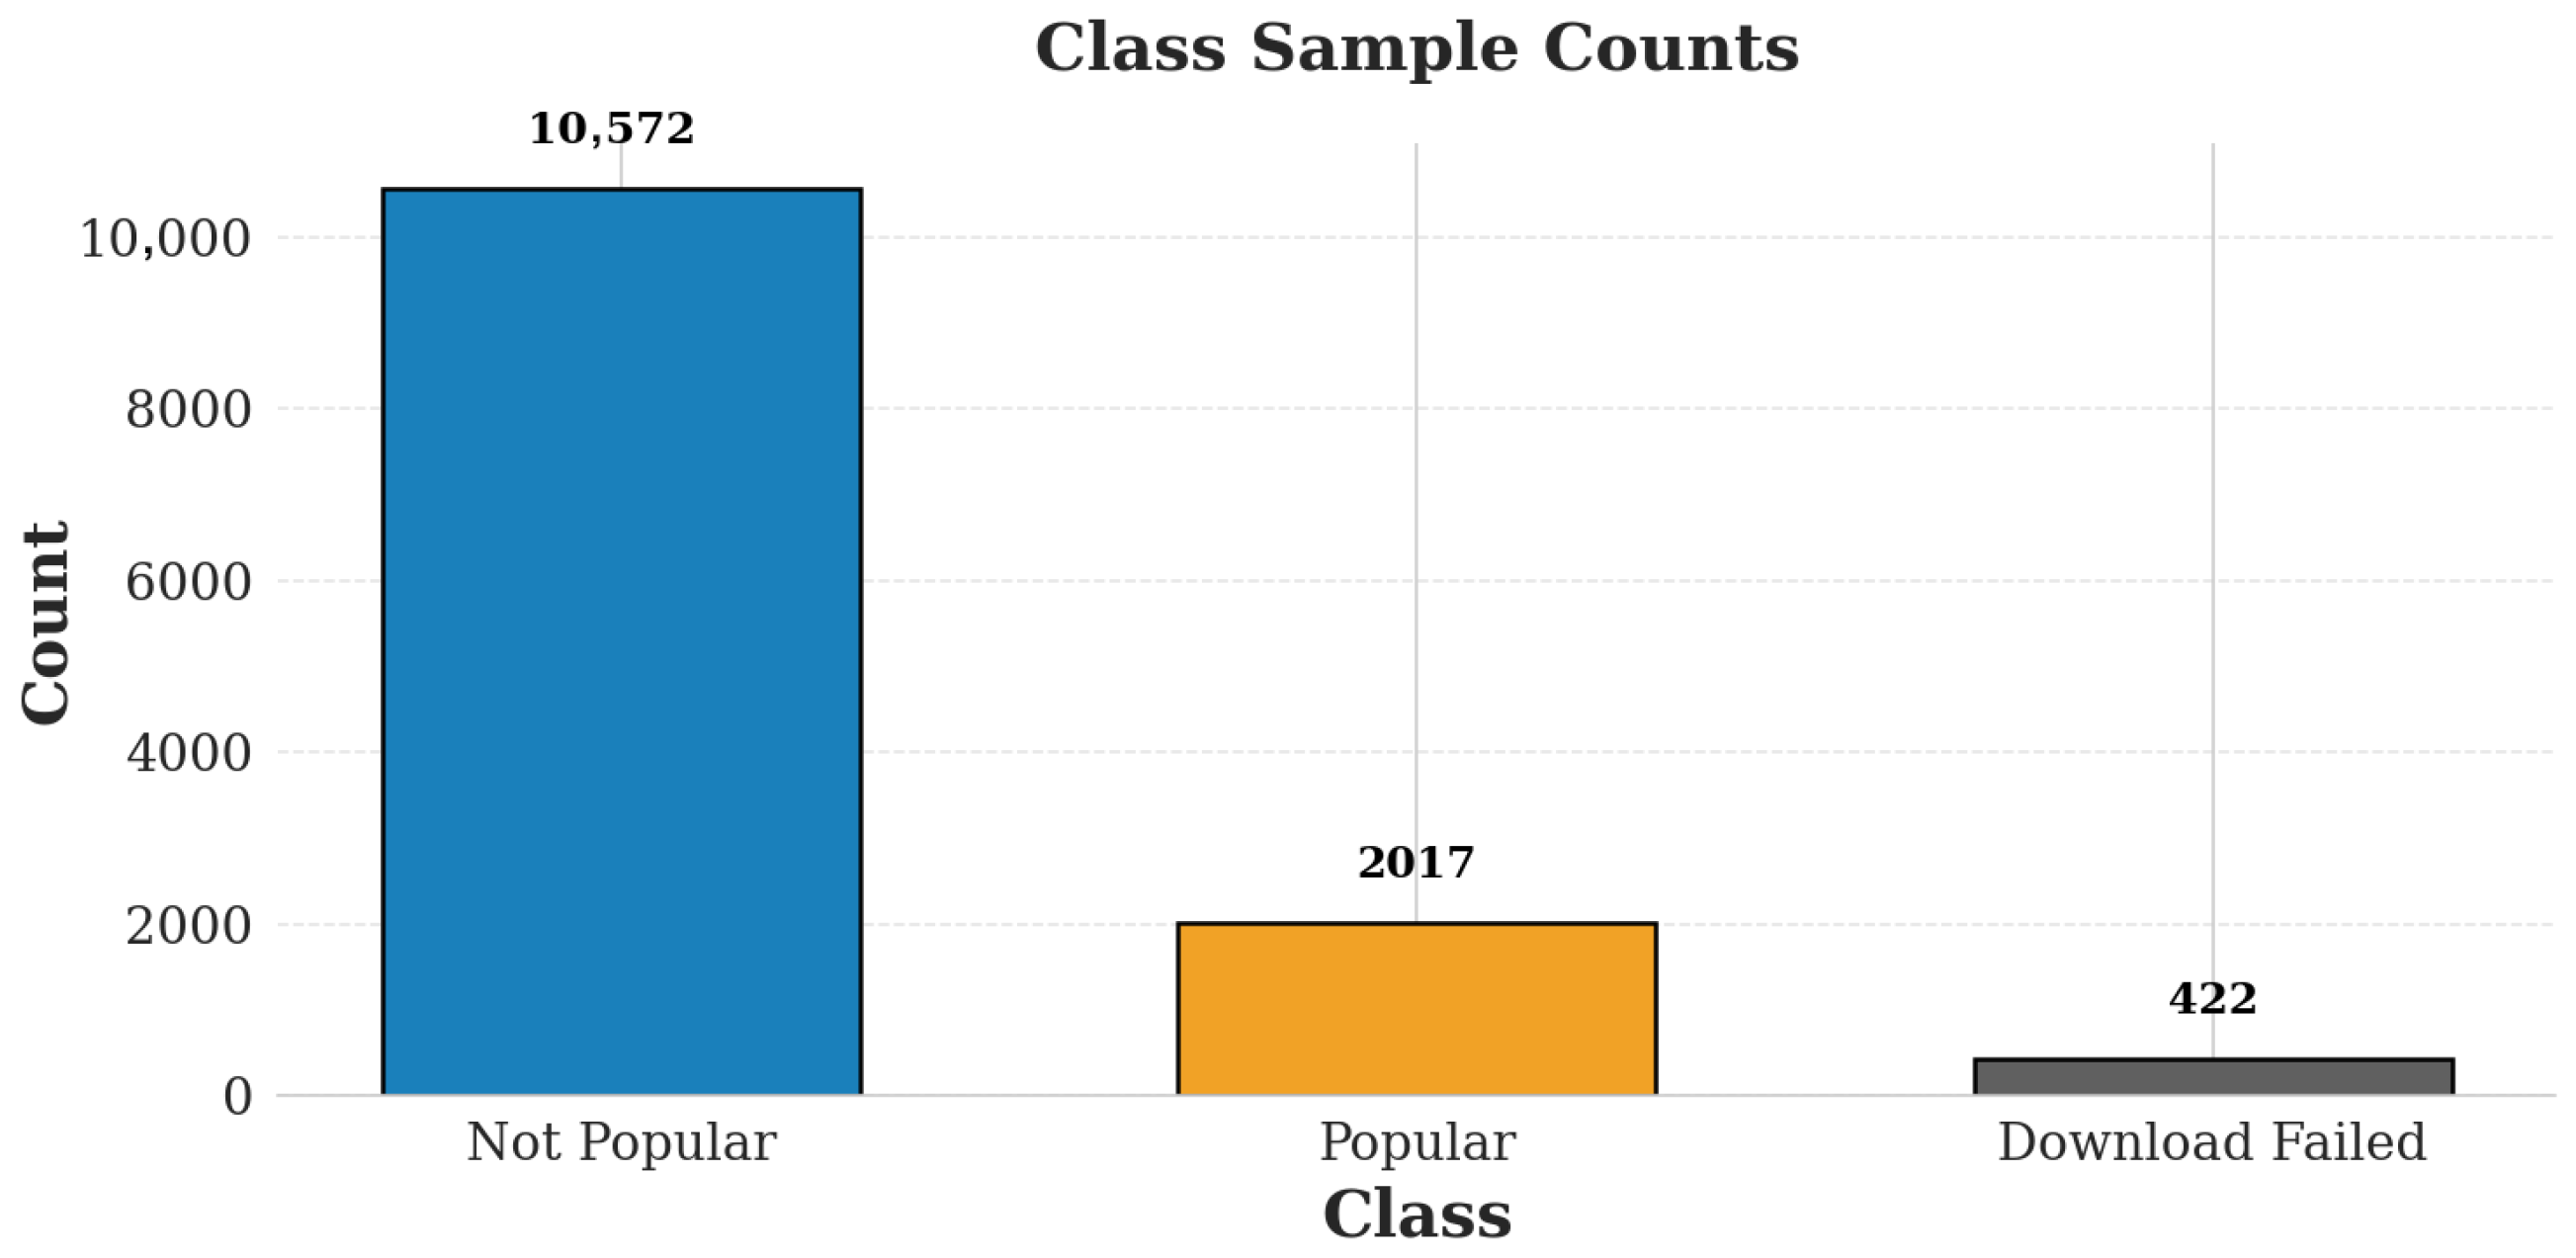
Out of a total of 13,011 thumbnail URLs, 12,589 images were successfully downloaded, whereas 422 downloads failed due to factors such as removed or restricted videos, missing metadata, or broken links. Each successfully retrieved thumbnail was resized to 224 × 224 pixels, consistent with the input requirements of the ResNet-50 image encoder used in the later stages of the model. The images were then normalized using the standard ImageNet mean and standard deviation values and converted into PyTorch tensors to ensure compatibility with deep learning frameworks. The class sample counts after this process are given in
Figure 2.
Following preprocessing, the thumbnails were used for feature extraction via the ResNet-50 architecture, initialized with ImageNet pre-trained weights. This step established a uniform and high-quality visual representation, emphasizing attributes such as composition, brightness, and subject prominence, which are key determinants of user engagement and content popularity.
Figure 3 presents examples of downloaded and preprocessed thumbnails. Each thumbnail was retrieved via its URL from the AMPS dataset, resized to 224 × 224 pixels, and normalized according to ImageNet statistics to ensure compatibility with the ResNet-50 visual encoder. This step standardizes color distribution and resolution while preserving the compositional and aesthetic cues such as brightness, contrast, and focal subject that are critical to predicting user engagement. To illustrate these steps, Algorithm 1 presents the structured workflow of our visual preprocessing pipeline, which was uniformly applied to all successfully downloaded thumbnails prior to feature extraction.
| Algorithm 1 Visual Preprocessing for Thumbnails |
- Require:
Image folder ; resize = ; normalization - Ensure:
Tensor batch ; video_ids; failed_ids - 1:
Initialize empty lists: images, video_ids, failed_ids - 2:
for all file f in do - 3:
- 4:
if then - 5:
Append to failed_ids; ▹ skip this file - 6:
else - 7:
- 8:
Apply torchvision.transforms.Compose: (1) Resize (2) ToTensor() (3) Normalize(mean = , std = ) - 9:
transformed tensor - 10:
Append x to images; Append to video_ids - 11:
end if - 12:
end for - 13:
Stack all tensors ▹ - 14:
Persist failed_ids for error inspection - 15:
return , video_ids, failed_ids
|
As shown in Algorithm 1, each thumbnail was first loaded and converted to the RGB color space to ensure consistent channel representation. Unreadable or corrupted images were automatically excluded and recorded for quality control, resulting in a final set of 12,589 valid thumbnails. Each image was then resized to pixels using bilinear interpolation, converted to a tensor scaled within , and normalized according to the ImageNet mean and standard deviation values (, ). This standardized preprocessing not only ensured input compatibility with the pretrained ResNet-50 backbone but also preserved essential visual attributes such as color balance, contrast, and focal composition that are fundamental to modeling user engagement patterns.
3.3.2. Textual Preprocessing
The textual modality of the dataset comprises the titles and descriptions of each YouTube Short. These elements convey semantic, emotional, and contextual cues that frequently influence a viewer’s decision to engage with the content. Because the dataset contains videos in both Korean and English, textual preprocessing was designed to preserve linguistic diversity while ensuring cross-lingual representativeness.
Initially, all textual fields were cleaned by removing HTML tags and redundant whitespace. Punctuation marks were retained only when they contributed to sentence structure or emotive expression. Each video’s title and description were stored separately to maintain their distinct communicative roles, reflecting attention-grabbing phrases and descriptions providing contextual information.
To encode textual data into dense semantic representations, we employed the XLM-RoBERTa tokenizer, which performs multilingual subword tokenization and is well-suited for mixed-language datasets. Token sequences were truncated or padded to a fixed maximum length to ensure uniform input dimensions, enabling efficient batch processing during training. For each text field, the tokenizer generated a sequence of token IDs along with corresponding attention masks, which were subsequently fed into the XLM-RoBERTa base model to obtain contextual embeddings.
This preprocessing pipeline ensured that linguistic features such as sentiment, emphasis, and cross-cultural word associations were retained, allowing the model to effectively capture the textual characteristics that contribute to content popularity. Algorithm 2 outlines this procedure.
| Algorithm 2 Textual Preprocessing for Titles & Descriptions (XLM-RoBERTa) |
- Require:
Dataset rows ; tokenizer xlm-roberta-base; max_len - Ensure:
Matrices title_ids, title_masks, desc_ids, desc_masks - 1:
title_ids, title_masks, desc_ids, desc_masks← [] - 2:
for all do - 3:
; - 4:
if t is NULL or empty then - 5:
“<EMPTY_TITLE>” - 6:
end if - 7:
if d is NULL or empty then - 8:
“<EMPTY_DESC>” - 9:
end if - 10:
Strip HTML tags; unescape entities; Unicode normalize (NFKC) - 11:
Collapse repeated whitespace; trim - 12:
▹Title tokenized independently max_length = max_len, padding = “max_length”, truncation = True, return_attention_mask = True) - 13:
▹Description tokenized independently max_length = max_len, padding = “max_length”, truncation = True, return_attention_mask = True) - 14:
Append , to title_ids, title_masks - 15:
Append , to desc_ids, desc_masks - 16:
end for - 17:
Stack all lists into final matrices - 18:
return title_ids, title_masks, desc_ids, desc_masks
|
As outlined in Algorithm 2, each video’s title and description were first verified for completeness and replaced with placeholder tokens (<EMPTY_TITLE>, <EMPTY_DESC>) when missing. Unicode normalization was then applied to maintain consistency across multilingual characters, while excessive whitespace and newline artifacts were collapsed to preserve structural coherence. Notably, the texts were not lowercased, as the XLM-RoBERTa tokenizer employed in this study is cased and benefits from the retention of capitalization cues. Finally, each cleaned title and description was independently tokenized up to a maximum sequence length of 512, ensuring uniform input dimensions while preserving the most informative segments. The resulting tensors were then stored for downstream modeling.
3.3.3. Metadata Preprocessing
The metadata of each video provided complementary information beyond visual and textual modalities, reflecting various quantitative and categorical aspects of user interaction and content classification. To ensure consistency with multimodal features, this metadata was preprocessed through a standardized pipeline. Initially, the consolidated CSV file containing metadata for all videos was loaded and inspected to identify the available numerical and categorical fields. Numerical attributes, specifically videoViewCount, videoLikeCount, videoCommentCount, totalViewCount, and subscriberCount, were identified and retained. These columns were converted to numeric types using coercion, and any invalid or missing entries were replaced with zeros to prevent data sparsity during scaling. For categorical variables, only videoCategoryId was utilized, as it provided a semantically meaningful mapping between video content and its corresponding YouTube category.
Following this data validation stage, numerical features were standardized, ensuring that each feature contributed proportionally to the model’s learning process without being influenced by scale disparities. Additionally, the categorical variables were one-hot encoded to preserve dimensional stability across datasets. The five retained numerical attributes were videoViewCount, videoLikeCount, videoCommentCount, totalViewCount, and subscriberCount, selected based on their highest individual mutual information scores with the popularity label. The categorical variable videoCategoryId was one-hot encoded into 11 binary indicator features. Channel identity features (channel ID, channel title) and rank-based indicators (likesRank, viewsRank) were excluded as they either encode categorical identifiers or derive deterministically from the retained numeric fields. These two feature groups were merged, yielding a unified 16-dimensional metadata representation suitable for downstream fusion with textual and visual embeddings. We refer to this feature configuration as Subset A throughout the remainder of the paper; it represents the feature selection adopted for the principal experiments of this study.
Table 3 summarizes the grouping of these attributes.
To facilitate better comparison with existing literature, we additionally prepared a second metadata configuration, referred to as Subset B, built around the attribute groups commonly reported in prior social media popularity prediction studies. Instead of relying on raw video-level counts, Subset B draws on channel-level statistics, derived engagement ratios, temporal signals from the publication timestamp, and content structure indicators extracted from titles, descriptions, and tags. Sixteen numerical attributes were produced in this way and combined with the same one-hot encoded videoCategoryId, yielding a 27-dimensional vector.
Table 4 presents the full grouping.
This preprocessing pipeline ensured that the model received normalized, numerically stable, and semantically interpretable metadata features, reducing the likelihood of bias arising from feature-scale imbalance or category sparsity.
3.4. Feature Extraction
Following the preprocessing procedures described above, the next stage involved converting the cleaned inputs from each modality into numerical feature representations suitable for multimodal fusion. The aim of this step was to preserve modality-specific information while projecting all inputs into a comparable latent space, enabling the model to learn complementary relationships across visual, textual, and metadata streams.
For the visual modality, each standardized thumbnail image was passed through a ResNet-50 network. The output was projected into a 512-dimensional embedding, which was retained as the visual feature vector.
The textual modality was processed using the XLM-RoBERTa transformer, which supports multilingual text and preserves semantic nuances across languages. Each video’s title and description were jointly encoded as a sentence pair, allowing the model to contextualize descriptive information relative to the concise summary provided by the title. The [CLS] token embedding from the XLM-RoBERTa final hidden state was extracted as a 768-dimensional representation for each field separately, yielding distinct title and description embeddings that jointly encode semantic and contextual signals critical to popularity prediction. This approach provided a robust representation of textual context, sentiment, and key determinants of online popularity.
Finally, the metadata modality was encoded into two alternative feature configurations described in
Section 3.1. For Subset A, the metadata vector consisted of 16 features: five numerical attributes (videoViewCount, videoLikeCount, videoCommentCount, totalViewCount, and subscriberCount) and 11 one-hot encoded category indicators derived from videoCategoryId. For Subset B, the same 11 one-hot indicators were combined with 16 engineered numerical attributes covering channel authority, temporal, and content-structure signals, yielding a 27-dimensional vector. In both cases, the numerical variables were standardized to ensure comparable scales across features.
Each modality’s feature set was serialized as NumPy arrays and stored independently, ensuring modularity and reproducibility for downstream processing. This separation also facilitated controlled experiments, allowing the model to be trained and evaluated on individual modalities or their combinations during the subsequent fusion and classification phases.
3.5. Class Imbalance Handling
Following the removal of 422 unresolvable thumbnail URLs, popular videos constituted 16.0% of the retained 12,589 samples. A chi-squared test confirmed that the failed downloads were distributed proportionally across both classes (
), indicating that the marginal increase from the original 15% labelling threshold does not introduce systematic bias into the retained set. Addressing this severe class imbalance present in the dataset required careful consideration of available strategies. While synthetic oversampling techniques such as SMOTE have become a standard in the literature [
36], our preliminary experiments revealed that these approaches degraded the average F1-score by approximately 0.55% in our specific context, with no commensurate improvement in minority-class recall. This outcome suggests that the synthetic samples blurred class boundaries and did not faithfully reproduce the characteristic patterns of genuinely popular content.
We therefore adopted an alternative strategy centered on class-weighted learning combined with focal loss [
39]. Rather than artificially augmenting the training set, we assigned amplified weights to minority-class samples during optimization. Specifically, the class weight for the popular class was computed as:
where
(non-popular samples) and
(popular samples), and
is the amplification multiplier, yielding
. This weight was applied directly to the Random Forest class_weight parameter and as the scale_pos_weight in XGBoost to further emphasize the underrepresented popular class. This weighting scheme was integrated directly into the loss computation, ensuring that misclassifications of popular videos incurred proportionally higher penalties.
To complement this approach, we employed Focal Loss with parameters and , which dynamically down-weights well-classified examples and focuses learning on hard-to-classify samples. The aggressive parameter proved particularly effective for our imbalanced setting, as it forced the model to concentrate on boundary cases where popular and non-popular content exhibited similar feature patterns. This combination preserved the original data distribution, reduced training time by approximately 30% compared to oversampling-based pipelines, and ultimately yielded superior precision-recall trade-offs across all evaluation metrics.
3.6. Multimodal Feature Fusion
Integrating heterogeneous representations across visual, textual, and metadata modalities presents a fundamental challenge: not all modalities carry equal predictive weight, yet conventional fusion approaches treat them as such. In our preliminary analyses, we observed that metadata features exhibited substantially higher correlation with popularity outcomes than thumbnail or textual features. Simple concatenation, while computationally straightforward, allowed these dominant features to effectively overshadow the subtler patterns encoded in visual aesthetics and linguistic cues.
To address this imbalance, we developed a two-stage hierarchical fusion strategy grounded in cross-modal interaction and information-theoretic weighting. The overall architecture is illustrated in
Figure 1a, while the internal mechanisms of the co-attention module and the MI-weighted fusion are detailed in
Figure 1b and
Figure 1c, respectively. The first stage fuses visual and textual modalities through a supervised co-attention mechanism before integrating the combined representation with metadata using mutual-information-based weighting.
In the first stage, co-attention fusion combines visual and textual representations, as detailed in
Figure 1b. Thumbnail images pass through a ResNet-50 backbone pretrained on ImageNet, producing 512-dimensional visual feature vectors. Titles and descriptions are processed independently through XLM-RoBERTa; the [CLS] token from each field’s final hidden state yields a 768-dimensional embedding, capturing cross-lingual semantic nuances. A supervised co-attention module then jointly attends over the visual (512d) and both textual (768d each) representations, enabling the model to highlight complementary cross-modal patterns such as emphasizing thumbnail saliency when the title is uninformative or foregrounding linguistic cues when the image is ambiguous. This module is trained end-to-end with a thin classification head; after training, only the 768-dimensional fused visual-text embedding is retained for the next stage. Specifically, each modality is first projected into a shared 256-dimensional space through independent linear transformations:
,
, and
, where
and
. A scalar importance score is then computed for each projection as
, and the three scores are normalized via softmax to yield modality weights
. The fused output is obtained by concatenating the weighted projections:
where ⊕ denotes concatenation and
, as illustrated in
Figure 1b.
In the second stage, the fused representation is integrated with metadata through mutual-information-based weighting, as illustrated in
Figure 1c. The 768-dimensional fused visual-text representation is then combined with the metadata vector, whose dimensionality depends on the feature configuration: 16-dimensional for Subset A (five numerical features and 11 one-hot category indicators) and 27-dimensional for Subset B (16 engineered numerical attributes combined with the same 11 one-hot category indicators). Modality importance weights are derived from mutual information scores between each modality and the binary popularity label. Two corrective measures prevent dominance: logarithmic smoothing compresses the weight range, narrowing the gap between high- and low-information modalities, and a hard ceiling of 0.7 on any single weight guarantees that no modality is suppressed outright. The two weighted representations are concatenated into a final 784-dimensional vector for Subset A (or 795-dimensional for Subset B) that draws on complementary signals across all input streams. Formally, the weight assigned to each modality is computed as:
where
denotes the mean mutual information between the features of modality
i and the popularity label, and the
transform prevents any single high-MI modality from dominating. If a weight exceeds the ceiling of 0.7, the excess is redistributed to the remaining modality. The final fused representation is then:
where
and
are the instantiated weights for the fused visual-text and metadata modalities, respectively, as depicted in
Figure 1c. The final dimensionality
d equals
for Subset A and
for Subset B.
The mean mutual information between the feature representation of each modality and the popularity label is given in
Table 5. Accordingly, among individual modalities, metadata achieves the highest value with 0.0499, followed by description, title, and thumbnail with 0.0163, 0.0020, and 0.0014, respectively. This ranking confirms the tendency of metadata to dominate the predictive signal when modalities are considered individually.
Applying the log-smoothed weighting described in Equation (
3) yields pre-ceiling weights of 0.218 for the fused visual-text stream and 0.782 for metadata. Without this process, metadata would therefore constitute approximately four-fifths of the combined representation. The weight ceiling redistributes the final weights to 0.30 and 0.70, ensuring that the fused modality retains a meaningful contribution to the downstream classifiers. These values empirically confirm the necessity of both the logarithmic smoothing and the ceiling mechanism employed in this study to prevent modality collapse.
For Subset B, the same procedure was repeated on the alternative metadata configuration. The metadata mean mutual information in this case was measured at 0.0272, and the fused visual-text stream at 0.0120. The log-smoothed weights produced 0.3089 for the fused stream and 0.6911 for metadata, which both remain below the 0.7 ceiling and are therefore used directly. The corresponding values for both configurations are shown together in
Table 5.
The fused representation serves as input to a stacked ensemble comprising three base learners with distinct inductive biases:
A Random Forest classifier providing robustness through bootstrap aggregation and implicit feature selection.
An XGBoost model capturing complex non-linear interactions and gradient-based refinement of decision boundaries.
An MLP trained with focal loss to address the inherent class imbalance.
Rather than simple voting, we employ a stacking architecture where base model predictions are generated through 5-fold stratified cross-validation. This out-of-fold procedure ensures that the logistic regression meta-learner is trained exclusively on predictions derived from held-out samples, eliminating data leakage and producing reliable performance estimates. The meta-learner combines the probability outputs from all three base models, learning an optimal weighting scheme that leverages their complementary strengths. The final output is a binary classification indicating whether a given YouTube Short is predicted to achieve popular status.
3.7. Classification Network and Comparative Evaluation
The classification stage of the proposed FUSEPOP framework transforms the fused multimodal representation into binary popularity predictions through a stacked ensemble architecture. Unlike conventional voting schemes, where base model outputs are combined through fixed coefficients, our approach employs a learned aggregation strategy that adapts to the predictive characteristics of each constituent classifier.
The ensemble comprises three base learners selected for their complementary inductive biases. The first is a Random Forest classifier configured with 200 estimators and constrained tree depth, providing stability through bootstrap aggregation and inherent resistance to overfitting. Its capacity for implicit feature selection proves valuable when processing high-dimensional fused representations where not all features carry equal discriminative power. The second base learner is an XGBoost model, whose gradient boosting mechanism excels at capturing complex feature interactions and refining decision boundaries through iterative residual correction. Hyperparameters, including learning rate, maximum depth, and regularization terms, were optimized through grid search on a held-out validation set.
The third component is a neural network designed to model non-linear relationships within the multimodal embedding space. The architecture consists of fully connected layers with batch normalization and dropout regularization to mitigate overfitting. Training employs the AdamW optimizer with focal loss, which dynamically reduces the contribution of well-classified examples while amplifying gradients from difficult samples near the decision boundary. Combined with amplified class weights, this configuration proved particularly effective for our imbalanced setting.
A critical aspect of our ensemble design concerns how base model predictions are generated for meta-learner training. Naive approaches that train the meta-learner on predictions from the same data used to fit base models introduce subtle but consequential data leakage. We address this through out-of-fold prediction generation: using 5-fold stratified cross-validation, each training sample receives a prediction from a base model that never observed that sample during its own training. This procedure yields unbiased probability estimates that faithfully represent each base learner’s generalization capability.
The meta-learner, which is a logistic regression classifier, receives the stacked probability outputs from all three base models and learns optimal combination weights. This learned aggregation consistently outperformed fixed voting schemes in our experiments, as it accounts for model-specific calibration differences and complementary error patterns. The final output is a binary label indicating predicted popularity status.
To further calibrate the ensemble output, the decision threshold was optimized post-training using the out-of-fold probability predictions. Candidate thresholds were evaluated over the range [0.1, 0.9] at 0.01 increments, with the threshold maximizing the popular-class F1-score selected. The optimal threshold of 0.81 was identified on the training-fold predictions for Subset A and applied without modification to the held-out test set, ensuring that information from the test partition did not influence this selection. The same procedure on Subset B yielded a threshold of 0.88.
This modular architecture facilitated systematic ablation studies examining the contribution of individual components. We evaluated single-modality configurations (visual-only, text-only, metadata-only), alternative fusion strategies, and reduced ensemble variants. These comparative analyses, detailed in the
Section 4, quantify the performance gains attributable to multimodal integration and the stacking architecture, demonstrating that the observed improvements stem from principled design choices rather than incidental factors.
3.8. Evaluation Metrics
The performance of the proposed model was evaluated using four widely adopted metrics for binary classification: accuracy, precision, recall, and F1-score. These metrics collectively provide a comprehensive evaluation of the model’s overall accuracy and its ability to correctly classify instances in the dataset [
40].
The accuracy metric quantifies the overall proportion of correctly classified samples and is defined as
where TP, TN, FP, and FN denote the numbers of true positives, true negatives, false positives, and false negatives, respectively. Although accuracy provides an intuitive overall measure, it can be misleading when class distributions are uneven.
To account for this, additional class-specific metrics were employed. The precision metric evaluates the model’s ability to correctly identify popular videos among all samples predicted as popular:
The recall metric, also referred to as sensitivity, measures the proportion of actual popular videos that were correctly detected:
Because precision and recall often exhibit an inverse relationship, their harmonic mean, the F1-score, was used to provide a single balanced indicator of performance:
These four metrics together offer a comprehensive understanding of the classifier’s behavior. Accuracy conveys general correctness, while precision and recall highlight the trade-off between over- and under-prediction of popular content. The F1-score, combining both, serves as the principal indicator for comparing single-modality and multimodal configurations in the subsequent experiments.
4. Experimental Results
This section presents the experimental evaluation of the proposed multimodal popularity prediction framework. All experiments were conducted using the preprocessed YouTube Shorts dataset described in
Section 3.1, with each modality processed through its respective encoder and fused according to the attention-based architecture outlined previously. The experiments aimed to evaluate the predictive effectiveness of individual modalities as well as their fused representations, thereby quantifying the contribution of multimodal integration to overall model performance.
4.1. Experimental Setup
All experiments were conducted in a Google Colab Pro+ environment. The dataset comprising 12,589 YouTube Shorts samples was partitioned using stratified sampling to preserve the original class distribution (5.24:1 ratio of non-popular to popular videos) across all experimental conditions. Rather than a conventional train-validation-test split, we employed 5-fold stratified cross-validation throughout the training pipeline. This design choice served two purposes: maximizing the effective use of limited popular-class samples and enabling proper out-of-fold prediction generation for the stacking architecture.
Neural network training utilized the AdamW optimizer. The final binary classification threshold was set to 0.81 for Subset A, determined via a grid search on out-of-fold training predictions optimized for popular-class F1-score, as described in
Section 3.7. The same procedure on Subset B produced a threshold of 0.88. All reported precision, recall, and F1 metrics reflect these subset-specific thresholds. A ReduceLROnPlateau scheduler monitored validation loss, reducing the learning rate by a factor of 0.5 after 3 epochs without improvement. Early stopping with a patience of 7 epochs prevented overfitting while allowing sufficient convergence time. Training proceeded for a maximum of 50 epochs with mixed precision enabled to improve computational efficiency.
The detailed architectural configurations and specific hyperparameters for the MLP, XGBoost, and Random Forest models are summarized in
Table 6.
Tree-based models operated on the fused feature representations produced by the multimodal fusion stage. Random Forest hyperparameters included 200 estimators with maximum depth constraints to balance expressiveness and generalization. XGBoost configuration was determined through grid search over learning rate, maximum depth, subsample ratio, and L1/L2 regularization terms.
For comparative analysis, each modality was independently evaluated using identical ensemble configurations to quantify standalone predictive capability. Ablation studies systematically removed architectural components to isolate their individual contributions to overall performance.
4.2. Baseline and Comparative Configurations
To rigorously assess the contribution of each architectural component, we designed a comprehensive evaluation framework encompassing ablation configurations. This systematic approach allows us to attribute performance gains to specific design choices rather than conflating the effects of multiple simultaneous changes.
The ablation studies examine individual classifiers trained on the full fused representation:
RF-Only: Random Forest classifier with 200 estimators and class weighting.
XGB-Only: XGBoost model with optimized hyperparameters and weighted loss.
MLP-Only: MLP trained with focal loss and amplified class weights.
All configurations shared consistent preprocessing pipelines, cross-validation folds, and evaluation protocols to ensure fair comparison. Hyperparameters for single-model baselines matched those used in the corresponding ensemble components.
4.3. Performance Results on Subset A
We evaluated the proposed FUSEPOP framework on the dataset using the evaluation protocol described in
Section 3.8. All configurations underwent identical preprocessing pipelines and 5-fold stratified cross-validation to ensure fair comparison. Class imbalance was addressed through amplified class weighting combined with Focal Loss, as this strategy demonstrated superior performance over synthetic oversampling in our preliminary experiments.
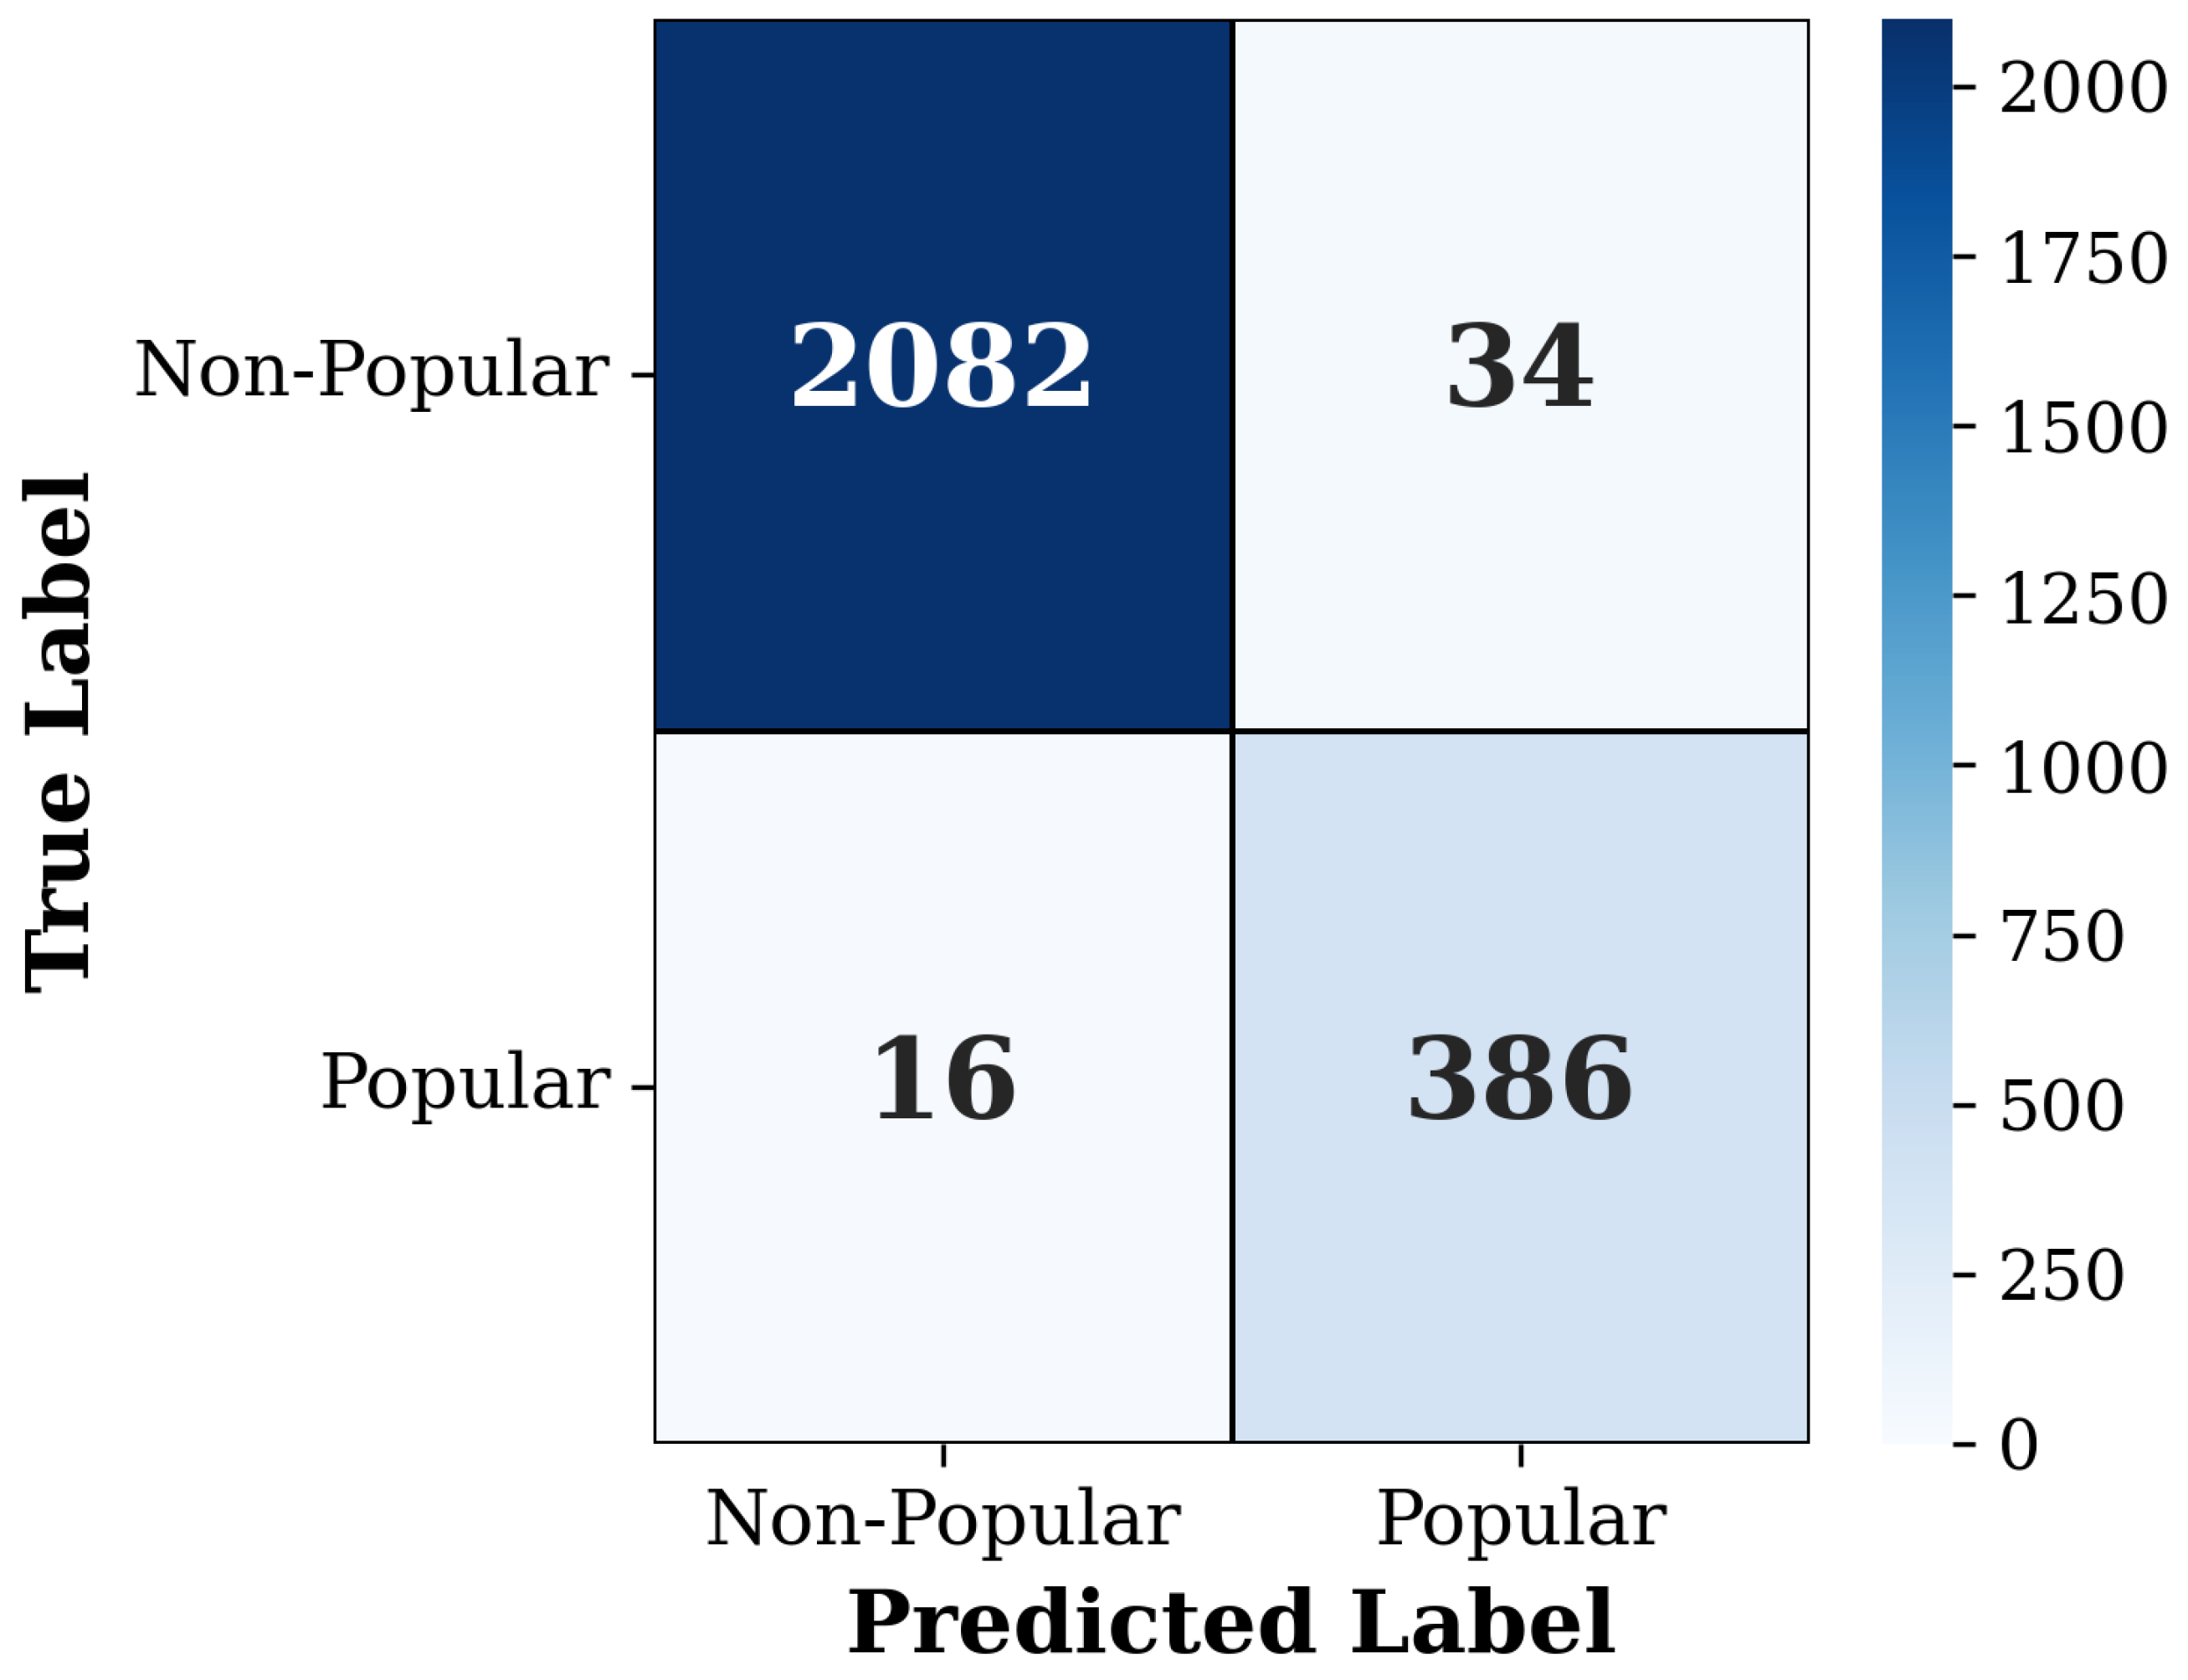
Figure 4 shows the confusion matrix of the proposed FUSEPOP model. Accordingly, the proposed FUSEPOP model successfully predicted 2082 out of 2116 non-popular data points, while predicting 34 as popular. Similarly, 386 out of 402 popular data points were successfully identified by the model, while 16 samples were misclassified. This illustrates the proposed FUSEPOP model’s capability to produce highly precise predictions for both non-popular and popular categories.
Table 7 summarizes the classifier ablation conducted on the same fused feature representation and evaluation split, isolating the contribution of the stacking architecture from that of the underlying multimodal features. FUSEPOP achieves the highest accuracy of 0.980 and the highest average F1-score of 0.964, outperforming all single-learner baselines. Although the margin over XGBoost is modest in absolute terms, with the strongest standalone model recording an average F1-score of 0.958, the ensemble does not simply inherit the performance of its best component. Rather, it actively reconciles the complementary error profiles of its constituent learners to produce more balanced predictions across both classes.
Examining the base learners individually reveals consistent and interpretable performance patterns. XGBoost outperforms both Random Forest and MLP as a standalone classifier, a result consistent with gradient boosting’s capacity for iterative decision boundary refinement on heterogeneous tabular features. Random Forest trails substantially in popular-class F1 (0.776) and recall (0.730), reflecting the well-documented tendency of bagging ensembles to underperform boosting under class imbalance [
41]. XGBoost achieves the highest popular-class recall among the base learners at 0.963, while the MLP achieves the highest popular-class precision at 0.939 with a lower corresponding recall of 0.844, demonstrating complementary error characteristics across the two models.
This divergence in error profiles is precisely what the stacking architecture is designed to exploit. XGBoost prioritizes recall, recovering the maximum number of popular videos at some precision cost, while the MLP prioritizes precision, reducing false positives at the expense of some minority-class coverage. Rather than selecting among these trade-offs, the meta-learner observes and adapts to model-specific error patterns across the validation fold, learning combination weights that balance precision and recall more effectively than any fixed voting or averaging scheme. The result is a popular-class recall of 0.960, comparable to the strongest single learner while providing the best overall balance, accompanied by precision that remains competitive with the individual base learners.
Taken together, these results indicate that the performance advantage of FUSEPOP derives not from the dominance of any single component but from the interactional diversity of its members. The stacking architecture reconciles the conservative tendencies of tree-based methods with the neural network’s sensitivity to borderline cases, yielding probability estimates that are better calibrated than those of any individual classifier. In imbalanced multimodal classification settings, learned aggregation over complementary classifiers therefore constitutes a more principled path to minority-class performance gains than either model selection or manual weight tuning.
4.4. Performance Results on Subset B
In addition to the principal experiments on Subset A, we ran the full FUSEPOP pipeline on the Subset B metadata configuration introduced in
Section 3. All pipeline settings, including the co-attention fusion, MI-weighted combination, stacked ensemble, 5-fold cross-validation protocol, and class imbalance treatment, are identical to the Subset A configuration. Only the metadata feature matrix, the MI-derived fusion weights, and the OOF-optimized decision threshold differ.
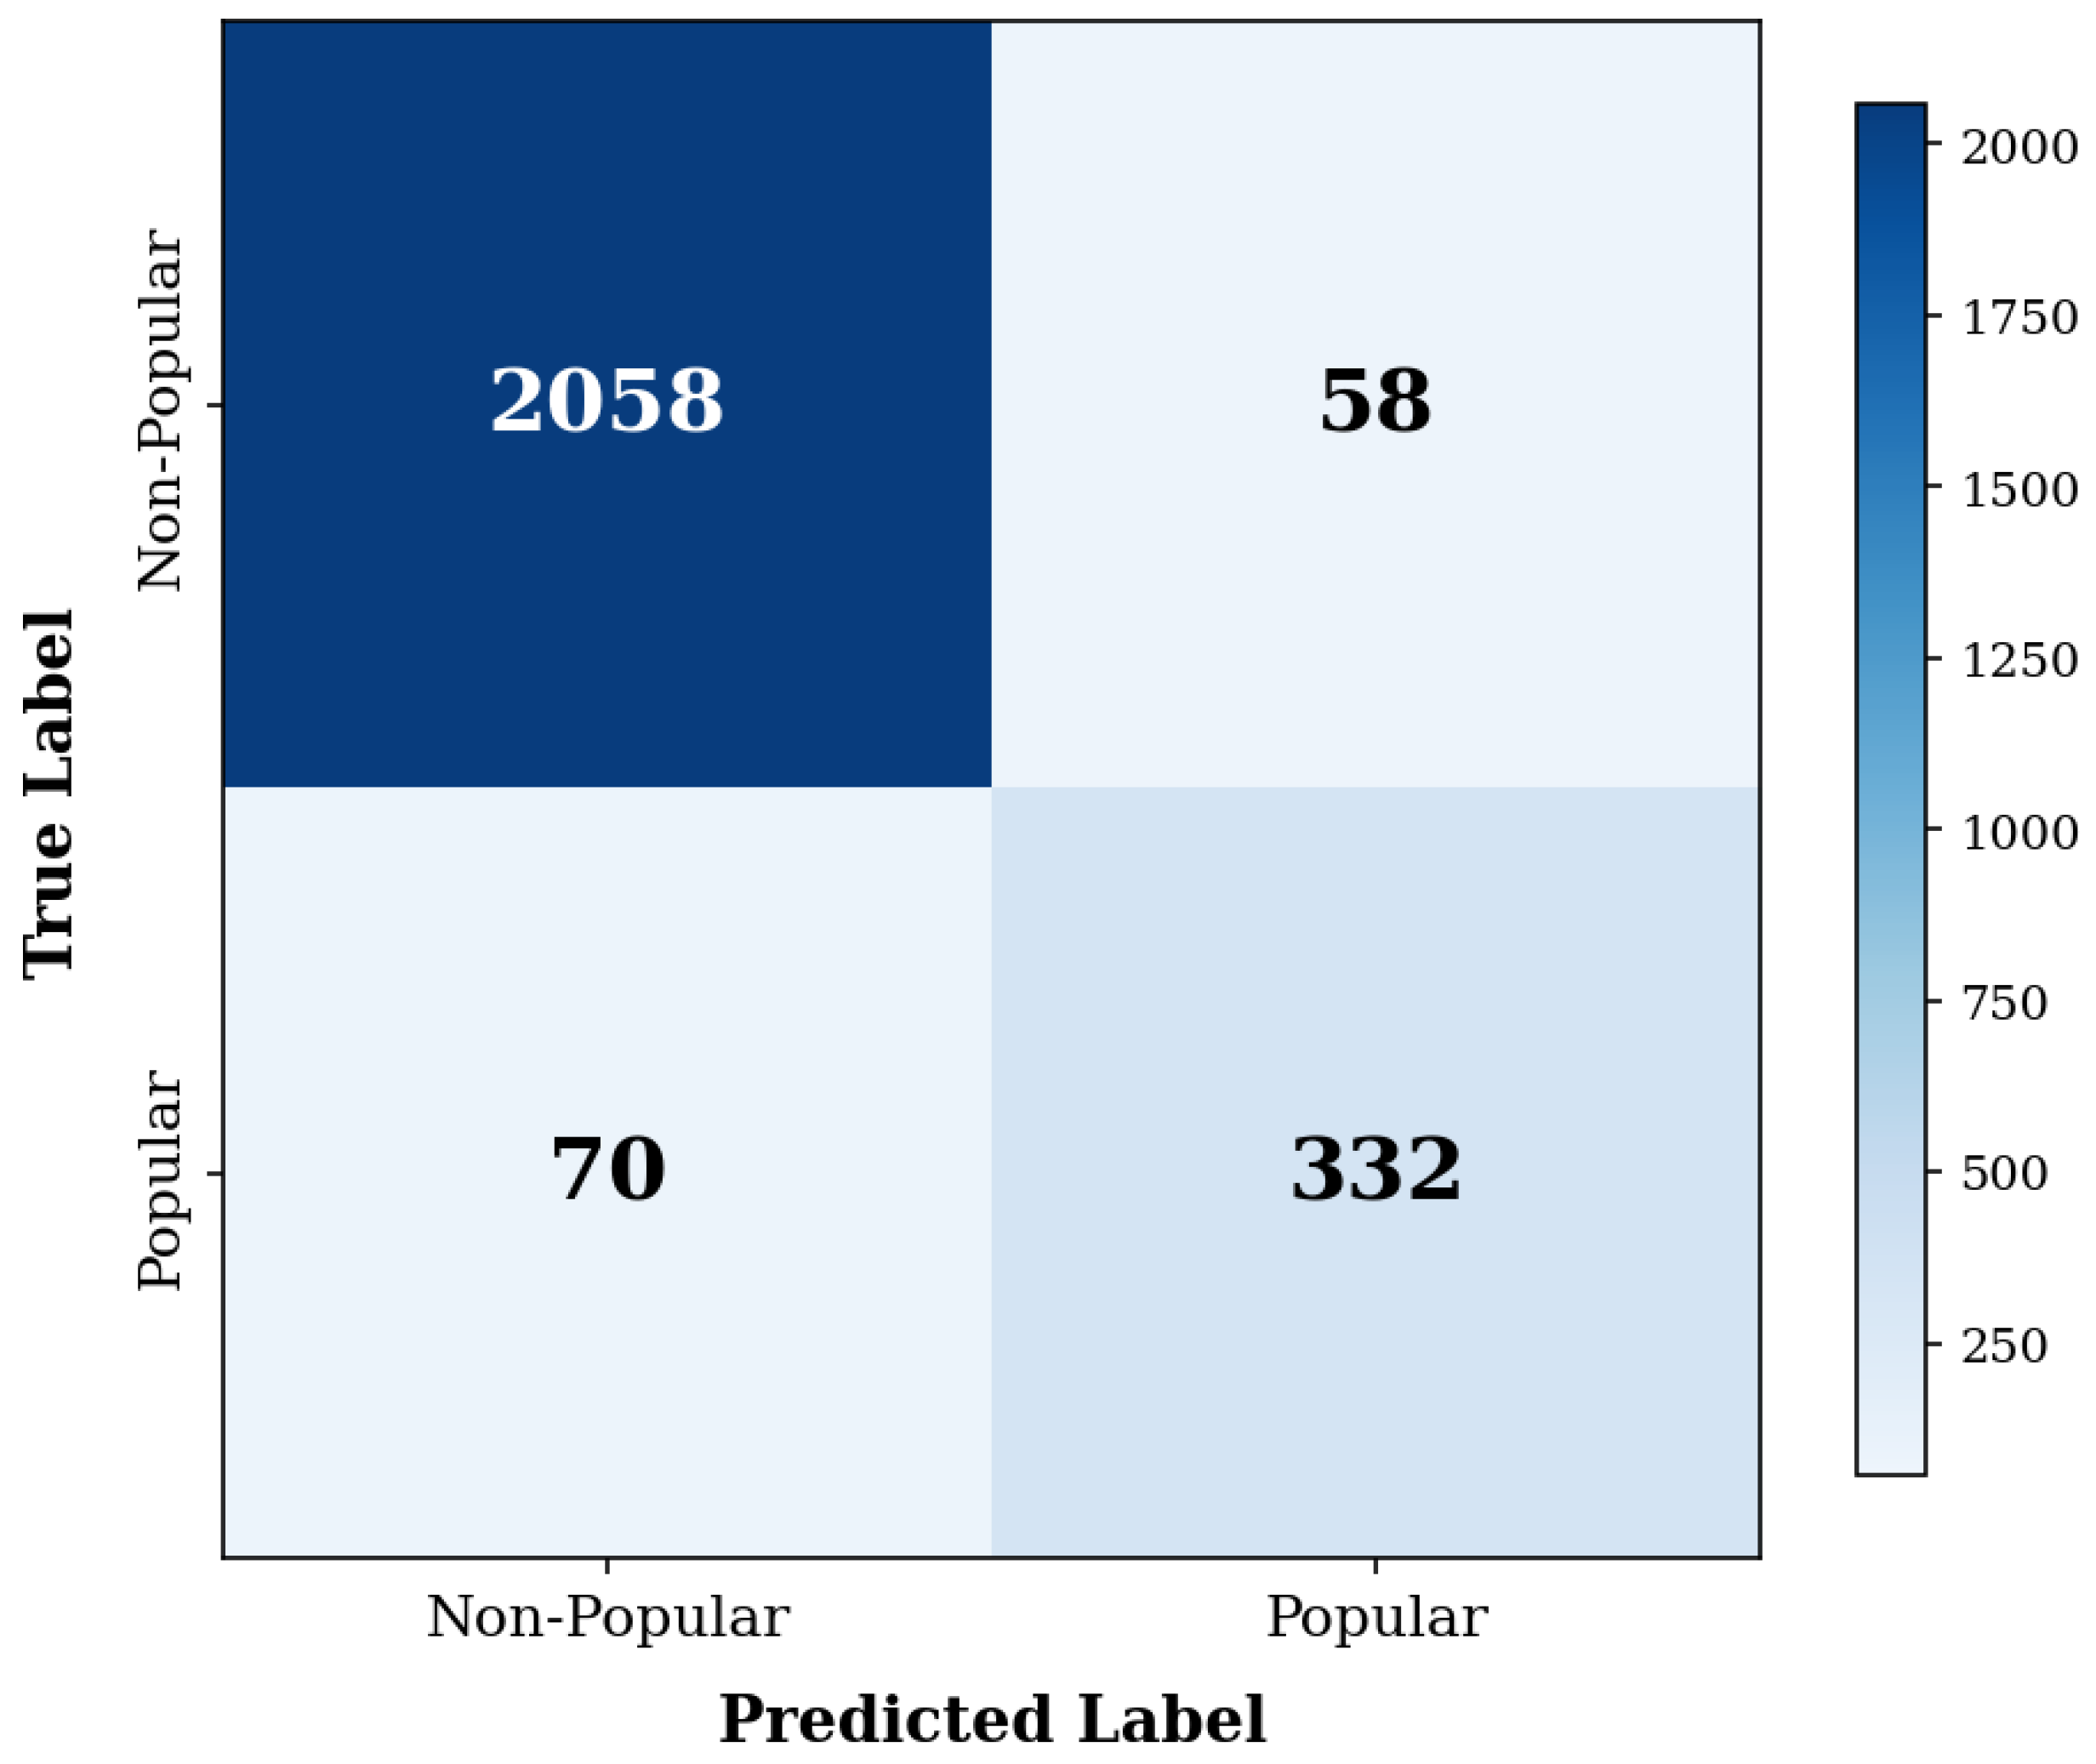
Figure 5 shows the confusion matrix produced by FUSEPOP on the Subset B held-out test set. The model correctly identifies 2058 out of 2116 non-popular samples and 332 out of 402 popular samples, with 58 false positives and 70 false negatives.
Table 8 reports the base learners and the stacked ensemble on Subset B. FUSEPOP on Subset B reaches an accuracy of 0.949 and an Avg-F1 of 0.904, again improving on every single base learner and remaining above every prior study reported in
Table 9. The ordering among base learners is also preserved: XGBoost is the strongest standalone model, the MLP trades precision for recall on the popular class, and the Random Forest trails both on the minority class. This confirms that the complementary error profiles exploited by the stacked ensemble on Subset A are present on Subset B as well.
4.5. Comparison with Prior Models on the Same Dataset
Having established the gains of the stacked ensemble over single-model baselines, we now situate our results within the broader literature by comparing against representative prior approaches. Consequently, various methodologies are compared with our proposed model in
Table 9. This comparison presents performance measures for both contemporary studies utilizing the same dataset and fundamental classification methods evaluated on the given dataset by the researchers who constructed the original dataset, using the same binary setup and common metrics to enable a fair, citation-grounded comparison.
As shown in
Table 9, FUSEPOP outperforms representative prior approaches under the same binary setup and reporting convention. At the aggregate level, FUSEPOP records the top accuracy of 0.980 and an average F1-score of 0.964 on Subset A, indicating that improvements are not confined to a single metric but hold across precision–recall trade-offs. The additional row reporting FUSEPOP on Subset B confirms that the framework remains well above every prior study, even under a feature configuration chosen for alignment with the conventions of earlier work in this area.
Additionally, in terms of class-wise behavior, the gains are consistent across both classes. FUSEPOP achieves the best precision, recall, and F1-score metrics for both of the classes compared to the prior studies.
These improvements align with the design of FUSEPOP, which consists of multimodal fusion that integrates complementary cues from thumbnails, text, and metadata and a stacked ensemble (MLP, XGBoost, Random Forest) trained via stratified 5-fold cross-validation.
4.6. Ablation Studies
To demonstrate the contribution of each method and architectural component used in this study, ablation experiments were performed in two different categories using the same structure, hyperparameters, and evaluation protocol described in
Section 3.7. In the first category, single-modality evaluation was performed to obtain the effect of each data type on the result, while in the second category, module-level evaluation was performed to test the effect of each architectural structure on the result.
4.6.1. Single-Modality Ablation
Table 10 presents the results of training the stacked ensemble on Subset A in each modality in isolation. Thumbnail features alone yield an avg-F1 of 0.550, while text features achieve 0.641, confirming that neither visual nor textual signals are independently sufficient for popularity prediction. Metadata features alone reach an avg-F1 of 0.962, reflecting the strong predictive power of engagement-derived statistics such as subscriber count and view history. However, the full FUSEPOP framework, which integrates all three modalities through co-attention fusion and MI-weighted balancing, achieves the highest Avg-F1 of 0.964, outperforming every single-modality configuration. This consistent improvement across all metrics confirms that visual and textual modalities provide complementary signals that enhance prediction beyond what metadata alone can achieve.
4.6.2. Module-Level Ablation
Table 11 isolates the contribution of each architectural component on Subset A by systematically removing or replacing individual modules. Replacing the co-attention mechanism with raw feature concatenation reduces Avg-F1 from 0.964 to 0.951, demonstrating that learned cross-modal interactions outperform naive concatenation.
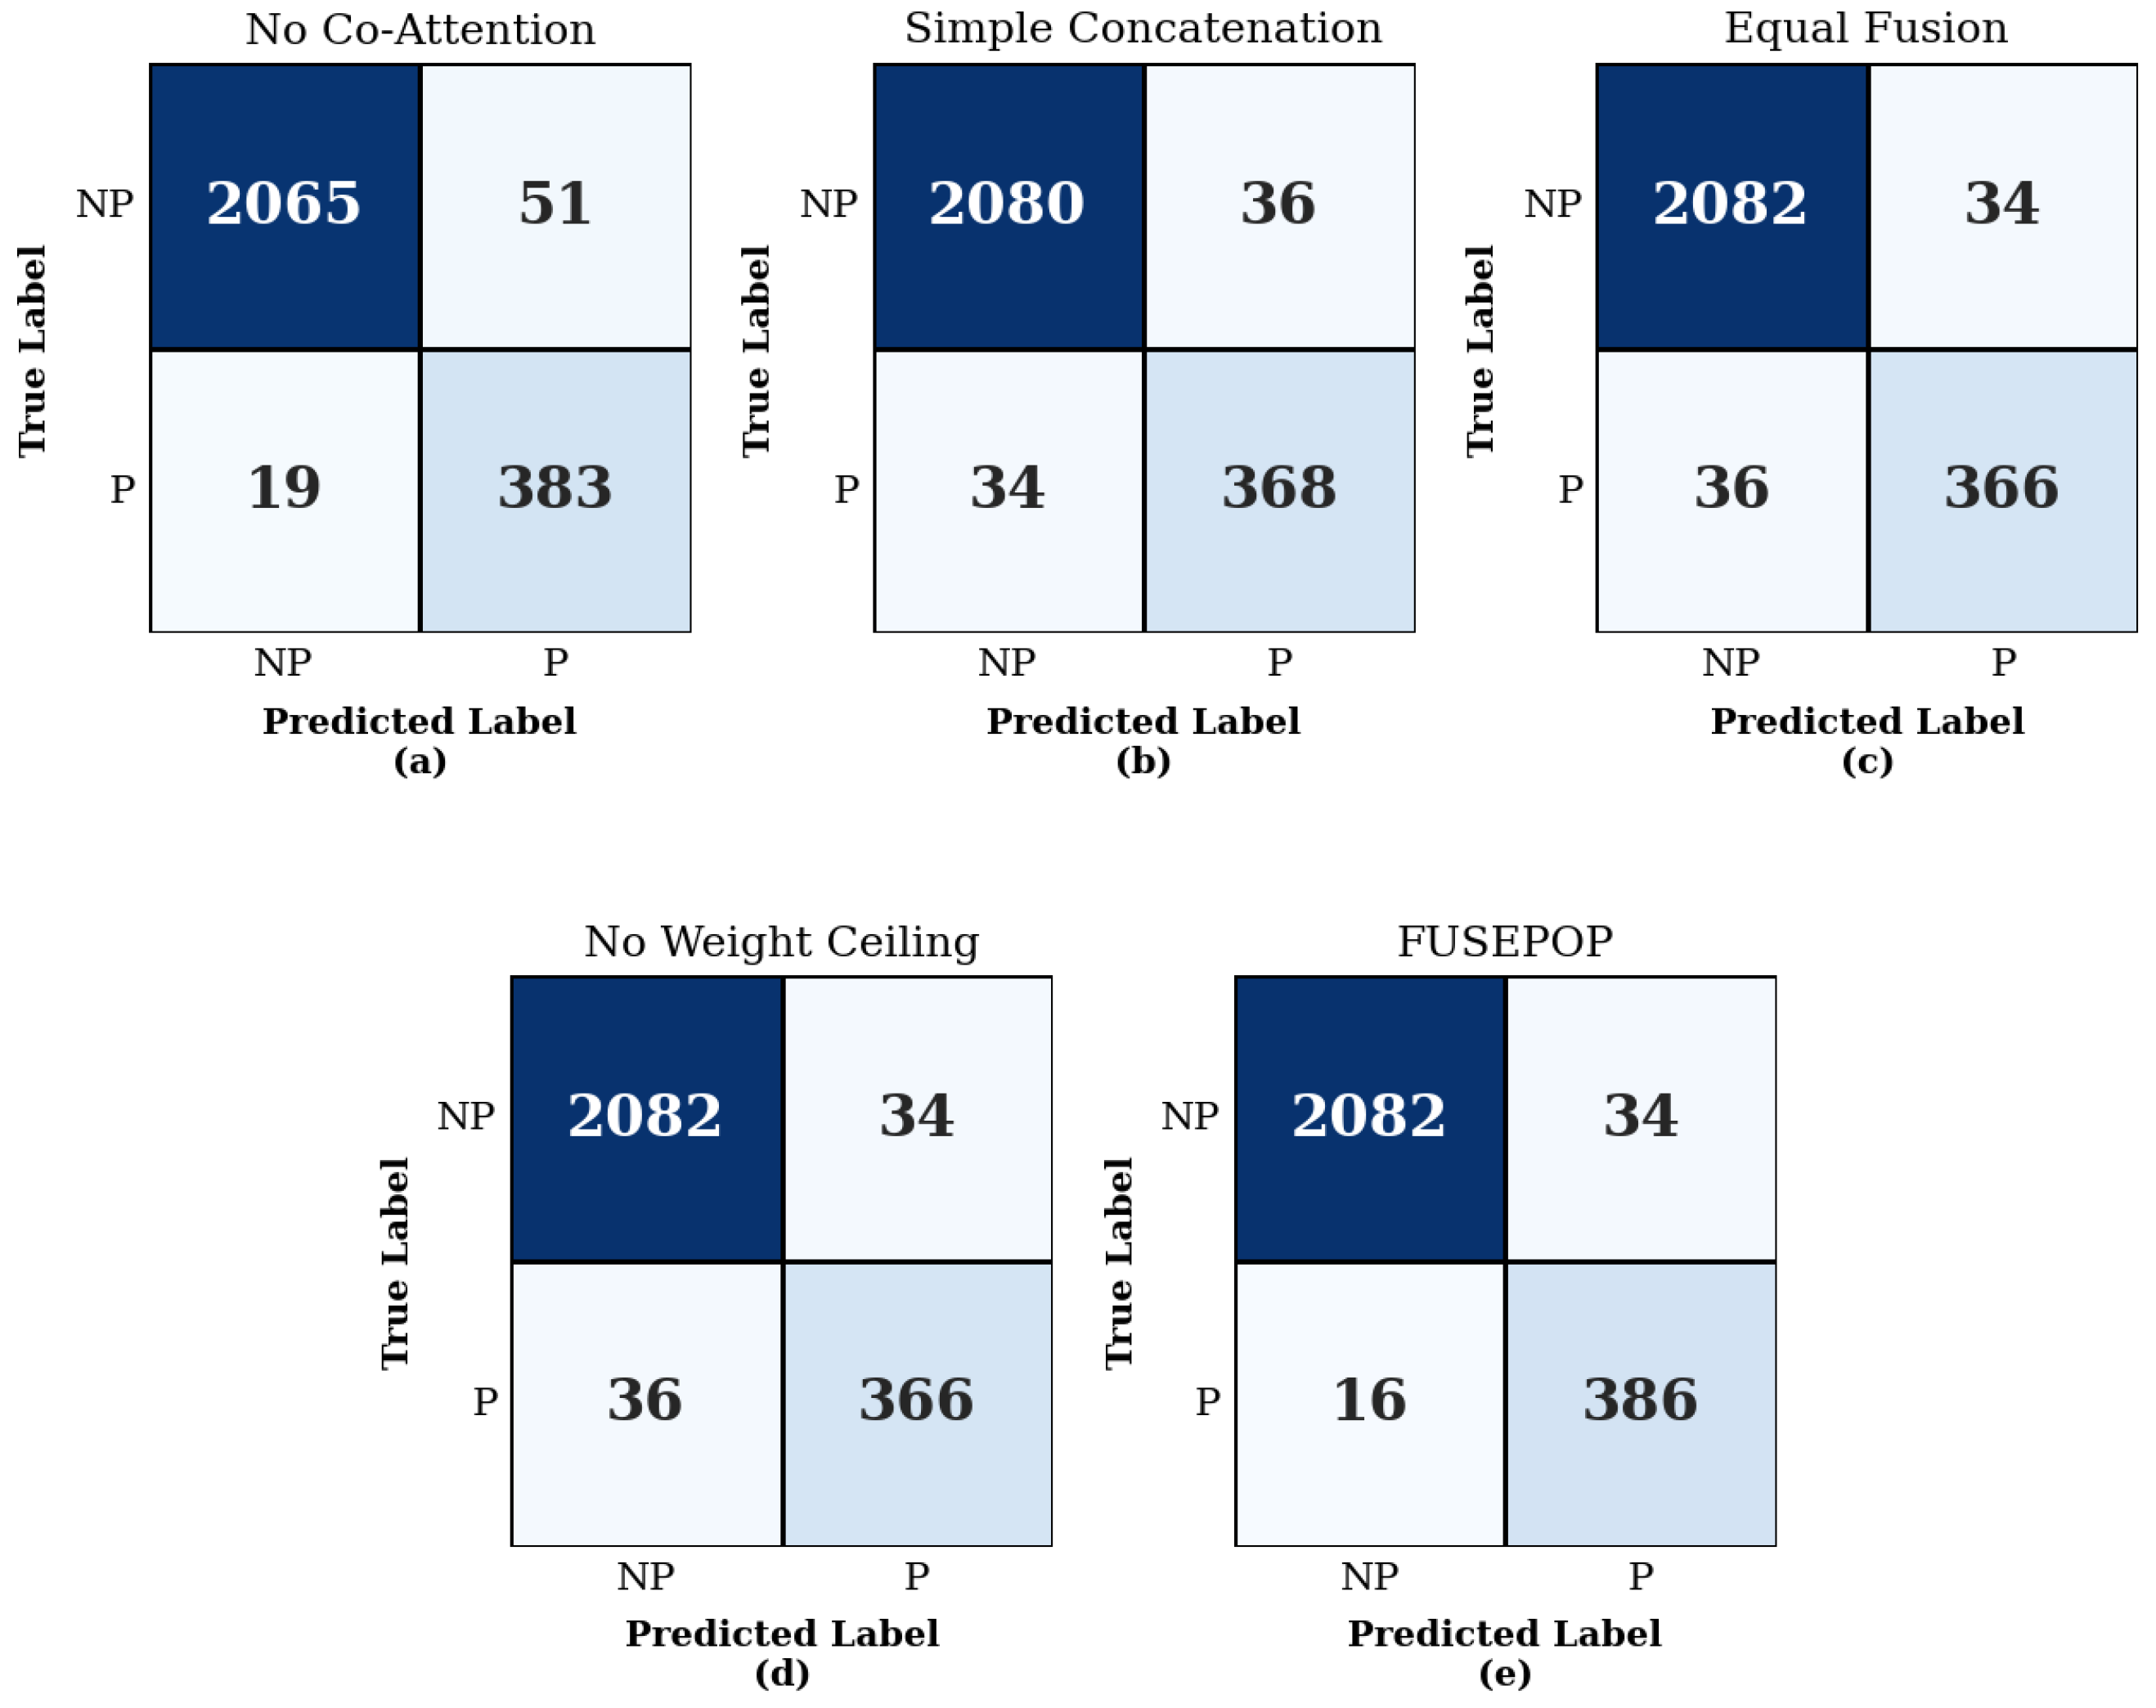
The confusion matrix analysis given in
Figure 6 reveals an important pattern that aggregate metrics alone do not fully capture: removing MI weighting (Equal Fusion) or the weight ceiling increases the false negative count from 16 to 36, meaning these components are directly responsible for preventing the model from overlooking genuinely popular content. Similarly, simple concatenation without any weighting yields 34 false negatives, confirming that the MI-weighted fusion mechanism plays a critical role in preserving minority-class sensitivity.
For completeness, the same ablation protocol used in
Section 4.6 was also applied to Subset B. A compact summary of both the single-modality and module-level ablations is reported in
Table 12. The pattern that emerges on Subset B differs from Subset A: the gap between the metadata-only variant and the full FUSEPOP configuration narrows considerably, and the strongest module-level ablation sits close to the full pipeline on both accuracy and Avg-F1.
5. Discussion
On the given dataset, FUSEPOP achieved an accuracy of 0.980 and an average F1-score of 0.964. Ablation results demonstrate that the stacked ensemble outperforms every single learner trained on the same fused features, while XGBoost achieved the strongest standalone performance. The ensemble improved upon the best single classifier by 0.63% in average F1-score and upon the average single classifier performance by 4.75%, confirming the value of the proposed architecture over individual models. Relative to representative prior studies summarized in
Table 9, FUSEPOP attains superior performance across all reported metrics.
The fundamental question arising from these results is whether the performance gains stem from either multimodal fusion, the use of ensemble architecture, or the metadata features themselves. The ablation studies presented in
Table 10 and
Table 11 allow for the separation of these contributions. In this context, metadata alone yields an average F1-score of 0.962, confirming that interaction-derived statistics carry the strongest individual predictive signal. However, the same ablation studies have shown that the FUSEPOP model, by also utilizing visual and textual features, outperformed this variant.
The comparison between the merging strategies yielded even more striking results. Removing the MI weight or weight threshold reduced the F1-score of the popular class by 2.87% and 2.76%, respectively, indicating that the relevant mechanisms are directly responsible for maintaining the sensitivity of the minority class. Therefore, these results indicate that when the proposed structure is not used, despite high overall accuracy, the model may overlook the popular content.
The co-attention mechanism contributes at a different level. Replacing it with raw feature concatenation results in a 1.34% decrease in the average F1-score. This indicates that learned cross-modal interactions capture dependencies that naive concatenation cannot.
The balanced multimodal fusion mechanism, grounded in mutual information scoring with logarithmic smoothing and weight capping, ensures that no single modality dominates the learned representation regardless of its standalone predictive power. Without the weight ceiling, metadata would receive 78.2% of the fusion weight, effectively marginalizing the visual and textual streams.
The stacked ensemble reconciles complementary inductive biases among its base learners. XGBoost captures non-linear, piecewise interactions characteristic of the tabular-like fused representation. Random Forest contributes variance reduction through bootstrap aggregation and implicit feature selection. The neural network, trained with focal loss, prioritizes hard-to-classify positive instances. The meta-learner, a logistic regression classifier trained on out-of-fold predictions, learns to exploit these complementary characteristics, producing probability estimates that are better calibrated than those of any individual component.
The ablation margins in Subset B are narrower than those in Subset A. Subset A draws from a feature selection we constructed around the engagement signals most informative for the popularity label on this dataset, which leaves room for the fused visual-textual stream to contribute complementary information that the raw engagement metrics do not cover. Subset B instead follows the feature conventions typical of prior work in social media popularity prediction, where channel-level ratios and derived engagement indicators already carry some of the content-quality signal that cross-modal fusion would otherwise add. The contribution of architectural components, therefore, becomes harder to isolate on this alternative configuration, while the full pipeline still reaches a competitive score. Subset A remains the principal testbed for evaluating FUSEPOP’s design choices, and Subset B serves to confirm that the framework performs robustly under a literature-aligned feature configuration.
6. Limitations and Future Work
Despite the strong performance demonstrated by FUSEPOP, several limitations warrant acknowledgment and suggest directions for future investigation.
The proposed architecture carries non-trivial computational requirements. Feature extraction through deep networks, fusion weight computation via mutual information estimation, and ensemble training with 5-fold cross-validation collectively demand significant processing resources. This complexity limits real-time applicability for platforms processing millions of uploads daily. Future research will focus on lightweight distillation techniques to compress the ensemble into a single efficient model while retaining prediction accuracy. Developing streaming-capable variants through incremental fusion modules that process thumbnails and metadata at inference time would further enhance practical deployability.
Furthermore, the focal loss hyperparameters governing the class imbalance strategy and the class weight amplification multiplier were selected based on established guidelines in the literature and validated empirically on this dataset. The generalizability of these values to other popularity prediction tasks with different imbalance ratios remains to be investigated. Future work could explore automated hyperparameter tuning through Bayesian optimization or meta-learning approaches that adapt these parameters based on dataset characteristics.
Finally, the current model treats video popularity as an attribute based on accumulated metrics. However, viral dynamics are inherently temporal; a video’s popularity trajectory often depends on early viewership velocity and algorithmic momentum. Integrating temporal sequence modeling to analyze the early evolution of view counts alongside static multimodal features could further enhance the model’s predictive foresight, particularly for trend detection in the critical first hours of upload.
7. Conclusions
In this paper, we introduce FUSEPOP, a multimodal fusion framework that combines co-attention with a stacked ensemble for YouTube Shorts popularity prediction, designed as a practical and reproducible pipeline that unifies visual, textual, and statistical metadata signals. The workflow standardizes thumbnails via ResNet-50, jointly encodes title-description pairs using the XLM-RoBERTa multilingual transformer, and integrates metadata through a balanced multimodal fusion mechanism that mitigates modality dominance via mutual information-based weighting.
Unlike conventional heuristic approaches, FUSEPOP employs a stacked generalization architecture trained via stratified 5-fold cross-validation to ensure robust generalization. Within this hierarchical structure, a data-driven logistic regression meta-learner dynamically synthesizes predictive probabilities from random forest, XGBoost, and neural network base classifiers. This approach effectively handles class imbalance through amplified class weights and focal loss, eliminating the reliance on synthetic oversampling techniques.
Experimental results demonstrate that FUSEPOP consistently outperforms prior models reported in the literature, achieving state-of-the-art accuracy of 0.980 and an average F1-score of 0.964 on the feature configuration used in the principal experiments. Ablation studies validated the effectiveness of the stacked architecture, demonstrating a 4.75% enhancement in performance compared to the average of the individual base classifiers. Replicating the same pipeline on a literature-aligned alternative feature configuration likewise produced competitive results, with an accuracy of 0.949 and an average F1-score of 0.904, supporting the view that the framework is not tied to a single feature selection strategy.
Overall, FUSEPOP demonstrates that balanced multimodal fusion coupled with a stacked meta-learning strategy yields reliable predictions of short-form video popularity. As platforms continue to evolve, the principles established here may generalize to adjacent tasks such as thumbnail optimization, content recommendation, and early trend detection. In each of these settings, the core insight holds: balanced multimodal fusion and learned ensemble aggregation together offer a more reliable path to minority-class sensitivity than any single architectural choice alone.
Author Contributions
Conceptualization, Ö.A.Ş., İ.A., İ.A.D., S.T., and N.B.; methodology, Ö.A.Ş., İ.A. and S.T.; software, Ö.A.Ş.; validation, Ö.A.Ş.; formal analysis, Ö.A.Ş., İ.A., İ.A.D., S.T., N.B., and K.K.; investigation, Ö.A.Ş.; resources, Ö.A.Ş.; data curation, Ö.A.Ş.; writing—original draft preparation, Ö.A.Ş.; writing—review and editing, İ.A., İ.A.D., S.T., N.B., and K.K.; visualization, Ö.A.Ş.; supervision, İ.A., İ.A.D., S.T., N.B., and K.K.; project administration, İ.A. All authors have read and agreed to the published version of the manuscript.
Funding
This research received no external funding.
Institutional Review Board Statement
Not applicable.
Informed Consent Statement
Not applicable.
Data Availability Statement
The dataset used in this study is based on the publicly available AMPS YouTube Shorts dataset developed by Cho et al. [
10]. The thumbnail images were retrieved using the URLs provided in the original dataset.
Conflicts of Interest
The authors declare no conflicts of interest.
Abbreviations
The following abbreviations are used in this manuscript:
| FUSEPOP | Multi-Modal Fusion with Mutual Information
Weighting and |
| Stacked Ensemble for Social Media Popularity
Prediction |
| AMPS | Attention-based Multi-modal Popularity prediction model of Short-form videos |
| CDF | Cumulative Distribution Function |
| CNN | Convolutional Neural Network |
| MI | Mutual Information |
| MLP | Multi-Layer Perceptron |
| SMOTE | Synthetic Minority Over-sampling Technique |
| SVR | Support Vector Regression |
| VSCNN | Visual Social Convolutional Neural Network |
| XGBoost | Extreme Gradient Boosting |
References
- Shankar, V.; Venkatesh, A.; Hofacker, C.; Naik, P. Mobile marketing in the retailing environment: Current insights and future research avenues. J. Interact. Mark. 2010, 24, 111–120. [Google Scholar] [CrossRef]
- Statista. Internet and Social Media Users in the World 2025. Available online: https://www.statista.com/statistics/617136/digital-population-worldwide/ (accessed on 29 March 2026).
- Statista. Biggest Social Media Platforms by Users 2025. Available online: https://www.statista.com/statistics/272014/global-social-networks-ranked-by-number-of-users/ (accessed on 1 September 2025).
- Xiao, Q.; Huang, W.; Qu, L.; Li, X. The impact of multimodal information features of short sales videos on consumer engagement behavior: A multi-method approach. J. Retail. Consum. Serv. 2025, 82, 104136. [Google Scholar] [CrossRef]
- Paolillo, J.C.; Ghule, S.; Harper, B.P. A Network View of Social Media Platform History: Social Structure, Dynamics and Content on YouTube. In Proceedings of the 52nd Hawaii International Conference on System Sciences, Maui, HI, USA, 8–11 January 2019. [Google Scholar]
- Pavithra, D.; Poovizhi, P.; Rokeshkumar, G.; Bharathvaj, T.; Mageshkumar, M. YouTube Comment Analysis Using LSTM Model. In Generative Artificial Intelligence; Nidhya, R., Pavithra, D., Kumar, M., Dinesh Kumar, A., Balamurugan, S., Eds.; Scrivener Publishing: Beverly, MA, USA, 2025; pp. 265–281. [Google Scholar] [CrossRef]
- George, D.A.S. YouTube as the New Television: The Evolution of Content Consumption in the Digital Age. Partners Univers. Innov. Res. Publ. 2025, 3, 1–19. [Google Scholar] [CrossRef]
- Sharma, A. Content Creation in Transition: Analyzing YouTube, YouTube Shorts, and Facebook’s Influence on Content Creators Amidst and Beyond COVID-19. J. Emerg. Technol. Innov. Res. 2024, 11, 256–267. [Google Scholar]
- Violot, C.; Elmas, T.; Bilogrevic, I.; Humbert, M. Shorts vs. Regular Videos on YouTube: A Comparative Analysis of User Engagement and Content Creation Trends. In Proceedings of the 16th ACM Web Science Conference, WebSci 2024, Stuttgart, Germany, 21–24 May 2024; pp. 213–223. [Google Scholar] [CrossRef]
- Cho, M.; Jeong, D.; Park, E. AMPS: Predicting popularity of short-form videos using multi-modal attention mechanisms in social media marketing environments. J. Retail. Consum. Serv. 2024, 78, 103778. [Google Scholar] [CrossRef]
- Wu, S.; Rizoiu, M.A.; Xie, L. Beyond Views: Measuring and Predicting Engagement in Online Videos. In Proceedings of the International AAAI Conference on Web and Social Media, Stanford, CA, USA, 25–28 June 2018; Volume 12, pp. 434–443. [Google Scholar] [CrossRef]
- Farooq, A.; Salminen, J.; Martin, J.D.; Aldous, K.; Jung, S.G.; Jansen, B.J. Exploring Social Media Privacy Concerns: A Comprehensive Survey Study Across 16 Middle Eastern and North African Countries. IEEE Access 2024, 12, 147087–147105. [Google Scholar] [CrossRef]
- Lin, Y.; Liao, Y.; Zeng, W.; Wei, Y.; Chen, D.; Yuan, X.; Li, Y.; Erkan, U.; Toktas, A.; Zhang, C.; et al. 3D Non-degenerate Hyperchaos: Design, Analysis, and Application in Image Encryption. IEEE Trans. Consum. Electron. 2026. early access. [Google Scholar] [CrossRef]
- Jin, K. Research on Predictive Models for Content Popularity on Social Media. Commun. Soc. Media 2024, 7, 197. [Google Scholar] [CrossRef]
- Xu, Y.; Zheng, B.; Zhu, W.; Pan, H.; Yao, Y.; Xu, N.; Liu, A.; Zhang, Q.; Yan, C. SMTPD: A New Benchmark for Temporal Prediction of Social Media Popularity. In Proceedings of the 2025 IEEE/CVF Conference on Computer Vision and Pattern Recognition (CVPR), Nashville, TN, USA, 11–15 June 2025; pp. 18847–18857. [Google Scholar] [CrossRef]
- Vallet, D.; Berkovsky, S.; Ardon, S.; Mahanti, A.; Kaafar, M.A. Characterizing and predicting viral-and-popular video content. In Proceedings of the International Conference on Information and Knowledge Management, Proceedings, Melbourne, Australia, 19–23 October 2015; pp. 1591–1600. [Google Scholar] [CrossRef]
- Dietterich, T.G. Ensemble Methods in Machine Learning. Lect. Notes Comput. Sci. 2000, 1857 LNCS, 1–15. [Google Scholar] [CrossRef]
- Figueiredo, F.; Almeida, J.M.; Gonçalves, M.A.; Benevenuto, F. TrendLearner: Early prediction of popularity trends of user generated content. Inf. Sci. 2016, 349–350, 172–187. [Google Scholar] [CrossRef]
- Hoiles, W.; Aprem, A.; Krishnamurthy, V. Engagement and Popularity Dynamics of YouTube Videos and Sensitivity to Meta-Data. IEEE Trans. Knowl. Data Eng. 2017, 29, 1426–1437. [Google Scholar] [CrossRef]
- Nisa, M.U.; Mahmood, D.; Ahmed, G.; Khan, S.; Mohammed, M.A.; Damaševičius, R. Optimizing Prediction of YouTube Video Popularity Using XGBoost. Electronics 2021, 10, 2962. [Google Scholar] [CrossRef]
- Halim, Z.; Hussain, S.; Hashim Ali, R. Identifying content unaware features influencing popularity of videos on YouTube: A study based on seven regions. Expert Syst. Appl. 2022, 206, 117836. [Google Scholar] [CrossRef]
- Trzcinski, T.; Rokita, P. Predicting Popularity of Online Videos Using Support Vector Regression. IEEE Trans. Multimed. 2017, 19, 2561–2570. [Google Scholar] [CrossRef]
- Abousaleh, F.S.; Cheng, W.H.; Yu, N.H.; Tsao, Y. Multimodal Deep Learning Framework for Image Popularity Prediction on Social Media. IEEE Trans. Cogn. Dev. Syst. 2021, 13, 679–692. [Google Scholar] [CrossRef]
- Aloufi, S.; Zhu, S.; El Saddik, A. On the prediction of flickr image popularity by analyzing heterogeneous social sensory data. Sensor 2017, 17, 631. [Google Scholar] [CrossRef]
- Chen, G.; Kong, Q.; Xu, N.; Mao, W. NPP: A neural popularity prediction model for social media content. Neurocomputing 2019, 333, 221–230. [Google Scholar] [CrossRef]
- Sarkar, S.; Basu, S.; Paul, A.; Prasad Mukherjee, D. ViViD: View Prediction of Online Video Through Deep Neural Network-Based Analysis of Subjective Video Attributes. IEEE Trans. Broadcast. 2023, 69, 191–200. [Google Scholar] [CrossRef]
- Devlin, J.; Chang, M.W.; Lee, K.; Toutanova, K. BERT: Pre-training of Deep Bidirectional Transformers for Language Understanding. In Proceedings of the 2019 Conference of the North American Chapter of the Association for Computational Linguistics: Human Language Technologies (NAACL-HLT 2019), Minneapolis, MN, USA, 2–7 June 2019; Burstein, J., Doran, C., Solorio, T., Eds.; Association for Computational Linguistics: Stroudsburg, PA, USA, 2019; Volume 1, pp. 4171–4186. [Google Scholar]
- Vaswani, A.; Shazeer, N.; Parmar, N.; Uszkoreit, J.; Jones, L.; Gomez, A.N.; Kaiser, Ł.; Polosukhin, I. Attention Is All You Need. Adv. Neural Inf. Process. Syst. 2017, 30, 1. [Google Scholar]
- Zhang, J.; Liu, J.; Cheng, Z.; Xu, X.; Liu, F.; Zhong, T.; Zhang, K. THGFormer: Time-Aware Hypergraph Learning for Multimodal Social Media Popularity Prediction. In Proceedings of the AAAI Conference on Artificial Intelligence, Vancouver, BC, Canada, 26–27 February 2024; Volume 38, pp. 23705–23706. [Google Scholar] [CrossRef]
- Javed, A.; Abid, N.; Shoaib, M.; Shahzad, M.F.; Sabah, F.; Sarwar, R. A Framework to Predict the Quality of a Video for Popularity on Social Media. Eng. Rep. 2025, 7, e70250. [Google Scholar] [CrossRef]
- Masood, M.; Kannan, S.; Liu, Z.; Vasisht, D.; Gupta, I. Counting How the Seconds Count: Understanding Algorithm-User Interplay in TikTok via ML-driven Analysis of Video Content. arXiv 2025. [Google Scholar] [CrossRef]
- Deng, R.; Ahmed, S. Perceptions and paradigms: An analysis of AI framing in trending social media news. Technol. Soc. 2025, 81, 102858. [Google Scholar] [CrossRef]
- Zimmermann, E.; Tomczyk, S. Using Social Media to Promote Life Skills Among Adolescents: A Debate on Opportunities, Challenges, and Implications for Health and Education. J. Prev. 2025, 46, 201–211. [Google Scholar] [CrossRef]
- Giankos, E.; Giannakopoulos, N.T.; Sakas, D.P. Optimizing YouTube Video Visibility and Engagement: The Impact of Keywords on Fisheries’ Product Campaigns in the Supply Chain Sector. Information 2025, 16, 353. [Google Scholar] [CrossRef]
- Beyari, H.; Hashem, T. The Role of Artificial Intelligence in Personalizing Social Media Marketing Strategies for Enhanced Customer Experience. Behav. Sci. 2025, 15, 700. [Google Scholar] [CrossRef]
- Chawla, N.V.; Bowyer, K.W.; Hall, L.O.; Kegelmeyer, W.P. SMOTE: Synthetic minority over-sampling technique. J. Artif. Intell. Res. 2002, 16, 321–357. [Google Scholar] [CrossRef]
- Zhong, T.; Lang, J.; Zhang, Y.; Cheng, Z.; Zhang, K.; Zhou, F. Predicting Micro-video Popularity via Multi-modal Retrieval Augmentation. In Proceedings of the 47th International ACM SIGIR Conference on Research and Development in Information Retrieval, New York, NY, USA, 14–18 July 2024; pp. 2579–2583. [Google Scholar] [CrossRef]
- Bielski, A.; Trzcinski, T. Understanding Multimodal Popularity Prediction of Social Media Videos With Self-Attention. IEEE Access 2018, 6, 74277–74287. [Google Scholar] [CrossRef]
- Lin, T.Y.; Goyal, P.; Girshick, R.; He, K.; Dollár, P. Focal Loss for Dense Object Detection. IEEE Trans. Pattern Anal. Mach. Intell. 2018, 42, 318–327. [Google Scholar] [CrossRef] [PubMed]
- Mustafa, M.A.; Erdem, O.A.; Söğüt, E. Hybrid Optimization and Explainable Deep Learning for Breast Cancer Detection. Appl. Sci. 2025, 15, 8448. [Google Scholar] [CrossRef]
- Grinsztajn, L.; Oyallon, E.; Varoquaux, G. Why do tree-based models still outperform deep learning on typical tabular data? In Proceedings of the 36th International Conference on Neural Information Processing Systems, NIPS ’22, Red Hook, NY, USA, 28 November–9 December 2022. [Google Scholar]
- Gu, J. MMSPP: Multimodal Social Media Popularity Prediction. In Proceedings of the 2020 Fourth International Conference On Intelligent Computing in Data Sciences (ICDS), Fez, Morocco, 21–23 October 2020; pp. 1–5. [Google Scholar] [CrossRef]
Figure 1.
Overall architecture of FUSEPOP. (a) End-to-end pipeline from feature extraction to classification. (b) Internal structure of the co-attention module, where , , denote the projected representations of visual, title, and description modalities, respectively, and are their learned importance weights via softmax. (c) MI-weighted fusion, where is the general modality weight computed from mutual information, and , are its instantiations for the fused and metadata modalities. ⊕ denotes concatenation.
Figure 1.
Overall architecture of FUSEPOP. (a) End-to-end pipeline from feature extraction to classification. (b) Internal structure of the co-attention module, where , , denote the projected representations of visual, title, and description modalities, respectively, and are their learned importance weights via softmax. (c) MI-weighted fusion, where is the general modality weight computed from mutual information, and , are its instantiations for the fused and metadata modalities. ⊕ denotes concatenation.
Figure 2.
Class sample counts after the download of the thumbnail images via the URLs in the original dataset.
Figure 2.
Class sample counts after the download of the thumbnail images via the URLs in the original dataset.
Figure 3.
Representative samples of downloaded and preprocessed thumbnails via the URLs in the original dataset. These images demonstrate the visual inputs processed by the proposed model.
Figure 3.
Representative samples of downloaded and preprocessed thumbnails via the URLs in the original dataset. These images demonstrate the visual inputs processed by the proposed model.
Figure 4.
Confusion matrix of the proposed FUSEPOP model.
Figure 4.
Confusion matrix of the proposed FUSEPOP model.
Figure 5.
Confusion matrix of the proposed FUSEPOP model on Subset B.
Figure 5.
Confusion matrix of the proposed FUSEPOP model on Subset B.
Figure 6.
Confusion matrices for all ablation configurations and the FUSEPOP. (a) No Co-Attention, (b) Simple Concatenation, (c) Equal Fusion, (d) No Weight Ceiling, (e) FUSEPOP.
Figure 6.
Confusion matrices for all ablation configurations and the FUSEPOP. (a) No Co-Attention, (b) Simple Concatenation, (c) Equal Fusion, (d) No Weight Ceiling, (e) FUSEPOP.
Table 1.
Comparison of the studies in the literature.
Table 1.
Comparison of the studies in the literature.
| Study | Dataset | Data Count | Class Imbalance | Features Used | Modal Weighting | Ensemble | Methodology | Reported Metrics |
|---|
| Vallet et al. (2015) [16] | YouTube + X | 200,000 | Imbalanced/Not addressed | Metadata | Cross-Platform Fusion | Not used | GBDT | AUC: 0.910 |
| Figueiredo et al. (2016) [18] | YouTube Top | 27,212 | Balanced | Metadata | Not used | ERT | K-Spectral Clustering + ERT | Top Macro F1: 0.610 |
| YouTube Random | 24,482 | Random Macro F1: 0.700 |
| Hoiles et al. (2017) [19] | BBTV | ∼6 M | Imbalanced/Not addressed | Metadata | Hybrid Fusion | Not used | CI Random Forest | : 0.800 |
| Trzcinski et al. (2017) [22] | YouTube Top | 5811 | Not Reported | Metadata + Visual | Feature Fusion | Not used | Popularity-SVR (RBF-SVR) | Spearman’s : 0.935 |
| YouTube Random | 16,132 | Spearman’s : 0.907 |
| Nisa et al. (2021) [20] | Public YouTube metadata | 5000 | Imbalanced/Cost-sensitive learning | Metadata | Feature Fusion | Not used | XGBoost | Accuracy: 0.880, F1: 0.720 |
| Abousaleh et al. (2021) [23] | SMP-T1 (Flickr) | ∼432,000 | Imbalanced/Not addressed | Metadata + Visual | Late Fusion | Not used | VSCNN (1-D CNN) | Spearman’s : 0.901 |
| Halim et al. (2022) [21] | Author-Constructed (7 regions) | 84,145 | Imbalanced/Not addressed | Metadata + Text | Not used | Not used | SVM + k-NN + ANN | 0.922/0.928/0.930 |
| Sarkar et al. (2023) [26] | Trending YouTube Stats (USA) | 5040 | Not Reported | Metadata + Visual + Text | Hierarchical Fusion | Not used | Multimodal DNN | Accuracy: 0.734 |
| Javed et al. (2025) [30] | PAK VIDEOS (YouTube) | 22,968 | Imbalanced/Not addressed | Metadata + Sentiment | Hybrid Fusion | Not used | XGBoost | Accuracy: 0.843 |
| Masood et al. (2025) [31] | Author-Constructed via TikTok | ∼3.9 M | Balanced (threshold) | Metadata + Visual | Multimodal Fusion | Not used | Video-LLaMA + RF | Accuracy: 0.696 |
| Cho et al. (2024) [10] | YouTube Shorts dataset | 13,011 | Imbalanced/SMOTE + Focal Loss | Metadata + Visual + Text | Multimodal Fusion | Not used | BiLSTM + Attention | Accuracy: 0.797 |
| FUSEPOP (Ours) | Cho et al. [10] + Thumbnails | 12,589 | Imbalanced/Focal Loss + Class Weighting | Metadata + Visual + Text | MI-Weighted Fusion | Stacked Ensemble | Co-Attention + Stacked Generalization + Meta-Learner | Accuracy: 0.980 |
Table 2.
Summary of the original AMPS YouTube Shorts Dataset.
Table 2.
Summary of the original AMPS YouTube Shorts Dataset.
| Feature Type | Description | Count/Dimension |
|---|
| Total Videos | The number of unique YouTube Shorts | 13,011 |
| Region | Geographical scope of data collection | South Korea |
| Visual Modality | Thumbnail URLs associated with each video | 13,011 URLs |
| Textual Modality | Titles and Descriptions | 13,011 text pairs |
| Video Metadata Modality | Views, likes, comments, category, etc. | 9 attributes |
| Channel Metadata Modality | Channel ID, channel title, subscriber count etc. | 5 attributes |
| Labels | Binary popularity indicator | 0 = non-popular, 1 = popular |
| Class Ratio | Non-popular vs. popular videos | ≈85%:15% |
Table 3.
Taxonomy of metadata features in Subset A.
Table 3.
Taxonomy of metadata features in Subset A.
| Category | Attribute | Description |
|---|
| Video-Level Engagement | videoViewCount | Total view count for the specific video |
| videoLikeCount | Total like count for the specific video |
| videoCommentCount | Total comment count for the specific video |
| Channel-Level Statistics | totalViewCount | Aggregate view count across all channel videos |
| subscriberCount | Total number of channel subscribers |
| Category Signal | videoCategoryId | YouTube category assigned to the video (one-hot) |
Table 4.
Taxonomy of Metadata Features in Subset B.
Table 4.
Taxonomy of Metadata Features in Subset B.
| Category | Attribute | Description |
|---|
Channel Authority and
Audience Engagement | subscriber_count | Total number of channel subscribers |
| total_videos | Aggregate number of videos published by the channel |
| channel_engagement | Ratio of total channel views to subscriber count |
| avg_views_per_video | Mean view count normalized per channel video |
| like_count | Total number of likes for the specific video |
| comment_count | Total volume of user comments per video |
| Temporal Attributes | publish_hour | Hour of the day when the video was published |
| day_of_week | Day of the week of publication |
| is_weekend | Binary indicator for weekend publication |
| publish_month | Calendar month of the publication date |
| Content Structure | video_duration | Temporal length of the video content |
| tag_count | Number of metadata tags associated with the video |
| title_length | Character count of the video title |
| desc_length | Character count of the video description |
| has_tags | Boolean indicator of tag presence |
| has_desc | Boolean indicator of description presence |
| Category Signal | videoCategoryId | YouTube category assigned to the video (one-hot) |
Table 5.
Mutual information between each modality and the popularity label. For modalities whose feature representation does not depend on the metadata configuration, a single MI value is reported; for metadata and for the fused visual-text stream whose training signal depends on the metadata configuration, values are reported separately for Subset A and Subset B.
Table 5.
Mutual information between each modality and the popularity label. For modalities whose feature representation does not depend on the metadata configuration, a single MI value is reported; for metadata and for the fused visual-text stream whose training signal depends on the metadata configuration, values are reported separately for Subset A and Subset B.
| Modality | Encoder | Dims | Mean MI |
|---|
| Thumbnail | ResNet-50 | 512 | 0.0014 |
| Title | XLM-RoBERTa | 768 | 0.0020 |
| Description | XLM-RoBERTa | 768 | 0.0163 |
| Metadata (Subset A) | Engineered | 16 | 0.0499 |
| Metadata (Subset B) | Engineered | 27 | 0.0272 |
| Fused Visual + Text (Subset A)
| 768 | 0.0137 |
| Fused Visual + Text (Subset B) | 768 | 0.0120 |
Table 6.
Architectural configurations and hyperparameters for the proposed stacking ensemble components.
Table 6.
Architectural configurations and hyperparameters for the proposed stacking ensemble components.
| Model | Hyperparameter | Value/Configuration |
|---|
| MLP | Architecture | , where (Subset A)/ (Subset B) |
| Regularization | BatchNorm + ReLU + Dropout (0.5, 0.3, 0.2) |
| Optimizer | AdamW (lr = 0.001, weight_decay = 1 × 10⁻⁴) |
| Loss | Focal Loss (, ) |
| Training | Batch size: 64, Max epochs: 50 |
| Early Stopping | Patience: 7 epochs |
| XGBoost | Tree Params | n_estimators: 250, max_depth: 7, gamma: 1 |
| Learning Rate | 0.03 |
| Sampling | Subsample: 0.8, Colsample_bytree: 0.8 |
| Imbalance | scale_pos_weight: 7.86 |
| Random Forest | Forest Params | n_estimators: 200, max_depth: 25 |
| Constraints | min_samples_split: 5, min_samples_leaf: 2 |
| Class Weight | {0: 1, 1: 7.86} |
| Meta-Learner (LR) | Solver | lbfgs (max_iter: 1000) |
| Class Weight | balanced |
| Fusion Logic | Weights | max_weight: 0.7, smoothing: log1p |
| Mutual Info | mutual_info_classif (random_state: 42) |
Table 7.
Performance results of the proposed model and baseline models on Subset A.
Table 7.
Performance results of the proposed model and baseline models on Subset A.
| Model | Non-Popular Class | Popular Class | Acc. | Avg-F1 |
|---|
| Prec. | Rec. | F1 | Prec. | Rec. | F1 |
|---|
| Random Forest | 0.950 | 0.971 | 0.960 | 0.828 | 0.730 | 0.776 | 0.933 | 0.868 |
| XGBoost | 0.993 | 0.979 | 0.986 | 0.898 | 0.963 | 0.929 | 0.977 | 0.958 |
| MLP | 0.971 | 0.990 | 0.980 | 0.939 | 0.844 | 0.889 | 0.966 | 0.935 |
| FUSEPOP | 0.992 | 0.984 | 0.988 | 0.919 | 0.960 | 0.939 | 0.980 | 0.964 |
Table 8.
Performance Results of the Proposed Model and Baseline Models on Subset B.
Table 8.
Performance Results of the Proposed Model and Baseline Models on Subset B.
| Model | Non-Popular Class | Popular Class | Acc. | Avg-F1 |
|---|
| Prec. | Rec. | F1 | Prec. | Rec. | F1 |
|---|
| Random Forest | 0.916 | 0.921 | 0.918 | 0.571 | 0.552 | 0.561 | 0.862 | 0.740 |
| XGBoost | 0.975 | 0.957 | 0.966 | 0.794 | 0.871 | 0.830 | 0.943 | 0.898 |
| MLP | 0.983 | 0.835 | 0.903 | 0.515 | 0.925 | 0.662 | 0.849 | 0.782 |
| FUSEPOP | 0.967 | 0.973 | 0.970 | 0.851 | 0.826 | 0.838 | 0.949 | 0.904 |
Table 9.
Comparison of our multimodal ensemble with prior studies.
Table 9.
Comparison of our multimodal ensemble with prior studies.
| Model | Author | Non-Popular Class | Popular Class | Accuracy | Avg-F1 |
|---|
| Prec. | Rec. | F1 | Prec. | Rec. | F1 |
|---|
| Decision Tree | Baseline from [10] | 0.863 | 0.779 | 0.819 | 0.252 | 0.377 | 0.302 | 0.712 | 0.733 |
| Random Forest | Baseline from [10] | 0.888 | 0.776 | 0.828 | 0.310 | 0.507 | 0.384 | 0.732 | 0.755 |
| MMSPP | [42] | 0.881 | 0.825 | 0.852 | 0.315 | 0.419 | 0.360 | 0.763 | 0.772 |
| VSCNN | [23] | 0.834 | 0.891 | 0.862 | 0.266 | 0.181 | 0.215 | 0.765 | 0.746 |
| ViViD | [26] | 0.875 | 0.857 | 0.866 | 0.224 | 0.253 | 0.238 | 0.773 | 0.778 |
| AMPS | [10] | 0.919 | 0.832 | 0.873 | 0.405 | 0.610 | 0.486 | 0.797 | 0.812 |
| FUSEPOP (Subset B) | (Ours) | 0.967 | 0.973 | 0.970 | 0.851 | 0.826 | 0.838 | 0.949 | 0.904 |
| FUSEPOP (Subset A) | (Ours) | 0.992 | 0.984 | 0.988 | 0.919 | 0.960 | 0.939 | 0.980 | 0.964 |
Table 10.
Single-modality ablation results on Subset A. Each modality is evaluated independently using the same stacked ensemble pipeline.
Table 10.
Single-modality ablation results on Subset A. Each modality is evaluated independently using the same stacked ensemble pipeline.
| Modality | Non-Popular Class | Popular Class | Accuracy | Avg-F1 |
|---|
| Prec. | Rec. | F1 | Prec. | Rec. | F1 |
|---|
| Thumbnail-only | 0.882 | 0.688 | 0.773 | 0.239 | 0.515 | 0.326 | 0.660 | 0.550 |
| Text-only | 0.906 | 0.802 | 0.851 | 0.350 | 0.562 | 0.431 | 0.763 | 0.641 |
| Metadata-only | 0.992 | 0.984 | 0.988 | 0.917 | 0.958 | 0.937 | 0.979 | 0.962 |
| FUSEPOP | 0.992 | 0.984 | 0.988 | 0.919 | 0.960 | 0.939 | 0.980 | 0.964 |
Table 11.
Module-level ablation results on Subset A. Each row removes or replaces a specific architectural component while keeping the remainder of the pipeline intact.
Table 11.
Module-level ablation results on Subset A. Each row removes or replaces a specific architectural component while keeping the remainder of the pipeline intact.
| Configuration | Non-Popular Class | Popular Class | Accuracy | Avg-F1 |
|---|
| Prec. | Rec. | F1 | Prec. | Rec. | F1 |
|---|
| No Co-Attention | 0.991 | 0.976 | 0.984 | 0.885 | 0.953 | 0.917 | 0.973 | 0.951 |
| Simple Concatenation | 0.984 | 0.983 | 0.983 | 0.909 | 0.915 | 0.912 | 0.972 | 0.948 |
| Equal Fusion | 0.983 | 0.984 | 0.983 | 0.913 | 0.910 | 0.912 | 0.972 | 0.947 |
| No Weight Ceiling | 0.983 | 0.984 | 0.984 | 0.915 | 0.910 | 0.913 | 0.972 | 0.948 |
| FUSEPOP | 0.992 | 0.984 | 0.988 | 0.919 | 0.960 | 0.939 | 0.980 | 0.964 |
Table 12.
Ablation summary on Subset B, reported as accuracy, popular-class F1, and average F1. Both the single-modality and module-level ablations are combined into a single table for compactness.
Table 12.
Ablation summary on Subset B, reported as accuracy, popular-class F1, and average F1. Both the single-modality and module-level ablations are combined into a single table for compactness.
| Configuration | Accuracy | P-F1 | Avg-F1 |
|---|
| Single-modality | | | |
| Thumbnail-only | 0.672 | 0.332 | 0.557 |
| Text-only | 0.782 | 0.431 | 0.648 |
| Metadata-only | 0.948 | 0.838 | 0.904 |
| Module-level | | | |
| No Co-Attention | 0.948 | 0.839 | 0.904 |
| Simple Concatenation | 0.939 | 0.822 | 0.893 |
| Equal Fusion | 0.948 | 0.837 | 0.903 |
| No Weight Ceiling | 0.945 | 0.830 | 0.899 |
| FUSEPOP | 0.949 | 0.838 | 0.904 |
| Disclaimer/Publisher’s Note: The statements, opinions and data contained in all publications are solely those of the individual author(s) and contributor(s) and not of MDPI and/or the editor(s). MDPI and/or the editor(s) disclaim responsibility for any injury to people or property resulting from any ideas, methods, instructions or products referred to in the content. |




 ,
,